Greenhouse Gas Emissions from Aviation - Öko-Institut · PDF fileGreenhouse Gas Emissions...
27
Greenhouse Gas Emissions from Aviation ETC/ACC Technical Paper 2006/3 December 2006 Jakob Graichen and Bernd Gugele The European Topic Centre on Air and Climate Change (ETC/ACC) is a consortium of European institutes under contract of the European Environmental Agency RIVM UBA-B UBA-V IIASA NILU AEAT AUTh CHMI DNMI NTUA ÖKO IEP TNO UEA
Transcript of Greenhouse Gas Emissions from Aviation - Öko-Institut · PDF fileGreenhouse Gas Emissions...
Greenhouse Gas Emissions from Aviation
ETC/ACC Technical Paper 2006/3December 2006
Jakob Graichen and Bernd Gugele
The European Topic Centre on Air and Climate Change (ETC/ACC)is a consortium of European institutes under contract of the European Environmental Agency
RIVM UBA-B UBA-V IIASA NILU AEAT AUTh CHMI DNMI NTUA ÖKO IEP TNO UEA

Front page photo: contrails formed by water vapour emissions from an aircraft(photo courtesy of Parl Vater, all rights reserved)
Author affiliation:Jakob Graichen: Öko-Institut, Berlin, GermanyBernd Gugele: Umweltbundesamt, Vienna, Austria
DISCLAIMER
This ETC/ACC Technical Paper has not been subjected to European EnvironmentAgency (EEA) member country review. It does not represent the formal views of theEEA.

3
Table of Contents
Table of Graphs....................................................................................................................................3
Table of Tables .....................................................................................................................................4
1 Introduction..................................................................................................................................5
2 Climate Change and Aviation ......................................................................................................5
2.1 Direct greenhouse gases.......................................................................................................62.2 Indirect greenhouse gases ....................................................................................................72.3 Cloud formation ..................................................................................................................7
3 Historic Emissions of CO2, SO2 and NOx .....................................................................................8
3.1 Estimation methods and uncertainties...................................................................................83.2 Historic emissions and growth rates ................................................................................... 103.3 Domestic and international CO2 emissions from aviation.................................................... 133.4 Allocation of emissions from international aviation ............................................................ 15
4 Projected Emissions for Aviation............................................................................................... 16
4.1 Projections from scientific bodies....................................................................................... 174.2 Forecasts from the aviation industry................................................................................... 224.3 Projections included in National Communications.............................................................. 23
5 References................................................................................................................................... 24
Annex I ............................................................................................................................................... 26
Table of Graphs
Graph 1 Radiative forcing of aviation in the years 1992 and 2000.........................................6
Graph 2 CO2 emissions from aviation in EU Member States 1990-2004 ............................. 11
Graph 3 Annual growth rates of CO2 emissions from aviation 1990-2004. .......................... 12
Graph 4 Share of international aviation on total fuel consumption in 1990 and2004..................................................................................................................... 14
Graph 5 Carbon emissions from the aviation industry for selected Europeannations ................................................................................................................. 21
Graph 6 Contraction and Convergence Profiles for EU 25 Compared with AviationForecasts.............................................................................................................. 22

4
Table of Tables
Table 1 Methods, activity data and emission factors used for the estimation ofemissions from aviation........................................................................................ 10
Table 2 CO2 emissions from aviation in EU Member States 1990-2004 ............................. 11
Table 3 Annual growth rates of CO2 emissions from aviation 1990-2004 ........................... 12
Table 4 Emissions of NOx and SO2 from aviation in EU Member States 1990-2004..................................................................................................................... 13
Table 5 Number of departures and CO2 emissions of flights taking of from EUairports by destination region in 2004 ................................................................... 14
Table 6 Allocation of 2000 emissions from international aviation to EU MemberStates by allocation option.................................................................................... 16
Table 7 IPCC projections for the development of global and aviation CO2
emissions up to 2050 (1990 = 100) ....................................................................... 17
Table 8 IPCC projections for the development of global and aviation NOx
emissions up to 2050 (1990 = 100) ....................................................................... 17
Table 9 Projected annual growth rates of CO2 emissions from aviation for EUMember States 2005-2050.................................................................................... 18
Table 10 Projected increase of CO2 emissions from aviation for EU 15 MemberStates 2005-2050.................................................................................................. 19
Table 11 Projected increase of CO2 emissions from aviation for EU 10 MemberStates 2005-2050.................................................................................................. 20
Table 12 Projected increase of CO2 emissions from aviation for the EU 2005-2050 ............. 20
Table 13 Annual average growth forecasts of revenue passenger kilometres byregion................................................................................................................... 23
Table 14 Member State’s projections .................................................................................. 23
Table A- 1 CO2 emissions from aviation from EU 15 Member States 2005-2050 .................... 26
Table A- 2 CO2 emissions from aviation from EU 10 Member States 2005-2050 .................... 27
Table A- 3 CO2 emissions from aviation from the EU 2005-2050 ........................................... 27

5
1 IntroductionGreenhouse gas emissions from aviation have been rising steadily in the past due toincreased demand for air traffic despite efficiency increases through technological im-provements and operative measures. Looking at CO2 alone aviation is responsible forapproximately 2.5% of global greenhouse gas emissions but the share is projected torise up to 10% in a business as usual scenario of global emissions (IPCC 1999). Thetotal impact of aviation on climate change is estimated to be two to five times higherthan the effect of CO2 alone due to emissions of NOx and cloud formation. As a result,emissions from EU aviation could be responsible for 40% to over 100% of the allow-able greenhouse gas emissions in 2050 if global warming is limited to 2°C, the goal setby the EU (T&E 2006).
Emissions from international aviation and maritime transport, so called bunker fuels, arenot covered under the United Nations Framework Convention on Climate Change(UNFCCC) and its Kyoto Protocol. Instead, responsibility to reduce these emissions ishanded to the International Civil Aviation Organisation (ICAO) and the InternationalMaritime Organisation (IMO). There is little political will to reduce greenhouse gasemissions from aviation on an international level despite the growing trend and the pro-jected impact on the climate in the next decades. As a consequence the Commission ofthe European Communities has proposed a Directive which would include aviation in anemissions trading scheme (EC 2006). The proposal foresees that all flights which departand/or arrive at an EU airport will be covered by the scheme after an initial year whichonly covers intra-EU flights.
The purpose of this report is to compile reliable and transparent data on the effects ofaviation on climate change. It compiles information on historic and projected emissionsfrom government sources, science and business organisations. Chapter 2 discusses theclimate impact of aviation in more detail. Historic CO2 emissions from the sector arepresented in chapter 3. Several different projections up to 2050 are presented in chap-ter 4.
2 Climate Change and AviationThe impact of fossil fuel combustion on the climate is normally dominated by carbondioxide (CO2) emissions. The other two greenhouse gases emitted during fossil fuelcombustion, methane (CH4) and nitrogen dioxide (N2O), together contribute less than2% to the greenhouse gas emissions from EU fuel combustion as estimated under theKyoto Protocol (EC 2006). This picture changes when looking at the aviation sector dueto the altitude at which airplanes fly and emissions occur. Apart from emissions of di-rect greenhouse gases emissions of substances that produce or destroy greenhouse gasesand emission of substances that trigger the generation of clouds have to be taken intoaccount for a full assessment of the impact of aviation on climate (IPCC 1999). It isestimated that the overall contribution of aviation to global warming is 2 to 5 times

6
higher than the radiative forcing1 of its CO2 emissions alone (Sausen 2005). The rangereflects the uncertainty in the assessment of the radiative forcing of the indirect effects(Graph 1). Note that the total given in the graph does not include the effect of cirrusclouds as the level of scientific understanding is judged to be poor. The scientific under-standing of the chemical and physical reactions in the atmosphere is best for CO2 emis-sions. For all other effects the scientific knowledge of the underlying reactions is judgedto be fair (Sausen 2005). Below is a compilation of the different effects of aviation onclimate based upon the special IPCC report (IPCC 1999) with updates by Sausen et al(Sausen 2005) and a study by CE Delft and MNP (CE Delft 2007).
Graph 1 Radiative forcing of aviation in the years 1992 and 2000
Source: Sausen 2005.
2.1 Direct greenhouse gasesEmissions of the direct greenhouse gases CO2 and H2O scale linearly with the amountof fuel burnt and can be estimated with a good level of accuracy. Emissions of soot andtheir characteristics depend on engine characteristics and can only be estimated withlarge uncertainties.
1 Radiative forcing is a measure for the change of the earth’s energy balance due to a change of green-house gas concentrations given in power per area (W/m2). Radiative forcing depends on the concen-tration of a given gas in the atmosphere and can therefore vary over time. Estimates for radiative forc-ing for future years depend on scenarios on global greenhouse gas emissions from all sectors.
7
· Carbon dioxide has a warming effect on the climate and remains in the atmos-phere for several decades. CO2 emissions from aviation can be treated identi-cally to those from other sectors as the gas remains long enough in the atmos-phere to be well mixed independent of the source location.
· Water vapour has a warming effect on the climate and is generated from theHydrogen contained in the kerosene. It remains only for a short period in thetroposphere, the altitude at which most emissions from aviation occur. Thequantity of water vapour emitted by aviation is small compared to the naturalhydrological cycle and the effect on the climate is minor.
· Soot particles are produced in the combustion process and have a small warm-ing effect on the climate as they absorb incoming sunlight and heat up the at-mosphere.
2.2 Indirect greenhouse gasesNOx and SO2 emissions do not contribute to global warming directly but produce ordestroy greenhouse gases, in particular ozone (O3), methane and sulphate aerosols. SO2
emissions can be estimated with good accuracy if the sulphur content of the fuel isknown. Estimates on the formation of O3 and the destruction of CH4 vary strongly withthe atmospheric models used.
· Ozone has a warming effect on the climate. The effect is higher at cruising alti-tude than on the ground due to longer lifetimes and greater radiative forcing inthe troposphere. Ozone generation is increased through NOx emissions fromaviation.
· Methane is a greenhouse gas which is present in the atmosphere due to naturalas well as human induced sources. Very little or no methane is emitted by air-planes but NOx emissions initiate a destruction of CH4 molecules and thereforehave a cooling effect on the climate (negative radiative forcing). Overall thewarming effect of NOx emissions due to ozone formation is estimated to behigher than the cooling results due to methane destruction.
· Sulphate aerosols scatter incoming sunlight back to the atmosphere and lead toa cooling of the climate (negative radiative forcing). Sulphur contained in thekerosene oxidises to SO2 during combustion out of which a fraction is convertedto SO4 in a further step.
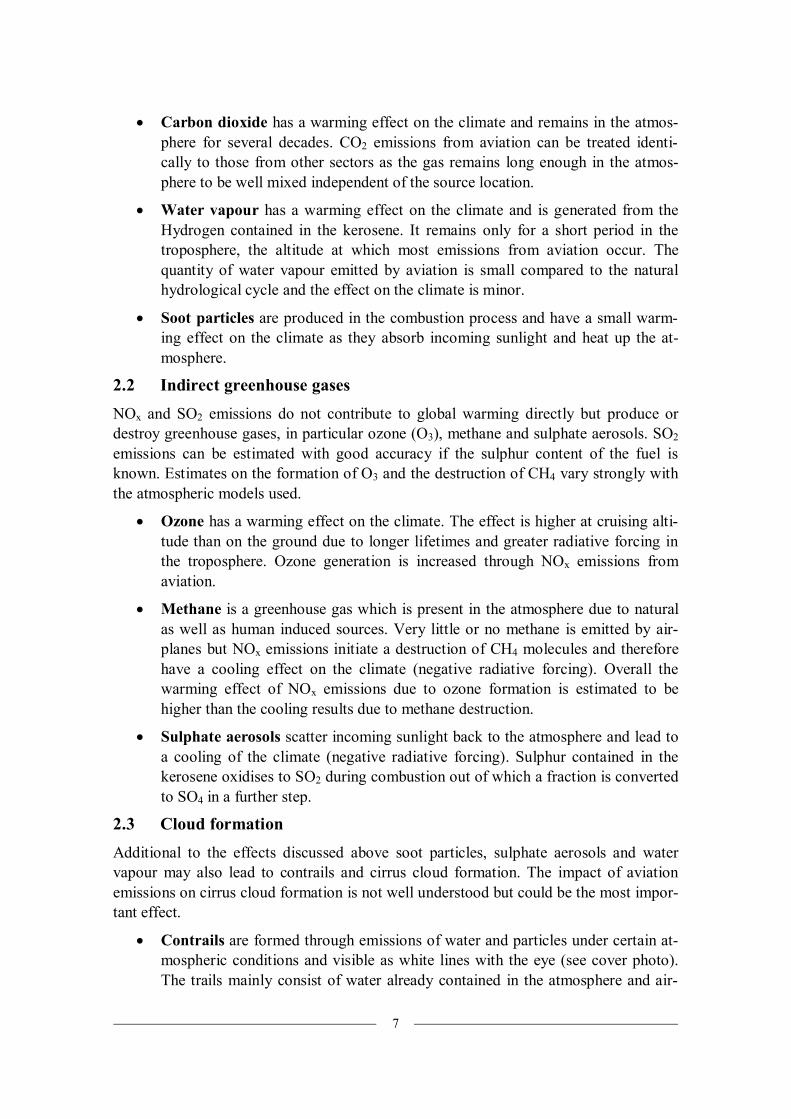
2.3 Cloud formationAdditional to the effects discussed above soot particles, sulphate aerosols and watervapour may also lead to contrails and cirrus cloud formation. The impact of aviationemissions on cirrus cloud formation is not well understood but could be the most impor-tant effect.
· Contrails are formed through emissions of water and particles under certain at-mospheric conditions and visible as white lines with the eye (see cover photo).The trails mainly consist of water already contained in the atmosphere and air-

8
planes only triggered their formation. The effect of contrails is twofold: theycool the climate through increased backscatter of solar radiation but also trapheat on the earth which contributes to global warming. Overall contrails have apositive radiative forcing although significant uncertainties remain in the estima-tion of the magnitude. The formation of contrails is well understood and can bemodelled if sufficient parameters on the atmospheric conditions are available.
· Cirrus cloud formation might be augmented through aviation induced contrailsand cloud seeding through particles. Increased cirrus cloud formation contributesto global warming but exact quantifications are not yet possible. Estimatesranges from no or very little radiative forcing up to four times the forcing in-duced by CO2 alone.
3 Historic Emissions of CO2, SO2 and NOx
The most comprehensive public source for CO2, SO2 and NOx emissions from aviationfor EU Member States are the national greenhouse gas inventory reports under theUNFCCC and its Kyoto Protocol. Under these treaties industrialised countries, so calledAnnex I countries, have to prepare annual reports on the emissions of all greenhousegases covered by the Convention and the Protocol. Although emissions from interna-tional aviation are not included in the national totals they are reported as memo itemsand available for all years starting 1990. Reporting is based on fuel sold and differenti-ated between domestic and international aviation.
An alternative source could be the database assembled by Eurocontrol on all flights ofits member countries since 1996. The main purpose of the data is the collection of routecharges and air traffic management but it also provides an excellent basis for modellingemissions from aviation. Eurocontrol has developed an application which is able to doso but the data is not publicly available.
3.1 Estimation methods and uncertaintiesSeveral different methodologies for the estimation of CO2, SO2 and NOx emissions fromaviation are used in Member States (Table 1). In the simplest methodology given in theIPCC good practice guidance (Tier 1) total fuel supplied to aircrafts is multiplied byemission factors for the three gases (IPCC 2000a). Emissions of CO2 and SO2 only de-pend on the carbon and sulphur content of the fuel and can be estimated accurately us-ing this methodology assuming that the respective contents are known. NOx emissionson the other hand vary between flight stages. More advanced methodologies take thisinto account and estimate emissions for landing and take-off cycles (LTO) separatelyfrom the cruise stage. Emissions and fuel consumption during LTO are estimated eitherbased on total number of LTOs and emission factors for an average fleet (Tier 2a) or onthe number of LTOs per aircraft type and respective emission factors (Tier 2b). Thedifference between total fuel sold and fuel use during LTO is used to estimate cruiseemissions. Some Member States use more advanced models to calculate emissions foreach individual flight (Tier 3). The total quantity of fuel supplied to airplanes is nor-mally taken from national statistics; emission factors are either country specific or taken
9
from the IPCC Guidelines (IPCC 1996) or the EMEP/CORINAIR Guidebook (EEA2006). Emissions of water and soot as well as the formation of contrails and clouds arenot reported under the UNFCCC and are not further considered in this chapter.
The uncertainties for the estimation of total CO2 emissions from the aviation sector areconsidered to be low. Emissions mainly depend on total fuel sales which are usuallyincluded in national energy statistics with good accuracy. The main difficulty faced byParties is the separation between domestic and international aviation. In general, allflights departing and arriving in one country should be reported under domestic aviationwhereas flights arriving in a different country should be reported as international bunkerfuels.2 National statistics might not differentiate between the two categories or use dif-ferent definitions for the split. While this does not affect to total estimate of emissionsfrom the sector it can lead to significant errors in the data given for domestic and inter-national aviation. A comparison of emission estimates for the year 2000 from nationalinventory reports with Eurocontrol estimates based on a detailed model using air trafficmanagement data showed that values agree within 10% for most countries for the sectoras a whole. Estimates for domestic aviation alone on the other hand differed by up to200% in several countries (ETC/ACC 2004). In the most recent EC GHG inventoryreport, uncertainty of CO2 emissions from domestic aviation is estimated to be 20% forthe EU-15 (EC 2006). For NOx and SO2 confidence levels are lower due to higher un-certainties in the emission factor (NOx) and the sulphur content of the kerosene (SO2).
2 Special rules exist for stops solely for refuelling or when passengers are only dropped off/ picked upat the beginning or end of a long distance flight. These cases have little relevance in the EU as mostcountries are too small to justify several stops in them for one flight.

10
Table 1 Methods, activity data and emission factors used for the estimation ofemissions from aviation
Method applied Activity Data Emission FactorAustria country specific national statistics country specificBelgium Corinair, model national statistics CorinairCyprus - - -Czech Republic Tier 1 national statistics DefaultDenmark Corinair national statistics CorinairEstonia Tier 1 national statistics DefaultFinland Tier 2b national statistics country specificFrance Tier 2b national statistics country specificGermany Tier 1 national statistics, associations country specificGreece Tier 2a national statistics, associations CorinairHungary - - -Ireland Tier 2a national statistics country specificItaly Tier 1, Tier 2a national statistics country specificLatvia Tier 1 queries DefaultLithuania Tier 2 national statistics country specificLuxembourg Corinair, Default - Corinair, DefaultMalta - - -Netherlands Tier 2 national statistics country specificPoland model national statistics, associations DefaultPortugal Tier 2b national statistics, associations CorinairSlovakia Tier 2a associations, queries, nat. stat. CorinairSlovenia Tier 1 national statistics DefaultSpain Tier 2a national statistics DefaultSweden Tier 1 national statistics country specificUnited Kingdom Tier 3 national statistics, associations country specific
Source: EC 2006.
3.2 Historic emissions and growth ratesEmissions of CO2, NOx and SO2 as reported by EU Member States are presented inTable 2 to Table 4 and Graph 2 to Graph 3. Between 1990 and 2004 CO2 emissionsfrom the EU aviation sector have risen by 73% (Table 2). Six countries (UK, Germany,France, Spain, Italy and the Netherlands) are responsible for 82% of the total emissions.The old 15 Member States are responsible for over 95% of the sector’s fuel consump-tion. Emissions from aviation have risen annually on average by 4% in the same perioddespite a noticeable decline after the attacks of 11 September 2001. Emissions from theaviation sector in the new Member States reached 1990 levels in 2004 but the datashows large annual fluctuations which might be due to incomplete or inaccurate esti-mates in some countries and not representing real growth rates. Emissions of NOx andSO2 show the same trend and distribution across Member States as for CO2.

11
Table 2 CO2 emissions from aviation in EU Member States 1990-2004
1990 1995 2000 2004Austria 918 1 385 1 757 1 724Belgium 3 108 2 895 4 665 3 825Cyprusa 745 820 898 1 017Czech Republic 766 499 447 889Denmark 1 979 2 066 2 504 2 575Estonia 103 52 65 89Finland 1 369 1 130 1 408 1 584France 13 158 15 818 20 534 20 715Germany 14 487 17 359 21 861 22 040Greece 3 902 3 819 4 062 4 333Hungary 475 524 641 609Ireland 1 118 1 148 1 662 2 223Italy 5 713 7 304 10 551 10 736Latvia 221 78 83 149Lithuania 418 128 81 120Luxembourg 399 574 972 1 290Malta 207 333 335 343Netherlands 4 582 7 625 9 790 10 544Polandb 317 308 358 854Portugal 1 555 1 764 2 495 2 775Slovakia 51 65 69 103Slovenia 82 60 74 62Spain 7 567 9 519 13 811 15 421Sweden 2 009 2 060 2 570 2 439United Kingdom 16 946 21 459 32 212 35 426EU 10 3 386 2 867 3 051 4 235EU 15 78 811 95 925 130 856 137 653EU 25 82 196 98 792 133 907 141 888Notes:
Emissions [kt CO2]
NE: not estimateda Incomplete dataset. 2003 emissions instead of 2004 emissions used.b Incomplete dataset. 1991 emissions instead of 1990 emissions used.
Source: EC 2006.
Graph 2 CO2 emissions from aviation in EU Member States 1990-2004
0
20 000
40 000
60 000
80 000
100 000
120 000
140 000
160 000
1990 1991 1992 1993 1994 1995 1996 1997 1998 1999 2000 2001 2002 2003 2004
kt C
O2
United Kingdom
Germany
France
Spain
Italy
Netherlands
Belgium
Greece
Sweden
Denmark
Portugal
Austria
Ireland
Finland
Luxembourg
Cyprus
Hungary
Czech Republic
Poland
Malta
Latvia
Lithuania
Slovenia
Slovakia
Estonia
Source: EC 2006.

12
Table 3 Annual growth rates of CO2 emissions from aviation 1990-2004
1990-1994 1995-1999 2000-2004 1990-2004Austria 7.8% 4.0% -0.5% 4.6%Belgium -5.0% 11.9% -4.8% 1.5%Cyprusa 0.1% 0.4% 4.3% 2.4%Czech Republic -14.9% 5.7% 18.8% 1.1%Denmark 0.4% 4.5% 0.7% 1.9%Estonia -8.7% 6.6% 8.0% -1.1%Finland -6.2% 6.3% 3.0% 1.0%France 3.6% 5.8% 0.2% 3.3%Germany 3.7% 4.7% 0.2% 3.0%Greece 1.7% 0.8% 1.6% 0.8%Hungary 2.9% 3.3% -1.3% 1.8%Ireland 1.0% 9.1% 7.5% 5.0%Italy 4.8% 7.9% 0.4% 4.6%Latvia -22.9% 4.0% 15.8% -2.8%Lithuania -26.1% -10.6% 10.4% -8.5%Luxembourg 6.1% 15.5% 7.3% 8.7%Malta 12.6% 1.3% 0.6% 3.7%Netherlands 9.5% 6.7% 1.9% 6.1%Polandb NE 2.9% 24.3% 7.9%Portugal 0.9% 5.6% 2.7% 4.2%Slovakia NE 0.0% 10.7% 5.7%Slovenia -9.1% 2.1% -4.3% -2.0%Spain 3.7% 7.9% 2.8% 5.2%Sweden -0.6% 5.8% -1.3% 1.4%United Kingdom 4.5% 8.0% 2.4% 5.4%EU 10 -8.2% 2.1% 8.5% 1.6%EU 15 3.5% 6.6% 1.3% 4.1%EU 25 3.1% 6.5% 1.5% 4.0%Notes: NE: not estimated
a Incomplete dataset. 2003 emissions instead of 2004 emissions used.b Incomplete dataset. 1991 emissions instead of 1990 emissions used.
Annual Growth Rates [%]
Source: EC 2006.
Graph 3 Annual growth rates of CO2 emissions from aviation 1990-2004.
-20%
-10%
0%
10%
20%
30%
40%
50%
1990
1991
1992
1993
1994
1995
1996
1997
1998
1999
2000
2001
2002
2003
2004
avera
ge
Year
Annu
al g
row
th [%
]
EU 10EU 15EU 25
Source: EC 2006.
13
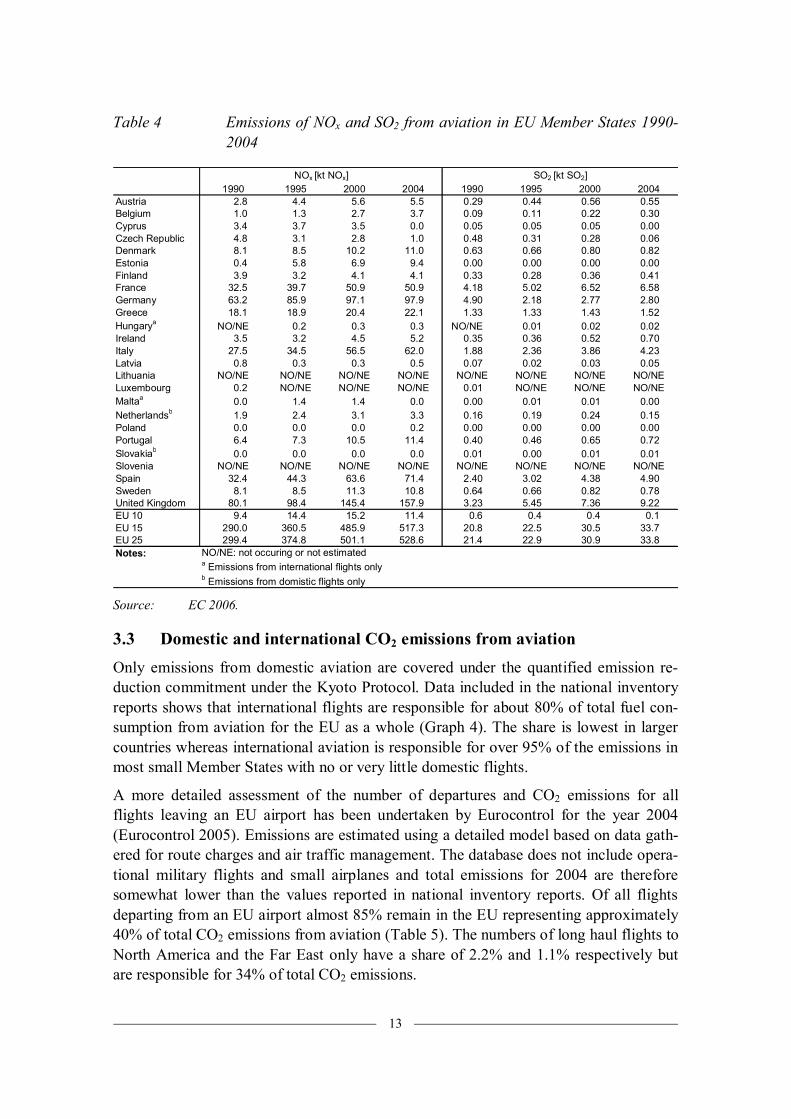
Table 4 Emissions of NOx and SO2 from aviation in EU Member States 1990-2004
1990 1995 2000 2004 1990 1995 2000 2004Austria 2.8 4.4 5.6 5.5 0.29 0.44 0.56 0.55Belgium 1.0 1.3 2.7 3.7 0.09 0.11 0.22 0.30Cyprus 3.4 3.7 3.5 0.0 0.05 0.05 0.05 0.00Czech Republic 4.8 3.1 2.8 1.0 0.48 0.31 0.28 0.06Denmark 8.1 8.5 10.2 11.0 0.63 0.66 0.80 0.82Estonia 0.4 5.8 6.9 9.4 0.00 0.00 0.00 0.00Finland 3.9 3.2 4.1 4.1 0.33 0.28 0.36 0.41France 32.5 39.7 50.9 50.9 4.18 5.02 6.52 6.58Germany 63.2 85.9 97.1 97.9 4.90 2.18 2.77 2.80Greece 18.1 18.9 20.4 22.1 1.33 1.33 1.43 1.52Hungarya NO/NE 0.2 0.3 0.3 NO/NE 0.01 0.02 0.02Ireland 3.5 3.2 4.5 5.2 0.35 0.36 0.52 0.70Italy 27.5 34.5 56.5 62.0 1.88 2.36 3.86 4.23Latvia 0.8 0.3 0.3 0.5 0.07 0.02 0.03 0.05Lithuania NO/NE NO/NE NO/NE NO/NE NO/NE NO/NE NO/NE NO/NELuxembourg 0.2 NO/NE NO/NE NO/NE 0.01 NO/NE NO/NE NO/NEMaltaa 0.0 1.4 1.4 0.0 0.00 0.01 0.01 0.00Netherlandsb 1.9 2.4 3.1 3.3 0.16 0.19 0.24 0.15Poland 0.0 0.0 0.0 0.2 0.00 0.00 0.00 0.00Portugal 6.4 7.3 10.5 11.4 0.40 0.46 0.65 0.72Slovakiab 0.0 0.0 0.0 0.0 0.01 0.00 0.01 0.01Slovenia NO/NE NO/NE NO/NE NO/NE NO/NE NO/NE NO/NE NO/NESpain 32.4 44.3 63.6 71.4 2.40 3.02 4.38 4.90Sweden 8.1 8.5 11.3 10.8 0.64 0.66 0.82 0.78United Kingdom 80.1 98.4 145.4 157.9 3.23 5.45 7.36 9.22EU 10 9.4 14.4 15.2 11.4 0.6 0.4 0.4 0.1EU 15 290.0 360.5 485.9 517.3 20.8 22.5 30.5 33.7EU 25 299.4 374.8 501.1 528.6 21.4 22.9 30.9 33.8Notes:
NOx [kt NOx] SO2 [kt SO2]
NO/NE: not occuring or not estimateda Emissions from international flights onlyb Emissions from domistic flights only
Source: EC 2006.
3.3 Domestic and international CO2 emissions from aviationOnly emissions from domestic aviation are covered under the quantified emission re-duction commitment under the Kyoto Protocol. Data included in the national inventoryreports shows that international flights are responsible for about 80% of total fuel con-sumption from aviation for the EU as a whole (Graph 4). The share is lowest in largercountries whereas international aviation is responsible for over 95% of the emissions inmost small Member States with no or very little domestic flights.
A more detailed assessment of the number of departures and CO2 emissions for allflights leaving an EU airport has been undertaken by Eurocontrol for the year 2004(Eurocontrol 2005). Emissions are estimated using a detailed model based on data gath-ered for route charges and air traffic management. The database does not include opera-tional military flights and small airplanes and total emissions for 2004 are thereforesomewhat lower than the values reported in national inventory reports. Of all flightsdeparting from an EU airport almost 85% remain in the EU representing approximately40% of total CO2 emissions from aviation (Table 5). The numbers of long haul flights toNorth America and the Far East only have a share of 2.2% and 1.1% respectively butare responsible for 34% of total CO2 emissions.

14
Graph 4 Share of international aviation on total fuel consumption in 1990 and2004
0%
20%
40%
60%
80%
100%
120%
Austria
Belgium
Cyprus
Czech
Rep
ublic
Denmark
Estonia
Finlan
d
France
Germany
Greece
Hunga
ry
Irelan
dIta
lyLa
tvia
Lithu
ania
Luxe
mbourg
Malta
Netherl
ands
Poland
Portuga
l
Slovak
ia
Sloven
iaSpa
in
Sweden
United
King
dom
EU 10EU 15
EU 25
19902004
Source: EC 2006.
Table 5 Number of departures and CO2 emissions of flights taking of from EUairports by destination region in 2004
Flight destination region[1 000] [%] [kt] [%]
EU 25 5 847 84.4% 52 328 39.9%EU UPR 93 1.3% 4 157 3.2%Europe (rest) 493 7.1% 7 370 5.6%Africa 113 1.6% 6 570 5.0%North America 152 2.2% 24 957 19.0%Central America 21 0.3% 4 079 3.1%South America 17 0.3% 3 882 3.0%Middle East 109 1.6% 8 000 6.1%Far East 73 1.1% 19 541 14.9%Unknown 14 0.2% 249 0.2%Total 6 931 100% 131 147 100%Notes: UPR: Ultra Peripheral Regions
CO2 emissionsDepartures
Source: Eurocontrol 2005.
Taking into account both information sources it can be concluded that approximately20% of CO2 emissions from aviation are due to domestic aviation, another 20% due toflights between EU Member States and 60% are caused by flights leaving the EU. TheCommission proposal for the inclusion of aviation in an emission trading scheme fore-sees that all flights entering the EU are covered as well. In this case and assuming thatarriving flights use the same quantity of kerosene as departing flights on the same route

15
approximately 75% of the emission would originate from flights leaving or entering theEU while intra-EU and domestic aviation each would be responsible for just over 10%.Note that the data sets use different bases for estimating emissions (fuel sales vs. mod-elled emissions over given routes). The two approaches should produce the similar re-sults under the assumptions that planes only take the necessary fuel for the next flightstrip onboard and that emissions are independent of the direction a route is flown. Inreality both assumptions are not entirely true.
3.4 Allocation of emissions from international aviationDifferent possibilities have been discussed for the allocation of emissions from interna-tional aviation to Parties under the UNFCCC. Methodological difficulties as well as alack of political will by some Parties led to the decision, that emissions from bunkerfuels should not be covered under the Kyoto Protocol. Since then data availability andmodelling capability has increased considerably. The Subsidiary Body for Scientific andTechnological Advice developed and discussed 8 options for the allocation of bunkerfuel emissions (UNFCCC 1996a). Out of these three were not favoured (UNFCCC1996b). The remaining options are
· Option 1: no allocation,
· Option 3: allocation by fuel sold,
· Option 4: allocation by nationality of aircraft carrier,
· Option 5: allocation by country of departure and/or destination of aircraft and
· Option 6: allocation by country of departure and/or destination of passenger orcargo.
An analysis of the effects of the different allocation options on EU Member States wascarried out by the Centre for Air Transport and the Environment of the Manchester Met-ropolitan University (MMU 2005a). The analysis was conducted using the FAST modelwhich is based on data for movements of aircraft types between city pairs for certainyears. Fuel consumption is calculated based on an aircraft performance model and thedistance between the city pairs (MMU 2005a). For the EU as a whole total allocationdoes not depend strongly on the option chosen but the differences for individual mem-ber States can be considerable (Table 6). Option 3b is based on fuel sales as reported innational inventory reports. This dataset is not consistent with the calculated fuel con-sumption in the model. The FAST model is based on scheduled flights only and doesnot include charter and military flights. As a result, the model underestimates totalemissions but provides a good indication for the relative differences between the differ-ent allocation options.

16
Table 6 Allocation of 2000 emissions from international aviation to EU Mem-ber States by allocation option
Domestic Option 3a Option 3b Option 4 Option 5 Option 6Austria 51 1 368 1 675 1 954 1 373 1 337Belgium - 2 847 3 907 94 2 787 2 740Cyprus 8 415 - 295 414 429Czech Republic 5 387 439 488 387 341Denmark 126 1 810 2 348 334 1 808 1 571Estonia 41 - 59 41 43Finland 416 831 1 027 1 266 818 759France 2 697 11 667 14 361 13 776 11 646 11 623Germany 1 748 14 780 17 582 17 871 14 753 14 890Greece 440 1 324 2 954 1 066 1 328 1 380Hungary - 440 634 555 440 392lreland 60 1 020 1 566 1 631 1 046 995ltaly 2 695 5 705 8 689 5 060 5 692 5 458Latvia - 52 51 54 52 39Lithuania 5 57 - 71 57 50Luxembourg - 581 1 051 1 442 566 493Maita - 187 - 250 187 183Netherlands 15 6 877 10 067 7 915 6 863 6 727Poland 44 468 336 576 468 440Portugal 328 1 294 972 1 172 1 290 1 333Slovakia 5 21 21 21 17Slovenia - 58 - 87 58 43Spain 3 131 5 668 8 314 4 534 5 682 5 683Sweden 837 1 426 1 926 3 235 1 402 1 256United Kingdom 1 714 20 151 29 412 20 463 20 264 20 564EU25 Total 14 323 79 475 107 311 84 270 79 444 78 785Annex I Total 175 489 169 722 200 799 174 620 169 553 169 306Global total 213 885 265 616 265 616 265 616 265 616Notes: Option 3a: modelled departures; Option 3b: UNFCCC data; Option 4: no data available for 1990
Emissions [kt CO2]
Source: MMU 2005a.
4 Projected Emissions for AviationProjections and forecasts of the development of the aviation industry are conducted fordifferent purposes and based on different indicators. Developers of climate models fo-cus on emissions and radiative forcing from the sector and try to model long time peri-ods. Companies are more interested in the growth of passenger or freight kilometres orthe development of airline fleet size and composition in the medium term. Projectionsare based on assumptions about future developments and are not able to capture unex-pected changes or singular events, e.g. the attacks on the World Trade Centre in NewYork which had a clear impact on the growth of air travel for two years (Graph 2). Un-certainties increase with time horizons and it is not possible to develop or select a singlebest projection. This is taken into account by developing different scenarios using dif-ferent sets of assumptions to show possible future developments and the potential rangeof emissions. This chapter therefore does not include one projection but presents severalindependent forecasts.

17
4.1 Projections from scientific bodies
IPCC special report on aviation and the global atmosphere
For the IPCC special report on aviation and the global atmosphere several different sce-narios of future emissions of air transport were analysed. The assessment includes CO2
and NOx emissions as well as radiative forcing from CO2, CH4, H2O, contrails and aero-sols for the years 1992, 2015 and 2050. Based on these figures an interpolation wasmade for the time period 1990 to 2050. Different scenarios reflect different assumptionson economic growth, technological development and demand for air traffic. All modelsconsidered take into account, that the aviation market is gradually maturing and willeventually grow in line with GDP growth. The results of the different scenarios show awide range with a projected increase of CO2 emissions from aviation between 60% and900% for the year 2050 (Table 7). NOx emissions are estimated to lie between two andfive times of their 1990 value by 2050 (Table 8).
Table 7 IPCC projections for the development of global and aviation CO2
emissions up to 2050 (1990 = 100)
1990 2000 2015 2025 2050Fossil Fuel (all sectors) 100 120 153 178 220CO2 Emissions (all sectors) 100 113 143 163 193Fa1 100 127 190 214 276Fa2 100 127 190 217 285Fc1 100 127 190 180 157Fe1 100 127 190 260 435Eab 100 122 173 315 669Edh 100 152 262 469 988Fa1H 100 127 190 234 326
IS92
aAv
iatio
n Sc
enar
ios
Source: IPCC 1999.
Table 8 IPCC projections for the development of global and aviation NOx
emissions up to 2050 (1990 = 100)
1990 2000 2015 2025 2050Energy (all sectors) 100 120 149 167 212Biomass Burn (all sectors) 100 103 107 110 120Fa1 100 140 215 255 360Fa2 100 140 215 235 280Fc1 100 140 215 210 200Fe1 100 140 215 320 570Eab 100 110 145 215 395Edh 100 140 215 320 580Av
iatio
n Sc
enar
ios
IS92
a
Source: IPCC 1999.

18
Manchester Metropolitan University projections
Lee and Owen (MMU 2005b) updated the 1999 IPCC calculations using newer scenar-ios for GDP growth and more recent forecasts for the increase of global aviation. Re-gional traffic forecasts and load factors from ICAO have been used together with as-sumptions on fuel efficiency increases to model CO2 emissions from aviation until 2020using the FAST model. To model emissions between 2020 and 2050 GDP projectionsfrom two IPCC reference scenarios (IPCC 2000b) have been used to estimate thegrowth in revenue passenger kilometres. The projected relative increase of CO2 emis-sions and annual growth rates until 2050 for the two scenarios are shown in Table 9 toTable 12. Absolute emission figures are given in Annex I.
Table 9 Projected annual growth rates of CO2 emissions from aviation for EUMember States 2005-2050
2005 2010 2015 2020 2030 2040 2050 2030 2040 2050Austria - 4.1% 2.9% 2.3% 5.3% 3.2% 3.3% 4.2% 3.6% 0.8%Belgium - 4.0% 3.5% 1.7% 5.1% 3.4% 3.5% 4.4% 3.8% 1.0%Cyprus - 5.0% 7.1% 5.6% 4.5% 3.2% 3.3% 4.2% 3.6% 0.8%Czech Republic- 3.5% 3.0% 0.8% 4.6% 3.3% 3.3% 4.3% 3.7% 0.8%Denmark - 4.4% 5.5% 3.0% 5.0% 3.2% 3.3% 4.3% 3.7% 0.8%Estonia - 3.7% 2.2% 0.6% 4.5% 3.2% 3.2% 4.2% 3.6% 0.8%Finland - 3.8% 2.3% 3.4% 5.0% 3.2% 3.3% 4.2% 3.6% 0.8%France - 4.5% 4.6% 2.9% 5.5% 3.4% 3.5% 4.4% 3.8% 1.0%Germany - 4.8% 5.2% 2.2% 5.4% 3.3% 3.4% 4.4% 3.8% 0.9%Greece - 4.2% 4.2% 1.4% 4.7% 3.2% 3.3% 4.2% 3.6% 0.8%Hungary - 3.9% 3.3% 0.6% 4.9% 3.2% 3.3% 4.3% 3.6% 0.8%Ireland - 4.3% 4.5% 1.6% 4.8% 3.3% 3.4% 4.3% 3.7% 0.9%Italy - 4.3% 4.2% 2.1% 5.1% 3.3% 3.4% 4.3% 3.7% 0.9%Latvia - 3.6% 3.1% 0.9% 4.5% 3.2% 3.3% 4.2% 3.6% 0.8%Lithuania - 3.4% 2.7% 0.2% 4.5% 3.2% 3.2% 4.2% 3.5% 0.7%Luxembourg - 5.3% 6.0% 4.0% 6.0% 3.5% 3.6% 4.6% 3.9% 1.1%Malta - 3.4% 2.8% 0.8% 4.5% 3.2% 3.3% 4.3% 3.6% 0.8%Netherlands - 5.0% 5.1% 2.7% 5.9% 3.4% 3.5% 4.5% 3.9% 1.0%Poland - 3.8% 3.3% 1.1% 4.6% 3.2% 3.3% 4.2% 3.6% 0.8%Portugal - 5.0% 6.6% 5.7% 4.5% 3.2% 3.3% 4.2% 3.6% 0.8%Slovakia - 4.2% 4.3% 1.5% 4.4% 3.1% 3.3% 4.2% 3.6% 0.8%Slovenia - 3.5% 4.8% -1.5% 4.5% 3.2% 4.0% 4.6% 3.6% 1.6%Spain - 4.6% 5.1% 2.5% 4.7% 3.2% 3.3% 4.3% 3.7% 0.8%Sweden - 4.3% 4.3% 1.6% 4.4% 3.2% 3.2% 4.2% 3.6% 0.7%UK - 5.2% 5.8% 2.4% 5.6% 3.5% 3.5% 4.5% 3.9% 1.0%EU10 - 3.9% 3.9% 1.8% 4.6% 3.2% 3.3% 4.3% 3.6% 0.8%EU15 - 4.7% 5.0% 2.5% 5.3% 3.4% 3.4% 4.4% 3.8% 0.9%EU25 - 4.7% 5.0% 2.5% 5.3% 3.4% 3.4% 4.4% 3.8% 0.9%Notes: a Based ICAO FESG/CAEP-6 Traffic and Fleet Forecast Sub-Group scenarios
b Based on IPCC reference scenario SRES A1 (high economic growth)c Based on IPCC reference scenario SRES B2 (low economic growth)
FESG/CAEP-6a SRES A1b SRES B2cAnnual emission growth rates [%]
Source: MMU 2005b.

19
Table 10 Projected increase of CO2 emissions from aviation for EU 15 MemberStates 2005-2050
2005 2010 2015 2020 2030 2040 2050 2030 2040 2050dom 100 122 145 163 242 332 454 200 285 305int 100 122 141 158 267 366 506 220 315 340total 100 122 141 158 266 365 504 219 313 339dom - - - - - - - - - -int 100 121 145 157 258 361 509 213 310 342total 100 121 145 157 258 361 509 213 310 342dom 100 124 155 171 254 347 476 210 298 320int 100 124 163 191 316 436 605 261 374 407total 100 124 162 188 308 424 588 254 364 395dom 100 121 142 156 232 317 435 192 272 292int 100 120 133 160 265 364 504 219 313 339total 100 120 135 159 258 355 490 213 305 329dom 100 126 165 209 311 424 582 257 364 391int 100 124 154 173 306 429 607 253 369 408total 100 125 156 180 307 428 602 253 368 405dom 100 119 135 147 219 299 410 181 257 276int 100 127 166 186 318 442 621 262 380 417total 100 126 163 182 307 427 598 253 367 402dom 100 119 135 144 215 293 402 177 252 270int 100 124 156 167 269 369 509 222 317 342total 100 123 151 162 256 351 485 212 302 326dom 100 125 157 200 297 405 557 245 348 374int 100 123 153 163 263 364 507 217 313 341total 100 123 154 166 266 367 511 219 315 343dom 100 120 141 156 233 318 437 193 274 294int 100 125 156 173 294 409 573 242 351 385total 100 124 152 168 277 383 535 228 329 359dom - - - - - - - - - -int 100 129 173 210 377 532 759 311 457 510total 100 129 173 210 377 532 759 311 457 510dom 100 123 147 167 250 340 467 207 293 313int 100 127 163 186 331 465 657 273 399 442total 100 127 163 186 331 464 656 273 399 441dom 100 132 197 309 461 628 862 380 539 579int 100 126 171 213 334 458 633 276 394 426total 100 127 176 231 358 491 677 295 421 455dom 100 124 156 179 266 363 499 220 312 335int 100 126 164 183 298 412 573 246 354 385total 100 125 161 181 287 395 546 237 339 367dom 100 123 151 165 246 336 461 203 288 310int 100 123 153 164 259 355 489 214 305 329total 100 123 152 164 253 346 477 209 297 320dom 100 125 160 183 272 371 510 225 319 343int 100 129 172 194 340 479 680 281 412 457total 100 129 171 193 334 469 664 275 403 446
Notes: a Based ICAO FESG/CAEP-6 Traffic and Fleet Forecast Sub-Group scenariosb Based on IPCC reference scenario SRES A1 (high economic growth)c Based on IPCC reference scenario SRES B2 (low economic growth)
UK
Spain
Sweden
Netherlands
Portugal
Italy
Luxembourg
Germany
Greece
Ireland
Denmark
Finland
France
Austria
Belgium
Relative emission growth [2005=100]FESG/CAEP-6a SRES A1b SRES B2c
Source: MMU 2005b.

20
Table 11 Projected increase of CO2 emissions from aviation for EU 10 MemberStates 2005-2050
2005 2010 2015 2020 2030 2040 2050 2030 2040 2050dom 100 150 225 300 450 600 825 375 525 550int 100 128 180 236 367 504 696 303 433 468total 100 128 180 237 368 505 697 304 434 469dom 100 120 160 180 260 360 500 220 300 340int 100 119 137 142 223 308 427 184 264 287total 100 119 137 143 224 308 428 185 265 288dom - - - - - - - - - -int 100 120 134 138 214 292 400 176 250 270total 100 120 134 138 214 292 400 176 250 270dom - - - - - - - - - -int 100 121 142 147 238 327 452 196 280 303total 100 121 142 147 238 327 452 196 280 303dom - - - - - - - - - -int 100 119 139 145 226 310 427 187 266 287total 100 119 139 145 226 310 427 187 266 287dom 100 120 160 160 260 340 460 220 300 300int 100 118 133 135 209 286 392 173 245 264total 100 118 135 137 213 290 397 176 249 266dom - - - - - - - - - -int 100 118 136 142 220 303 419 182 260 281total 100 118 136 142 220 303 419 182 260 281dom 100 122 145 162 242 331 454 200 285 305int 100 120 141 148 233 320 443 193 275 298total 100 120 141 150 235 322 445 194 276 299dom 100 117 133 150 217 283 400 183 250 267int 100 124 155 166 259 352 486 210 303 328total 100 123 151 163 251 340 471 206 294 317dom - - - - - - - - - -int 100 119 136 139 216 295 405 178 253 272total 100 119 150 139 216 295 439 178 253 295
Notes: a Based ICAO FESG/CAEP-6 Traffic and Fleet Forecast Sub-Group scenariosb Based on IPCC reference scenario SRES A1 (high economic growth)c Based on IPCC reference scenario SRES B2 (low economic growth)
Slovakia
Slovenia
Malta
Poland
Latvia
Lithuania
Hungary
Estonia
Cyprus
CzechRepublic
Relative emission growth [2005=100]FESG/CAEP-6a SRES A1b SRES B2c
Source: MMU 2005b.
Table 12 Projected increase of CO2 emissions from aviation for the EU 2005-2050
2005 2010 2015 2020 2030 2040 2050 2030 2040 2050dom 100 122 160 168 252 342 496 209 295 333int 100 121 147 161 253 348 481 209 298 323total 100 121 147 161 253 347 481 209 298 323dom 100 123 153 177 264 360 494 218 309 332int 100 126 162 183 314 438 617 259 376 415total 100 126 161 182 306 426 597 252 366 401dom 100 123 153 177 264 360 494 218 309 332int 100 126 162 182 312 436 614 258 374 412total 100 126 161 181 305 424 595 251 364 400
Notes: a Based ICAO FESG/CAEP-6 Traffic and Fleet Forecast Sub-Group scenariosb Based on IPCC reference scenario SRES A1 (high economic growth)c Based on IPCC reference scenario SRES B2 (low economic growth)
EU10
EU15
EU25
Relative emission growth [2005=100]FESG/CAEP-6a SRES A1b SRES B2c
Source: MMU 2005b.
21
Tyndall growth scenarios
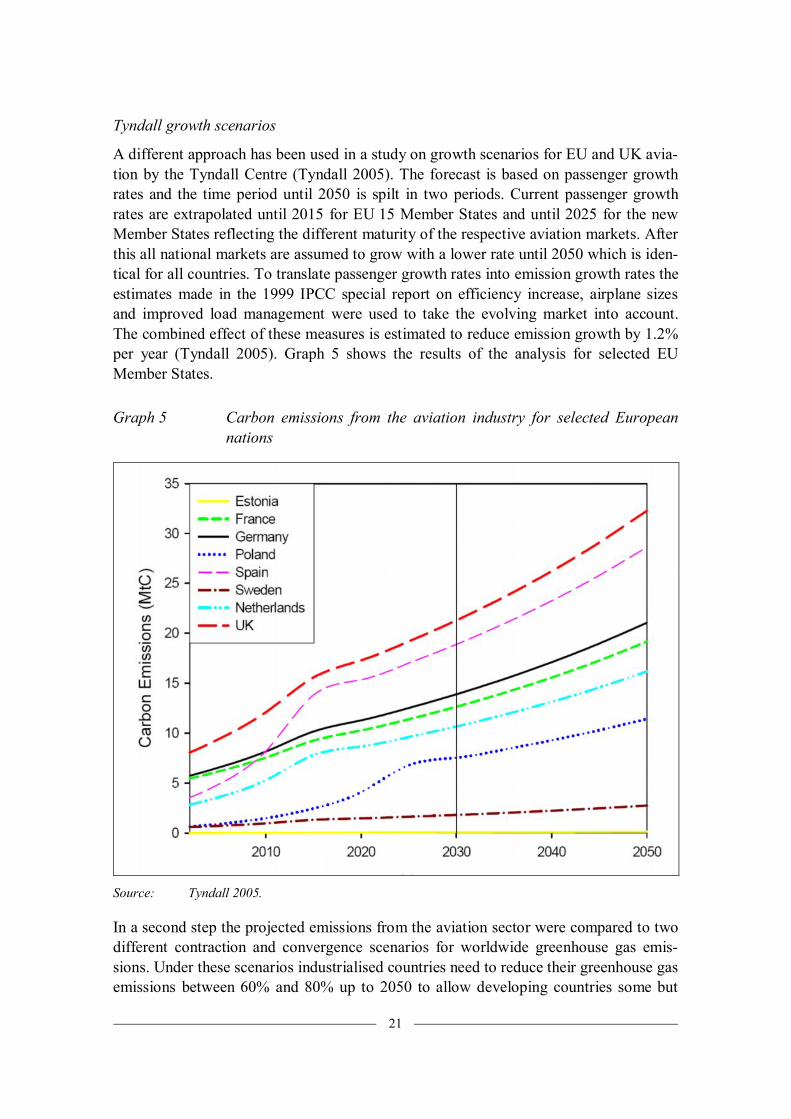
A different approach has been used in a study on growth scenarios for EU and UK avia-tion by the Tyndall Centre (Tyndall 2005). The forecast is based on passenger growthrates and the time period until 2050 is spilt in two periods. Current passenger growthrates are extrapolated until 2015 for EU 15 Member States and until 2025 for the newMember States reflecting the different maturity of the respective aviation markets. Afterthis all national markets are assumed to grow with a lower rate until 2050 which is iden-tical for all countries. To translate passenger growth rates into emission growth rates theestimates made in the 1999 IPCC special report on efficiency increase, airplane sizesand improved load management were used to take the evolving market into account.The combined effect of these measures is estimated to reduce emission growth by 1.2%per year (Tyndall 2005). Graph 5 shows the results of the analysis for selected EUMember States.
Graph 5 Carbon emissions from the aviation industry for selected Europeannations
Source: Tyndall 2005.
In a second step the projected emissions from the aviation sector were compared to twodifferent contraction and convergence scenarios for worldwide greenhouse gas emis-sions. Under these scenarios industrialised countries need to reduce their greenhouse gasemissions between 60% and 80% up to 2050 to allow developing countries some but

22
also limited room for emission increases. The difference between the two scenarios isthe level at which greenhouse gas concentrations should stabilise in the atmosphere.Graph 6 shows that the share of emissions from the aviation sector alone could requirethe full allowable CO2 budget if left unchecked in the lower scenario. If the CO2 emis-sions are multiplied with a factor to take the indirect effects of aviation on the climateinto account the share of aviation on global warming further increases.
Graph 6 Contraction and Convergence Profiles for EU 25 Compared withAviation Forecasts
Source: Tyndall 2005.
4.2 Forecasts from the aviation industrySeveral companies in the aviation sector publish projections on revenue passengerkilometres (RPK) for the next 20 years disaggregated by region. These values are usedto assess the future market for airplanes and emissions of greenhouse gases or fuel con-sumption are normally not included in the analyses. Table 13 gives an overview overdifferent projections published by the industry. In general forecasted growth rates arerather close between the different data sets with only few large discrepancies. Especiallythe average growth rate for the entire market is at our close to 5% per year in all studiesand studied time horizons. A growth of RPK does not directly translate into a growth ofCO2 emissions as in general new airplane get more efficient and larger airplanes con-sume less fuel per passenger kilometre than small ones. IPCC estimated that the annualdecrease of emissions due to such effects amount to about 1.2%, i.e. the worldwideemissions from aviation are expected to grow by about 4% per year until 2025.

23
Airbus estimates that by 2025 15% of the revenue passenger kilometres will be gener-ated by domestic US flights followed by intra-EU flights (9%), domestic flights inChina and flights between the EU and the US (both 7%) (Airbus 2006).
Table 13 Annual average growth forecasts of revenue passenger kilometres byregion
1998-2008 1998-2018 2005-2025Region Airbus Boeing Rolls
RoyceaAvitasb Airbus Boeing Rolls
RoyceaAvitasb Airbus Boeing
Intra North America 2.9% 3.0% 3.3% 2.5% 2.7% 2.9% 3.0% 2.5% 2.7% 3.6%Intra Europe 5.7% 4.5% 4.7% 3.7% 5.5% 4.3% 3.9% 4.2% 4.1% 3.5%Europe - North America 5.3% 3.8% 4.2% 5.2% 5.0% 3.7% 3.7% 4.6% 4.3% 4.5%Africa - Europe 4.4% 5.0% 5.6% 7.3% 4.2% 4.8% 5.1% 7.5% 4.6% 5.0%C America - N America 5.3% 4.1% 5.7% 4.1% 5.0% 4.0% 5.1% 3.8% 4.3% 4.9%Intra China 8.8% 10.2% 12.9% - 8.4% 9.3% 10.9% - 8.2% 6.4%C America - Europe 5.3% 4.1% 5.8% 4.2% 5.0% 4.0% 5.2% 4.9% 5.8% 5.1%Intra South America 4.6% 7.0% 5.2% 12.0% 4.6% 6.9% 5.0% 11.7% 6.0% 6.9%Total World 5.1% 4.7% 5.5% 5.2% 5.0% 4.7% 5.1% 5.0% 4.8% 4.9%Notes: a forecasts are for 1997- 2007 and 1997 - 2017; regional segmentations differs in some cases
b forecasts are for 1999-2009 and 1999-2019
Source: Anker 2000, Airbus 2006, Boeing 2006.
4.3 Projections included in National CommunicationsOnly few countries publish national projections for the development of the aviation sec-tor. Data on the expected increase of aviation emissions for the next 15 to 25 years isincluded in six 4th national communications under the UNFCCC from EU MemberStates (Table 14). The projections made by the Czech Republic, Denmark and Franceare well annual below the business forecast for Europe as a whole and the detailed pro-jections by Lee/Owen.
Table 14 Member State’s projections
Emissions [kt CO2] Annual growth rate1990 2000 2005 2010 2015 2020 2030 1990-2010 2010-2020
Czech Republic 627 349 613 752 859 940 0.9% 1.4%Denmark 2 001 2 533 2 406 2 604 2 823 3 082 3 508 1.3% 1.5%France 13 000 21 800 24 450 27 100 2.6% 2.5%Netherlands 4 552 11 200 12 800 13 600 14 400 5.3% 3.9%Portugala 167 367 462 625 5.2% 4.5%Swedenb 1 354 2 708 3 250 3.5% 3.0%Notes: a Emissions from domestic aviation only
b Emissions from interntional aivation only. Estimates for 2010 and 2020 based on growth data included in theSwedish 4th National Communication
Source: Member State’s 4th National Communications under the UNFCCC and the Kyoto Protocol.

24
5 ReferencesAirbus (2006): Global Market Forecast The future of flying 2006-2025.
Anker, Ralph (2000): Comparison of Airbus, Boeing, Rolls-Royce and AVITAS MarketForecasts. Air & Space Europe, Vol.2, No.3-2000.
Boeing (2006): Current Market Outlook 2006
CE Delft, MNP (2007): Aviation and maritime transport in a post 2012 climate policyregime (in press).
CEC (Commission of the European Communities) (2006): Proposal for a Directive ofthe European Parliament and of the Council amending Directive 2003/87/EC soas to include aviation activities in the scheme for greenhouse gas emission al-lowance trading within the Community
EC (European Community) (2006): Annual European Community greenhouse gas in-ventory 1990-2004 and inventory report 2006, Version 14 December 2006.
EEA (European Environment Agency) (2006): EMEP/CORINAIR Atmospheric Emis-sion Inventory Guidebook, 3rd edition.
ETC/ACC (European Topic Centre on Air and Climate Change) (2004): Comparison ofEurocontrol/Eurostat and IEA estimates with MS inventories, presentation at theWorkshop on emissions of greenhouse gases from aviation and navigationhttp://air-climate.eionet.europa.eu/meetings/past_html.
Eurocontrol (2005): EUROCONTROL Compendium for the first meeting of the Euro-pean Climate Change Programme II Aviation Working Grouphttp://forum.europa.eu.int/Public/irc/env/eccp_2/library?l=/work_group_aviation
IPCC (Intergovernmental Panel on Climate Change) (1996): Revised 1996 IPCC Guide-lines for National Greenhouse Gas Inventories.
IPCC (Intergovernmental Panel on Climate Change) (1999): IPCC Special Report Avia-tion and the Global Atmosphere.
IPCC (Intergovernmental Panel on Climate Change) (2000a): Good Practice Guidanceand Uncertainty Management in National Greenhouse Gas Inventories.
IPCC (Intergovernmental Panel on Climate Change) (2000b): Emission Scenarios. ASpecial Report of Working Group III of the Intergovernmental Panel on ClimateChange
Manchester Metropolitan University (MMU) (2005a): Allocation of International Avia-tion Emissions from Scheduled Air Traffic – Present day and Historical (Report2 of 3), Final Report to DEFRA Global Atmosphere Division
Manchester Metropolitan University (MMU) (2005b): Allocation of International Avia-tion Emissions from Scheduled Air Traffic – Future Cases, 2005 to 2050 (Re-port 3 of 3), Final Report to DEFRA Global Atmosphere Division

25
Sausen (2005): R. Sausen, Isaksen I., Grewe V., Hauglustaine D., Lee D. S., Myhre G.,Köhler M. O., Pitari G., Schumann U., Stordal F. and Zerefos C. Aviation radia-tive forcing in 2000: an update on IPCC. Meteorologische Zeitschrift Vol. 14,No.4, 555 – 561 (2005)
T&E (European Federation for Transport and Environment) (2006): Clearing the Air.The Myth and Reality of Aviation and Climate Change
Tyndall Centre (2005): Growth Scenarios for EU & UK Aviation: contradictions withclimate policy
UNFCCC (1996a): Emissions from international bunker fuels, documentFCCC/SBSTA/1996/9/Add.2
UNFCCC (1996b): Report of the Subsidiary Body for Scientific and Technological Ad-vice on the work of its fourth session Geneva, 16-18 December 1996, documentFCCC/SBSTA/1996/20

26
Annex I
Table A- 1 CO2 emissions from aviation from EU 15 Member States 2005-2050
2005 2010 2015 2020 2030 2040 2050 2030 2040 2050dom 92 112 133 150 223 305 418 184 262 281int 1 920 2 351 2 713 3 033 5 125 7 033 9 720 4 229 6 042 6 532total 2 012 2 463 2 846 3 183 5 348 7 338 10 138 4 413 6 304 6 813dom 0 0 0 0 0 0 0 0 0 0int 2 857 3 471 4 129 4 484 7 381 10 314 14 529 6 089 8 859 9 763total 2 857 3 471 4 129 4 484 7 381 10 314 14 529 6 089 8 859 9 763dom 234 290 362 399 595 811 1 113 491 697 748int 1 519 1 885 2 479 2 900 4 801 6 618 9 190 3 961 5 685 6 176total 1 753 2 175 2 841 3 299 5 396 7 429 10 303 4 452 6 382 6 924dom 358 433 508 558 832 1 135 1 558 686 975 1 047int 1 352 1 623 1 795 2 160 3 586 4 927 6 819 2 958 4 232 4 583total 1 710 2 056 2 303 2 718 4 418 6 062 8 377 3 644 5 207 5 630dom 2 796 3 513 4 612 5 830 8 698 11 863 16 286 7 176 10 190 10 944int 11 397 14 179 17 532 19 744 34 906 48 937 69 174 28 797 42 037 46 485total 14 193 17 692 22 144 25 574 43 604 60 800 85 460 35 973 52 227 57 429dom 1 773 2 109 2 399 2 602 3 882 5 295 7 269 3 203 4 548 4 885int 14 539 18 516 24 162 27 052 46 209 64 312 90 221 38 122 55 244 60 629total 16 312 20 625 26 561 29 654 50 091 69 607 97 490 41 325 59 792 65 514dom 460 547 619 663 989 1 348 1 851 816 1 158 1 244int 1 563 1 944 2 441 2 612 4 197 5 760 7 961 3 463 4 948 5 349total 2 023 2 491 3 060 3 275 5 186 7 108 9 812 4 279 6 106 6 593dom 77 96 121 154 229 312 429 189 268 288int 1 091 1 345 1 672 1 783 2 873 3 973 5 536 2 370 3 413 3 720total 1 168 1 441 1 793 1 937 3 102 4 285 5 965 2 559 3 681 4 008dom 2 464 2 962 3 472 3 856 5 753 7 846 10 771 4 746 6 740 7 238int 6 278 7 849 9 789 10 836 18 433 25 653 35 984 15 207 22 036 24 181total 8 742 10 811 13 261 14 692 24 186 33 499 46 755 19 953 28 776 31 419dom 0 0 0 0 0 0 0 0 0 0int 382 494 661 803 1 439 2 034 2 899 1 187 1 747 1 948total 382 494 661 803 1 439 2 034 2 899 1 187 1 747 1 948dom 30 37 44 50 75 102 140 62 88 94int 6 389 8 138 10 422 11 907 21 156 29 683 41 990 17 454 25 498 28 218total 6 419 8 175 10 466 11 957 21 231 29 785 42 130 17 516 25 586 28 312dom 246 325 484 759 1 133 1 545 2 121 935 1 327 1 425int 1 049 1 326 1 789 2 234 3 503 4 807 6 644 2 890 4 129 4 465total 1 295 1 651 2 273 2 993 4 636 6 352 8 765 3 825 5 456 5 890dom 3 141 3 882 4 886 5 608 8 366 11 410 15 665 6 902 9 801 10 527int 5 698 7 171 9 319 10 432 17 006 23 470 32 637 14 030 20 161 21 932total 8 839 11 053 14 205 16 040 25 372 34 880 48 302 20 932 29 962 32 459dom 1 084 1 334 1 637 1 788 2 668 3 639 4 995 2 201 3 126 3 357int 1 389 1 712 2 119 2 277 3 596 4 926 6 795 2 967 4 231 4 566total 2 473 3 046 3 756 4 065 6 264 8 565 11 790 5 168 7 357 7 923dom 2 479 3 102 3 977 4 526 6 752 9 209 12 643 5 570 7 911 8 496int 22 429 28 996 38 654 43 527 76 369 107 517 152 629 63 004 92 357 102 567total 24 908 32 098 42 631 48 053 83 121 116 726 165 272 68 574 100 268 111 063
Notes:
Emissions [kt CO2]FESG/CAEP-6a SRES A1b SRES B2c
Sweden
UK
Portugal
Spain
Luxembourg
Netherlands
Germany
Greece
a Based ICAO FESG/CAEP-6 Traffic and Fleet Forecast Sub-Group scenariosb Based on IPCC reference scenario SRES A1 (high economic growth)c Based on IPCC reference scenario SRES B2 (low economic growth)
Ireland
Italy
Denmark
Finland
France
Austria
Belgium
Source: MMU 2005b.
27
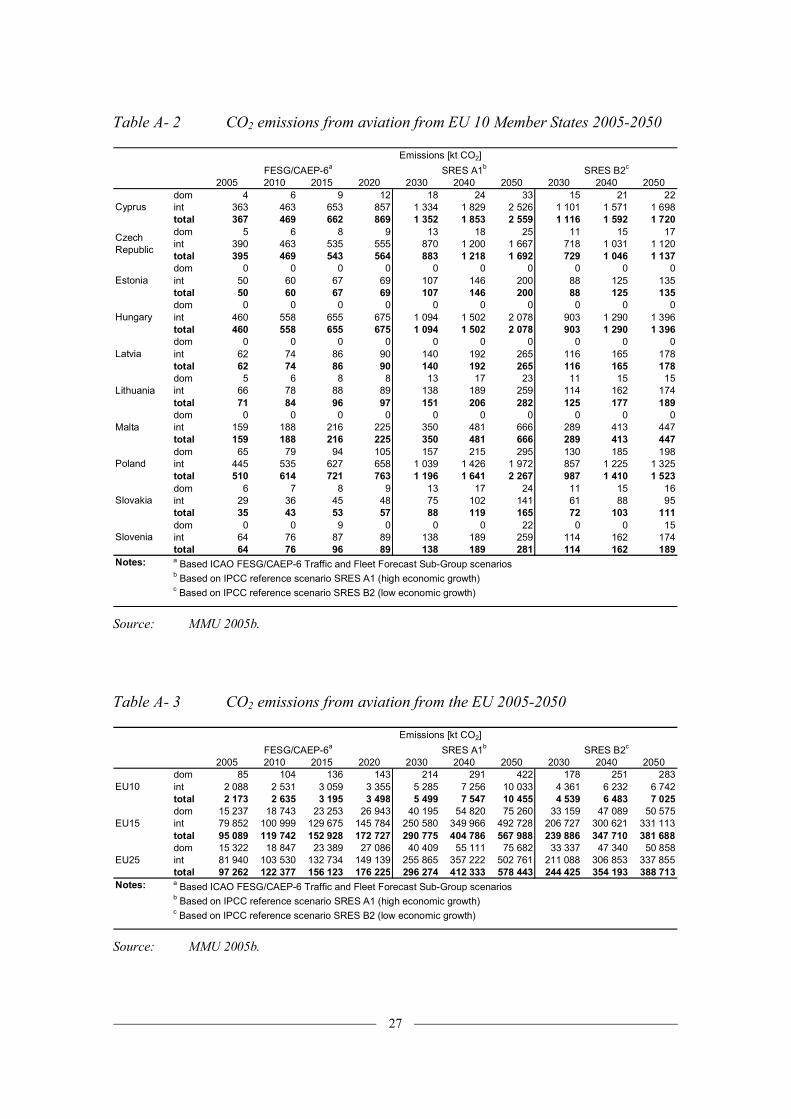
Table A- 2 CO2 emissions from aviation from EU 10 Member States 2005-2050
2005 2010 2015 2020 2030 2040 2050 2030 2040 2050dom 4 6 9 12 18 24 33 15 21 22int 363 463 653 857 1 334 1 829 2 526 1 101 1 571 1 698total 367 469 662 869 1 352 1 853 2 559 1 116 1 592 1 720dom 5 6 8 9 13 18 25 11 15 17int 390 463 535 555 870 1 200 1 667 718 1 031 1 120total 395 469 543 564 883 1 218 1 692 729 1 046 1 137dom 0 0 0 0 0 0 0 0 0 0int 50 60 67 69 107 146 200 88 125 135total 50 60 67 69 107 146 200 88 125 135dom 0 0 0 0 0 0 0 0 0 0int 460 558 655 675 1 094 1 502 2 078 903 1 290 1 396total 460 558 655 675 1 094 1 502 2 078 903 1 290 1 396dom 0 0 0 0 0 0 0 0 0 0int 62 74 86 90 140 192 265 116 165 178total 62 74 86 90 140 192 265 116 165 178dom 5 6 8 8 13 17 23 11 15 15int 66 78 88 89 138 189 259 114 162 174total 71 84 96 97 151 206 282 125 177 189dom 0 0 0 0 0 0 0 0 0 0int 159 188 216 225 350 481 666 289 413 447total 159 188 216 225 350 481 666 289 413 447dom 65 79 94 105 157 215 295 130 185 198int 445 535 627 658 1 039 1 426 1 972 857 1 225 1 325total 510 614 721 763 1 196 1 641 2 267 987 1 410 1 523dom 6 7 8 9 13 17 24 11 15 16int 29 36 45 48 75 102 141 61 88 95total 35 43 53 57 88 119 165 72 103 111dom 0 0 9 0 0 0 22 0 0 15int 64 76 87 89 138 189 259 114 162 174total 64 76 96 89 138 189 281 114 162 189
Notes:
Emissions [kt CO2]FESG/CAEP-6a SRES A1b SRES B2c
Slovenia
Malta
Poland
Hungary
a Based ICAO FESG/CAEP-6 Traffic and Fleet Forecast Sub-Group scenariosb Based on IPCC reference scenario SRES A1 (high economic growth)c Based on IPCC reference scenario SRES B2 (low economic growth)
Latvia
Lithuania
Slovakia
Estonia
Cyprus
CzechRepublic
Source: MMU 2005b.
Table A- 3 CO2 emissions from aviation from the EU 2005-2050
2005 2010 2015 2020 2030 2040 2050 2030 2040 2050dom 85 104 136 143 214 291 422 178 251 283int 2 088 2 531 3 059 3 355 5 285 7 256 10 033 4 361 6 232 6 742total 2 173 2 635 3 195 3 498 5 499 7 547 10 455 4 539 6 483 7 025dom 15 237 18 743 23 253 26 943 40 195 54 820 75 260 33 159 47 089 50 575int 79 852 100 999 129 675 145 784 250 580 349 966 492 728 206 727 300 621 331 113total 95 089 119 742 152 928 172 727 290 775 404 786 567 988 239 886 347 710 381 688dom 15 322 18 847 23 389 27 086 40 409 55 111 75 682 33 337 47 340 50 858int 81 940 103 530 132 734 149 139 255 865 357 222 502 761 211 088 306 853 337 855total 97 262 122 377 156 123 176 225 296 274 412 333 578 443 244 425 354 193 388 713
Notes:
EU25
Emissions [kt CO2]FESG/CAEP-6a SRES A1b SRES B2c
EU10
EU15
a Based ICAO FESG/CAEP-6 Traffic and Fleet Forecast Sub-Group scenariosb Based on IPCC reference scenario SRES A1 (high economic growth)c Based on IPCC reference scenario SRES B2 (low economic growth)
Source: MMU 2005b.