GRAPHS Professor Karen Leppel Economics 202. Upward-sloping lines Example 1: DIETING Consider your...
114
GRAPHS Professor Karen Leppel Economics 202
-
Upload
june-mitchell -
Category
Documents
-
view
223 -
download
1
Transcript of GRAPHS Professor Karen Leppel Economics 202. Upward-sloping lines Example 1: DIETING Consider your...

GRAPHS
Professor Karen Leppel
Economics 202
Upward-sloping lines
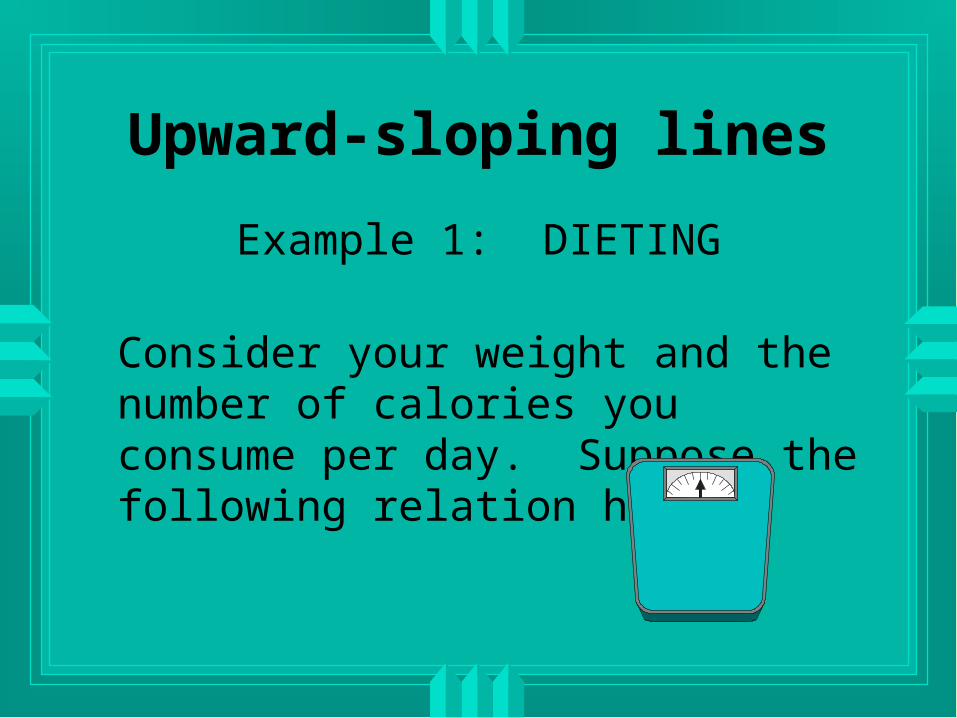
Example 1: DIETING
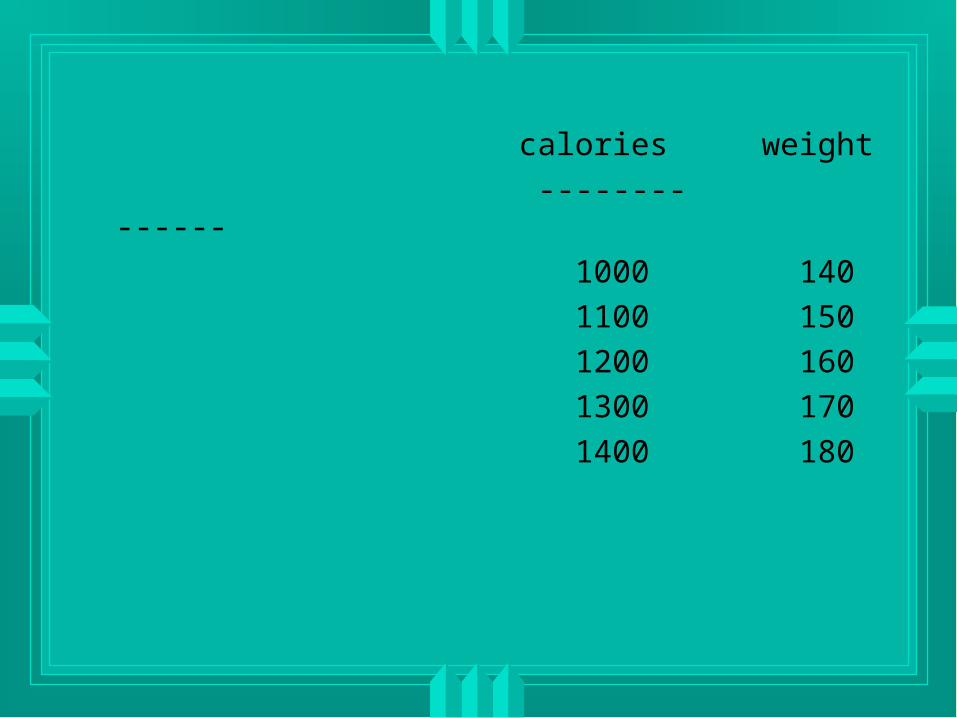
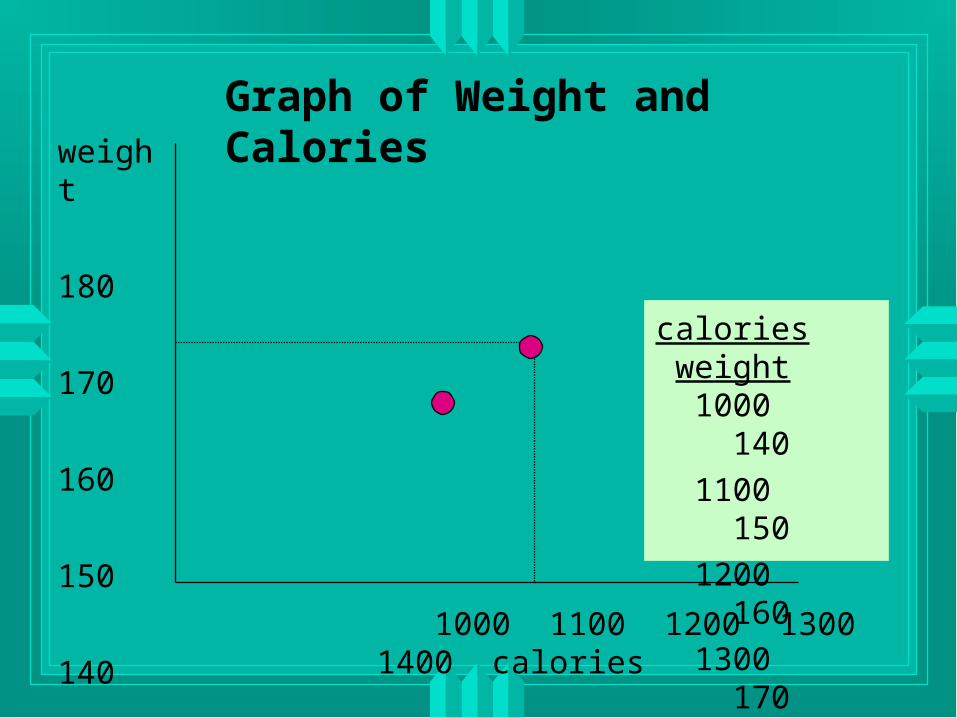
Consider your weight and the number of calories you consume per day. Suppose the following relation holds.
calories weight
-------- ------
1000 140
1100 150
1200 160
1300 170
1400 180

weight
180
170
160
150
140
1000 1100 1200 1300 1400 calories
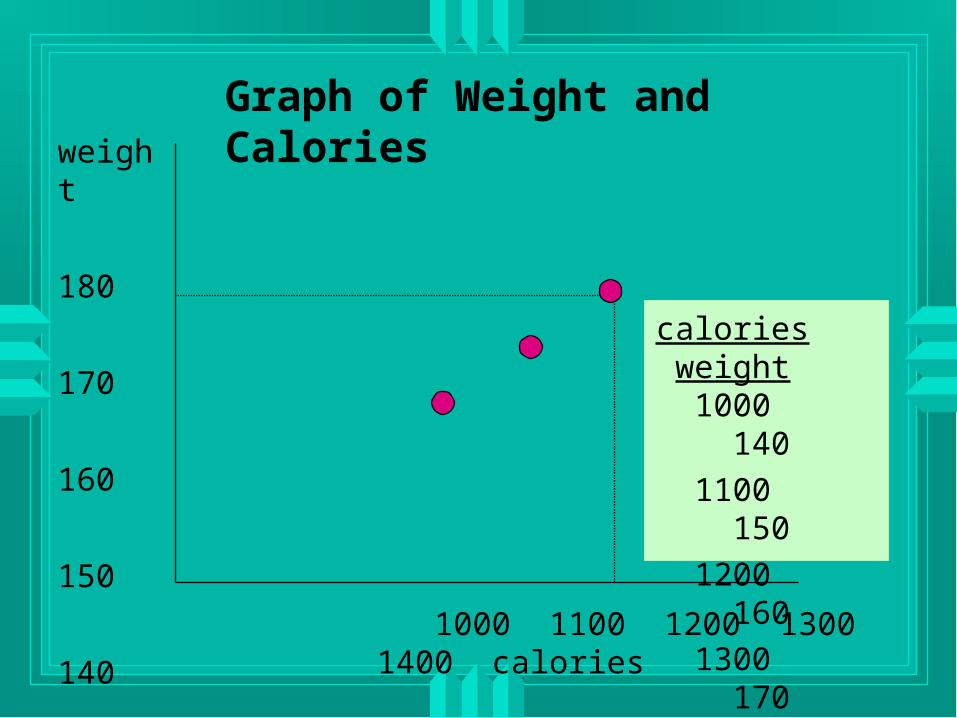
Graph of Weight and Calories

weight
180
170
160
150
140
1000 1100 1200 1300 1400 calories
Graph of Weight and Calories
calories weight
1000 140
1100 150
1200 160
1300 170
1400 180

weight
180
170
160
150
140
1000 1100 1200 1300 1400 calories
Graph of Weight and Calories
calories weight
1000 140
1100 150
1200 160
1300 170
1400 180
weight
180
170
160
150
140
1000 1100 1200 1300 1400 calories
Graph of Weight and Calories
calories weight
1000 140
1100 150
1200 160
1300 170
1400 180
weight
180
170
160
150
140
1000 1100 1200 1300 1400 calories
Graph of Weight and Calories
calories weight
1000 140
1100 150
1200 160
1300 170
1400 180

weight
180
170
160
150
140
1000 1100 1200 1300 1400 calories
Graph of Weight and Calories
calories weight
1000 140
1100 150
1200 160
1300 170
1400 180

weight
180
170
160
150
140
1000 1100 1200 1300 1400 calories
Graph of Weight and Calories
calories weight
1000 140
1100 150
1200 160
1300 170
1400 180

weight
180
170
160
150
140
1000 1100 1200 1300 1400 calories
Graph of Weight and Calories
calories weight
1000 140
1100 150
1200 160
1300 170
1400 180

weight
180
170
160
150
140
1000 1100 1200 1300 1400 calories
Graph of Weight and Calories
calories weight
1000 140
1100 150
1200 160
1300 170
1400 180

Your weight is the dependent variable, and the number of calories consumed is the independent variable.
The dependent variable, generally denoted by Y, is on the vertical axis.
The independent variable, generally denoted by X, is on the horizontal axis.
Your weight depends on the number of calories you consume.

your calories your weight

your calories your weight

So when looking from left to right, we see a line that slopes upward.
This is called a positive or direct relation.
The number of calories and your weight move in the same direction.

calories 100 weight 10
calories 100/100 weight 10/100
calories 1 weight 1/10 = .1
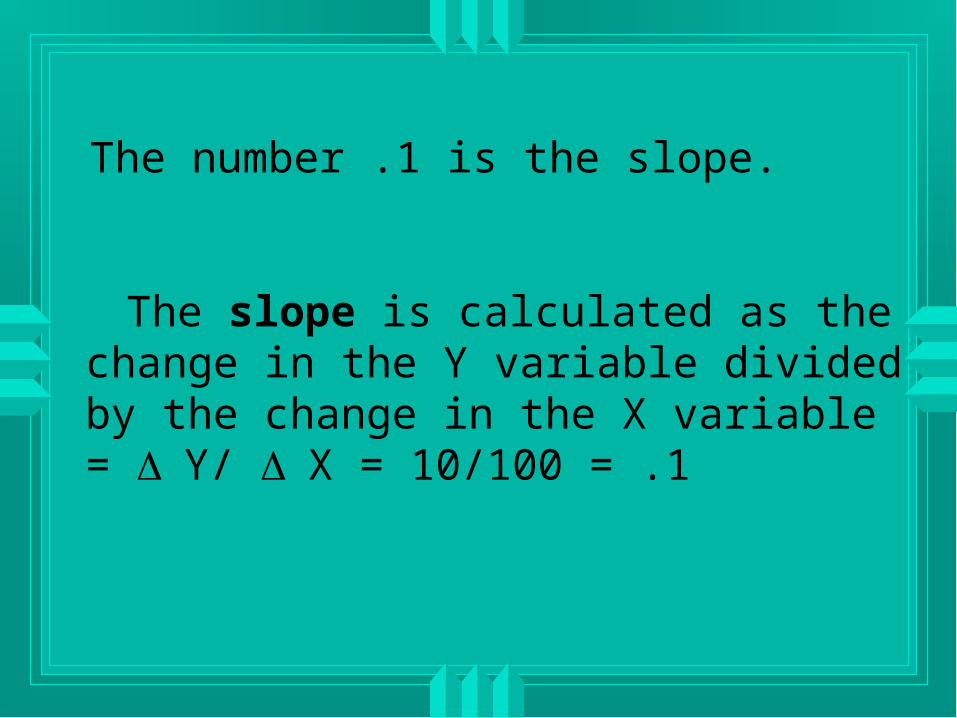
The number .1 is the slope.
The slope is calculated as the change in the Y variable divided by the change in the X variable = Y/ X = 10/100 = .1
It is the distance the line “rises” in the vertical direction divided by the distance it “runs” in the horizontal direction.
The slope formula is also sometimes expressed as the "rise" over the "run."

weight
180
170
160
150
140
1000 1100 1200 1300 1400 calories
run = 100
rise = 10
slope = rise/run = 10/100 = 1/10
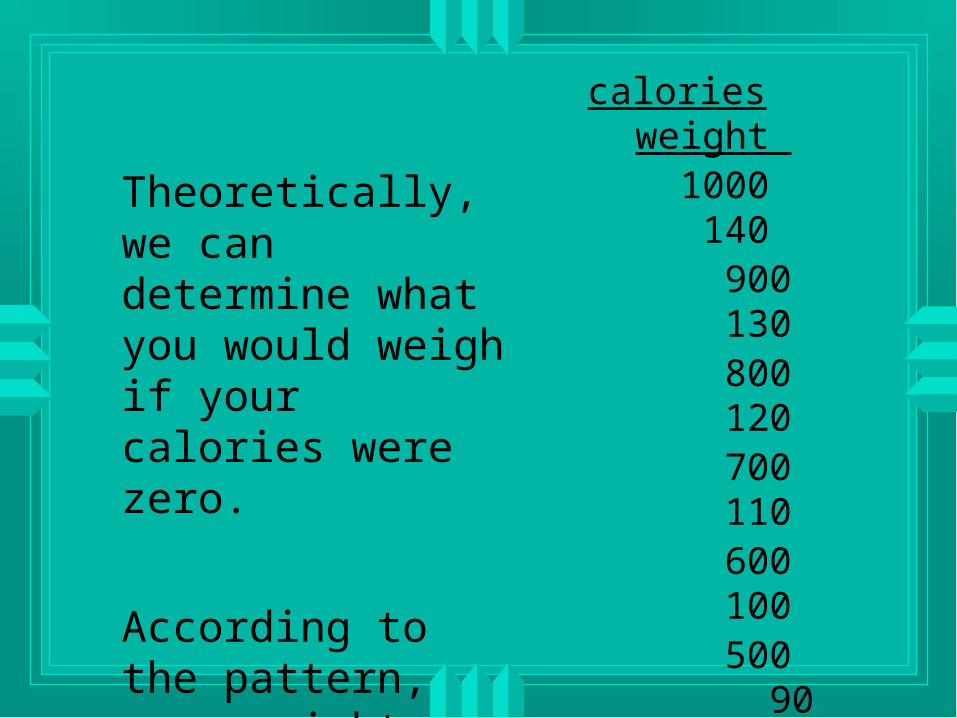
calories weight 1000 140 900 130 800 120 700 110 600 100 500 90 400 80 300 70 200 60 100 50 0 40
Theoretically, we can determine what you would weigh if your calories were zero.
According to the pattern, your weight would be 40 pounds.

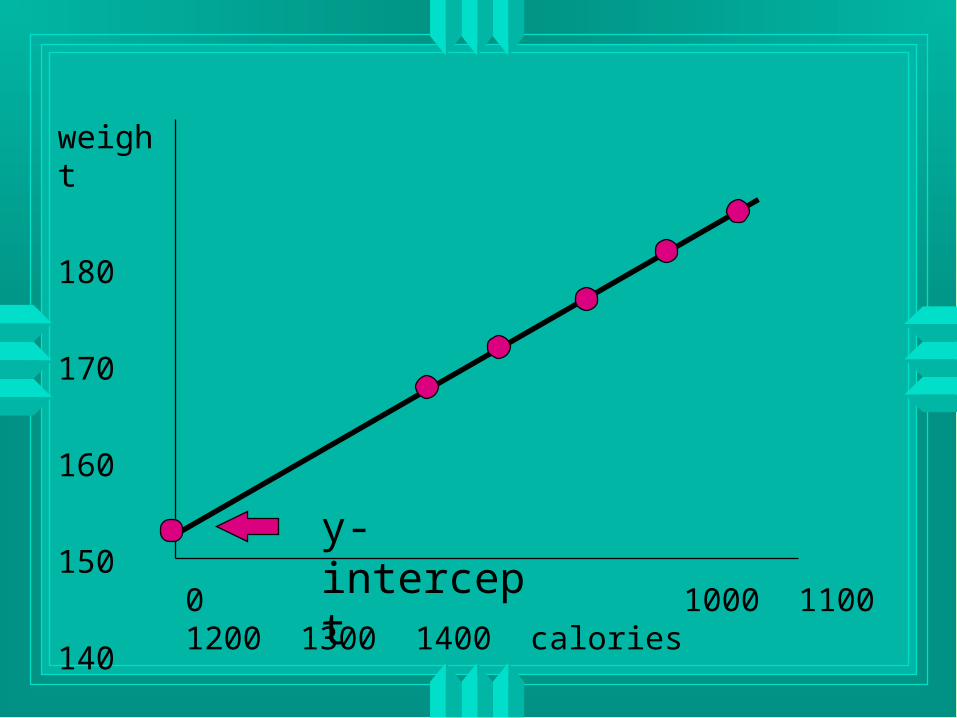
The number 40 is the value of the Y-intercept.
You can also find this number, by drawing the graph and extending the line to the vertical axis.
The Y-intercept tells you the value of the Y variable (weight) when the value of the X variable (calories) is zero.
weight
180
170
160
150
140
40
0 1000 1100 1200 1300 1400 calories
y-intercept
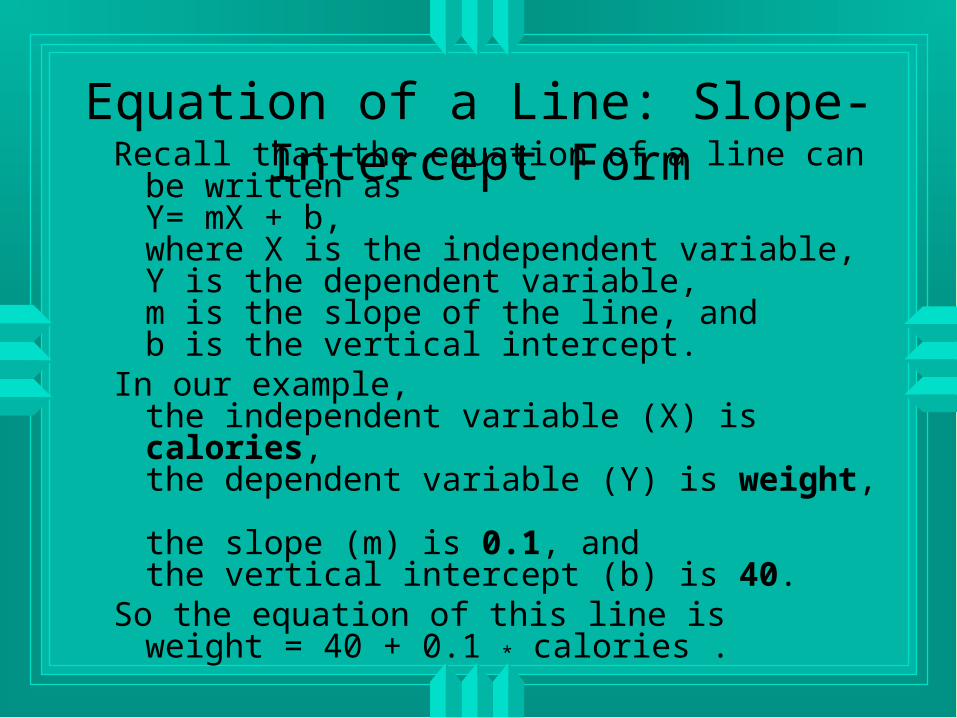
Recall that the equation of a line can be written as Y= mX + b, where X is the independent variable, Y is the dependent variable, m is the slope of the line, and b is the vertical intercept.
In our example, the independent variable (X) is calories, the dependent variable (Y) is weight, the slope (m) is 0.1, andthe vertical intercept (b) is 40.
So the equation of this line isweight = 40 + 0.1 * calories .
Equation of a Line: Slope-Intercept Form
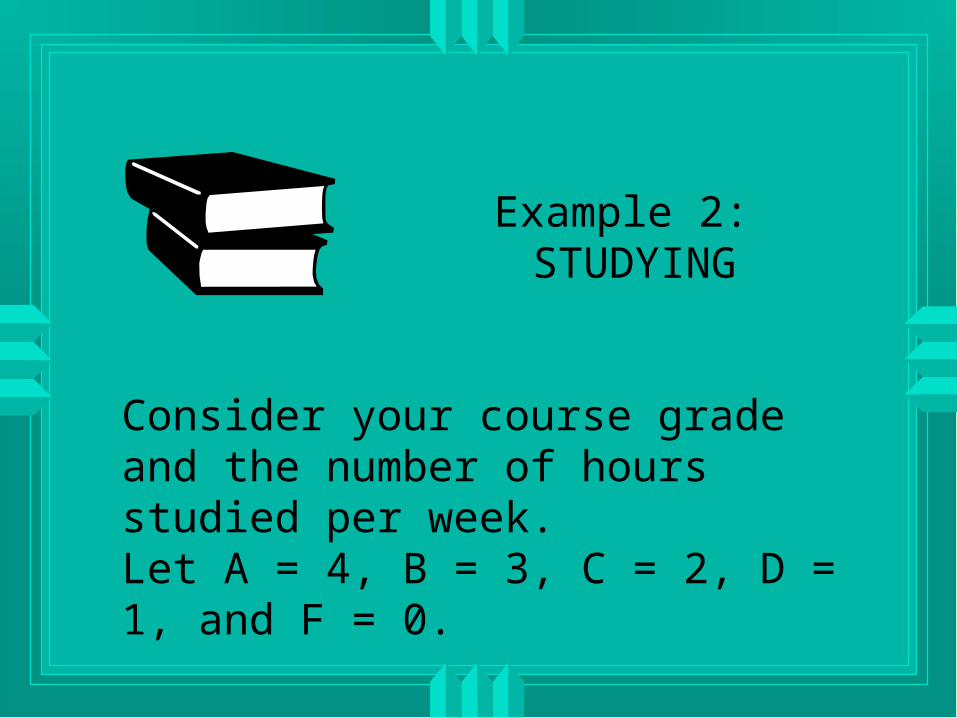
Example 2: STUDYING
Consider your course grade and the number of hours studied per week. Let A = 4, B = 3, C = 2, D = 1, and F = 0.

Suppose the graph of the relation looks like this:
grade
hrs. studied per week
4
3
2
1
0 2 4 6 8

If you studied for two hours per week, what would your grade be?
grade
hrs. studied per week
4
3
2
1
0 2 4 6 8
1 (D)

If you studied for eight hours per week, what would your grade be?
grade
hrs. studied per week
4
3
2
1
0 2 4 6 8
4 (A)

If you studied for zero hours per week, what would your grade be?
grade
hrs. studied per week
4
3
2
1
0 2 4 6 8
0 (F)

At what number does the line intersect the vertical axis?
grade
hrs. studied per week
4
3
2
1
0 2 4 6 8
0

What is the Y-intercept?
grade
hrs. studied per week
4
3
2
1
0 2 4 6 8
0

grade
hrs. studied per week
4
3
2
1
0 2 4 6 8
Filling in the other points, we have this table:
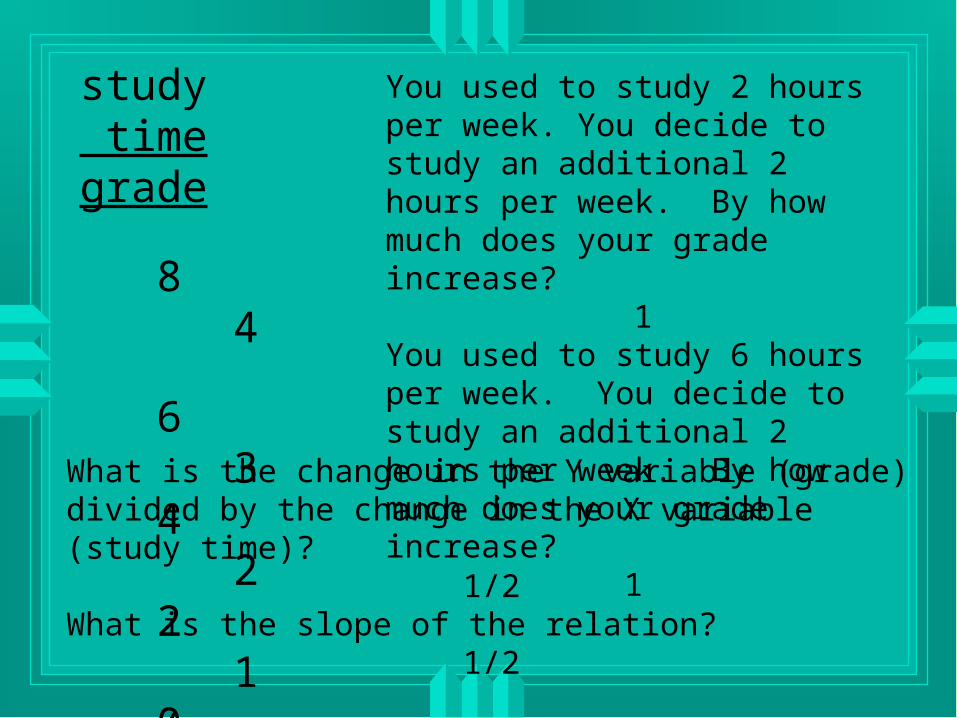
study time grade
8 4 6 3 4 2 2 1 0 0
study time grade 8 4
6 3 4 2 2 1 0 0
You used to study 2 hours per week. You decide to study an additional 2 hours per week. By how much does your grade increase?
1You used to study 6 hours per week. You decide to study an additional 2 hours per week. By how much does your grade increase?
1 What is the change in the Y variable (grade) divided by the change in the X variable (study time)?
1/2What is the slope of the relation?
1/2

grade = 0 + 0.5 * hrs studied or grade = 0.5 * hrs studied
Given that for this example, the independent variable is hrs studied, the dependent variable is grade, and we found that the slope is 0.5 and the intercept is 0, what is the equation of the relation?
Horizontal Lines
Example 3: DIETING
Suppose that no matter how many or how few calories you consumed, your weight stayed the same. Suppose, in particular, the following relation holds.

calories weight
1000 180
1100 180
1200 180
1300 180
1400 180

weight
180
170
160
150
140
1000 1100 1200 1300 1400 calories
calories weight
1000 180 1100 180 1200 180 1300 180 1400 180

Notice that Y never changes.
slope = Y/ X = 0/X = 0
The slope of a horizontal line is zero.
In this relation, your weight would remain at 180 even if you consumed zero calories.
So the Y-intercept is 180.
Y
180
X

weight = 180 + 0 * calories or weight = 180
Given that for this example, the independent variable is calories, the dependent variable is weight, and we found that the slope is 0 and the intercept is 180, what is the equation of the relation?
Example 4: STUDYING
Consider the following graph of the relation between study time and grades.
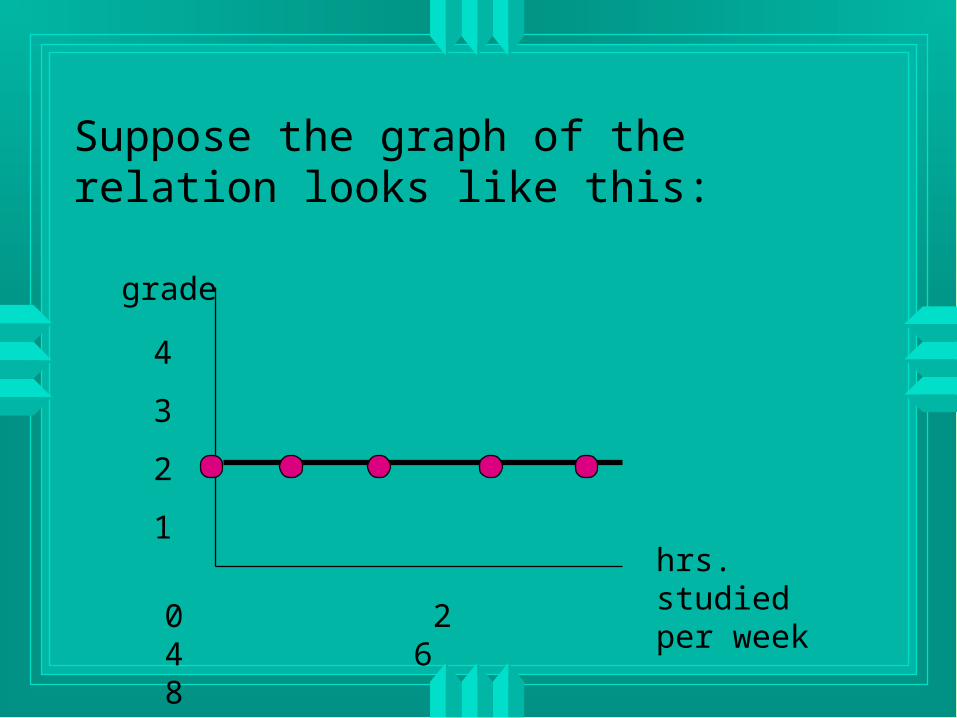
Suppose the graph of the relation looks like this:
grade
hrs. studied per week
4
3
2
1
0 2 4 6 8
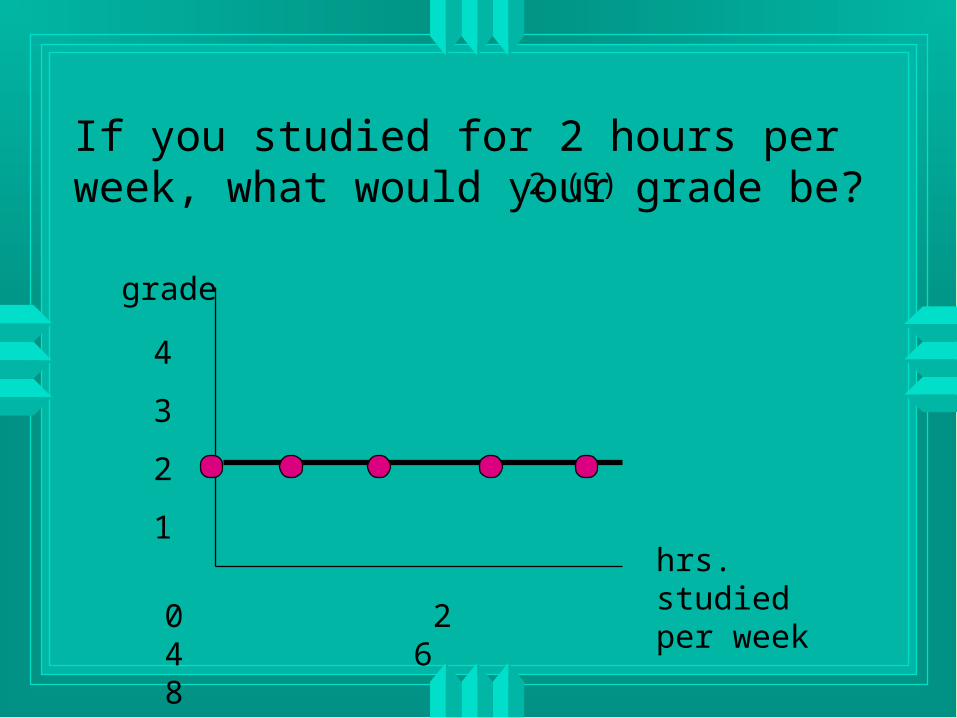
If you studied for 2 hours per week, what would your grade be?
grade
hrs. studied per week
4
3
2
1
0 2 4 6 8
2 (C)

If you studied for 8 hours per week, what would your grade be?
grade
hrs. studied per week
4
3
2
1
0 2 4 6 8
2 (C)

If you studied for zero hours per week, what would your grade be?
grade
hrs. studied per week
4
3
2
1
0 2 4 6 8
2 (C)

At what number does the line intersect the vertical axis?
grade
hrs. studied per week
4
3
2
1
0 2 4 6 8
2

What is the Y-intercept?
grade
hrs. studied per week
4
3
2
1
0 2 4 6 8
2

grade
hrs. studied per week
4
3
2
1
0 2 4 6 8
study time grade 8 2 6 2 4 2 2 2 0 2
Filling in the other points we have this table:

study time grade 8 2
6 2 4 2 2 2 0 2
You used to study 2 hours per week. You decide to study an additional 2 hours per week. By how much does your grade increase?
0You used to study six hours per week. You decide to study an additional 2 hours per week. By how much does your grade increase?
0
What is the change in the Y variable (grade) divided by the change in the X variable (study time)?
0/2 = 0What is the slope of the relation?
0
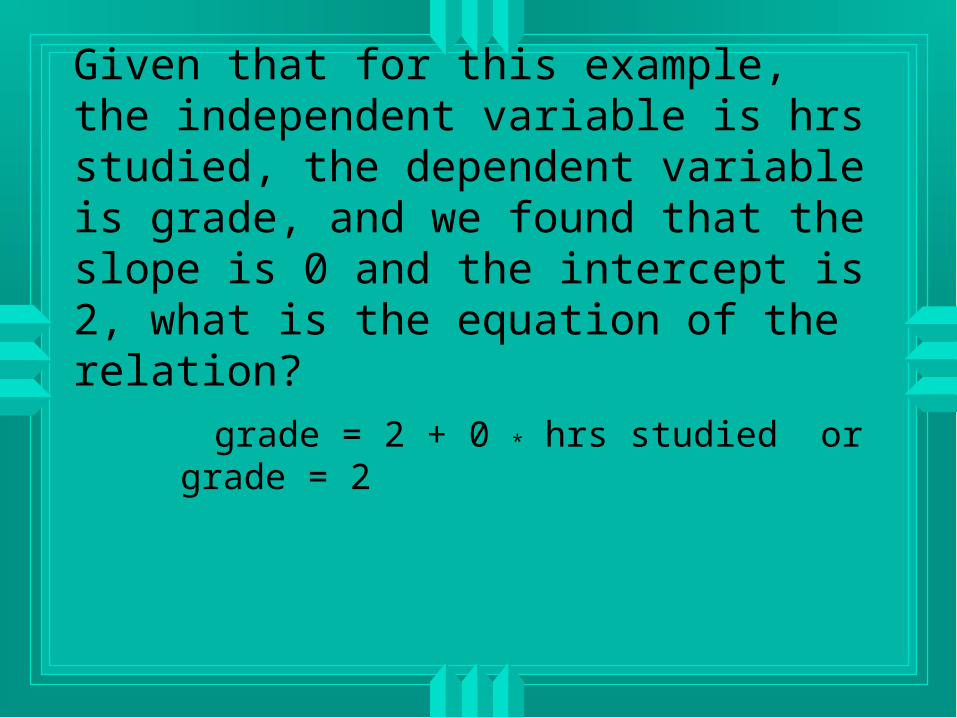
grade = 2 + 0 * hrs studied or grade = 2
Given that for this example, the independent variable is hrs studied, the dependent variable is grade, and we found that the slope is 0 and the intercept is 2, what is the equation of the relation?
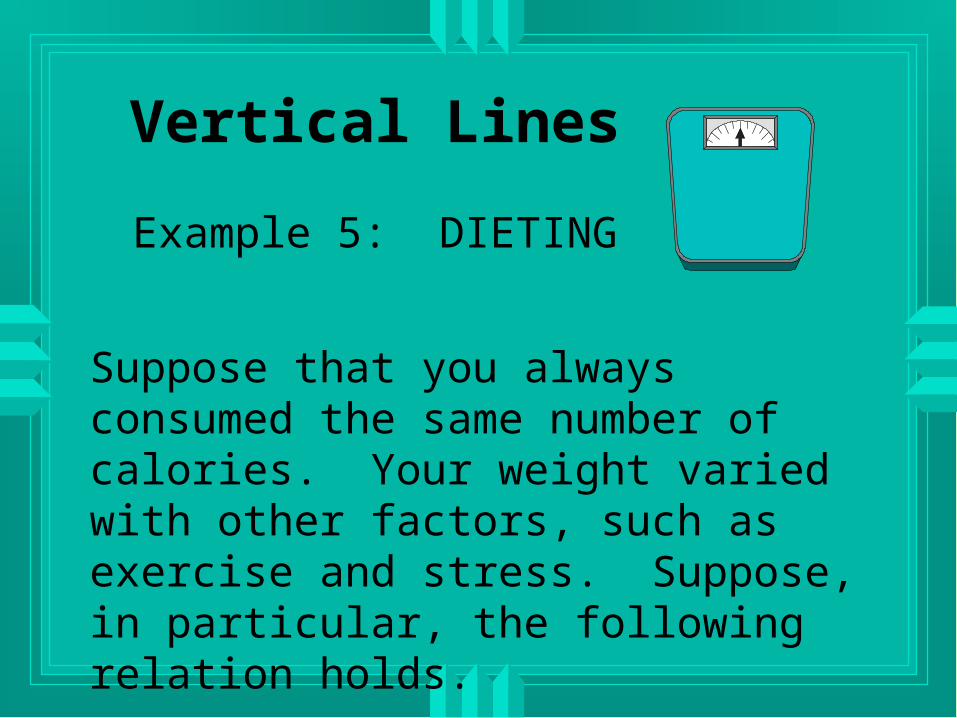
Vertical Lines
Example 5: DIETING
Suppose that you always consumed the same number of calories. Your weight varied with other factors, such as exercise and stress. Suppose, in particular, the following relation holds.

calories weight
1100 140
1100 150
1100 160
1100 170
1100 180

weight
180
170
160
150
140
40
0 1000 1100 1200 1300 1400 calories
calories weight 1100 140 1100 150 1100 160 1100 170 1100 180

Even though we don't change calories (the X variable), weight (the Y variable) does change.
The slope, which is Y/ X, is a non-zero number divided by zero.
Thus, the slope is infinity or undefined.The slope of a vertical line is infinity or
undefined.There is no Y-intercept.
wgt
1100 calories

Instead it is written as: X = X0 , where X0 is the constant value of the independent variable.
For our example, the equation is calories = 1100 .
Since for a vertical line, the slope is undefined and there is either no intercept or an infinite number of intercepts, the equation of a vertical line is not written in the slope-intercept form.

Example 6: STUDYING
Consider the following graph of the relation between study time and grade.

grade
hrs. studied per week
4
3
2
1
0 2 4 6 8
6
How many hours did you study to get a grade
of 2 (C)?

grade
hrs. studied per week
4
3
2
1
0 2 4 6 8
6
How many hours did you study to get a grade
of 3 (B)?

grade
hrs. studied per week
4
3
2
1
0 2 4 6 8
6
How many hours did you study to get a grade
of 4 (A)?

grade
hrs. studied per week
4
3
2
1
0 2 4 6 8
study time grade 6 4 6 3 6 2 6 1 6 0
Filling in the other points, we have this table:

You always studied the same amount. Your grade varied with other factors, such as the amount of sleep you had and your diet.

study time grade 6 4 6 3 6 2 6 1 6 0
1/0 = undefined or infinity
What is the slope of the relation?
undefined or infinity
What is the change in the Y variable (grade) divided by the change in the X variable (study time)?

hrs studied = 6 .
What is the equation of our relation in which the value of the independent variable, hours studied, is always 6?

Downward Sloping LinesExample 7: RUNNING
Suppose that the more rested you are, the faster you can run.
So the more hours you sleep, the fewer minutes it takes you to run a mile.
Suppose the relation between hours slept per day and the number of minutes it takes you to run a mile is as follows.

hours slept minutes per mile
6 8
7 7
8 6
9 5
10 4

min./mile
hrs. slept/day 0 1 2 3 4 5 6 7 8 9 10
8 7 6 5 4
hrs min/mi 6 8 7 7 8 6 9 510 4

What is the slope of the relation?
slope = Y/ X
= min/ hrs
= -1/+1 = -1
A positive change denotes an increase. A negative change denotes a decrease.
hrs min/mi 6 8 7 7 8 6 9 510 4
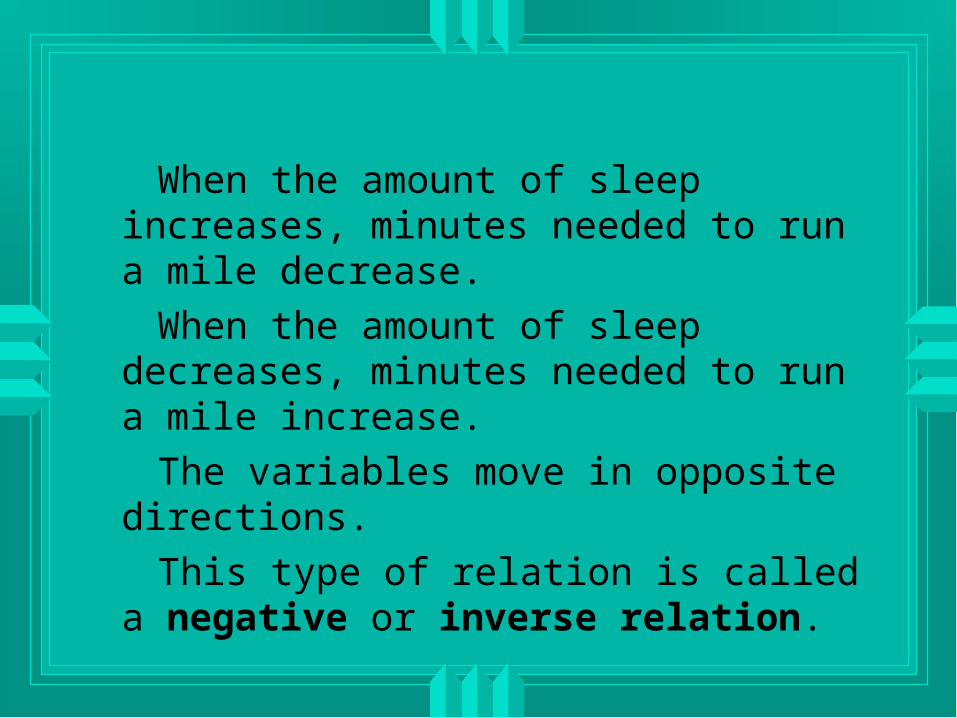
When the amount of sleep increases, minutes needed to run a mile decrease.
When the amount of sleep decreases, minutes needed to run a mile increase.
The variables move in opposite directions.
This type of relation is called a negative or inverse relation.

Y
X
Negative or inverse relations are downward sloping from left to right. Downward sloping lines have a negative slope.
Positive or direct relations are upward sloping from left to right.
Upward sloping lines have a positive slope.
Y
X
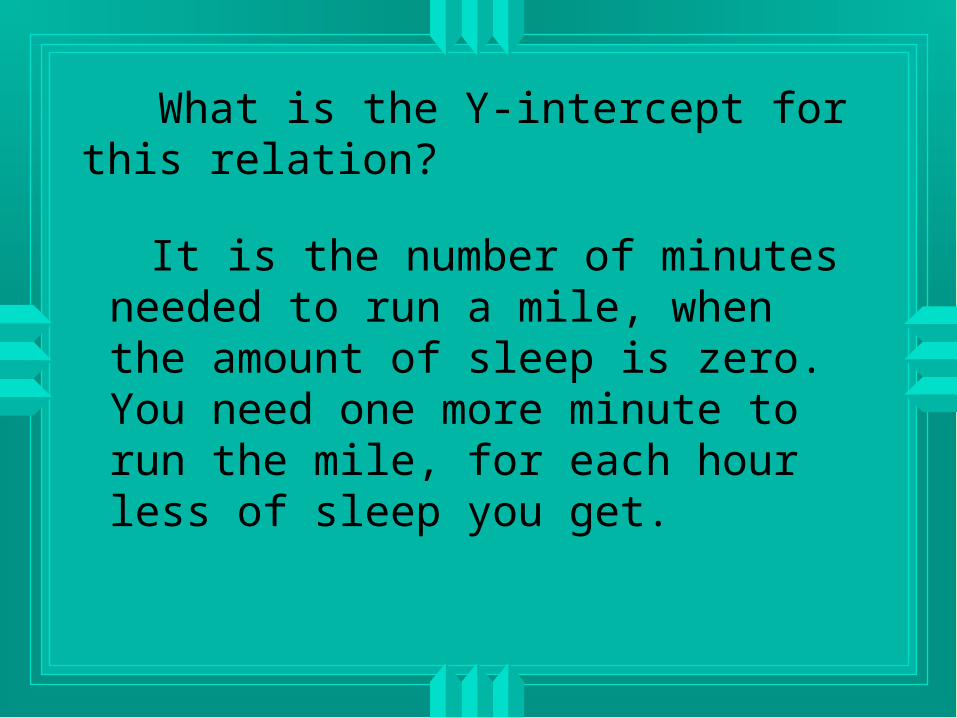
What is the Y-intercept for this relation?
It is the number of minutes needed to run a mile, when the amount of sleep is zero. You need one more minute to run the mile, for each hour less of sleep you get.

hours slept min/mile
6 8
5 9
4 10
3 11
2 12
1 13
0 14
We know it takes 8 minutes to run a mile when you have had 6 hours of sleep. We can work down from there.
So when the number of hours slept is zero, you need 14 minutes to run the mile.
The number 14 is the Y-intercept.
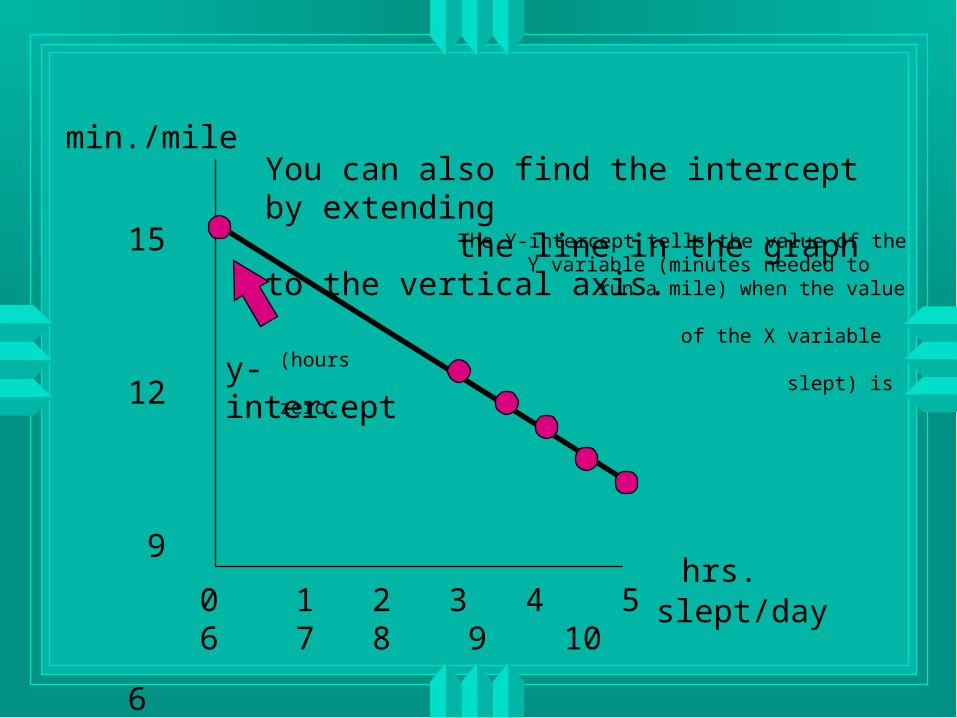
min./mile
hrs. slept/day 0 1 2 3 4 5 6 7 8 9 10
15 12 9 6 3
y-intercept
The Y-intercept tells the value of the Y variable (minutes needed to run a mile) when the value of the X variable (hours slept) is zero.
You can also find the intercept by extending the line in the graph to the vertical axis.

min per mile = 14 + (-1) * hrs slept or min per mile = 14 - 1 * hrs slept
Remember that multiplication and division take precedence over addition and subtraction. So you multiply first and then subtract. So the right side of this equation is not 13 * hrs slept .
Given that for this example, the independent variable is hrs slept, the dependent variable is minutes per mile, and we found that the slope is -1 and the intercept is 14, what is the equation of the relation?

Example 8: MEDICINE
Suppose that you're taking medication for a virus that you've contracted. The medication has the effect on the number of heartbeats per minute as indicated in the following graph.

beats/min.
medicine (mg.) 0 100 200 300 400 500
75 70 65 60 55 50
med. beats/min 0 75
100 70
200 65
300 60
400 55
500 50

beats/min.
medicine (mg.) 0 100 200 300 400 500
75 70 65 60 55 50
75 At what number does the line intersect
the vertical axis? 75 What is the Y-intercept? 75
If you took no medication, what would your heart rate be?

- 5 (decreases by 5 beats/min.)
If you increase your medication from 400 to 500 milligrams, by how much does your heart rate change?
- 5
What is the change in the Y variable (beats/min) divided by the change in the X variable (medication)?
- 5/100 or - .05
What is the slope of the relation?
- .05
med. beats/min 0 75
100 70
200 65
300 60
400 55
500 50
If you increase your medication from 200 to 300 milligrams, by how much does your heart rate change?

The slope is negative, because the variables are inversely related.
When the amount of medication increases, the heart rate decreases.
When the amount of medication decreases, the heart rate increases.
med. beats/min 0 75
100 70
200 65
300 60
400 55
500 50

The negative slope is evident in the graph by the fact that the line slopes downward toward the right.
beats
mg.
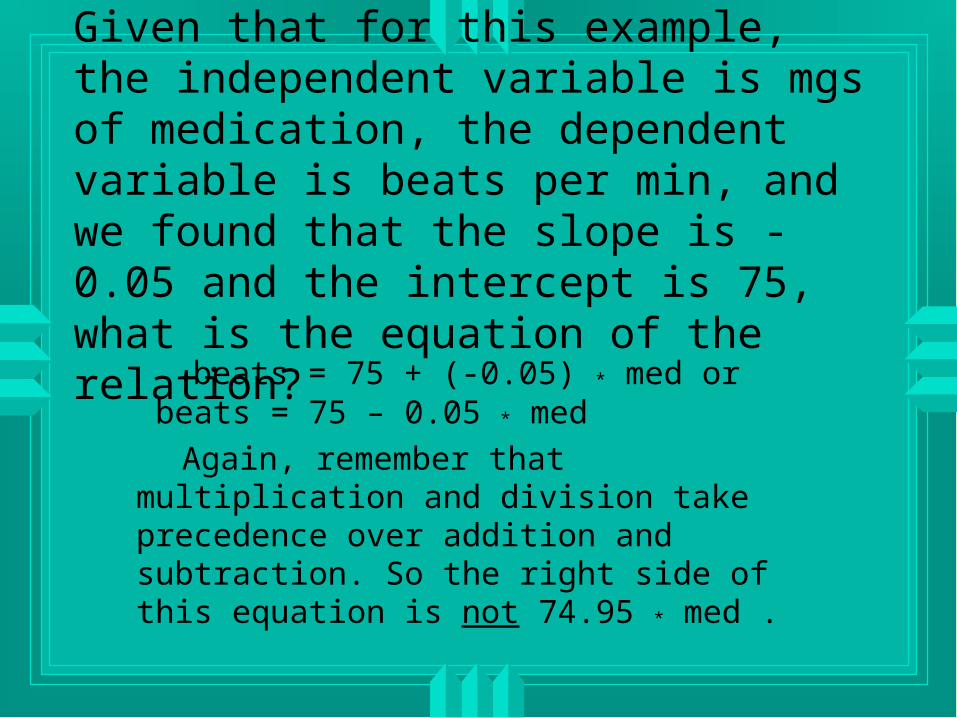
beats = 75 + (-0.05) * med or beats = 75 – 0.05 * med
Again, remember that multiplication and division take precedence over addition and subtraction. So the right side of this equation is not 74.95 * med .
Given that for this example, the independent variable is mgs of medication, the dependent variable is beats per min, and we found that the slope is -0.05 and the intercept is 75, what is the equation of the relation?

We will next considerNonlinear Relations
We will not be putting these relations in the form Y = mX + b.
That equation only applies to straight lines. For curves, the slope is not constant; instead it changes from point to point.
Example 9: DIETING - It keeps getting tougher.
- The heavy person's perspective
Consider your weight and the number of calories you consume per day. Suppose that you're trying to lose weight.
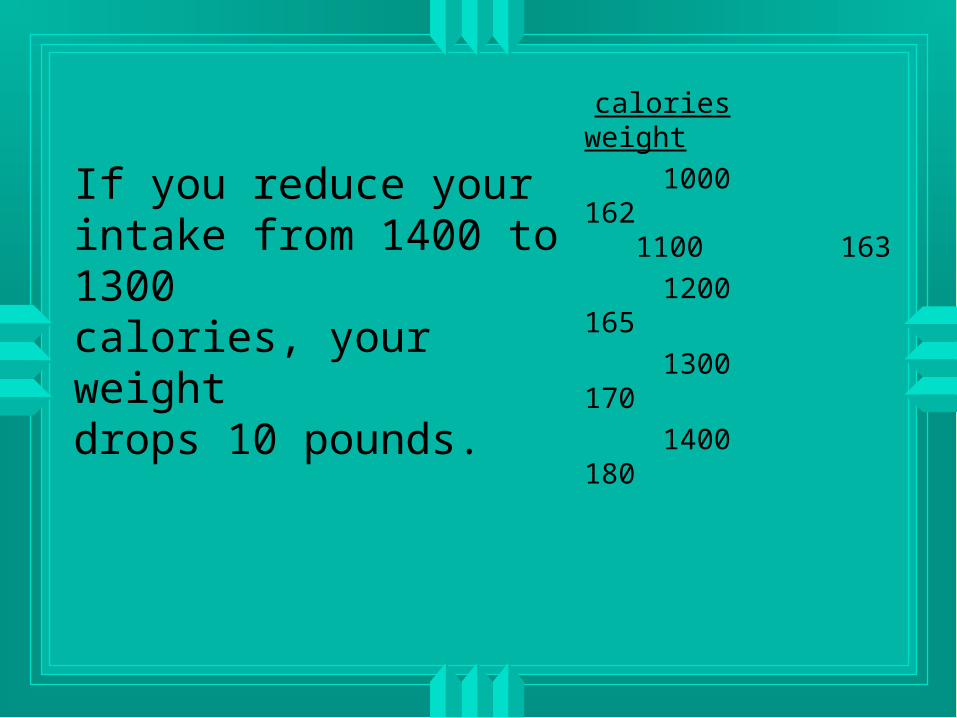
calories weight
1000 162
1100 163
1200 165
1300 170
1400 180
If you reduce your intake from 1400 to 1300 calories, your weight drops 10 pounds.

calories weight
1000 162
1100 163
1200 165
1300 170
1400 180
When you reduce your intake from 1300 to 1200 calories, your weight only drops 5 pounds.

calories weight
1000 162
1100 163
1200 165
1300 170
1400 180
When your reduce your intake from 1200 to 1100 calories, your weight drops just 2 pounds.
weight
180
175
170
165
160
1000 1100 1200 1300 1400 calories

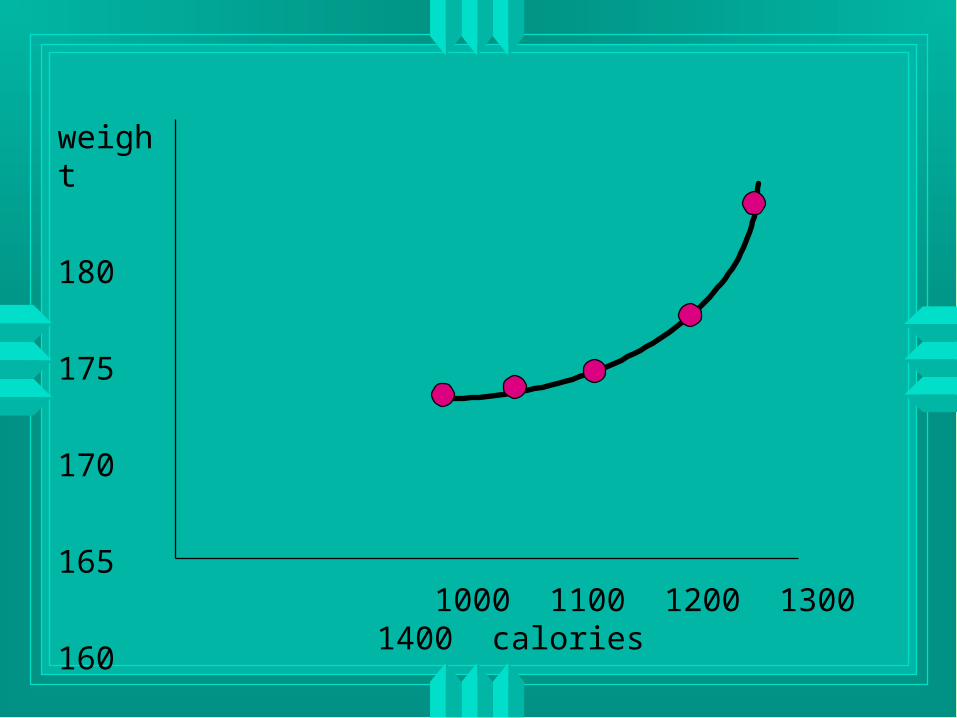
We now do not have a straight line (linear) relationship. Instead the relation is curved.
This reflects a changing slope.
Recall, the slope is the change in the Y-variable (wgt) divided by the change in the X-variable (calories).

calories wgt wgt 1000 162 1 1100 163 2 1200 165 5 1300 170 10 1400 180

calories wgt wgt slope=wgtcal 1000 162 1 .01 1100 163 2 .02 1200 165 5 .05 1300 170 10 .10 1400 180

calories wgt wgt slope=wgtcal 1000 162 1 .01 1100 163 2 .02 1200 165 5 .05 1300 170 10 .10 1400 180
As calories increase, the slope increases; the curve gets steeper.

This curve is upward sloping and convex from below.
Since we don't know exactly what the relationship looks like as we get near zero calories, we can't determine precisely what the Y-intercept would be.
calories
wgt

Example 10: DIETING - It keeps getting tougher. - The thin person's perspective
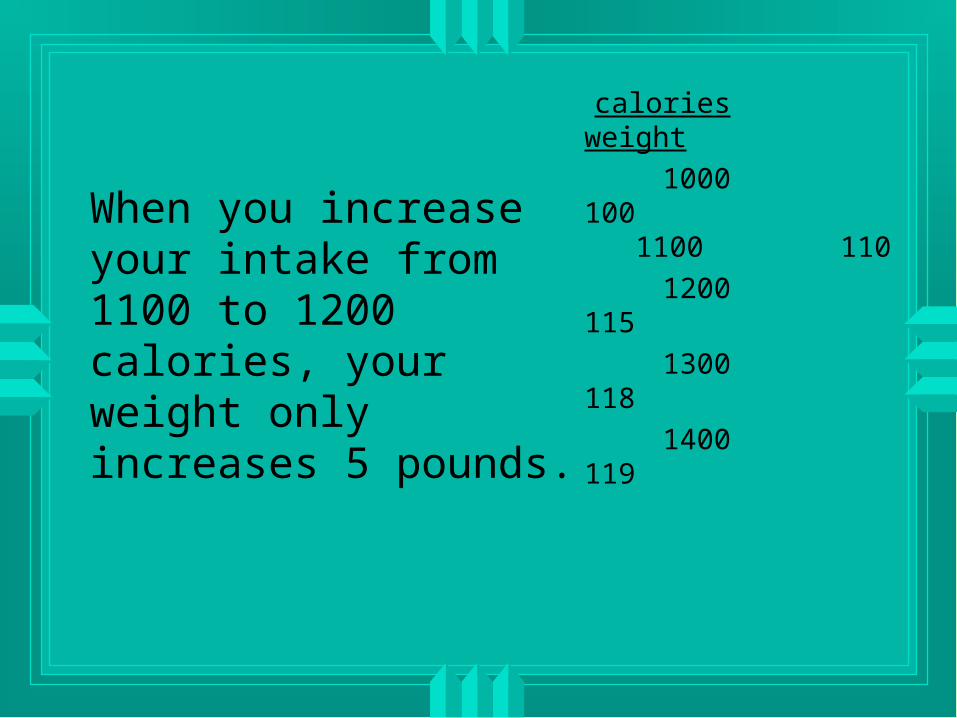
Consider your weight and the number of calories you consume per day. Suppose that you're trying to gain weight.

calories weight
1000 100
1100 110
1200 115
1300 118
1400 119
If you increase your intake from 1000 to 1100 calories, your weight increases 10 pounds.
calories weight
1000 100
1100 110
1200 115
1300 118
1400 119
When you increase your intake from 1100 to 1200 calories, your weight only increases 5 pounds.

calories weight
1000 100
1100 110
1200 115
1300 118
1400 119
When your increase your intake from 1200 to 1300 calories, your weight increases just 3 pounds.
weight
120
115
110
105
100
1000 1100 1200 1300 1400 calories

calories weight wgt 1000 100 10 1100 110 5 1200 115 3 1300 118 1 1400 119

calories weight wgt slope=wgt/cal 1000 100 10 .10 1100 110 5 .05 1200 115 3 .03 1300 118 1 .01 1400 119

calories weight wgt slope=wgt/cal 1000 100 10 .10 1100 110 5 .05 1200 115 3 .03 1300 118 1 .01 1400 119
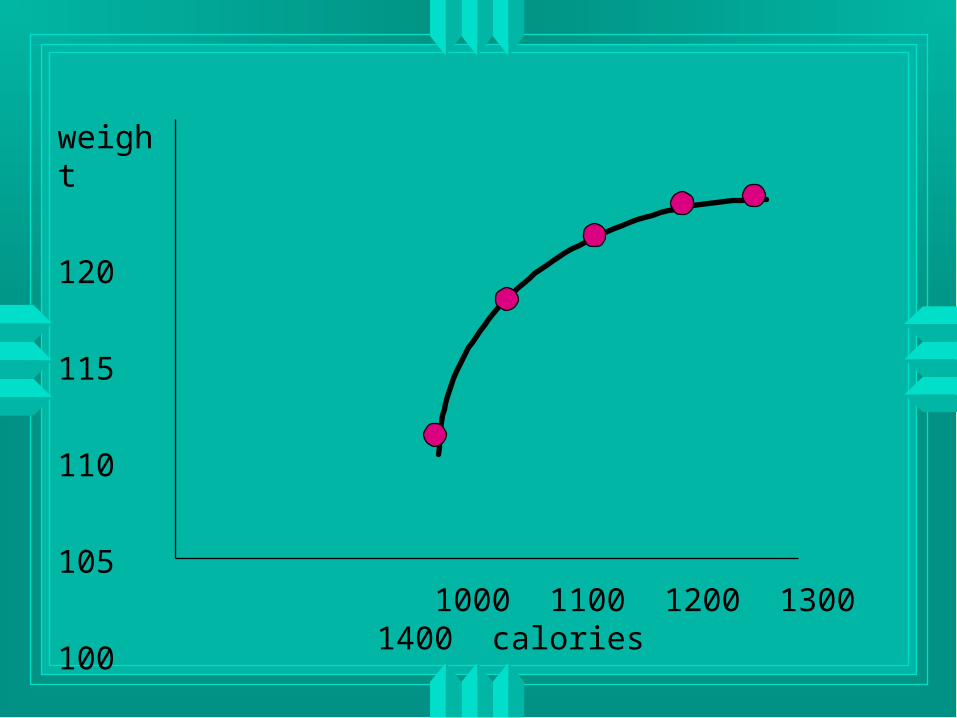
As calories increase, the slope decreases; the curve gets flatter.
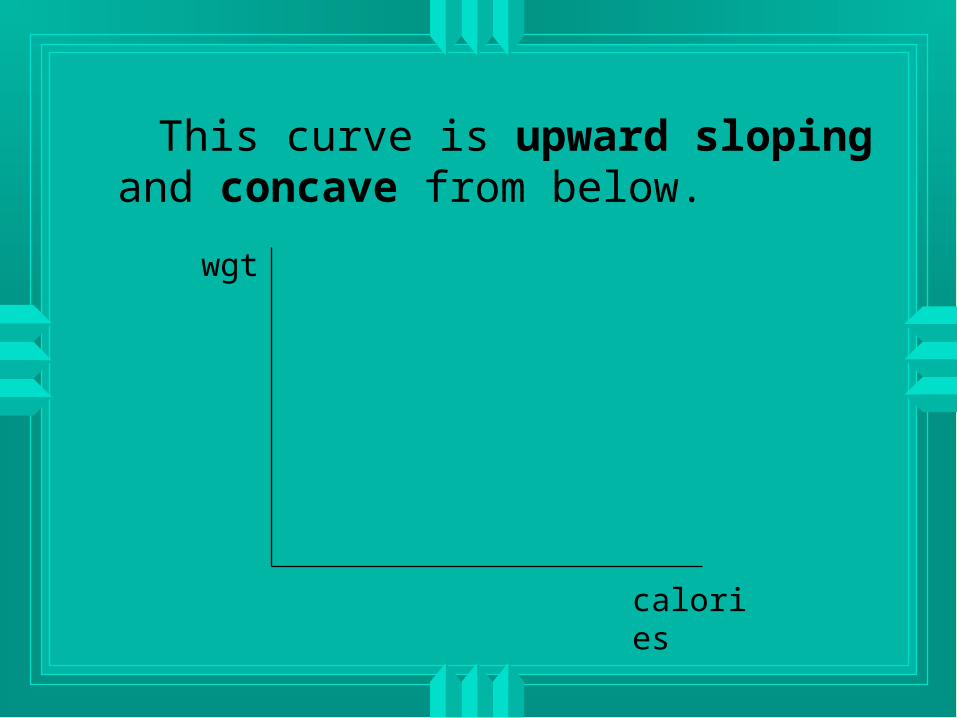
This curve is upward sloping and concave from below.
wgt
calories
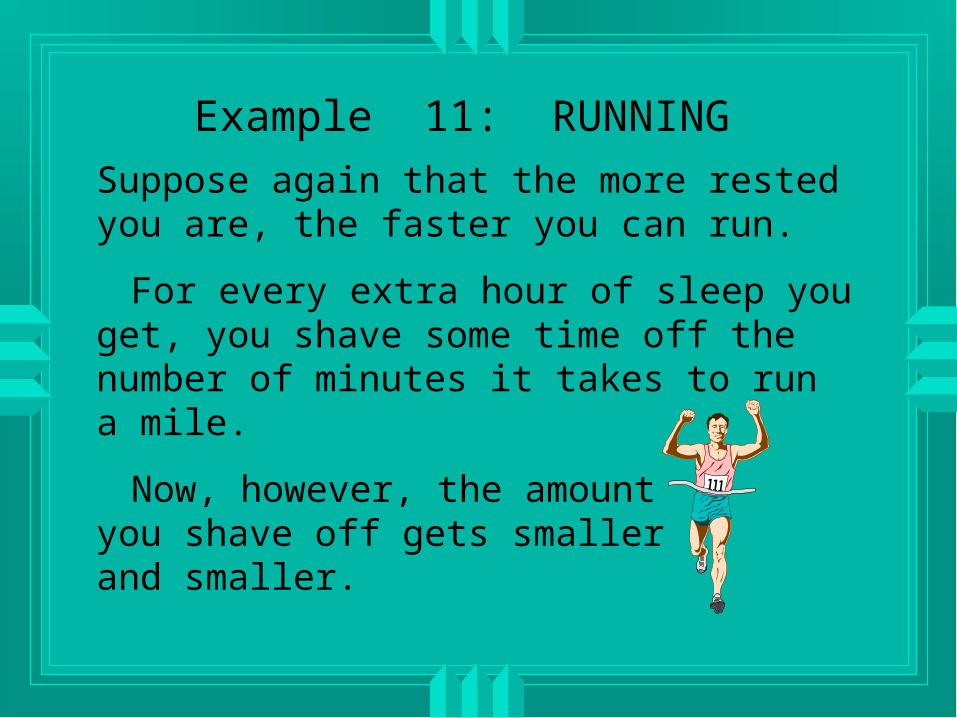
Example 11: RUNNING
Suppose again that the more rested you are, the faster you can run.
For every extra hour of sleep you get, you shave some time off the number of minutes it takes to run a mile.
Now, however, the amount you shave off gets smaller and smaller.

hours slept minutes per mile
6 8.0
7 7.0
8 6.4
9 6.1
10 6.0

min./mile
hrs. slept/day 0 1 2 3 4 5 6 7 8 9 10
8.0 7.8 7.6 7.4 7.2 7.0 6.8 6.6 6.4 6.2 6.0
hrs min/mi 6 8.0 7 7.0 8 6.4 9 6.110 6.0

hrs. slept min. min. 6 8.0 -1.0 7 7.0 - .6 8 6.4 - .3 9 6.1 - .1 10 6.0
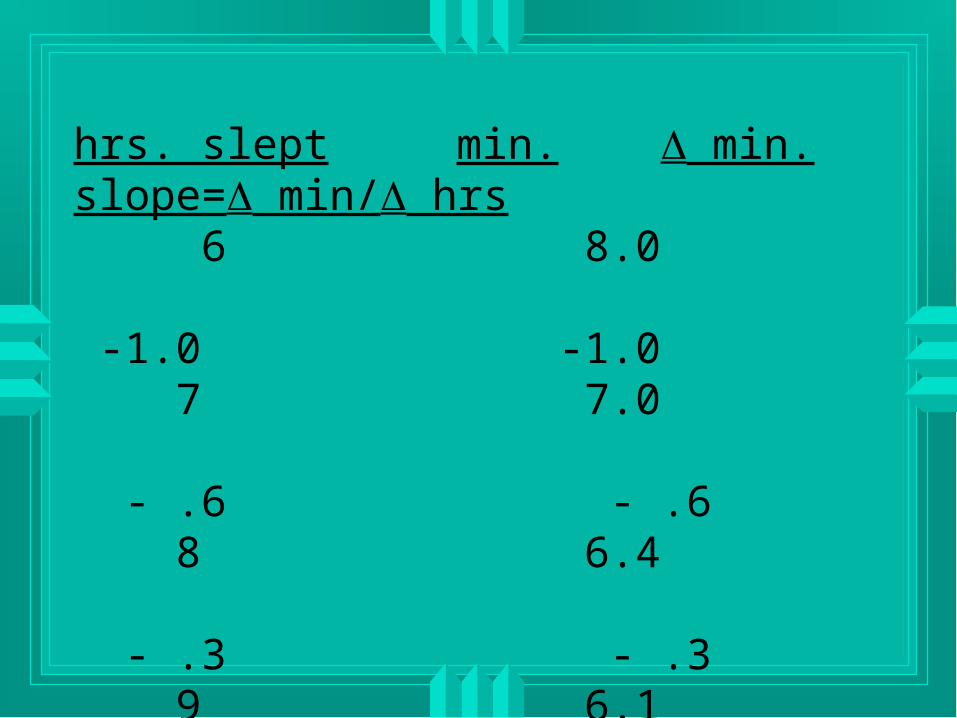
hrs. slept min. min. slope= min/ hrs 6 8.0 -1.0 -1.0 7 7.0 - .6 - .6 8 6.4 - .3 - .3 9 6.1 - .1 - .1 10 6.0

hrs. slept min. slope 6 8.0 -1.0 7 7.0 - .6 8 6.4 - .3 9 6.1 - .1 10 6.0
As sleep increases, the absolute value of the slope decreases; the curve gets flatter.

This curve is downward sloping and convex from below.
min. per mile
hrs. slept per day

Example 12: MEDICINE
Suppose that you're taking medication for a virus that you've contracted. The medication has the effect on the number of heartbeats per minute as indicated in the following graph.

beats/min.
medicine (mg.) 0 100 200 300 400 500
75 74 72 69 64 56
med. beats/min 0 75
100 74
200 72
300 69
400 64
500 56

med. beats beats 0 75 -1 100 74 -2 200 72 - 3 300 69 - 5 400 64 -8 500 56

med. beats beats slope = beats/ med. 0 75 -1 -.01 100 74 -2 - .02 200 72 - 3 - .03 300 69 - 5 - .05 400 64 -8 - .08 500 56

med. beats slope 0 75 -.01 100 74 - .02 200 72 - .03 300 69 - .05 400 64 - .08 500 56
As medication increases the absolute value of the slope rises; the curve gets steeper.
This pattern indicates that the effects of the medicine increase as you take more of it.

This curve is downward sloping and concave from below.
beats/min.
medicine (mg.)

Concave
Picture the opening of a cave. If a curve looks like this or part of this, it is concave (from below).

Convex
If a curve looks like the letter U or part of a U, it is convex (from below).