
GRANTHAM FLOODS COMMISSION OF...
37
Job Number WS0854.1501.001 Doc Number WS150262 Revision 0 Date 11 August 2015 Report to GRANTHAM FLOODS COMMISSION OF INQUIRY on EXPERT HYDROLOGY REPORT 10 JANUARY 2011 FLOOD CIRCUMSTANCES AND CONTRIBUTING FACTORS
Transcript of GRANTHAM FLOODS COMMISSION OF...

Job Number WS0854.1501.001 Doc Number WS150262 Revision 0 Date 11 August 2015
Report to
GRANTHAM FLOODS COMMISSION OF INQUIRY
on
EXPERT HYDROLOGY REPORT 10 JANUARY 2011 FLOOD
CIRCUMSTANCES AND CONTRIBUTING FACTORS

The image cannot be displayed. Your computer may not have enough memory to open the image, or the image may have been corrupted. Restart your computer, and then open the file again. If the red x still appears, you may have to delete the image and then insert it again.
THIS PAGE INTENTIONALLY LEFT BLANK
The image cannot be displayed. Your computer may not have enough memory to open the image, or the image may have been corrupted. Restart your computer, and then open the file again. If the red x still appears, you may have to delete the image and then insert it again.
Grantham Floods Commission of Inquiry Expert Hydrology Report 10 January 2011 Flood Circumstances and Contributing Factors
Prepared for:
Grantham Floods Commission of Inquiry
PO Box 15185 City East, QLD 4002
Phone: 07 3003 9451 eMail: [email protected]
Prepared by:
Water Solutions Pty Ltd
PO Box 1031 Kenmore QLD 4069 Australia
Phone: 07 3378 7955 Fax: 07 3378 7966
Email: [email protected]
The sole purpose of this report and the associated services performed by Water Solutions Pty Ltd (WS) is to provide the information required in accordance with the scope of services set out in the contract between WS and the Client. That scope of services was defined by the request of the Client, by the time and budgetary constraints imposed by the Client, and by the availability of data and other relevant information. A person using Water Solution Pty Ltd documents or data accepts the risk of:
a. Using the documents or data in electronic form without requesting and checking them for accuracy against the original hard copy version.
b. Using the documents or data for any purpose not agreed to in writing by Water Solutions Pty Ltd.

The image cannot be displayed. Your computer may not have enough memory to open the image, or the image may have been corrupted. Restart your computer, and then open the file again. If the red x still appears, you may have to delete the image and then insert it again.
THIS PAGE INTENTIONALLY LEFT BLANK

GRANTHAM FLOODS COMMISSION OF INQUIRY EXPERT HYDROLOGY REPORT 10 JANUARY 2011 FLOOD CIRCUMSTANCES AND CONTRIBUTING FACTORS
Document No. WS150262 Water Solutions Pty Ltd Revision Rev 0 Page 5 of 301
TABLE OF CONTENTS
1! SUMMARY OF CONCLUSIONS ....................................................................................... 19!Description of the Grantham Flood ............................................................... 20!Grantham Quarry .......................................................................................... 22!Helidon, Flagstone and Ma Ma Creeks Gauging Station Flood Flow Hydrographs ................................................................................................. 23!Flooding Sensitivity Scenarios ...................................................................... 24!Outcomes of Sensitivity Analyses ................................................................. 28!Conclusions Regarding the Grantham Quarry .............................................. 30!Grantham Railway Embankment .................................................................. 31!Debris and Sediment Loads ......................................................................... 33!Upstream Overbank Storage of Floodwater ................................................. 33!Evacuation .................................................................................................... 35!
2! INTRODUCTION ........................................................................................................... 38!
3! QUALIFICATIONS AND EXPERIENCE .............................................................................. 38!
4! CONFLICTS OF INTEREST ............................................................................................. 38!
5! STRUCTURE OF THE REPORT ....................................................................................... 39!
6! KEY INFORMATION ...................................................................................................... 40!6.1! Overview ....................................................................................................... 40!6.2! Eye-witness Accounts and Statements ........................................................ 40!
Key Characteristics ....................................................................................... 41!Survey Data .................................................................................................. 42!
6.3! Inspection of the Grantham Quarry, Grantham and Surrounds .................... 43!6.4! DNRM Stream Gauging Stations .................................................................. 44!6.5! Computer Models and Associated Data ....................................................... 45!
General ......................................................................................................... 45!Lockyer Valley Flood Models ........................................................................ 46!
6.6! Investigations by Geotechnical Experts ........................................................ 48!
7! THE 10TH JANUARY 2011 FLOOD EVENT ....................................................................... 49!7.1! Rainfall and Flood Flows .............................................................................. 49!7.2! Changes to the Waterway ............................................................................ 52!7.3! Changes to the Quarry ................................................................................. 53!
8! PREPARATION OF THE GFCOI FLOOD MODEL .............................................................. 55!8.1! Overview ....................................................................................................... 55!8.2! Suitability of the LVRC Models ..................................................................... 55!8.3! Adaption of the LVRC Models ...................................................................... 55!
GRANTHAM FLOODS COMMISSION OF INQUIRY EXPERT HYDROLOGY REPORT 10 JANUARY 2011 FLOOD CIRCUMSTANCES AND CONTRIBUTING FACTORS
Document No. WS150262 Water Solutions Pty Ltd Revision 0 Page 6 of 301
8.4! Changes to the LVRC Model ........................................................................ 57!8.5! Helidon Gauging Station 2011 Flow Hydrograph ......................................... 57!
Overview ....................................................................................................... 57!DNRM Estimate ............................................................................................ 58!LVRC Models Estimate ................................................................................. 61!Revision of Rating Curve for Helidon Gauging Station ................................. 61!Revised Flow Hydrograph ............................................................................ 63!
8.6! Flagstone and Ma Ma Creek Flow Hydrographs .......................................... 63!8.7! Downstream Stage-Discharge Relationship ................................................. 65!8.8! Modelling of the Grantham Quarry Breaches ............................................... 65!
General ......................................................................................................... 65!Modelling the Western Levee Failure ........................................................... 69!
8.9! Quarry Pit Lake Levels ................................................................................. 72!8.10!Carpendale Weir ........................................................................................... 73!8.11!Sediment and Sand Deposits in Creek ......................................................... 74!8.12!Obstruction to Flow by Debris and Buildings ................................................ 74!8.13!Calibration Adjustment .................................................................................. 75!
9! CHRONOLOGY OF THE 2011 FLOOD EVENT IN GRANTHAM ............................................. 77!9.1! Overview ....................................................................................................... 77!9.2! The Event ..................................................................................................... 79!9.3! Summary Observations ................................................................................ 80!
10! EFFECT OF THE GRANTHAM QUARRY ON FLOODING ...................................................... 90!10.1!General Arrangement ................................................................................... 90!10.2!Overview of Assessment .............................................................................. 92!10.3!Method Parameters ...................................................................................... 92!
General ......................................................................................................... 92!No Quarry Scenario ...................................................................................... 93!Most Likely Scenario ..................................................................................... 93!Worst Case Scenario .................................................................................... 93!Reference Locations ..................................................................................... 94!
10.4!No Quarry Scenario Assessment ................................................................. 95!10.5!Most Likely Scenario Assessment ................................................................ 99!10.6!Worst Case Scenario Assessment ............................................................. 106!10.7!Conclusion .................................................................................................. 116!
11! EFFECT OF THE RAILWAY EMBANKMENT ON FLOODING ................................................ 121!
12! TESTING MODEL PERFORMANCE ............................................................................... 124!12.1!Overview ..................................................................................................... 124!12.2!Helidon Gauge Flow Hydrographs .............................................................. 126!12.3!Quarry Lake Water Levels .......................................................................... 129!

GRANTHAM FLOODS COMMISSION OF INQUIRY EXPERT HYDROLOGY REPORT 10 JANUARY 2011 FLOOD CIRCUMSTANCES AND CONTRIBUTING FACTORS
Document No. WS150262 Water Solutions Pty Ltd Revision 0 Page 7 of 301
12.4!Peak Flood Heights .................................................................................... 132!12.5! Flood Inundation Upstream of the Quarry .................................................. 136!12.6!Hydraulic Model Grid Size .......................................................................... 145!
13! CORROBORATION BY EYE-WITNESS ACCOUNTS .......................................................... 148!13.1!Overview ..................................................................................................... 148!13.2!Arndt, Frances (1 July 2015) ...................................................................... 151!13.3!Marshall, Bruce (000 Transcript and Coroners 2011) ................................. 154!13.4!Sippel, Jonathan (1 July 2015) ................................................................... 155!13.5!Besley, Helen (2 July 2015) ........................................................................ 160!13.6! Lack, Wayne (7 July 2015) ......................................................................... 164!13.7!Richardson, Lance (1 July 2015) ................................................................ 170!13.8!McIntosh, Anthony (1 July 2015) ................................................................ 172!13.9!Outcomes ................................................................................................... 176!
14! FLOOD EVACUATION ................................................................................................. 177!
A! APPENDIX A – REFERENCES ...................................................................................... 183!A.1! Technical References ................................................................................. 183!A.2! Witness Statements – Grantham Floods Commission of Inquiry (GFCOI) . 183!A.3! Additional Material Provided by GFCOI ...................................................... 184!A.4! Submissions Provided to the GFCOI .......................................................... 184!A.5! Witness Statements – Queensland Floods Commission of Inquiry ............ 184!
B! APPENDIX B – TECHNICAL REVIEWS .......................................................................... 186!B.1! OverviewGauging Station ........................................................................... 186!B.2! Helidon Gauging Station Review ................................................................ 186!B.3! Review of LVRC Models Stage-Discharge Relationship ............................ 193!B.4! Revised Flagstone and Ma Ma Creek Inflows ............................................ 196!B.5! Downstream Flow-Height Boundary Condition ........................................... 197!B.6! Western Levee and Main Breach Erosion Definition .................................. 200!B.7! Pre Quarry Surface Topography ................................................................. 201!B.8! Pre Railway Embankment Topography ...................................................... 203!
C! APPENDIX C – EXTRACT OF SELECTED FIGURES (ENLARGED) ..................................... 205!
D! APPENDIX D – CURRICULUM VITAE ............................................................................ 234!
E! APPENDIX E – LETTERS OF INSTRUCTION ................................................................... 239!
GRANTHAM FLOODS COMMISSION OF INQUIRY EXPERT HYDROLOGY REPORT 10 JANUARY 2011 FLOOD CIRCUMSTANCES AND CONTRIBUTING FACTORS
Document No. WS150262 Water Solutions Pty Ltd Revision 0 Page 8 of 301
List of Figures Figure 1.1 – Grantham Environs Locality Map ........................................................................................... 20!
Figure 1.2 – Grantham Township Locality Map .......................................................................................... 20!
Figure 1.3 (a) – Simplified Flooding Locality, Sandy Creek Inundation ..................................................... 21!
Figure 1.3 (b) – Simplified Flooding Locality, South-Western Overbank Inundation .................................. 21!
Figure 1.3 (c) – Simplified Flooding Locality, Western Overbank Inundation ............................................ 22!
Figure 1.4 – Grantham Quarry 2010 .......................................................................................................... 22!
Figure 1.5 – Schematic Cross-section Through Western Levee (Starr, 2015) ........................................... 23!
Figure 1.6 – Revised Flow Hydrographs at DNRM Gauging Stations ........................................................ 24!
Figure 1.7 – Quarry Area in 1982 Overlaid with Flood Path ....................................................................... 25!
Figure 1.8 – Quarry Failure Trigger Level Locations .................................................................................. 26!
Figure 1.9 – Flow Depth and Intensity Locations ....................................................................................... 28!
Figure 1.10 – Grantham Railway Embankment Locality ............................................................................ 32!
Figure 1.11 – Locality Map, Sippel 2015 LS-4 ........................................................................................... 34!
Figure 1.12 – Evacuation Routes, Grantham ............................................................................................. 35!
Figure 6.1 – Track of Field Inspection at Quarry ........................................................................................ 43!
Figure 6.2 – LVRC Flood Model Extent ...................................................................................................... 47!
Figure 7.1 – BOM Rainfall Radar Imagery ................................................................................................. 49!
Figure 7.2 – Annual Series Frequency Analysis: Lockyer Creek at Helidon, Jacobs (2014) ..................... 51!
Figure 7.3 (a) – Helidon Gauge – August 2010 Aerial Photography (Station at Red Circle) ..................... 52!
Figure 7.3 (b) – Helidon Gauge – January 2010 Aerial Photography (Station at Red Circle) .................... 52!
Figure 7.4 – Oblique Showing Post-flood Quarry ....................................................................................... 53!
Figure 7.5 – Pre and Post Flood Erosion of Western Levee of Quarry ...................................................... 54!
Figure 8.1 – Extent of GFCOI Hydraulic Modelling Area ............................................................................ 56!
Figure 8.2 – Helidon (143203C) Stage Hydrograph 10 January 2011 ....................................................... 59!
Figure 8.3 – Helidon (143203C) DNRM Rating Curve ............................................................................... 59!
Figure 8.4 – Helidon (143203C) DNRM Rating Curve – Re-plotted Linear Scale ..................................... 60!
Figure 8.5 – Helidon (143203C) Flood Flow Hydrograph Estimates .......................................................... 61!
Figure 8.6 – Helidon (143203C) Revised Rating Curve ............................................................................. 62!
Figure 8.7 –Revised Flood Flow Hydrographs at Helidon, Flagstone and Ma Ma Creeks ........................ 63!
Figure 8.8 – Flagstone Creek Revised Flood Flow Hydrograph ................................................................ 64!
Figure 8.9 – Ma Ma Creek Revised Flood Flow Hydrograph ..................................................................... 64!
Figure 8.10 – Downstream Boundary Stage-Discharge Relationship ........................................................ 65!
GRANTHAM FLOODS COMMISSION OF INQUIRY EXPERT HYDROLOGY REPORT 10 JANUARY 2011 FLOOD CIRCUMSTANCES AND CONTRIBUTING FACTORS
Document No. WS150262 Water Solutions Pty Ltd Revision 0 Page 9 of 301
Figure 8.11 – Schematic Cross-section Through Western Quarry Levee (Starr, 2015) ! ........................... 65!
Figure 8.12 – Oblique Showing Pre-flood Quarry as at August 2010 ........................................................ 66!
Figure 8.13 – Oblique Showing Post-flood Quarry as at January 2011 ..................................................... 67!
Figure 8.14 – Inside Western Levee Looking North as at 12 February 2011 (McIntosh 2015) .................. 68!
Figure 8.15 – Alignment of Pre Flood Quarry Bunds and Location of Main Breach .................................. 70!
Figure 8.16 – Alignment of Post Flood Quarry Bunds and Location of Main Breach ................................. 70!
Figure 8.17 – Western Bund Profiles for Pre and Post Flood Conditions .................................................. 71!
Figure 8.18 – Eastern Bund Profiles for Pre and Post Flood Conditions ................................................... 71!
Figure 8.19 – Locality of Carpendale Weir ................................................................................................. 73!
Figure 9.1 a to d – Chronology of Inundation, Quarry and Upstream 2:45pm to 3:20pmTable ................. 81!
Figure 9.1 e to h – Chronology of Inundation, Quarry and Upstream 3:25pm to 3:40pm .......................... 82!
Figure 9.1 i to l – Chronology of Inundation, Quarry and Upstream 3:45pm to 4:20pm ............................. 83!
Figure 9.2 a to d – Chronology of Inundation, Western Grantham 3:25pm to 3:40pm .............................. 84!
Figure 9.2 e to h – Chronology of Inundation, Western Grantham 4:05pm to 4:20pm .............................. 85!
Figure 9.2 i to l – Chronology of Inundation, Western Grantham 4:25pm to 5:00pm ................................. 86!
Figure 9.3 a to d – Chronology of Inundation, Central Grantham 3:25pm to 3:40pm ................................ 87!
Figure 9.3 e to h – Chronology of Inundation, Central Grantham 4:05pm to 4:20pm ................................ 88!
Figure 9.3 i to l – Chronology of Inundation, Eastern Grantham 4:25pm to 5:00pm .................................. 89!
Figure 10.1 – Quarry Area in 1982 Overlaid with Flood Path ..................................................................... 90!
Figure 10.2 – Oblique Showing Pre-flood Quarry ...................................................................................... 91!
Figure 10.3 – Oblique Showing Post-flood Quarry ..................................................................................... 91!
Figure 10.4 – Downstream Reporting Locations ........................................................................................ 94!
Figure 10.5 – Flow Depth and Intensity Hydrograph Locations ................................................................. 95!
Figure 10.6 – Surface Topography at the Grantham Quarry Site .............................................................. 96!
Figure 10.7 – No Quarry Reference Downstream Flow Location ............................................................... 97!
Figure 10.7 (continued) – No Quarry Reference Downstream Flow Location ........................................... 98!
Figure 10.8 – No Quarry Reference Flow Depth and Intensity Location .................................................... 98!
Figure 10.8 (continued) – No Quarry Reference Flow Depth and Intensity Location ................................. 99!
Figure 10.9 – Quarry Failure Trigger Level Locations .............................................................................. 100!
Figure 10.10 – Effect of Most Likely Quarry Levee Failure on Downstream Flow ................................... 102!
Figure 10.11 – Effect of Most Likely Quarry Levee Failure on Flow Depth and Intensity ........................ 103!
Figure 10.12 – Pre and Post Flood Volume Comparisons (Starr 2015) ................................................... 105!
Figure 10.13 – Quarry Failure Trigger Level Locations ............................................................................ 107!

GRANTHAM FLOODS COMMISSION OF INQUIRY EXPERT HYDROLOGY REPORT 10 JANUARY 2011 FLOOD CIRCUMSTANCES AND CONTRIBUTING FACTORS
Document No. WS150262 Water Solutions Pty Ltd Revision 0 Page 10 of 301
Figure 10.14 – Worst Case Trigger Levels: Quarry Causeway ................................................................ 107!
Figure 10.15 - Profile Through Eastern Bund with Worst Case Levees Overlaid .................................... 109!
Figure 10.16 – Worst Case Quarry Breach: Selected Flow Hydrographs ................................................ 110!
Figure 10.17 – Effect of Worst Case Quarry Levee Failure on Downstream Flow ................................... 112!
Figure 10.17 (continued) – Effect of Worst Case Quarry Levee Failure on Downstream Flow ............... 113!
Figure 10.18 – Effect of Worst Case Quarry Levee Failure on Flow Depth and Intensity ........................ 114!
Figure 10.18 (continued) – Effect of Worst Case Quarry Levee Failure on Flow Depth and Intensity ..... 115!
Figure 10.19 –Effect of Quarry Levee Failure on Downstream Flow ....................................................... 117!
Figure 10.19 –Effect of Quarry Levee Failure on Downstream Flow ....................................................... 118!
Figure 10.20 – Effect of Quarry Levee Failure on Flow Depth and Intensity ........................................... 118!
Figure 10.20 – Effect of Quarry Levee Failure on Flow Depth and Intensity ........................................... 119!
Figure 11.1 – Grantham Railway Embankment Locality .......................................................................... 121!
Figure 11.2 – Maximum Event Flow Intensity with Railway Embankment ............................................... 122!
Figure 11.3 – Maximum Event Flow Intensity without Railway Embankment .......................................... 122!
Figure 11.4 – Increase in Event Flow Intensity due to Railway Embankment ......................................... 123!
Figure 12.1 – Downstream Reporting Locations ...................................................................................... 125!
Figure 12.2 – Flow Depth and Intensity Locations ................................................................................... 125!
Figure 12.3 – Metrics Locations ............................................................................................................... 126!
Figure 12.4 – Change in Flows Downstream from Quarry: Helidon Hydrographs ................................... 127!
Figure 12.6 – Effect of Initial Lake Level on Flow Downstream from Quarry ........................................... 129!
Figure 12.6 (continued) – Effect of Initial Lake Level on Flow Downstream from Quarry ........................ 130!
Figure 12.7 – Effect of Initial Lake Level on Flow Depth and Intensity .................................................... 131!
Figure 12.8a – GFCOI Model Peak Flood Height Calibration .................................................................. 133!
Figure 12.8b – GFCOI Model Peak Flood Height Calibration .................................................................. 134!
Figure 12.9 – Locality of Western Levee Waterway Cross-section .......................................................... 136!
Figure 12.10 – Western Levee Waterway Cross-section ......................................................................... 137!
Figure 12.11 (a to c) – Flow Inundation Upstream from the Quarry ......................................................... 138!
Figure 12.11 (c to d) – Flow Inundation Upstream from the Quarry ......................................................... 139!
Figure 12.11 (e to f) – Flow Inundation Upstream from the Quarry .......................................................... 140!
Figure 12.12 – Locality Map, Sippel 2015 LS-4 ....................................................................................... 141!
Figure 12.13 (a to b) – Flow Inundation of Oval Area Near Quarry .......................................................... 142!
Figure 12.13 (c to d) – Flow Inundation of Oval Area Near Quarry .......................................................... 143!
Figure 12.13 (e to f) – Flow Inundation of Oval Area Near Quarry ........................................................... 144!
GRANTHAM FLOODS COMMISSION OF INQUIRY EXPERT HYDROLOGY REPORT 10 JANUARY 2011 FLOOD CIRCUMSTANCES AND CONTRIBUTING FACTORS
Document No. WS150262 Water Solutions Pty Ltd Revision 0 Page 11 of 301
Figure 12.13 – Quarry Cross-section Locations ....................................................................................... 146!
Figure 12.14 – Longitudinal Water Surface Profiles Through Quarry ...................................................... 147!
Figure 13.1 – Corroboration Locations ..................................................................................................... 148!
Figure 13.2 – Mrs Arndt’s House .............................................................................................................. 151!
Figure 13.3 – Arndt’s Vehicle Location ..................................................................................................... 152!
Figure 13.4 – GFCOI Flow Intensity Simulations ..................................................................................... 152!
Figure 13.4 (continued) – GFCOI Flow Intensity Simulations .................................................................. 153!
Figure 13.5 – Simulated Flow Characteristics at Mr and Mrs Arndt Location B ....................................... 153!
Figure 13.6 – Locality of Marshall Home .................................................................................................. 154!
Figure 13.7 – Simulated Flow Characteristics at Mr Marshall’s House (Location D) ............................... 155!
Figure 13.8 – Mr Sippel’s Locality ............................................................................................................ 156!
Figure 13.9 – Simulated Flow Intensity at 3:19pm ................................................................................... 157!
Figure 13.10 – Simulated Flow Intensity at 3:35pm ................................................................................. 157!
Figure 13.11 – Simulated Flow History at Locations E and F .................................................................. 158!
Figure 13.12 – Simulated Flow Intensity at 3:39pm, Location F .............................................................. 158!
Figure 13.13 – Simulated Flow Intensity at 4:19pm, Location G .............................................................. 159!
Figure 13.14 – Mr and Mrs Besley’s Residence ....................................................................................... 160!
Figure 13.15 – Simulated Stage Hydrograph in Lockyer Creek Adjacent Location H .............................. 161!
Figure 13.16 – Simulated Flow Intensity at 3:30pm, Locations H and I ................................................... 162!
Figure 13.17 – Simulated Flow Intensity at 3:48pm, Locations H and I ................................................... 162!
Figure 13.18 – Simulated Flow Intensity at 3:59pm, Locations H and I ................................................... 163!
Figure 13.19 – Simulated Flow Characteristics at Mrs Besley’s Location I .............................................. 164!
Figure 13.20 – Mr Lack’s Residence Location ......................................................................................... 165!
Figure 13.21 – Mr Lack’s Photograph showing water around base of the fuel bowser slab (Picture 002.jpg) .................................................................................................................................................... 165!
Figure 13.22 – Mr Lack’s Photograph showing water around base of bin (Picture 010.jpg) .................... 166!
Figure 13.23 – Mr Lack’s Photograph showing water over base of the fuel bowser slab (Picture 020.jpg) ................................................................................................................................................................. 166!
Figure 13.24 – Simulated Flow Characteristics Location J ...................................................................... 167!
Figure 13.25 – Simulated Water Depth at Location K .............................................................................. 168!
Figure 13.26 – Mr Lack’s photograph showing floodwater at the base of the stay pole (Picture 028.jpg)169!
Figure 13.27 – Mr Lack’s photograph showing floodwater at the base of the power pole (Picture 040.jpg) ................................................................................................................................................................. 169!
Figure 13.28 – Simulated Water Level at Location L ............................................................................... 170!
GRANTHAM FLOODS COMMISSION OF INQUIRY EXPERT HYDROLOGY REPORT 10 JANUARY 2011 FLOOD CIRCUMSTANCES AND CONTRIBUTING FACTORS
Document No. WS150262 Water Solutions Pty Ltd Revision 0 Page 12 of 301
Figure 13.29 – Mr Richardson’s Location (Grantham Hotel) .................................................................... 171!
Figure 13.30 – Simulated Water Depth at Location M ............................................................................. 171!
Figure 13.31 – Mr McIntosh’s Location .................................................................................................... 172!
Figure 13.32 – Lockyer Creek at 3:15pm Location N (Image IMG_0228.JPG) ....................................... 173!
Figure 13.33 – Simulated Flow Intensity at 3:10pm, Location N .............................................................. 174!
Figure 13.34 – Photograph of Lockyer Creek Floodplain at 4:41pm Location N, Mr McIntosh’s Residence (IMG_0236.jpg) ........................................................................................................................................ 175!
Figure 13.35 – Simulation of Lockyer Creek Floodplain at 4:41pm Location N ....................................... 175!
Figure 14.1 – Evacuation Routes, Grantham ........................................................................................... 177!
Figure 14.2 – Photograph of Gatton-Helidon Road near Armstrong Road, approaching Anzac Avenue at 3:53pm ..................................................................................................................................................... 179!
Figure 14.3 – Photograph of Gatton-Helidon Road bridge crossing of Sandy Creek at 3:56pm ............. 179!
Figure 14.4 – Photograph of Gatton-Helidon Road past Citrus and approaching Sorrensen Street at 3:58pm ..................................................................................................................................................... 180!
Figure 14.5 – Photograph of Gatton-Helidon Road near the intersection of Dorrs Road at 4:10pm ........ 181!
Figure B.1 – Helidon Gauging Station: Site Cross-section (DNRM Water Monitoring Portal) .................. 187!
Figure B.2 – Helidon Gauging Station: Rating Curve and Gaugings (DNRM Water Monitoring Portal) .. 187!
Figure B.3 – Helidon Gauging Station: Comparison of Pre and Post Flood LIDAR Cross-Sections ....... 188!
Figure B.4 – Helidon Gauging Station: View Downstream (DNRM Water Monitoring Portal) .................. 189!
Figure B.5 – Helidon Gauging Station: View Upstream (DNRM Water Monitoring Portal) ...................... 190!
Figure B.6 – Helidon Gauging Station: View of Site (DNRM Water Monitoring Portal) ............................ 190!
Figure B.7 – Helidon Gauging Station – Pre and Post Aerial Photography (Station at Red Circle) ......... 191!
Figure B.8 – Helidon Gauging Station: Estimated Cross-sectional Area and Back-calculated Manning’s n ................................................................................................................................................................. 192!
Figure B.9 – Sample Rating Curves at a Range of Roughness ............................................................... 193!
Figure B.10 – Helidon (143203C): Comparison of Flow Hydrographs ..................................................... 193!
Figure B.11 – Helidon (143203C): Revised Rating Curve for 2011 flood ................................................ 195!
Figure B.12 – Helidon (143203C): Revised Hydrograph for 2011 flood ................................................... 195!
Figure B.13 – Flagstone Creek Revised Hydrology ................................................................................. 196!
Figure B.14 – Ma Ma Creek Revised Hydrology ...................................................................................... 197!
Figure B.15 – Downstream Boundary Rating Curves (Gatton-Helidon Road) ......................................... 197!
Figure B.16 – Initial Flood Flow Inundation using LVRC ULG Downstream Rating ................................. 199!
Figure B.17 – Initial Flood Flow Inundation using Revised Downstream Rating ...................................... 199!
Figure B.18 – Western Levee and Main Breach Arrangement ................................................................ 200!
Figure B.19 – Water Surface Levels, Western Levee and Main Breach Erosion Development .............. 201!

GRANTHAM FLOODS COMMISSION OF INQUIRY EXPERT HYDROLOGY REPORT 10 JANUARY 2011 FLOOD CIRCUMSTANCES AND CONTRIBUTING FACTORS
Document No. WS150262 Water Solutions Pty Ltd Revision 0 Page 13 of 301
Figure B.20 – Surface Topography at the Grantham Quarry Site ............................................................ 203!
Figure B.21 – Surface Topography at the Grantham Quarry Site ............................................................ 204!
GRANTHAM FLOODS COMMISSION OF INQUIRY EXPERT HYDROLOGY REPORT 10 JANUARY 2011 FLOOD CIRCUMSTANCES AND CONTRIBUTING FACTORS
Document No. WS150262 Water Solutions Pty Ltd Revision 0 Page 14 of 301
List of Tables Table 1.1 – Initial Scope of Sensitivity Scenarios ....................................................................................... 24!
Table 1.2 – Summary Key Simulation Outcomes* ...................................................................................... 29!
Table 1.3 – Critical Evacuation Route Closure Times ................................................................................ 36!
Table 8.1 – Comparison between Jacobs (2014) and DNRM Hydrology, Helidon Station ........................ 58!
Table 8.2 – Western Levee Breach Locations ........................................................................................... 71!
Table 8.3 – Lockyer Creek Flow Rates and Levels at the Quarry Prior to 10th January 2011 ................... 72!
Table 8.4 – Rainfall Totals Helidon Post Office (Stn. No. 040096) ............................................................ 73!
Table 9.1 – Simulation Movie Files ............................................................................................................ 80!
Table 9.2 – Index to Most Likely Chronology ............................................................................................. 80!
Table 10.1 – Most Likely Scenario Trigger Status .................................................................................... 101!
Table 10.2 – Worst Case Trigger Status .................................................................................................. 108!
Table 12.1 – Sensitivity Metrics: Helidon Hydrographs ............................................................................ 128!
Table 12.2 – Peak Flood Height Survey (Cork) ........................................................................................ 135!
Table 12.3 – Peak Flood Height Survey (Rickuss) ................................................................................... 136!
Table 12.4 – Indicative Flow Area Calculation Upstream of Quarry ......................................................... 137!
Table 12.5 – Flood Storage Upstream from Quarry ................................................................................. 140!
Table 12.6 – Flood Storage in Oval Area Upstream from Quarry ............................................................ 145!
Table 13.1 – GFCOI Model Selected Eye-witness Accounts ................................................................... 149!
Table 14.1 – Critical Evacuation Route Closure Times ............................................................................ 178!
Table B.1 – Lockyer Creek At Helidon No 3 – Details .............................................................................. 186!
Table B.2 – Simulated Levee and Breach Initiation ................................................................................. 200!
GRANTHAM FLOODS COMMISSION OF INQUIRY EXPERT HYDROLOGY REPORT 10 JANUARY 2011 FLOOD CIRCUMSTANCES AND CONTRIBUTING FACTORS
Document No. WS150262 Water Solutions Pty Ltd Revision 0 Page 15 of 301
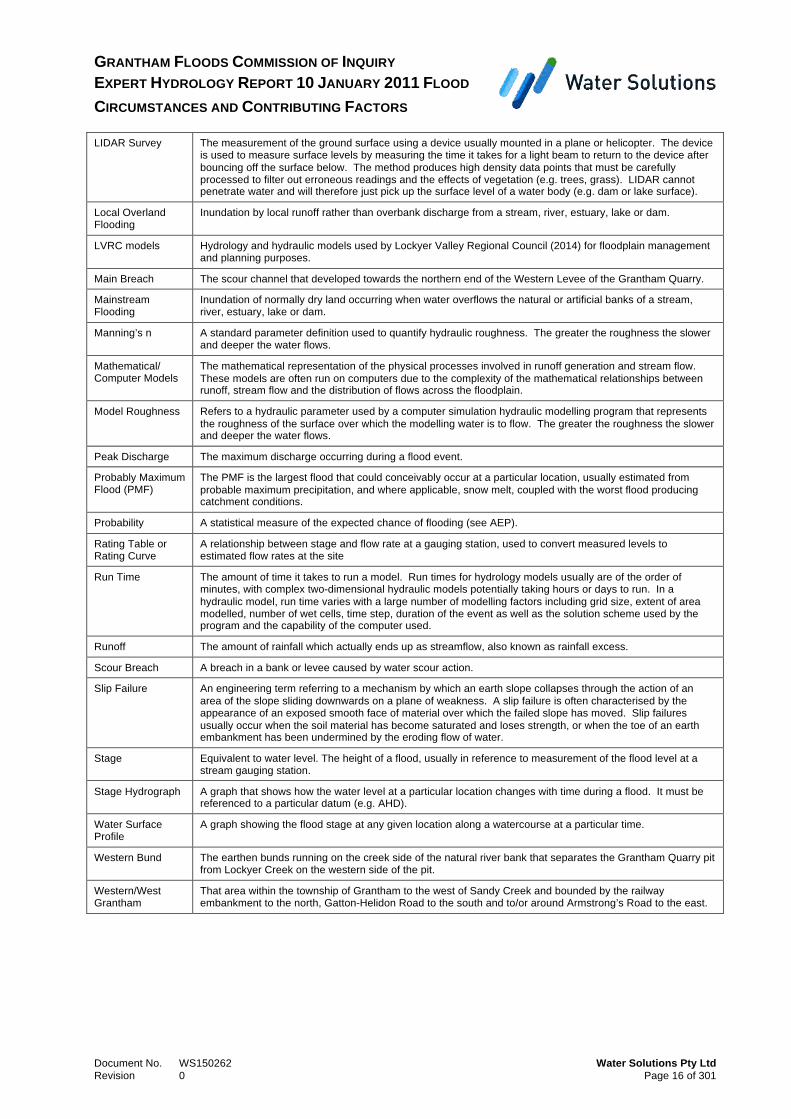
Glossary of Terms Term Description
2011 Flood Event The flooding event which occurred on 10 January 2011 in Lockyer Creek between Helidon and Grantham.
Annual Exceedance Probability (AEP)
The probability that a given condition, such as rainfall total accumulated over a given duration or flow rate, will be exceeded in any one year.
Afflux The rise in water level on the upstream side of a constriction, such as a road, weir or bridge in a stream or channel relative to the water level at that point without the constriction.
Australian Height Datum (AHD)
A level datum, uniform throughout Australia, based on an origin determined from observations of mean sea level at tide gauge stations, located at more than 30 points along the Australian coastline.
Average Recurrence Interval (ARI)
The long term average number of years between the occurrence of a flood as big or larger than the selected event. For example, floods with a discharge as great as or greater than the 20 year ARI flood event will occur on average every 20 years. ARI is another way of expressing the likelihood of occurrence of a flood event.
Breach An opening or hole created through a barrier. In a flood event, the overtopping of a levee will usually lead to erosion of the levee and possibly the natural terrain beneath.
Catchment That area determined by topographical or equivalent features, upon any part of which rain falling will contribute to the discharge of the stream at the point under consideration.
Central Grantham That area within the township of Grantham close to Sandy Creek, between the railway embankment to the north, the Gatton-Helidon Road to the south between around 1332 Gatton-Helidon Road to the west and 12 Anzac Avenue to the east (former Grantham Hotel).
Discharge The rate of flow of water measured in terms of volume per unit time, for example, cubic metres per second.
Eastern Bund The earthen bunds running on the pit lake side of the natural river bank that separates the Grantham Quarry pit from Lockyer Creek on the western side of the pit.
Eastern/East Grantham
That area within the township of Grantham to the east of Sandy Creek and bounded by the railway embankment to the north and Gatton-Helidon Road to the south.
Flash Flooding Flooding which is sudden and unexpected. It is often caused by sudden local or nearby heavy rainfall. Often defined as flooding which peaks within six hours of the causative rain.
Flood Water inundating land that is normally dry.
Floodplain The relatively flat area adjoining the channel of a natural stream which has been or may be inundated with floodwaters.
Flood Storage Areas
Those parts of the floodplain that are important for the temporary storage of floodwaters during the passage of a flood. The extent and behaviour of flood storage areas may change with flood severity, and loss of flood storage can increase the severity of flood impacts by reducing natural flood attenuation. The floodplain areas adjacent the main channel of a river or creek usually provides storage capacity.
Floodway Areas Those parts of the floodplain where a significant discharge of water occurs during floods. They are often aligned with naturally defined channels. Floodways are areas that, if blocked or partly blocked, would potentially cause a redistribution of flood flow, or an increase in flood levels.
Flow Intensity A measure of flood flow being velocity multiplied by depth. Colour coding is applied to graphical aerial images to represent values.
Gauge Zero The 0.0m level at a gauging station, usually set at about creek or river bed level. A datum is usually available to convert gauged levels to AHD.
GFCOI model Hydraulic model developed for the purposes of the Grantham Floods Commission of Inquiry
Grantham Quarry The Grantham Quarry located in the floodplain of Lockyer Creek approximately 3.5km upstream from Grantham as indicated in Figure 1.1.
Hydraulics The study of water flow in waterways, in particular, the evaluation of flow parameters such as water level and velocity.
Hydrograph A graph that shows how the discharge or stage/flood level at any particular location varies with time during a flood.
Hydrology The study of rainfall and runoff processes, in particular the evaluation of peak flows, flow volumes and the derivation of hydrographs for a range of floods.
Jordan models Hydrology and hydraulic models used by Dr Jordan (2011) for the purpose of his responses to the Queensland Floods Commission of Inquiry.
Levee An embankment alongside a stream that limits the water from entering the area behind the levee.
GRANTHAM FLOODS COMMISSION OF INQUIRY EXPERT HYDROLOGY REPORT 10 JANUARY 2011 FLOOD CIRCUMSTANCES AND CONTRIBUTING FACTORS
Document No. WS150262 Water Solutions Pty Ltd Revision 0 Page 16 of 301
LIDAR Survey The measurement of the ground surface using a device usually mounted in a plane or helicopter. The device is used to measure surface levels by measuring the time it takes for a light beam to return to the device after bouncing off the surface below. The method produces high density data points that must be carefully processed to filter out erroneous readings and the effects of vegetation (e.g. trees, grass). LIDAR cannot penetrate water and will therefore just pick up the surface level of a water body (e.g. dam or lake surface).
Local Overland Flooding
Inundation by local runoff rather than overbank discharge from a stream, river, estuary, lake or dam.
LVRC models Hydrology and hydraulic models used by Lockyer Valley Regional Council (2014) for floodplain management and planning purposes.
Main Breach The scour channel that developed towards the northern end of the Western Levee of the Grantham Quarry.
Mainstream Flooding
Inundation of normally dry land occurring when water overflows the natural or artificial banks of a stream, river, estuary, lake or dam.
Manning’s n A standard parameter definition used to quantify hydraulic roughness. The greater the roughness the slower and deeper the water flows.
Mathematical/ Computer Models
The mathematical representation of the physical processes involved in runoff generation and stream flow. These models are often run on computers due to the complexity of the mathematical relationships between runoff, stream flow and the distribution of flows across the floodplain.
Model Roughness Refers to a hydraulic parameter used by a computer simulation hydraulic modelling program that represents the roughness of the surface over which the modelling water is to flow. The greater the roughness the slower and deeper the water flows.
Peak Discharge The maximum discharge occurring during a flood event.
Probably Maximum Flood (PMF)
The PMF is the largest flood that could conceivably occur at a particular location, usually estimated from probable maximum precipitation, and where applicable, snow melt, coupled with the worst flood producing catchment conditions.
Probability A statistical measure of the expected chance of flooding (see AEP).
Rating Table or Rating Curve
A relationship between stage and flow rate at a gauging station, used to convert measured levels to estimated flow rates at the site
Run Time The amount of time it takes to run a model. Run times for hydrology models usually are of the order of minutes, with complex two-dimensional hydraulic models potentially taking hours or days to run. In a hydraulic model, run time varies with a large number of modelling factors including grid size, extent of area modelled, number of wet cells, time step, duration of the event as well as the solution scheme used by the program and the capability of the computer used.
Runoff The amount of rainfall which actually ends up as streamflow, also known as rainfall excess.
Scour Breach A breach in a bank or levee caused by water scour action.
Slip Failure An engineering term referring to a mechanism by which an earth slope collapses through the action of an area of the slope sliding downwards on a plane of weakness. A slip failure is often characterised by the appearance of an exposed smooth face of material over which the failed slope has moved. Slip failures usually occur when the soil material has become saturated and loses strength, or when the toe of an earth embankment has been undermined by the eroding flow of water.
Stage Equivalent to water level. The height of a flood, usually in reference to measurement of the flood level at a stream gauging station.
Stage Hydrograph A graph that shows how the water level at a particular location changes with time during a flood. It must be referenced to a particular datum (e.g. AHD).
Water Surface Profile
A graph showing the flood stage at any given location along a watercourse at a particular time.
Western Bund The earthen bunds running on the creek side of the natural river bank that separates the Grantham Quarry pit from Lockyer Creek on the western side of the pit.
Western/West Grantham
That area within the township of Grantham to the west of Sandy Creek and bounded by the railway embankment to the north, Gatton-Helidon Road to the south and to/or around Armstrong’s Road to the east.
GRANTHAM FLOODS COMMISSION OF INQUIRY EXPERT HYDROLOGY REPORT 10 JANUARY 2011 FLOOD CIRCUMSTANCES AND CONTRIBUTING FACTORS
Document No. WS150262 Water Solutions Pty Ltd Revision 0 Page 17 of 301
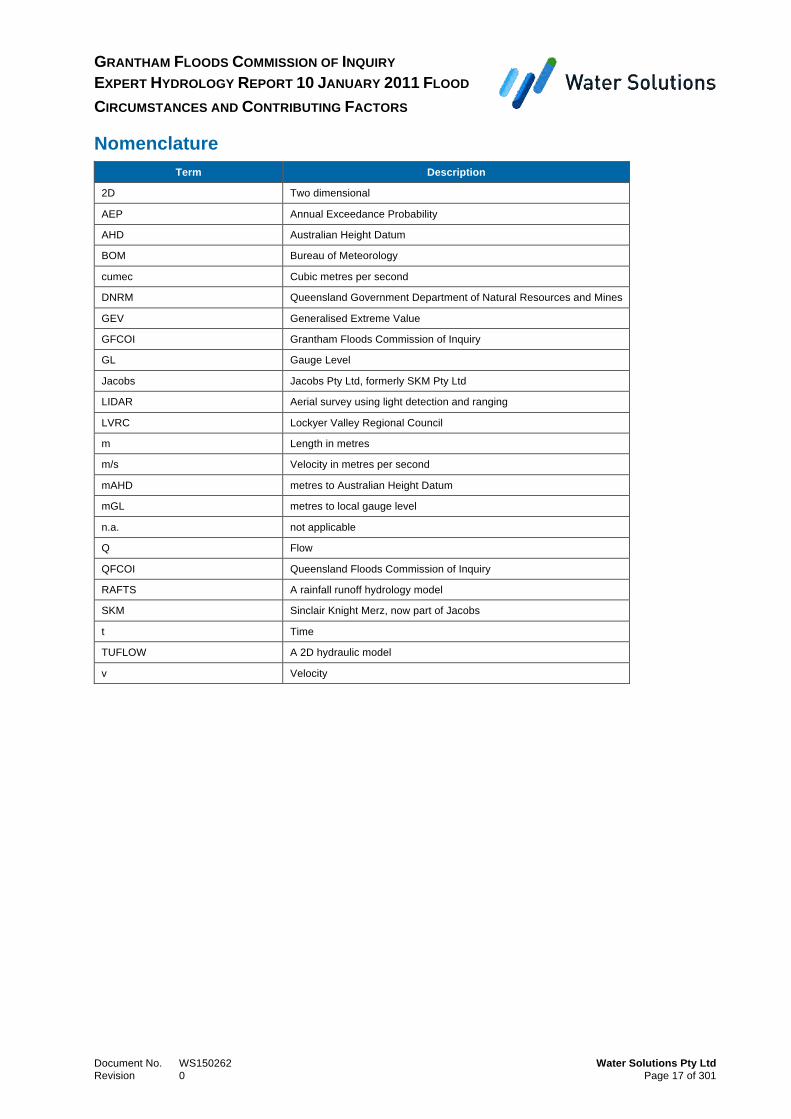
Nomenclature Term Description
2D Two dimensional
AEP Annual Exceedance Probability
AHD Australian Height Datum
BOM Bureau of Meteorology
cumec Cubic metres per second
DNRM Queensland Government Department of Natural Resources and Mines
GEV Generalised Extreme Value
GFCOI Grantham Floods Commission of Inquiry
GL Gauge Level
Jacobs Jacobs Pty Ltd, formerly SKM Pty Ltd
LIDAR Aerial survey using light detection and ranging
LVRC Lockyer Valley Regional Council
m Length in metres
m/s Velocity in metres per second
mAHD metres to Australian Height Datum
mGL metres to local gauge level
n.a. not applicable
Q Flow
QFCOI Queensland Floods Commission of Inquiry
RAFTS A rainfall runoff hydrology model
SKM Sinclair Knight Merz, now part of Jacobs
t Time
TUFLOW A 2D hydraulic model
v Velocity
GRANTHAM FLOODS COMMISSION OF INQUIRY EXPERT HYDROLOGY REPORT 10 JANUARY 2011 FLOOD CIRCUMSTANCES AND CONTRIBUTING FACTORS
Document No. WS150262 Water Solutions Pty Ltd Revision 0 Page 18 of 301
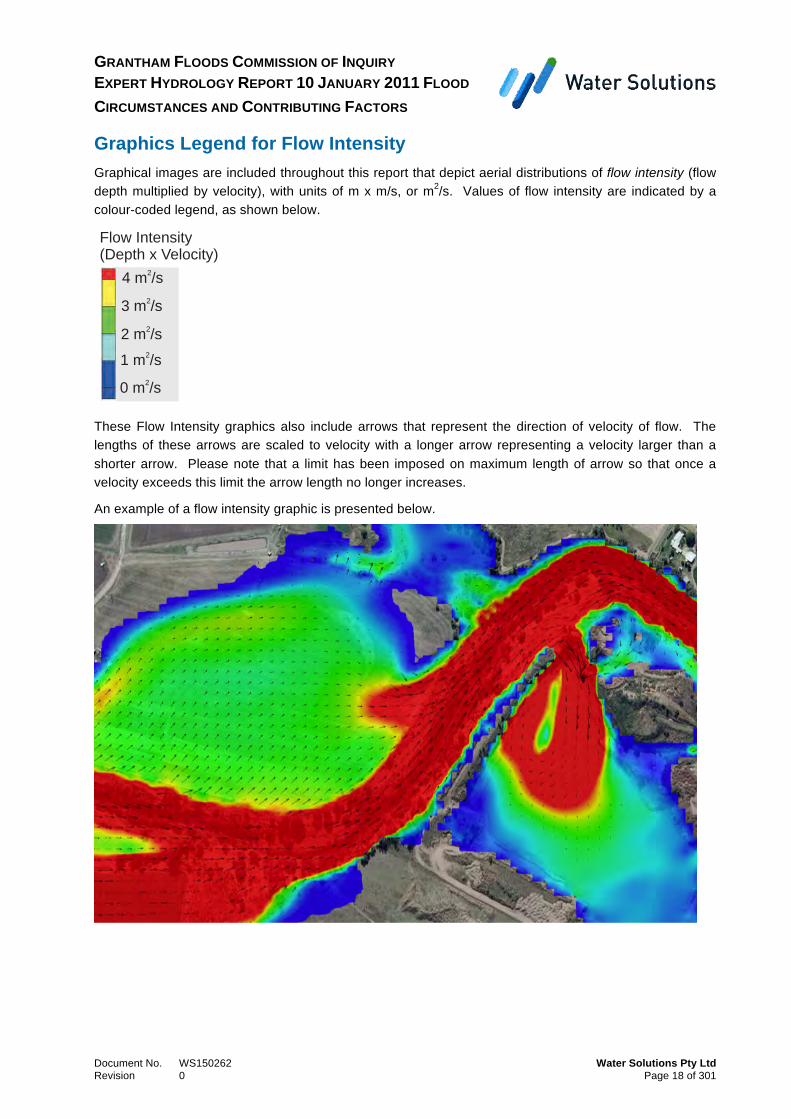
Graphics Legend for Flow Intensity Graphical images are included throughout this report that depict aerial distributions of flow intensity (flow depth multiplied by velocity), with units of m x m/s, or m2/s. Values of flow intensity are indicated by a colour-coded legend, as shown below.
These Flow Intensity graphics also include arrows that represent the direction of velocity of flow. The lengths of these arrows are scaled to velocity with a longer arrow representing a velocity larger than a shorter arrow. Please note that a limit has been imposed on maximum length of arrow so that once a velocity exceeds this limit the arrow length no longer increases.
An example of a flow intensity graphic is presented below.
2
4 m /s
2
3 m /s
2
2 m /s
2
1 m /s
2
0 m /s
Flow Intensity
(Depth x Velocity)

GRANTHAM FLOODS COMMISSION OF INQUIRY EXPERT HYDROLOGY REPORT 10 JANUARY 2011 FLOOD CIRCUMSTANCES AND CONTRIBUTING FACTORS
Document No. WS150262 – Confidential – Water Solutions Pty Ltd Revision Rev 0 Page 19 of 301
1 Summary of Conclusions 1. The Grantham Floods Commission of Inquiry (the GFCOI) was established under the
Commissions of Inquiry Act 1950 to make full and careful inquiry into the flooding of Lockyer Creek between Helidon and Grantham on 10th January 2011, with specific reference to any natural or man-made features of the landscape, including the Grantham Quarry, which could have altered or contributed to the flooding.
2. I have been engaged by the GFCOI to provide an expert hydrology opinion in relation to:
• the likely chronology of the flooding between Helidon and Grantham on 10th January 2011; and
• the possible factors that may have altered, contributed, caused or materially impacted on the flooding on 10th January 2011 with specific reference to any natural or man-made features of the landscape, and in particular the Grantham Quarry.
3. In forming my opinion, I have been requested to consider the matters set out in four letters of instruction contained in Appendix E.
4. I am a Chartered Professional Engineer practising in the area of Water Engineering, with over 35 years experience. A copy of my Curriculum Vitae is at Appendix D.
5. This report presents the outcomes of the investigations that I have undertaken for the GFCOI. My approach has been as follows:
• establish a clear understanding of all relevant available information and in particular that contained in eye-witness accounts;
• with the use of computer simulation modelling, gain a sound and detailed understanding of how the 10th January 2011 flood event evolved, and identify and test areas of uncertainty;
• corroborate computer simulation outcomes against eye-witness accounts;
• examine those factors that might have contributed to the nature, timing and magnitude of the 2011 Flood Event; and
• assist the GFCOI in answering its brief.
6. For reference, I have included a map showing the general environs around Grantham with relevant landmarks and localities, Figure 1.1 below (a larger version is in Appendix C.1).
7. I have also included below Figure 1.2 which indicates the key features around Grantham referred to in my report being the areas that I have designated as Eastern, Central and Western Grantham, Lockyer Creek and Sandy Creek, the railway embankment and bridge crossing of Sandy Creek, the Grantham Quarry (including the Western Levee) and Gatton-Helidon Road.

GRANTHAM FLOODS COMMISSION OF INQUIRY EXPERT HYDROLOGY REPORT 10 JANUARY 2011 FLOOD CIRCUMSTANCES AND CONTRIBUTING FACTORS
Document No. WS150262 Water Solutions Pty Ltd Revision 0 Page 20 of 301
Figure 1.1 – Grantham Environs Locality Map
Figure 1.2 – Grantham Township Locality Map
8. A summary of my key conclusions is provided below.
Description of the Grantham Flood
9. The 10th January 2011 flood event had never before been experienced in the Lockyer Valley’s recorded history, and particularly in the area of Grantham. It was a flash flood in the Lockyer Valley, driven by an extreme rainfall event and only rarely expected to occur. A 2014 flood study provided to the LVRC estimated the probability of the flood at the Helidon Gauge on Lockyer
GRANTHAM
HELIDON
HELIDON TO GRANTHAM (2009 AERIAL IMAGERY)LOCKYER VALLEY, QUEENSLAND
UNCLASSIFIED
0 200 400 600 800 1000
metres
© State of Queensland 2015Produced by Analytics Team
Public Safety Business AgencyFile Ref: JR171/2015
Helidon_Grantham_ImageMap_A3L_ed2
railway line
railway lin
e
Approximate location 143203C gauging stationLockyer Creek at Helidon
Warrego Highway
Gatton Helidon Road
Warrego Highway
Railway Terrace
Sandy Creek
Lockyer Creek
Tent
hill
Cre
ek
Ma Ma Creek
Flag
ston
e C
reek
Flag
ston
e Cr
eek
Road
Monkey Waterholes
Creek Lockyer Creek
Quarry
Lockyer Creek
Soda Spring Creek
R
a
i
l
w
a
y
G
a
t
t
o
n
-
H
e
l
i
d
o
n
R
o
a
d
S
a
n
d
y
C
r
e
e
k
L
o
c
k
y
e
r
C
r
e
e
k
Quarry Access Road Causeway
Grantham Quarry
Western Levee
Railway Bridge
Sandy Creek Floodplain
Western Grantham
Central Grantham
Eastern Grantham
GRANTHAM FLOODS COMMISSION OF INQUIRY EXPERT HYDROLOGY REPORT 10 JANUARY 2011 FLOOD CIRCUMSTANCES AND CONTRIBUTING FACTORS
Document No. WS150262 Water Solutions Pty Ltd Revision 0 Page 21 of 301
Creek (about 10km upstream from Grantham) as being around 1 in 400 AEP (Annual Exceedance Probability). I have indicated in Figure 1.1 above the location of the Helidon Gauge.
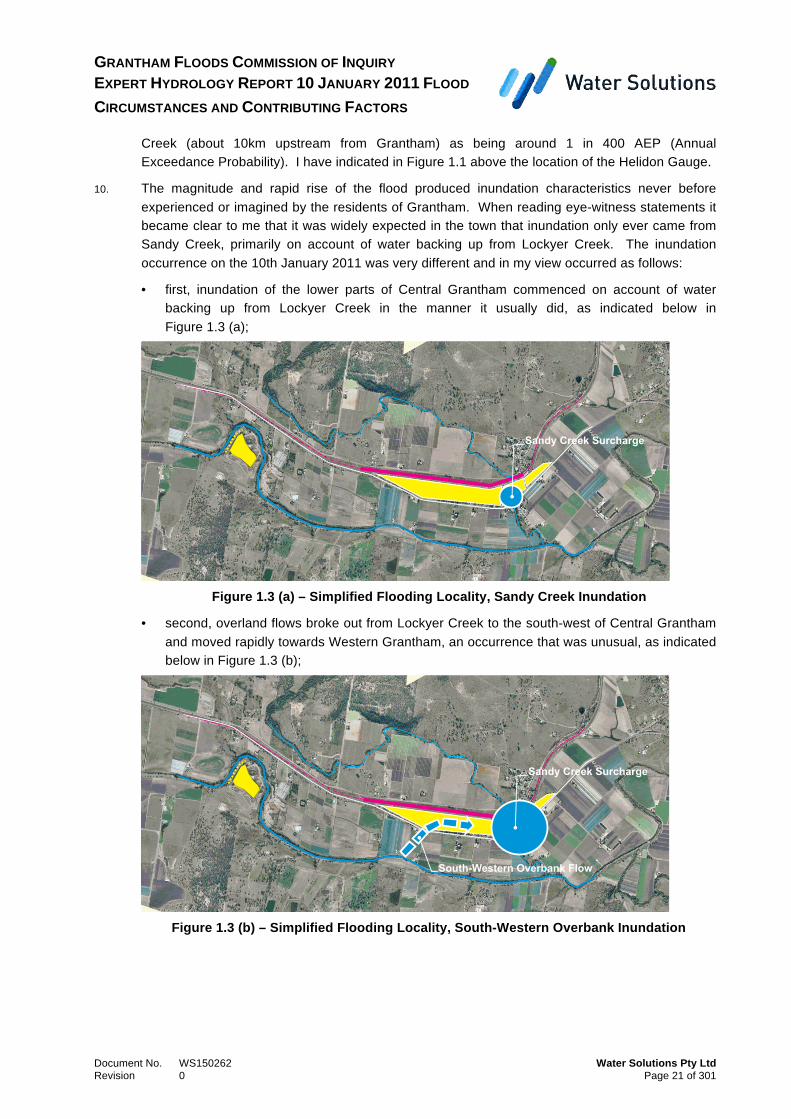
10. The magnitude and rapid rise of the flood produced inundation characteristics never before experienced or imagined by the residents of Grantham. When reading eye-witness statements it became clear to me that it was widely expected in the town that inundation only ever came from Sandy Creek, primarily on account of water backing up from Lockyer Creek. The inundation occurrence on the 10th January 2011 was very different and in my view occurred as follows:
• first, inundation of the lower parts of Central Grantham commenced on account of water backing up from Lockyer Creek in the manner it usually did, as indicated below in Figure 1.3 (a);
Figure 1.3 (a) – Simplified Flooding Locality, Sandy Creek Inundation
• second, overland flows broke out from Lockyer Creek to the south-west of Central Grantham and moved rapidly towards Western Grantham, an occurrence that was unusual, as indicated below in Figure 1.3 (b);
Figure 1.3 (b) – Simplified Flooding Locality, South-Western Overbank Inundation
Sandy Creek Surcharge
South-Western Overbank Flow
Sandy Creek Surcharge
GRANTHAM FLOODS COMMISSION OF INQUIRY EXPERT HYDROLOGY REPORT 10 JANUARY 2011 FLOOD CIRCUMSTANCES AND CONTRIBUTING FACTORS
Document No. WS150262 Water Solutions Pty Ltd Revision 0 Page 22 of 301
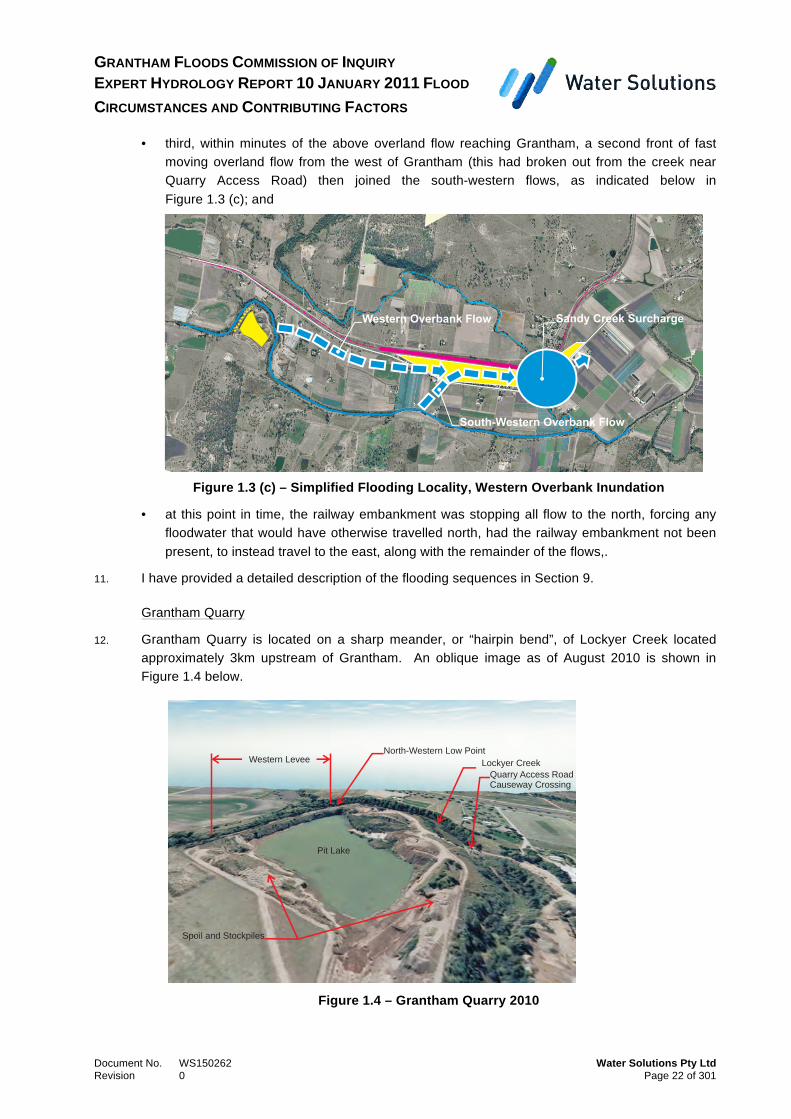
• third, within minutes of the above overland flow reaching Grantham, a second front of fast moving overland flow from the west of Grantham (this had broken out from the creek near Quarry Access Road) then joined the south-western flows, as indicated below in Figure 1.3 (c); and
Figure 1.3 (c) – Simplified Flooding Locality, Western Overbank Inundation
• at this point in time, the railway embankment was stopping all flow to the north, forcing any floodwater that would have otherwise travelled north, had the railway embankment not been present, to instead travel to the east, along with the remainder of the flows,.
11. I have provided a detailed description of the flooding sequences in Section 9.
Grantham Quarry
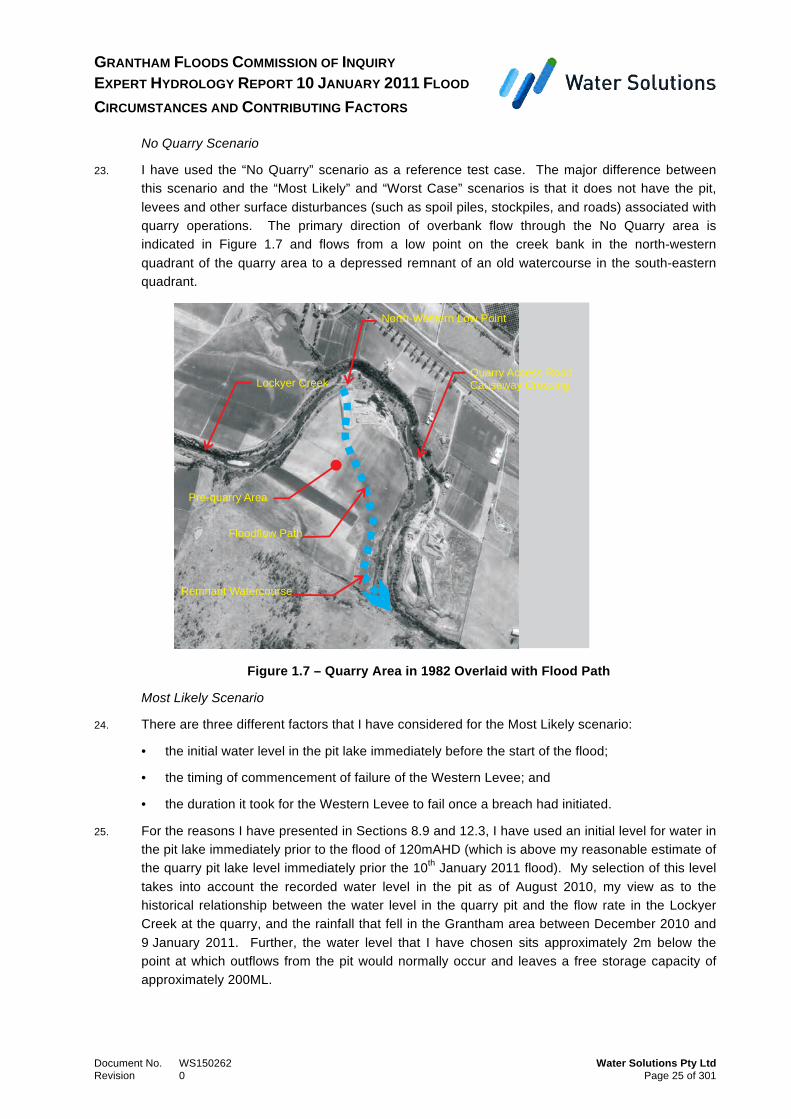
12. Grantham Quarry is located on a sharp meander, or “hairpin bend”, of Lockyer Creek located approximately 3km upstream of Grantham. An oblique image as of August 2010 is shown in Figure 1.4 below.
Figure 1.4 – Grantham Quarry 2010
Western Overbank Flow
South-Western Overbank Flow
Sandy Creek Surcharge
North-Western Low Point
Pit Lake
Lockyer Creek
Western Levee
Quarry Access Road
Causeway Crossing
Spoil and Stockpiles

GRANTHAM FLOODS COMMISSION OF INQUIRY EXPERT HYDROLOGY REPORT 10 JANUARY 2011 FLOOD CIRCUMSTANCES AND CONTRIBUTING FACTORS
Document No. WS150262 Water Solutions Pty Ltd Revision 0 Page 23 of 301
13. In order to determine the likely contribution of the Grantham Quarry to the flooding of Grantham, I first considered my information requirements.
14. I determined that there was sufficient information to define:
• the general flooding characteristics of the Grantham area as of 10th January 2011, taken from eye-witness accounts and a flood simulation model provided to LVRC by Jacobs (a company that was commissioned by LVRC to produce the flood study);
• the timing and characteristics of the flood, taken from eye-witness accounts;
• survey information defining peak flood levels throughout the Grantham area, provided by LVRC, Mr Cork and Mr Rickuss; and
• the likely topography of the Grantham Quarry site before its development as a quarry commenced (circa 1982), taken from investigation outcomes by Mr Starr (Geotechnical Expert).
15. As to the last of these matters, Figure 1.5 is a schematic of the cross-section through the quarry, prepared by Mr Starr, that shows the general arrangement of the bunds in the Western Levee, the pit lake, the location of Lockyer Creek and an indication of the relative location of the original pre-quarry ground level.
Figure 1.5 – Schematic Cross-section Through Western Levee (Starr, 2015)
16. However, I determined that initially there was not sufficient information to reasonably define without further investigation:
• the flood flow hydrograph at the locations of the Helidon, Flagstone and Ma Ma Creek Gauging Stations (although DNRM did provide me with detailed records of time-code flood levels at those gauging stations for the 10th January 2011 event);
• the time that the progressive failure of the bunds on the Western Levee commenced;
• the duration of levee failure once it had commenced; and
• the initial level of the pit lake on 10th January 2011 and prior to the flood.
Helidon, Flagstone and Ma Ma Creeks Gauging Station Flood Flow Hydrographs
17. The most critical aspect of assessing the impact of the Grantham Quarry on flooding was to be able to derive the flow hydrographs in Lockyer Creek upstream from the Grantham Quarry, for the flooding at Grantham.
18. A flow hydrograph is a record of flow rate in a watercourse over time. This hydrograph information is most often presented in a graphical format.

GRANTHAM FLOODS COMMISSION OF INQUIRY EXPERT HYDROLOGY REPORT 10 JANUARY 2011 FLOOD CIRCUMSTANCES AND CONTRIBUTING FACTORS
Document No. WS150262 Water Solutions Pty Ltd Revision 0 Page 24 of 301
19. For the reasons set out in Section 8.3, I considered that it was necessary for me to derive revised flow hydrographs for the DNRM Gauging Stations at Helidon (Lockyer Creek), Flagstone and Ma Ma Creeks. I have plotted these revised hydrographs in Figure 1.6 below.
Figure 1.6 – Revised Flow Hydrographs at DNRM Gauging Stations
Flooding Sensitivity Scenarios
20. As to the remaining unknown factors I considered it was necessary to undertake a number of sensitivity analyses.
21. The scope of sensitivity scenarios that I have considered is summarised in Table 1.1 below.
Table 1.1 – Initial Scope of Sensitivity Scenarios
Scenario Pit Lake Level Levee Overtopped Levee Failure Trigger Duration of Failure
No Quarry n.a. n.a. n.a. n.a.
Most Likely 120mAHD (2m below full) Yes
Progressive: triggered by water levels at 3 locations (A to C, Figure 1.8 below)
Range: fast (5s), typical (10m), long (1hr)
Worst Case 122mAHD (full) No
All at once: triggered to the same water level (Location D, Figure 1.8 below)
Fast (5s)
22. I have used the flow hydrographs referred to above for each of the three sensitivity scenarios to determine the likely flooding characteristics in Grantham as described by the variation of flood flow rates, depths and velocities over time.
10/01/11$14:00$ 10/01/11$15:00$ 10/01/11$16:00$ 10/01/11$17:00$ 10/01/11$18:00$0$
500$
1,000$
1,500$
2,000$
2,500$
3,000$
3,500$
4,000$
4,500$
5,000$
Discha
rge*(cum
ecs)*
Helidon:$Revised$Ra9ng$Curve$
Helidon:$DNRM$Table$22$Ra9ng$Curve$
Flagstone$Creek:$Revised$
Ma$Ma$Creek:$Revised$
GRANTHAM FLOODS COMMISSION OF INQUIRY EXPERT HYDROLOGY REPORT 10 JANUARY 2011 FLOOD CIRCUMSTANCES AND CONTRIBUTING FACTORS
Document No. WS150262 Water Solutions Pty Ltd Revision 0 Page 25 of 301
No Quarry Scenario
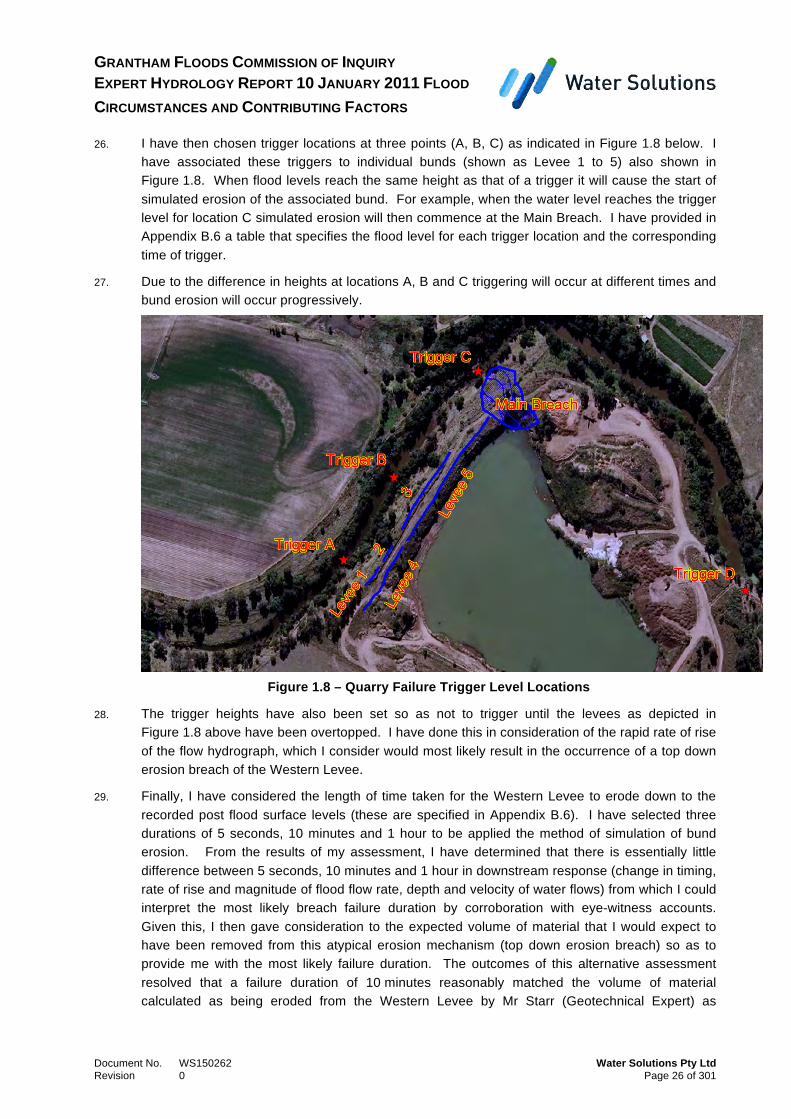
23. I have used the “No Quarry” scenario as a reference test case. The major difference between this scenario and the “Most Likely” and “Worst Case” scenarios is that it does not have the pit, levees and other surface disturbances (such as spoil piles, stockpiles, and roads) associated with quarry operations. The primary direction of overbank flow through the No Quarry area is indicated in Figure 1.7 and flows from a low point on the creek bank in the north-western quadrant of the quarry area to a depressed remnant of an old watercourse in the south-eastern quadrant.
Figure 1.7 – Quarry Area in 1982 Overlaid with Flood Path
Most Likely Scenario
24. There are three different factors that I have considered for the Most Likely scenario:
• the initial water level in the pit lake immediately before the start of the flood;
• the timing of commencement of failure of the Western Levee; and
• the duration it took for the Western Levee to fail once a breach had initiated.
25. For the reasons I have presented in Sections 8.9 and 12.3, I have used an initial level for water in the pit lake immediately prior to the flood of 120mAHD (which is above my reasonable estimate of the quarry pit lake level immediately prior the 10th January 2011 flood). My selection of this level takes into account the recorded water level in the pit as of August 2010, my view as to the historical relationship between the water level in the quarry pit and the flow rate in the Lockyer Creek at the quarry, and the rainfall that fell in the Grantham area between December 2010 and 9 January 2011. Further, the water level that I have chosen sits approximately 2m below the point at which outflows from the pit would normally occur and leaves a free storage capacity of approximately 200ML.
North-Western Low Point
Pre-quarry Area
Lockyer Creek
Quarry Access Road
Causeway Crossing
Remnant Watercourse
Floodflow Path
GRANTHAM FLOODS COMMISSION OF INQUIRY EXPERT HYDROLOGY REPORT 10 JANUARY 2011 FLOOD CIRCUMSTANCES AND CONTRIBUTING FACTORS
Document No. WS150262 Water Solutions Pty Ltd Revision 0 Page 26 of 301
26. I have then chosen trigger locations at three points (A, B, C) as indicated in Figure 1.8 below. I have associated these triggers to individual bunds (shown as Levee 1 to 5) also shown in Figure 1.8. When flood levels reach the same height as that of a trigger it will cause the start of simulated erosion of the associated bund. For example, when the water level reaches the trigger level for location C simulated erosion will then commence at the Main Breach. I have provided in Appendix B.6 a table that specifies the flood level for each trigger location and the corresponding time of trigger.
27. Due to the difference in heights at locations A, B and C triggering will occur at different times and bund erosion will occur progressively.
Figure 1.8 – Quarry Failure Trigger Level Locations
28. The trigger heights have also been set so as not to trigger until the levees as depicted in Figure 1.8 above have been overtopped. I have done this in consideration of the rapid rate of rise of the flow hydrograph, which I consider would most likely result in the occurrence of a top down erosion breach of the Western Levee.
29. Finally, I have considered the length of time taken for the Western Levee to erode down to the recorded post flood surface levels (these are specified in Appendix B.6). I have selected three durations of 5 seconds, 10 minutes and 1 hour to be applied the method of simulation of bund erosion. From the results of my assessment, I have determined that there is essentially little difference between 5 seconds, 10 minutes and 1 hour in downstream response (change in timing, rate of rise and magnitude of flood flow rate, depth and velocity of water flows) from which I could interpret the most likely breach failure duration by corroboration with eye-witness accounts. Given this, I then gave consideration to the expected volume of material that I would expect to have been removed from this atypical erosion mechanism (top down erosion breach) so as to provide me with the most likely failure duration. The outcomes of this alternative assessment resolved that a failure duration of 10 minutes reasonably matched the volume of material calculated as being eroded from the Western Levee by Mr Starr (Geotechnical Expert) as

GRANTHAM FLOODS COMMISSION OF INQUIRY EXPERT HYDROLOGY REPORT 10 JANUARY 2011 FLOOD CIRCUMSTANCES AND CONTRIBUTING FACTORS
Document No. WS150262 Water Solutions Pty Ltd Revision 0 Page 27 of 301
30,880m3 net (see Section 10 for further details). On this basis I have concluded that the 10 minute failure duration is most likely and accordingly I have selected this duration for application to the Most Likely scenario.
Worst Case Scenario
30. My purpose for the Worst Case scenario was to create a set of hypothetical conditions that I expected would maximise the effect of the quarry on simulation outcomes (in terms of the timing, rate of rise and magnitude of flood flow rate, depth and velocity of water flows).
31. I have considered the same three factors for the Worst Case scenario as for the Most Likely scenario:
• the initial water level in the pit lake immediately before the start of the flood;
• the timing of commencement of failure of the Western Levee; and
• the duration it took the failure mechanism to occur once initiated.
32. I have selected an initial pit lake water level of 122mAHD, this being a few centimetres over the maximum storage capacity of the quarry pit. Under this condition it would minimise any delay to the outflow of water from the south-eastern quadrant of the pit lake back into Lockyer Creek. This delay is that which would have otherwise been due to the time it would take for water to fill the pit from a lower level to full storage capacity. The end outcome would be that inflows from a breached Western Levee would outflow with minimum delay and at maximum rate. That is, by setting the pit lake level at full storage capacity I created simulated conditions that I expected would maximise any surge of water from the Western Levee breach through the pit back into Lockyer Creek at a location adjacent to the south-eastern quadrant of the pit.
33. In contrast to the Most Likely scenario, I have used a different method to set the initiation and duration of failure of the Western Levee. I have designed this method to create the situation where floodwater builds up behind the Western Levee and then the levee suddenly collapses allowing the water immediately behind the levee to flow into the pit all at once.
34. To simulate this I have:
• set the Western Levee to all collapse at the same instant when triggered;
• raised the entire Western Levee to a uniform level above the peak level of the water that builds up behind it during the flood (that is, I have set the top of the Western Levee high enough so that floodwater does not spill over it prior to it collapsing); and
• set the Western Levee to collapse over a very short period of time of 5 seconds.
35. I have intended that this method for the initiation and duration of failure replicates the behaviour of a complete and rapid levee collapse, not by top down erosion by the flow of water over the top of the levee (as I have done for the Most Likely scenario), but instead by a sudden loss of levee strength such as that associated with the entire Western Levee dropping downwards in the manner of a slip failure.
36. I have selected this method of collapse so as to maximise:
• the volume of water that is able to build up behind (upstream of) the Western Levee before failure initiation; and
• the potential rate of inflow into the pit.
GRANTHAM FLOODS COMMISSION OF INQUIRY EXPERT HYDROLOGY REPORT 10 JANUARY 2011 FLOOD CIRCUMSTANCES AND CONTRIBUTING FACTORS
Document No. WS150262 Water Solutions Pty Ltd Revision 0 Page 28 of 301
37. I have chosen a single location point (D), also as indicated in Figure 1.8 (see previous page), to identify the trigger height for initiating failure of the entire Western Levee. The significance of location D is its close proximity to the point of the breakout of overbank flows from this location eastward to Grantham (Western Overbank flows) as indicated by Mr and Mrs Besley in their eye-witness accounts.
38. My sensitivity analyses have considered a range of water level triggers at location D, as detailed in Section 10.6. My inspection of simulation results from these analyses has provided me with:
• Worst Case (greatest delay) – the case that produced the greatest delay until initiation of levee failure, trigger level at location Trigger D of 126.4mAHD; and
• Worst Case (greatest drop) – the case that produced the greatest Lockyer Creek to quarry pit lake drop, trigger level at location Trigger D of 124.5mAHD.
Outcomes of Sensitivity Analyses
39. My simulations analyses considered a range of Western Levee failure initiation times:
• Most Likely Case at 3:25pm;
• Worst Case (greatest drop) at 3:35pm; and
• Worst Case (greatest delay) at 4:16pm.
40. In addressing the outcomes of my sensitivity analyses I have considered the following simulated flooding characteristics:
• time of inundation;
• flow depth and intensity (product of velocity and depth); and
• rate of increase in flow depth and intensity.
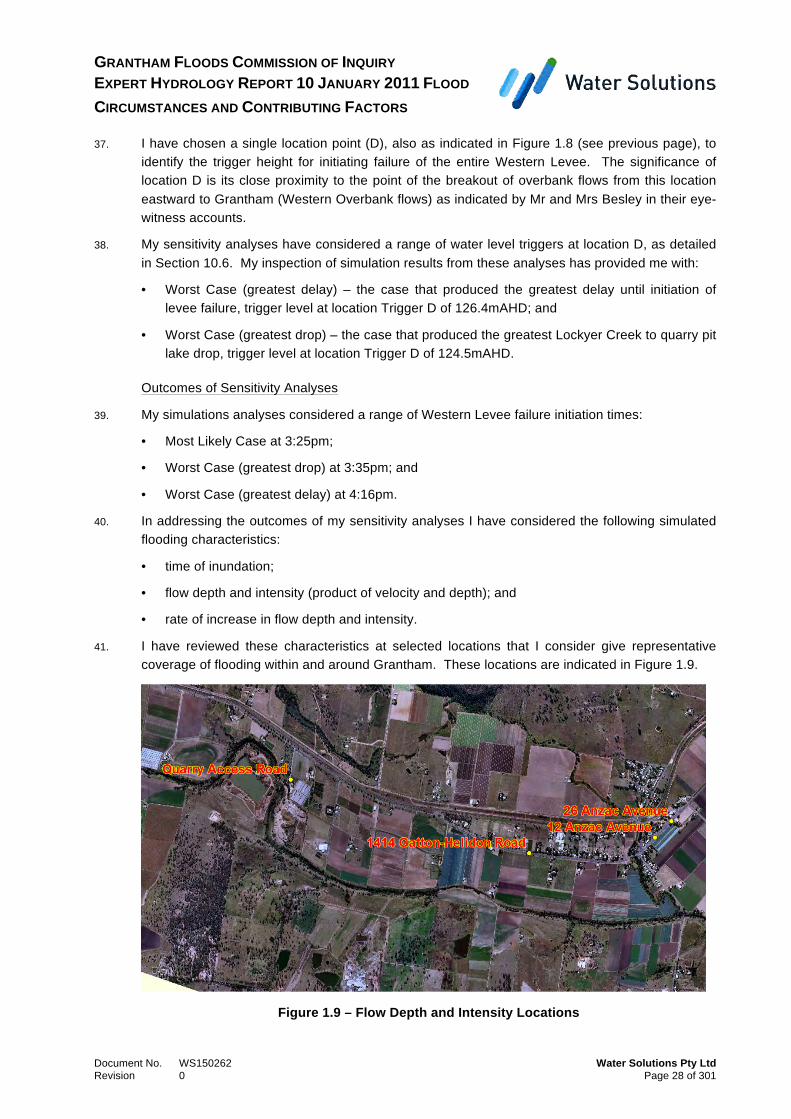
41. I have reviewed these characteristics at selected locations that I consider give representative coverage of flooding within and around Grantham. These locations are indicated in Figure 1.9.
Figure 1.9 – Flow Depth and Intensity Locations
GRANTHAM FLOODS COMMISSION OF INQUIRY EXPERT HYDROLOGY REPORT 10 JANUARY 2011 FLOOD CIRCUMSTANCES AND CONTRIBUTING FACTORS
Document No. WS150262 Water Solutions Pty Ltd Revision 0 Page 29 of 301
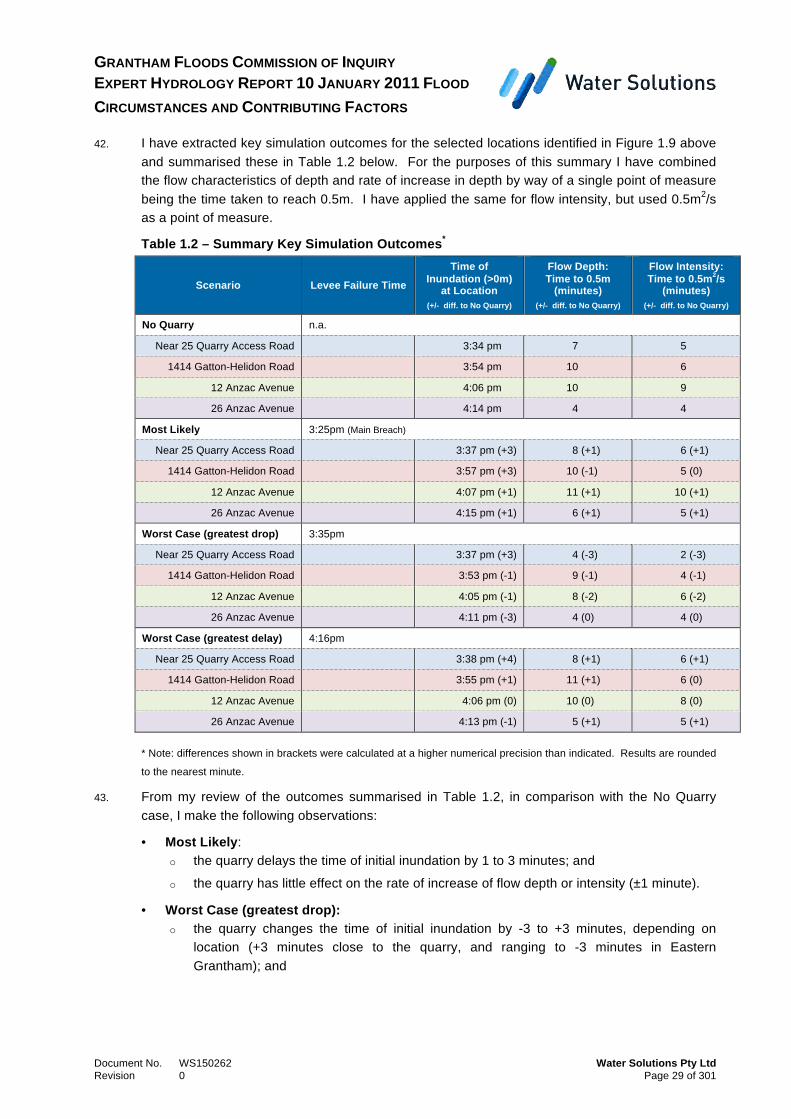
42. I have extracted key simulation outcomes for the selected locations identified in Figure 1.9 above and summarised these in Table 1.2 below. For the purposes of this summary I have combined the flow characteristics of depth and rate of increase in depth by way of a single point of measure being the time taken to reach 0.5m. I have applied the same for flow intensity, but used 0.5m2/s as a point of measure.
Table 1.2 – Summary Key Simulation Outcomes*
Scenario Levee Failure Time
Time of Inundation (>0m)
at Location (+/- diff. to No Quarry)
Flow Depth: Time to 0.5m
(minutes) (+/- diff. to No Quarry)
Flow Intensity: Time to 0.5m2/s
(minutes) (+/- diff. to No Quarry)
No Quarry n.a.
Near 25 Quarry Access Road 3:34 pm 7 5
1414 Gatton-Helidon Road 3:54 pm 10 6
12 Anzac Avenue 4:06 pm 10 9
26 Anzac Avenue 4:14 pm 4 4
Most Likely 3:25pm (Main Breach)
Near 25 Quarry Access Road 3:37 pm (+3) 8 (+1) 6 (+1)
1414 Gatton-Helidon Road 3:57 pm (+3) 10 (-1) 5 (0)
12 Anzac Avenue 4:07 pm (+1) 11 (+1) 10 (+1)
26 Anzac Avenue 4:15 pm (+1) 6 (+1) 5 (+1)
Worst Case (greatest drop) 3:35pm
Near 25 Quarry Access Road 3:37 pm (+3) 4 (-3) 2 (-3)
1414 Gatton-Helidon Road 3:53 pm (-1) 9 (-1) 4 (-1)
12 Anzac Avenue 4:05 pm (-1) 8 (-2) 6 (-2)
26 Anzac Avenue 4:11 pm (-3) 4 (0) 4 (0)
Worst Case (greatest delay) 4:16pm
Near 25 Quarry Access Road 3:38 pm (+4) 8 (+1) 6 (+1)
1414 Gatton-Helidon Road 3:55 pm (+1) 11 (+1) 6 (0)
12 Anzac Avenue 4:06 pm (0) 10 (0) 8 (0)
26 Anzac Avenue 4:13 pm (-1) 5 (+1) 5 (+1)
* Note: differences shown in brackets were calculated at a higher numerical precision than indicated. Results are rounded
to the nearest minute.
43. From my review of the outcomes summarised in Table 1.2, in comparison with the No Quarry case, I make the following observations:
• Most Likely: o the quarry delays the time of initial inundation by 1 to 3 minutes; and
o the quarry has little effect on the rate of increase of flow depth or intensity (±1 minute).
• Worst Case (greatest drop): o the quarry changes the time of initial inundation by -3 to +3 minutes, depending on
location (+3 minutes close to the quarry, and ranging to -3 minutes in Eastern Grantham); and
GRANTHAM FLOODS COMMISSION OF INQUIRY EXPERT HYDROLOGY REPORT 10 JANUARY 2011 FLOOD CIRCUMSTANCES AND CONTRIBUTING FACTORS
Document No. WS150262 Water Solutions Pty Ltd Revision 0 Page 30 of 301
o the quarry increases the rate of rise in flow depth and intensity by up to 6 minutes per m of flow depth (i.e. 3 minutes per 0.5m) and by up to 6 minutes per m2/s of flow intensity (i.e. 3 minutes per 0.5m2/s).
• Worst Case (greatest delay): o the quarry changes the time of initial inundation by -1 to +4 minutes, depending on
location (+4 minutes close to the quarry, and ranging to -1m in Eastern Grantham); and
o the quarry has little effect on the initial rate of increase of flow depth or intensity (±1 minute) although, as I have noted in Section 10.6, it does result in an accelerated rate of rise of floodwater leading up to the occurrence of inundation and shortly thereafter at near 25 Quarry Access Road.
Conclusions Regarding the Grantham Quarry
44. From the above, I consider that it is most likely that the primary effect of the presence of the quarry has been to delay the time of inundation of the Grantham area. However, the magnitude of this delay is marginal (between 1 and 3 minutes), when compared with the No Quarry scenario that has the flow hydrograph moving through the same area now occupied by the pit. I consider that the primary reason for this delay is due to the time it takes to fill the quarry pit by floodwater inflows.
45. My sensitivity assessment of Worst Case (greatest drop) conditions has indicated that it is possible to create simulated circumstances where the presence of the quarry is shown to bring forward the time of initial inundation by a small amount (by up to 3 minutes) when compared to the No Quarry scenario. I consider that the primary reason for this is because of the shorter time taken for flows to traverse a flooded pit under Worst Case conditions, than otherwise for over farmland under No Quarry conditions. This is because flows through a flooded pit effectively see a smoother bed surface than what they would over farmland, making it quicker to traverse the pit.
46. However, it is also my opinion that, the Worst Case scenarios are unrealistic because of the underlying assumptions that I have applied. Specifically, it assumes that:
• when failure is initiated, the levee embankments all fail in unison. This is unrealistic because it assumes the Western Levee is all the same height, and constructed in with the same geometry and material, which is different to Mr Starr’s opinion, and the LIDAR survey of August 2010;
• levee failure to the observed post-flood surface (January 2011) happens over 5 seconds, including to the full extent of the Main Breach erosion. This is unrealistic because the amount of material removed from the Western Levee is more consistent with a 10 minute breach as I discuss in Section 10.5 above.
• in the case of the Worst Case (greatest delay) scenario, a levee height to 126.4mAHD is much higher than contained in Mr Starr’s opinion;
• an initial pit lake level to full capacity would have required an additional 2m of rainfall to have fallen at the quarry on, or within a few days prior to, the 10th January 2011 flood.
47. I recommend that the unrealistic nature of the Worst Case scenario should be kept in mind when considering simulation outcomes.

GRANTHAM FLOODS COMMISSION OF INQUIRY EXPERT HYDROLOGY REPORT 10 JANUARY 2011 FLOOD CIRCUMSTANCES AND CONTRIBUTING FACTORS
Document No. WS150262 Water Solutions Pty Ltd Revision 0 Page 31 of 301
48. As to the breaches of the Western Levee I have observed six primary distinct areas of erosion that have combined during the course of the flood event to form three breaches into the pit on the Western Levee:
• Main Breach – approximately 60m wide at the northern end;
• Central Breach – approximately 190m wide centrally located; and
• Southern Breach – approximately 80m wide towards the southern end.
49. These breaches total in length to 330m. I have formed the view that the Western Levee:
• allowed flood flows into the pit upon breach initiation; and
• retained and delayed the progression of the flow hydrograph up until breach initiation.
50. I hold this view because:
• the pit is located immediately downstream from the Western Levee and floodwater passes into the pit when it breaches; and
• while intact, the Western Levee restricts flows within the Lockyer Creek floodplain causing increased flood levels and retention of additional flood water upstream of the levee, thereby delaying the passage of this water further downstream.
51. The effect of the breaches on flood characteristics is demonstrated by the Most Likely and Worst Case scenarios with an effect on the timing of initial inundation. At near 25 Quarry Access Road the delay in the breaching occurrence produces a small delay of 3 to 4 minutes, and in Eastern, Western and Central Grantham it brings forward the time of inundation by up to 3 minutes.
Grantham Railway Embankment
52. Grantham is divided by a railway that runs east-west through the town. This railway is elevated above natural ground level by an embankment that extends up to a maximum of approximately 2m in height. The railway crosses Sandy Creek that also passes through the centre of the town. An underpass at the railway crossing of Sandy Creek provides the only vehicle and pedestrian connection between the north and south of Grantham.
53. I have prepared a locality map that highlights the location of the railway and Sandy Creek crossing, Figure 1.10. The natural floodplain of Sandy Creek extends to the north of the railway as indicated in the figure.

GRANTHAM FLOODS COMMISSION OF INQUIRY EXPERT HYDROLOGY REPORT 10 JANUARY 2011 FLOOD CIRCUMSTANCES AND CONTRIBUTING FACTORS
Document No. WS150262 Water Solutions Pty Ltd Revision 0 Page 32 of 301
Figure 1.10 – Grantham Railway Embankment Locality
54. I have considered the effect that this raised railway embankment is likely to have had on the Grantham flooding by making a comparison between simulated flow intensity under the two scenarios of:
• the Most Likely case, as discussed above; and
• the Most Likely case, but with the railway embankment removed (No Railway case).
55. For the No Railway case I have removed the railway embankment by determining the natural ground levels across the width of the railway corridor. The natural ground levels were determined from topography provided by LVRC. Details of this determination are presented in Appendix B.8.
56. Based on my comparison of these cases, I consider that the effect of the railway embankment on flood characteristics would be to intercept the flow of inundating floodwaters that would otherwise have moved unrestricted into the Sandy Creek floodplain area to the north of the embankment. I have formed the view that the result of this interception was to intensify the action of flood flows within Western Grantham by:
• directing incoming flood flows from both the South-Western Overbank flow path and the Western Overbank flow path to an easterly direction, but at a greater depth and flow intensity than would otherwise have been the case had the embankment not been there; and
• creating a concentration of flood flow to the northern side of the embankment at the location of the Sandy Creek rail bridge crossing.
57. My assessment has concluded that the railway embankment increased peak flood flow intensities through Western Grantham and Central Grantham to the west of Sandy Creek. The magnitude of the increase in flow intensity is relatively consistent throughout this area, typically by around an additional 0.5m2/s. Closer to the western side of Sandy Creek near the rail bridge this increase becomes substantial, ranging up to an additional 2.5m2/s. Further details are contained in Section 11.
R
a
i
l
w
a
y
E
m
b
a
n
k
m
e
n
t
G
a
t
t
o
n
-
H
e
l
i
d
o
n
R
o
a
d
S
a
n
d
y
C
r
e
e
k
L
o
c
k
y
e
r
C
r
e
e
k
Quarry Access Road Causeway
Grantham Quarry
Western Levee
Railway Bridge
Sandy Creek Floodplain
Western Grantham
Central Grantham
Eastern Grantham
GRANTHAM FLOODS COMMISSION OF INQUIRY EXPERT HYDROLOGY REPORT 10 JANUARY 2011 FLOOD CIRCUMSTANCES AND CONTRIBUTING FACTORS
Document No. WS150262 Water Solutions Pty Ltd Revision 0 Page 33 of 301
Debris and Sediment Loads
58. I have also considered the impact of debris loads that I expect would have been carried by the floodwater as well as the impact of possible sand and sediment deposits in the bed of Lockyer Creek prior to the flood.
59. In my opinion, the presence of relatively high debris loads in floodwater typically results in its accumulation on houses and other structures such as bridges. These accumulations increase the drag and impact loading on those structures.
60. To affect flood flows debris has to either:
• have sufficient concentration in the flow to introduce additional frictional and / or momentum losses; or
• collect sufficiently against objects protruding out of the flow in such a way as to restrict the flow through obstruction; such as against buildings, bridges and fences, but over sufficient width of flow so as to make a significant effect.
61. The intensity of water flow during the flooding in Grantham was significant. Even without debris loading I consider that much of the observed damage would have still occurred. I consider that the presence of the debris would have therefore contributed to increased damages to structures, but not been the cause.
62. In forming this view, I have considered eye-witness accounts that include reference to debris as well as photographs and videos of debris accumulations on structures (including, but not limited to, Kapernick’s Bridge) during the course of the flood in Grantham. From my review of this material, I have also formed the opinion that debris accumulations would not have been sufficient to affect the net depth, intensity or timing of the flooding in Grantham.
63. Finally, I have considered the possibility of the presence of sand and sediment deposits in the bed of Lockyer Creek at the Grantham Quarry and its likely effect on the flow capacity of the creek. From my review of January 2011 aerial photographs of the area (provided by LVRC), I observed a considerable amount of scour to the bed and banks of Lockyer Creek at the location of the quarry. As the quantity of scour was substantial, it is my opinion that any such deposits of sand and sediments that may have been present in Lockyer Creek prior to the flood would have been cleaned away without any effect on the flow capacity of the creek.
Upstream Overbank Storage of Floodwater
64. As I have indicated above, under Most Likely scenario conditions, the presence of the Grantham Quarry is likely to have resulted in peak flood levels immediately upstream from the Western Levee of the quarry being higher (about 0.2m) than what it would have been under No Quarry conditions. In my opinion, this is because the presence of the Western Levee tends to temporarily constrict floodplain flows as opposed to the No Quarry scenario that has no such constriction. This increase in flood level is observed at its highest immediately upstream of the quarry and diminishes in the upstream direction such that by Kapernick’s Bridge no increase is observed.
65. Further in my opinion, raised flood heights typically result in increased volumes of floodwater stored on floodplains. For the Most Likely scenario, I have estimated the maximum amount of floodwater that was simulated to have been stored between the Western Levee of the quarry and Kapernick’s Bridge as 6.3GL (or about 60% of the volume of the flow hydrograph to peak). Of

GRANTHAM FLOODS COMMISSION OF INQUIRY EXPERT HYDROLOGY REPORT 10 JANUARY 2011 FLOOD CIRCUMSTANCES AND CONTRIBUTING FACTORS
Document No. WS150262 Water Solutions Pty Ltd Revision 0 Page 34 of 301
this volume, I estimate that approximately 4.7GL is storage in the floodplain areas (or about 45% of the volume of the flow hydrograph to peak).
66. In his statement to the GFCOI, Mr Sippel has observed what I consider to be a hydraulic phenomenon occurring in an inundated oval shaped area located immediately to the west of the quarry. He referred to it as a “sea of water” and marked it on a locality diagram as “Water Pooling”. He also referred to water accumulating up to the bridge at Dinner Corner. For ease of reference, a copy of Mr Sippel’s locality diagram is provided in Figure 1.11 below.
Figure 1.11 – Locality Map, Sippel 2015 LS-4
67. Further, in a report prepared by DHI for Nationwide News Pty Ltd entitled Grantham and Wagner Quarry, Review of Flood Impact 10th January 2011 Flood Event, February 2015 (Szylkarski 2015), there is a figure that also shows this inundated area (Figure 4, DHI) in the foreground.
68. I have investigated the likely significance of this stored floodwater on the flooding Grantham, and in particular in connection with the breaching of the Western Levee of the Grantham Quarry. My conclusions are:
• the volume of floodwater stored in the “oval” area was likely to have been relatively small (a maximum of about 3% (0.7GL) of the flow hydrograph to peak, compared to 60% for the waterway from upstream of the Western Levee at the Grantham Quarry to Kapernick’s Bridge);
• outflow rates from this area back into Lockyer Creek are controlled by:
o the difference in the water level between the “oval” and the adjacent Lockyer Creek;
o the available waterway area through which it must flow; and
o bottom friction (hydraulic roughness).
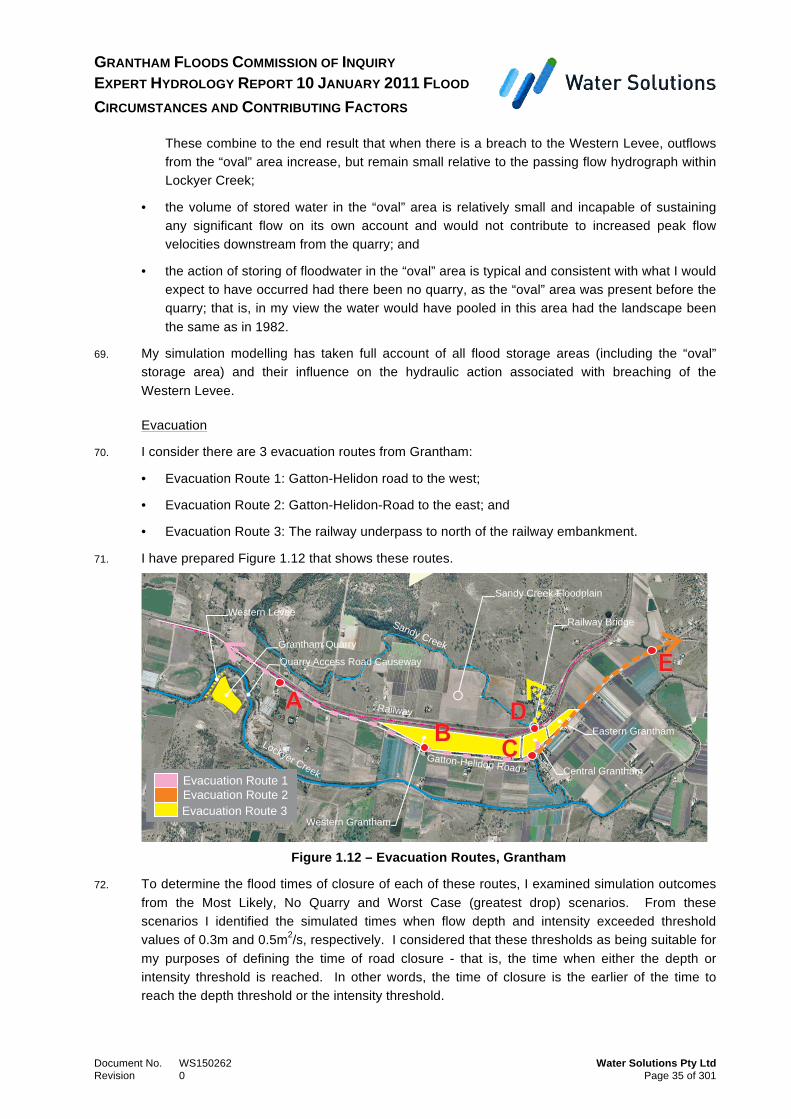
GRANTHAM FLOODS COMMISSION OF INQUIRY EXPERT HYDROLOGY REPORT 10 JANUARY 2011 FLOOD CIRCUMSTANCES AND CONTRIBUTING FACTORS
Document No. WS150262 Water Solutions Pty Ltd Revision 0 Page 35 of 301
These combine to the end result that when there is a breach to the Western Levee, outflows from the “oval” area increase, but remain small relative to the passing flow hydrograph within Lockyer Creek;
• the volume of stored water in the “oval” area is relatively small and incapable of sustaining any significant flow on its own account and would not contribute to increased peak flow velocities downstream from the quarry; and
• the action of storing of floodwater in the “oval” area is typical and consistent with what I would expect to have occurred had there been no quarry, as the “oval” area was present before the quarry; that is, in my view the water would have pooled in this area had the landscape been the same as in 1982.
69. My simulation modelling has taken full account of all flood storage areas (including the “oval” storage area) and their influence on the hydraulic action associated with breaching of the Western Levee.
Evacuation
70. I consider there are 3 evacuation routes from Grantham:
• Evacuation Route 1: Gatton-Helidon road to the west;
• Evacuation Route 2: Gatton-Helidon-Road to the east; and
• Evacuation Route 3: The railway underpass to north of the railway embankment.
71. I have prepared Figure 1.12 that shows these routes.
Figure 1.12 – Evacuation Routes, Grantham
72. To determine the flood times of closure of each of these routes, I examined simulation outcomes from the Most Likely, No Quarry and Worst Case (greatest drop) scenarios. From these scenarios I identified the simulated times when flow depth and intensity exceeded threshold values of 0.3m and 0.5m2/s, respectively. I considered that these thresholds as being suitable for my purposes of defining the time of road closure - that is, the time when either the depth or intensity threshold is reached. In other words, the time of closure is the earlier of the time to reach the depth threshold or the intensity threshold.
R
a
i
l
w
a
y
G
a
t
t
o
n
-
H
e
l
i
d
o
n
R
o
a
d
S
a
n
d
y
C
r
e
e
k
L
o
c
k
y
e
r
C
r
e
e
k
Quarry Access Road Causeway
Grantham Quarry
Western Levee
Railway Bridge
Sandy Creek Floodplain
Western Grantham
Central Grantham
Eastern Grantham
Evacuation Route 1
Evacuation Route 2
Evacuation Route 3
A B CDE
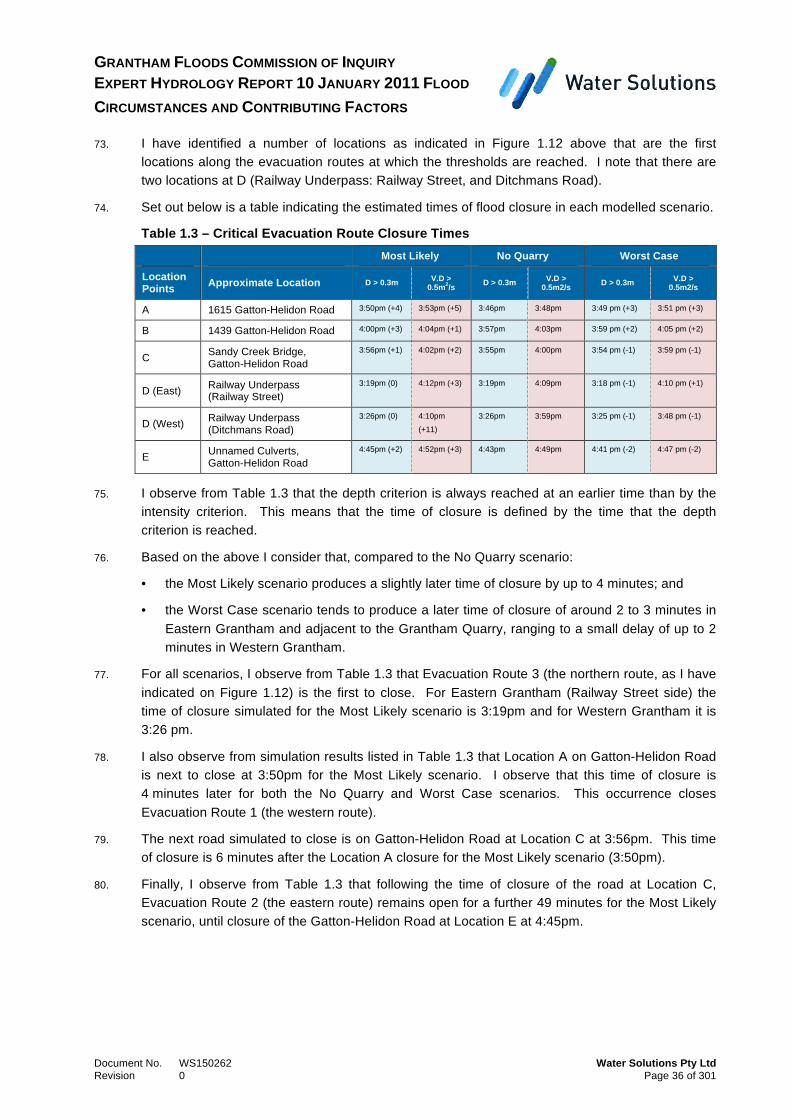
GRANTHAM FLOODS COMMISSION OF INQUIRY EXPERT HYDROLOGY REPORT 10 JANUARY 2011 FLOOD CIRCUMSTANCES AND CONTRIBUTING FACTORS
Document No. WS150262 Water Solutions Pty Ltd Revision 0 Page 36 of 301
73. I have identified a number of locations as indicated in Figure 1.12 above that are the first locations along the evacuation routes at which the thresholds are reached. I note that there are two locations at D (Railway Underpass: Railway Street, and Ditchmans Road).
74. Set out below is a table indicating the estimated times of flood closure in each modelled scenario.
Table 1.3 – Critical Evacuation Route Closure Times
Most Likely No Quarry Worst Case
Location Points Approximate Location D > 0.3m V.D >
0.5m2/s D > 0.3m V.D > 0.5m2/s D > 0.3m V.D >
0.5m2/s
A 1615 Gatton-Helidon Road 3:50pm (+4) 3:53pm (+5) 3:46pm 3:48pm 3:49 pm (+3) 3:51 pm (+3)
B 1439 Gatton-Helidon Road 4:00pm (+3) 4:04pm (+1) 3:57pm 4:03pm 3:59 pm (+2) 4:05 pm (+2)
C Sandy Creek Bridge, Gatton-Helidon Road
3:56pm (+1) 4:02pm (+2) 3:55pm 4:00pm 3:54 pm (-1) 3:59 pm (-1)
D (East) Railway Underpass (Railway Street)
3:19pm (0) 4:12pm (+3) 3:19pm 4:09pm 3:18 pm (-1) 4:10 pm (+1)
D (West) Railway Underpass (Ditchmans Road)
3:26pm (0) 4:10pm
(+11)
3:26pm 3:59pm 3:25 pm (-1) 3:48 pm (-1)
E Unnamed Culverts, Gatton-Helidon Road
4:45pm (+2) 4:52pm (+3) 4:43pm 4:49pm 4:41 pm (-2) 4:47 pm (-2)
75. I observe from Table 1.3 that the depth criterion is always reached at an earlier time than by the intensity criterion. This means that the time of closure is defined by the time that the depth criterion is reached.
76. Based on the above I consider that, compared to the No Quarry scenario:
• the Most Likely scenario produces a slightly later time of closure by up to 4 minutes; and
• the Worst Case scenario tends to produce a later time of closure of around 2 to 3 minutes in Eastern Grantham and adjacent to the Grantham Quarry, ranging to a small delay of up to 2 minutes in Western Grantham.
77. For all scenarios, I observe from Table 1.3 that Evacuation Route 3 (the northern route, as I have indicated on Figure 1.12) is the first to close. For Eastern Grantham (Railway Street side) the time of closure simulated for the Most Likely scenario is 3:19pm and for Western Grantham it is 3:26 pm.
78. I also observe from simulation results listed in Table 1.3 that Location A on Gatton-Helidon Road is next to close at 3:50pm for the Most Likely scenario. I observe that this time of closure is 4 minutes later for both the No Quarry and Worst Case scenarios. This occurrence closes Evacuation Route 1 (the western route).
79. The next road simulated to close is on Gatton-Helidon Road at Location C at 3:56pm. This time of closure is 6 minutes after the Location A closure for the Most Likely scenario (3:50pm).
80. Finally, I observe from Table 1.3 that following the time of closure of the road at Location C, Evacuation Route 2 (the eastern route) remains open for a further 49 minutes for the Most Likely scenario, until closure of the Gatton-Helidon Road at Location E at 4:45pm.

GRANTHAM FLOODS COMMISSION OF INQUIRY EXPERT HYDROLOGY REPORT 10 JANUARY 2011 FLOOD CIRCUMSTANCES AND CONTRIBUTING FACTORS
Document No. WS150262 Water Solutions Pty Ltd Revision 0 Page 37 of 301
81. My conclusions are consistent with the eye-witness statement of Mr Steffens (2015) who provided a series of time-stamped photographs that he took using the camera in his mobile phone along with location and direction of view, as follows:
• at 3:53pm, the Gatton-Helidon Road near Armstrong Road, approaching Anzac Avenue was not inundated (Photo 0316), consistent with Most Likely simulation outcomes;
• at 3:56pm, the Gatton-Helidon Road bridge crossing of Sandy Creek had flooded over the road (Photo 0319), consistent with Most Likely simulation outcomes;
• at 3:58pm, the Gatton-Helidon Road past Citrus and approaching Sorrensen Street, Photo 0320 shows that floodwater inundation was up high against the southern side of the road (I am unable to discern the height of the water from the photograph), consistent with Most Likely simulation outcomes;
• at 4:10pm, the Gatton-Helidon Road near the intersection of Dorrs Road (Photo 0323) has been completely inundated, once again consistent with Most Likely simulation outcomes.
82. Mr Steffens’ observations are consistent with my assessment of the sequence of time of road closure along the Gatton-Helidon Road (depth greater than 0.3m):
• first, Sandy Creek Bridge (simulated at 3:56pm);
• second, near 1615 Gatton-Helidon Road just west of Dorrs road (simulated at 3:50pm); and
• third, near 1439 Gatton-Helidon Road near Sorrensen Street (simulated at 4:00pm).
That is, Mr Steffens drove across the flooded Sandy Creek Bridge, and past Sorrensen Street, but was then unable to proceed past Dorrs Road.
83. Based on my analysis above, my opinion is that the effect of Grantham Quarry is most likely to have resulted in delay to the time of closure of evacuation routes by up to 2 minutes.
84. I trust that my service to the Commission and community of Grantham has satisfied their needs and contributes to the satisfactory conclusion of the Inquiry.