Grain and Feed Annual Egypt 2012
17
THIS REPORT CONTAINS ASSESSMENTS OF COMMODITY AND TRADE ISSUES MADE BY USDA STAFF AND NOT NECESSARILY STATEMENTS OF OFFICIAL U.S. GOVERNMENT POLICY Date: GAIN Report Number: Approved By: Prepared By: Report Highlights: Post forecasts Egyptian wheat imports of only 10 MMT in 2012/13. The drop in imports is based on increased local production and government procurement of the local crop. Post forecasts corn area to increase from 700 TH in MY 2011/12 to reach 750 TH in MY 2012/13. Corn offers better prospects than rice and cotton. MY 2012/13 corn imports are currently forecast at 5.2 MMT with improved prospects for the poultry sector. The March 2012 outbreak of a new strain of FMD virus will likely have only a minor impact on feed demand. Post forecasts harvested area of rice to decline from 700 TH in 2011/12 to 600 TH in 2012/13. With a continued official ban on exports and the importation of long grain rice for the ration card program, farmers are seeing lower prices on the market prior to planting season, despite the substantial contraband exports of rice. Salah Mansour Jonathan P Gressel Wheat and Corn Production on the Rise Grain and Feed Annual Egypt 4/2/2012 Required Report - public distribution
description
THIS REPORT CONTAINS ASSESSMENTS OF COMMODITY AND TRADE ISSUES MADE BY USDA STAFF AND NOT NECESSARILY STATEMENTS OF OFFICIAL U.S. GOVERNMENT POLICY
Transcript of Grain and Feed Annual Egypt 2012

THIS REPORT CONTAINS ASSESSMENTS OF COMMODITY AND TRADE ISSUES MADE BY
USDA STAFF AND NOT NECESSARILY STATEMENTS OF OFFICIAL U.S. GOVERNMENT
POLICY
Date:
GAIN Report Number:
Approved By:
Prepared By:
Report Highlights:
Post forecasts Egyptian wheat imports of only 10 MMT in 2012/13. The drop in imports is based on
increased local production and government procurement of the local crop. Post forecasts corn area to
increase from 700 TH in MY 2011/12 to reach 750 TH in MY 2012/13. Corn offers better prospects
than rice and cotton. MY 2012/13 corn imports are currently forecast at 5.2 MMT with improved
prospects for the poultry sector. The March 2012 outbreak of a new strain of FMD virus will likely
have only a minor impact on feed demand. Post forecasts harvested area of rice to decline from 700 TH
in 2011/12 to 600 TH in 2012/13. With a continued official ban on exports and the importation of long
grain rice for the ration card program, farmers are seeing lower prices on the market prior to planting
season, despite the substantial contraband exports of rice.
Salah Mansour
Jonathan P Gressel
Wheat and Corn Production on the Rise
Grain and Feed Annual
Egypt
4/2/2012
Required Report - public distribution

Executive Summary:
Egyptian wheat imports are forecast to be around 10 MMT in 2012/13 compared to 10.3 MMT in MY
2011/12, with GASC projected to import nearly 6.0 MMT, and the rest to be imported by the private
sector. GASC has about 3.0 MMT of stocks, 4-5 months consumption of subsidized “baladi” bread.
Although Egypt has purchased its requirements for MY 2011/12, GASC may enter the market again to
buy about 500 TMT before the end of the fiscal year due to relatively affordable prices. The primary
restraint on further purchases will be the Government of Egypt‟s worsening financial situation. The
previously announced wheat procurement price for MY 2012/13 is equivalent to $419/MT, significantly
above current international prices. Farmers responded by increased planting and will likely permit the
government to reach their procurement target of 3.0 MMT. In addition to subsidizing vegetable oils,
rice, and sugar under the ration card system, the government has increased its subsidy allocation for
baladi bread to about $2.45 billion.
Due to the increase in rice and cotton area in MY 2011/12, a significant decrease in the area of corn
planted occurred. Post expects an increase in corn acreage from 700 TH in MY 2011/12 to reach 750
TH in MY 2012/13. Many farmers are expected to switch from rice to corn in MY 2012/13. Corn feed
consumption is estimated to be 9.0 MMT in MY 2012/13 as the year before. Total corn consumption
decreased sharply in MY 2011/12 compared to the previous year. Total corn imports for MY 2011/12
was 5.0 MMT, significantly less than the prior year (5.8 MMT), but expected to be partially recovered
in MY 2012/13 to about 5.2 MMT. The Ukraine has made substantial inroads in what has long been a
U.S. market as U.S. prices have not been competitive. Egypt has also been importing increased
amounts of U.S. DDGS and corn gluten meal due to the marketing efforts of U.S. Grains Council.
Water shortages have forced the GOE to restrict the area of rice at around 450 TH, but the area of rice
increased sharply from 450 TH in MY 2010/11 to about 700 TH in 2011/12 with the lack of security
presence in rural areas following the January 25 Revolution. Planted area is forecast to decrease to 600
TH in 2012/13. The sharp increase in MY 2011/12 was due to the high profitability of rice, but paddy
prices are down entering the 2012 planting season and we expected farmers to respond accordingly. In
October 2010, Egypt banned rice exports as the result of smaller production and an increase of local
consumption as the population increase by about 2.0 million/year. Rice prices remained relatively high
in the domestic market as traders either held onto stocks or used various methods to export to their
traditional markets in the region. In response, GASC purchase imported long grain rice for the first time
ever to supply the ration card program. Two tenders have been conducted one in December 2011 and
the other in March 2012. India, Pakistan, Vietnam, and Thailand were the main sources for the imported
long grain rice. After conducting an expected third tender in June 2012 and with a new government
likely in place by July, the GOE may allow rice exports beginning as early as August 2012. A change
in policy is not reflected in Post‟s MY 2012 /13 export forecast, which only reflects contraband exports.

Commodities:
Production:
Wheat is planted in October/November and harvested in April/May. Egyptian wheat can be classified as
semi-hard wheat. The moisture percent in the Egyptian wheat ranges between 9-10%, but it has at least
11.5% protein, and 25% -26% gluten index. Ministry of Agriculture experts estimate that planted area
in MY 2011/12 increased slightly compared to MY 2010/11 due to the increase of announced
procurement prices. Due to the high procurement prices offered to the farmers this year, it is expected
that the area cultivated with wheat in MY 2012/13 will increase again to be 1,350 TH compared to
1,280 TH in MY 2011/12. According to the government official statistics, wheat production has
increased significantly from 7.2 MMT in MY 2010/11 to about 8.4 MMT in MY 2011/12 due to the
good weather conditions in the past year. However, many experts, traders, and experts believe that this
production figure is overestimated and the actual production doesn‟t exceed 7 MMT. Production for
MY 2012/13 is estimated to be around 8.5 MMT given the good weather conditions this year.
The government has announced the procurement price for MY 2011/12 crop at LE 380 /ardeb ($1 =
$6.05). This is equivalent to LE 2,535/ton or $419/ton, which is higher than last year‟s price by about
8.5% and higher than the current world price by about one-third. Last year‟s procurement price was LE
350 /ardeb. This is equivalent to LE 2,335/ton or $386/ton.
Although the wheat procurement prices are higher than the international prices, the GOE has continued
to increase the price in order to encourage farmers to increase the area cultivated with wheat. Farmers
would like to increase their production of wheat but the cost of production including seeds, pesticides,
fertilizers, and the wage rate is high. Some of the fertilizers and most of the pesticides are imported
therefore international prices fluctuations affect wheat production costs. Fertilizers prices were doubled
in one year. Expansion in the wheat areas would come on the account of other important winter crops
for the farmer, mainly the clover (berseem) and vegetable crops. Farmers would like to implement new
technology and adopt improved production practices but the cost for such new technologies is high.
They cannot afford to utilize these improved inputs and services given their low purchasing power and
the increase of cost of living which don‟t allow them to have extra money to spend on these new
technologies and practices.
Egypt is facing a shortage in registered high yielding wheat seeds because the Central Administration
for Seed Production (CASP) is usually late in its production and don‟t have the enough resources and
land to produce enough wheat seed. The Ministry has pledged to provide 35- 40% of the total seeds
needed. Sixty percent of wheat area uses seeds from their stock of last year‟s crop. One acre uses about
70 kilos of seeds, which cost about LE 250 ($41/acre).
GASC has a target to purchase 3.0 million MT of local wheat in MY 2012/13. The total quantity of
locally produced wheat sold to the Ministry of Supply and Internal Trade in MY 2011/12 was estimated
at 2.6 MMT, compared to 2.1 MMT in MY 2010/11. The balance of locally produced wheat was either
sold directly to local traders or was kept by farmers either for their own use for milling and bread baking
or was utilized as feed for their livestock as needed.
Consumption:
Wheat

The Egyptian milling industry consists of public and private sector mills. The public sector capacity
represents about 52% of the total milling capacity in Egypt while the private sector owns about 48% of
the milling capacity. About 70% of the production of 82% flour is produced by the public sector mills
and 30% are produced by the private sector.
The public sector milling industry consists of 126 mills (mostly small or medium size), in which 109
mills are currently used for the production of 82 percent flour, 10 mills for the production of 76 percent
flour, and 7 mills are utilized to produce 72 percent flour. All these mills are affiliated with one holding
company (Holding Company for Food Industries). Given that wheat is a strategic commodity in Egypt,
the government is expected to retain control of most of the milling capacity for subsidized Baladi bread.
There are seven public sector companies that operate these mills. In MY 2011/12, the public sector
utilized 5.67 MMT of wheat to produce 82 percent flour, 0.6 MMT to produce 76 percent flour and 0.5
MMT to produce 72 percent flour with total of 6.77 MMT. About 7 percent of the capacity of the public
sector mills that produces 72 percent flour is leased by the private sector against LE 90/ton ($15/ton) of
wheat.
There are nearly 105 private sector commercial mills, with total capacity of 25,000 tons per day or about
9 MMT/year. These mills are working at only 60% of their capacities while they have 40% of excess
capacity. There are many new private sector flour mills are established throughout Egypt. In MY
2010/11, the private sector utilized 2.43 MMT of wheat to produce 82% flour, 1.7 MMT to produce
76% flour (milled by the private sector and handled to the public sector companies against a milling
fee), and 2.34 MMT to produce 72% flour with a total production of 6.47 MMT of wheat. Although
most of the private sector milling capacity is allocated to produce 72 percent flour, part of its capacity is
leased to the public sector mills to produce 82 percent flour against a fee of LE 112/ton ($18.5/ton).
Shares in some of the public sector companies have been sold to private investors over the past few
years. Although the majority of shares are held by the private sector, the holding company maintains
complete control of these mills. The following table shows the flour production in MY 2010/11
classified between public and private sector:
Public
And
Private
sectors
Wheat (MMT) for
82% extraction rate
(subsidized bread)
Wheat (MMT) for
76% extraction rate
(semi-subsidized
bread)
Wheat (MMT) for
72% extraction
rate (free market
flour)
Wheat
(MMT)
total
Public
sector
Quantity
(MMT)
5.67 0.6 0.5 6.77
% 84% 9% 7%) 100%
Private
sector
Quantity
(MMT)
2.43 1.7 2.3 6.43
% 38% 26% 36% 100%
Total Quantity
(MMT)
8.1 2.3 2.8 13.2
% of
Public to
private
70% 26% 18%
The public sector mills produce three types of flour: 82 percent is utilized for fully subsidized bread, 76
percent for semi-subsidized bread called Tabaki, and 72 percent flour for white high quality flat bread
and European type bread, biscuits, pastries and pasta.

The part of the imported wheat that is utilized for producing 82 percent flour is handled by the public
sector mills that sell it to the bakeries against a subsidized price of LE 160/ton ($27/ton). This flour is
sold on the black market at about LE 1,900/ton ($314/ton). It is estimated that at least 30% of the 82%
flour is not baked but sold by the bakeries in the black market. The 76 percent flour is produced through
tenders that is hold by GASC , one every three months with about 325 TMT of flour each time where
the private sector - as well as the public sector mills- participates in these tenders to provide the public
sector with the flour. The cost of producing one ton is about LE 3,000 ($496/ton), in which the mill get
paid LE 900/ ton ($152/ton) by the bakeries and the rest LE 2,100/ton ($347/ton) is paid by GASC. The
black market price for 76% flour is about LE 1,200/ton ($198/ton). Many bakeries prefer to sell the
76% flour in the black market rather than producing bread. The 72 percent flour sells freely at about LE
4,000/ton ($660/ton). The bran is sold by the government for the Baladi bread at $1,250/ton ($207/ton)
but the free market price is bout LE 1,500/ton ($248/ton). Small farmers mill their wheat at the village
mills against LE 85/ton ($14/ton). GASC and the Holding Company for Food Industries bought about
400 TMT in MY 2010/11 of imported wheat on the local market in Egyptian pounds through tenders.
This part is used by the public sector mills for the production of 72% flour.
Wheat is viewed as a strategic commodity and considered a main ingredient in the Egyptian diet;
therefore the consumers have no other choice except consuming the bread since it is still the cheapest
food. Consumption of wheat is increasing as a result of the annual population increase approaches 2.0
million/year. Egypt continues to have one of the highest wheat per capita consumption levels in the
world. Post forecasts that wheat consumption in MY 2011/12 is estimated to be 18.8 MMT. It is
estimated that subsidized baladi bread production reaches 80 billion loaves per year produced by about
19,000 baladi bakeries with a per capita consumption of about 1,000 loaves / person/ year or 2.7 loaf/
person/ day. Each bakery serves about 4,000 people. The number of bakeries that produce semi-
subsidized Tabaki bread (made of 76% flour) is about 4,000 bakeries. There are about 2,000 bakeries
that produce unsubsidized bread made of 72% flour.
The public sector produces three types of bread: fully subsidized bread made out of 82% flour, sells at
LE 0.05/loaf of 130 grams, Tabaki bread made of 76% flour, sells at LE 0.10 for 85 grams per loaf and
LE 0.20/loaf for 160 grams per loaf, and white bread made out of 72% flour and sells at LE 0.25-
0.75/loaf depending on the weight and size. About 66% of the bread produced in Egypt is subsidized
baladi bread made out of 82 percent flour, 19% is Tabaki semi-subsidized bread made out of 76 percent
flour, and 15 percent of the bread is white unsubsidized bread made out of 72 percent flour. The prices
of 72% flour utilized also for pasta, biscuits, cookies, and the food industry has increased. Egypt
produces about 650 TMT of 72% flour annually used for Pasta, 400 TMT for biscuits, confectionary,
and cookies. Many private sector flour mills as well as pasta factories are under construction and there
is one factory for noodles and expected 2-3 others under construction.
The total subsidy allocated for GASC was estimated to be about LE 33 billion ($5.45 billion) in FY
2010/11 which has ended in June 30th
, 2011. Although the official numbers haven‟t been announced , it
is expected that this amount will increase in FY 2011/12and FY 2012/13. The state finances have come
under pressure from sharp drop in economic growth after a popular rising unseated the country‟s
president in February 2011, in which baladi bread share was about 45% and the rest goes to rice,
vegetable oils and sugar subsidy under the ration card system. This budget is higher than the budget of
the year before by about $1.2 billion.

Due to the unrest and current political and economic situation, the GOE is not in a position to search for
other alternatives for the current subsidy system for bread or the other commodities under the ration
card program. The subsidized baladi bread is sold to anyone in the country, but the ration card
commodities are distributed only for the registered 64 million citizens representing 12.5 million
families. The government is not increasing the production of 82% and 76% flour utilized for baladi and
Tabaki bread and the private sector is now playing an increasing role in producing the unsubsidized
bread made out of 72% flour.
The current flour distribution and bread making system has numerous shortcomings which result in loss,
waste, and misuse of the subsidies. Losses occurred during harvesting, transportation, storage, milling,
distribution of wheat and flour, baking, and consumption of bread show that there are losses at all
stages. Thefts are also an important source of such losses. The low quality of bread is a major source of
increasing such losses because it forces consumers not to consume all the bread they buy. Additionally,
the subsidized flour is sold on the black market to beef and dairy producers since they believe that
adding flour to the feed ration increases milk production. Some traders collect the leftover bread, dry it
and sell it by the kilo. They also collect the low quality bread that is intentionally baked for this purpose
(and is considered within the allowable percentage of bread to be wasted during baking). They sell these
quantities to the poultry, beef, and milk breeders at $0.35/kilo. A study conducted in Egypt showed that
total losses in wheat from harvesting till baking is estimated at 13-15% of the total consumption.
The government has a plan to establish bread complexes to distribute the bread through nearly 7,000
outlets. This project was supposed to be start in 2010 and to be executed gradually starting with the big
cities. The plan was to be implemented by either adding bread production lines to the existing ones or
establishing new big complexes. The locations of these complexes and the time span to complete the
project are not yet determined. According to The Minister of Supply and Internal Trade, 114 locations
were selected for this project with a total area of 246,528 square meters with an average of 2,000-3,000
square meters per bakery to serve 14,000 of the surrounding inhabitants. The current political and
economical situation in Egypt seemed to postpone the continuation of this plan.
Trade:
Egyptian wheat imports are forecast to be around 10 MMT in 2012/13 compared to 10.3 MMT in MY
2011/12, little lower of the year before (10.6 MMT in MY 2010/11). GASC is projected to import
nearly 6.0 MMT, and the rest to be imported by the private sector. In MY 2010/11 GASC imported 6.2
MMT and this MY year they have bought about 5.440 MMT through Feb 2012. It is expected that
imports of wheat in MY 2012/13 will continue at about the same level as in MY 2011/12. GASC and
the Holding Company for Food Industries will continue to purchase imported wheat from the local
market based on its needs for the production of 82 percent flour and on the available storage capacity.
Although Egypt has bought its need for MY 2011/12, GASC may enter the market again to buy about
400 TMT this MY due to relatively favorable prices. This quantity may increase to 500 TMT if there is
enough budget allocation and enough spaces in the warehouses considering the new crop that will start
to be harvested in May. GASC buys mainly through international tenders but in MY 2010/11 it
purchased about 400 TMT locally from private sector importers in local currency. The following table
shows the distribution of these quantities among countries (in 0,000 tons):
Year MY 2009/10 MY 2010/11

Imports from:
U.S. 610 3,781
Others:
Russia 5,882 1,940
Canada 95 405
France 1,435 2,254
Brazil 260
Ukraine 738 263
Turkey 131
Australia 673 803
Germany 186
Argentina 469
Romania 45 63
Bulgaria 13 5
Total for Others 10,065
Others not listed 235 38
Grand Total 10,300 10,280
SOURCE: Office Research
For CY 2011, the following table shows the distribution of the quantities arrived Egypt classified by
countries imported by GASC and the private sector (in 0,000 tons):
Country GASC Private Sector Total
Russia 2,189 1,984 4,173
USA 1,870 923 2,793
France 1,040 13 1,053
Australia 420 336 756
Argentina 315 180 495
Ukraine 288 288
Canada 189 27 216
Brazil 199 199
Romania 189 189
Bulgaria 5 5
Moldavia 3 3
Others 23 23
Total 6,212 3,981 10,193
% 61% 39% 100%
SOURCE: Office Research
The quantities contracted by GASC from September 2011 till the last tender in March 15, 2012 (arrival
is May 1-10) is 4.615 MMT. In the last six month (September 2011- March 12, 2012), the quantities
arrived the Egyptian ports reached 5.7 MMT, in which 3.5 MMT purchased by GASC and the private

sector bought 2.2 MMT. The following table shows the distribution of these shipments among countries
classified into GASC and the private sector:
Wheat shipments arrived to the Egyptian ports (, 000 tons)
(September 2011- March 2012)
Country GASC Private sector Total
Russia 2,945 1,717 4.662
Ukraine 305 295 600
Romania 189 15 204
Australia 123 123
U.S.A. 63 63
Argentina 26 26
Kazakhstan 7 7
Bulgaria 5 5
France 4 4
Total 3,502 2,192 5,694
% 61.5% 38.5% 100%
SOURCE: Office Research
Due to the Russian wheat export ban, the U.S. market share was about 40% in MY 2010/11, but is
expected to total less than 10% in 2011/12. GASC has about 3.0 MMT of stocks, 4-5 months
consumption of subsidized bread. There are no customs duties for wheat and corn, but only about two
percent for port charges.
Both government and private sector buyers generally prefer U.S. wheat. In MY 2010/11 about 63% of
wheat was imported by GASC and the rest 37% was imported by the private sector. However, due to the
higher prices of U.S. wheat and higher freight costs, GASC and the private Egyptian importers
generally purchase lower quality wheat from Black Sea origins, such as Russia and Ukraine.
Stocks:
GASC– under The Ministry of Trade and Industry- tries to maintain a five month supply of strategic
stocks. However, due to limited storage capacity that constrains the government from reaching this
target, the strategic stocks are now redefined to include wheat import purchases in the pipeline, which
usually amounts to about three months of annual consumption. Currently, while GASC may only have
three months reserve in country, it has an additional 2-3 months in the pipe line that is the shipments
that are in port, on the water, and already purchased through GASC tenders. The private sector currently
has two months or more stocks in Egypt also, since they bought heavily this past year, anticipating that
prices would go up further.

The total covered storage capacity for wheat is estimated at one million metric tons, including about
350,000 tons in silos at three different ports, 250,000 tons in inland silos and 400,000 tons in open
storage, mostly in metropolitan areas. In addition to government storage facilities, several private sector
traders and mills currently have their own receiving and storage facilities, estimated at 500,000 tons. In
order to increase the storage capacity, the Ministry of Supply and Internal Trade is adopting a project to
build 50 inland silos each with about 30,000 ton capacities in different locations throughout the country.
It has already built 18 inland silos and encourages the private sector to build silos under the build,
operate, and transfer (B.O.T) system. The Ministry will commit to using 60 percent of each silo‟s
capacity at the prevailing storage fee for five years. The recent unstable political and economical
situation in Egypt has postponed the project.
Marketing:
Marketing and Import Policy:
GASC‟s imposition of a minimum 11.5 percent protein level on all wheat has harmed the marketing
opportunities for U.S. white wheat and French wheat. The requirement makes little sense given that the
wheat is used for baladi (flat) bread.
The current GASC tender requirements includes a requirement that six inspectors ( two from each of the
Ministry of Agriculture Central Administration for Plant Quarantine, Ministry of Trade and Industry,
and Ministry of Health) travel to the exporting country to inspect the wheat at the port before it is
shipped even though the imported wheat is still being inspected upon arrival. The Central
Administration of Plant Quarantine (CAPQ) argument is that such procedure should facilitate and
accelerates the customs clearance process in Egypt, reduces the possibility of shipments interceptions
from Egypt, and finally the shipments inspected in the port of origin will have the chance to enter Egypt
with only quarantine check.
GASC does not allow countries to export wheat from ports of other countries unless the country of
origin does not have any ports, such as Kazakhstan. There were speculations that Russia could impose
grain export duties later this season. Egypt is opposed to countries using export restrictions on food
commodities, especially wheat, whether in form of duties or an outright export ban. The Ministry of
Supply and Internal Trade has lifted the ban on importing Ukrainian wheat in October 2011. It had been
excluded from tenders last season due to quality problems. GASC prohibits loading of wheat from more
than one port inside an exporting country, but the private sector does not restrict imports in this way.
GASC allows only 55-65,000 MT Panamax shipments. The private sector places no restrictions on
shipment size, accepting smaller quantities.
CAPQ has also requested that imported wheat to be free from Ambrosia weed seeds. USDA and
Animal and Plant Health Inspection Services (APHIS) in cooperation with U.S. Wheat Associates
informed them that no U.S. company can meet this condition due to the integrity and transparency of
USDA Federal Grain Inspection Service (FGIS), and APHIS. APHIS has previously requested that
CAPQ share the pest risk assessment that is the basis of this new request. FAS also informed CAPQ that
without change in this new requirement, U.S. exporters and Egyptian importers incur unacceptable risks
in wheat trade and these risks currently drive up the costs to the Government of Egypt and would
conceivably lead to a disruption of trade.

GASC has an issue with the DON (vomitoxin) spec of 1.25 ppm. Egyptian Organization for
Standardization (EOS) sets standards that GASC follow. The worldwide standard is 2 ppm. Local
wheat is procured by GASC, but does not have to meet the EOS wheat standards.
U.S. Wheat Associates continues to provide trade servicing and quality seminars to Egyptian millers,
wheat buyers, and traders. Although the USDA GSM-102 export credit guarantee program is available
for both public and private sector importers of U.S. agricultural commodities, importers have not used
the program in several years, citing the potential foreign exchange rate risk in the Egyptian market. In
addition, Egyptian banks often do not pass along benefits of the GSM-102 program to importers. The
other reason for GSM-102 not being used is the 50 percent foreign exchange coverage requirement for
opening letters of credit.
In March 2012, Egypt received $400 million of a $1.2 billion credit facility with the International
Islamic Trade Finance Corp. to help fund purchase of fuel and wheat. The allocation for wheat will be
provided to GASC. The loan carries a 3.75% interest rate.

Production, Supply and Demand Data Statistics: Wheat Egypt 2010/2011 2011/2012 2012/2013
Market Year Begin: Jul 2010 Market Year Begin: Jul 2011 Market Year Begin: Jul 2012 USDA Official New Post USDA Official New Post USDA Official New Post
Area Harvested 1,260 1,260 1,320 1,280 1,350 Beginning Stocks 5,596 5,596 5,509 5,509 5,209 Production 7,200 7,200 8,700 8,400 8,500 MY Imports 10,600 10,600 10,500 10,300 10,000 TY Imports 10,600 10,600 10,500 10,300 10,000 TY Imp. from U.S. 3,866 3,866 0 400 800 Total Supply 23,396 23,396 24,709 24,209 23,709 MY Exports 187 187 100 100 100 TY Exports 187 187 100 100 100 Feed and Residual 2,200 2,200 2,500 2,600 2,000 FSI Consumption 15,500 15,500 16,300 16,300 16,700 Total Consumption 17,700 17,700 18,800 18,900 18,700 Ending Stocks 5,509 5,509 5,809 5,209 4,909 Total Distribution 23,396 23,396 24,709 24,209 23,709
1000 HA, 1000 MT, MT/HA
Commodities:
Production:
Corn is planted in May and harvested in August, however some farmers plant it twice a year (March and
July). Due to the increase in rice and cotton area in MY 2011/12, a significant decrease in the area of
corn planted occurred. However, due to problems in marketing the 2011/12 cotton crop and low returns
to farmers as well as low paddy prices, post expects an increase in corn acreage from 700 TH in MY
2011/12 to reach 750 THA in MY 2012/13. Many farmers are expected to switch from rice to corn in
MY 2012/13. Relatively high domestic corn prices are also encouraging corn production. There are
three main summer crops compete for the available cultivable area, namely cotton, corn, and rice.
The area and production of yellow corn represented about 15% of the total corn area and production in
MY 2010/11 and the rest was white corn. In MY 2010/11, area cultivated with white corn was 596 THA
compared to 104 THA for yellow corn and production of white corn was 4.695 MMT compared to 805
TMT for yellow corn. The yield of white corn in MY 2010/11 was slightly higher than the yellow corn
(7.77 ton/HA for yellow corn compared to 7.87 ton/HA for yellow corn). It is expected that the share of
area and production of yellow corn in MY 2012/13 will reach about 18% of the total area and
production of corn.
The area cultivated with Bt corn in MY 2010/11 was about1,700 ha, in which about 1,000 ha was
cultivated in the new project „Toshka” in Southern Egypt and gave almost double yield over the yield of
the conventional hybrid crop. There were 50 tons of Bt seeds imported in MY 2011/12 from South
Africa and about 56 tons imported in MY 2012/13 from the same source. Farmers would like to grow
biotech corn since they know that it gives them higher yields, and uses less fertilizer, pesticides, and
Corn

water but the availability of MON 810 corn seed is still very limited. On March 8, the Minister of
Agriculture ordered a temporary suspension of planting of MON 810 in reaction to false information
circulated on health concerns which has no apparent scientific foundation. In the current political
environment in Egypt, government officials appear particularly sensitive to criticism, even when untrue.
In contrast with wheat and rice, 95% of corn seeds are produced by the private sector, while 5% is
produced by the public sector companies. One acre requires10-12 kilos of seeds for single cross and
over 15 kilos for three way cross. One kilo of seeds cost all the way from LE 20-40/kilo ($3.3-
6.6/kilo). One kilo of Bt corn seeds sells to the farmer at about $8.25.
The procurement price for white corn procured by the Ministry of Supply of corn for MY 2011/12 was
LE 300 /ardeb or LE 2,142/ton equivalent to $354 /ton compared to last year price of LE 250/ardeb or
LE 1,785/ton. Only a small portion of the corn crop is procured by the government, so price is
determined more by the local supply and demand situation and international prices. The quantity that
was delivered to the Ministry of Supply in MY 2011/12 was only 96,000 MT. It is not expected that the
quantity of corn delivered to the government will increase significantly in MY 2012/13 because farmers
prefer to sell it in the free market or keep it for their own use.
Consumption:
Over eighty percent of the local corn crop is utilized for animal feed (mostly consumed on farms) and
the rest- about 1.8 MMT- is used for food purposes (either milled to produce glucose and Fructose or
consumed fresh). Large commercial end-users and feed mills rely on imported yellow corn to meet their
requirements. There is a small, but growing demand for food products containing corn (snack foods)
and corn oil which increase the demand for corn.
Feed consumption is estimated to be 9.0 MMT in MY 2012/13 as the year before. Total corn
consumption decreased sharply in MY 2011/12 compared to the previous year. High beef prices, due to
the spread of diseases, high cost of production, and shortage of supply; and the high poultry prices
resulted from high feed prices and the outbreak of the Avian Influenza (AI) have all contributed in the
reduction of corn consumption. While poultry production is likely to recover in 2012/13, the impact of
the February/March 2012 FMD SAT2 virus outbreak will likely be felt in a substantial, but
manageable loss of young calves, thereby slightly reducing feed demand. The reduced feed demand
will primarily come from the domestic corn crop, as the outbreak is expected to primarily impact small
holders, who often feed their own crop to their animals.
The use of corn for food industries decreased in MY 2011/12 but it is expected to partially recover in
MY 2012/13 as the general political and economical situation is expected to be better. The amount of
white corn utilized in governmental bread production in MY 2011/12 was less than 5% (5% corn to
95% wheat). The quantity of corn utilized for baladi bread has been diminished to only 96 TMT in MY
2011/12. This small amount was delivered to the Ministry of Supply and Internal Trade for the
production of subsidized baladi bread. The announced target of the government is to increase this ratio
to be 20% corn against 80% wheat, but this will not be possible unless a corn dry milling industry
develops to supply high quality corn flour to the baladi bread program. Currently, whole corn is ground
for incorporation in baladi bread flour, and the oil content of the corn has a negative impact on flour
quality. A small amount of white corn is used by farmers in rural areas to make bread.

Local corn prices were up considerably during the unrest MY 2010/11 and MY 2011/12, but as ports
catch up and shipments resume, corn prices are returning to a more normal level. However, the brief
increase in corn prices enticed livestock feeders, not already using U.S. distiller‟s dried grains with
soluble (DDGS), to incorporate the ingredient into their rations. The increase in DDGS suppliers has
improved pricing options and encouraged producers to use U.S. DDGS.
Trade:
Total corn imports for MY 2011/12 was 5.0 MMT, but is expected to recover in MY 2012/13 to about
5.2 MMT due to expected improvements in the poultry sector.
Year MY 2009/10 MY 2010/11
Imports from:
U.S. 2,930 2,930
Others
Argentina 876 1,229
Brazil 2
Ukraine 1,432 842
Russia 30
Hungary 11
Serbia 20
Canada 43
Turkey 8
Romania 11
Total for Others 5,363
Others not listed 1 159
Grand Total 5,364 5,560
SOURCE: Office Research
Imports of yellow corn in CY 2011:
Country Quantity
(,000 tons)
USA 2,728
Ukraine 1,435
Argentina 1,246
Brazil 408
Romania 210
Bulgaria 52
Canada 40
Russia 23
South Africa 19
Croatia 11
Total 6,172

SOURCE: Office Research
From September 1, 2011 through March 12, 2012, the total imports of corn reached 3,819 TMT or about
590 TMT/month. Ukraine has dominated the market during this period with 1.9 MMT followed by the
U.S with 614 TMT, Argentina with 462 TMT, and Russia with 18 TMT. Traditionally, Egypt came to
the U.S. market consistently because of the high quality of U.S. corn and the ability of the U.S. to offer
a reliable supply. U.S. corn consistently passed the tough quality inspections of the Regional
Laboratory for Food and Feed which are required for entry into the country. However, the quality of
Ukrainian corn coming into the market has improved significantly in recent years. With a significant
price and freight advantage, the Ukraine has tended to dominate the market.
Egypt also imports large quantities of Corn Gluten reached 166 TMT in CY 2011. Almost all the
quantities were imported from the U.S. DDGS is also becoming more competitive, as more suppliers
enter the marketplace.
Production, Supply and Demand Data Statistics: Corn Egypt 2010/2011 2011/2012 2012/2013
Market Year Begin: Oct 2010 Market Year Begin: Oct 2011 Market Year Begin: Oct 2012 USDA Official New Post USDA Official New Post USDA Official New Post
Area Harvested 850 850 520 700 750 Beginning Stocks 1,490 1,490 1,280 1,280 970 Production 6,500 6,500 3,800 5,500 5,800 MY Imports 5,803 5,803 6,000 5,000 5,200 TY Imports 5,803 5,803 6,000 5,000 5,200 TY Imp. from U.S. 2,939 2,939 0 1,000 0 Total Supply 13,793 13,793 11,080 11,780 11,970 MY Exports 13 13 10 10 10 TY Exports 13 13 10 10 10 Feed and Residual 10,100 10,100 8,600 9,000 9,000 FSI Consumption 2,400 2,400 1,800 1,800 2,000 Total Consumption 12,500 12,500 10,400 10,800 11,000 Ending Stocks 1,280 1,280 670 970 960 Total Distribution 13,793 13,793 11,080 11,780 11,970
1000 HA, 1000 MT, MT/HA
Commodities:
Production:
Rice area increased sharply from 450 TH in MY 2010/11 to about 700 TH in 2011/12 but is forecast to
decrease to 600 TH in 2012/13. The sharp increase in MY 2011/12 was due to the high profitability of
Rice, Milled

rice and the absence of police presence to enforce planting restrictions following the January 2011
Revolution. While the Ministry of Agriculture and Land Reclamation has updated their estimate of the
area cultivated with rice in MY 2011/12 to about 610 TH (thousand hectare), the Ministry of Irrigation
and Water Resources as well as the traders estimate the rice area was actually about 730 TH. Post
accepts the latter estimate. Reports also indicate that yields were well below normal, resulting in a lower
than earlier forecast rice crop.
Rice is a major summer crop in Egypt, occupying 10-20 percent of Egypt‟s total crop area. The entire
rice crop is irrigated. One acre of rice needs about 70 kilos of seeds. Rice requires a special irrigation
regime and its cultivation is largely restricted to the northern part of the Delta. Rice consumes about
12% of the Nile river water quota of 55 billion cfm. It is often planted on low quality land where the soil
is fairly saline and has varying degrees of productivity. A limited amount of rice is also grown in the
middle Delta. Farmers normally exceed the area targeted by the government for rice cultivation despite
the prospect of fines (LE 600/ feddan) for those who violate their targeted areas. This is due to the much
higher profitability of rice cultivation compared to other traditional summer crops (i.e. corn and cotton)
and the higher potent for exporting the crop. The government is trying to restrict the area of rice and
increase the area of corn to save water, but the breakdown of security following the January 2011
revolution meant that the area restrictions were not enforced. Farmers would like to increase the area
cultivated with rice since it is a relatively profitable cash crop compared to cotton and corn and exports
makes it very desirable crop for the farmer to grow. The restrictions on water use makes the government
restrict the area cultivated with rice and ban its exports to maintain low domestic consumer prices.
Based on last year‟s prices of paddy rice of about $580/MT, farmers switched about 250 TH from corn
to rice. There was no control on water usage and on the cultivated area during the period following the
January 25 Revolution due to a lack of police presence. Since officials did not want to upset the farmers
at that time, fines on the farmers who plant rice in areas that are not supposed to be planted with rice
were lifted. The government announced that it will not allow the rice area to exceed 460 TH in the next
season, but Post expects farmers will react more to paddy prices prior to the planting season as well as
any decision to lift the ban on rice exports. Currently, paddy prices are about $380/MT, which should
discourage planting.
Consumption:
Egypt consumes medium grain rice and rice consumption is relatively constant, as consumers continue
to prefer wheat-based products. In MY 2011/12, the quantity consumed of milled rice was about 4.25
MMT and forecast at 3.5 MMT in 2012/13. Rice stocks in MY 2011/12 are increasing due to the ban
imposed on exports. There is no stock-holding policy, with levels reflecting pipeline supplies. Buyers
tend to avoid holding stocks and push them to the export market.
Under the ration card program, the Ministry of Supply provides 1.5 kg of rice per person per month for
the 63 million ration card holders or a total of about 1.1 million tons per year. GASC previously
procured Egyptian medium grain for the ration card program. There is now a program to substitute
macaroni for rice on the ration cards whenever macaroni prices are lower and rice is not available. In
December, GASC began tendering for imported long grain rice and the rice appears to be accepted by
local consumers.
Trade:
Egypt used to be net rice exporter. There has been a ban on rice exports since March 2008. The
Minister of Trade and Industry has issued a decree on February 2009 to remove the ban on rice exports.
This decree (no.105) permitted Egyptian rice to be exported provided that the exporter delivers through
a tender an amount equal to the exported amount to the Government of Egypt and pays the government
LE 1,000 per MT in export taxes. On October 2010, the Minister issued a decree # 829 completely
banning the exports of rice. Only broken rice is allowed for exportation in the EU and Eastern Europe to
be utilized as food ingredient and to some African countries as direct consumption.
Egypt needs 1.1 MT s of rice a year for its subsidy program, around a quarter of its total consumption of
4.25 MMT. The repeated extension of the export rice ban has meant traders are prevented from selling
the country‟s niche medium-grain rice at higher prices abroad. Farmers are stocking up on the rice as
they want to get higher prices. If they are not going to export then they want the price that is equivalent
to what they would get if they were exporting it. Since the local traders continue to store their rice to
push up prices, two tenders have been conducted one in December 2011 and the other was in March
2012. India, Pakistan, Vietnam, and Thailand were the main sources for the imported long grain rice.
The first tender was for 221 TMT and the second was for 213 TMT. A third tender is expected to be
held in June 2012 before harvesting the new crop in October 2012. The price for the last tender ranged
between $512-529/ton. The price for the local paddy rice is LE 2,300/ton ($380/ton).
Policy:
The goals of Egypt's rice policy are to minimize production of rice to conserve water while also keeping
prices low for consumers. This has resulted in restrictions on rice exports. On October 2010, a
ministerial decree to ban rice exports was issued and rice exports were stopped except for minimal
quantities of broken rice to Europe and some African countries. The decree was extended to October
2012. The export ban forced many countries in the region to source rice from other countries, including
the United States. After conducting the third GASC tender for long grain rice and with the formation
of a new government following Presidential elections in June, the GOE may allow rice exports by
August 2012. Much will depend on the stocks carried out by the traders before the new crop appears in
the local market and given that all the domestic needs are satisfied. For a good explanation of Egypt's
rice policies see: Rice Update _Cairo_Egypt_6-29-2010
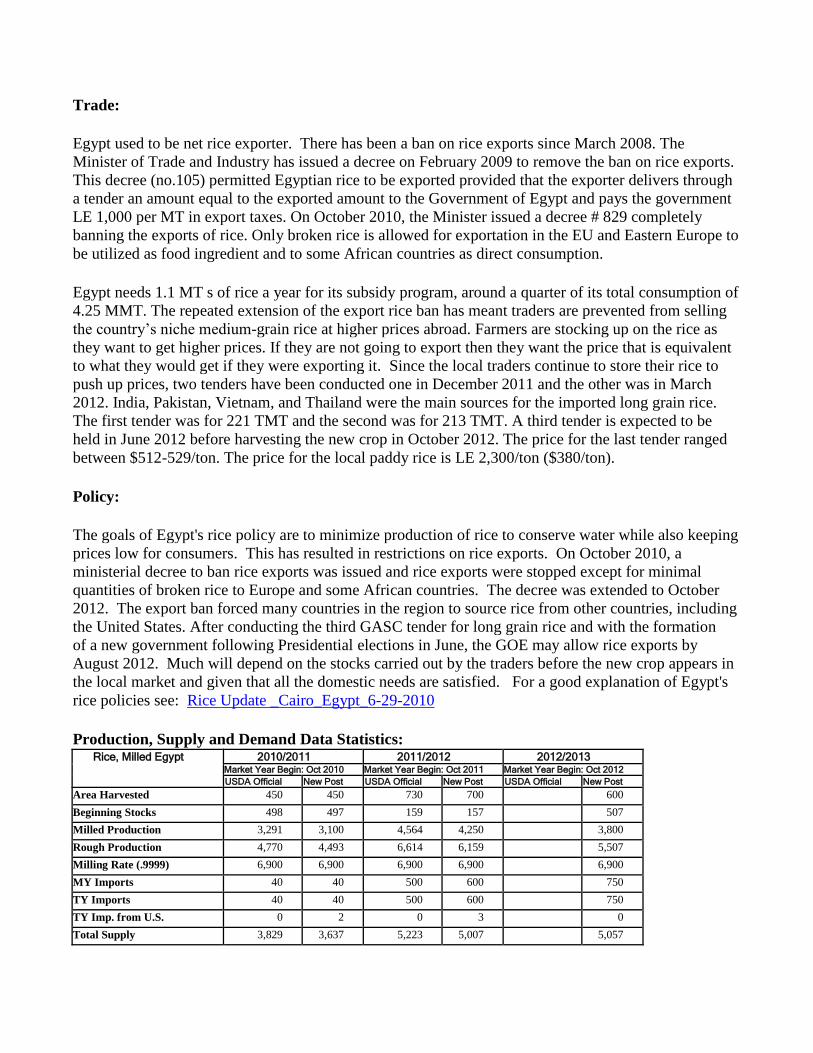
Production, Supply and Demand Data Statistics: Rice, Milled Egypt 2010/2011 2011/2012 2012/2013
Market Year Begin: Oct 2010 Market Year Begin: Oct 2011 Market Year Begin: Oct 2012 USDA Official New Post USDA Official New Post USDA Official New Post
Area Harvested 450 450 730 700 600 Beginning Stocks 498 497 159 157 507 Milled Production 3,291 3,100 4,564 4,250 3,800 Rough Production 4,770 4,493 6,614 6,159 5,507 Milling Rate (.9999) 6,900 6,900 6,900 6,900 6,900 MY Imports 40 40 500 600 750 TY Imports 40 40 500 600 750 TY Imp. from U.S. 0 2 0 3 0 Total Supply 3,829 3,637 5,223 5,007 5,057

MY Exports 80 80 600 600 600 TY Exports 120 120 600 600 600 Consumption and Residual 3,590 3,400 4,060 3,900 4,000 Ending Stocks 159 157 563 507 457 Total Distribution 3,829 3,637 5,223 5,007 5,057
1000 HA, 1000 MT, MT/HA
Other recent Grain and Feed Reports
Rice Up-date_Cairo_Egypt_1-12-2012
GASC Successfully Tenders for Long Grain Rice_Cairo_Egypt_12-20-2011
Rice Update_Cairo_Egypt_8-2-2011