Japan Grain and Feed Update 2017 Grain and Feed ... - USDA GAIN Publications/Grain and Feed... ·...
27
THIS REPORT CONTAINS ASSESSMENTS OF COMMODITY AND TRADE ISSUES MADE BY USDA STAFF AND NOT NECESSARILY STATEMENTS OF OFFICIAL U.S. GOVERNMENT POLICY Date: GAIN Report Number: Approved By: Prepared By: Report Highlights: Given competitive prices for imported feed grains (particularly for corn) and DDGS, Japanese demand is expected to remain strong in 2017/18, with corn imports again forecast to total 15.2 million MT. Favorable weather, resulting in improved Japanese wheat production, is expected to lead to a small reduction in imports (100,000 MT). Japanese rice production is estimated to decrease 2.3 percent in 2017/18 as a result of reduced planting area and poor weather in certain parts of the country. With an anticipated increase in the price for domestically produced rice, demand for imported rice is expected to be strong in 2017/2018. Japanese demand for beta-glucan “waxy barley” continues to grow. Keiko Fujibayashi Christopher Riker 2017 Grain and Feed Semi-Annual Grain and Feed Update Japan JA7127 10/13/2017 Required Report - public distribution
Transcript of Japan Grain and Feed Update 2017 Grain and Feed ... - USDA GAIN Publications/Grain and Feed... ·...

THIS REPORT CONTAINS ASSESSMENTS OF COMMODITY AND TRADE ISSUES MADE BY
USDA STAFF AND NOT NECESSARILY STATEMENTS OF OFFICIAL U.S. GOVERNMENT
POLICY
Date:
GAIN Report Number:
Approved By:
Prepared By:
Report Highlights:
Given competitive prices for imported feed grains (particularly for corn) and DDGS, Japanese demand
is expected to remain strong in 2017/18, with corn imports again forecast to total 15.2 million
MT. Favorable weather, resulting in improved Japanese wheat production, is expected to lead to a
small reduction in imports (100,000 MT). Japanese rice production is estimated to decrease 2.3 percent
in 2017/18 as a result of reduced planting area and poor weather in certain parts of the country. With an
anticipated increase in the price for domestically produced rice, demand for imported rice is expected to
be strong in 2017/2018. Japanese demand for beta-glucan “waxy barley” continues to grow.
Keiko Fujibayashi
Christopher Riker
2017 Grain and Feed Semi-Annual
Grain and Feed Update
Japan
JA7127
10/13/2017
Required Report - public distribution

Post:
Commodities:
Feed Production and Feed Price Stabilization Program
Japan maintains a feed price stabilization program that consists of a combination of a Ministry of
Agriculture, Forestry and Fisheries (MAFF) subsidy and an industry fund to help absorb surges in
compound feed prices. The program is activated when the average import price of feed ingredients
(corn, sorghum, soybean meal, barley and wheat) in a particular quarter exceeds the average import cost
of these feed ingredients in the previous year (see Chart 1).
Chart 1. Import Feed Ingredients Price and Compensation
Source: MAFF
As the import price of feed ingredients had fallen, no compensation payments were made for seven
consecutive quarters from the first quarter of Japanese Fiscal Year (JFY: April - March) 2015 until the
3rd
quarter of JFY2016. However, due to an increase in ocean freight costs and a weaker Yen, the
import price of feed ingredients in the fourth quarter of JFY2016 and the first quarter of JFY2017 rose
to levels that exceeded the average import price of the previous year. As a result, compensation
Wheat
Sorghum
Rice, Milled
Corn
Barley Tokyo

payments of 950 yen/MT (JFY 2016 4th
Qtr) and 1,700 Yen/MY (JFY2017 1st Qtr) were made. While
MAFF has not yet reported data for the second and third quarters in JFY2017, industry sources have
indicated feed millers have decreased compound feed prices by 1.8 percent (JFY2017 2nd
Qtr) and 0.6
percent (JFY2017 3rd
Qtr) given the appreciation of the Yen and lower prices for soybean meal.
Accordingly, FAS Tokyo does not believe payments have continued beyond the first quarter of
JFY2017.
As a result of declining livestock inventories, Japanese compound feed production has remained below
24 million MT since Marketing Year (MY) 2013/14 (October 2013 – September 2014). However,
reflecting strong demand, per-farm poultry inventories expanded, supported by lower input costs and
higher farm prices (see Table 1). Despite this year’s growth, inventories are expected to remain flat in
2018 (for additional information, see JA7113). As a result of high market prices for beef and pork,
reflecting solid demand, beef cattle and swine inventories were up slightly in February 2017. Like
poultry, however, inventories are forecast to remain the same in 2018 (for additional information, see
JA7110). While dairy cattle inventories have been trending down, and this trend is projected to
continue in 2018, compound feed production for all livestock in Japan in MY2017/18 is forecast to
remain largely unchanged (see Compound feed production by ingredients – Table 2).
Wheat
Wheat Production, Supply and Distribution
Wheat 2015/2016 2016/2017 2017/2018 Market Begin Year Jul 2015 Jul 2016 Jul 2017
Japan USDA Official New Post USDA Official New Post USDA Official New Post
Area Harvested 213 213 214 214 214 212
Beginning Stocks 1227 1227 1288 1288 1200 1210
Production 1004 1004 778 778 820 930
MY Imports 5715 5715 5911 5911 5800 5800
TY Imports 5715 5715 5911 5911 5800 5800
TY Imp. from U.S. 2592 2531 2858 2859 0 0
Total Supply 7946 7946 7977 7977 7820 7940
MY Exports 258 258 277 277 270 270
TY Exports 258 258 277 277 270 270
Feed and Residual 500 600 700 690 600 600
FSI Consumption 5900 5800 5800 5800 5800 5800
Total Consumption 6400 6400 6500 6490 6400 6400
Ending Stocks 1288 1288 1200 1210 1150 1270
Total Distribution 7946 7946 7977 7977 7820 7940
Yield 4.7136 4.7136 3.6355 3.6355 3.8318 4.3868
(1000 HA) ,(1000 MT) ,(MT/HA)

Production
According to MAFF’s wheat planted area and production data for MY2017/18,1 Japan’s total planted
area decreased one percent to 212,300 hectares (ha) (see Table 4). The planted area in Hokkaido and all
other Prefectures decreased one percent to 121,600 ha and 90,700 ha, respectively, due to a shift in
production to other crops. Despite the decrease in the planted area, production in Prefectures other than
Hokkaido increased 30,400 MT (11 percent to 296,900 MT) as favorable growing conditions led to
increased yields (12 percent to 3.3 MT/ha). Although MAFF has yet to publish Hokkaido data,
production in the Prefecture is estimated to have increased roughly 20 percent to over 600,000 MT as a
good harvest was reported in the major wheat production regions of Tokachi and Okhotsk.
Accordingly, FAS Tokyo estimates total Japanese wheat production to be 930,000 MT in MY2017/18.
Consumption
Food wheat and wheat product consumption remained strong at 5.8 million MT in MY 2016/17. With
no indication of any abatement, consumption is forecast to remain unchanged at 5.8 million MT in
MY2017/18.
With regard to feed consumption, although wheat and wheat flour are minor ingredients in compound
feed, their composition ratios increased to 1.9 percent and to 0.8 percent, respectively, in MY2016/17.
This increase translated to an increase of approximately 92,000 MT (wheat-equivalent). As a result, the
total quantity of wheat for feed (i.e., wheat, wheat-equivalent wheat flour in compound feed, and on-
farm feed) is estimated at 690,000 MT (up 90,000 MT from MY2015/16). With the availability of
competitively priced wheat from Black Sea countries and the United States (see Table 5), as well as
domestic wheat (given that unfavorable weather led to higher than average off-grade wheat production),
feed millers increased their use of wheat in compound feed.
However, wheat for feed use is forecast to return to 600,000 MT in MY2017/18 due to competition with
other competitively priced feed ingredients such as corn and sorghum (see Chart 2) and an expectation
of reduced availability of domestically produced feed-grade wheat. Accordingly, total wheat
consumption is forecast to return to 6.4 million MT in MY2017/18.
Trade
Japan imports roughly 90 percent of the food wheat it consumes, of which imports from the United
States account for nearly 50 percent. Following a decrease in food wheat imports in MY2015/16 due to
a record harvest in Japan, food wheat imports rebounded to 5.3 million MT in MY2016/17, up 3.6
percent. Imports from the United States increased 10 percent while imports from Canada decreased 5.6
percent (mainly due to the price competitiveness of U.S. Dark Northern Spring compared to Canadian
Western Red Spring #1 – see Chart 3). However, food wheat imports are forecast to decrease 100,000
1 The marketing year for wheat is July – June.

MT (to 5.2 million MT) in MY2017/18 due to an anticipated increase in domestic production.
Pasta accounts for the majority of Japanese wheat product imports, and imports of pasta have been
trending upwards over the last decade (see Chart 4). Pasta imports from Turkey have grown
significantly due to Turkey’s price competitiveness (coupled with the establishment of a Japanese pasta
factory in Turkey in 2015 which shifted pasta production from Japan to Turkey). Pasta imports are
forecast to increase in the future when the Japan-EU Economic Partnership Agreement comes into effect
(which will reduce the tariff on pasta from EU countries, including Italy, which supplies over 40 percent
of Japan’s pasta imports).
Reflecting strong feed demand supported by lower prices, feed wheat imports increased 3.7 percent to
371,573MT in MY2016/17. Due to the expected reduction of wheat in feed use, however, feed wheat
imports are forecast to decrease to 320,000 MT in MY2017/18. The decrease in feed wheat imports is
forecasted to be partially offset by an increase in pasta imports in MY2017/18. Accordingly, total
wheat imports are forecast to decrease 100,000 MT to 5.8 million MT in MY2017/18.
As wheat is a state traded item, MAFF imports wheat under three different systems: 1) general imports
of five major classes of food wheat: Western White (WW), Hard Red Winter (HRW), Dark Northern
Spring (DNS), Canada Western Red Spring #1 (1CW) and Australia Standard White (ASW), 2)
Simultaneous Buy and Sell (SBS) imports of specific classes of food wheat (Category I for bulk
shipment and Category II for container shipment), and 3) SBS imports of feed wheat (for additional
information, see JA7027). Tender results for numbers 1), 2) and 3) are included in Table 6, 7, 8 and 9.
Increase in MAFF’s sales price for five major classes of food wheat
To ensure domestic prices are reflective of international prices, MAFF revises the sales prices for the
five major classes of food wheat twice a year (April-September and October-March). Following an
average 4.6 percent increase for April-September 2017, MAFF raised its sales price for the five major
classes for October 2016 – March 2017 by an average of 3.6 percent to 52,519 yen/MT (roughly $468)
to account for an increase in freight costs, a weaker Japanese Yen and concerns over production
decreases in the United States and Australia. The average resale price of soft wheat (ASW and WW)
and semi-hard and hard wheat (1CW, DNS and HRW) increased 8.2 percent to 50,200 yen/MT (roughly
$447) and 1.7 percent to 53,600 yen/MT (roughly $478), respectively.
Establishment of new SBS Category III
In addition to the Category I and Category II SBS imports, MAFF established a new SBS import
category, Category III, allowing up to 200,000 MT of any wheat class, in either bulk or containerized
shipments, to be imported. MAFF indicated the purpose was to expand flexibilities for Japanese flour
millers to allow for the purchase of diversified classes and specifications of wheat at competitive prices
(for additional information, see JA7081). The first SBS tender for Category III is scheduled to be held

on October 17, 2017 for 100,000 MT of food wheat.
Stocks
As a contingency plan, the private sector holds a total of 930,000 MT of imported wheat, equivalent to
2.3 months of demand, in reserve, for which the Government of Japan (GOJ) subsidizes the storage
costs for the amount equivalent to demand for 1.8 months. Together with operating stocks held by flour
mills and feed mills, approximately 1.2 million MT of wheat is believed to be held in stocks in Japan.
Rice
Rice Production, Supply and Distribution
Rice, Milled 2015/2016 2016/2017 2017/2018 Market Begin Year Nov 2015 Nov 2016 Nov 2017
Japan USDA Official New Post USDA Official New Post USDA Official New Post
Area Harvested 1586 1584 1570 1569 1560 1560
Beginning Stocks 2821 2821 2532 2550 2372 2474
Milled Production 7670 7668 7780 7779 7600 7600
Rough Production 10536 10533 10687 10685 10440 10440
Milling Rate (.9999) 7280 7280 7280 7280 7280 7280
MY Imports 711 711 685 700 685 700
TY Imports 685 685 685 700 685 700
TY Imp. from U.S. 343 365 0 0 0 0
Total Supply 11202 11200 10997 11029 10657 10774
MY Exports 70 50 75 55 80 60
TY Exports 70 50 75 55 80 60
Consumption and Residual 8600 8600 8550 8500 8500 8450
Ending Stocks 2532 2550 2372 2474 2077 2264
Total Distribution 11202 11200 10997 11029 10657 10774
Yield (Rough) 6.6431 6.6496 6.807 6.8101 6.6923 6.6923
(1000 HA) ,(1000 MT) ,(MT/HA)
Note: the quantities of rice in this section are reported on a milled basis, unless otherwise noted.
Production
According to MAFF’s rice planted area and production data, the planted area for table rice decreased
11,000 ha to 1.37 million ha in MY2017/18.2 The number of grains is said to be similar to a normal
year, but a lack of sunshine from late July into August negatively impacted grain ripening in the Kanto
region and the Pacific side of the Tohoku region. Accordingly, the average yield for Japan is expected
to fall 0.1 MT/ha (brown) from MY2016/17 to 5.34 MT/ha (brown). Based on the expected yield,
MAFF estimates table rice production to be 6.65 million MT in MY2017/18, down 166,530 MT from
MY2016/17. MAFF reports the planted area of feed rice to be 91,510 ha in MY2017/18, up 341 ha
from MY2016/17. While MAFF has yet to publish the total rice planted area and production data for
2 The marketing year for rice is November – October.

MY2017/18, FAS Tokyo estimates total rice planted area and the production to be 1.56 million ha and
7.6 million MT, respectively (see Table 13).
Under the rice acreage reduction program, MAFF set the table rice production target and allocated
planting area to each Prefecture, providing a subsidy of 75,000 yen/ha (approximately $670/ha) to those
who comply with the planting area allocation. Beginning in April 2018, however, MAFF will
discontinue the issuance of a planting area allocation and the subsidy for table rice. While high
wholesale prices may encourage producers to produce more table rice, municipal governments and
agricultural cooperatives are expected to continue setting production targets and guide producers to
produce: 1) rice for use other than table rice and 2) other rotational crops supported by the continuation
of conversion subsidies. Accordingly, a significant increase in table rice production is not expected in
2018 or beyond.
Consumption
Table rice consumption continues to decline in Japan, and table rice consumption is estimated to have
decreased 100,100 MT to 6.87 million MT in 2016/17 (July 2016 – June 2017). A further decline to
6.84 million MT in 2017/18 (July 2017 – June 2018) is also expected. In accordance with declining
table rice consumption, MAFF has incentivized production of feed rice, rice for processing and other
crops to suppress table rice production and reduce private stocks. As a result, wholesale prices
increased by 10 percent in 2015/16 (September – August) and 8.6 percent in 2016/17 (September –
August) (see Chart 5). With a further reduction in table rice production in 2017/18, a further increase in
the wholesale price is expected in 2017/18 (September – August).
The price increase in table rice and the production shift towards feed rice have greatly impacted the
foodservice and home meal replacement sectors as reasonably priced rice has fallen into short supply.
This, in turn, has increased market opportunities for imported rice. Nevertheless, there are growing
concerns among industry sources that further price increases could negatively impact table rice
consumption -- which is already trending down with Japan’s population decline.
Rice continues to be used for feed in Japan (accounting for 5.1 percent of the compound feed
composition), and a total of 1.42 million MT of rice (510,000 MT of domestic rice (brown), 700,000
MT (actual tonnage) of Ordinary Minimum Access (OMA) rice and 210,000 MT of GOJ reserve rice
(brown)) is estimated to have been used for feed in JFY2016. Approximately 1.1 million MT of this
rice was used for compound feed, while the remainder was used on-farm. Despite continued use for
feed, the quantity of rice in the compound feed recipe has been declining since April 2017, with the
composition ratio falling to 4.2 percent in July 2017 (attributable to reduced supplies of OMA rice and
GOJ reserve rice for feed due to increased demand for processing). Competitive import prices for
Distiller’s Dried Grains with Solubles (DDGS) and corn are also believed to have contributed to the
reduction of rice used in compound feed. Accordingly, rice for feed use is expected to fall slightly in
MY2016/17.
In MY2017/18, however, an anticipated increase in the number of undersized grains is expected to
reduce demand for OMA rice and GOJ reserve rice for processing allowing for a larger volume to be
sold for feed. With the expected decrease in table rice consumption, overall rice consumption in Japan
is still expected to decrease 100,000 MT to 8.5 million MT in MY2016/17 and is forecast to further
decline to 8.45 million MT in MY2017/18.
Trade
As of October 6, 2017, three OMA tenders and one Simultaneous Buy and Sell (SBS) tender were held
in JFY2017 (where 141,856 MT and 24,998 MT of rice (actual tonnage), respectively, were
successfully bid (see Table 14). With strong demand for SBS rice as a result of high domestic table
rice prices, Japan’s 100,000 MT SBS quota is expected to be fully utilized this fiscal year, while
increased demand may lead to increased competition among importers and, potentially, higher prices.
Following the prohibition of the exchange of “adjustment money” in December 2016 (for additional
information, see JA7005), MAFF has again revised the administrative rules for the Simultaneous Buy
and Sell (SBS) tendering system – this time to prohibit the sale, transfer, or hand-over of SBS imported
rice between importers and buyers (for additional information, see JA7120). The revision is believed to
have been made to prevent SBS rice from being distributed at prices lower than the government’s
intended prices.
With regard to exports, Japan shipped 40,000 MT (actual tonnage) of MA rice as food aid (see Table
15) and sold 9,528 MT (actual tonnage) of commercial rice in MY2015/16. In an effort to support
Japanese agricultural production, MAFF has been promoting agricultural exports, including rice. While
high prices may inhibit rapid export growth, commercial rice exports are expected to increase gradually
in the coming years and food aid exports are expected to continue at similar levels to MY2015/16 in
both MY2016/17 and MY2017/18.
Stocks
MAFF regularly maintains 828,100 MT of rice in reserve. An additional 640,000 MT (actual tonnage)
of MA rice stocks were held (as of October 2016), of which 350,000 MT (actual tonnage) is set aside
for the GOJ contingency feed grain reserve. As a result of the decline in table rice production, private
stocks have decreased in 2016 and 2017. Accordingly, aggregated ending stocks are expected to total
2.4 million MT in MY2016/17, and are forecast to further decline to 2.2 million MT in MY2017/18
(given an anticipated decrease in production).
Corn
Corn Production, Supply and Distribution

Corn 2015/2016 2016/2017 2017/2018 Market Begin Year Oct 2015 Oct 2016 Oct 2017
Japan USDA Official New Post USDA Official New Post USDA Official New Post
Area Harvested 1 1 1 1 1 1
Beginning Stocks 1348 1348 1350 1351 1251 1302
Production 1 1 1 1 1 1
MY Imports 15201 15202 15000 15200 15000 15200
TY Imports 15201 15202 15000 15200 15000 15200
TY Imp. from U.S. 11227 10586 0 0 0 0
Total Supply 16550 16551 16351 16552 16252 16503
MY Exports 0 0 0 0 0 0
TY Exports 0 0 0 0 0 0
Feed and Residual 11600 11600 11500 11650 11500 11650
FSI Consumption 3600 3600 3600 3600 3600 3600
Total Consumption 15200 15200 15100 15250 15100 15250
Ending Stocks 1350 1351 1251 1302 1152 1253
Total Distribution 16550 16551 16351 16552 16252 16503
Yield 1 1 1 1 1 1
(1000 HA) ,(1000 MT) ,(MT/HA)
Production
Japanese corn production remains negligible, with a very small amount of corn produced in Hokkaido.
Consumption
Feed consumption is estimated to increase 50,000 MT to 11.65 million MT in MY2016/173 as
competitive corn prices continued to encourage feed millers to use higher volumes of corn in their feed
production (in lieu of sorghum and rice). MY2017/18 feed consumption is forecast to remain 11.65
million MT, assuming prices remain unchanged. Food, Seed and Industrial (FSI) consumption is also
expected to remain flat at 3.6 million MT in MY2016/17, and is forecast to remain unchanged in
MY2017/18.
Trade
Reflecting strong demand for feed, MY2016/17 corn imports are expected to remain at 15.2 million
MT. Despite a temporary slowdown of grain exports from Pacific North West ports in early 2017 due
to severe winter weather, imports from the United States significantly increased in MY2016/17
(offsetting a reduction in imports from Brazil and Argentina) (see Table16). A good U.S. corn crop
over the last four consecutive years has led to competitive prices while exportable supplies from Brazil
and Argentina decreased due to unfavorable weather. However, in an effort to diversify import sources,
Japanese traders also imported corn from suppliers whose prices were lower than the price for U.S. corn
(e.g., Russia and Ukraine) (see Chart 6). Reflecting solid feed demand and stable starch demand,
MY2017/18 imports are forecast to remain 15.2 million MT, but import diversification is expected to be
greater (particularly given favorable weather in Brazil and Argentina).
3 The marketing year for corn is October - September.

Stocks
The GOJ operates a feed grain reserve program to encourage the private sector to maintain 850,000 MT
of corn, sorghum, wheat, barley, bran and soybean meal (corn is believed to account for the majority of
the reserve). Together with operating stocks held by feed mills and starch manufacturers, approximately
1.25 million MT of corn is believed to be held in stocks in Japan.
DDGS
Japan’s imports of DDGS, a high value byproduct of ethanol production, increased 17 percent to
460,000 MT for the first 11 months of MY2016/17 due to its competitive price (see Table 17). The
import price for DDGS fell from US$237.8/MT in MY2015/16 to US$198.4/MT in August 2017, lower
than the price for feed corn (see Chart 2). Increased utilization of DDGS in compound feed is expected
to lower the utilization of both soybean meal and rice. The majority (approximately 66 percent) of
Japan’s imports of DDGS is used in compound feed for layers and chicks.
Barley
Barley Production, Supply and Distribution
Barley 2015/2016 2016/2017 2017/2018 Market Begin Year Oct 2015 Oct 2016 Oct 2017
Japan USDA Official New Post USDA Official New Post USDA Official New Post
Area Harvested 61 61 61 61 61 61
Beginning Stocks 360 360 352 332 314 292
Production 177 177 172 170 172 183
MY Imports 1155 1155 1200 1190 1100 1150
TY Imports 1154 1155 1200 1190 1100 1150
TY Imp. from U.S. 7 6 0 0 0 0
Total Supply 1692 1692 1724 1692 1586 1625
MY Exports 0 0 0 0 0 0
TY Exports 0 0 0 0 0 0
Feed and Residual 980 980 1030 1000 950 960
FSI Consumption 360 380 380 400 380 410
Total Consumption 1340 1360 1410 1400 1330 1370
Ending Stocks 352 332 314 292 256 255
Total Distribution 1692 1692 1724 1692 1586 1625
Yield 2.9016 2.9016 2.8197 2.7869 2.8197 3
(1000 HA) ,(1000 MT) ,(MT/HA)
Production
According to MAFF’s barley planted area and production data for the 2017 crop (excluding production
in Hokkaido), Japan’s total planted area decreased marginally to 61,370 ha in MY2017/18.4 An
4 The marketing year for barley is October – September.

increase of 100 ha in the planted area of two-row barley was offset by decreases of 100 ha of six row
barley and 20 ha of naked barley. MAFF has yet to publish the production data for Hokkaido, whose
production accounts for three percent of Japan’s total barley production.
The production of two-row barley (see Table 18) in Prefectures other than Hokkaido increased 12
percent to 112,000MT as a result of a 12 percent yield increase stemming from favorable weather and
growing conditions. The national production of six row barley (see Table 19) decreased four percent to
51,200 MT as the number of ears were smaller due to poor germination caused by rains during sowing
in the main production region of Hokuriku (i.e., Northwest Honshu). Additionally, although the
planting area was down, production of naked barley (see Table 20) in Prefectures other than Hokkaido
increased 27 percent to 12,600 MT as a result of favorable weather which increased yields by 28
percent. Accordingly, total barley production (see Table 21) is estimated at approximately 183,000 MT
in MY2017/18, up 13,000 MT from MY2016/17.
Consumption
MY2016/17 feed consumption is expected to increase slightly to one million MT as barley utilization in
compound feed, supported by low import prices, showed a marginal increase in the first 10 months of
MY2016/17. However, as explained in the trade section below, an anticipated increase in feed barley
prices is expected to lead to a decrease in feed consumption (lowering consumption to 960,000 MT) in
MY2017/18.
Beta-glucan rich glutinous food barley has become popular because of its reported health benefit of
lowering cholesterol. Demand for glutinous barley is estimated to have rapidly increased in
MY2016/17 (to 15,000 MT), and is expected to increase by another 11,000 MT to 26,000 MY in
MY2017/18. The increase in demand provides opportunities to foreign barley suppliers as only 1,000
MT is expected to be produced domestically (the remaining 25,000 MT is expected to be imported).
Other food, seed and industrial barley consumption is expected to remain unchanged.
Trade
Similar to wheat, as a state traded item, MAFF controls barley imports. All food and feed barley are
imported under Japan’s SBS import system except feed barley from Australia (which is imported by the
private sector as a result of provisions established in the Japan-Australia Economic Partnership
Agreement). Year-to-date SBS tender results for barley are shown in Table 22, 23 and 24.
There was a six percent drop in the average price of imported feed barley in the first 11 months of
MY2016/17, when compared to the same period during the previous year (see Table 25), as Australia’s
crop was strong. However, despite the price decrease, feed barley imports in MY2016/17 are estimated
to marginally increase to 940,000MT as cattle inventories remain relatively unchanged. While feed
demand is forecast to remain stable in MY2017/18, feed barley imports are projected to decrease
because of an expected price increase for Australian barley due to dry and hot conditions adversely
affecting exportable supplies.

Reflecting strong demand for glutinous food barley, food barley imports have grown seven percent in
the first 11 months of MY2016/17 (when compared to the same period last year) (see Table 27). While
imports from Australia account for the majority of food barley imports, supplies from Canada and the
United States have recently increased. U.S. imports have grown significantly given increased demand
for beta-glucan “waxy barley” (see Tables 22, 27). Consequently, MY2016/17 food barley imports are
expected to increase to 250,000 MT. Accordingly, total barley imports are expected to increase to 1.19
million MT in MY2016/17. While food barley demand is forecast to remain strong in MY2017/18, total
barley imports are forecast to decline to 1.15 million MT as demand for barley for feed is expected to
decline on higher prices.
Stocks
Barley is part of Japan’s contingency feed grain reserve program. However, as corn is believed to
account for the majority of the reserve, barley stocks in this program are believed to be negligible.
Nevertheless, feed mills and food barley manufacturers are believed to maintain some operating stocks
in their inventories.
Sorghum
Sorghum Production, Supply and Distribution
Sorghum 2015/2016 2016/2017 2017/2018 Market Begin Year Oct 2015 Oct 2016 Oct 2017
Japan USDA Official New Post USDA Official New Post USDA Official New Post
Area Harvested 0 0 0 0 0 0
Beginning Stocks 53 53 52 53 52 53
Production 0 0 0 0 0 0
MY Imports 649 650 600 560 550 460
TY Imports 649 650 600 560 550 460
TY Imp. from U.S. 82 72 0 0 0 0
Total Supply 702 703 652 613 602 513
MY Exports 0 0 0 0 0 0
TY Exports 0 0 0 0 0 0
Feed and Residual 650 650 600 560 550 470
FSI Consumption 0 0 0 0 0 1
Total Consumption 650 650 600 560 550 471
Ending Stocks 52 53 52 53 52 42
Total Distribution 702 703 652 613 602 513
Yield 0 0 0 0 0 0
(1000 HA) ,(1000 MT) ,(MT/HA)
Production
Production of sorghum remains negligible in Japan.
Consumption

Nearly all imported sorghum is consumed as feed in Japan, as it is mainly used as a substitute for corn
in compound feed. The utilization of sorghum in compound feed decreased approximately 100,000 MT
in the first 10 months of MY2016/175 from the same period during the previous year due to corn’s price
competitiveness. Accordingly, MY2016/17 consumption is forecasted to decline to 560,000 MT.
MY2017/18 consumption is forecast to further decrease to roughly 470,000 MT assuming a
continuation of competitively priced corn.
While it is still small, food sorghum has found a market niche in Japan in recent years with the
increasing popularity of gluten free foods, “super foods” and multigrain foods (Zakkoku). Industry
sources believe that approximately 500 MT of food sorghum was consumed in MY2016/17, and that
consumption is expected to increase in MY2017/18.
Trade
MY2016/17 sorghum imports are expected to decrease to 560,000 MT due to corn’s price
competitiveness. Since MY2013/14, supplies from Argentina and the United States have accounted for
nearly all of Japan’s sorghum imports. The U.S. market share increased at Argentina’s expense in
MY2016/17 due to increased availability and price competitiveness (see Chart 7). Nevertheless, with a
decline in demand for sorghum for feed, in favor of corn, MY2017/18 imports are forecast to further
decease to 460,000MT.
Stocks
Sorghum is included in Japan’s contingency feed grain reserve program. However, as corn is believed
to account for the lion’s share of the reserve, sorghum stocks for this program are believed to be
negligible. Operating stocks at feed mills are estimated at approximately 50,000 MT in MY2016/17,
but are expected to decrease to 42,000 MT in accordance with a decline in monthly use.
5 The marketing year for sorghum is October – September.
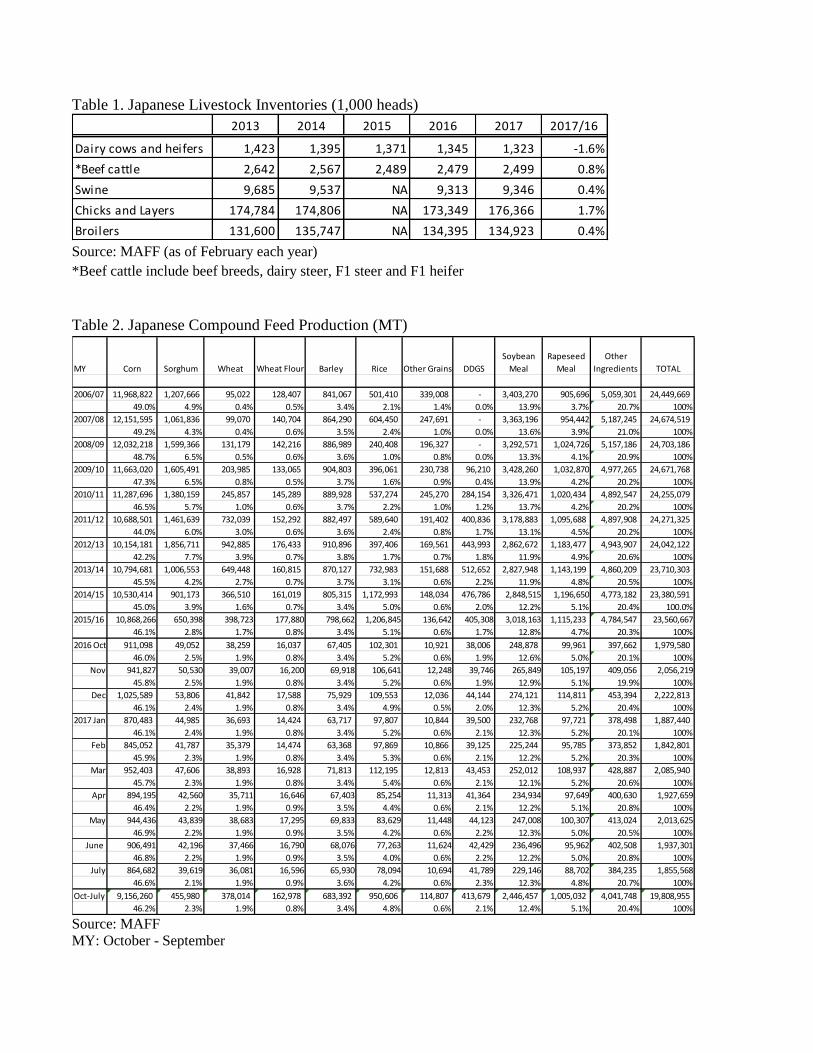
Table 1. Japanese Livestock Inventories (1,000 heads)
2013 2014 2015 2016 2017 2017/16
Dairy cows and heifers 1,423 1,395 1,371 1,345 1,323 -1.6%
*Beef cattle 2,642 2,567 2,489 2,479 2,499 0.8%
Swine 9,685 9,537 NA 9,313 9,346 0.4%
Chicks and Layers 174,784 174,806 NA 173,349 176,366 1.7%
Broilers 131,600 135,747 NA 134,395 134,923 0.4% Source: MAFF (as of February each year)
*Beef cattle include beef breeds, dairy steer, F1 steer and F1 heifer
Table 2. Japanese Compound Feed Production (MT)
MY Corn Sorghum Wheat Wheat Flour Barley Rice Other Grains DDGS
Soybean
Meal
Rapeseed
Meal
Other
Ingredients TOTAL
2006/07 11,968,822 1,207,666 95,022 128,407 841,067 501,410 339,008 - 3,403,270 905,696 5,059,301 24,449,669
49.0% 4.9% 0.4% 0.5% 3.4% 2.1% 1.4% 0.0% 13.9% 3.7% 20.7% 100%
2007/08 12,151,595 1,061,836 99,070 140,704 864,290 604,450 247,691 - 3,363,196 954,442 5,187,245 24,674,519
49.2% 4.3% 0.4% 0.6% 3.5% 2.4% 1.0% 0.0% 13.6% 3.9% 21.0% 100%
2008/09 12,032,218 1,599,366 131,179 142,216 886,989 240,408 196,327 - 3,292,571 1,024,726 5,157,186 24,703,186
48.7% 6.5% 0.5% 0.6% 3.6% 1.0% 0.8% 0.0% 13.3% 4.1% 20.9% 100%
2009/10 11,663,020 1,605,491 203,985 133,065 904,803 396,061 230,738 96,210 3,428,260 1,032,870 4,977,265 24,671,768
47.3% 6.5% 0.8% 0.5% 3.7% 1.6% 0.9% 0.4% 13.9% 4.2% 20.2% 100%
2010/11 11,287,696 1,380,159 245,857 145,289 889,928 537,274 245,270 284,154 3,326,471 1,020,434 4,892,547 24,255,079
46.5% 5.7% 1.0% 0.6% 3.7% 2.2% 1.0% 1.2% 13.7% 4.2% 20.2% 100%
2011/12 10,688,501 1,461,639 732,039 152,292 882,497 589,640 191,402 400,836 3,178,883 1,095,688 4,897,908 24,271,325
44.0% 6.0% 3.0% 0.6% 3.6% 2.4% 0.8% 1.7% 13.1% 4.5% 20.2% 100%
2012/13 10,154,181 1,856,711 942,885 176,433 910,896 397,406 169,561 443,993 2,862,672 1,183,477 4,943,907 24,042,122
42.2% 7.7% 3.9% 0.7% 3.8% 1.7% 0.7% 1.8% 11.9% 4.9% 20.6% 100%
2013/14 10,794,681 1,006,553 649,448 160,815 870,127 732,983 151,688 512,652 2,827,948 1,143,199 4,860,209 23,710,303
45.5% 4.2% 2.7% 0.7% 3.7% 3.1% 0.6% 2.2% 11.9% 4.8% 20.5% 100%
2014/15 10,530,414 901,173 366,510 161,019 805,315 1,172,993 148,034 476,786 2,848,515 1,196,650 4,773,182 23,380,591
45.0% 3.9% 1.6% 0.7% 3.4% 5.0% 0.6% 2.0% 12.2% 5.1% 20.4% 100.0%
2015/16 10,868,266 650,398 398,723 177,880 798,662 1,206,845 136,642 405,308 3,018,163 1,115,233 4,784,547 23,560,667
46.1% 2.8% 1.7% 0.8% 3.4% 5.1% 0.6% 1.7% 12.8% 4.7% 20.3% 100%
2016 Oct 911,098 49,052 38,259 16,037 67,405 102,301 10,921 38,006 248,878 99,961 397,662 1,979,580
46.0% 2.5% 1.9% 0.8% 3.4% 5.2% 0.6% 1.9% 12.6% 5.0% 20.1% 100%
Nov 941,827 50,530 39,007 16,200 69,918 106,641 12,248 39,746 265,849 105,197 409,056 2,056,219
45.8% 2.5% 1.9% 0.8% 3.4% 5.2% 0.6% 1.9% 12.9% 5.1% 19.9% 100%
Dec 1,025,589 53,806 41,842 17,588 75,929 109,553 12,036 44,144 274,121 114,811 453,394 2,222,813
46.1% 2.4% 1.9% 0.8% 3.4% 4.9% 0.5% 2.0% 12.3% 5.2% 20.4% 100%
2017 Jan 870,483 44,985 36,693 14,424 63,717 97,807 10,844 39,500 232,768 97,721 378,498 1,887,440
46.1% 2.4% 1.9% 0.8% 3.4% 5.2% 0.6% 2.1% 12.3% 5.2% 20.1% 100%
Feb 845,052 41,787 35,379 14,474 63,368 97,869 10,866 39,125 225,244 95,785 373,852 1,842,801
45.9% 2.3% 1.9% 0.8% 3.4% 5.3% 0.6% 2.1% 12.2% 5.2% 20.3% 100%
Mar 952,403 47,606 38,893 16,928 71,813 112,195 12,813 43,453 252,012 108,937 428,887 2,085,940
45.7% 2.3% 1.9% 0.8% 3.4% 5.4% 0.6% 2.1% 12.1% 5.2% 20.6% 100%
Apr 894,195 42,560 35,711 16,646 67,403 85,254 11,313 41,364 234,934 97,649 400,630 1,927,659
46.4% 2.2% 1.9% 0.9% 3.5% 4.4% 0.6% 2.1% 12.2% 5.1% 20.8% 100%
May 944,436 43,839 38,683 17,295 69,833 83,629 11,448 44,123 247,008 100,307 413,024 2,013,625
46.9% 2.2% 1.9% 0.9% 3.5% 4.2% 0.6% 2.2% 12.3% 5.0% 20.5% 100%
June 906,491 42,196 37,466 16,790 68,076 77,263 11,624 42,429 236,496 95,962 402,508 1,937,301
46.8% 2.2% 1.9% 0.9% 3.5% 4.0% 0.6% 2.2% 12.2% 5.0% 20.8% 100%
July 864,682 39,619 36,081 16,596 65,930 78,094 10,694 41,789 229,146 88,702 384,235 1,855,568
46.6% 2.1% 1.9% 0.9% 3.6% 4.2% 0.6% 2.3% 12.3% 4.8% 20.7% 100%
Oct-July 9,156,260 455,980 378,014 162,978 683,392 950,606 114,807 413,679 2,446,457 1,005,032 4,041,748 19,808,955
46.2% 2.3% 1.9% 0.8% 3.4% 4.8% 0.6% 2.1% 12.4% 5.1% 20.4% 100% Source: MAFF
MY: October - September

Table 4. Japanese Wheat Production
Planted
Area Production Yield
Planted
Area Production Yield
Planted
Area Production Yield
(ha) (MT) (MT/ha) (hectares) (MT) (MT/ha) (ha) (MT) (MT/ha)
2010 206,900 571,300 2.8 116,300 349,400 3.0 90,600 221,900 2.4
2011 211,500 746,300 3.5 119,200 499,900 4.2 92,300 246,400 2.7
2012 209,200 857,800 4.1 119,200 586,100 4.9 90,100 271,700 3.0
2013 210,200 811,700 3.9 122,000 531,900 4.4 88,100 279,800 3.2
2014 212,600 852,400 4.0 123,400 551,400 4.5 89,200 301,000 3.4
2015 213,100 1,004,000 4.7 122,600 731,000 6.0 90,500 273,200 3.0
2016 214,400 777,900 3.6 122,900 524,300 4.3 91,500 266,500 2.9
2017 212,300 *930,000 *4.4 121,600 *633,100 *5.2 90,700 296,900 3.3
Total Hokkaido Prefectures
Source: MAFF
*FAS Tokyo estimates
Table 5. CIF Price of Feed Wheat
Source: Global Trade Atlas
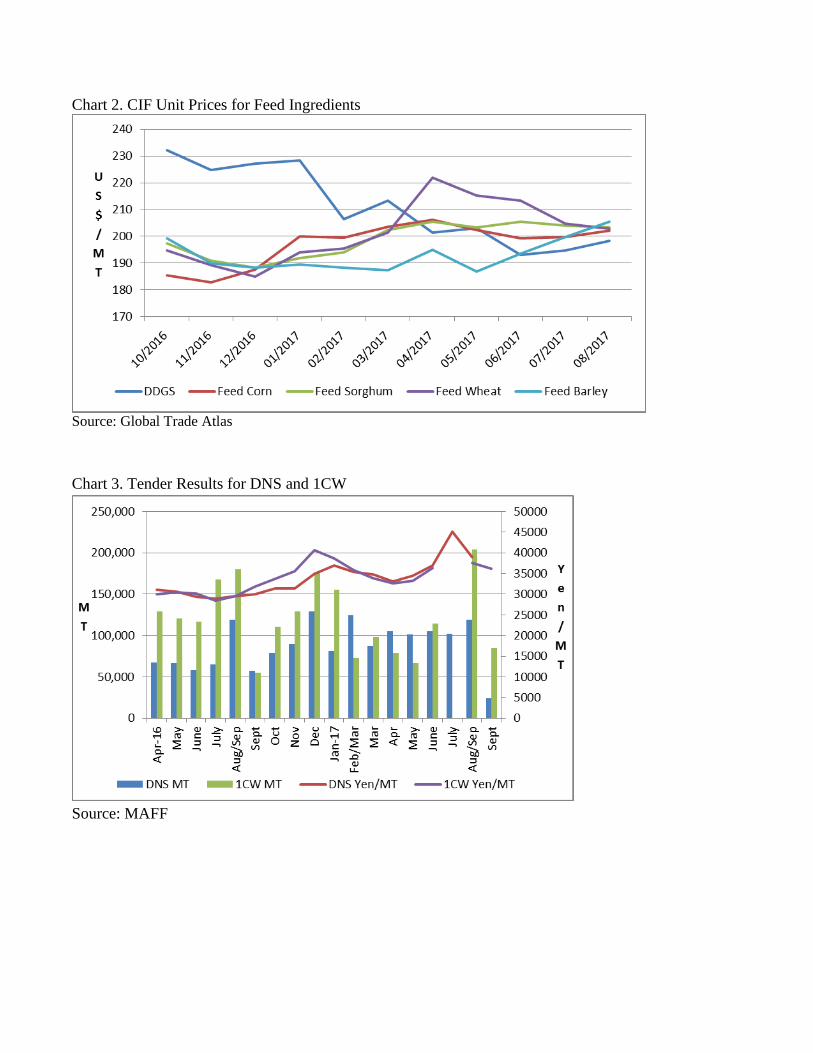
Chart 2. CIF Unit Prices for Feed Ingredients
Source: Global Trade Atlas
Chart 3. Tender Results for DNS and 1CW
Source: MAFF

Chart 4. Japanese Pasta Imports and CIF Unit Price
Source: Global Trade Atlas
Table 6. Tender Results for General Imports of Food Wheat
Class JFY2013 JFY2014 JFY2015 JFY2016 *JFY2017
U.S. Western White (WW) 640,307 718,922 689,057 654,923 342,200
U.S. Hard Red Winter (HRW) 836,456 739,979 790,309 839,616 393,555
U.S. Dark Northern Spring (DNS) 1,001,600 1,029,194 841,648 1,023,734 556,544
Canada Western Red Spring #1 (1CW) 1,401,434 1,118,383 1,470,557 1,510,343 549,441
Australia Standard White (ASW) 790,933 752,241 860,705 595,020 411,335
Total 4,670,730 4,358,719 4,652,276 4,623,636 2,253,075 Source: MAFF
*April – September 2017

Table 7. SBS Tender Results for Food Wheat
JFY2013 JFY2014 JFY2015 JFY2016 JFY2017
Country Category Apr-Sep
Australia Category I 78,520 59,650 90,200 80,800 33,480
Category II 7,394 9,598 7,017 3,358 1,800
Australia Total 85,914 69,248 97,217 84,158 35,280
Canada Category I 223,611 195,998 202,440 198,900 85,970
Category II 0 0 750 810
Canada Total 223,611 195,998 202,440 199,650 86,780
USA Category I 10,100 5,000
Category II 3,043
USA Total 8,043
France Category II 5,869 6,300 6,739 7,071 4,244
315,394 271,546 306,396 290,879 134,347Total Source: MAFF
Table 8. Food Wheat Imports by Class (1,000MT)
JFY2011 JFY2012 JFY2013 JFY2014 JFY2015
Western White 867 820 610 775 683
Hard Red Winter 880 980 727 855 790
Dark Northern Spring 1,507 1,246 877 1,245 850
Durum 3 1 1 3
White Club 25
Soft Red Winter 2
Western Red Spring 1,049 1,037 1,228 1,258 1,527
Durum 272 170 210 222 219
Hard White 1 1 3 3 1
Standard White 911 870 759 794 737
Prime Hard 122 101 83 83 84
Australian Premium White 2 28
Other 4 4 6 7 7
Total 5,616 5,229 4,533 5,243 4,929
USA
Canada
Australia
Source: MAFF
JFY2015 is the latest available data.
Table 9. Tender Results for Feed Wheat
JFY2014 JFY2015 JFY2016 *JFY2017
380,180 303,588 348,263 146,479
Source: MAFF
*April – September 2017
Table 10. Japanese Total Wheat Imports

% Change
2015 2016 2017 2015 2016 20172017/201
6
World T 5647685 5475059 5650130 100.00 100.00 100.00 3.20
United States T 2990593 2504158 2829184 52.95 45.74 50.07 12.98
Canada T 1660459 1812742 1678232 29.40 33.11 29.70 - 7.42
Australia T 909316 876109 945460 16.10 16.00 16.73 7.92
Romania T 28520 8093 56938 0.50 0.15 1.01 603.55
Ukraine T 0 156177 54101 0.00 2.85 0.96 - 65.36
Russia T 1307 9662 47993 0.02 0.18 0.85 396.72
United
Kingdom T 34320 84501 30834 0.61 1.54 0.55 - 63.51
France T 5975 6738 7253 0.11 0.12 0.13 7.64
Other T 17195 16879 135 0.0 0.0 0.0 0
Year Ending: June
Partner
CountryUnit
Quantity % Share
Source: Global Trade Atlas
Table 11. Japanese Wheat Products Imports
% Change
2015 2016 2017 2015 2016 20172017/201
6World T 168160 175353 190718 100.00 100.00 100.00 8.76
Italy T 74667 69628 76779 44.40 39.71 40.26 10.27
Turkey T 30510 43590 50199 18.14 24.86 26.32 15.16
United States T 21516 19816 20968 12.79 11.30 10.99 5.81
China T 17262 15884 16457 10.27 9.06 8.63 3.61
Korea South T 5666 5813 6778 3.37 3.31 3.55 16.61
Thailand T 6324 6681 5973 3.76 3.81 3.13 - 10.59
Greece T 2686 3450 3597 1.60 1.97 1.89 4.26
Vietnam T 2368 2731 3296 1.41 1.56 1.73 20.68
Other T 7158 7758 6673 0.0 0.0 0.0 0
Year Ending: June
Partner
CountryUnit
Quantity % Share
Source: Global Trade Atlas
Table 12. Japanese Total Wheat and Wheat Products Imports
MY2014/15 MY2015/16 MY2016/17
1. Wheat 5,647,685 5,475,059 5,650,130
2. Wheat products 168,160 175,353 190,718
3. Wheat equivalent of wheat products 230,043 239,883 260,902
Total 1. + 3. 5,877,728 5,714,942 5,911,032 Source: FAS Tokyo
Table 13. Japanese Rice Production

Planted Area
(ha) Brown Milled Brown Milled
2010 1,639,883 8,546,011 7,776,870 5.21 4.74
2011 1,607,955 8,557,900 7,787,689 5.32 4.84
2012 1,613,525 8,685,537 7,903,839 5.38 4.90
2013 1,618,802 8,711,576 7,927,534 5.38 4.90
2014 1,606,881 8,621,564 7,845,623 5.37 4.88
2015 1,584,766 8,426,099 7,667,750 5.32 4.84
2016 1,569,169 8,547,998 7,778,678 5.45 4.96
*2017 1,560,000 8,330,400 7,580,664 5.34 4.86
Production Yield (MT/ha)
Source: MAFF
*FAS Tokyo estimate
Chart 5. Wholesale Price of Table Rice
Source: MAFF
Table 14. OMA and SBS tender results (MT)

JFY2012 JFY2013 JFY2014 JFY2015 JFY2016 *JFY2017
USA SBS 40,974 20,046 3,804 19,909 56,438 17,744
OMA 281,000 300,000 316,000 300,000 266,000 64,000
Total 321,974 320,046 319,804 319,909 322,438 81,744
Share 47.4% 47.1% 47.2% 47.2% 51.5% 49.0%
Thailand SBS 4,870 11,173 5,596 6,276 6,283 440
OMA 245,564 300,933 290,174 299,458 286,679 65,856
Total 250,434 312,106 295,770 305,734 292,962 66,296
Share 36.9% 45.9% 43.6% 45.1% 46.8% 39.7%
Australia SBS 23,873 26,244 559 1,285 6,861 5,814
OMA 35,000 12,000 12,000 - - 12,000
Total 58,873 38,244 12,559 1,285 6,861 17,814
Share 8.7% 5.6% 1.9% 0.2% 1.1% 10.7%
China SBS 28,164 714 780 736 2,396 1,000
OMA 13,000 - 48,000 49,000 -
Total 41,164 714 48,780 49,736 2,396 1,000
Share 6.1% 0.1% 7.2% 7.3% 0.4% 0.6%
Other SBS 2,119 2,662 867 1,109 1,336
OMA 5,000 6,000 - - -
Total 7,119 8,662 867 1,109 1,336 -
Share 1.0% 1.3% 0.1% 0.2% 0.2% 0.0%
Total SBS 100,000 60,839 11,606 29,315 73,314 24,998
OMA 579,564 618,933 666,174 648,458 552,679 141,856
Total 679,564 679,772 677,780 677,773 625,993 166,854 Source: MAFF
*JFY2017 as of October 6, 2017
Table 15. OMA Rice Sales
MY2011/12 MY2012/13 MY2013/14 MY2014/15 MY2015/16
For table rice 80,000 100,000 40,000 10,000 10,000
For processing 150,000 190,000 150,000 100,000 130,000
For feed 450,000 330,000 440,000 650,000 700,000
For food aid 190,000 100,000 40,000 60,000 40,000
Ending stock 780,000 800,000 830,000 710,000 640,000 Source: MAFF
Table 16. Japanese Total Corn Imports

Change
MY2014/1
5
MY2015/1
6Oct 2015-
Aug 2016
Oct 2016-
Aug 2017
MY2014/
15
MY2015/
16Oct 2015-
Aug 2016
Oct 2016-
Aug 2017 Oct-Aug
World 14654913 15202376 13875791 13863700 100.00 100.00 100.00 100.00 -0.09
United States 12638597 10585567 9259635 12429082 86.24 69.63 66.73 89.65 34.23
Brazil 1338540 4483494 4483494 841643 9.13 29.49 32.31 6.07 -81.23
Argentina 118247 75633 75633 10999 0.81 0.50 0.55 0.08 -85.46
Ukraine 390945 35142 35142 215163 2.67 0.23 0.25 1.55 512.27
Russia 0 13142 13142 309911 0.00 0.09 0.09 2.24 2258.17
Other 168584 9398 8745 56902 1.15 0.06 0.06 0.41 550.68
Quantity (MT) Share (%)
Source: Global Trade Atlas
Chart 6. CIF Unit Price of Feed Corn
Source: Global Trade Atlas
Table 17. Japanese DDGS Imports
MY2014/15 MY2015/16Oct 2015-
Aug 2016
Oct 2016-
Aug 2017
Change
Oct - Aug
World 463407 442381 395294 463245 17.19
United States 440542 425865 380071 448453 17.99
China 12434 7769 7197 7185 -0.17
Canada 7477 6720 6091 5256 -13.71
Vietnam 1597 1238 1166 1222 4.80
Australia 649 631 631 545 -13.63
Cambodia 0 142 122 584 378.69
Other 708 16 16 0 -100.00 Source: Global Trade Atlas

Table 18. Japanese Two Row Barley Production
Planted
Area Production Yield
Planted
Area Production Yield
Planted
Area Production Yield
(ha) (MT) (MT/ha) (ha) (MT) (MT/ha) (ha) (MT) (MT/ha)
2010 36,600 104,300 2.8 2,110 5,560 2.6 34,500 98,700 2.9
2011 37,600 119,100 3.2 2,030 5,890 2.9 35,600 113,200 3.2
2012 38,300 112,400 2.9 1,990 6,710 3.4 36,300 105,600 2.9
2013 37,500 116,600 3.1 1,740 5,080 2.9 35,700 111,500 3.1
2014 37,600 108,200 2.9 1,740 5,880 3.4 35,800 102,400 2.9
2015 37,900 113,300 3.0 1,640 6,510 4.0 36,300 106,800 2.9
2016 38,200 106,800 2.8 1,690 6,720 4.0 36,500 100,100 2.7
2017 38,300 *119000 3.1 1,720 *6800 4.0 36,600 112,200 3.1
Total Hokkaido Prefectures
Source: MAFF
*FAS Tokyo estimates
Table 19. Japanese Six Row Barley Production
Planted
Area Production Yield
Planted
Area Production Yield
Planted
Area Production Yield
(ha) (MT) (MT/ha) (ha) (MT) (MT/ha) (ha) (MT) (MT/ha)
2010 17,400 44,800 2.6 0 0 17,400 44,800 2.6
2011 17,100 38,700 2.3 0 0 17,100 38,700 2.3
2012 16,900 47,800 2.8 0 0 16,900 47,800 2.8
2013 17,300 51,500 3.0 0 0 17,300 51,500 3.0
2014 18,200 47,000 2.6 0 0 18,200 47,000 2.6
2015 18,200 52,300 2.9 0 0 18,200 52,300 2.9
2016 18,200 53,600 2.9 0 0 18,200 53,600 2.9
2017 18,100 51,200 2.8 0 0 18,100 51,200 2.8
Total Hokkaido Prefectures
Source: MAFF
*FAS Tokyo estimates

Table 20. Japanese Naked Barley Production
Planted
Area Production Yield
Planted
Area Production Yield
Planted
Area Production Yield
(ha) (MT) (MT/ha) (ha) (MT) (MT/ha) (ha) (MT) (MT/ha)
2010 4,720 11,800 2.5 0 0 4,720 11,800 2.5
2011 5,130 13,700 2.7 0 0 5,130 13,700 2.7
2012 4,970 12,200 2.5 0 0 4,970 12,200 2.5
2013 5,010 14,700 2.9 4 0 5,010 14,700 2.9
2014 5,250 14,500 2.8 8 25 3.1 5,240 14,500 2.8
2015 5,200 11,300 2.2 12 44 3.7 5,180 11,300 2.2
2016 4,990 10,000 2.0 19 66 3.5 4,970 9,940 2.0
2017 4,970 *12,716 *2.6 34 *116 *3.4 4,940 12,600 2.6
Total Hokkaido Prefectures
Source: MAFF
*FAS Tokyo estimates
Table 21. Japanese Total Barley Production
Planted
Area Production Yield
Planted
Area Production Yield
Planted
Area Production Yield
(ha) (MT) (MT/ha) (ha) (MT) (MT/ha) (ha) (MT) (MT/ha)
2010 58,720 160,900 2.7 2,110 5,560 2.6 56,620 155,300 2.7
2011 59,830 171,500 2.9 2,030 5,890 2.9 57,830 165,600 2.9
2012 60,170 172,400 2.9 1,990 6,710 3.4 58,170 165,600 2.8
2013 59,810 182,800 3.1 1,744 5,080 2.9 58,010 177,700 3.1
2014 61,050 169,700 2.8 1,748 5,905 3.4 59,240 163,900 2.8
2015 61,300 176,900 2.9 1,652 6,554 4.0 59,680 170,400 2.9
2016 61,390 170,400 2.8 1,709 6,786 4.0 59,670 163,640 2.7
2017 61,370 *182,900 *3.0 1,754 *6,900 *3.9 59,640 176,000 3.0
Total Hokkaido Prefectures
Source: MAFF
*FAS Tokyo estimates

Table 22. SBS Tender Results for Food Barley
JFY2016
Apr-Sep Oct-Mar Apr-Sep Oct-Mar Apr-Sep
USA Category I 0
Category II 1925 2280 5007 9036 13460
USA Total 1925 2280 5007 9036 13460
Canada Category I 16891 22130 14954 22600 17310
Category II 1430 2998 2802 1851
Canada Total 16891 23560 17952 25402 19161
Australia Category I 60000 95000 60000 82800 56000
Category II 2000 300 324
Australia Total 62000 95000 60000 83100 56324
New Zealand Category II 34
Other Category II 642 20 60 0
81458 120860 83019 117538 88979Total
Food Barley
JFY2015 JFY2016
Source: MAFF
Table 23. SBS Tender Results for Beer Barley
JFY2016
Apr-Sep Oct-Mar Apr-Sep Oct-Mar Apr-Sep
Australia Category I 5000 8000 0 0
Category II 2500 8000 5000
Canada Category I 4000 6000 0
Category II 4000 3000
Canada Total 0
France Category II 2000 0
Not publicized Category II 2000
5000 16500 18000 0 10000
Beer barley
JFY2015 JFY2016
Total Source: MAFF
Table 24. SBS Tender Results for Feed Barley
JFY2014 JFY2015 JFY2016 *JFY2017
1,018,047 546,127 82,040 64,310 Source: MAFF
*As of September 27, 2017
Table 25. CIF Unit Price for Feed Barley Imports (US$/MT)
MY2014/15 MY2015/16Oct 2015-
Aug 2016
Oct 2016-
Aug 2017
Change
Oct-Aug
255.4 204.77 205.3 192.5 -6.23 Source: Global Trade Atlas

Table 26. Japanese Feed Barley Imports (MT)
MY2014/15 MY2015/16Oct 2015-
Aug 2016
Oct 2016-
Aug 2017
Change
Oct-Aug
World 895391 923980 836078 852023 1.91
Australia 148449 566195 483534 825232 70.67
Ukraine 33316 186049 186049 10233 -94.50
Russia 40548 40820 40820 16558 -59.44
United Kingdom 129566 37886 37886 0 -100.00
Romania 98927 37753 32512 0 -100.00
Hungary 32640 30026 30026 0 -100.00
Canada 143031 23531 23531 0 -100.00
Bulgaria 997 1720 1720 0 -100.00
Germany 183164 0
Slovakia 1520 0
United States 83233 0 Source: Global Trade Atlas
Table 27. Japanese Food Barley Imports (MT)
MY2014/15 MY2015/16Oct 2015-
Aug 2016
Oct 2016-
Aug 2017
Change
Oct - Aug
World 201591 230961 225661 242133 7.30
Australia 139675 174900 172858 159457 -7.75
Canada 55014 47656 44964 58356 29.78
United States 3903 6378 5812 22217 282.26
France 1991 2009 2009 1995 -0.70
United Kingdom 1008 18 18 101 461.11
Korea South 0 0 0 7 Source: Global Trade Atlas
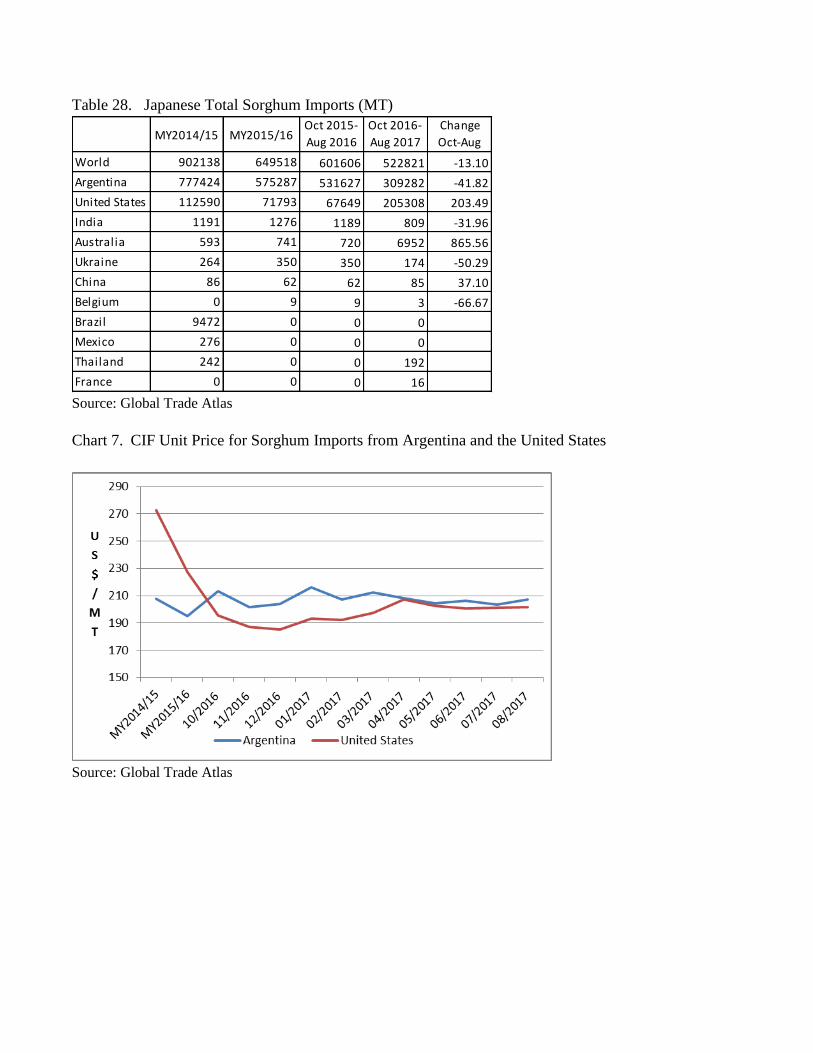
Table 28. Japanese Total Sorghum Imports (MT)
MY2014/15 MY2015/16Oct 2015-
Aug 2016
Oct 2016-
Aug 2017
Change
Oct-Aug
World 902138 649518 601606 522821 -13.10
Argentina 777424 575287 531627 309282 -41.82
United States 112590 71793 67649 205308 203.49
India 1191 1276 1189 809 -31.96
Australia 593 741 720 6952 865.56
Ukraine 264 350 350 174 -50.29
China 86 62 62 85 37.10
Belgium 0 9 9 3 -66.67
Brazil 9472 0 0 0
Mexico 276 0 0 0
Thailand 242 0 0 192
France 0 0 0 16 Source: Global Trade Atlas
Chart 7. CIF Unit Price for Sorghum Imports from Argentina and the United States
Source: Global Trade Atlas