Global and china semiconductor equipment industry report, 2014 2015
15
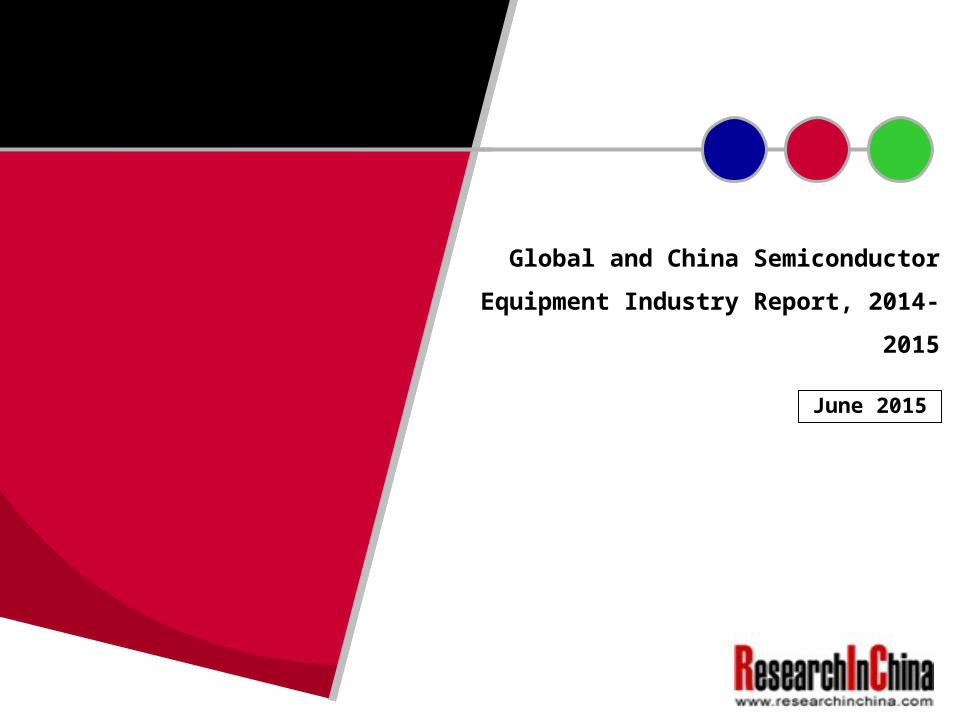
Global and China Semiconductor Equipment Industry Report, 2014- 2015 June 2015
-
Upload
researchinchina -
Category
Technology
-
view
81 -
download
1
Transcript of Global and china semiconductor equipment industry report, 2014 2015
Global and China Semiconductor
Equipment Industry Report, 2014-2015
June 2015
METHODOLOGY
Both primary and secondary research methodologies were used
in preparing this study. Initially, a comprehensive and exhaustive
search of the literature on this industry was conducted. These
sources included related books and journals, trade literature,
marketing literature, other product/promotional literature, annual
reports, security analyst reports, and other publications.
Subsequently, telephone interviews or email correspondence
was conducted with marketing executives etc. Other sources
included related magazines, academics, and consulting
companies.
INFORMATION SOURCES
The primary information sources include Company Reports,
and National Bureau of Statistics of China etc.
STUDY GOAL AND OBJECTIVES
This report provides the industry executives with strategically significant
competitor information, analysis, insight and projection on the
competitive pattern and key companies in the industry, crucial to the
development and implementation of effective business, marketing and
R&D programs.
REPORT OBJECTIVES
To establish a comprehensive, factual, annually updated and cost-
effective information base on market size, competition patterns,
market segments, goals and strategies of the leading players in the
market, reviews and forecasts.
To assist potential market entrants in evaluating prospective
acquisition and joint venture candidates.
To complement the organizations’ internal competitor information
gathering efforts with strategic analysis, data interpretation and
insight.
To suggest for concerned investors in line with the current
development of this industry as well as the development tendency.
To help company to succeed in a competitive market, and
understand the size and growth rate of any opportunity.
Room 502, Block 3, Tower C, Changyuan Tiandi Building, No. 18, Suzhou Street, Haidian District, Beijing, China 100080 Phone: +86 10 82600828 ● Fax: +86 10 82601570 ● www.researchinchina.com ● [email protected]
Copyright 2012 ResearchInChina
Abstract
Global and China Semiconductor Equipment Industry Report, 2014-
2015covers the following:
1. Global Semiconductor Market and Industry;
2. China Semiconductor Market and Industry;
3. Global and China Semiconductor Equipment Market and Industry;
4. Fifteen Semiconductor Equipment Vendors
In 2014, the global semiconductor equipment market size totaled
USD38 billion, up 10.4% from 2013. It is predicted that in 2015 this
figure will climb to USD40.5 billion, a rise of 6.7% from a year ago,
and that the market size in 2016 will slump by 5.6% as compared to
2015. However, the possible shrinkage in 2016 might come from
the following factors:
Firstly, following a peak in 2014, main electronic products such as
smartphones and tablet and laptop PCs have stagnated or
declined. This is particularly true of tablet PCs, which has presented
a significant decline. On the other hand, equipment market delays
being sluggish but will without doubt decline in 2016.
Room 502, Block 3, Tower C, Changyuan Tiandi Building, No. 18, Suzhou Street, Haidian District, Beijing, China 100080 Phone: +86 10 82600828 ● Fax: +86 10 82601570 ● www.researchinchina.com ● [email protected]
Copyright 2012ResearchInChina
Secondly, due to the global deflation, prices for bulk commodity led by
oil and iron ore plunged and would cause knock-on effect, which would
in turn result in a fall in semiconductor equipment prices.
Thirdly, global economic recovery will probably come to a halt, with the
US GDP dropping by 0.7% in 2015Q1. Moreover, China’s GDP growth
slowed obviously. The both countries constituted the major driving
force of the global economy. The stimulatory effect of US QE began to
fade away, and therefore the economy might go down.
In the future, it is difficult to come up with a start product like
smartphones. Thus, the prospects for the semiconductor industry
remain uncertain.
In 2014, semiconductor equipment vendors made remarkable
performance, with a substantial rise in operating profit, though their
revenue did not increased. The merger of Applied Material and Tokyo
Electron was rejected by the US Department of Commerce. In future,
more of M&A plans may well be intervened by the government, after
all semiconductor equipment market is a highly concentrated market.
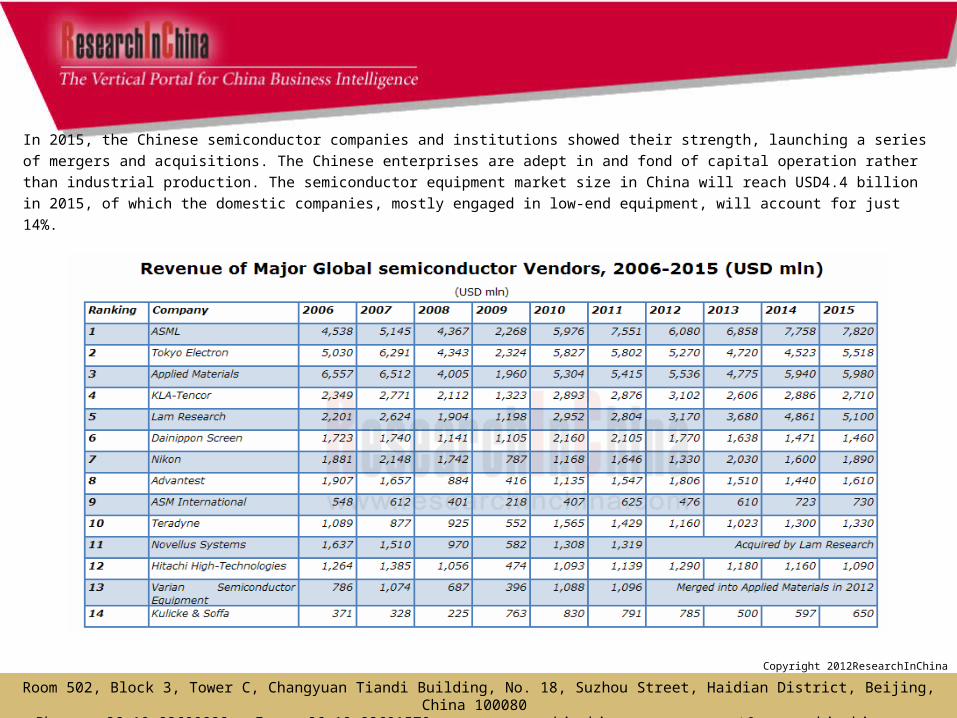
In 2015, the Chinese semiconductor companies and institutions showed their strength, launching a series of mergers and acquisitions. The
Chinese enterprises are adept in and fond of capital operation rather than industrial production. The semiconductor equipment market size
in China will reach USD4.4 billion in 2015, of which the domestic companies, mostly engaged in low-end equipment, will account for just
14%.
Room 502, Block 3, Tower C, Changyuan Tiandi Building, No. 18, Suzhou Street, Haidian District, Beijing, China 100080 Phone: +86 10 82600828 ● Fax: +86 10 82601570 ● www.researchinchina.com ● [email protected]
Copyright 2012ResearchInChina

1 Global Semiconductor Industry
1.1 Overview
1.2 Memory Industry Overview
1.3 DRAM Supply and Demand
1.4 NAND Supply and Demand
1.5 Memory Industry Chain
1.6 Market Share of Memory Vendors
1.7 Ranking of Memory Vendors
1.8 Market Share of NorFlash Vendors
1.9 IC Fabrication and Wafer Foundry
1.10 Overview of IC Packaging and Testing Industry
1.11 Chinese IC Market
1.12 China’s Semiconductor Industry
1.13 China’s Policies for Fostering Semiconductor Industry
1.14 M&A Activities in China’s Semiconductor Industry
1.15 China’s IC Industry Development Forecast
2 Semiconductor Equipment Industry
2.1 Semiconductor Equipment Market
2.2 Latest Developments of Semiconductor Equipment
2.3 Etching Equipment Industry
2.4 Thin Film Deposition Equipment Industry
2.5 Lithography Equipment Industry
2.6 Semiconductor Process Control Equipment
2.7 Compound Semiconductor Equipment Market
2.7.1 Aixtron
Table of contents
Room 502, Block 3, Tower C, Changyuan Tiandi Building, No. 18, Suzhou Street, Haidian District, Beijing, China 100080 Phone: +86 10 82600828 ● Fax: +86 10 82601570 ● www.researchinchina.com ● [email protected]
2.7.2 VEECO
2.8 Ranking of Semiconductor Equipment Vendors
2.9 China’s Semiconductor Equipment Industry
3 Major Semiconductor Equipment Vendors
3.1 Applied Materials
3.2 ASML
3.3 Tokyo Electron
3.4 KLA-Tencor
3.5 Lam Research
3.6 DAINIPPON SCREEN
3.7 Nikon Precision
3.8 Advantest
3.9 Hitachi High-Technologies
3.10 ASM International N.V.
3.11 Teradyne
3.12 ASM PACIFIC
3.13 Kulicke & Soffa
3.14 AMEC
3.15 Sevenstar Electronics
4 Semiconductor Downstream Market
4.1LTE Mobile Phone Market
4.2Global Mobile Phone Industry
4.3 China’s Mobile Phone Market
4.4 Laptop PC Market
4.5 Tablet PC Market
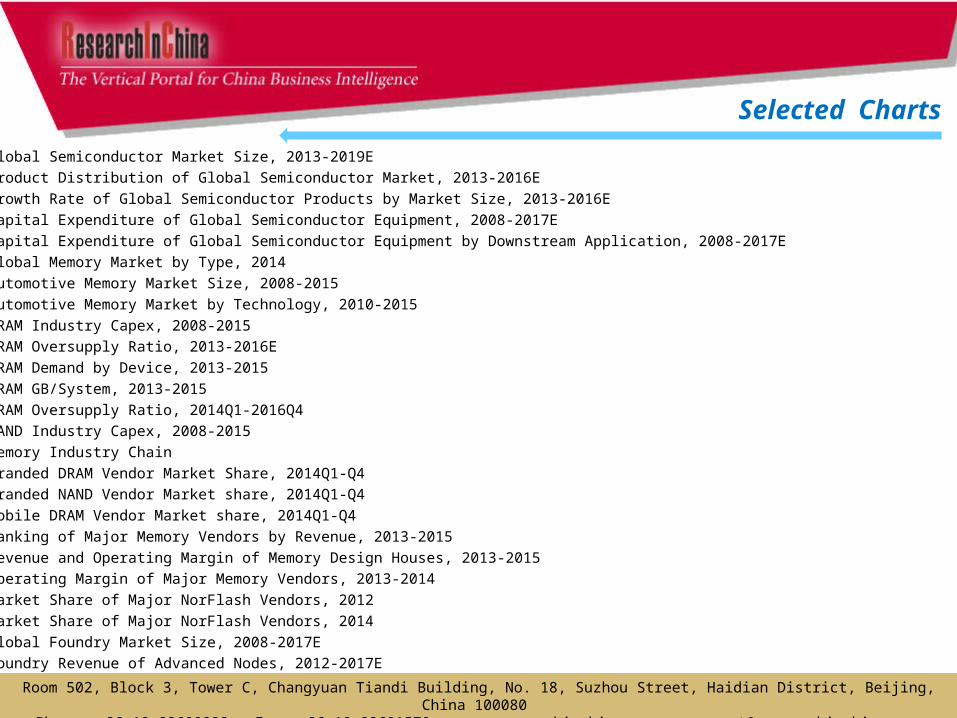
• Global Semiconductor Market Size, 2013-2019E
• Product Distribution of Global Semiconductor Market, 2013-2016E
• Growth Rate of Global Semiconductor Products by Market Size, 2013-2016E
• Capital Expenditure of Global Semiconductor Equipment, 2008-2017E
• Capital Expenditure of Global Semiconductor Equipment by Downstream Application, 2008-2017E
• Global Memory Market by Type, 2014
• Automotive Memory Market Size, 2008-2015
• Automotive Memory Market by Technology, 2010-2015
• DRAM Industry Capex, 2008-2015
• DRAM Oversupply Ratio, 2013-2016E
• DRAM Demand by Device, 2013-2015
• DRAM GB/System, 2013-2015
• DRAM Oversupply Ratio, 2014Q1-2016Q4
• NAND Industry Capex, 2008-2015
• Memory Industry Chain
• Branded DRAM Vendor Market Share, 2014Q1-Q4
• Branded NAND Vendor Market share, 2014Q1-Q4
• Mobile DRAM Vendor Market share, 2014Q1-Q4
• Ranking of Major Memory Vendors by Revenue, 2013-2015
• Revenue and Operating Margin of Memory Design Houses, 2013-2015
• Operating Margin of Major Memory Vendors, 2013-2014
• Market Share of Major NorFlash Vendors, 2012
• Market Share of Major NorFlash Vendors, 2014
• Global Foundry Market Size, 2008-2017E
• Foundry Revenue of Advanced Nodes, 2012-2017E
Selected Charts
Room 502, Block 3, Tower C, Changyuan Tiandi Building, No. 18, Suzhou Street, Haidian District, Beijing, China 100080 Phone: +86 10 82600828 ● Fax: +86 10 82601570 ● www.researchinchina.com ● [email protected]
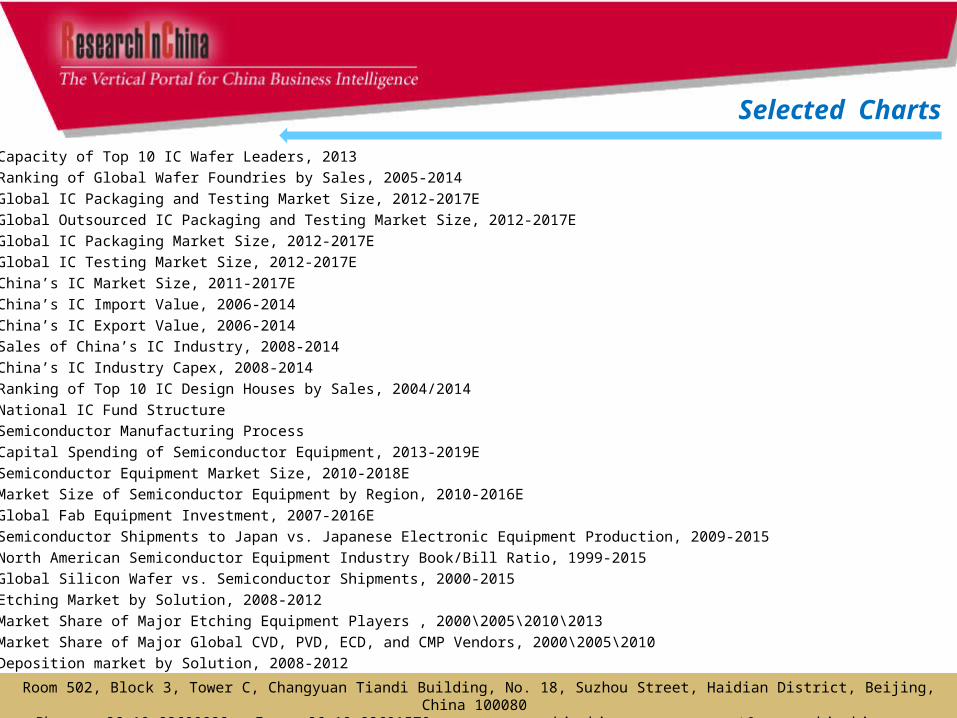
• Capacity of Top 10 IC Wafer Leaders, 2013
• Ranking of Global Wafer Foundries by Sales, 2005-2014
• Global IC Packaging and Testing Market Size, 2012-2017E
• Global Outsourced IC Packaging and Testing Market Size, 2012-2017E
• Global IC Packaging Market Size, 2012-2017E
• Global IC Testing Market Size, 2012-2017E
• China’s IC Market Size, 2011-2017E
• China’s IC Import Value, 2006-2014
• China’s IC Export Value, 2006-2014
• Sales of China’s IC Industry, 2008-2014
• China’s IC Industry Capex, 2008-2014
• Ranking of Top 10 IC Design Houses by Sales, 2004/2014
• National IC Fund Structure
• Semiconductor Manufacturing Process
• Capital Spending of Semiconductor Equipment, 2013-2019E
• Semiconductor Equipment Market Size, 2010-2018E
• Market Size of Semiconductor Equipment by Region, 2010-2016E
• Global Fab Equipment Investment, 2007-2016E
• Semiconductor Shipments to Japan vs. Japanese Electronic Equipment Production, 2009-2015
• North American Semiconductor Equipment Industry Book/Bill Ratio, 1999-2015
• Global Silicon Wafer vs. Semiconductor Shipments, 2000-2015
• Etching Market by Solution, 2008-2012
• Market Share of Major Etching Equipment Players , 2000\2005\2010\2013
• Market Share of Major Global CVD, PVD, ECD, and CMP Vendors, 2000\2005\2010
• Deposition market by Solution, 2008-2012
Selected Charts
Room 502, Block 3, Tower C, Changyuan Tiandi Building, No. 18, Suzhou Street, Haidian District, Beijing, China 100080 Phone: +86 10 82600828 ● Fax: +86 10 82601570 ● www.researchinchina.com ● [email protected]
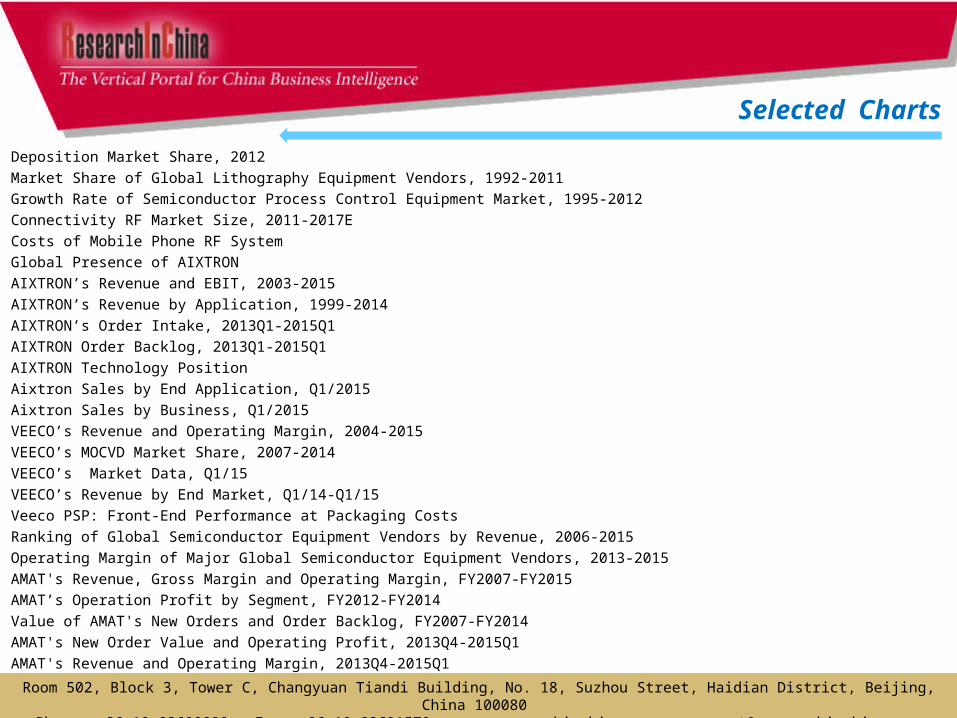
• Deposition Market Share, 2012
• Market Share of Global Lithography Equipment Vendors, 1992-2011
• Growth Rate of Semiconductor Process Control Equipment Market, 1995-2012
• Connectivity RF Market Size, 2011-2017E
• Costs of Mobile Phone RF System
• Global Presence of AIXTRON
• AIXTRON’s Revenue and EBIT, 2003-2015
• AIXTRON’s Revenue by Application, 1999-2014
• AIXTRON’s Order Intake, 2013Q1-2015Q1
• AIXTRON Order Backlog, 2013Q1-2015Q1
• AIXTRON Technology Position
• Aixtron Sales by End Application, Q1/2015
• Aixtron Sales by Business, Q1/2015
• VEECO’s Revenue and Operating Margin, 2004-2015
• VEECO’s MOCVD Market Share, 2007-2014
• VEECO’s Market Data, Q1/15
• VEECO’s Revenue by End Market, Q1/14-Q1/15
• Veeco PSP: Front-End Performance at Packaging Costs
• Ranking of Global Semiconductor Equipment Vendors by Revenue, 2006-2015
• Operating Margin of Major Global Semiconductor Equipment Vendors, 2013-2015
• AMAT's Revenue, Gross Margin and Operating Margin, FY2007-FY2015
• AMAT’s Operation Profit by Segment, FY2012-FY2014
• Value of AMAT's New Orders and Order Backlog, FY2007-FY2014
• AMAT's New Order Value and Operating Profit, 2013Q4-2015Q1
• AMAT's Revenue and Operating Margin, 2013Q4-2015Q1
Selected Charts
Room 502, Block 3, Tower C, Changyuan Tiandi Building, No. 18, Suzhou Street, Haidian District, Beijing, China 100080 Phone: +86 10 82600828 ● Fax: +86 10 82601570 ● www.researchinchina.com ● [email protected]
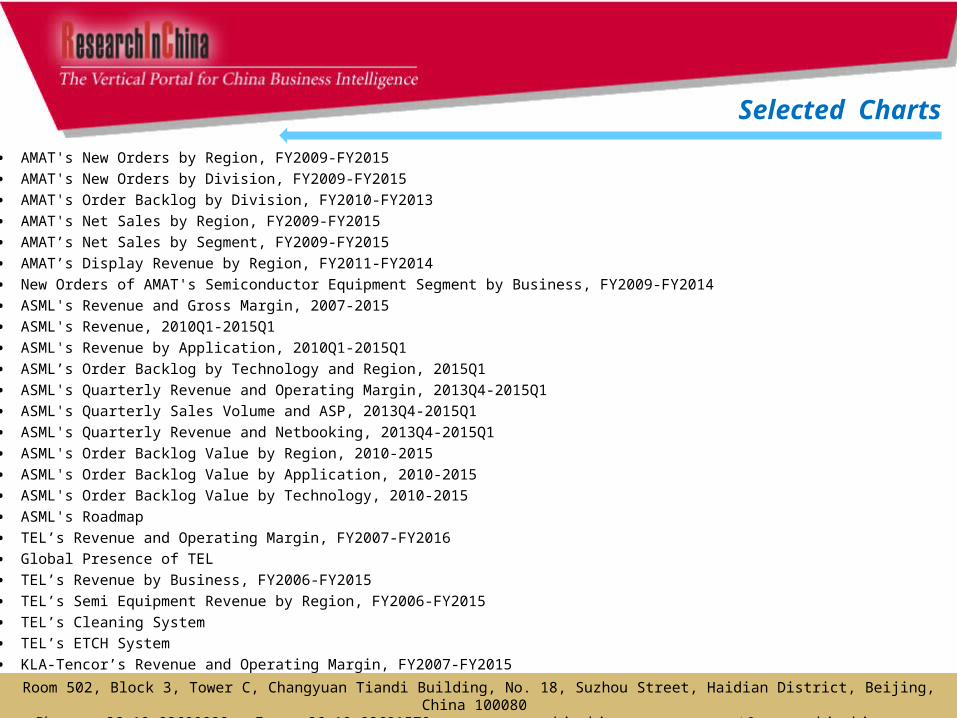
• AMAT's New Orders by Region, FY2009-FY2015
• AMAT's New Orders by Division, FY2009-FY2015
• AMAT's Order Backlog by Division, FY2010-FY2013
• AMAT's Net Sales by Region, FY2009-FY2015
• AMAT’s Net Sales by Segment, FY2009-FY2015
• AMAT’s Display Revenue by Region, FY2011-FY2014
• New Orders of AMAT's Semiconductor Equipment Segment by Business, FY2009-FY2014
• ASML's Revenue and Gross Margin, 2007-2015
• ASML's Revenue, 2010Q1-2015Q1
• ASML's Revenue by Application, 2010Q1-2015Q1
• ASML’s Order Backlog by Technology and Region, 2015Q1
• ASML's Quarterly Revenue and Operating Margin, 2013Q4-2015Q1
• ASML's Quarterly Sales Volume and ASP, 2013Q4-2015Q1
• ASML's Quarterly Revenue and Netbooking, 2013Q4-2015Q1
• ASML's Order Backlog Value by Region, 2010-2015
• ASML's Order Backlog Value by Application, 2010-2015
• ASML's Order Backlog Value by Technology, 2010-2015
• ASML's Roadmap
• TEL’s Revenue and Operating Margin, FY2007-FY2016
• Global Presence of TEL
• TEL’s Revenue by Business, FY2006-FY2015
• TEL’s Semi Equipment Revenue by Region, FY2006-FY2015
• TEL’s Cleaning System
• TEL’s ETCH System
• KLA-Tencor’s Revenue and Operating Margin, FY2007-FY2015
Selected Charts
Room 502, Block 3, Tower C, Changyuan Tiandi Building, No. 18, Suzhou Street, Haidian District, Beijing, China 100080 Phone: +86 10 82600828 ● Fax: +86 10 82601570 ● www.researchinchina.com ● [email protected]
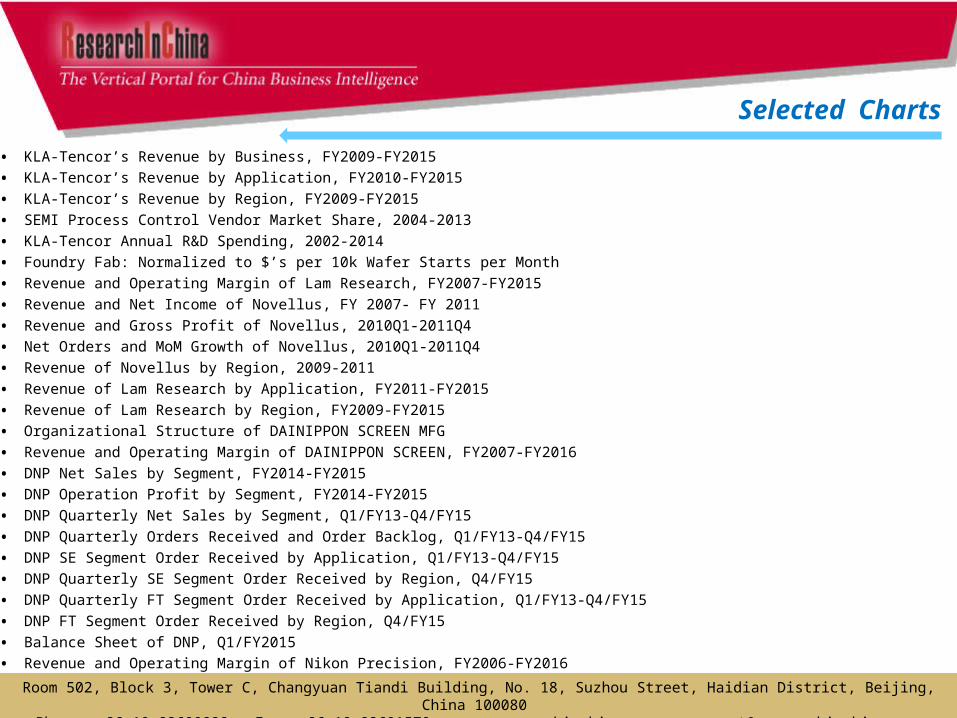
• KLA-Tencor’s Revenue by Business, FY2009-FY2015
• KLA-Tencor’s Revenue by Application, FY2010-FY2015
• KLA-Tencor’s Revenue by Region, FY2009-FY2015
• SEMI Process Control Vendor Market Share, 2004-2013
• KLA-Tencor Annual R&D Spending, 2002-2014
• Foundry Fab: Normalized to $’s per 10k Wafer Starts per Month
• Revenue and Operating Margin of Lam Research, FY2007-FY2015
• Revenue and Net Income of Novellus, FY 2007- FY 2011
• Revenue and Gross Profit of Novellus, 2010Q1-2011Q4
• Net Orders and MoM Growth of Novellus, 2010Q1-2011Q4
• Revenue of Novellus by Region, 2009-2011
• Revenue of Lam Research by Application, FY2011-FY2015
• Revenue of Lam Research by Region, FY2009-FY2015
• Organizational Structure of DAINIPPON SCREEN MFG
• Revenue and Operating Margin of DAINIPPON SCREEN, FY2007-FY2016
• DNP Net Sales by Segment, FY2014-FY2015
• DNP Operation Profit by Segment, FY2014-FY2015
• DNP Quarterly Net Sales by Segment, Q1/FY13-Q4/FY15
• DNP Quarterly Orders Received and Order Backlog, Q1/FY13-Q4/FY15
• DNP SE Segment Order Received by Application, Q1/FY13-Q4/FY15
• DNP Quarterly SE Segment Order Received by Region, Q4/FY15
• DNP Quarterly FT Segment Order Received by Application, Q1/FY13-Q4/FY15
• DNP FT Segment Order Received by Region, Q4/FY15
• Balance Sheet of DNP, Q1/FY2015
• Revenue and Operating Margin of Nikon Precision, FY2006-FY2016
Selected Charts
Room 502, Block 3, Tower C, Changyuan Tiandi Building, No. 18, Suzhou Street, Haidian District, Beijing, China 100080 Phone: +86 10 82600828 ● Fax: +86 10 82601570 ● www.researchinchina.com ● [email protected]

• NIKON Precision Equipment IC Steppers & Scanners Sales by Technology, FY2012-FY2016
• NIKON Precision Equipment LCD Steppers & Scanners Sales by Generation, FY2012-FY2016
• Advantest's Gross Margin and Operating Profit, FY2013Q1-FY2015Q4
• Advantest's New Orders by Division, FY2013Q1-FY2015Q4
• Advantest's New Orders by Region, FY2013Q1-FY2015Q4
• Advantest's Revenue by Division, FY2013Q1-FY2015Q4
• Advantest's Revenue by Region, FY2013Q1-FY2015Q4
• Advantest Capex/R&D /Depreciation, FY2013Q1-FY2015Q4
• Balance Sheet of Advantest, 2015Q1
• Global Presence of Advantest
• Revenue and Operating Margin of Hitachi High-Technologies, FY2007-FY2016
• Revenue of Hitachi High-Technologies by Division, FY2011-FY2016
• Operating Profit of Hitachi High-Technologies by Division, FY2011-FY2016
• Electronic Device System Revenue of Hitachi High-Technologies by Business, FY2013-FY2014
• Electronic Device System Front-end Revenue of Hitachi High-Technologies by Field, FY2013-FY2014
• Hitachi High-Technologies’ Reverence from Electronic Device Systems by Business, FY2015-FY2016
• ASM’s Revenue and Operating Margin, 2006-2014
• ASM’s Revenue by Business, 2006-2012
• ASM’s Sales and EBIT, 2009Q1-2015Q1
• ASM’s Net Sales and Working Capital, 2011Q1-2015Q1
• ASM’s Bookings/Backlog, 2009Q1-2015Q1
• ASM’s Front-end Revenue by Region, 2010-2014
• Profile of Universal Robots
• Shipments of Universal Robots, 2008-2014
• Teradyne’s Revenue and Operating Margin, 2006-2015
Selected Charts
Room 502, Block 3, Tower C, Changyuan Tiandi Building, No. 18, Suzhou Street, Haidian District, Beijing, China 100080 Phone: +86 10 82600828 ● Fax: +86 10 82601570 ● www.researchinchina.com ● [email protected]
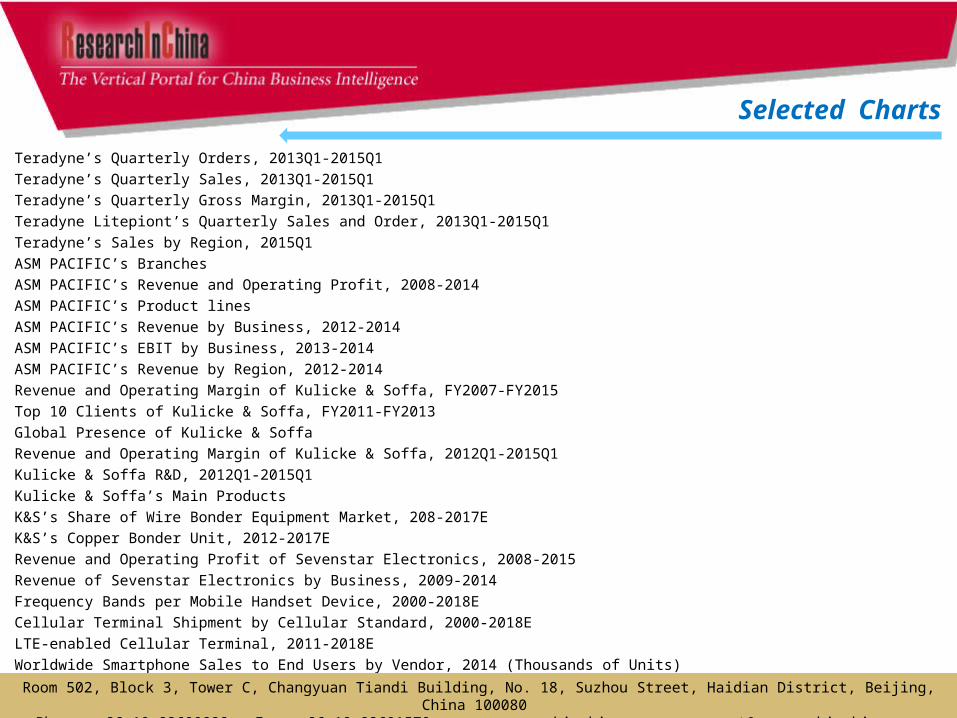
• Teradyne’s Quarterly Orders, 2013Q1-2015Q1
• Teradyne’s Quarterly Sales, 2013Q1-2015Q1
• Teradyne’s Quarterly Gross Margin, 2013Q1-2015Q1
• Teradyne Litepiont’s Quarterly Sales and Order, 2013Q1-2015Q1
• Teradyne’s Sales by Region, 2015Q1
• ASM PACIFIC’s Branches
• ASM PACIFIC’s Revenue and Operating Profit, 2008-2014
• ASM PACIFIC’s Product lines
• ASM PACIFIC’s Revenue by Business, 2012-2014
• ASM PACIFIC’s EBIT by Business, 2013-2014
• ASM PACIFIC’s Revenue by Region, 2012-2014
• Revenue and Operating Margin of Kulicke & Soffa, FY2007-FY2015
• Top 10 Clients of Kulicke & Soffa, FY2011-FY2013
• Global Presence of Kulicke & Soffa
• Revenue and Operating Margin of Kulicke & Soffa, 2012Q1-2015Q1
• Kulicke & Soffa R&D, 2012Q1-2015Q1
• Kulicke & Soffa’s Main Products
• K&S’s Share of Wire Bonder Equipment Market, 208-2017E
• K&S’s Copper Bonder Unit, 2012-2017E
• Revenue and Operating Profit of Sevenstar Electronics, 2008-2015
• Revenue of Sevenstar Electronics by Business, 2009-2014
• Frequency Bands per Mobile Handset Device, 2000-2018E
• Cellular Terminal Shipment by Cellular Standard, 2000-2018E
• LTE-enabled Cellular Terminal, 2011-2018E
• Worldwide Smartphone Sales to End Users by Vendor, 2014 (Thousands of Units)
Selected Charts
Room 502, Block 3, Tower C, Changyuan Tiandi Building, No. 18, Suzhou Street, Haidian District, Beijing, China 100080 Phone: +86 10 82600828 ● Fax: +86 10 82601570 ● www.researchinchina.com ● [email protected]
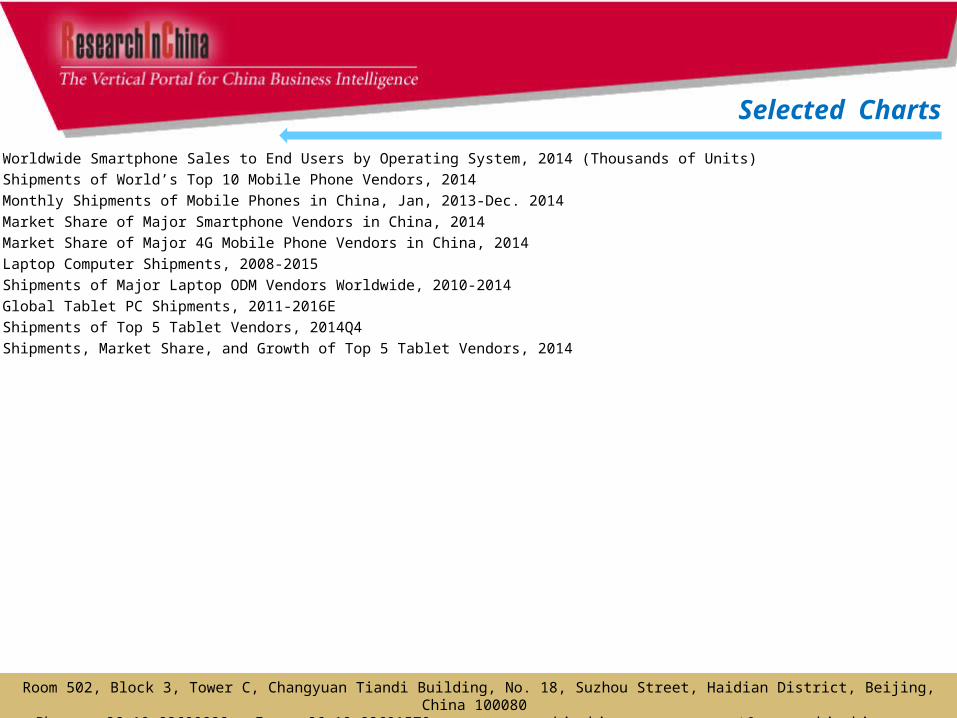
• Worldwide Smartphone Sales to End Users by Operating System, 2014 (Thousands of Units)
• Shipments of World’s Top 10 Mobile Phone Vendors, 2014
• Monthly Shipments of Mobile Phones in China, Jan, 2013-Dec. 2014
• Market Share of Major Smartphone Vendors in China, 2014
• Market Share of Major 4G Mobile Phone Vendors in China, 2014
• Laptop Computer Shipments, 2008-2015
• Shipments of Major Laptop ODM Vendors Worldwide, 2010-2014
• Global Tablet PC Shipments, 2011-2016E
• Shipments of Top 5 Tablet Vendors, 2014Q4
• Shipments, Market Share, and Growth of Top 5 Tablet Vendors, 2014
Selected Charts
Room 502, Block 3, Tower C, Changyuan Tiandi Building, No. 18, Suzhou Street, Haidian District, Beijing, China 100080 Phone: +86 10 82600828 ● Fax: +86 10 82601570 ● www.researchinchina.com ● [email protected]
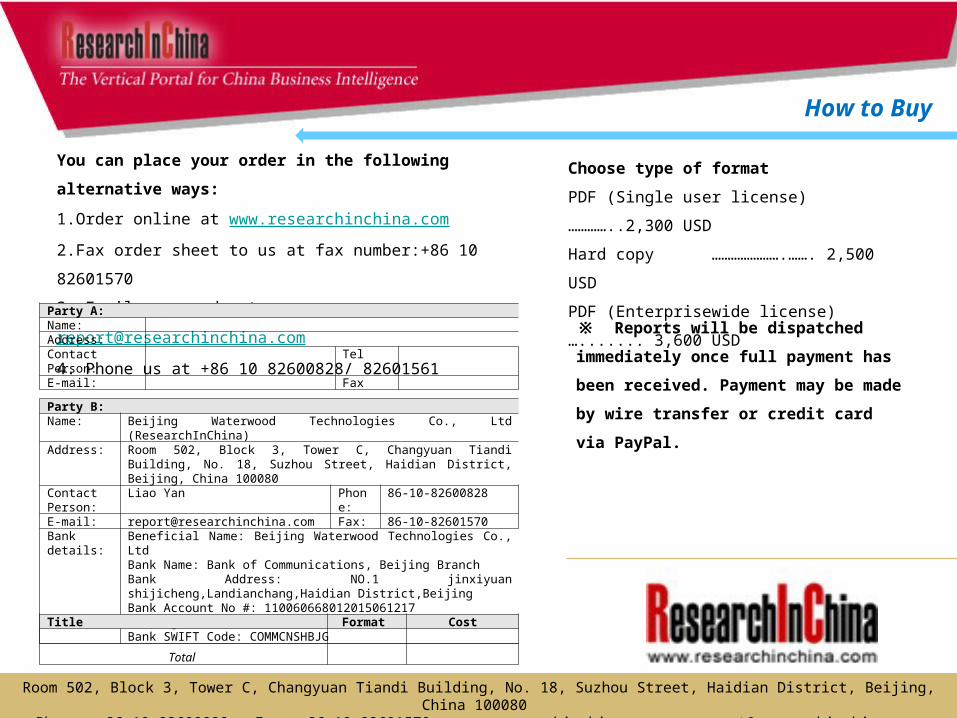
You can place your order in the following alternative ways:
1.Order online at www.researchinchina.com
2.Fax order sheet to us at fax number:+86 10 82601570
3. Email your order to: [email protected]
4. Phone us at +86 10 82600828/ 82601561
Party A:Name:Address:Contact Person: TelE-mail: Fax
Party B:Name: Beijing Waterwood Technologies Co., Ltd (ResearchInChina)Address: Room 502, Block 3, Tower C, Changyuan Tiandi Building, No. 18,
Suzhou Street, Haidian District, Beijing, China 100080Contact Person:
Liao Yan Phone:
86-10-82600828
E-mail: [email protected] Fax: 86-10-82601570Bank details:
Beneficial Name: Beijing Waterwood Technologies Co., LtdBank Name: Bank of Communications, Beijing BranchBank Address: NO.1 jinxiyuan shijicheng,Landianchang,Haidian District,BeijingBank Account No #: 110060668012015061217Routing No # : 332906Bank SWIFT Code: COMMCNSHBJG
Title Format Cost
Total
Choose type of format
PDF (Single user license) …………..2,300 USD
Hard copy ………………….……. 2,500 USD
PDF (Enterprisewide license)…....... 3,600 USD
※ Reports will be dispatched immediately
once full payment has been received.
Payment may be made by wire transfer or
credit card via PayPal.
How to Buy
Room 502, Block 3, Tower C, Changyuan Tiandi Building, No. 18, Suzhou Street, Haidian District, Beijing, China 100080 Phone: +86 10 82600828 ● Fax: +86 10 82601570 ● www.researchinchina.com ● [email protected]

About ResearchInChina
ResearchInChina (www.researchinchina.com) is a leading independent provider of China business intelligence. Our research is designed to meet the diverse planning and information needs of businesses, institutions, and professional investors worldwide. Our services are used in a variety of ways, including strategic planning, product and sales forecasting, risk and sensitivity management, and as investment research.
Our Major Activities
Multi-users market reports
Database-RICDB
Custom Research
Company Search
RICDB (http://www.researchinchina.com/data/database.html ), is a visible financial data base presented by map and graph covering global and China macroeconomic data, industry data, and company data. It has included nearly 500,000 indices (based on time series), and is continuing to update and increase. The most significant feature of this base is that the vast majority of indices (about 400,000) can be displayed in map.
After purchase of our report, you will be automatically granted to enjoy 2 weeks trial service of RICDB for free.
After trial, you can decide to become our formal member or not. We will try our best to meet your demand. For more information, please find at www.researchinchina.com
For any problems, please contact our service team at:
Room 502, Block 3, Tower C, Changyuan Tiandi Building, No. 18, Suzhou Street, Haidian District, Beijing, China 100080 Phone: +86 10 82600828 ● Fax: +86 10 82601570 ● www.researchinchina.com ● [email protected]
RICDB service