Georgia Budget Primer 2014 - Georgia Budget and Policy Institute
48
Georgia Budget Primer 2014 www.gbpi.org
Transcript of Georgia Budget Primer 2014 - Georgia Budget and Policy Institute

GEORGIA BUDGET PRIMER 2014
i | www.gbpi.org
Georgia Budget Primer 2014 www.gbpi.org

GEORGIA BUDGET PRIMER 2014
ii | www.gbpi.org
About the Georgia Budget and Policy Institute
The Georgia Budget and Policy Institute (GBPI) seeks to build a more prosperous
Georgia. We rigorously analyze budget and tax policies and provide education to
inspire informed debate and responsible decision-making, advancing our vision of
a state in which economic opportunity and well-being are widely shared among
all. We are an independent, nonprofit, nonpartisan organization founded in 2004.
Visit www.gbpi.org for more information.
© July 2013 Georgia Budget & Policy Institute • All Rights ReservedThis document may not be quoted without proper citation. A PDF is available for reference and distribution at www.gbpi.org.
Georgia Budget & Policy Institute100 Edgewood Avenue, NE
Suite 950
Atlanta, GA 30303
404.420.1324
Fax: 404.420.1329
www.gbpi.org
ii | www.gbpi.org

GEORGIA BUDGET PRIMER 2014
iii | www.gbpi.org
Table of ContentsIntroduction ................................................................................................................... 1Georgia by the Numbers ................................................................................................ 2Budget Basics ............................................................................................................... 3Steps Along Georgia’s Budget Path ................................................................................ 4Where Does the Money Come From? ............................................................................. 6Georgia’s Income Tax is Essential to Economic Growth .................................................. 8Georgia Relies on Diverse Funding Sources ................................................................... 9 General and Motor Fuel Funds ................................................................................ 10 Federal Funds ......................................................................................................... 12 Agency Funds ......................................................................................................... 13 Tobacco Funds ........................................................................................................ 14Budget Trends ............................................................................................................. 15 Revenues Can’t Keep Pace ............................................................................ 15 Georgians Paying Historically Less in Taxes ................................................... 17Reserve Fund .............................................................................................................. 18Tax Expenditures ......................................................................................................... 19Employee Cuts ............................................................................................................ 20Education .................................................................................................................. 23 Elementary and Secondary Education .......................................................... 24 Lottery Funds ............................................................................................... 26 Pre-Kindergarten .......................................................... ............................... 27 HOPE Financial Aid .......................................................... ............................. 28 University Systyem of Georgia ...................................................................... 29 Technical College System of Georgia ............................................................. 31Health Care ................................................................................................................ 32 Medicaid and PeachCare.............................................................................. 33 Medicaid Expansion .......................................................... ........................... 35 Behavioral Health and Developmental Disabilities ........................................ 36 Public Health................................................................................................ 36Human Services ........................................................................................................ 37 Fewer Resources for State’s Most Vulnerable ............................................... 38 Child Welfare Case Workers ........................................ ................................. 39 Low-Income Supports.................................................................................. 40 Adult Protective Services.............................................................................. 41Looking Ahead to Next Year ........................................................................................ 42Contact Us ................................................................................................................ 43
iii | www.gbpi.org

GEORGIA BUDGET PRIMER 2014
iv | www.gbpi.org
Figures and Charts
Figure 1: Income Tax Largest Source of State Revenue ...................................................... 6Figure 2: Revenue Estimate, 2014 Fiscal Year .................................................................... 7Figure 3: General and Federal Funds Make Up Most of State Budget .................................. 9Figure 4: Education and Health Care Dominate General Fund Spending ...........................11Figure 5: Federal Funds Primarily Pay for Health Care, Education, Transportation and Human Services ................................................................................................12Figure 6: Most Agency Funds Come From Higher Education, Tuition, Fees and Research ....................................................................................................13Figure 7: Tobacco Settlement Funds Focus on Medicaid ..................................................14Figure 8: After Seven Years Revenues Return to 2007 Level .............................................16Figure 9: Georgia’s Revenue as a Share of Income Remains at Historic Low ....................17Figure 10: Rainy Day Fund at Historically Low Level ...........................................................18Figure 11: Georgia’s Tax Expenditures are Costly................................................................19Figure 12: Fewer State Employees Serving Larger Population ............................................20Figure 13: Largest State Agency Employers on December 31, 2012 ...................................21Figure 14: Georgia Makes Deep Cuts to Education .............................................................24Figure 15: More Students With Greater Needs as Funding Shrinks .....................................25Figure 16: Most Lottery Money Supports HOPE Programs ................................................ ..26Figure 17: Quality at Risk as State Support for Pre-K Students Declines .............................27Figure 18: HOPE Award Amounts Decline Since 2001 ........................................................28Figure 19: University Funding Per Student Plummets for More Than a Decade ..................29Figure 20: $4 Billion for Health Care is Distributed to Three Agencies .................................32Figure 21: General Funds a Smaller Share of Medicaid and PeachCare Funding ................33Figure 22: Bulk of Medicaid Spending for Aged, Blind and Disabled Grows Faster than New Enrollment .................................................................................................34Figure 23: Medicaid Expansion Can Deliver Big Bang for Georgia’s Buck ...........................35Figure 24: Georgia’s Children a Major Focus of Human Services ........................................37Figure 25: Department of Human Services Budget Down 20 Percent .................................38Figure 26: Protectors of Child Welfare Stretched Thin .........................................................39Figure 27: Adult Protective Services Cases Rise, Staff Level Remains the Same ................41
iv | www.gbpi.org

GEORGIA BUDGET PRIMER 2014
1 | www.gbpi.org
Introduction
Georgia is set to spend $19.9 billion in state funds for the 2014 fiscal year. Even with slightly more revenue than in 2013, Georgia’s budget continues a pattern of cuts to vital state functions, including education and human services, that hinder efforts to improve Georgia’s economy and residents’ quality of life. Since hitting rock bottom in 2010 with the national recession, Georgia’s economy is recovering too slowly from the damage. Year after year the money coming in is not enough to meet the needs of Georgians and the demands of a modern economy. If this structural deficit is not addressed, Georgia will continue to have fewer resources to educate school children and college students, ensure safe neighborhoods, help abused children and improve vital highways and transit systems crucial to the state’s economic growth.
The Georgia Budget and Policy Institute’s 2014 Georgia Budget Primer is a guide to understanding the state’s revenue collections and its spending plan. The publication includes basics to help a novice digest the budget’s complexities. People well-versed in state budget matters will also want to keep this publication handy as a trusted reference during the twelve-month fiscal year that beginsJuly 1, 2013.
The state budget is a blueprint for Georgia’s future and, as such, it is an evolving document. The 2014 budget, approved at the close of the 2013 General Assembly, will be amended to reflect any major changes in revenue and other circumstances when state lawmakers reconvene in January for the 2014 legislative session. Please visit www.gpbi.org for in-depth analysis of the budget as it now stands and for updates as it evolves.
The steady erosion of government services and lagging investments in Georgia’s children, roads and communities are taking a toll. Georgia’s economic well-being depends on a major course correction - a new approach that balances belt-tightening with new revenues. Georgia simply cannot cut its way back to prosperity.

GEORGIA BUDGET PRIMER 2014
2 | www.gbpi.org
Georgia by the Numbers
Importance of the State BudgetGeorgia’s budget for 2014 touches the lives of people in every corner of the state. From the mountains of north Georgia to the southern coastal plains, the spending plan affects the quality of life in Georgia’s communities. The state’s future prosperity depends on Georgia’s investments in essential services like education, health care, public safety and transportation, just to name a few. Here are some examples of the wide impact the state budget has on the lives of Georgians:
1.7 million – approximate number of children in the K-12 public school system ($7.4 billion in the 2014 state budget)
1.7 million – approximate number of Georgians who receive health care coverage who are seniors, disabled, children or low-income parents ($2.8 billion in the 2014 state budget)
18,000 – approximate miles of road overseen by the Georgia Department of Transportation ($836 million in 2014 state budget)
53,000 – approximate number of inmates in Georgia Department of Corrections facilities ($1.1 billion in 2014 state budget)
Where Georgia Ranks Among the States
When it’s good to rank first, Georgia is…
50th – in Medicaid spending per patient
(Out of 51)
40th – in eighth grade math scores
When it’s good to rank fiftieth, Georgia is…
5th – in the number of residents living in poverty
5th – in the number of residents without
health insurance
Sources: Federation of Tax Administrators, U.S. Census Bureau, National Assessment of Educational Progress, Kaiser Family Foundation, State Health Facts.
49thGeorgia’s rank in
state revenue per person (42nd in local and state
revenue per person)

GEORGIA BUDGET PRIMER 2014
3 | www.gbpi.org
Budget Basics
Georgia’s 2014 fiscal year is July 1, 2013 through June 30, 2014 and the total
budget available to the state is $37.2 billion. That includes $19.9 billion in state
funding, $11.3 billion in federal funding and $5.5 billion in agency funds.
The state budget outlines Georgia’s priorities, how it plans to spend money to meet
them and how much revenue it expects to collect. It is the most important piece
of legislation lawmakers pass. In fact, it is the only legislation that the General
Assembly is legally mandated to pass each year. The Georgia Constitution requires
the state to maintain a balanced budget, which means the government cannot
spend more money than it collects in revenues.
The budget process is ongoing. Even as Georgia is implementing its current
budget, it is auditing the previous year’s budget and planning for the next one.
Beyond the General Assembly, many others participate in the process, including
the governor, state budget director, state economists, agency leaders and budget
officials, state auditors, advocates and the public.

GEORGIA BUDGET PRIMER 2014
4 | www.gbpi.org
Steps Along Georgia’s Budget Path (1-6)
1
2
AGENCY
Budget Request Instructions Sent to Agencies: In early summer, the Governor’s Office of Planning and Budget (OPB) sends guidelines to agencies for budget requests.
Agencies Prepare Budget Request:Agencies prepare requests and get board approval (if applicable).
4BUDGET
REQUEST
Budget Request Analyzed:The governor, OPB staff, and agency leaders review and assess current and new budget requests.
BUDGETREQUEST
Budget Request Submitted:Agencies submit all requests for current and upcoming fiscal year to OPB by September 1.
3
6
Budget Documents Sent to the General Assembly: In January, within the first five days of the General Assembly session, the governor presents his budget proposals.
5BUDGET
PROPOSAL
Governor Finishes Budget: By the end of the calendar year, the governor finalizes the budget proposals.
Steps Along Georgia’s Budget Path (1-6)

GEORGIA BUDGET PRIMER 2014
5 | www.gbpi.org
11
12
BUDGETREQUEST
HOUSE8
House Approves Its Budget The House votes on its changes to governor’s budget proposals. Passes its version to the Senate.
HOUSE
SENATE
APPROPRIATIONS COMMITTEES
7
Legislative Appropriations Process: The Appropriations committees in the Georgia House of Representatives and Senate hold budget hearings for the current and upcoming ficsal year.
9 SENATE
Senate Approves its Budget: The Senate reviews the House-passed budget for the current and upcoming fiscal years, can make changes, then votes on latest versions.
FInal Version Approved: The House and the Senate each vote to approve the final version.
Appropriations Bill Sent to Governor:The governor has 40 days from the end of the legislative session to sign the budget bill into law and may veto specific parts of it.
10
Conference Committee Meets: The lieutenant governor and Speaker of the House appoint a conference committee to negotiate a single version of the budget.
CONFERENCE COMMITTEE
Steps Along Georgia’s Budget Path (7-12)

GEORGIA BUDGET PRIMER 2014
6 | www.gbpi.org
Where Does the Money Come From?
Georgia’s fiscal health depends on the state’s ability to raise money from diverse
sources in a reliable way. While Georgia has a mix of income taxes, sales taxes and
other fees, the reliability of the revenue structure is faltering. The tax code needs
to be updated to reflect Georgia’s shift in recent decades to a more service-based
economy from one that relied on sales of cars, household appliances and other
tangible goods. Many services in Georgia are not taxed, depleting the state’s
revenue year after year. The income tax accounts for about half of all state revenue
and is the most stable of Georgia’s revenue sources. The income tax adds the
most stability and fairness to the state revenue stream. (See “Georgia’s Income Tax
Essential to Economic Growth” on page 8.)
Source: Georgia’s 2014 Fiscal Year Budget (HB 106), signed by governor
Figure 1 Income Tax Largest Source of State Revenue 2014 Fiscal Year Total State Revenue Projection is $19.9 billion
$8.9BPersonal Income Tax
$5.1BSales and Use Tax
$3.1BOther Taxes and Fees
$972 MMotor Fuel Tax
$911 MLottery Funds
$775 MCorporate Income Tax
$200 MTobacco Settlement

GEORGIA BUDGET PRIMER 2014
7 | www.gbpi.org
Figure 2 Revenue Estimate, 2014 Fiscal Year
INCOME TAXES
Personal Income Tax $8,895,846,000 44.7%
Corporate Income Tax $775,314,000 3.9%
$9,671,160,000 48.5%
SALES TAXES
Sales and Use Tax $5,094,297,000 25.6%
OTHER TAXES AND FEES
Tobacco Tax $232,268,000 1.2%
Alchohol Beverage Tax $181,044,303 0.9%
Property Tax $ 31,395,827 0.2%
Insurance Premium Tax $356,919,500 1.8%
Motor Vehicle License Tax $325,214,799 1.6%
Nursing Home Provider Fees $167,756,401 0.8%
Title Fee $733,000,000 3.7%
Hospital Provider Payments $241,674,441 1.2%
All Other Interest Fees and Sales $787,721,211 4.0%
$3,064,734,698 15.4%
DESIGNATED FUNDS AND OTHER REVENUE SOURCES
Motor Fuel Tax $972,027,000 4.9%
Lottery Funds $910,819,213 4.6%
Tobacco Settlement Funds $ 199,758,761 1.0%
Brain and Spinal Injury Trust Fund $1,988,502* 0.0%
Payments from State Organizations $9,346,425* 0.0%
$2,090,069,783 10.5%
Total $19,920,261,481 100.0%
Source: Governor’s Budget Report Fiscal Year 2014*Less than .01%

GEORGIA BUDGET PRIMER 2014
8 | www.gbpi.org
Georgia’s Income Tax Essential to Economic Growth
Georgia’s tax on income provides a reliable stream of money to pay for schools,
health care and other vital public needs. It is the source of about half of the revenue
collected by the state, helps keep the sales tax rate relatively low and earns the
state a top credit rating that keeps the cost of borrowing low.
Out of about $19.9 billion in state revenues Georgia expects to collect in the
2014 fiscal year, $9.7 billion is projected to come from the income tax. To put that
in perspective, the income tax alone this year could pay all of Georgia’s public
education costs – for K-12 schools, universities and technical colleges. It brings
in more than twice as much as the state expects to spend on health care during
the year.
But this steady and vital source of revenue might be in jeopardy. In 2014, the
Georgia General Assembly is set to consider fundamentally altering Georgia’s
diverse approach to funding the public’s essential needs. At least two of the
proposals would reduce or eliminate Georgia’s income tax and replace it with an
increased sales tax.
Doing so would hurt families and businesses by eroding investments in schools,
transportation, public safety and other ingredients crucial to a strong economy.
Middle-class and low-income Georgians would end up paying more of their
earnings in other, less equitable taxes, such as the sales tax, while upper-income
Georgians would get a substantial tax break.

GEORGIA BUDGET PRIMER 2014
9 | www.gbpi.org
Georgia Relies on Diverse Funding Sources
Including federal funds, the total 2014 Georgia budget is $37.2 billion and is made
up of six funding sources:
n General Funds – Education, public safety and most other traditional state
services are paid for from the General Fund.
n Federal Funds – A large share of Georgia’s overall spending for services is
through administration of federal funds.
n Agency Funds – These funds consist mostly of higher education tuition and
fees and research funds.
n Lottery Funds – These are dedicated to Pre-Kindergarten programs and
scholarships for higher education.
n Tobacco Settlement Funds – This ongoing annual payment resulting from a
legal settlement with the country’s four largest tobacco companies over health
care costs can be used for any reason in the budget.
Figure 3 General and Federal Funds Make Up Most of the State Budget 2014 Fiscal Year State Budget Total $37.2 Billion
$17.8 BGeneral Funds
$11.8 BFederal Funds
$5.5 BAgency Funds
$972 MMotor Fuel Funds
$911 MLottery Funds
$200 MTobacco Funds
Source: Georgia’s 2014 Fiscal Year Budget (HB 106), signed by governor

GEORGIA BUDGET PRIMER 2014
10 | www.gbpi.org
General and Motor Fuel Funds
$18,807,695,005 (51 percent of Georgia’s budget)
General funds come from state taxes and fees. Nearly 96 cents of every dollar
collected goes to seven areas:
n K-12 and Post-Secondary Education (52 cents of every dollar spent)
n Health Care (21 cents)
n Public Safety (9 cents)
n Debt Service (6 cents)
n Transportation (4 cents)
n Department of Human Services (3 cents)
n Judicial and Legislative branches (1 cent)
The remaining four cents of each dollar pays for all other state agencies, boards
and commissions.
Motor Fuel Funds
Georgia’s Constitution restricts spending of Motor Fuel Funds to public roads
and bridges. The state collects a motor fuel excise tax of 7.5 cents per gallon on
gasoline, diesel fuel, gasohol, liquid propane and other fuels. The state also levies
a 4 percent sales tax on motor fuel sold at the pump. Of that retail tax, 3 percent
goes to transportation with the remaining 1 percent going to the General Fund.
Georgia’s budget for the 2014 fiscal year spends nearly $976 million in Motor Fuel
Funds. Of this amount, $829 million goes to the Department of Transportation
and $147 million is appropriated to the General Obligation Debt Sinking Fund, or
debt service.
GEORGIA BUDGET PRIMER 2014
11 | www.gbpi.org
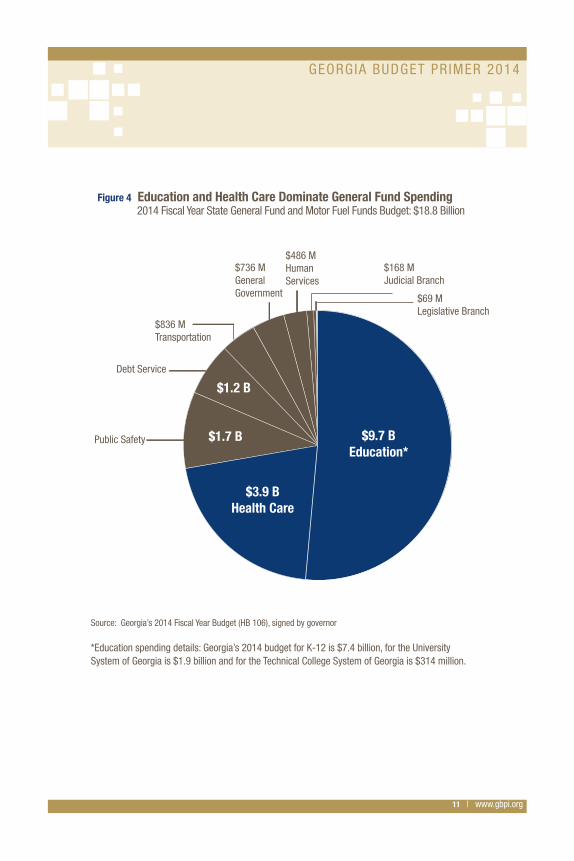
Figure 4 Education and Health Care Dominate General Fund Spending 2014 Fiscal Year State General Fund and Motor Fuel Funds Budget: $18.8 Billion
Source: Georgia’s 2014 Fiscal Year Budget (HB 106), signed by governor
*Education spending details: Georgia’s 2014 budget for K-12 is $7.4 billion, for the University System of Georgia is $1.9 billion and for the Technical College System of Georgia is $314 million.
$9.7 BEducation*
$3.9 BHealth Care
$1.7 B
Debt Service
$736 MGeneral Government
$168 MJudicial Branch
Public Safety
$1.2 B
$836 MTransportation
$486 MHuman Services
$69 MLegislative Branch

GEORGIA BUDGET PRIMER 2014
12 | www.gbpi.org
Federal Funds
$11,773,819,282 (32 percent of Georgia’s budget) Money from the federal government flows to a wide variety of state programs and services. As Congress continues to cut the federal budget, important services are at risk throughout the state. The great majority of federal money is spent for the following:
n $6.2 billion for Medicaid and PeachCare
n $2.1 billion for students with disabilities, low-income students, school nutrition
and other education services
n $1.2 billion for the Georgia Department of Transportation
n $1 billion for child welfare, elder services, Temporary Assistance for Needy
Families (TANF) and other human services
The state is required to use its own dollars to match federal funding for Medicaid and many human services. Consequently, a cut in state funds for a service can lead to a corresponding cut in federal funds.
Figure 5 Federal Funds Primarily Pay for Health Care, Education, Transportation, and Human Services 2014 Federal Funds, $11.8 Billion
Source: Georgia’s 2014 Fiscal Year Budget (HB 106), signed by governor
$6.2 BMedicaid/Peachcare
$2.1 BEducation
$1.2 B
$640 MHuman Services
$356 M TANF
Transportation
$607 MAll Other Health Care
$572 MAll Other Agencies

GEORGIA BUDGET PRIMER 2014
13 | www.gbpi.org
Agency Funds
$5,474,687,715 (15 percent of Georgia’s budget)
Agency Funds include $1.9 billion in tuition and fees paid by University System of
Georgia and Technical College System students and $2 billion in University System
of Georgia research funds. The money is retained by the individual schools.
Figure 6 Most Agency Funds Come From Higher Education Tuition, Fees and Research
Source: Georgia’s 2014 Fiscal Year Budget (HB 106), signed by governor
Tuition and Fees for Higher Education $1,857,602,633
University System of Georgia Research Funds $1,972,097,601
All Other $1,644,987,481
Total $5,474,687,715

GEORGIA BUDGET PRIMER 2014
14 | www.gbpi.org
Tobacco Funds
$199,758,761 (0.5 percent of Georgia’s budget)
Georgia receives annual payments from a legal settlement with four of the
country’s largest tobacco companies, known as the Tobacco Master Settlement
Agreement (MSA). Georgia does not earmark MSA payments for specific purposes.
As a result, the use of tobacco settlement funds can vary from year to year.
Due to a supplemental settlement, Georgia will receive $56 million in additional
one-time funds for the 2014 fiscal year, which will go to Medicaid for the lowest
income families.
FIGURE 7 Tobacco Settlement Funds Focus on Medicaid
Source: Georgia’s 2014 Fiscal Year Budget (HB 106), signed by governor
2014 Tobacco Settlement Fund Budget
Low-Income Medicaid $166,193,257
Mental Retardation Waiver Programs $10,255,133
Georgia Cancer Coalition $4,193,740
Cancer Treatment for Low-Income Uninsured $6,613,249
Elder Community Living and Support Services $6,191,806
Cancer Screening $2,915,302
Smoking Prevention and Cessation $2,368,932
Underage Smoking Compliance $433,733
Clinical Trials $275,000
Cancer Program Administration $202,917
Cancer Registry $115,637
Total $199,758,761

GEORGIA BUDGET PRIMER 2014
15 | www.gbpi.org
Budget Trends
Revenues Can’t Keep Pace With Needs
The Great Recession caused a dramatic decline in General and Motor Fuel Funds
between the 2007 and 2010 fiscal years, when they fell by $3.6 billion, or 19.2
percent. Those revenues increased in the 2011 and 2012 fiscal years and are
projected to continue growing in 2013 and 2014 due to moderate economic
growth and a slight increase in various taxes and fees. But the revenue increases
between 2011 and 2014 are not sufficient to replenish the vast majority of services
that suffered from cuts lawmakers made between 2007 and 2010. In fact, even
with increased revenues, most state agency budgets were cut again in 2014. The
moderate revenue uptick is unable to keep up with the normal growth in need for
services, driven by population increase and inflation. For instance, more students
are enrolled in Georgia schools, and health care costs are rising faster than costs
for other services. Revenues are expected to rise by $514 million in the current
budget year compared to the prior year, while spending due to population increases
and ongoing obligations is up by about $700 million. The net result is an additional
budget cut of more than $200 million in spending.
The increased needs in the 2014 fiscal year budget include:
n $255 million for increased student enrollment in K-12 schools and the
University System of Georgia
n $224 million for population growth and shortfalls in Medicaid
n $143 million for increases in state employee and teacher health benefits and
retirement obligations
n $35 million to improve treatment for people with mental and developmental disabilities under an agreement between the state and the U.S.
Justice Department

GEORGIA BUDGET PRIMER 2014
16 | www.gbpi.org
Figure 8 After Seven Years Revenues Return to 2007 Level General and Motor Fuel Funds 2007-2014 Fiscal Years
Sources: Governor’s Budget reports, fiscal years 2007- 2014
*Governors FY 2013 Revenue Estimate, includes National Mortgage Settlement and Mid-Year Adjustment Reserve** Governor’s FY 2014 Revenue Estimate
0
$5,000,000,000
$10,000,000,000
$15,000,000,000
$20,000,000,000
FY 2007 FY 2008 FY 2009 FY 2010 FY 2007 FY 2012 FY 2013 FY 2014**
$18.8 $18.7
$16.8
$15.2
$16.6$17.3
$18.3 $18.8
*

GEORGIA BUDGET PRIMER 2014
17 | www.gbpi.org
Georgians Paying Historically Less in Taxes
Georgians now pay less in state taxes as a percentage of income than at any point in the last 30 years. During the 1990s, Georgians paid an average of 5.9 percent of their income in state taxes. Even though the state cut taxes during the 1990s, reducing or eliminating various personal and corporate income taxes and approving a sales tax exemption on food, the share of the average Georgian’s income taxed to support state government remained the same. A strong economy allowed the state to cut taxes, while maintaining support for services.
This dynamic changed last decade. The tax cuts, combined with two recessions and the weak recoveries that followed, caused a dramatic drop in the percentage of income Georgians pay in taxes. Revenues plummeted as a share of personal income from 2010 to 2012, reaching historic lows of about 4.7 percent, where they are projected to remain through the 2014 fiscal year. This loss of revenue, rather than a major increase in state spending, explains the fiscal crisis facing the state.
If the average taxpayer paid 5.6 percent of her or his personal income in state income taxes in 2014, the lowest that share reached in the 1990s, Georgia would gain $3.6
billion to make investments in necessities such as education and health care.
Figure 9 Revenue as a Share of Income at Historic Low Percentage of Income (1989 – 2013 Fiscal Years)
Sources: Governor’s Budget reports and U.S. Bureau of Economic Analysis
GEORGIA BUDGET PRIMER 2014
18 | www.gbpi.org
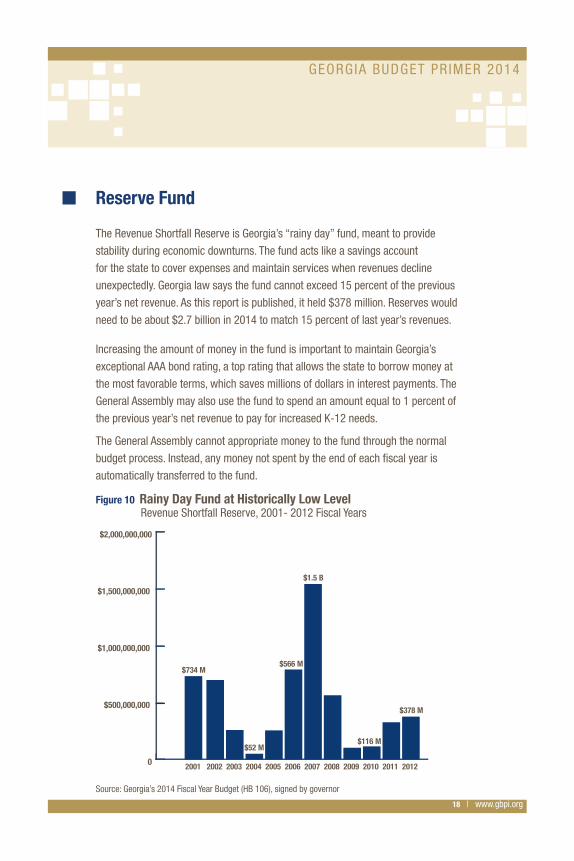
Reserve Fund
The Revenue Shortfall Reserve is Georgia’s “rainy day” fund, meant to provide
stability during economic downturns. The fund acts like a savings account
for the state to cover expenses and maintain services when revenues decline
unexpectedly. Georgia law says the fund cannot exceed 15 percent of the previous
year’s net revenue. As this report is published, it held $378 million. Reserves would
need to be about $2.7 billion in 2014 to match 15 percent of last year’s revenues.
Increasing the amount of money in the fund is important to maintain Georgia’s
exceptional AAA bond rating, a top rating that allows the state to borrow money at
the most favorable terms, which saves millions of dollars in interest payments. The
General Assembly may also use the fund to spend an amount equal to 1 percent of
the previous year’s net revenue to pay for increased K-12 needs.
The General Assembly cannot appropriate money to the fund through the normal
budget process. Instead, any money not spent by the end of each fiscal year is
automatically transferred to the fund.
Figure 10 Rainy Day Fund at Historically Low Level Revenue Shortfall Reserve, 2001- 2012 Fiscal Years
Source: Georgia’s 2014 Fiscal Year Budget (HB 106), signed by governor
0
$500,000,000
$1,000,000,000
$1,500,000,000
$2,000,000,000
2001 2002 2003 2004 2005 2006 2007 2008 2009 2010 2011 2012
$734 M
$52 M
$566 M
$1.5 B
$116 M
$378 M

GEORGIA BUDGET PRIMER 2014
19 | www.gbpi.org
Tax Expenditures
Georgia foregoes billions of dollars in revenue each year due to dozens of special
tax breaks, known collectively as “tax expenditures.” Like state spending, these
tax breaks are meant to promote specific activities or goals, such as economic
development or support for working families.
Georgia’s assortment of tax expenditures is projected to cost the state treasury
more than $3 billion in the 2014 budget year – roughly equivalent to Georgia’s
investment in health care, the state’s second-largest area of spending. Unlike with
health care and other direct spending, lawmakers are not required to regularly
measure whether tax expenditures are delivering the benefits they promise, such
as job creation. Most remain on the books for years, even decades, without review.
Figure 11 Georgia’s Tax Expenditures are Costly
Sources: Georgia Tax Expenditure Report for Fiscal Year 2014, Georgia 2014 Fiscal Year Budget (HB 106) signed by governor
Note: All tax expenditure totals are approximate. Also, totals for the personal income tax exclude the personal exemption, standard deduction and credit for taxes paid to other states.
0
$1,000,000,000
$2,000,000,000
$3,000,000,000
$4,000,000,000
$5,000,000,000
$6,000,000,000
$7,000,000,000
$8,000,000,000
K-12Education
Medicaid,PeachCare andPublic Health
Regents andTechnical Colleges
HumanServices
TaxExpenditures
$3.2 B
$486 M
$2.2 B
$3.0 B
$7.4 BType of Tax BreakSales & Use: $1.57 billionPersonal Income: $911 millionCorporate Income: $352 millionInsurance Premium: $346 millionOther: $55 million

GEORGIA BUDGET PRIMER 2014
20 | www.gbpi.org
Employee Cuts
Georgia expects to cut the number of state employees* during the 2014 fiscal year
to 12,426 fewer than it employed in 2008, a reduction of 15.1 percent over those
six years. In 1999, Georgia employed 6,021 more people than it does today. The
population state workers serve, however, has grown by more than 2 million, or 25
percent, since then.
The result is a much smaller group of state employees trying to serve a much
larger population. That means fewer child protection workers watching out for
abuse and neglect, fewer state patrol officers keeping highways safe, fewer health
and safety inspectors protecting the public from illness and injury and fewer
examiners to meet the demand for business licenses.
* Excludes Board of Regents, University System
Figure 12 Fewer State Employees Serving Larger Population*
Source: Email from Georgia Department of Administrative Services, April 15, 2013
0
20,000
40,000
60,000
80,000
100,000
2003 2004 2005 2006 2007 2008 2009 2010 2011 2012 2013
82,080
69,654
81,248
GEORGIA BUDGET PRIMER 2014
21 | www.gbpi.org
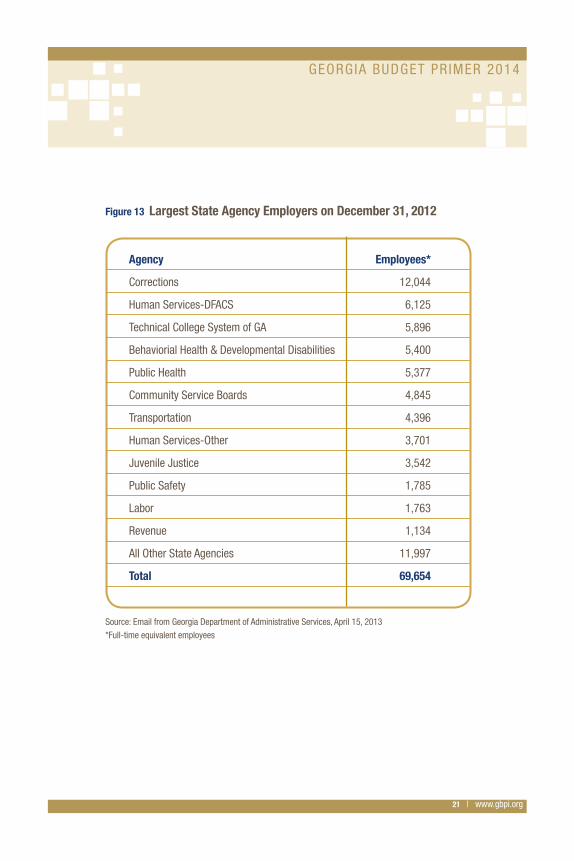
Figure 13 Largest State Agency Employers on December 31, 2012
Source: Email from Georgia Department of Administrative Services, April 15, 2013*Full-time equivalent employees
Agency Employees*
Corrections 12,044
Human Services-DFACS 6,125
Technical College System of GA 5,896
Behaviorial Health & Developmental Disabilities 5,400
Public Health 5,377
Community Service Boards 4,845
Transportation 4,396
Human Services-Other 3,701
Juvenile Justice 3,542
Public Safety 1,785
Labor 1,763
Revenue 1,134
All Other State Agencies 11,997
Total 69,654
GEORGIA BUDGET PRIMER 2014
22 | www.gbpi.org
A Detailed Look at Georgia’s 2014 Budget
Education ........................................................................... 23
Health Care ........................................................................ 32
Human Services ................................................................ 37

GEORGIA BUDGET PRIMER 2014
23 | www.gbpi.org
Education in Georgia: Growing Expectations, Shrinking State Investment
The $9.7 billion Georgia is investing in education in 2014 accounts for more than half
of all state expenses. Elementary and secondary education make up $7.4 billion of
Georgia’s education funding.
Georgia’s investment in its students is falling even as its expectations of what
they will accomplish are rising. For years the Legislature has cut funding for Pre-
Kindergarten and elementary and secondary schools as well as for technical colleges
and universities. At the same time, state leaders—recognizing the essential role of
education in developing a workforce that will foster a strong Georgia economy—have
laid out ambitious goals for students at all levels. Those goals will be harder to meet
without additional investments in Pre-K, schools and colleges.
In K-12, student achievement goals rise each year under the state’s accountability
system. In addition, Georgia is ramping up its expectations of student performance in
math and English under the Common Core Georgia Performance Standards.
In higher education, the state wants to significantly increase the number of students
who earn a diploma, a certificate or a degree as outlined in the Complete College
Georgia initiative. It is also shifting to a system that funds colleges and universities
based on the number of students who finish their programs of study. This new
approach ends the link between enrollment and funding. Beginning in 2015,
institutions will receive additional funding when they meet graduation goals, not when
enrollment increases.
Helping students learn more and complete their studies at all levels is essential. Sixty
percent of all jobs in the state will require postsecondary study by 2020 and Georgia
is a long way from offering a workforce that can meet this demand. That requires
adequate funding, something few educators have today after years of budget cuts.

GEORGIA BUDGET PRIMER 2014
24 | www.gbpi.org
Elementary and Secondary Education: K-12 Funding Formula Short $1 Billion
In fiscal year 2014, the formula the state uses to distribute most state dollars to
local school districts, the Quality Basic Education program (QBE), is underfunded by
$1 billion. The Legislature has underfunded schools every year since 2002, cutting
more than $7.6 billion from the QBE formula.
Figure 14 Georgia Makes Deep Cuts to Education Through the QBE Formula Each Year
Source: Georgia Department of Education, QBE Earnings Sheets, 2014, Midterm 2002- 2013 fiscal years
Local districts must make up the funding shortfall, and many are making cuts that
can undermine student success, including increasing class sizes and shrinking the
school calendar.
-$1,500,000,000
-$1,200,000,000
-$900,000,000
-$600,000,000
-$300,000,000
$0
2003 2004 2005 2006 2007 2008 2009 2010 2011 2012 2013 2014
QBE Funds
Quality Basic Education Funds
GEORGIA BUDGET PRIMER 2014
25 | www.gbpi.org
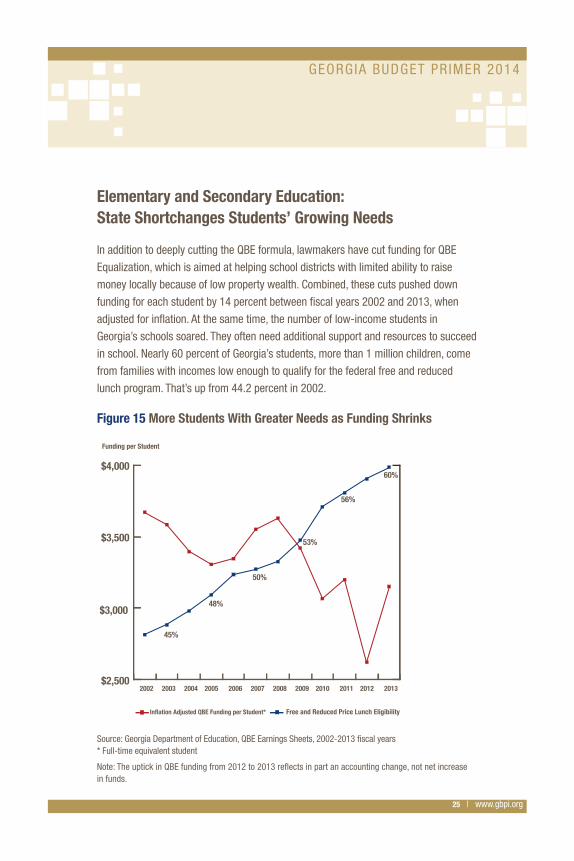
Elementary and Secondary Education: State Shortchanges Students’ Growing Needs
In addition to deeply cutting the QBE formula, lawmakers have cut funding for QBE
Equalization, which is aimed at helping school districts with limited ability to raise
money locally because of low property wealth. Combined, these cuts pushed down
funding for each student by 14 percent between fiscal years 2002 and 2013, when
adjusted for inflation. At the same time, the number of low-income students in
Georgia’s schools soared. They often need additional support and resources to succeed
in school. Nearly 60 percent of Georgia’s students, more than 1 million children, come
from families with incomes low enough to qualify for the federal free and reduced
lunch program. That’s up from 44.2 percent in 2002.
Figure 15 More Students With Greater Needs as Funding Shrinks
Source: Georgia Department of Education, QBE Earnings Sheets, 2002-2013 fiscal years* Full-time equivalent student
Note: The uptick in QBE funding from 2012 to 2013 reflects in part an accounting change, not net increase in funds.
$2,500
$3,000
$3,500
$4,000
45%
48%
50%
53%
56%
60%
2002 2003 2004 2005 2006 2007 2008 2009 2010 2011 2012 2013
Inflation Adjusted QBE Funding per Student* Free and Reduced Price Lunch Eligibility
Funding per Student

GEORGIA BUDGET PRIMER 2014
26 | www.gbpi.org
Lottery Funds: Support for Young Children and College StudentsGeorgia expects to collect $910 million from lottery sales in 2014, which can be used
to fund:
n Helping Outstanding Pupils Educationally (HOPE) Scholarships for high-achieving
students pursuing a bachelor’s or associate’s degree
n HOPE grants for students in a certificate or diploma program at a two-year college
n HOPE GED grants, one-time awards to students who complete a GED and enroll in
postsecondary education
n Student Access Loans (SAL), which provide low-interest loans to college students
n Voluntary Pre-Kindergarten
n Educational technology/training and capital expenses, including computers and other instructional tools in K-12 and postsecondary schools
Figure 16 Most Lottery Money Supports HOPE Programs
Source: Georgia’s 2014 Fiscal Year Budget (HB 106), signed by governor
The Georgia Lottery for Education Act requires officials to make every effort to direct
35 percent of lottery revenues to these education programs. In fiscal year 2012,
the most recent year for which data are available, officials directed 25.2 percent of
revenues to the HOPE programs and Pre-K.
$424 MHOPE Scholarship,
Public Schools
$312 MPre-Kindergarten
$97 M
HOPE Grant
$8 MHOPEAdministration
HOPE Scholarship,Private Schools
$48 M
$1.9 MHOPEGED
$20 MLow InterestLoans
GEORGIA BUDGET PRIMER 2014
27 | www.gbpi.org
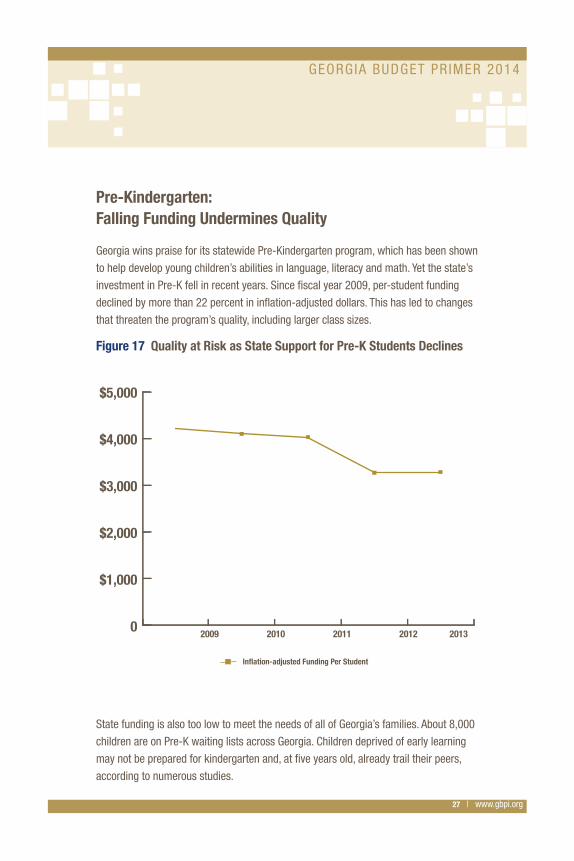
Pre-Kindergarten: Falling Funding Undermines Quality
Georgia wins praise for its statewide Pre-Kindergarten program, which has been shown
to help develop young children’s abilities in language, literacy and math. Yet the state’s
investment in Pre-K fell in recent years. Since fiscal year 2009, per-student funding
declined by more than 22 percent in inflation-adjusted dollars. This has led to changes
that threaten the program’s quality, including larger class sizes.
Figure 17 Quality at Risk as State Support for Pre-K Students Declines
State funding is also too low to meet the needs of all of Georgia’s families. About 8,000
children are on Pre-K waiting lists across Georgia. Children deprived of early learning
may not be prepared for kindergarten and, at five years old, already trail their peers,
according to numerous studies.
0
$1,000
$2,000
$3,000
$4,000
$5,000
2009 2010 2011 2012 2013
Inflation-adjusted Funding Per Student
GEORGIA BUDGET PRIMER 2014
28 | www.gbpi.org
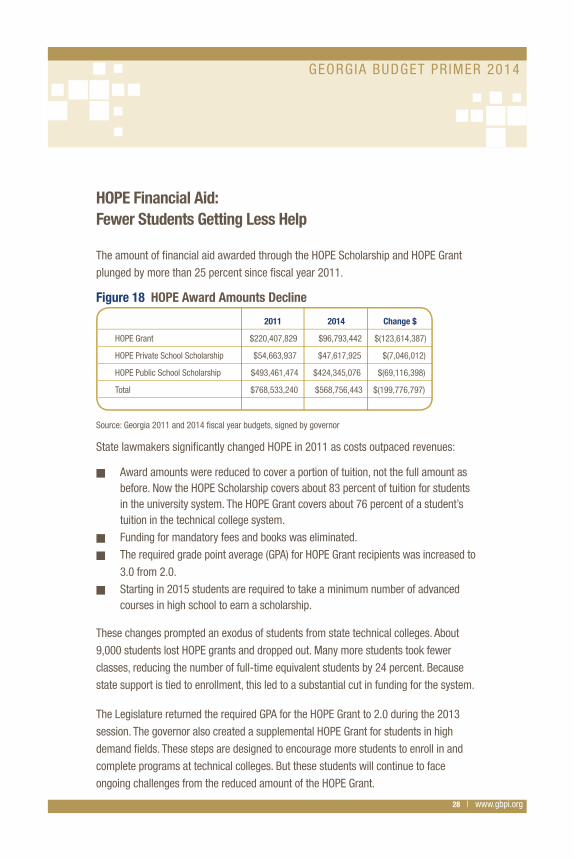
HOPE Financial Aid: Fewer Students Getting Less Help
The amount of financial aid awarded through the HOPE Scholarship and HOPE Grant
plunged by more than 25 percent since fiscal year 2011.
Figure 18 HOPE Award Amounts Decline
Source: Georgia 2011 and 2014 fiscal year budgets, signed by governor
State lawmakers significantly changed HOPE in 2011 as costs outpaced revenues:
n Award amounts were reduced to cover a portion of tuition, not the full amount as before. Now the HOPE Scholarship covers about 83 percent of tuition for students in the university system. The HOPE Grant covers about 76 percent of a student’s tuition in the technical college system.
n Funding for mandatory fees and books was eliminated.
n The required grade point average (GPA) for HOPE Grant recipients was increased to
3.0 from 2.0.
n Starting in 2015 students are required to take a minimum number of advanced courses in high school to earn a scholarship.
These changes prompted an exodus of students from state technical colleges. About
9,000 students lost HOPE grants and dropped out. Many more students took fewer
classes, reducing the number of full-time equivalent students by 24 percent. Because
state support is tied to enrollment, this led to a substantial cut in funding for the system.
The Legislature returned the required GPA for the HOPE Grant to 2.0 during the 2013
session. The governor also created a supplemental HOPE Grant for students in high
demand fields. These steps are designed to encourage more students to enroll in and
complete programs at technical colleges. But these students will continue to face
ongoing challenges from the reduced amount of the HOPE Grant.

GEORGIA BUDGET PRIMER 2014
29 | www.gbpi.org
University System of Georgia: Demand Grows but State Funds Dwindle
The state’s investment in the university system and its students shrunk considerably
over the past decade. State funding for each student, or full-time equivalent,
plummeted to $4,777 in 2013 from $11,278 in 2001, adjusted for inflation. That’s a
decrease of more than 57 percent. Enrollment grew by nearly 80 percent during this
time. Total state funding did not keep pace with this enrollment growth and, since 2009,
it has fallen by more than 8 percent.
The cuts have pushed universities to increase class size, use more part-time faculty
and eliminate courses. More costs have been shifted onto students and their families,
through significant increases in tuition and fees.
Figure 19 University Funding Per Student Plummets Since 2001
Source: Board of Regents, University System of Georgia. Fall semester enrollment reports.
$4,000
$6,000
$8,000
$10,000
$12,000278,319
154,941
225,197
Inflation Adjusted Funding Per Student Full-time Equivalent Enrollment
2001 2002 2003 2004 2005 2006 2007 2008 2009 2010 2011 2012 2013 2010 2011 2012 2013
Inflation Adjusted Funding per Student
GEORGIA BUDGET PRIMER 2014
30 | www.gbpi.org
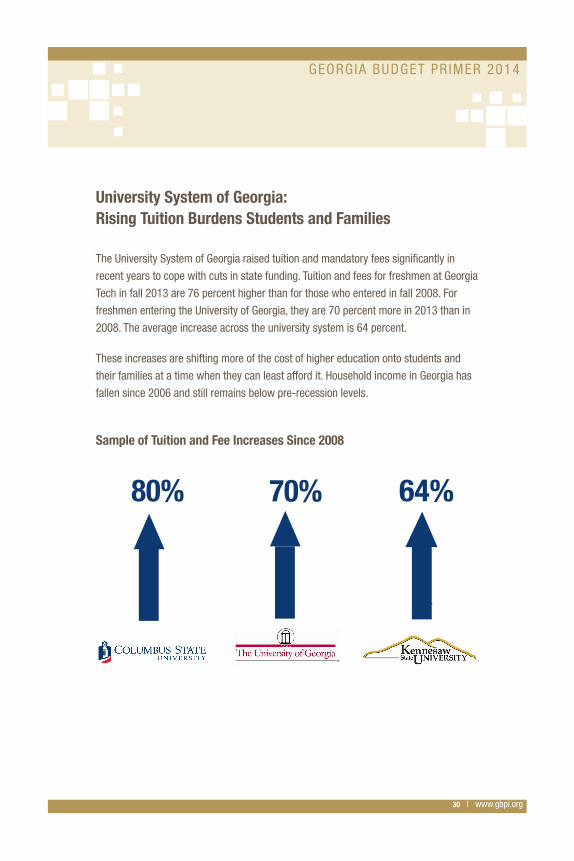
University System of Georgia: Rising Tuition Burdens Students and Families
The University System of Georgia raised tuition and mandatory fees significantly in
recent years to cope with cuts in state funding. Tuition and fees for freshmen at Georgia
Tech in fall 2013 are 76 percent higher than for those who entered in fall 2008. For
freshmen entering the University of Georgia, they are 70 percent more in 2013 than in
2008. The average increase across the university system is 64 percent.
These increases are shifting more of the cost of higher education onto students and
their families at a time when they can least afford it. Household income in Georgia has
fallen since 2006 and still remains below pre-recession levels.
Sample of Tuition and Fee Increases Since 2008
80% 64%70%

GEORGIA BUDGET PRIMER 2014
31 | www.gbpi.org
Technical College System of Georgia: Sharp Declines in State Funding
State funding for the Technical College System of Georgia plummeted since 2008,
from to $3,460 per full-time student from $4,478, a decline of more than 22
percent. The decline is more than 27 percent when adjusted for inflation.
To cope with the state’s funding cuts, colleges now rely primarily on part-time
faculty. Across the technical college system, 70 percent of faculty is part-time.
This reduces the cost of salaries and benefits, but it puts the accreditation of
several colleges at risk. Colleges also increased class sizes and some laid off
faculty and staff.
Like the universities, technical colleges also raised tuition. This may be a hardship
for many of their students. For the 2013-1014 school year, 64 percent of technical
college students qualify for federal Pell grants or Temporary Assistance for Needy
Families, according to Georgia Budget and Policy Institute calculations based on
data from the technical college system. The recent $10 per-credit-hour tuition
increase, which translates to $150 more per semester for a full-time student, can
be a significant financial burden.
22%

GEORGIA BUDGET PRIMER 2014
32 | www.gbpi.org
Health CareOverviewGeorgia’s health care spending is primarily distributed through three state agencies – the
Department of Community Health, the Department of Public Health and the Department of
Behavioral Health and Developmental Disabilities. State funding for these three agencies
totals nearly $4 billion in 2014, which is about 21 percent of total state spending.
Figure 20 $4 Billion for Health Care is Distributed to Three Agencies
Source: Georgia’s 2014 Fiscal Year Budget (HB 106), signed by governor
n The Department of Community Health is the largest of Georgia’s three health care agencies. It accounts for $2.9 billion, or 71.5 percent of total state spending on health care. It operates Georgia’s Medicaid and PeachCare programs, operates some planning and regulatory functions, and the State Health Benefit Plan that provides health care to state employees and teachers.
n The state’s spending on behavioral health and disabilities, including some services funded through Medicaid, account for about $945 million, or 23.5 percent of Georgia’s spending on health care.
n The Department of Public Health operates a variety of population-based health programs such as immunizations, health screening and infectious disease control. It receives $205 million, 5 percent of Georgia’s health spending.
$8.9BPersonal Income Tax
$5.1BSales and Use Tax
$3.1BOther Taxes and Fees
$205 MPublic Health
$2.9 BCommunity Health
$945 MBehavioral Health and
Development Disabilities

GEORGIA BUDGET PRIMER 2014
33 | www.gbpi.org
Medicaid and PeachCare: Georgia’s Stagnant Investment in Crucial Services
Medicaid and PeachCare are expected to provide health insurance to 1.8 million
Georgians in 2014. This is a 20 percent increase since 2009, but state General Fund
investment has lagged behind, with spending only increasing 3 percent in that time
to $2.2 billion in 2014. Instead, Medicaid and PeachCare increasingly rely on other
revenue, such as $166 million from the Tobacco Master Settlement agreement and
$242 million from hospital provider fees. The share of alternate funding is expected to
increase to more than 20 percent in 2014. It was less than 8 percent in 2009. About $56
million of the 2014 Tobacco Settlement funding is one-time money not available in 2015.
The federal government pays nearly two-thirds of Georgia’s Medicaid costs and more
than three-fourths of the costs for PeachCare in 2014.
Georgia’s stagnant investment in these crucial health care services fails to meet the
needs of the state’s growing and aging population. In 2009, Georgia’s combined state
and federal investment per Medicaid patient was second-lowest in the country. Georgia
is home to nearly 1.9 million people without insurance, one of the highest national totals.
Figure 21 General Funds a Smaller Share of Medicaid and PeachCare Than in 2009
Source: Georgia’s 2014 Fiscal Year Budget (HB 106), signed by governor
2009 Original Budget
57.6%
0
$500,000,000
$1,000,000,000
$1,500,000,000
$2,000,000,000
$2,500,000,000
$3,000,000,000
General Fund Tobacco Settlement Hospital Fees
2014 Budget
Nursing Home Fees

GEORGIA BUDGET PRIMER 2014
34 | www.gbpi.org
Medicaid and PeachCare Enrollment and Spending
Medicaid and PeachCare are important sources of health insurance for Georgians,
especially children, pregnant women, low-income seniors and people with disabilities.
At least 40 percent of all children in Georgia – more than 1.1 million – will likely get
health care through Medicaid or PeachCare in 2014.
Medicaid is also the primary payer for three-fourths of all nursing home patients
in Georgia and pays for more than half of all births in the state. Medicaid helps pay
Medicare premiums for low-income seniors who are in both programs. Medicaid also
pays for in-home care services and employment support for people with developmental
disabilities, physical disabilities and behavioral health needs.
The majority of Georgians who receive health care through Medicaid qualify based
solely on their low income, but the bulk of Georgia’s Medicaid spending in 2014 will
pay for services for people who qualify for the program due to a disability. As shown
in Figure 22, people in the Aged, Blind, & Disabled portion of the program are about
one-fourth of total enrollment, yet account for nearly 60 percent of total spending.
PeachCare, on the other hand, serves nearly 11 percent of all people in Medicaid and
PeachCare, yet represents only 4 percent of total spending.
Figure 22 Bulk of Medicaid Spending is for Services for Seniors and Disabled Georgians
Sources: Georgia’s 2014 Fiscal Year Budget (HB 106), signed by governor, Department of Community Health Estimates
0 20 40 60 80 100
2014Projected Enrollment
2014Spending
26.9%
57.6%
Low-Income Medicaid Age, Blind, & Disabled PeachCare for Kids
GEORGIA BUDGET PRIMER 2014
35 | www.gbpi.org
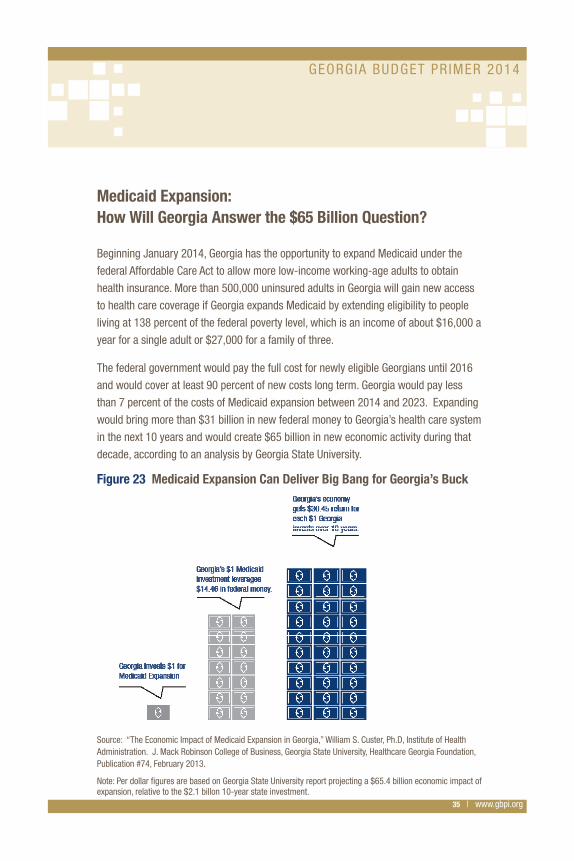
Medicaid Expansion: How Will Georgia Answer the $65 Billion Question?
Beginning January 2014, Georgia has the opportunity to expand Medicaid under the
federal Affordable Care Act to allow more low-income working-age adults to obtain
health insurance. More than 500,000 uninsured adults in Georgia will gain new access
to health care coverage if Georgia expands Medicaid by extending eligibility to people
living at 138 percent of the federal poverty level, which is an income of about $16,000 a
year for a single adult or $27,000 for a family of three.
The federal government would pay the full cost for newly eligible Georgians until 2016
and would cover at least 90 percent of new costs long term. Georgia would pay less
than 7 percent of the costs of Medicaid expansion between 2014 and 2023. Expanding
would bring more than $31 billion in new federal money to Georgia’s health care system
in the next 10 years and would create $65 billion in new economic activity during that
decade, according to an analysis by Georgia State University.
Figure 23 Medicaid Expansion Can Deliver Big Bang for Georgia’s Buck
Source: “The Economic Impact of Medicaid Expansion in Georgia,” William S. Custer, Ph.D, Institute of Health Administration. J. Mack Robinson College of Business, Georgia State University, Healthcare Georgia Foundation, Publication #74, February 2013.
Note: Per dollar figures are based on Georgia State University report projecting a $65.4 billion economic impact of expansion, relative to the $2.1 billon 10-year state investment.

GEORGIA BUDGET PRIMER 2014
36 | www.gbpi.org
Behavioral Health and Developmental Disabilities
Georgia’s increased spending for behavioral health and developmental disability
services in recent years is largely due to a 2011 legal settlement with the U.S.
Department of Justice, which requires the state to provide more of those services in
home or community settings rather than institutions.
As a result, Georgia’s 2014 behavioral health budget is $131.8 million more than in
2009, an increase of 17 percent. Georgia’s 2014 budget reflects the fourth year of the
five-year agreement, which outlined a schedule for the state to start providing new
services and supports to people in need of this care. The state has so far provided
$124.6 million to the Department of Behavioral Health and Developmental Disabilities to
implement these changes.
Public Health
Georgia’s public health programs in 2014 largely depend on funding from the federal
government. Federal money accounts for 61 percent of the department’s budget of
more than $700 million, while state funding accounts for 32 percent. Other sources,
such as fees paid by patients visiting health departments, make up the remaining
7 percent.
As recently as 2012, Georgia’s state investment in public health ranked as the fifteenth
lowest in the U.S. and was nearly 40 percent below the national median. Georgia’s
2014 spending on public health is only about 5 cents a day per person. Since 2009,
state funding for public health has been cut by 5 percent, or $9.5 million. This does
not include administrative spending because a recent agency restructuring makes it
difficult to compare that funding year to year.

GEORGIA BUDGET PRIMER 2014
37 | www.gbpi.org
Human ServicesOverviewGeorgia’s spending to help children, the poor and seniors is overseen by the state
Department of Human Services. State funding for the agency is $486 million in 2014,
or about 3 percent of total state spending.
Child welfare-related services represent the largest share of the department’s
responsibilities, accounting for $212 million, or 44 percent of the department’s 2014
budget. These services include protecting children from abuse, abandonment and
neglect, as well as safeguarding them in suitable temporary and permanent homes.
Human Services employees also license, monitor and inspect temporary foster homes.
About $113 million of the Human Services budget helps low-income families gain
access to Temporary Assistance for Needy Families (TANF), nutrition assistance,
Medicaid and other federal services. These temporary supports help people stay
healthy and prepared for job opportunities and financial independence.
Other Human Services functions protect and sustain older Georgians, enforce parents’
responsibility to financially support their children and help employ people with disabilities.
Figure 24 Georgia’s Children a Major Focus of Human Services
Source: Georgia’s 2014 Fiscal Year Budget (HB 106), signed by governor
$212 MChild Welfare
Related Services
$113 MLow-Income
Family Supports
$83 MAging Services
Administration
$24 MChild SupportServices
$20 MGeorgia VocationalRehab Agency
$1.5 MOffice ofResidentialChild Care
$32 M

GEORGIA BUDGET PRIMER 2014
38 | www.gbpi.org
Fewer Resources for State’s Most Vulnerable
The Georgia Department of Human Services budget has fallen by 20 percent since the
2009 fiscal year. The result is fewer state workers to protect children and fewer staffers
to help Georgians who need TANF, nutrition assistance and Medicaid to move toward
financial independence.
Since 2009, the decline in state support for the department has meant drastic
reduction or changes in a number of services, including community-based support
services for seniors and work assistance for families receiving TANF. Recruitment of
potential adoptive families and support services for grandparents raising grandchildren
also were significantly cut.
Figure 25 Department of Human Services Budget Down 20 Percent
Sources: Georgia’s 2009 and 2014 fiscal year budgets, includes programs remaining in the Department of Human Services as of FY 2013
0
$100,000,000
$200,000,000
$300,000,000
$400,000,000
$500,000,000
$600,000,000
$700,000,000
$800,000,000
FY 2009 FY 2014
$609,998,172
$485,582,984

GEORGIA BUDGET PRIMER 2014
39 | www.gbpi.org
Child Welfare Workers: A Strained Safety Net
The largest portion of the Human Services budget, $212 million, pays the salaries of
staff who investigate allegations of child abuse, abandonment and neglect, and goes to
support families and organizations that provide temporary and permanent homes for
children in need.
The budget for child welfare-related services is down nearly 23 percent since the 2009
fiscal year, which has led to layoffs and three consecutive years of requiring those
who remain to take time off without pay. Budget cuts also led to the cancellation of
some contracts with private companies for in-home services, leaving state workers
with increased responsibility. These in-home services can include preparing families
for reunification, helping parents cope with discipline issues and facilitating family
conferences.
Between September 2011 and December 2012, state child welfare workers saw the
number of cases they handled increase by over 20 percent. Child welfare workers need
adequate time to talk with families face-to-face, assess a child’s safety risk
and follow up to see if the necessary services and supports are provided. Requiring
human services workers to deal with a growing volume of work is troubling news for
Georgia’s children, since the quality of the help they get can suffer.
Figure 26 Protectors of Child Welfare Stretched Thin
‘
Source: Department of Human Services Appropriations presentation, 1/2013; Child Welfare Information Gateway
0
5
10
15
20
Sept Oct Nov Dec Jan Feb Mar Apr May Jun Jul Aug Sep Oct Nov Dec2011 2011 2011 2011 2012 2012 2012 2012 2012 2012 2012 2012 2012 2012 2012 2012
Heavy caseloads are citedas key reason child welfare workers leave the job.
High staff turnover from heavy caseloads can hurt quality, timeliness and continuity of service.
Heavy caseloads shrink time spent with families building relationships, assessingissues and planningpermanent solutions
Average Number of Cases Monthly

GEORGIA BUDGET PRIMER 2014
40 | www.gbpi.org
Low-Income Supports
As Georgians continue to struggle with high unemployment or, in many cases, jobs
offering fewer hours than they are willing to work, the human services workers who
help them have seen the number of people they serve more than double. These
workers help families obtain TANF, nutrition assistance and Medicaid. TANF is a
state-federal partnership designed to help low-income families become financially
independent through job preparation, temporary cash assistance and other support. The
Supplemental Nutrition Assistance Program (SNAP, formerly called food stamps) helps
low-income families afford the nutrition they need to work, attend school and otherwise
contribute to their communities. Medicaid provides some low-income Georgians with
health insurance. (See more on Medicaid in the Health Care section.)
The highest growth rate among these low-income supports is for SNAP, which saw
a 128 percent increase in cases in Georgia between December 2007 and December
2012. Georgia’s record high unemployment and poverty during that time meant more
families needed help putting food on the table. One in five Georgians do not have
sufficient access to food, including more than one in four children. SNAP helps these
families. State costs are expected to decline over time as the economy recovers.
Food Stamp Needs Soar
SNAP cases grow 128% in five years
128%

GEORGIA BUDGET PRIMER 2014
41 | www.gbpi.org
Adult Protective Services: Less Support, Greater Need
Georgia’s population is aging, which increases the need to help seniors with
medication, nutrition and other necessities. In only three other states is the over-65
population growing faster than in Georgia. And the over-85 population is also growing
faster than most states.
Adult Protective Services prevents abuse, neglect and exploitation of Georgians 65 or
older who are not in long-term care, and investigates violations. The agency’s family
services workers take older Georgians to get medicine and groceries and spend time
with them in their homes, which makes seniors less susceptible to abuse. In 2014, the
budget that pays for these workers is cut in half from the previous year.
Though reports of elder abuse, neglect and exploitation surged 50 percent between the
2007 and 2013 fiscal years and confirmed cases increased by 53 percent, the number
of Adult Protective Service workers has not grown. As with their counterparts who help
children, these workers have taken on higher caseloads.
Figure 27 Adult Protective Services Cases Rise, Staff Levels Remain the Same
Source: Department of Human Services Appropriations presentation, January 2013
0
3,000
6,000
9,000
12,000
15,000
230Total Staff
221Total Staff
228Total Staff
211Total Staff
232Total Staff
230Total Staff
2007 2008 2009 2010 2011 2012
Number of Cases
GEORGIA BUDGET PRIMER 2014
42 | www.gbpi.org
Looking Ahead to Next YearWhen the state’s 2015 fiscal year begins July 1, 2014, Georgians will enjoy better
access to health care through changes in federal law. Georgians will have more
opportunity to get a technical college education thanks to a return to a more reasonable
academic standard for the HOPE grant. And Georgians should continue to count on
predictable, if not adequate, funding for schools, health care, public safety and other
basic services through its income tax system. But pending income tax proposals to
reduce or eliminate the state’s dependence on its most reliable source of revenue
threaten Georgia’s ability to pay for those things.
Making small improvements to health care and education, while fending off attempts
to make tax policy worse, are small steps toward regaining some of the ground the
state lost since the Great Recession. Georgia could instead choose to chart a bold new
course, beginning with the 2015 fiscal year.
n If Georgia opts to accept available federal funding to expand Medicaid, hundreds of thousands of low-income workers would have health insurance and could get the medical care and peace of mind that go with it.
n If Georgia resumes contributing the full share of school funding set out by the state’s Quality Basic Education formula, students and teachers would benefit from local school systems no longer increasing class sizes and furloughing teachers to make up for lost state financial support.
n If Georgia lawmakers overhaul the state’s tax code to reflect today’s economy and public needs, the state can restore vital state services to where they were before the Great Recession.
When Gov. Nathan Deal signed the state’s 2014 budget into law in spring 2013, he said even when state revenue collections improve he expects state spending to remain at or near recent low levels. If that happens, it would be a tragic missed opportunity. Georgia’s schools and colleges will continue to decline, our working men and women will be unable to meet the needs of employers and our state’s economy will continue to sputter.
Georgians will do better in the future with a major course correction and renewed investment in the foundations of a strong economy and a high quality of life. Lawmakers can seize the opportunity to begin that correction with Georgia’s 2015 fiscal year.

GEORGIA BUDGET PRIMER 2014
43 | www.gbpi.org
Contact Us
The Georgia Budget and Policy Institute
100 Edgewood Avenue NE, Suite 950
Atlanta, Georgia 30303
www.gbpi.org
Alan Essig
Executive Director
404.420.1324 x 101 | [email protected]
Taifa Smith Butler
Deputy Director
404.420.1324 x 102 | [email protected]
Policy Analysts
Melissa Johnson
Policy Analyst, Human Services
404.420.1324 x 100 | [email protected]
Claire Suggs
Senior Policy Analyst, Education
404.420.1324 x 105 | [email protected]
Timothy Sweeney
Director of Health Policy
404.420.1324 x 103 | [email protected]
Wesley Tharpe
Policy Analyst, Tax and Economic Policy
404.420.1324 x 110 | [email protected]

www.gbpi.org