Social Security: A Primer - Congressional Budget Office
97
Transcript of Social Security: A Primer - Congressional Budget Office


Numbers in the text, tables, and figures of thispublication may not add up to totals because of rounding.
Cover photo is © Corbis Corporation/Jane Sapinsky.

Executive Summary
This Congressional Budget Office primer on Social Security describes the ele-ments of the program that are most relevant to the current debate about SocialSecurity’s future. The primer comes at a time when policymakers are grappling
with the issue of how to deal with the looming retirement of the baby-boom genera-tion. Over the next three decades, the number of people in the United States age 65 orolder is projected to rise by more than 90 percent, while the number of adults underage 65 will increase by only about 15 percent. That demographic shift will pose newchallenges for the Social Security program, the federal government, and the U.S.economy.
This primer examines the demographic patterns that are causing the graying ofthe U.S. population and looks at several strategies that have been proposed for prepar-ing for that aging population. It emphasizes the economic and budgetary aspects ofSocial Security—particularly, how changes to the program might affect the nation’sability to deal with its impending demographic shift. Some of the key points of theprimer are outlined below.
The Challenges of an Aging Population
� Once the baby-boom generation retires, the amount of money that the fed-eral government will spend on Social Security will grow substantially. Thatspending is projected to increase by more than 50 percent over the nextthree decades—from 4.2 percent of the nation’s total output (gross domesticproduct, or GDP) this year to 6.5 percent in 2030—according to the inter-mediate projections of the Social Security Administration.
� Although policymakers have many goals, if they want to limit the growth ofspending on the elderly as a share of GDP, they have only two options:slow the growth of total payments to the elderly or increase the growth ofthe economy.

ii SOCIAL SECURITY: A PRIMER September 2001
� Issues about how to prepare for an aging population ultimately concern howmany goods and services the economy will produce and how they will bedistributed, not how much money is credited to Social Security’s trustfunds.
� Social Security is much more than a retirement program. Fewer than two-thirds of its beneficiaries are retired workers. The rest are disabled workers,survivors of deceased workers, and workers’ spouses and minor children.
Strategies for Preparing the Nation
This primer looks at three strategies that have been at the heart of the public debateabout preparing for the nation’s future needs. Those strategies are saving budgetsurpluses and paying down federal debt, using surpluses to create private retirementaccounts, or changing the current Social Security program’s benefits or revenues.
Saving Budget Surpluses
� Saving surpluses and paying down federal debt could enlarge the economy,give policymakers more flexibility for dealing with unexpected develop-ments, and ease the burden of an aging population on future workers.
� Current projections suggest that surpluses could be large enough to pay offall of the federal debt available for redemption by 2010. After that, thegovernment could use surpluses to buy stocks and nonfederal bonds. How-ever, such purchases would raise important questions. Would it be appro-priate for the government to own shares in and possibly control privatecompanies? And could the government’s involvement distort market sig-nals and corporate decisionmaking?
Using Budget Surpluses to Finance the Creation of Private Accounts
� Using surpluses to pay for private retirement accounts might help protectthose surpluses from being used for other purposes. It would also shiftcontrol of the surpluses from the government to the private sector and avoidthe possible drawbacks of having the government own private assets. Asystem of private accounts that was based on 2 percent of workers’ earningscould reduce the surplus by about $1 trillion over 10 years.

EXECUTIVE SUMMARY iii
� Some people argue that private accounts would offer higher rates of returnthan the traditional Social Security system does, but that argument can bemisleading. Social Security has a low rate of return largely because initialgenerations received benefits far greater than the payroll taxes they paid;that difference would have to be made up even if the Social Security systemwas entirely replaced by private accounts. Moreover, investing in the stockmarket—through either private accounts or government purchases of stocksfor the Social Security trust funds—is no panacea. Corporate stocks delivera higher expected return than government bonds because they carry higherrisks.
� A system of private accounts (even if it did not fully replace Social Secu-rity) would raise some practical questions. How much would the systemcost to administer? Would it provide insurance against downturns in thestock market? At retirement, would people have to convert the assets intheir private account into an annuity (a series of regular payments that con-tinues until the person and his or her spouse dies), and if so, under whatconditions? How would the system handle benefits for workers’ families,for survivors of deceased workers, and for disabled workers? Would itprovide subsidies for people with low income and intermittent work histo-ries, as Social Security does now?
Modifying the Current Social Security Program
� Many types of reductions in Social Security benefits could increase GDP inthe long run. However, the effect on the economy in the near term would beuncertain, and the long-term gains could take a couple of decades to materi-alize fully. GDP could increase in the long run because reducing SocialSecurity benefits might encourage some people to save more. Reductions inbenefits would probably reduce the lifetime resources of some transitionalgenerations, but later generations would be likely to earn higher wages andpay lower taxes, on average.
� Raising taxes to pay for Social Security would have an uncertain effect onGDP. If the additional revenues were not used for other purposes, nationalsaving could increase. However, raising the rate of the Social Securitypayroll tax could reduce some people’s incentives to work. For that reason,cutting benefits might be more likely to expand the economy in the long runthan raising payroll tax rates would.
� If policymakers intended to alter the Social Security program, announcingthe changes well in advance would give people time to respond by adjustingtheir plans for saving and retirement.


Contents
Chapter 1 Introduction and Summary . . . . . . . . . . . . . . . . . . . . . . . . 1
The Challenges of an Aging Population . . . . . . . . . . . . . . . . 3Issues to Consider in Reforming Social Security . . . . . . . . . 6Strategies for Preparing the Nation . . . . . . . . . . . . . . . . . . . 7
Save Budget Surpluses . . . . . . . . . . . . . . . . . . . . . . . . 9Create Private Accounts . . . . . . . . . . . . . . . . . . . . . . . 10Make Programmatic Changes . . . . . . . . . . . . . . . . . . 11
Chapter 2 An Overview of the Social Security Program . . . . . . . . . 13
Social Security’s Objectives . . . . . . . . . . . . . . . . . . . . . . . . . 13The Original Program . . . . . . . . . . . . . . . . . . . . . . . . . 13Later Developments . . . . . . . . . . . . . . . . . . . . . . . . . . 15Related Federal Programs . . . . . . . . . . . . . . . . . . . . . 16
How Social Security Works . . . . . . . . . . . . . . . . . . . . . . . . . 18Rules for Determining Retirement and
Disability Benefits . . . . . . . . . . . . . . . . . . . . . . . . . 19Rules for Determining Family Benefits . . . . . . . . . . . 24
Financing and the Trust Funds . . . . . . . . . . . . . . . . . . . . . . . 26
Chapter 3 The Challenges of an Aging Population . . . . . . . . . . . . . . 29
The Demographic Outlook . . . . . . . . . . . . . . . . . . . . . . . . . . 29The Outlook for Incomes . . . . . . . . . . . . . . . . . . . . . . . . . . . 34
Higher Productivity Results in HigherAverage Income . . . . . . . . . . . . . . . . . . . . . . . . . . . 35
Some Elderly People Might Not Sharein the Income Gains . . . . . . . . . . . . . . . . . . . . . . . . 39
The Budgetary and Economic Perspective . . . . . . . . . . . . . . 41The Social Security Trust Fund Perspective . . . . . . . . . . . . 42

vi SOCIAL SECURITY: A PRIMER September 2001
Chapter 4 Strategies for Preparing for an Aging Population . . . . . 45
Preserving Budget Surpluses . . . . . . . . . . . . . . . . . . . . . . . . 46The Mechanics of Federal Budget Surpluses . . . . . . . 46The Economic Effects of Saving Surpluses . . . . . . . . 48Government Accumulation of Assets . . . . . . . . . . . . 51Economic Efficiency . . . . . . . . . . . . . . . . . . . . . . . . . 53
Creating Private Retirement Accounts . . . . . . . . . . . . . . . . . 55The Basic Structure of a Privatization Plan . . . . . . . . 59The Effects on National Saving . . . . . . . . . . . . . . . . . 60The Effects on the Labor Market . . . . . . . . . . . . . . . . 62Administrative Costs . . . . . . . . . . . . . . . . . . . . . . . . . 62Risks and Guarantees . . . . . . . . . . . . . . . . . . . . . . . . . 63Annuities . . . . . . . . . . . . . . . . . . . . . . . . . . . . . . . . . . 66Other Considerations . . . . . . . . . . . . . . . . . . . . . . . . . 68
Changing the Rules of the Current Social Security System . . . . . . . . . . . . . . . . . . . . . . . . . . . 71
Reducing Benefits . . . . . . . . . . . . . . . . . . . . . . . . . . . 72The Effects of Raising Payroll Taxes . . . . . . . . . . . . 76
Appendix A The Economic Effects of Having the GovernmentIssue Debt to Finance Investments in theStock Market . . . . . . . . . . . . . . . . . . . . . . . . . . . . . . . . . . . . 83
Appendix B Proposals for Private Accounts in the 106th Congress . . . . . . . . . . . . . . . . . . . . . . . . . . . . . . . 85
Appendix C Contributors to the Primer . . . . . . . . . . . . . . . . . . . . . . . . 87

CONTENTS vii
TABLES
1. Projected Federal Spending for Social Security,Medicare, and Medicaid in 2001 . . . . . . . . . . . . . . . . . . . . . . 5
2. Asset Holdings of Retirement Funds for State and LocalGovernment Employees . . . . . . . . . . . . . . . . . . . . . . . . . . . . . 52
3. Families’ Direct and Indirect Holdings of Stock,by Type of Family . . . . . . . . . . . . . . . . . . . . . . . . . . . . . . . . . 70
4. The Payroll Tax Base for Social Security and Average Wages in Selected Years, 1951-1998 . . . . . . . . . . . . . . . . . . 78
FIGURES
1. Projected Growth in the Adult Population, 2001-2075 . . . . . 4
2. Projected Federal Spending for Social Security, Medicare, and Medicaid, 2000-2030 . . . . . . . . . . . . . . . . . . . 6
3. Distribution of Social Security Beneficiaries, by Typeof Benefit Received, December 2000 . . . . . . . . . . . . . . . . . . 19
4. The Extent to Which Social Security Replaces Workers’Preretirement Earnings . . . . . . . . . . . . . . . . . . . . . . . . . . . . . 21
5. Income, Outlays, and Balances of the Social SecurityTrust Funds, 2001-2037 . . . . . . . . . . . . . . . . . . . . . . . . . . . . . 27
6. The Outlook for Social Security Demographicsand Spending, 2001-2075 . . . . . . . . . . . . . . . . . . . . . . . . . . . 30
7. Births in the United States, 1909-2075 . . . . . . . . . . . . . . . . . 31
8. Key Demographic Indicators for Social Security,1940-2075 . . . . . . . . . . . . . . . . . . . . . . . . . . . . . . . . . . . . . . . 33
9. Labor Productivity in the Nonfarm Business Sector,1951-2000 . . . . . . . . . . . . . . . . . . . . . . . . . . . . . . . . . . . . . . . 36
10. Sources of Family Income for People Age 65or Older, 1999 . . . . . . . . . . . . . . . . . . . . . . . . . . . . . . . . . . . . 38

viii SOCIAL SECURITY: A PRIMER September 2001
11. Poverty Rates for Different Age Groups, 1966-1999 . . . . . . 40
12. Marital Status of the Female Population Age 65or Older, 2000 and 2030 . . . . . . . . . . . . . . . . . . . . . . . . . . . . 41
13. Federal Debt Held by the Public as a Percentageof GNP, 1790-2000 . . . . . . . . . . . . . . . . . . . . . . . . . . . . . . . . 47
14. Real Income per Person Under Different AssumptionsAbout Saving Surpluses . . . . . . . . . . . . . . . . . . . . . . . . . . . . . 50
15. Number of Active Participants in Private PensionPlans, 1977-1997 . . . . . . . . . . . . . . . . . . . . . . . . . . . . . . . . . . 64
16. How the Year of Retirement Affects Income-Replacement Rates in a System of Private AccountsInvested in Stocks or Bonds . . . . . . . . . . . . . . . . . . . . . . . . . . 65
17. The Probability of Retirement for Men at VariousAges in Different Years . . . . . . . . . . . . . . . . . . . . . . . . . . . . . 73
18. The Payroll Tax Rate for Social Security, 1937-2000 . . . . . . 77
BOXES
1. Recent Statistics About Social Security . . . . . . . . . . . . . . . . 2
2. Prefunding Future Consumption . . . . . . . . . . . . . . . . . . . . . . 8
3. Will Workers in the Future Retire Later? . . . . . . . . . . . . . . . 34
4. The Budgetary Treatment of Government Purchasesof Private Securities . . . . . . . . . . . . . . . . . . . . . . . . . . . . . . . . 48
5. The Impact on Financial Markets of Paying DownFederal Debt . . . . . . . . . . . . . . . . . . . . . . . . . . . . . . . . . . . . . . 54
6. The Risks and Returns of Stocks . . . . . . . . . . . . . . . . . . . . . . 56
7. Why Comparing Rates of Return Can Be Misleading . . . . . . 58
8. Who Would Bear the Transition Costs of PrivatizingSocial Security? . . . . . . . . . . . . . . . . . . . . . . . . . . . . . . . . . . . 61

1. Quoted in Project on the Federal Social Role, The Report of the Committee on Economic Security of 1935, 50thAnniversary Edition (Washington, D.C.: National Conference on Social Welfare, 1985), p. 145.
Chapter One
Introduction and Summary
We can never insure one hundred percent of the population against onehundred percent of the hazards and vicissitudes of life, but we have triedto frame a law which will give some measure of protection to the averagecitizen and to his family against the loss of a job and against poverty-ridden old age.
Statement of Franklin Delano Roosevelt upon signingthe Social Security Act, August 14, 19351
The Social Security Act of 1935, enacted in the midst of the Depression, iswidely seen as one of the most important legislative accomplishments in U.S.history. The law created a program to provide lifetime payments to retired
workers beginning at age 65, laying the foundation for today’s Social Security pro-gram. The legislation also set up the federal system of unemployment insurance andauthorized federal grants to the states for various purposes.
Since then, Social Security has grown to become by far the largest federal pro-gram. Coverage has expanded, benefits have increased, and the program has beenbroadened to include benefits for workers’ spouses and minor children, for the survi-vors of deceased workers, and for disabled workers. The federal government currentlypays monthly Social Security benefits to more than 45 million retired or disabledworkers, their families, and their survivors (see Box 1). Those benefits will cost thegovernment a total of about $430 billion this year—roughly one-quarter of the entirefederal budget.
Over the next 30 years, the retirement of the baby-boom generation (the largegroup born between 1946 and 1964) will pose new challenges for the Social Securityprogram, the federal government, and the U.S. economy. The Social Security Admin-istration projects that the number of people age 65 or older will rise by more than 90

2 SOCIAL SECURITY: A PRIMER September 2001
Box 1.Recent Statistics About Social Security
The numbers below present a portrait of the Social Security program in December2000 (except the numbers for the payroll tax, which are for 2001). They are based ondata from the Social Security Administration.
Number of Social Security Beneficiaries
Retired Workers 28.5 millionDisabled Workers 5.0 millionSpouses of Deceased Workers 5.1 millionSpouses of Retired or Disabled Workers 3.0 millionChildren of Retired, Disabled, or Deceased Workers1 3.8 million
Total Number of Beneficiaries 45.4 million
Average Monthly Social Security Benefit
Retired Workers $845Disabled Workers $787Spouses of Deceased Workers $790Spouses of Retired or Disabled Workers $417Children of Retired, Disabled, or Deceased Workers1 $406
Workers
Numbers of Workers in Employment Coveredby Social Security 152.9 million
Social Security Payroll Tax2
Tax Rate (Paid half by employer and half by employee) 12.4 percentLimit on Worker’s Annual Earnings Subject to the Tax $80,400Maximum Tax Owed (Paid half by employer
and half by employee) $9,970
1. Minor children and some adults disabled before age 22.
2. Besides the Social Security payroll tax, workers are also subject to a 2.9 percent payroll tax (paid halfby them and half by their employers) on covered earnings for the Medicare program. There is no limiton the annual earnings subject to that tax.

CHAPTER ONE INTRODUCTION AND SUMMARY 3
percent in the next three decades (from about 36 million now to 69 million in 2030),according to its intermediate assumptions (see Figure 1). During the same period, thenumber of adults under age 65—who will largely be the ones paying the taxes tosupport their elders—will grow by only about 15 percent (from 170 million to 195million). Moreover, the number of elderly people is expected to keep rising at a fasterrate than the number of nonelderly people as life spans continue to lengthen.
On May 2, 2001, President Bush established a 16-member commission “to studyand report . . . specific recommendations to preserve Social Security for seniors whilebuilding wealth for younger Americans.” The President instructed the commission toissue a report by this fall. The Congress is likely to review the commission’s recom-mendations as it determines what, if any, Social Security legislation it will send to thePresident for his signature.
This report provides background information for the Congress as it considershow to prepare for the retirement of the baby-boom generation and beyond. Thereport emphasizes the economic and budgetary aspects of Social Security—particu-larly, how changes to the program might affect the nation’s ability to deal with itsimpending demographic shifts. This chapter highlights several of the report’s mainpoints.
The Challenges of an Aging Population
Observers can view the economic and budgetary consequences of the aging of the U.S.population from at least three perspectives: that of the trust fund framework used bythe trustees of the Social Security program, that of the total federal budget, and that ofthe overall U.S. economy.
The most common perspective is that of Social Security’s own financial struc-ture. The program is financed largely by a tax on workers’ wages (a payroll tax). Therevenues from that tax are credited to two accounts (“trust funds”) in the federal bud-get, one for each of the program’s two parts: Old-Age and Survivors Insurance, andDisability Insurance. Those trust funds, which are maintained in the U.S. Treasury,function mainly as accounting mechanisms to track Social Security’s revenues andspending and to monitor whether the program’s designated sources of revenue areproducing enough money to cover expected benefits. The program’s benefits, admin-istrative costs, and other authorized expenditures are paid from those funds. Balancesin the funds are held in the form of special interest-bearing Treasury securities.
A broader perspective takes into account the pressures on the total federal bud-get, not just the part of the budget specific to Social Security. In particular, as thepopulation ages, spending on federal health care programs for the elderly and disabled

4 SOCIAL SECURITY: A PRIMER September 2001
2000 2010 2020 2030 2040 2050 2060 20700
25
50
75
100
125
150
175
200
225Millions
Population by Age Group
2000 2010 2020 2030 2040 2050 2060 20700
10
20
30
40
50Percent
Population 65 or Older as a Percentage of Population 20 to 64
20 to 64
65 or Older
Figure 1.Projected Growth in the Adult Population, 2001-2075
SOURCE: Social Security Administration, The 2001 Annual Report of the Board of Trustees of the Fed-eral Old-Age and Survivors Insurance and Disability Insurance Trust Funds (March 19, 2001),Table V.A2 (intermediate assumptions).

CHAPTER ONE INTRODUCTION AND SUMMARY 5
2. Congressional Budget Office, The Long-Term Budget Outlook (October 2000), p. 15.
Table 1.Projected Federal Spending for Social Security, Medicare, and Medicaid in 2001
In Billionsof Dollars
As a Percentage ofTotal Federal Spending
Social Security 429 26.0Medicare 238 14.4Medicaid 131 7.9
Subtotal 798 48.3
Rest of Government 852 51.6
Total (Excluding net interest) 1,651 100.0
SOURCE: Congressional Budget Office, The Budget and Economic Outlook: An Update (August 2001).
will probably rise rapidly because of increases in federal costs per beneficiary as wellas in the percentage of the population eligible for benefits (unless major changes aremade in those programs). The Medicare program provides health insurance to mostU.S. residents age 65 or older and to eligible disabled people. Most of its participantsalso receive Social Security benefits. Medicaid is a joint federal/state program thatprovides medical assistance to low-income people; in recent years, a large share of itspayments have gone to provide long-term care for elderly and disabled people innursing facilities. The federal government will spend a total of about $370 billion onMedicare and Medicaid this year. Those programs, together with Social Security,already account for nearly half of all federal spending, excluding interest payments onfederal debt (see Table 1). If the programs are not changed, by 2030 they could con-sume two-thirds of the federal budget.2
The broadest perspective—and the one emphasized in this report—takes intoaccount what might happen to the overall U.S. economy, not just to the federal budget.As the population ages, total consumption of goods and services by the elderly willincrease, whether that consumption is financed through public programs or privately.The Congressional Budget Office (CBO) projects that federal spending for SocialSecurity, Medicare, and Medicaid will account for roughly 15 percent of the nation’stotal output (gross domestic product) in 2030—double the current share (see Figure 2).Large increases in spending on those programs, combined with any taxes or federaldebt needed to finance them, could have significant effects on the economy. Examin-ing how changes to those programs could alter the future size of the economy is im-

6 SOCIAL SECURITY: A PRIMER September 2001
Figure 2.Projected Federal Spending for Social Security, Medicare,and Medicaid, 2000-2030 (As a percentage of gross domestic product)
SOURCE: Congressional Budget Office (October 2000 estimates).
portant because the goods and services that baby boomers will consume in their retire-ment will largely be produced by future workers.
Issues to Consider in Reforming Social Security
Several aspects of the Social Security program and its outlook as the population agesare especially important in considering changes to the program. First, throughout itslong history, Social Security has had multiple goals—some related to redistributingincome among or within generations, others related to providing insurance to offsetlost earnings. Policymakers will need to decide whether those goals are still appropri-ate and, if so, how changes to Social Security would aid or hinder the achievement ofthose goals and would affect various types of beneficiaries and taxpayers. Thosedecisions will also need to take into account the dramatic increase in the elderly popu-lation that is expected in coming decades.

CHAPTER ONE INTRODUCTION AND SUMMARY 7
Second, issues about how to prepare for an aging population ultimately concernthe amount of goods and services the economy will produce and how they will bedistributed, not how much money is credited to the Social Security trust funds. In thatsense, the projected depletion of those funds—which is the focus of much of thepopular debate about Social Security’s future—is irrelevant. The challenge of adjust-ing to an aging population would need to be faced even if the trust funds never ex-isted.
Third, deciding how to prepare for an aging population is likely to requireweighing the interests of today’s workers and Social Security beneficiaries against theinterests of future workers and beneficiaries. No matter how it is packaged, any planto increase national saving today means that the U.S. population will consume fewergoods and services now so that consumption can be greater in the future, when a largershare of the population is retired. Gone are the days when expansion of the laborforce could pay for the growth of Social Security benefits. As the Congress looks atpolicy changes, one consideration is that future workers and Social Security beneficia-ries are likely to have higher standards of living, on average, than current workers andbeneficiaries do, because of future increases in productivity.
Strategies for Preparing the Nation
The 107th Congress has inherited Social Security reform as a major item on itsagenda. Like previous Congresses, it faces projections that payments from the govern-ment to the elderly will rise sharply as a share of the economy over the next 30 years.Spending more on the elderly may be appropriate given the large increase in the olderpopulation, but questions can be raised about how much that spending should rise.Policymakers have many goals, but if they want to limit the growth of spending on theelderly as a share of the economy, they can do so in only two ways: either by slowingthe growth of total payments to the elderly or by increasing the rate of growth of theeconomy.
Different options for reform would have different effects on economic growth.To the extent that they boosted the future size of the economy and increased the na-tion’s accumulation of assets, they could lessen the burden on future workers of gov-ernment programs that serve the elderly. In essence, the accumulation of assets“prefunds” the future spending of retired baby boomers (as explained in Box 2). Thataction would reduce the relative costs of an aging population to future generations byreducing payments to retirees as a share of the economy.
Policymakers could attempt to increase the size of the economy in several ways:by running budget surpluses or promoting private saving (which can make more fundsavailable for investment in business equipment, structures, and other types of capital);

8 SOCIAL SECURITY: A PRIMER September 2001
Box 2.Prefunding Future Consumption
Saving is one of the major ways that workers can prepare for retirement. By spending lessthan they earn, they can build up assets to pay for the consumption of goods and servicesin their retirement. Nations can prepare for an aging population in the same way. Throughsaving, nations can finance the construction of new business plants and equipment athome and the acquisition of financial and physical assets in other countries. Those domes-tic investments enable the economy to produce more goods and services in the future, andthe income from the foreign investments supplements the income produced at home.Together, those investments provide the resources to finance future consumption by work-ers and retirees alike. That process of saving and accumulating assets for future needs iscalled prefunding because it sets aside current resources for future use.1
The word prefunding is sometimes also used to describe policy actions that financefuture spending by a government program, such as Social Security. However, that usagecan be misleading. For example, payments of future Social Security benefits could befinanced on paper simply by making transfers from the rest of the budget to the SocialSecurity trust funds. Although such transfers improve the actuarial balances of the trustfunds, they do not directly change the government’s total spending or revenues and hencedo not increase national saving as a whole. Moreover, unless such transfers alter policy-makers’ future decisions about the budget, they will have no effect on the economy. Thus,they do not prefund future consumption in any meaningful way.2
Although asset accumulation is a central feature of prefunding, that does not meanthe government could prefund future consumption by investing the balances of the SocialSecurity trust funds in corporate stocks. Changing the mix of securities held by those trustfunds would not increase the resources available for future consumption. To buy stocks,the government would have to give private sellers an asset of equal value. Unless govern-ment policy increased national saving, the investments in stocks would simply involve anexchange of assets between the government and the private sector, not an increase in assetsfor the nation as a whole. (The economic effects of government investments in stocks arediscussed in more detail in Appendix A of this report.)
1. Nations may also be able to prepare for the future by investing in public infrastructure, education, andresearch and development; however, many of those federal investments appear to have lower returnsthan private investments do. See Congressional Budget Office, The Economic Effects of FederalSpending on Infrastructure and Other Investments (June 1988).
2. Some analysts distinguish between broad prefunding and narrow prefunding. Broad prefunding raisesnational saving, accumulates assets, and sets aside resources for future use. Narrow prefunding—which refers to actions taken with respect to a particular government program—does not necessarilyimply that resources have been set aside for future use. For more details, see Joseph Stiglitz, “Re-thinking Pension Reform: Ten Myths About Social Security Systems” (paper presented at the WorldBank Conference on New Ideas About Old Age Security, Washington, D.C., September 14-15, 1999).
CHAPTER ONE INTRODUCTION AND SUMMARY 9
3. Congressional Budget Office, The Budget and Economic Outlook: An Update (August 2001).
4. For more details, see Congressional Budget Office, Budget Options (February 2001), Chapter 1.
by changing tax and regulatory policies to improve the efficiency of the economy or toboost people’s incentives to work or improve their skills; or by spending money ongovernment programs that are oriented toward investment rather than current con-sumption. In addition, some changes to the Social Security program could have posi-tive effects on economic growth. For example, cutting future benefits might createincentives for workers to save more.
Chapter 4 of this report focuses on three strategies that have generated a lot ofpublic attention: saving budget surpluses and using them to pay down federal debt;using those surpluses to create private retirement accounts; and making changes to thebenefits or revenues of the current Social Security program. Those various ap-proaches are not mutually exclusive; they could be combined in any number of ways.
Save Budget Surpluses
One strategy for preparing for the needs of an aging population is to preserve thefederal government’s annual budget surpluses and pay down the federal debt. If thegovernment continues to spend less than it receives in revenues, it can increase na-tional saving (if private saving does not fall to offset the government’s saving), boostthe stock of private capital, and expand the future size of the economy. By saving thesurpluses, policymakers would have more flexibility for dealing with unexpecteddevelopments, and future workers could be better prepared to bear the heightenedburden of making payments to an aging population.
CBO projects that if current laws and policies do not change, surpluses wouldbe large enough to pay off all of the federal debt available for redemption by 2010.3
What would happen after that? If laws restricting the Treasury’s current investmentchoices were modified, any further surpluses could be used to buy nonfederal assets,such as stocks and bonds. Although asset accumulation could increase the fundsavailable for capital investment and boost economic growth, it would be unprece-dented for the federal government to hold a large stock of private assets. The possibil-ity of such holdings raises questions. Would it be appropriate for the government toown and possibly control private companies? Could the government’s involvementdistort market signals and corporate decisionmaking?4
Questions have also been raised about whether using surpluses to pay down debtand accumulate assets is politically realistic. Would policymakers refrain from spend-ing more or cutting taxes further and allow the government to pay off its debt andbuild up private assets? Recent experience creates some doubts on that score. Al-

10 SOCIAL SECURITY: A PRIMER September 2001
5. That estimate excludes interest on the federal debt, which would rise if the accounts were financed by increasingthat debt.
though the government has paid down debt over the past few years, federal spendinghas also been growing faster than inflation. This year, the President and the Congressenacted the Economic Growth and Tax Relief Reconciliation Act of 2001—which willreduce tax revenues by a total of almost $1.35 trillion between 2001 and 2011—andpolicymakers are considering other proposals that would further reduce projectedsurpluses.
Create Private Accounts
A second strategy is to use part of the budget surpluses to pay for the creation ofprivate retirement accounts. Proposals for private accounts differ in many ways, butthey share a common feature: the income from an account that would be available toa worker at retirement would depend on the payments made into the account and therate of return on the account’s assets during the person’s working life. Many types ofaccounts are possible, and their effects would vary widely.
Supporters argue that using budget surpluses to finance the creation of privateaccounts could provide many of the same economic benefits as saving the surpluses,without the potential problems of having the government own shares in private compa-nies. In essence, proponents would shift control of part of the surpluses from thegovernment to individuals.
How much of those surpluses would a system of private accounts absorb? Theanswer would depend on the details of the proposal, but the amount could be large.For example, creating a system of private accounts that was based on contributions of2 percent of workers’ earnings could cost about $1 trillion over 10 years.5
Some people argue that private accounts would offer higher rates of return thanthe traditional Social Security system does, but that argument can be misleading.Social Security has a low rate of return largely because initial generations receivedbenefits far greater than the payroll taxes they paid. That difference would have to bemade up even if the Social Security system was entirely replaced by private accounts.Moreover, investing in the stock market (either through private accounts or throughgovernment purchases of stock for the Social Security trust funds) is no panacea.Simply raising the average rate of return on assets by taking on more risk would notchange the economic fundamentals. Only if the accounts increased national savingand enlarged the economy would they reduce future burdens. Their impact on na-tional saving would depend on how the accounts affected both government and privatesaving.

CHAPTER ONE INTRODUCTION AND SUMMARY 11
In setting up a system of private accounts, policymakers would have to addressmany practical issues. How much would the system cost to administer? Would itprovide insurance against downturns in the stock market? How would it handle bene-fits for workers’ families, for survivors of deceased workers, and for disabled work-ers? Would the system give subsidies to people with low income and intermittentwork histories? How would the system be regulated and investors informed?
Some of the answers to those questions could have implications for the econ-omy. For example, government guarantees that people would receive a minimumlevel of retirement income in the event of a market downturn would probably reducenational saving below what it would be without those guarantees. And subsidies tolow-income workers that were phased out as wages rose could impose implicit taxeson work and could discourage some people from working more.
Make Programmatic Changes
A third approach is to modify the current Social Security program. Changes that havebeen proposed include reducing benefits (for example, by raising the retirement age,lengthening the period over which benefits are computed, or reducing annual cost-of-living adjustments) or increasing payroll taxes. The effect on the economy woulddepend on the particular type of change. Other things being equal, reducing benefitsmight be more likely to increase the size of the economy than raising payroll tax rates,which could lessen people’s incentives to work.
Economic models suggest that many types of benefit reductions could increasethe size of the economy in the long run because they could encourage some people tosave more. However, those long-term gains could take a couple of decades to materi-alize fully. How the benefit cuts would affect the economy in the near term is uncer-tain.
Slowing the growth of Social Security benefits would most likely reduce thelifetime resources of some transitional generations. However, it could also raise thewages of later generations and reduce their tax burdens. If benefits are to be cut,changing the law now rather than later would give workers time to adjust their plansfor saving and retirement.


Chapter Two
An Overview of theSocial Security Program
Over the years, lawmakers have tried to make Social Security serve variouspurposes and categories of people. In the process, they have created a compli-cated set of rules that determine the eligibility and benefit amounts of different
types of beneficiaries. And they have crafted a special financial structure for theprogram. This chapter describes the key elements of the history, benefit structure, andfinancing of Social Security that are most relevant to the current debate over the pro-gram’s future.
Social Security’s Objectives
From the beginning of Social Security, its developers sought to achieve multiple,sometimes conflicting, goals. Later expansions of the program added other goals, andamendments designed to curb the program’s rapidly growing costs did not limit itsobjectives.
Today’s Social Security program is a hybrid—part redistribution program(which transfers resources within and among generations) and part insurance program(which provides insurance to workers and their families for losses resulting from aworker’s death or disability). Unlike the case with private insurance, however, partici-pation in Social Security is mandatory. And unlike private insurers, the federal gov-ernment has the power to tax and thus does not need to charge current participants forthe full amount of the expected payouts. Moreover, as with other federal programs,new laws can be enacted to change the terms of the insurance, making it more or lessgenerous for its participants.
The Original Program
As its 1935 report to President Roosevelt indicates, the committee charged with devel-oping Social Security legislation wanted to help all workers prepare for retirement, butit was particularly concerned about helping retired workers who had low incomes:

14 SOCIAL SECURITY: A PRIMER September 2001
1. Project on the Federal Social Role, The Report of the Committee on Economic Security of 1935, 50th AnniversaryEdition (Washington, D.C.: National Conference on Social Welfare, 1985), p. 53.
2. Even though the formula for calculating monthly benefits is progressive (in that it favors retired workers with lowlifetime earnings), some people have questioned whether the overall benefit structure of Social Security is pro-gressive. They point out that men with low lifetime earnings have shorter life spans, on average, than other men.Other people, however, observe that Social Security also provides benefits to the survivors of deceased workersand to disabled workers; both of those features contribute to the program’s progressivity.
3. Project on the Federal Social Role, The Report of the Committee on Economic Security, p. 53.
4. “We put those payroll contributions there so as to give the contributors a legal, moral, and political right to collecttheir pensions. . . . With those taxes in there, no damn politician can ever scrap my social security program.”President Roosevelt, quoted on the Social Security Administration’s “History Page,” at www.ssa.gov/history/quotes.html.
[I]t should not be overlooked that old-age annuities are designed to pre-vent destitution and dependency. Destitution and dependency are enor-mously expensive, not only in the initial cost of necessary assistance butin the disastrous psychological effect of relief upon the recipients, which,in turn, breeds more dependency.1
The design of the Social Security system involves a trade-off between ensuringa sufficient level of benefits to even the poorest recipients (the “adequacy” objective)and distributing benefits so that workers who have paid more taxes for Social Securityreceive more benefits (the “equity” objective). The progressive benefit structure ofthe program, described below, reflects the attempt to balance those two objectives.Although the specific formulas for calculating benefits have changed since SocialSecurity began, retired workers with a history of low wages have always received ahigher percentage of their preretirement earnings in monthly benefits than other retiredworkers do. Nonetheless, workers who earned higher wages receive a higher level ofmonthly benefits.2
Social Security’s main revenue source has always been a payroll tax imposed onworkers and their employers. Benefits are calculated according to the earnings onwhich the tax was paid, even though the revenues from taxing a particular worker’searnings are not set aside to pay for that worker’s future benefits.
One purpose of using payroll taxes rather than income taxes or other sources ofrevenue was so that elderly beneficiaries would feel they had earned their benefits,whether or not they had really done so. The program’s developers were eager thatSocial Security not be seen as a welfare program but rather as “a self-respectingmethod through which workers make their own provision for old age.”3 Moreover,President Roosevelt believed that such an approach would help ensure that futurepolicymakers would not be able to repeal the program.4 Undoubtedly, the perceptionthat beneficiaries were simply getting back what they had paid in—even though most

CHAPTER TWO AN OVERVIEW OF THE SOCIAL SECURITY PROGRAM 15
5. Other changes included eliminating a provision in the 1935 law for lump-sum payments (of 3.5 percent of workers’accumulated wages) for workers who were ineligible for benefits at age 65 or who died before then, establishinga minimum benefit, and providing a lump-sum death benefit of six times the deceased worker’s monthly benefitif the worker left no survivors eligible for monthly survivor benefits.
retired workers have received much more in benefits than they have paid in SocialSecurity taxes—has been a deterrent to changing the program.
Later Developments
Later legislation greatly expanded the scope and complexity of Social Security, as newpurposes were added to the original ones.
� Legislation enacted in 1939—before the program had paid any monthlybenefits—added payments for spouses of retired workers and for survivorsof deceased workers. Those provisions changed Social Security from astrictly worker-based retirement program to one in which workers’ familiescould also receive benefits.5
� Legislation enacted in 1956 created the Disability Insurance (DI) part of theprogram, explicitly adding a new purpose to Social Security: providinginsurance for earnings lost because of disability.
� Legislation enacted in 1972 required Social Security to automatically adjustbenefits each year for inflation. The creation of automatic cost-of-livingadjustments (COLAs) explicitly moved Social Security into the business ofproviding annuities that are fully indexed for inflation. Previously, eachacross-the-board increase in benefits had required an act of Congress.
Not all amendments to the Social Security Act have expanded the program.Many of the changes made since the mid-1970s were designed to slow the growth ofbenefits, as policymakers responded to perceived short-term and long-term financialproblems with Social Security.
� Amendments enacted in 1977 revised the indexing provisions established in1972 to make them less sensitive to inflation. The procedure used to deter-mine initial benefits was separated (“decoupled”) from the procedure usedto adjust benefits later for inflation. Each worker’s earnings history, whichis used to determine his or her initial benefit, is indexed to reflect thegrowth in average wages throughout the economy; later adjustments to thatbenefit are based on changes in consumer prices rather than in averagewages. In addition, the 1977 amendments increased revenues by raising the

16 SOCIAL SECURITY: A PRIMER September 2001
6. For more details of the 1977 amendments, as well as each of the other major changes in the Social Securityprogram, see Geoffrey Kollmann, Social Security: Summary of Major Changes in the Cash Benefits Program, CRSReport for Congress RL30565 (Congressional Research Service, May 18, 2000).
7. For more-detailed information about the 1983 legislation, see John A. Svahn and Mary Ross, “Social SecurityAmendments of 1983: Legislative History and Summary of Provisions,” Social Security Bulletin, vol. 46, no. 7(July 1983), pp. 3-48.
amount of a worker’s earnings that is subject to the payroll tax, indexingthat amount to growth in average wages, and increasing the tax rate.6
� Amendments in 1980 and 1981 further reduced projected spending for So-cial Security. The 1980 amendments were designed to limit the growth inthe cost of the DI program. The Omnibus Budget Reconciliation Act of1981 cut benefits further, largely by eliminating benefits for postsecondarystudents.
� The Social Security Amendments of 1983 made some of the most signifi-cant changes in the program’s history.7 Those changes came in response toprojections that the Social Security trust funds would soon be exhausted andthat the program faced a large, long-term deficit. Spending was cut in theshort run by delaying a scheduled COLA for six months. The biggest re-duction in long-run costs came from gradually raising the age at which re-tired workers could receive full benefits from 65 to 67 (for workers born in1960 or later). In addition, lawmakers increased Social Security revenuesby moving up the dates on which scheduled increases in the payroll taxwere to take effect, making some Social Security benefits subject to incometaxes, and including new federal workers and all employees of nonprofitorganizations in the program.
Related Federal Programs
Three separate government programs are closely related to Social Security in theirobjectives and in the populations they serve. Each one was established by amendingthe Social Security Act.
Supplemental Security Income. Under the Supplemental Security Income (SSI)program, enacted in 1972, the federal government provides monthly cash payments tolow-income people who are 65 or older or disabled. SSI replaced previous state-administered programs that had been jointly funded by the federal government and thestates with a single program that uses uniform, nationwide rules for eligibility. Be-cause SSI is a means-tested program, people must have income and assets belowspecified amounts to be eligible for benefits. (The eligibility criteria based on disabil-ity are similar to those used to determine eligibility for DI benefits.) The maximum

CHAPTER TWO AN OVERVIEW OF THE SOCIAL SECURITY PROGRAM 17
8. In addition, most states provide supplemental payments. The history of the SSI program and its current operationsare described in Social Security Administration, The Supplemental Security Income Program at the Millennium(November 2000), available at www.ssa.gov/policy/programs/SSI/millennium/index.html.
9. Social Security Administration, SSI Annual Report, 2000 (May 2001), Table 7, available at www.ssa.gov/statistics/ssi_annual_stat/2000/table7.html.
SSI benefit in 2001 for an individual with no other income is $531 a month; for acouple, it is $796 a month.8 This year, the federal government will spend nearly $30billion on SSI, the Congressional Budget Office estimates.
People who receive Social Security benefits and who have assets below thespecified level ($2,000 for an individual or $3,000 for a couple) can also receive SSIbenefits. However, any unearned income of more than $20 a month that they receive(including Social Security) reduces their SSI benefit by an equal amount.
In effect, SSI serves as a backstop to Social Security to ensure that elderly anddisabled people have a minimum level of income if they do not qualify for SocialSecurity or if their Social Security benefits are very low. At the end of 2000, about 60percent of the 1.3 million elderly recipients of SSI and 30 percent of the 5.3 milliondisabled recipients were also receiving Social Security benefits.9
The links between SSI and Social Security are important to consider whenexamining the potential effects of changing the Social Security program. If SocialSecurity benefits were reduced, some of the government’s savings would be offset byincreased spending for SSI. Likewise, if Social Security’s minimum benefit wasincreased, some of the additional cost would be offset by lower spending for SSI.
Medicare. The second-largest entitlement program after Social Security, Medicareprovides health insurance coverage to elderly or disabled people. Most Medicarebeneficiaries also receive Social Security. Medicare, which was enacted in 1965,comprises two programs—Hospital Insurance (HI) and Supplementary Medical Insur-ance (SMI). The HI program pays for inpatient care in hospitals, some stays in skillednursing facilities, some home health care, and hospice services. The SMI programpays for services from physicians, medical suppliers, and outpatient care facilities aswell as for some home health care.
This year, Medicare will spend about $240 billion on health care for 40 millionbeneficiaries, CBO estimates. The HI part of the program is financed largely by apayroll tax levied on workers and their employers. The SMI part of the program isfinanced in two ways: roughly one-quarter of its funding comes from monthly premi-ums paid by enrollees, and the rest comes from the government’s general revenues. Inall, beneficiaries pay for less than 15 percent of current Medicare outlays.

18 SOCIAL SECURITY: A PRIMER September 2001
10. Most workers need to earn 40 credits (known as quarters) to be eligible for retirement benefits. Workers can earnup to four credits each year on the basis of the amount they earned in employment covered by Social Security. In2001, one credit is earned for each $830 in wages. Thus, a worker earning at least $3,320 this year will receivefour credits. The amount of earnings required for a credit is indexed to average earnings for the labor force as awhole.
11. For more detailed information about determining eligibility and benefit amounts, see the Social SecurityAdministration’s Web site (www.ssa.gov). Users can estimate their own future benefits at that site as well.
Medicaid. The Medicaid program, also enacted in 1965, is a joint federal/state pro-gram that provides medical assistance to many of the nation’s poor people. Paymentsfor long-term care (mainly for the elderly and disabled) account for about one-third oftotal Medicaid spending. The federal government and the states pay for the programjointly, with the federal government’s share ranging from 50 percent to 83 percent(depending on a state’s per capita income). Federal spending for Medicaid will totalabout $130 billion this year, CBO estimates.
How Social Security Works
The Social Security program will pay monthly benefits to about 45 million people thisyear—more than 28 million retired workers, 5 million disabled workers, and 12 mil-lion family members of retired, disabled, or deceased workers. In general, workers areeligible for retirement benefits if they are at least age 62 and have had sufficient earn-ings on which they paid Social Security taxes in at least 10 years.10 Workers whoseemployment has been limited because of a physical or mental disability can becomeeligible at an earlier age with a shorter employment history. Various rules apply tofamily members of retired, disabled, or deceased workers.11
Although Social Security is often characterized as a retirement program, onlyabout 63 percent of its beneficiaries receive their payments as retired workers (seeFigure 3). As of last year, 15 percent of beneficiaries were survivors of deceasedworkers. Most of those survivors were widows—either widows age 60 or older (whocomposed about 10 percent of all beneficiaries) or younger widows who were caringfor a minor child or who were disabled.
The Disability Insurance program is an important but often overlooked part ofSocial Security. Workers under age 65 who had qualified for DI accounted for 11percent of the people receiving Social Security benefits at the end of 2000; membersof their families accounted for another 4 percent. Those percentages actually under-state the role of Disability Insurance because DI recipients move into the retired-worker category when they reach the normal retirement age. (Although many of themwould have qualified for retirement benefits at age 62 anyway, the amount they re-ceived by having their benefits calculated as disabled workers is typically much higher

CHAPTER TWO AN OVERVIEW OF THE SOCIAL SECURITY PROGRAM 19
than it would have been if they had received benefits as retired workers.) More than10 percent of the people who began receiving Social Security retirement benefits in1999 had been getting DI benefits. Likewise, survivors of deceased DI beneficiariesare not counted in the DI category.
Rules for Determining Retirement and Disability Benefits
Benefits for retired or disabled workers are based on those workers’ past taxableearnings, expressed as an average level of earnings over their working lifetime (theiraverage indexed monthly earnings, or AIME). For retired workers, the AIME is nowbased on the highest 35 years of earnings on which they paid Social Security taxes (upto the taxable maximum), with some adjustments. Earnings before age 60 are indexedto compensate both for past inflation and for real (after-inflation) growth in wages.
Figure 3.Distribution of Social Security Beneficiaries, by Type of Benefit Received,December 2000
SOURCE: Social Security Administration, Annual Statistical Supplement, 2001 (draft), Table 5.A1 (avail-able at www.ssa.gov/statistics/Supplement/2001/index.html).

20 SOCIAL SECURITY: A PRIMER September 2001
12. Their average indexed monthly earnings would be about $2,540, or about $30,500 per year. Applying the formulafor workers turning 62 this year, their PIA would be $1,150, or about $13,800 per year. If they stopped workingand began receiving benefits shortly after their 62nd birthday, that amount would be permanently reduced by about22 percent. (All of those amounts are in 2001 dollars.)
(When benefits are calculated for disabled workers and for the survivors of deceasedworkers, the AIME can be based on a shorter period. Moreover, DI benefits are notsubject to any reduction for beginning to receive them before the age at which a re-tired worker is eligible for full benefits.)
Benefit Formula. The Social Security Administration (SSA) applies a progressiveformula to a worker’s average indexed monthly earnings to calculate his or her pri-mary insurance amount (PIA). The PIA is the monthly amount payable to a workerwho begins receiving Social Security retirement benefits at the age at which he or sheis eligible for full benefits or payable to a disabled worker who has never received aretirement benefit reduced for age. (The age of eligibility is discussed in the next sec-tion.)
The formula is designed to ensure that initial Social Security benefits replace alarger proportion of preretirement earnings for people with low average earnings thanfor those with higher earnings. For workers who turn 62 this year, the formula is:
PIA = (90 percent of the first $561 of the AIME) + (32 percent of the AIMEbetween $561 and $3,381) + (15 percent of the AIME over $3,381)
Those thresholds at which the percentage of the AIME replaced by the PIA changesare known as “bend points” (see the top panel of Figure 4). They change along withchanges in the average annual earnings for the labor force as a whole. Consequently,as wages rise over time, initial benefits increase at a similar pace.
Workers who are 62 now, who had average earnings throughout their career,and who wait to retire until they reach the age at which they will be eligible for fullbenefits (65 and four months for this group) will receive a monthly benefit of about$1,150. That payment will replace about 41 percent of their earnings in the yearbefore they retired. If, instead, they retire this year soon after their 62nd birthday, theywill be eligible for a permanently reduced benefit of almost $900 a month. Thatamount will replace about 35 percent of their pretax earnings last year.12 (Most benefi-ciaries’ after-tax replacement rates are higher than their pretax replacement rates.)
The replacement rate is inversely related to past earnings (see the bottom panelof Figure 4). For example, workers who earned half of the average wage each year areeligible for a monthly benefit at age 62 of $575, replacing about 45 percent of theirpast earnings (compared with 35 percent for workers with average earnings). Byworking longer and waiting to claim benefits, those workers would receive higher

CHAPTER TWO AN OVERVIEW OF THE SOCIAL SECURITY PROGRAM 21
0 1,000 2,000 3,000 4,000 5,000 6,0000
200
400
600
800
1,000
1,200
1,400
1,600
1,800
2,000Primary Insurance Amount (Dollars)
Primary Insurance Amount Compared with Average IndexedMonthly Earnings for Workers Who Turn 62 in 2001
90 P
erce
nt
32 Percent
15 Percent
0 1,000 2,000 3,000 4,000 5,000 6,0000
10
20
30
40
50
60
70
80
90
100Percent
Benefits as a Percentage of Earnings for Workers WhoBegin Receiving Reduced Benefits at Age 62 in 2001
Average Indexed Monthly Earnings (Dollars)
Average Indexed Monthly Earnings (Dollars)
Figure 4.The Extent to Which Social Security Replaces Workers’Preretirement Earnings
SOURCE: Congressional Budget Office.

22 SOCIAL SECURITY: A PRIMER September 2001
13. Specifically, earnings before the year that the worker turned 60 are indexed to reflect the growth in average earningsbetween the years in which the wages were earned and the year that the worker turned 60. Later earnings are notindexed. Benefits are indexed to the CPI for years after the worker turned 62 (regardless of when the worker beginsreceiving benefits).
14. Craig A. Feinstein, Projected Demise of the Special Minimum PIA, Actuarial Note No. 143 (Social Security Ad-ministration, Office of the Chief Actuary, October 2000), available at www.ssa.gov/OACT/NOTES/note143.html.
annual benefits (replacing a higher percentage of their earnings), but the progressivepattern shown in Figure 4 would not change.
The Social Security Administration makes various adjustments to the PIA, suchas reductions for early retirement and credits for later retirement. In addition, at theend of each year, SSA adjusts benefits by the amount of any increase in the consumerprice index (CPI). For example, the 3.5 percent cost-of-living adjustment that tookeffect in December 2000 reflected the increase in the CPI for urban wage earners andclerical workers that occurred between the third quarter of 1999 and the third quarterof 2000.
Because of Social Security’s indexing rules, the payments received by newlyeligible beneficiaries reflect both increases in prices and real growth in earningsthroughout the economy during the years that those beneficiaries worked.13 Laterincreases in their payments—through annual COLAs—reflect only increases in pricesafter the beneficiaries became eligible for benefits. Thus, as long as real wages con-tinue to rise, new beneficiaries will receive more than older beneficiaries, on average.
Another method for calculating benefits, known as the “special minimum PIA,”is used to help people who worked for many years but had low earnings. Essentially,that alternative calculation is based on the number of years worked rather than on theamount earned. The few people who receive benefits based on that calculation—150,000 beneficiaries at the end of 1999—are chiefly retired female workers. Theiraverage benefit was less than $600 per month in 1999, or about $100 more than themaximum SSI benefit for eligible individuals at that time. Initial benefits based on thespecial minimum method are indexed to prices rather than to wages, so even fewernew Social Security recipients will gain from having their benefits calculated that wayin the future.14
Early Retirement. Under current law, the age at which a worker becomes eligible forfull Social Security retirement benefits—the normal retirement age (NRA)—dependson the worker’s year of birth. For people born before 1938, the NRA is 65. Forslightly younger workers, it increases by two months per birth year, reaching 66 forpeople born in 1943. The NRA remains at 66 for workers born between 1944 and1954 and then begins to increase in two-month increments again, reaching 67 forworkers born in 1960 or later. For workers whose 62nd birthday falls this year, theNRA is 65 years and four months.

CHAPTER TWO AN OVERVIEW OF THE SOCIAL SECURITY PROGRAM 23
15. The characteristics, circumstances, and financial resources of men and women who received reduced benefits inthe early 1990s are examined in Congressional Budget Office, Raising the Earliest Eligibility Age for SocialSecurity Benefits, CBO Paper (January 1999).
16. Starting with beneficiaries born in 1943, each year delayed beyond the normal retirement age (which will be 66for that group) will add 8 percent to their retired-worker benefits. The delayed-retirement credit for workersreaching the normal retirement age this year is 6 percent.
17. If he began collecting retirement benefits as soon as he was eligible and lived to age 80, the worker would receive216 monthly payments of $780 (adjusted for inflation), for a total of about $168,500. By waiting until his normalretirement age, he would receive 176 monthly payments of $1,000, for a total of $176,000. Although he wouldreceive more money in total by waiting, he would not have access to that money until later. What economists callthe present value of the two streams of future monthly payments would be equivalent if the worker considered $1received now to be worth about the same as $1.03 (adjusted for inflation) received one year later.
Workers can begin receiving permanently reduced monthly retirement benefitsas early as age 62.15 People who start collecting retirement benefits at age 62 this yearwill incur a permanent 22 percent reduction in their monthly benefits. As the normalretirement age rises to 67 for future groups of workers, that maximum reduction willalso increase. (Once the NRA is 67, the permanent reduction will be 30 percent.)Similarly, workers who delay collecting benefits beyond their normal retirement agereceive a delayed-retirement credit to compensate them for the reduction in the lengthof time they will receive benefits.16
The size of the early-retirement reduction for workers is intended to be “actu-arially fair”—in the sense that the total value of the reduced monthly benefits that anaverage worker could expect to receive between age 62 and death is similar to the totalvalue of the full monthly benefits that the worker could expect to receive over thattime by waiting until he or she was eligible for full benefits. For example, a singlemale worker who retired this year at age 62 and expected to live about 18 more years(to age 80) would be almost equally well off receiving reduced benefits of $780 permonth for 18 years or unreduced benefits of $1,000 per month for 14 years and eightmonths (starting at his full-benefit age of 65 years and four months).17
Because a typical 62-year-old woman could expect to live longer than 18 years,she would theoretically accrue greater total benefits by waiting until normal retirementage to begin collecting them. But many women might not incur the full reduction forearly-retirement benefits because they can switch from receiving reduced retired-worker benefits to full survivor benefits upon the death of their husband. If a widowis at least the normal retirement age when her husband dies, she becomes eligible fora full survivor benefit (equal to his benefit) if that benefit is higher than the one shehad been receiving on the basis of her own earnings record.
The size of the early-retirement reduction may encourage some workers tocollect early benefits and may discourage others. For example, workers who believethat their life span will be well short of the average might see the reduction as a gooddeal and apply for benefits at age 62. Conversely, workers who expect to live into

24 SOCIAL SECURITY: A PRIMER September 2001
18. Social Security Administration, Annual Statistical Supplement, 2000, p. 240. In 1999, 1.1 million of the 1.5million people who SSA determined were entitled to new retirement benefits were ages 62 through 64. About850,000 of those people were 62-year-olds. (Those estimates exclude the 200,000 Disability Insurance benefi-ciaries who automatically became retired-worker beneficiaries when they reached 65.)
their 80s might regard the reduction as unacceptably high and wait until later to re-ceive benefits.
More than two-thirds of the workers who began receiving Social Security retire-ment benefits in the past decade implicitly decided that the reduction in their monthlycheck was a price worth paying to start collecting benefits before age 65. The major-ity of those early recipients began collecting benefits at age 62.18
Earnings Test. A complicated set of rules requires that Social Security benefits bereduced if recipients earn more than a certain exempt amount. Those rules, known asthe retirement earnings test, apply to wages but not to income from dividends, pen-sions, or interest. This year, the benefits of Social Security recipients who have notyet reached normal retirement age will be reduced by $1 for each $2 they earn above$10,680. That earnings threshold automatically rises each year to match the increasein a national index of average wages.
Workers whose benefits are reduced because of the retirement earnings test willreceive higher monthly benefits later—about 7 percent or 8 percent higher for eachyear in which their benefits are entirely withheld because of the earnings test. In manycases, the increase in benefits will be even more than 8 percent because the additionalearnings can raise the earnings base from which benefits are calculated. In short,although the retirement earnings test is often portrayed as a tax on work, it is moreaccurately described as a means of deferring benefits until workers no longer havesubstantial earnings.
Until last year, a separate earnings test applied to workers ages 65 through 69.The Senior Citizens Freedom to Work Act of 2000 repealed that earnings test forbeneficiaries at or above the NRA, but it left in place the test for younger beneficia-ries. As the NRA rises to 67 over the next two decades, the size of the group subjectto the remaining earnings test will expand greatly.
Rules for Determining Family Benefits
More than one-quarter of Social Security beneficiaries receive payments as the spouse,child, or survivor of a worker. The rules for determining their benefits are importantin the context of reforming Social Security, both because so many people receivethose benefits and because several reform proposals address specific concerns raisedabout those benefits, such as the treatment of one-earner versus two-earner couples.

CHAPTER TWO AN OVERVIEW OF THE SOCIAL SECURITY PROGRAM 25
19. The Social Security Administration’s Web site (www.ssa.gov) contains several publications that provide more-detailed information about each type of benefit. A particularly useful one is Understanding the Benefits (February2001).
20. Benefits received by a divorced spouse do not reduce the amount payable to a current spouse or other familymembers.
21. Strictly speaking, as the Social Security Administration records the benefits, she will receive her own benefit asa retired worker plus the difference between that amount and the benefit to which she would be entitled as a spouseor widow.
The benefits that a spouse, child, or survivor of a worker receives are based onthe worker’s PIA. The rules determining eligibility and benefit amounts are compli-cated, particularly in situations in which the family members are also eligible forbenefits on the basis of their own work history or in which benefits are reduced be-cause of the age of the beneficiary. The key concepts are outlined below.19
An eligible wife or husband of a retired or disabled worker can receive a spousalbenefit equal to 50 percent of the spouse’s PIA. To be eligible, the wife or husband ofthe worker must be at least age 62 or caring for an eligible child. A widow or wid-ower can receive 100 percent of the amount to which the deceased worker would havebeen entitled. Minor children can also receive benefits. However, the total amount ofbenefits that a family can receive on the basis of a worker’s earnings record is limitedby a family cap (which is generally between 150 percent and 188 percent of theworker’s PIA).
Special eligibility rules apply to former spouses. In general, if their marriagelasted at least 10 years, ex-husbands and ex-wives are entitled to the same benefitsbased on their former spouse’s earnings as they would be if they had remained mar-ried. Otherwise, they are ineligible for family-based benefits.20
The rules governing cases in which a person is eligible for benefits as a retiredor disabled worker and as the spouse or widow of a worker are especially importantbecause an increasing percentage of wives have worked long enough to qualify forbenefits based on their own careers. The general rule is that someone eligible for twobenefits receives the higher one, not both.
For example, suppose a husband and wife are the same age, both work until theybecome eligible for full retirement benefits, the husband is eligible for a monthlybenefit of $1,000, and the wife is eligible for a retirement benefit of only $300. In thatsituation, because the wife’s benefit as a spouse ($500 a month) is higher than herbenefit as a retired worker, she will receive the spousal benefit. Likewise, if sheoutlives her husband, she will receive a survivor benefit of $1,000 per month (adjustedfor inflation).21 If, instead, the wife’s earnings history is the same as her husband’s,she will receive her benefit as a retired worker.

26 SOCIAL SECURITY: A PRIMER September 2001
22. Above a second set of thresholds—$34,000 for single returns and $44,000 for joint returns—up to 85 percent ofSocial Security benefits are subject to taxation as a result of legislation enacted later. However, the revenues fromthat additional tax are credited to Medicare’s Hospital Insurance Trust Fund rather than to the Social Security trustfunds.
Financing and the Trust Funds
The Social Security program has two sources of dedicated tax revenues. The mainone is a 12.4 percent tax on earnings, split evenly between workers and their employ-ers. The second, much smaller source is income taxes on some people’s Social Secu-rity benefits.
Only earnings up to a maximum annual amount are subject to the Social Secu-rity payroll tax. That amount, the taxable earnings base, is adjusted each year forchanges in average earnings in the U.S. economy. This year, the taxable base is$80,400. Thus, workers earning at least that amount and their employers will each paya tax of almost $5,000.
Since 1984, some Social Security recipients have also been required to payincome taxes on part of their benefits. Beneficiaries pay those taxes only if the sum oftheir adjusted gross income, their nontaxable interest income, and one-half of theirSocial Security benefits exceeds a fixed threshold. If that total is more than $25,000for taxpayers filing individually, or $32,000 for taxpayers filing joint returns, up tohalf of the benefits are subject to taxation.22 Last year, about one-third of SocialSecurity recipients paid an estimated total of $12 billion in income taxes on theirbenefits. That amount represents about 3 percent of total Social Security spending.The income thresholds for determining whether benefits are subject to taxation are notindexed for inflation, so a larger share of recipients and benefits will be affected eachyear.
All of the revenues from the Social Security payroll tax and part of the revenuesfrom taxing some Social Security benefits are credited to the trust funds for the Old-Age and Survivors Insurance and Disability Insurance programs. Social Securitybenefits, the program’s administrative costs, and other authorized expenditures arepaid from those funds.
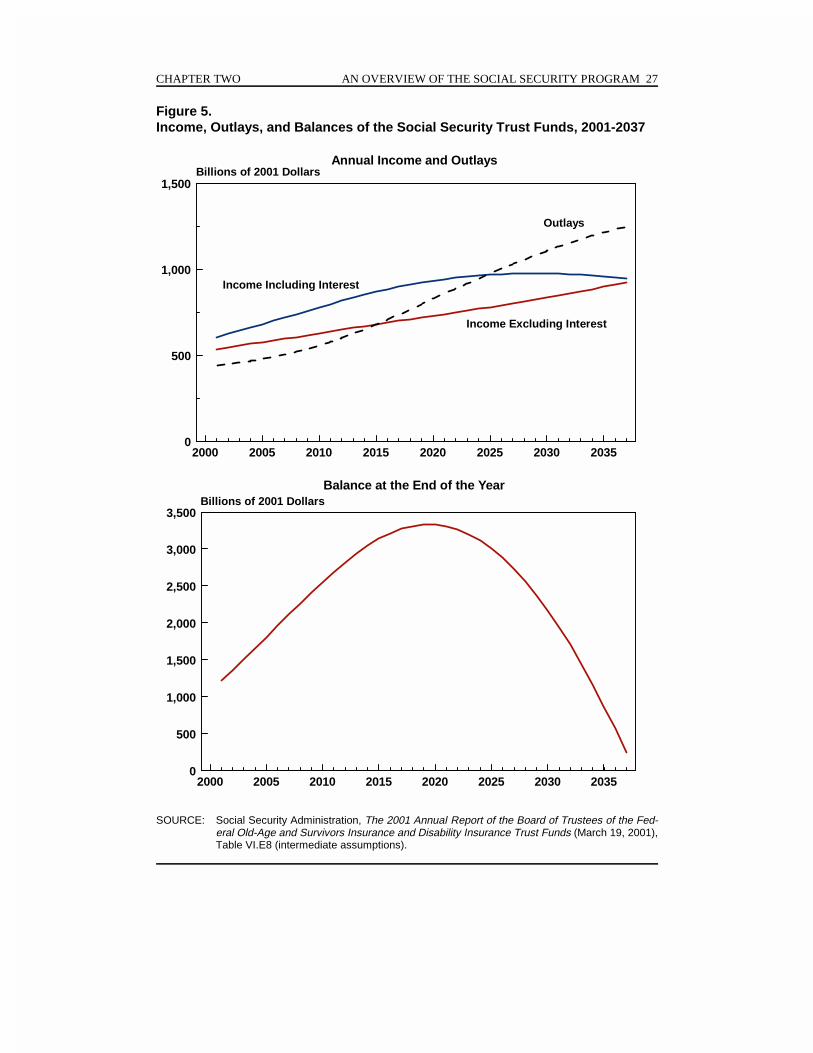
The trust funds serve mainly as accounting mechanisms to track revenues andspending for Social Security. They also help government officials monitor whethertaxes are producing enough revenues to pay for expected benefits. The two trust fundsare running a combined surplus of more than $150 billion a year. They are projectedto show accumulated balances of more than $1 trillion at the end of 2001 (see thebottom panel of Figure 5). However (as discussed in the next chapter), the size of
CHAPTER TWO AN OVERVIEW OF THE SOCIAL SECURITY PROGRAM 27
2000 2005 2010 2015 2020 2025 2030 20350
500
1,000
1,500Billions of 2001 Dollars
Annual Income and Outlays
2000 2005 2010 2015 2020 2025 2030 20350
500
1,000
1,500
2,000
2,500
3,000
3,500Billions of 2001 Dollars
Balance at the End of the Year
Outlays
Income Including Interest
Income Excluding Interest
Figure 5.Income, Outlays, and Balances of the Social Security Trust Funds, 2001-2037
SOURCE: Social Security Administration, The 2001 Annual Report of the Board of Trustees of the Fed-eral Old-Age and Survivors Insurance and Disability Insurance Trust Funds (March 19, 2001),Table VI.E8 (intermediate assumptions).
28 SOCIAL SECURITY: A PRIMER September 2001
23. The debate over the extent to which workers should pay for their own benefits is discussed in Project on the FederalSocial Role, The Report of the Committee on Economic Security; and in Herman B. Leonard, Checks Unbalanced:The Quiet Side of Public Spending (New York: Basic Books, 1986), Chapter 2.
those trust fund balances does not necessarily bear any relationship to Social Secu-rity’s obligations to its beneficiaries or the country’s ability to pay for benefits. Al-though the Social Security Administration keeps track of the amount of payroll taxespaid by each worker, those amounts do not signify ownership by the worker in the waythat the balance statement for a bank account denotes ownership. Ultimately, theworker’s eligibility for benefits and the amount that he or she will receive are deter-mined by Social Security rules set in law.
In 2016, projected outlays for Social Security will begin to exceed the tax reve-nues earmarked for the program (see the top panel of Figure 5). Once that happens,the federal government will need to draw on other resources to fund Social Security,even though the trust funds will continue to be credited with interest on the balancesin the funds. The economic and budgetary effects of having outlays exceed tax reve-nues are the same with or without trust funds.
The financial structure of the Social Security program has resulted in a redistri-bution of resources between generations: each generation of workers pays taxes thatare largely used to make payments to the people already eligible for benefits. FromSocial Security’s earliest days, a contentious issue was whether the benefits that work-ers and their families received should be prefunded using the taxes that those workerspaid, rather than the taxes paid by current workers. As the program was enacted in1935, revenues dedicated to Social Security would have exceeded outlays by enoughto build up very large surpluses. In effect, those excess revenues would have helpedfund, in advance, the benefits that the same workers would receive later. Opponentsof prefunding argued that such an arrangement would result either in pressure to in-crease spending or in federal government ownership of private assets. Later expan-sions to the program, along with postponement of increases in the payroll tax rate thatwere originally scheduled to occur during the 1940s, essentially moved Social Secu-rity to a pay-as-you-go basis.23
That pay-as-you-go structure has worked, although with many changes in taxesand benefits along the way. But it has worked largely because the labor force hasgrown rapidly during much of the program’s history. That situation is about tochange, as the number of Social Security beneficiaries begins to increase much fasterthan the number of workers.

1. An increase of that size would not be unprecedented. Expansions in Social Security benefits and other changesto the program described in Chapter 2, together with increases in the proportion of adults age 65 and over, havealready caused substantial growth in Social Security spending as a percentage of gross domestic product. Spendingon Social Security did not reach 1 percent of GDP until 1955; after that, it rose to 2.5 percent in the following 10years and then nearly doubled (to 4.9 percent) by 1983.
Chapter Three
The Challenges of anAging Population
Social Security may well be the nation’s most popular government program. It iswidely credited with raising the living standards of the elderly and with provid-ing valuable insurance to workers and their families to cushion the economic
losses associated with disability and death.
Why would anyone want to change such a popular program? Different peoplehave different reasons, but most of those reasons relate to one fundamental fact: theage composition of the U.S. population is about to change in ways that will make itharder to continue Social Security as the program operates today. This chapter looksat the demographic patterns that are generating the much-anticipated graying of theU.S. population and the implications of those patterns for Social Security.
The Demographic Outlook
Social Security’s rules for eligibility and benefits, together with favorable demograph-ics, have kept spending for the program stable in recent years, with total outlays grow-ing at about the same rate as the economy. But that relationship will change once thenumber of beneficiaries begins to increase much faster than the number of workers.
Since 1985, spending for Social Security has accounted for 4.1 percent to 4.6percent of the nation’s gross domestic product (GDP). The Social Security Adminis-tration projects that if the laws governing the program do not change, Social Securityoutlays will remain in that range from now until the first wave of baby boomers be-comes eligible for retirement benefits (see the bottom panel of Figure 6). After that,from 2010 to 2030, projected outlays will climb to 6.5 percent of GDP.1 Social

30 SOCIAL SECURITY: A PRIMER September 2001
2000 2010 2020 2030 2040 2050 2060 20700
10
20
30
40
50
60Beneficiaries
Number of Social Security Beneficiaries per 100 Covered Workers
PercentSocial Security Spending as a Percentage of GDP
2000 2010 2020 2030 2040 2050 2060 20700
1
2
3
4
5
6
7
Figure 6.The Outlook for Social Security Demographics and Spending, 2001-2075
SOURCE: Social Security Administration, The 2001 Annual Report of the Board of Trustees of the Fed-eral Old-Age and Survivors Insurance and Disability Insurance Trust Funds (March 19, 2001),Tables IV.B2 and VI.E5 (intermediate assumptions).

CHAPTER THREE THE CHALLENGES OF AN AGING POPULATION 31
1909 1924 1939 1954 1969 1984 1999 2014 2029 2044 2059 20740
1
2
3
4
5Millions
Security’s share of GDP will then increase at a much slower pace—to 6.7 percent in2075.
The source of the projected increase in Social Security spending is the demo-graphic outlook. Since the mid-1970s, the United States has had roughly one SocialSecurity beneficiary for every three workers paying payroll taxes. That ratio is pro-jected to rise to nearly one beneficiary for every two workers by 2030 with the retire-ment of most baby boomers. After that, the combination of a low birth rate and longerlife expectancy will keep raising the ratio. Given the government’s commitments toprovide Social Security benefits under current law, those increases in the ratio ofbeneficiaries to workers translate directly into increases in spending as a percentage ofGDP.
Three facts are key to understanding why the number of Social Security benefi-ciaries will rise at a faster rate than the number of workers over the next 30 years.First, the inflow of newly eligible beneficiaries will soon include the huge baby-boomgeneration born between 1946 and 1964. At the peak of that postwar period, birthsexceeded 4 million per year—a level not reached again until those babies grew up andhad children of their own (see Figure 7).
Figure 7.Births in the United States, 1909-2075
SOURCE: Congressional Budget Office based on data from the Social Security Administration (intermedi-ate assumptions) and from Bureau of the Census, Historical Statistics of the United States:Colonial Times to 1970, Part 1 (1975), p. 49.

32 SOCIAL SECURITY: A PRIMER September 2001
2. Of course, the number of people turning 65 reflects more than simply the number of births 65 years earlier. It isalso affected by immigration to and emigration from the United States and deaths before age 65.
3. Those estimates are “cohort life expectancies,” meaning that they represent the average number of years of liferemaining if a group of people at that age were to experience the mortality rates for the series of years in which theyreach each succeeding age. For example, the estimated life expectancy for a 65-year-old man in 2001 reflects,among other things, projected reductions in the mortality rates of 75-year-old men 10 years from now. (The morecommonly reported “period life expectancies” represent the average number of years of life remaining at a givenage for a given year if a group at that age were to experience the mortality rates for that year over the remainingcourse of their lives. Period life expectancies are generally lower than cohort life expectancies.)
The oldest baby boomers (those born in 1946) will turn 65 in 2011. For nearlytwo decades thereafter, the number of people reaching 65 will surge (see the top panelof Figure 8). That rush will be in stark contrast to the slow inflow in recent years,which reflects the low number of births during the Depression of the 1930s.2
Second, life spans are expected to continue to lengthen. In 1940 (the first yearthat Social Security paid monthly benefits), the average 65-year-old man was expectedto live another 12.7 years, and the average woman another 14.7 years. Social Secu-rity’s actuaries estimate that today the life expectancy of 65-year-olds is 16.3 years formen and 19.6 years for women (see the middle panel of Figure 8).3 The actuariespredict that life spans will continue to increase throughout their 75-year projectionperiod. Some analysts argue that people will live even longer during that period thanthe actuaries are projecting.
Thus, even after all of the baby boomers have retired, the number of beneficia-ries per worker will increase simply because the number of years in which SocialSecurity recipients are collecting benefits will rise. That pattern could be altered,however, if people worked to a later age and delayed applying for benefits. That factis important because there is considerable uncertainty about whether people in thefuture will work to later ages (see Box 3).
Third, the number of workers is likely to grow at a much slower rate both be-cause of the exit of the baby boomers from the labor force and because of the smallsize of the cohorts that immediately follow them (see the bottom panel of Figure 8).Unless immigrants add to the population at a much greater pace than SSA projects (netimmigration of just under 1 million per year), the size of the adult population underage 65 will not rise very much. During most of the second half of the 20th century,women moved into the paid labor force in large numbers, which helped maintain ahigh ratio of workers to beneficiaries. Most observers believe that further increases ofthat size are unlikely to occur. Without a large rise in the percentage of people work-ing, slow growth in the size of the population translates directly into slow growth inthe size of the labor force.

CHAPTER THREE THE CHALLENGES OF AN AGING POPULATION 33
1940 1950 1960 1970 1980 1990 2000 2010 2020 2030 2040 2050 2060 20700
1
2
3
4
5Millions
Number of Men and Women Turning 65
1940 1950 1960 1970 1980 1990 2000 2010 2020 2030 2040 2050 2060 20700
5
10
15
20
25Years Remaining
Cohort Life Expectancy for Men and Women at Age 65
Women
Men
1940 1950 1960 1970 1980 1990 2000 2010 2020 2030 2040 2050 2060 20700
1
2
3
4
5Millions
Number of Men and Women Turning 20
a
Figure 8.Key Demographic Indicators for Social Security, 1940-2075
SOURCE: Congressional Budget Office based on data from the Social Security Administration (intermedi-ate assumptions) and from Social Security Administration, The 2001 Annual Report of theBoard of Trustees of the Federal Old-Age and Survivors Insurance and Disability InsuranceTrust Funds (March 19, 2001), Table V.A4 (intermediate assumptions).
a. The cohort life expectancy for a given year represents the average number of years of life remaining ifa group of people at that age were to experience the mortality rates for the series of years in which theyreach each succeeding year.

34 SOCIAL SECURITY: A PRIMER September 2001
1948 1953 1958 1963 1968 1973 1978 1983 1988 1993 19980
20
40
60
80
100Percent
Women 55 to 64
Men 55 to 64
Women 65 or OlderMen 65 or Older
Box 3.Will Workers in the Future Retire Later?
Lengthy periods of postemployment leisure for men are a relatively recent phenome-non. A century ago, men generally worked as long as they were healthy enough to doso. Even as late as 1950, nearly half of U.S. men age 65 or older were still in thelabor force, compared with just one in six today (see the figure below). The laborforce participation rates of older men have been near the current level since the mid-1980s. The story is more complicated for women because of their rapid movementinto the paid labor force. As more women developed careers during the past halfcentury, their participation rates at all ages increased. But, like men, their participa-tion drops sharply well before age 65.
Labor Force Participation Rates of Men and Women,by Age Group, 1948-2000
The Outlook for Incomes
Most proposals for reforming Social Security are intended to help prepare for futurechallenges rather than immediate ones; thus, projections of people’s future incomesare important. Such projections are inherently imprecise. Even so, two outcomesseem clear. First, future workers and Social Security beneficiaries are likely to havehigher earnings and standards of living, on average, than their predecessors did. Sec-

CHAPTER THREE THE CHALLENGES OF AN AGING POPULATION 35
Box 3.Continued
It is not clear whether the recent stability in labor force participation rates ofolder men represents a temporary pause in the long-term downward trend—perhapsresulting from the exceptionally strong labor market of recent years—or whetherpeople’s attitudes toward work and retirement are beginning to change.
Researchers have linked the long-term decline in men’s retirement ages to thegrowth in the nation’s overall affluence, which is expected to continue.1 Social Secu-rity, pensions, and private savings have enabled workers to look forward to a timewhen they could afford to live without working and without being financially depend-ent on their children. Whole industries have developed to cater to the needs anddesires of retired people.
Other researchers argue that the downward trend in retirement ages has endedand that, in the future, more workers may well decide to retire later.2 They argue thatincreases in life expectancy, the elimination of mandatory retirement, and the growthof less physically demanding jobs may cause more workers to want to maintain someattachment to the labor force later in life. Moreover, the fact that people at or abovethe normal retirement age no longer have their Social Security benefits reduced forearning outside income, and the decline in employers’ use of defined-benefit pensionplans, could make working longer a more attractive option.
1. See, for example, Dora L. Costa, The Evolution of Retirement (Chicago: University of ChicagoPress, 1998).
2. See, for example, Joseph F. Quinn, “Has the Early Retirement Trend Reversed?” (paper presented atthe first joint conference of the Retirement Research Consortia, Washington, D.C., May 20-21,1999); and Eugene Steuerle and Adam Carasso, A Prediction: Older Individuals Will Work More inthe Future, Straight Talk on Social Security and Retirement Policy, No. 32 (Washington, D.C.:Urban Institute, March 30, 2001).
ond, not all groups of elderly people in the future will share equally in the overallincreases in living standards.
Higher Productivity Results in Higher Average Income
How rapidly will average income rise? The answer depends largely on the futuregrowth in labor productivity—that is, the growth in the amount of goods and servicesproduced by the average worker. Economists generally believe that, over the long run,

36 SOCIAL SECURITY: A PRIMER September 2001
4. See Congressional Budget Office, The Long-Term Budget Outlook (October 2000).
1951- 1956- 1961- 1966- 1971- 1976- 1981- 1986- 1991- 1996-0
1
2
3
4Average Annual Percentage Growth
Trend, 1951-1973
(2.7 percent)
Trend, 1974-1995
(1.5 percent)
1955 1960 1965 1970 1975 1980 1985 1990 1995 2000
Figure 9.Labor Productivity in the Nonfarm Business Sector, 1951-2000
SOURCES: Congressional Budget Office; Department of Labor, Bureau of Labor Statistics.
increases in labor compensation (wages and benefits) tend to track increases in pro-ductivity. During the past 50 years, output per hour worked in the nonfarm businesssector rose by about 2 percent a year, though with considerable variation from oneyear to the next (see Figure 9). Average wages grew at a lower rate, as some of theincreases in compensation went to pay for higher health insurance costs and other non-wage employment costs.
Wages. In the fall of 2000, the Congressional Budget Office projected that laborproductivity would rise by more than 2 percent per year over the next three decades.4
At that rate, output per worker in 2030 would be nearly double what it is today.
The Social Security trustees use less optimistic assumptions about the growth ofproductivity and wages than CBO does, but they still project large increases over thenext several decades. Under their intermediate assumptions, productivity would riseby about 1.5 percent per year, and average earnings adjusted for inflation would rise

CHAPTER THREE THE CHALLENGES OF AN AGING POPULATION 37
5. Social Security Administration, The 2001 Annual Report of the Board of Trustees of the Federal Old-Age andSurvivors Insurance and Disability Insurance Trust Funds (March 19, 2001), pp. 83 and 155.
6. The measure of income used here includes cash income received by the individual and his or her family. It doesnot include capital gains or noncash benefits (such as the value of health care covered by Medicare).
by 1.0 percent per year. Thus, average annual earnings in 2030 would be about$45,000 (in inflation-adjusted dollars), compared with about $34,000 today.5
Even under those less optimistic projections, workers in 2030 would earnenough to pay much higher Social Security taxes and still be better off than today’sworkers. For example, the trustees project that under current law, Social Securityspending will exceed revenues in 2030 by 4.2 percent of taxable payroll (or 1.6 per-cent of GDP). Suppose that workers in 2030 were required to have their earningsreduced by an additional 4.2 percent in order to close that gap. Workers earning about$45,000 would need to pay an extra $1,900 in taxes. That would still leave theirwages well above the $34,000 earned by today’s average worker.
Whether future voters would be willing to accept higher taxes is unknowable.For the past three decades, federal taxes have remained relatively stable, at between17.2 percent and 20.6 percent of GDP. During that period, average family incomerose by more than 40 percent. This year, with federal taxes as a share of GDP at thehigh end of that range (20.6 percent) and a large budget surplus, the Congress and thePresident enacted a tax cut.
Retirement Income. In 1999, people age 65 or older received almost 40 percent oftheir cash income from Social Security (see Figure 10).6 Wages, pensions, and incomefrom assets accounted for most of the rest, in about equal shares. Reliance on SocialSecurity was especially high among elderly people with relatively low cash income.In recent years, elderly families who had at least one member collecting Social Secu-rity benefits and who were in the lowest one-fifth of the income distribution receivedalmost 90 percent of their income from Social Security, compared with only 25 per-cent for elderly families in the highest one-fifth of the income distribution.
How much better off will future Social Security beneficiaries be? As with thefuture course of wages, the answer depends in part on productivity. If workers con-tinue to produce increasing amounts of goods and services, wages should continue torise. Increases in wages should, in turn, result in higher Social Security benefits andpensions for those workers when they retire.
Under current law, Social Security benefits are directly related to a worker’searnings history. Because the age at which full benefits are paid is set to increase,average benefits will not grow as much as earnings while that change is phased in.Thus, Social Security will not provide the same fraction of preretirement income tofuture retired workers as to current beneficiaries unless future retirees work longer.

38 SOCIAL SECURITY: A PRIMER September 2001
7. For data on trends in retirement plans and other benefits, see Dallas Salisbury, EBRI Research Highlights:Retirement and Health Data, Issue Brief 229 (Washington, D.C.: Employee Benefit Research Institute, January2001).
Figure 10.Sources of Family Income for People Age 65 or Older, 1999
SOURCE: Social Security Administration, Annual Statistical Supplement, 2000, Chart 3.
a. Includes private pensions and annuities, government-employee pensions, Railroad Retirement bene-fits, and payments from individual retirement accounts, Keogh plans, and 401(k) plans.
Nonetheless, a worker who steadily earns the average wage and retires in 2030 at age65 is projected to be eligible for a Social Security benefit of about $16,000 per year(in 2001 dollars)—25 percent more than a comparable worker retiring at age 65 todaywill receive.
Income from pensions and other retirement plans will probably also be higher,both because of the projected higher earnings of future retired workers and becausemany of those retirees will have worked in jobs that provided retirement benefits,especially tax-deferred defined-contribution plans.7
Another major source of income for retired workers is their assets, which pro-duce income in the form of interest, dividends, rents, and so forth. Most elderly peo-

CHAPTER THREE THE CHALLENGES OF AN AGING POPULATION 39
8. According to data from the 1998 Survey of Consumer Finances, 96 percent of families headed by someone ages65 to 74, and 92 percent of families headed by someone age 75 or older, owned at least one financial asset. Halfof the asset-holders in the 65-74 age group had holdings of at least $46,000. Half of the asset-holders in the oldergroup had holdings of at least $37,000. See Arthur B. Kennickell, Martha Starr-McCluer, and Brian J. Surette,“Recent Changes in U.S. Family Finances: Results from the 1998 Survey of Consumer Finances,” Federal ReserveBulletin, vol. 86, no. 1 (January 2000), pp. 1-29.
9. For a discussion of how much workers would need to save for their retirement and a presentation of recentempirical findings, see Olivia S. Mitchell, P. Brett Hammond, and Anna M. Rappaport, eds., ForecastingRetirement Needs and Retirement Wealth (Philadelphia: Pension Research Council, Wharton School, Universityof Pennsylvania, 2000).
10. Each year, the Bureau of the Census estimates the number of people who live in families whose cash income isbelow an income cutoff, known as a poverty threshold. The threshold varies according to such factors as familysize, number of minor children, and age of the householder and is adjusted each year for inflation. The povertythreshold for an elderly individual in 1999 was about $8,000; for an elderly couple, it was about $10,000. Thosethresholds are roughly 10 percent lower than the ones for nonelderly adults. The most recent estimates are reportedin Bureau of the Census, Poverty in the United States: 1999 (September 2000).
ple have some financial assets, such as bank accounts and money market funds.8 Asworkers’ earnings increase in the future, their assets are likely to grow as well. How-ever, many policymakers are concerned that today’s workers are not saving enough.That is a complicated issue because there is no objective basis for determining howmuch workers should save. The answer depends to a large extent on when they planto retire and what standard of living they wish to have in retirement.9
Some Elderly People Might Not Share in the Income Gains
The decline in the poverty rate of the elderly population during the past half centuryhas been a remarkable development. As late as 1967, 30 percent of people age 65 orolder had income below the poverty line—triple the rate for adults under 65 (seeFigure 11). In recent years, the poverty rate among the elderly has been about 10percent, virtually the same as for younger adults and well below the rate for children.10
By some measures, the percentage of people living in poverty is much loweramong the elderly than among other adults. The official measure of income used bythe Census Bureau does not include capital gains and noncash benefits (such as healthinsurance subsidized by an employer or the government). Likewise, it does not reflectthe value of owning a home. However, the bureau does provide alternative measuresof poverty that take such factors into account. Because most elderly people are en-rolled in Medicare and are more likely than younger adults to own a home, thosealternative measures reduce the estimated poverty rate of the elderly by more than thatof other adults. For example, using the bureau’s most inclusive measure of income,the poverty rate for people age 65 or older would have been 5.2 percent in 1999 ratherthan 9.7 percent. By comparison, the poverty rate for people ages 45 to 64 would

40 SOCIAL SECURITY: A PRIMER September 2001
11. Ibid., pp. 28-29.
1965 1970 1975 1980 1985 1990 19950
5
10
15
20
25
30Percent
65 or Older Under 18
18 to 64
Figure 11.Poverty Rates for Different Age Groups, 1966-1999
SOURCE: Congressional Budget Office based on Bureau of the Census, Poverty in the United States:1999 (September 2000), Table B-2.
have been 5.5 percent using that measure, and the rate for people ages 25 to 44 wouldhave been 6.7 percent.11
Social Security clearly played a major role in the decline of the poverty rateamong elderly people (although exactly how big a role is uncertain). For example,from 1970 to 1972, their poverty rate declined by 6 percentage points, from 24.6percent to 18.6 percent. That drop coincided with three increases in Social Securitybenefits that together raised the average payment by about 35 percent (adjusted forinflation).
Some observers fear that continued prosperity over the next several decadesmight not reduce the poverty rate of the elderly. Of particular concern is the economicoutlook for elderly women who never married or who were divorced after marriageslasting less than 10 years. The Social Security Administration projects that in 2030,nearly 8 percent of women age 65 or older will have never married and 15 percent willhave divorced and not remarried—almost double the percentages of last year (see Fig-ure 12). Obviously, specific projections are very uncertain, but the pattern of lower

CHAPTER THREE THE CHALLENGES OF AN AGING POPULATION 41
12. Amara Bachu and Martin O’Connell, Fertility of American Women, Current Population Report P20-526 (Bureauof the Census, September 2000), p. 6. Among all never-married women ages 21 to 44, the share with one or morechildren ranges from 9 percent of women with at least a bachelor’s degree to 66 percent of women without a highschool diploma.
Figure 12.Marital Status of the Female Population Age 65 or Older, 2000 and 2030
SOURCE: Congressional Budget Office based on data from the Social Security Administration (intermedi-ate assumptions).
marriage rates and higher divorce rates among baby boomers—compared with ratesamong previous generations—seems unmistakable.
Less clear is how well those women will fare. Many of the never-marriedwomen will have pursued careers and, when they retire, will become eligible forSocial Security benefits on the basis of a full earnings history. But others will havespent part of their lives rearing children by themselves and either not working outsidethe home or not earning very much. In recent years, about one-third of single womenhave had at least one child by the time they reach their early 40s.12 Those women areineligible for Social Security benefits based on a husband’s earnings unless they latermarry. And unless those women develop substantial earnings histories, many of themare likely to have low incomes when they reach their 60s.
The Budgetary and Economic Perspective
Once the baby-boom generation retires, the amount of money that the federal govern-ment will spend on Social Security and other programs for the elderly will grow sub-stantially (barring changes to those programs). SSA projects that under current law,

42 SOCIAL SECURITY: A PRIMER September 2001
13. According to the intermediate assumptions in the trustees’ 2001 report, Social Security spending will increase by2.35 percent of GDP between now and 2030. The Congressional Budget Office forecasts that GDP will total about$10.3 trillion in 2001.
14. Congressional Budget Office, The Long-Term Budget Outlook.
spending on Social Security will rise from 4.2 percent of GDP this year to 6.5 percentby 2030—equivalent to an increase of about $240 billion in today’s economy.13
Moreover, spending on federal health care programs for the elderly and disabled willprobably rise at an even faster rate because of increases in the cost per beneficiary. Inall, spending for Social Security, Medicare, and Medicaid is projected to grow fromless than 8 percent of GDP this year to roughly 15 percent by 2030.14
The resources needed to finance the government’s obligations under thoseprograms—and, in turn, the goods and services that those benefits will pay for—aredrawn from the overall economy when the payments are made. In other words, in2030 (as in any year), pledges to the elderly as well as other federal priorities—suchas national defense, aid to state and local education agencies, public health services,and transportation projects—will require the government to draw on economic re-sources available at that time.
One way to prepare for the demographic pressures expected later in this centurywould be to take actions that increase the size of the economy (as discussed in Chap-ter 4). Another approach would be to curtail the growth of benefits for the elderly. Ifthose benefits are to be curtailed, however, it would be useful to announce the changeswell in advance so that people who will be affected can alter their plans accordingly.In particular, they might try to save more money or retire later.
In addition, Social Security planners may want to pay special attention to howproposals to slow the growth of benefits would affect people with a history of lowearnings, especially people who are not eligible for a spousal benefit because theynever married or their marriage did not last for 10 years. Several proposals have triedto address the needs of such beneficiaries by expanding or replacing the minimum-benefit provisions in the current Social Security law. Another approach would be tohelp those people through the Supplemental Security Income program.
The Social Security Trust Fund Perspective
The Social Security trustees project that spending for the program will begin to exceeddedicated tax revenues in 2016 and that the Social Security trust funds will be de-

CHAPTER THREE THE CHALLENGES OF AN AGING POPULATION 43
15. Because the Social Security Act states that benefits are only payable from the trust funds, it is not clear howrevenues would be distributed to beneficiaries after those funds were depleted. The trustees project that at thatpoint, tax revenues dedicated to the Social Security program would be sufficient to pay only about 73 percent ofprojected benefits.
pleted in 2038. Those events could easily occur sooner or later, depending on a hostof economic and demographic variables that are difficult to predict accurately.15
The perspective of trust fund accounting provides, at best, only a partial view ofthe challenges posed by the aging of the population. Whether a program receivesearmarked revenues and is accounted for through a government trust fund or relies onannual appropriations does not alter the fact that whatever resources the federal gov-ernment is required to spend it must acquire through taxes, borrowing, sales of assets,or some combination of those actions. Ultimately, the government’s ability to meetfuture commitments—whether Social Security benefits or some other payments—depends on the total financial resources of the economy and the willingness of citizensto fund those programs, not on the balances attributed to the trust funds.
Some approaches that would strengthen the government’s ability to meet futurecommitments would contribute little to making the Social Security trust funds solvent.For example, approaches that would promote productivity would most likely increasereal wages. But under the benefit formula established by the 1977 amendments,higher wages would eventually translate into higher Social Security benefits (althoughwith a substantial lag).
Likewise, some approaches for making the Social Security trust funds solventwould, by themselves, do nothing to reduce the program’s obligations or increase thenation’s economic capacity to meet those obligations. For example, the Congresscould pass a law transferring enough funds from the federal government’s generalfund to the Social Security trust funds to ensure that those funds always showed apositive balance. That would fix the solvency problem on paper. But such accountingdevices—moving money from one part of the budget to another—would not directlyaffect either the size of the economy or the government’s obligations to the elderly.


Chapter Four
Strategies for Preparingfor an Aging Population
Any strategy to prepare the United States for an aging population must deal witha key fact: the goods and services that retirees consume in the future will haveto be produced at that time by the U.S. economy or imported from abroad.
From that perspective, what matters is not the financial structure of the Social Securityprogram but the capacity of the economy. Various options for reform will have differ-ent effects on the economy and on the division of resources between the elderly andother people. To the extent that those options boost the future size of the economyand increase the nation’s accumulation of assets, they can lessen the burden on futureworkers of making payments to the elderly.
How can the federal government expand the economy? Possible ways includerunning budget surpluses or promoting private saving, which can provide more fundsfor investment in business equipment, structures, and other types of capital; changingtax and regulatory policies to make the economy more efficient or give people greaterincentives to work or improve their skills; and increasing government spending onprograms that are geared toward investment rather than current consumption. Inaddition, changing some of the rules of the Social Security program could promoteeconomic growth. In most cases, increasing the size of the economy requires policyactions that cause people to consume less or work more. Thus, policymakers shouldweigh the benefits of a larger economy in the future against the costs of those policyactions today.
This chapter looks at three strategies that have been at the heart of the publicdebate about preparing for the nation’s future needs. Those strategies are savingbudget surpluses and using them to pay down federal debt, using the surpluses tocreate private retirement accounts, and changing the rules of the current Social Secu-rity program. Those options are not mutually exclusive; they could be combined inany number of ways.

46 SOCIAL SECURITY: A PRIMER September 2001
1. Federal debt held by the public is debt issued by the federal government in the form of Treasury securities and heldby nonfederal investors. In this chapter, “debt” refers to debt held by the public.
2. Congressional Budget Office, The Budget and Economic Outlook: An Update (August 2001).
Preserving Budget Surpluses
With the federal government running a budget surplus each year, many people arguethat those surpluses should be saved and used to pay down federal debt. Federal debtheld by the public has already declined in recent years—from about 50 percent of thenation’s gross domestic product in 1995 to about 35 percent last year (see Figure 13).1
Continuing to pay down that debt could provide economic and budgetary benefits. Byexpanding the nation’s saving, that policy could boost the stock of private capital andincrease the size of GDP. As a result, future workers might be better prepared to bearthe burden of making payments to an aging population. In addition, lower levels ofdebt would reduce the government’s interest payments on the debt, which could givefuture policymakers more flexibility for dealing with unexpected developments.
The Mechanics of Federal Budget Surpluses
Whenever the federal government’s total yearly spending exceeds its total yearlyrevenues, the government runs a budget deficit. If the Treasury does not finance thatdeficit by drawing down its holdings of cash, gold, or other assets, the government hasto borrow funds from the public by selling Treasury securities (bonds, notes, andbills). That additional borrowing increases the government’s debt held by the public.
The situation is not unlike what happens when a family borrows on a creditcard. The balance on the card is a debt, which carries finance or interest charges aslong as the debt is outstanding. The family can reduce its debt by paying off morethan it spends (including finance charges) each month.
Since 1998, the government has been running budget surpluses and repayingdebt. Looking forward, the Congressional Budget Office projects that if current poli-cies do not change, budget surpluses will grow and, over the coming decade, provideenough money to pay off all of the publicly held debt available for redemption by2010.2
CBO does not expect the Treasury to redeem (buy back) all of the outstandingdebt. Many of the outstanding bonds will not mature for many years, and the govern-ment does not have the right to redeem them before maturity. Thus, the only way itcould pay off those bonds early would be to buy them on the open market. But as thestock of debt dwindled, debt holders might demand a premium to surrender their

CHAPTER FOUR STRATEGIES FOR PREPARING FOR AN AGING POPULATION 47
Percent
1790 1805 1820 1835 1850 1865 1880 1895 1910 1925 1940 1955 1970 1985 20000
20
40
60
80
100
120
bonds. At some point, that premium could grow so high as to make it impractical topay off any more debt. Budget surpluses would then have to be invested in otherassets. CBO calls those assets “uncommitted funds,” reflecting the fact that the Trea-sury does not now have the legal authority to invest in most types of nonfederal assets,such as stocks and bonds of private corporations. Under current law, the federalgovernment would have to hold its uncommitted funds as cash, gold, or deposits at theFederal Reserve or commercial banks.
Managing those holdings within the constraints of current law would be difficultfor the federal government; thus, the Treasury would probably seek authority to investin other assets, including stocks and debt of U.S. or foreign companies and securitiesissued by foreign governments. However, government ownership of private assetswould raise significant questions about the government’s role in the economy (dis-cussed below). It would also raise questions about how such securities should betreated in the federal budget (see Box 4).
Figure 13.Federal Debt Held by the Public as a Percentage of GNP, 1790-2000
SOURCE: Congressional Budget Office.
NOTE: This figure compares debt with gross national product (GNP) rather than the more familiar grossdomestic product (GDP) because GNP is the measure used in the historical data. GNP measuresthe total income of all U.S. residents (including net payments for capital and labor income earnedin other countries). GDP measures the income produced on U.S. soil. The difference betweenthe two was about $12 billion in 2000.

48 SOCIAL SECURITY: A PRIMER September 2001
Box 4.The Budgetary Treatment of Government
Purchases of Private Securities
Several recent proposals envision having the government invest in private securities,such as corporate stocks and bonds. The possibility of such purchases raises thequestion of how they would be treated in the federal budget, which operates mainlyon a cash basis.
The Office of Management and Budget’s Circular A-11 on budget preparationsays that purchases of private securities should be recorded as outlays when they aremade and as offsets to outlays (offsetting receipts) when the securities are sold.Interest and dividend payments are also supposed to be classified as offsetting re-ceipts. Under that treatment, the budget would not distinguish between using $10million to buy private securities and spending the same amount to buy office suppliesor a building. Indeed, Circular A-11 directs that all federal purchases of assets,whether financial or physical, receive the same treatment and be shown as outlays.That approach is consistent with the practice of recording most government transac-tions on a cash basis.
Some people suggest, however, that the purchase of private securities should betreated differently because the securities would be bought as a means of financingfuture government obligations and would not constitute a use of budgetary resources.In their view, securities transactions between the government and the public, if theyare carried out at fair market prices, should leave the budget balance (surplus or defi-cit) unaffected. That is how the budget treats the issuance of Treasury securitieswhen the government borrows from the public.
Under that alternative treatment, purchases of securities would be reported as anincrease in the government’s assets, which would be exactly offset by a reduction inanother asset (cash) or an increase in a liability (Treasury debt). Similarly, sales ofsecurities would leave the budget balance unaffected because the reduced value ofone asset held by the government (securities) would be exactly offset by an increase
The Economic Effects of Saving Surpluses
Using budget surpluses to pay down debt would probably raise national saving andexpand the pool of funds available for investing at home and abroad. Over time, theU.S. capital stock could grow larger, and the nation could accumulate more net assetsin other countries. As investment in businesses’ structures and equipment increased,workers would become more productive, real wages would rise, and the United Statescould produce more goods and services. In addition, the income from the extra netforeign assets could supplement the income produced domestically. In October 2000,

CHAPTER FOUR STRATEGIES FOR PREPARING FOR AN AGING POPULATION 49
3. That estimate is based on CBO’s midrange assumptions for population, productivity, and medical costs. Fordetails, see Congressional Budget Office, The Long-Term Budget Outlook (October 2000).
Box 4.Continued
in another asset (cash). Investing in private securities is risky, however, and changesin the market prices of securities would result in gains and losses to the government.Under this alternative budgetary accounting, those gains and losses would be reportedas positive or negative outlays in each reporting period. That way, such purchaseswould be treated like transactions of the financing accounts for credit programs,profits from the government’s sale of its gold reserves, or seigniorage on the coinsthat the government issues.1
Proposals for private retirement accounts also envision having people invest inprivate securities, such as stocks and bonds.2 If all of the benefits and risks of privateaccounts accrued to the individual owners, those accounts would be private and out-side the federal budget. However, the federal government (and thus taxpayers) wouldretain a large interest in the accounts if people’s annual Social Security benefits werereduced dollar for dollar by the amount of annual income they received from theiraccount. In that case, many account holders would receive no net gain from havingsuch a private account; in effect, they would merely be acting as investing agents forthe federal government. Because the federal government would have a substantialinterest in the holdings of the private accounts, those accounts might appropriately betreated as governmental rather than private, with cash flows to and from them in-cluded in the federal budget.
1. Seigniorage is the profit that the government makes from putting new currency in circulation. Itresults when the face value of the currency is greater than the cost of producing it. Seigniorageand the other items listed above are not recorded in the budget (in other words, they do not con-tribute to deficits or surpluses). However, they are regarded as “means of financing” because theyincrease or decrease the amount that the government needs to borrow.
2. See Congressional Budget Office, The Budgetary Treatment of Personal Retirement Accounts,CBO Paper (March 2000).
CBO estimated that real income per person could be about 10 percent higher in 2040if the off-budget surpluses projected through 2010 were saved rather than used formore government spending that consumed goods and services (see Figure 14).3
National saving would not rise dollar for dollar with an increase in federalbudget surpluses because private savers would probably reduce their saving. There
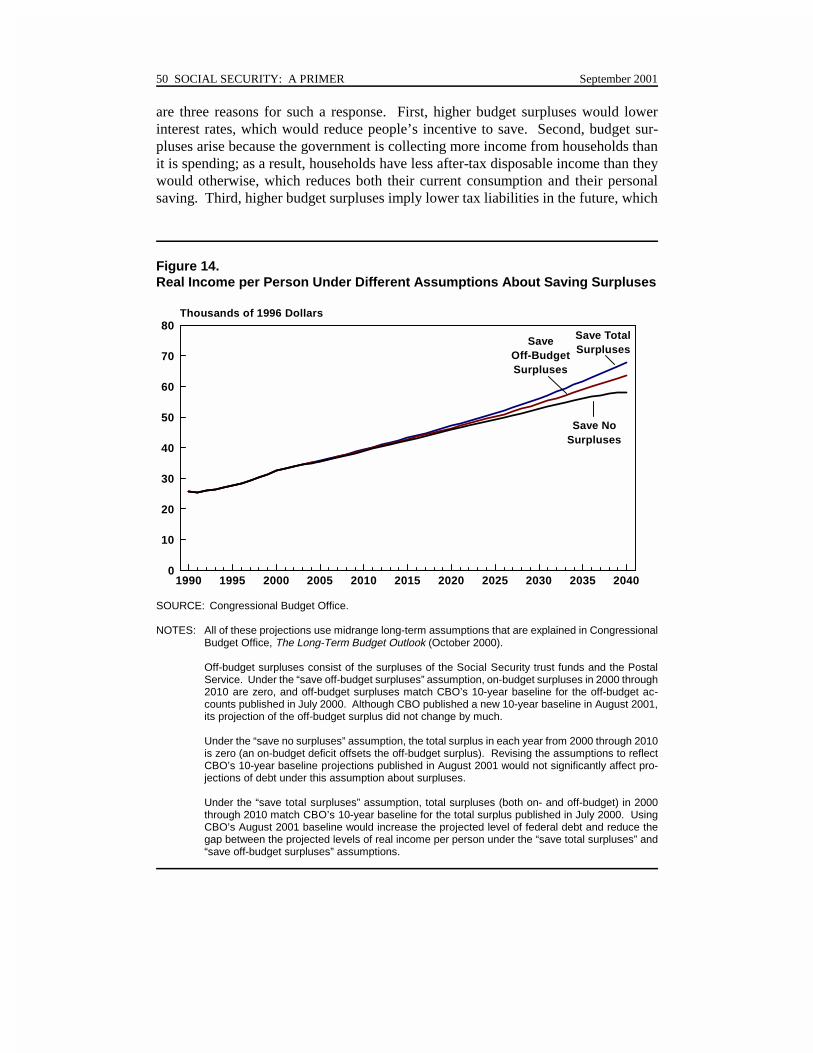
50 SOCIAL SECURITY: A PRIMER September 2001
1990 1995 2000 2005 2010 2015 2020 2025 2030 2035 20400
10
20
30
40
50
60
70
80Thousands of 1996 Dollars
Save TotalSurpluses
SaveOff-BudgetSurpluses
Save NoSurpluses
are three reasons for such a response. First, higher budget surpluses would lowerinterest rates, which would reduce people’s incentive to save. Second, budget sur-pluses arise because the government is collecting more income from households thanit is spending; as a result, households have less after-tax disposable income than theywould otherwise, which reduces both their current consumption and their personalsaving. Third, higher budget surpluses imply lower tax liabilities in the future, which
Figure 14.Real Income per Person Under Different Assumptions About Saving Surpluses
SOURCE: Congressional Budget Office.
NOTES: All of these projections use midrange long-term assumptions that are explained in CongressionalBudget Office, The Long-Term Budget Outlook (October 2000).
Off-budget surpluses consist of the surpluses of the Social Security trust funds and the PostalService. Under the “save off-budget surpluses” assumption, on-budget surpluses in 2000 through2010 are zero, and off-budget surpluses match CBO’s 10-year baseline for the off-budget ac-counts published in July 2000. Although CBO published a new 10-year baseline in August 2001,its projection of the off-budget surplus did not change by much.
Under the “save no surpluses” assumption, the total surplus in each year from 2000 through 2010is zero (an on-budget deficit offsets the off-budget surplus). Revising the assumptions to reflectCBO’s 10-year baseline projections published in August 2001 would not significantly affect pro-jections of debt under this assumption about surpluses.
Under the “save total surpluses” assumption, total surpluses (both on- and off-budget) in 2000through 2010 match CBO’s 10-year baseline for the total surplus published in July 2000. UsingCBO’s August 2001 baseline would increase the projected level of federal debt and reduce thegap between the projected levels of real income per person under the “save total surpluses” and“save off-budget surpluses” assumptions.

CHAPTER FOUR STRATEGIES FOR PREPARING FOR AN AGING POPULATION 51
4. Robert J. Barro, “Are Government Bonds Net Wealth?” Journal of Political Economy, vol. 82, no. 6 (December1994), pp. 1095-1117. For an evaluation, see Douglas W. Elmendorf and N. Gregory Mankiw, “GovernmentDebt,” in John B. Taylor and Michael Woodford, eds., Handbook of Macroeconomics, vol. 1C (Amsterdam:Elsevier Science, 1999).
5. For views on those topics, see the statement of Alan Greenspan, Chairman, Board of Governors of the FederalReserve System, before the Senate Budget Committee, January 25, 2001, and the statement of David M. Walker,Comptroller General of the United States, before the Senate Budget Committee, published as General AccountingOffice, Long-Term Budget Issues: Moving from Balancing the Budget to Balancing Fiscal Risk, GAO-01-385T(February 6, 2001).
6. Statement of Kevin Hassett, Resident Scholar, American Enterprise Institute, before the House Ways and MeansCommittee, February 13, 2001.
lessens people’s incentive to save to pay future tax bills.4 Despite those consider-ations, it is unlikely that the decrease in private saving would completely offset theincrease in budget surpluses.
Government Accumulation of Assets
One of the potential problems with saving surpluses is that the government couldaccumulate a large amount of assets and possibly own a significant number of sharesin private companies. Although asset accumulation can increase the funds availablefor capital investment and boost economic growth, it would be unprecedented for thefederal government to hold a large quantity of private assets. The possibility of suchholdings raises broad philosophical questions (would it be appropriate for the govern-ment to own shares in and possibly control private companies?) as well as economicquestions (could the government’s involvement distort market signals and corporatedecisionmaking?).5
Answers to those questions would depend on how the investments were chosen,the portfolio managed, and the asset-purchase program overseen. Economic theoryand the experience of other governments provide some insights. In principle, thegovernment could reduce the impact of its investments on the economy by investing inindex funds, maintaining a passive stance, and letting private shareholders determinecorporate behavior. In addition, the investments could be managed by a board thatwas subject to strict rules. According to economic theory, if financial markets wereefficient and government investments in any particular stock were not too large, thegovernment would not significantly affect the prices of stocks selected for its portfolioor alter the allocation of capital among firms.
However, financial markets may not behave exactly as economic models pre-dict, and putting a company’s stock in the government’s portfolio might influencestock prices and capital flows. For example, the price of a stock often rises when thestock is listed in the Standard & Poor’s (S&P) 500 index.6 A similar situation mightoccur when the government put a company on its list of stocks to buy.

52 SOCIAL SECURITY: A PRIMER September 2001
7. Olivia Mitchell and Ping-Lung Hsin, “Public Pension Governance and Performance,” in Salvador Valdés-Prieto,ed., The Economics of Pensions: Principles, Policies, and International Experience (Cambridge: CambridgeUniversity Press, 1997); Alicia Munnell, “The Pitfalls of Social Investing by Public Pension Plans,” New EnglandEconomic Review (September/October 1983), pp. 20-37; John Nofsinger, “Why Targeted Investing Does Not MakeSense,” Financial Management, vol. 27, no. 3 (Autumn 1998), pp. 87-96; and Roberta Romano, “Public PensionFund Activism in Corporate Governance Reconsidered,” Columbia Law Review, vol. 93, no. 4 (May 1993), pp.795-853.
Table 2.Asset Holdings of Retirement Funds for State and LocalGovernment Employees (In billions of dollars)
Type of Asset 1996 1997 1998 1999 2000
Corporate Stocks 829 1,085 1,234 1,343 1,352
Corporate and Foreign Bonds 211 245 280 310 322
U.S. Government SecuritiesTreasury 204 217 218 211 206Agency 105 123 142 165 198
Municipal Securities 1 2 3 3 2
Open-Market Paper 28 29 38 40 46
Mortgages 17 18 24 22 22
Checkable Deposits and Currency 8 5 10 9 9
Time and Savings Deposits 2 2 2 2 1
Security Repurchase Agreements 28 29 38 40 46
Miscellaneous Assets 63 64 66 81 85
Total 1,495 1,817 2,054 2,227 2,288
SOURCE: Congressional Budget Office based on data from Federal Reserve, Flow of Funds Accounts ofthe United States (June 8, 2001).
NOTE: The numbers in this table represent asset holdings at the end of the year.
Many state pension funds invest in stocks and bonds. Those funds held almost$1.7 trillion in corporate stocks and bonds in the fourth quarter of 2000 (see Table 2).The states have a mixed track record in insulating their investment decisions frompolitics: in some cases, investment policies bent to political pressure, and the perfor-mance of the portfolios suffered.7 However, the overall returns on investments in stateand local pension funds are similar to those on investments in private funds (adjustedfor differences in the size and composition of the portfolios), which suggests that

CHAPTER FOUR STRATEGIES FOR PREPARING FOR AN AGING POPULATION 53
8. Alicia Munnell and Annika Sunden, “Investment Practices of State and Local Pension Funds: Implications forSocial Security Reform” (paper presented at the Pension Research Council conference at the Wharton School,University of Pennsylvania, April 26-27, 1999).
9. General Accounting Office, Budget Surpluses: Experiences of Other Nations and Implications for the UnitedStates, GAO/AIMD-00-23 (November 2, 1999).
10. Under certain circumstances, the Secretary of the Treasury is authorized to reduce the holdings of the TSP fund.For instance, when negotiations to increase the legal limit on federal debt deadlocked in 1995, Treasury SecretaryRobert Rubin sold holdings of the TSP’s Government Securities Investment Fund to create room under the debtlimit and ensure that the government would be able to meet its November 15 quarterly payment to bondholders.Those holdings were later replenished in full with interest, as required by law.
political influence may not have greatly interfered with the pursuit of market returnsfor many state funds.8
Some countries have also built up large holdings of government-owned privateassets.9 Norway, for example, has accumulated net assets (primarily foreign stocksand bonds) totaling almost half of its GDP. It reduces political interference by havingthe country’s central bank manage those investments. However, its decision to investmainly in foreign securities limits its potential scope for distorting the activities of itsprivate sector. Moreover, Norway is a relatively small country whose actions wouldnot be expected to affect world financial markets to any appreciable extent.
The U.S. government has been successful in managing the Thrift Savings Plan(TSP), which invests in stock and bond markets through broad-based indexes and paysretirement benefits to federal workers through a system of individual accounts. Acrucial feature of the TSP is that its assets are owned by federal workers, not thegovernment. The board that oversees the program has a fiduciary responsibility tomanage those assets for the sole benefit of the owners of the individual accounts.10
If lawmakers decided that the federal government should not invest in privateassets, they would need to cut taxes or increase spending at some point to eliminatebudget surpluses. Making those changes smoothly over time would be desirable be-cause sudden shifts in policy run the risk of causing economic disruptions.
Economic Efficiency
Saving surpluses and accumulating nonfederal assets would have an uncertain effecton the efficiency of the U.S. economy. If surpluses were not saved and current spend-ing policies did not change, future taxpayers could face much higher tax rates to coverthe growing costs of Social Security, Medicare, Medicaid, and interest on the federaldebt. Thus, saving surpluses could help reduce the pressure to raise future taxes andpossibly avoid large variations in marginal tax rates over time. (A marginal tax rate isthe rate that applies to an additional dollar of taxable income.) Rising marginal tax

54 SOCIAL SECURITY: A PRIMER September 2001
11. Those losses increase by roughly the square of the tax rate. For a nontechnical discussion of this issue, see HarveyRosen, Public Finance, 5th ed. (Homewood, Ill.: Richard D. Irwin, 1999).
Box 5.The Impact on Financial Markets of
Paying Down Federal Debt
Many private investors hold government debt (Treasury securities) in their portfoliosbecause it provides a relatively safe return and is highly liquid (that is, can be easilybought and sold). If government debt were nearly paid off, investors would have toadjust their portfolios, and investment firms would have to change some of theirprocedures for assessing the prices of assets.
Investors would probably be able to find other assets that were relatively safe,and U.S. financial markets would most likely create new financial instruments tosatisfy investors’ demands. But those other assets might not be as liquid as Treasurysecurities are today. In addition, investors would have to hold assets that were proba-bly not as safe as government debt. Nevertheless, because the cost of guaranteeinggovernment debt is ultimately borne by taxpayers, higher risks to investors might belargely offset in the long run by lower risks to taxpayers. The effects on economicefficiency would most likely be small.
The Federal Reserve uses Treasury securities to carry out some of its importantfunctions, such as buying and selling securities on the open market in order to influ-ence the economy. Nevertheless, it would still be able to perform open-market opera-tions if federal debt was not available. Open-market operations can be carried outusing any liquid asset. However, the Federal Reserve would have to work out a num-ber of practical problems, and policymakers might have to change the Federal Re-serve’s charter to allow it to use other assets.
rates can be particularly harmful to economic efficiency because they reduce people’sincentives to work and save, and the resulting losses in efficiency tend to increase bymuch more than the tax rate does.11 Paying down debt lessens the pressure to raise taxrates in the future by reducing interest payments on the debt. (Slowing the growth rateof federal spending could have similar effects.)
However, government investments in private assets could interfere with theefficient operation of the nation’s capital markets. The size of that interference isdifficult to gauge for reasons discussed earlier. Some people also argue that if inves-tors were not able to buy Treasury securities, efficiency in capital markets could suf-fer, but it is doubtful that such a change would have much effect (see Box 5).

CHAPTER FOUR STRATEGIES FOR PREPARING FOR AN AGING POPULATION 55
Creating Private Retirement Accounts
A second strategy that might help the nation prepare for an aging population is to usebudget surpluses to pay for the creation of private retirement accounts. During theprevious Congress, lawmakers introduced a host of proposals for such accounts (for alist of those proposals, see Appendix B). Although the proposals differed in signifi-cant ways, they shared a common feature: the income that would be available from anaccount at someone’s retirement would depend on the contributions made to the ac-count and the rate of return on the account’s assets during the person’s working life.In addition, most proposals would let workers invest part of their accounts in corpo-rate stocks (see Box 6 for a discussion of the economic effects of such investments).
Private accounts have drawn widespread interest for several reasons:
� They would give workers some freedom and responsibility for choosinginvestments and planning their retirement;
� They could expand people’s access to financial markets and improve theirunderstanding of the value of saving;
� They might help protect budget surpluses from being used for increasedgovernment spending or for tax cuts; and
� They could be used to shift control of those surpluses from the governmentto the private sector and thus avoid the potential drawbacks of having thegovernment own private assets.
Some analysts also argue that private accounts offer the opportunity for higher rates ofreturn than the traditional Social Security system does, but that argument can be mis-leading (see Box 7).
Proposals for private accounts can help prepare the nation for an aging popula-tion only to the extent that they increase national saving. However, private accountsare not necessary, or by themselves sufficient, to boost national saving. As discussedin the previous section, the government might be able to increase such saving by pre-serving budget surpluses and paying down federal debt. However, national savingwould not rise if the government simply financed the creation of private accounts byborrowing. In that case, every dollar saved in a private account would be offset by adollar borrowed by the government.
In setting up a system of private accounts, policymakers would also have toconfront various questions. Would participation be mandatory or voluntary? Wouldpeople be given a limited choice of assets (as in the government’s Thrift Savings Plan

56 SOCIAL SECURITY: A PRIMER September 2001
Box 6.The Risks and Returns of Stocks
Stock investments are a common feature of many proposals for Social Security.Those proposals range from ones that would create private retirement accounts toones that would invest part of the Social Security trust funds in the stock market (seeAppendix A for more details).
The interest in stocks is not surprising. Stocks have historically yielded a higherrate of return than fixed-income securities, such as Treasury bonds. From 1926through 2000, for example, the real rate of return on large-company stocks averagedabout 7 percentage points more than the real rate of return on three-month Treasurybills (see the table at right).1
However, stock investments also carry correspondingly higher risks, and the ratesof return on those investments vary greatly. According to historical data, investorsface about a 25 percent chance of realizing lower returns from holding a portfolio ofstocks in the Standard & Poor’s 500 index for 10 years than from holding 10-yeargovernment notes for the same length of time.2 Moreover, for several years in a row,a stock portfolio could lose money relative to a bond portfolio.
Analyses that focus only on the average return on stocks and ignore the risk canbe misleading. If financial markets are efficient, the higher returns on stocks shouldexactly compensate investors for the added risk.3 Although investing in the stockmarket would improve the projected balances in the Social Security trust funds or inprivate accounts, on average, it would also make those average balances much moreuncertain. Adjusting the projected balances to account for that risk by using the mar-ket’s assessment (that is, discounting them at a market risk-adjusted rate) would elimi-nate all of the apparent gains from investing in stocks.
1. That difference may be smaller in the future. Although the value of the stock market has droppedover the past year, some analysts argue that it is still high relative to corporate earnings. See RobertShiller, Irrational Exuberance (Princeton, N.J.: Princeton University Press, 2000).
2. Thomas MaCurdy and John Shoven, “Asset Allocation and Risk Allocation: Can Social SecurityImprove Its Future Solvency Problem by Investing in Private Securities?” in John Campbell andMartin Feldstein, eds., Risk Aspects of Investment-Based Social Security Reform (forthcoming).
3. Traditional economic models cannot easily explain the high returns on stocks relative to their observ-able risk, but that situation may have more to do with the shortcomings of economists’ models thanwith the possibility that investing in stocks could provide a “free lunch.”
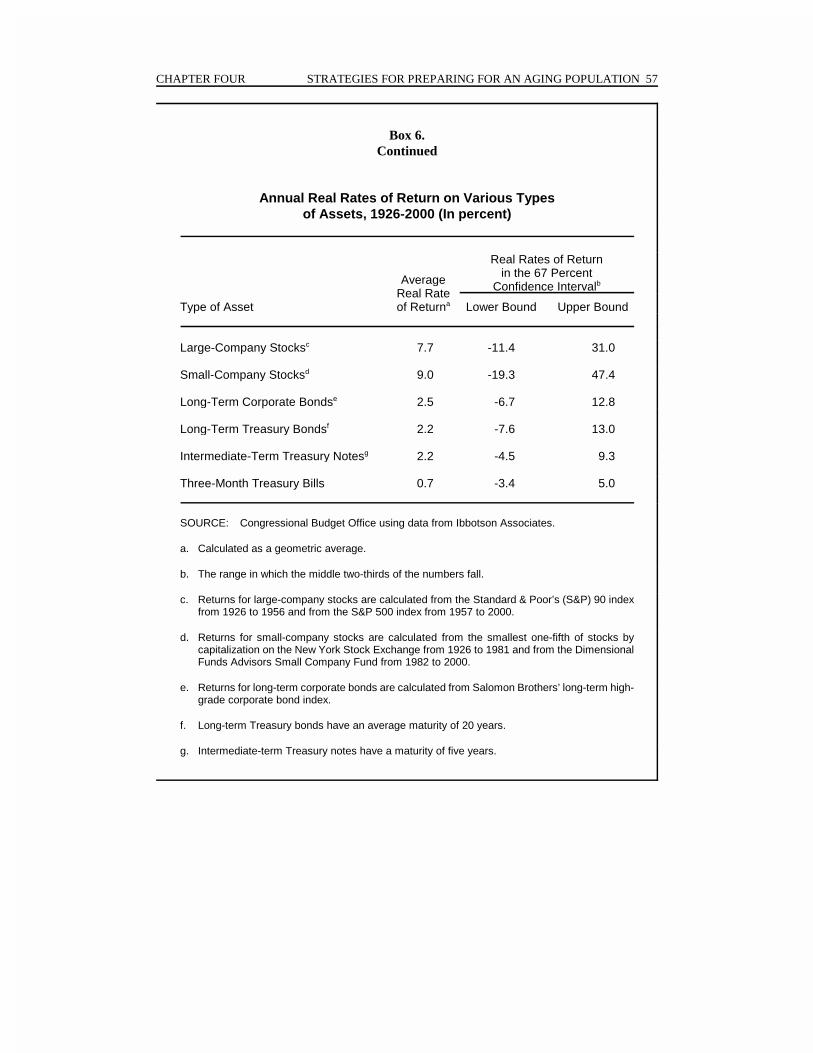
CHAPTER FOUR STRATEGIES FOR PREPARING FOR AN AGING POPULATION 57
Box 6.Continued
Annual Real Rates of Return on Various Typesof Assets, 1926-2000 (In percent)
Type of Asset
AverageReal Rateof Returna
Real Rates of Returnin the 67 Percent
Confidence Intervalb
Lower Bound Upper Bound
Large-Company Stocksc 7.7 -11.4 31.0
Small-Company Stocksd 9.0 -19.3 47.4
Long-Term Corporate Bondse 2.5 -6.7 12.8
Long-Term Treasury Bondsf 2.2 -7.6 13.0
Intermediate-Term Treasury Notesg 2.2 -4.5 9.3
Three-Month Treasury Bills 0.7 -3.4 5.0
SOURCE: Congressional Budget Office using data from Ibbotson Associates.
a. Calculated as a geometric average.
b. The range in which the middle two-thirds of the numbers fall.
c. Returns for large-company stocks are calculated from the Standard & Poor’s (S&P) 90 indexfrom 1926 to 1956 and from the S&P 500 index from 1957 to 2000.
d. Returns for small-company stocks are calculated from the smallest one-fifth of stocks bycapitalization on the New York Stock Exchange from 1926 to 1981 and from the DimensionalFunds Advisors Small Company Fund from 1982 to 2000.
e. Returns for long-term corporate bonds are calculated from Salomon Brothers’ long-term high-grade corporate bond index.
f. Long-term Treasury bonds have an average maturity of 20 years.
g. Intermediate-term Treasury notes have a maturity of five years.

58 SOCIAL SECURITY: A PRIMER September 2001
Box 7.Why Comparing Rates of Return Can Be Misleading
A popular criticism of Social Security and other public pension programs that are funded on apay-as-you-go basis is that they produce very low “rates of return” for future beneficiaries. Tobe sure, simply comparing the present value of taxes paid into the program with the presentvalue of average benefits shows that the implied rate of return on the taxes paid is projected tobe low for many workers who will be retiring in the next several decades.1 If those taxes wereinstead invested in private accounts, the argument goes, the expected returns would be muchhigher.
Those types of “money’s worth” comparisons can be highly misleading, however.2 In anypay-as-you-go program, the first generation of retirees in the system always receives a very highrate of return, at the expense of later generations, who receive a correspondingly low rate ofreturn. That result stems from the fact that initial generations receive benefits far greater thanthe taxes they paid. Thus, the low rate of return for later generations is not an indication ofinefficiency in the system; it merely reflects a zero-sum transfer among generations. Changes tothe Social Security system can alter the distribution of returns among generations, but theycannot alter this fundamental arithmetic: raising the returns for current generations of workerscan be done only by lowering the returns for future generations.
Another way to understand this argument is to focus on the fact that taxes paid into SocialSecurity are not an investment. The implicit return is determined by the program’s rules fortaxes and benefits, not by the return on any real asset. (Investing the trust funds in stockswould not change that analysis; see Appendix A for details.) As noted above, the low rate ofreturn expected by some beneficiaries does not reflect inefficient investment or administration,just the rules for transfers. Because the apparent rate of return is the result of legislative action,it could easily be increased to a level that matched or even exceeded the average return onstocks. Doing that, however, would require transferring wealth from later generations.
Rate-of-return comparisons can be misleading for two other reasons. First, some of therevenues from the Social Security payroll tax are used to finance survivors’ and disabilityinsurance. Ignoring the value of that insurance can understate the benefits of the current SocialSecurity program. Second, some rate-of-return comparisons overlook differences in risk.Corporate stocks deliver a higher expected return than government bonds, but they also carryhigher risks. On a risk-adjusted basis, investing in government bonds would provide the samereturn as investing in corporate stocks. Of course, compared with private accounts, SocialSecurity benefits may involve greater political risk—that is, the risk that future policymakerswill decide to reduce benefits.
1. “Present value” converts a stream of future income or payments into an equivalent lump-sum amountreceived or paid today. Of course, some beneficiaries will receive higher returns than others as a resultof their individual circumstances, but an analysis of the net benefits by age group indicates that futureworkers are likely to receive much lower returns from Social Security than their parents and grandpar-ents did. See Dean Leimer, Cohort Specific Measures of Lifetime Net Social Security Transfers, ORSWorking Paper 59 (Social Security Administration, Office of Research and Statistics, February 1994).
2. See John Geanakoplos, Olivia Mitchell, and Stephen P. Zeldes, “Social Security Money’s Worth,” inOlivia Mitchell, Robert J. Myers, and Howard Young, eds., Prospects for Social Security Reform(Philadelphia: Pension Research Council and University of Pennsylvania Press, 1999).

CHAPTER FOUR STRATEGIES FOR PREPARING FOR AN AGING POPULATION 59
for federal workers) or would they have the freedom to choose from a wide range ofinvestments (as with individual retirement accounts, or IRAs)? At retirement, wouldpeople have to convert the assets in their private accounts into an annuity (a series ofregular payments that continues until the person and his or her spouse dies), and if so,under what conditions? How would the accounts affect people’s exposure to varioussources of risk? Would individuals be guaranteed a minimum benefit if the marketsperformed poorly, and if so, who would pay for the guarantee? How much wouldadministering a system of private accounts cost? How would the accounts be financedand integrated into the current Social Security program? And how would a system ofprivate accounts handle nonworking spouses, people with disabilities, low-incomeworkers, and people with intermittent work histories?
The Basic Structure of a Privatization Plan
Many proposals for private accounts would combine a cut in the Social Security bene-fits specified in current law with the establishment of mandatory private accounts thatwere owned and directed by individual workers. Such proposals—often referred to asprivatization—would give workers control over how their money was invested. Mostprivatization plans have five elements in common:
� They would provide income at retirement that would depend partly on thecontributions made into an account and the rate of return on the account’sassets during the person’s working life;
� They would reduce Social Security benefits from the amounts specifiedunder current law;
� They would require (or at least give a strong financial incentive for) work-ers to put a certain percentage of their earnings into individual investmentaccounts;
� They would generally allow workers to decide for themselves how to allo-cate their accounts among the qualified investments available; and
� They would prohibit withdrawals from those accounts until workers reacheda certain age.
The budgetary cost of setting up a system of private accounts would depend onthe details of the proposal, but the amount could be large. For example, creating a

60 SOCIAL SECURITY: A PRIMER September 2001
12. That estimated cost excludes any additional interest payments that the government would have to make if itfinanced the accounts by increasing federal debt.
13. Eric M. Engen and William G. Gale, The Effects of 401(k) Plans on Household Wealth: Differences AcrossEarnings Groups, Working Paper No. 8032 (Cambridge, Mass.: National Bureau of Economic Research, December2000).
system of accounts based on 2 percent of workers’ earnings could cost about $1 tril-lion over 10 years.12
The Effects on National Saving
Private accounts could increase national saving if they preserved some of the budgetsurpluses as private saving. The size of that increase is hard to estimate, however,because it would depend on the specific details of the proposal and on how the gov-ernment and the private sector responded. Moreover, raising national saving is notcostless: it requires people to reduce their current consumption (see Box 8).
In analyzing the impact of private accounts on government saving, the majorissue is the extent to which using surpluses for such accounts would preventpolicymakers from using them for some other purpose, such as additional governmentspending or tax cuts.
In analyzing the impact on saving in the private sector, the major issue is howthe accounts would influence people’s decisions about saving. Under many proposals,the government would offer a tax credit that gave people some or all of the funds theywould need to set up a private account. Because many low-income people have fewassets, an account would probably represent new savings for them. Indeed, past expe-rience with 401(k) plans suggests that low-income people increase their saving inresponse to tax incentives, although the size of that response is hard to gauge.13 Simi-lar responses might occur under a system of private accounts.
Experience also suggests that most high-income people respond to tax incen-tives by shifting their assets from other accounts into their 401(k) plan rather than byincreasing their total saving. However, that experience may not be directly applicableto some proposals for private accounts. Combining a tax credit with a cut in futureSocial Security benefits could limit the risk that people would reduce their other sav-ing dollar for dollar; those who did could have less income in retirement. With thatcombination, high-income people might increase their total personal saving, includingsaving in the accounts.
Despite those areas of uncertainty, using budget surpluses for private accountswould probably increase national saving more than using surpluses for additional

CHAPTER FOUR STRATEGIES FOR PREPARING FOR AN AGING POPULATION 61
14. Tax cuts or government spending may have other economic effects besides their impact on national saving. Forexample, cuts in marginal tax rates may increase the labor supply. In addition, some types of government spendingmay increase productivity.
Box 8.Who Would Bear the Transition Costs
of Privatizing Social Security?
Any proposal to privatize the Social Security program faces a challenge: who wouldpay for Social Security benefits during the transition from the current system to theprivatized one? In today’s program, taxes on current workers largely finance SocialSecurity payments to current beneficiaries; thus, the system’s funding relies on inter-generational transfers. Under a privatized system, however, intergenerational trans-fers would be replaced by workers’ financing their own retirement by building upassets in private accounts. Thus, a transition period would occur during which somegenerations of workers might have to make payments not only to their private ac-counts but also to current beneficiaries.
The added costs to those transitional generations would make them worse off andcause them to reduce their consumption of goods and services. However, that reduc-tion in their current consumption would have long-term benefits for the economy: itwould boost national saving, increase the nation’s capital stock, and raise the realwages of future generations of workers.
The government could spread the transition costs among many generations byissuing debt that was paid off over a period of time. Such an approach would reducethe burden on any single generation, but it would not increase the economy as fast aswould a policy that imposed high transition costs early on.
Using federal budget surpluses to fund the creation of private retirement accountscould produce long-term economic gains if it displaced other, less productive uses ofthose surpluses. In that case, current generations would bear a transitional cost in thesense that they would have to forgo tax cuts or additional spending on governmentservices.
government spending or tax cuts would. Most types of government spending consumeresources, and many types of tax cuts simply stimulate private consumption.14 Bycontrast, a substantial portion of the resources transferred to private accounts wouldprobably be saved, for the reasons discussed above.

62 SOCIAL SECURITY: A PRIMER September 2001
The Effects on the Labor Market
What effects private accounts would have on the labor market is uncertain. Both thecurrent Social Security system and a private-account system could distort people’sdecisions about work. Comparing the labor-market effects of the two systems wouldrequire examining the specifics of the proposal for private accounts. Without knowingthose specifics, no firm conclusions can be drawn.
On one hand, private accounts could reduce distortions in the labor market andencourage people to work more because those accounts would tighten the link be-tween workers’ contributions and their retirement benefits. On the other hand, aproposal for private accounts might include provisions (such as subsidies for contribu-tions by low-income workers or guarantees of minimum benefits) that could distortincentives to work.
If low-income workers received subsidies for their contributions, the subsidiesmight encourage some people to join the labor force. However, if those subsidieswere phased out as people’s income rose, they would also impose an implicit tax onwork for people whose income was in the phaseout range (because those people wouldreceive less subsidy for each additional dollar of income). The size of that implicit taxwould depend on the size of the subsidy and the rate at which it was phased out.Other labor-market distortions could arise from the fact that subsidies or guarantees ofminimum benefits would have to be paid for in some way. If they were fundedthrough increases in payroll or income tax rates, they could lessen people’s incentivesto work.
Administrative Costs
Any pension system costs something to administer. Staff must perform such tasks ascollecting funds, keeping records, managing assets, calculating and paying benefits,overseeing and enforcing rules, and (in some cases) marketing and selling the plans.
Some lessons can be learned by looking at the administrative costs of a range ofinstitutions that offer retirement savings accounts or that manage programs to provideincome in retirement. Those institutions include mutual funds, defined-contributionpension plans, Social Security, and private-account plans in other countries. Theexperience of those institutions suggests that the administrative costs of a system ofprivate accounts would depend greatly on the structure of the program. Under someproposals, administrative costs would be modest; but those costs could be high if an

CHAPTER FOUR STRATEGIES FOR PREPARING FOR AN AGING POPULATION 63
15. For more information, see John B. Shoven, ed., Administrative Aspects of Investment-Based Social Security Reform(Chicago: University of Chicago Press, 2000).
account system provided many services to investors and gave them a wide choice ofinvestments.15
Of course, administrative costs may pay for services that people value. Somepeople may want to choose whether to participate in the program, how much to con-tribute, the mix of assets in their portfolio, and the frequency with which they adjusttheir portfolio. When they are at or near retirement, they may want choices aboutwhether and when to convert their assets into an annuity and the kinds of annuities tobuy. Restricting the freedom to make financial choices reduces administrative costs,but it may also reduce the value that people place on their accounts.
Another issue for policymakers to consider is how administrative costs would beallocated among participants. Two concerns arise. First, if people do not face themarginal costs of their transactions, they may take actions—such as churning (short-term buying and selling) of assets in their portfolios—that raise administrative costs.Second, if some of the fixed administrative costs are not spread among accounts, theycould absorb much of the income of people who have small accounts (because of lowincomes or intermittent work histories).
Risks and Guarantees
All public and private pension systems carry risks. How those risks are distributedcan have significant effects on economic well-being. This section compares two typesof public pension systems—a defined-contribution plan and a defined-benefit plan—toshow how risk might be allocated in a private-account system. Those two publicsystems have counterparts in the private sector. Participation in private defined-con-tribution plans was about half the level of participation in private defined-benefit plansin the late 1970s, but the opposite is true today (see Figure 15).
A public defined-contribution plan resembles a 401(k) plan in that a definedamount of a worker’s salary is contributed to an account and invested in assets such asstocks and bonds. At retirement, the worker’s income depends on the size of thecontributions and the rate of return on the assets. In such a system, each individualbears the risk of certain unexpected changes, such as an increase in life spans (whichcreates the need for more money in retirement), a drop in wages, or a decline in thestock market.
With a public defined-contribution system, variations in the value of stocks cancreate large differences in the retirement income of workers who retire in differentyears. The riskiness of stock investments can be dramatically reduced by requiring

64 SOCIAL SECURITY: A PRIMER September 2001
16. Gary Burtless, Social Security Privatization and Financial Market Risk, Working Paper No. 10 (Washington, D.C.:Center on Social and Economic Dynamics, February 2000). The replacement rate for similar workers retiring atage 62 in 2000 would have been more than 100 percent of their peak wage.
Millions
1977 1979 1981 1983 1985 1987 1989 1991 1993 1995 19970
10
20
30
40
50
60
70
80
Total
Defined-Contribution Plans
Defined-Benefit Plans
Figure 15.Number of Active Participants in Private Pension Plans, 1977-1997
SOURCE: Department of Labor, Pension and Welfare Benefits Administration, “Abstract of 1997 Form5500 Annual Reports,” Private Pension Plan Bulletin, no. 10 (Winter 2001), available atwww.dol.gov/dol/pwba/public/programs/opr/bullet97/cover.htm.
that workers invest in a stock market index (such as the S&P 500) composed of manycompanies. Even so, the risks cannot be eliminated. For example, workers withaverage wages who invested 6 percent of those wages in the S&P 500 index over 40years and then bought an annuity at retirement would have replaced almost 100 per-cent of their peak wage if they had retired at age 62 in 1969 (see Figure 16). But ifthey had retired just six years later (in 1975)—shortly after the oil price shocks of1973 and the recession of 1974-1975, which knocked down the stock market—theywould have replaced just 42 percent of their peak wage.16 Those two years present anextreme example, but they show some of the potential for large year-to-year fluctua-tions in the income of retired workers who retire at different times. Such an analysisalso shows that those fluctuations could be reduced by requiring people to hold portfo-lios of both stocks and bonds.
In a public defined-benefit plan (such as Social Security), by contrast, workers’income in retirement depends on their history of wages and a formula that relatesthose wages to benefits. The formula can be set up to redistribute income from people

CHAPTER FOUR STRATEGIES FOR PREPARING FOR AN AGING POPULATION 65
Replacement Rate (Percent)
1910 1920 1930 1940 1950 1960 1970 1980 1990 20000
20
40
60
80
100
120
100% Stocks
50% Stocks/50% Bonds
100% Bonds
Year of Retirement
Figure 16.How the Year of Retirement Affects Income-Replacement Rates in a System of Private Accounts Invested in Stocks or Bonds
SOURCE: Gary Burtless, Social Security Privatization and Financial Market Risk, Working Paper No. 10(Washington, D.C.: Center on Social and Economic Dynamics, February 2000).
NOTES: The estimates are based on average male workers who are assumed to work for 40 years andsave 6 percent of their earnings. Dividends and interest are reinvested. On their 62nd birthday,workers retire and convert their accumulations into a single-life annuity.
“Replacement rate” is the workers’ initial annuity divided by their average real annual earningswhen they were 54 to 58 years old.
who had high wages to those who had low wages, providing a type of insurance forlow-income people.
Many of the risks that individuals face in a public defined-contribution systemdo not disappear in a defined-benefit system. For example, if people live longer thanexpected, public defined-benefit programs may become financially strained, creatingthe political risk that policymakers will change the benefit formulas or tax rates. Ifaverage wages grow more slowly, average benefits at retirement will be lower (al-though a progressive defined-benefit formula will help reduce some of the variation in

66 SOCIAL SECURITY: A PRIMER September 2001
17. Peter Diamond, “The Economics of Social Security Reform,” in R. Douglas Arnold, Michael J. Graetz, and AliciaH. Munnell, eds., Framing the Social Security Debate: Values, Politics, and Economics (Washington, D.C.:National Academy of Social Insurance, 1998).
wages among individual workers). In such a program, however, risks can be shifted todifferent people and across time, thus providing a form of social insurance.17
The risks of any private-account proposal depend on the proposal’s specificprovisions. Many proposals are not for pure defined-contribution plans; instead, theycontain provisions that could pool risks among generations under certain conditions.For example, many private-account proposals guarantee a minimum level of retire-ment income; some may also tax earnings on withdrawals from the accounts. If thestock market does poorly, a minimum-benefit guarantee can shift the risks onto futuregenerations. In principle, the government can transform any defined-contributionsystem into a defined-benefit system by using a set of guarantees and taxes to poolrisks among generations.
Guarantees can create other problems, however. By insuring people againstlosses in their investment portfolio, the government could unintentionally encourageinvestors to put money into risky assets. If such gambles were successful, investorswould pocket handsome returns; but if they failed, the losses would be covered by thegovernment. That type of “moral hazard” is a problem inherent in many insurancecontracts. It can be reduced by restricting people’s choice of assets, but it cannot beeliminated.
Annuities
Most of the public discussion of private accounts has focused on questions aboutcontributions, rates of return, and the accumulation of assets in the accounts. Muchless attention has been paid to how people would draw down their accumulated fundsin old age, but that issue is equally important.
Today, most retirees receive a life annuity from Social Security that is indexedto inflation. If the retiree is married or has dependent children, Social Security alsopays benefits to his or her survivors. In addition, many people receive annuity pay-ments from private pensions.
Annuities like Social Security provide insurance against the risk of longevity—that is, the risk of outliving one’s resources. A life annuity protects against longevityrisk by providing a stream of payments for as long as the annuitant (or his or herspouse if the contract provides survivor benefits) is alive. The insurer (an insurancecompany or the government) absorbs the uncertainty about longevity and pools thatuncertainty among many annuitants. Since some annuitants live longer than expected

CHAPTER FOUR STRATEGIES FOR PREPARING FOR AN AGING POPULATION 67
18. Congressional Budget Office, Social Security Privatization and the Annuities Market, CBO Paper (February 1998).
and others die earlier than expected, the insurer can protect each individual againstlife-span uncertainty but itself be subject only to uncertainty about the average lifespan of the population.
Without access to annuities, people must divide their resources according totheir expectations about how long they will live after retirement. They may findthemselves without enough money if their actual life span exceeds what they hadexpected. For example, someone who retires at age 65 with assets of $100,000 andwho expects to live 10 more years may choose to spend those savings in 10 equalinstallments. But if the retiree lives to age 76, he or she could end up without anyassets.
One key issue for any system of private accounts is how people would be pro-tected from outliving their resources. Would the system rely on private markets toprovide annuities or would the government carry out that task? If the former, wouldpeople be able to buy annuities at fair prices and would private markets offer the samelevel of protection against longevity risk during retirement that Social Security doesnow?
Although private insurance companies currently sell life annuities to retirees,the market is very small. The reasons include competition from Social Security(which provides a similar product), people’s desire to leave assets to heirs, and prob-lems in the market that raise prices. An analysis by CBO concluded that private annu-ities are 15 percent to 25 percent more expensive than average mortality rates wouldsuggest.18 That higher price reflects a combination of overhead costs and the fact thatpeople who expect to have longer-than-average life spans are more likely than otherpeople to purchase annuities (a phenomenon known as adverse selection).
If a system of private accounts was created and private insurance companiessupplied the annuities, the prices of those annuities would probably fall. The systemwould put more people into the annuities market, which could lower both overheadcosts and the share of annuitants with longer-than-average life expectancy. Further-more, a growing market for annuities could increase the variety of annuity productsand better adjust those products to meet consumers’ demand.
Nonetheless, some factors could hinder the functioning of the private annuitiesmarket: adverse selection, high marketing costs, shortsighted behavior by consumers,and the existence of a social safety net. Government oversight of the annuities marketand private retirement accounts could address some of those problems and reduce thecost of annuities to society. But policymakers would face a trade-off between balanc-ing the gains from reducing overall costs and the losses from restricting individualchoice.

68 SOCIAL SECURITY: A PRIMER September 2001
19. Some countries have addressed that problem by requiring only that people annuitize enough of their accounts toprovide a minimum level of income in retirement. The rest of an account could be used for any other purpose,including being passed to children as a bequest. In Chile, for example, people are not allowed to withdraw fundsfrom their account unless they have an annuity that provides income of more than 70 percent of their taxableearnings over the past 10 years and at least 120 percent of the minimum pension. See Congressional BudgetOffice, Social Security Privatization and the Annuities Market, p. 31.
The government could sharply limit adverse selection in the annuities market byrequiring everyone with a private account to convert that account into an annuity atretirement. Such a requirement would increase the pool of people participating in themarket and reduce the costs of adverse selection. However, it would also reduce peo-ple’s choices and might not allow many retirees to pass the assets in their account totheir children. (Life annuities end at the death of the owner, unless a joint annuity hasbeen purchased, in which case it ends at the death of the spouse.)19
In requiring account holders to buy annuities, policymakers would also have toconfront some difficult questions. Would insurers be forbidden to separate annuitantsinto risk classes on the basis of sex, marital status, income, health, and forebears’longevity? Prohibiting the separation of annuitants into risk classes results in a redis-tribution of resources among different people. If a low-income retiree with shorter lifeexpectancy pays the same price for an annuity as a high-income person with above-average life expectancy, wealth will be redistributed from the low-income person tothe high-income one. If unisex annuities are required, resources will be implicitlyredistributed from men to women (since women live longer, on average, than men).Both types of redistribution could have substantial effects on the welfare of certaingroups. Those redistributions also occur in the current Social Security system, butthey are masked by the complexity of the system.
Other Considerations
Creating a system of private accounts would require policymakers to address severalother practical issues. First, how would the system handle benefits for nonworkingspouses, people with intermittent work histories, workers with low income, and peoplewith disabilities? The current Social Security system provides benefits for thosepeople. Would it continue to do so? If so, how would the provision of such benefitsbe integrated into the system of private accounts?
Second, the success of private accounts will depend partly on people’s knowl-edge about financial markets and the quality of their financial decisions. That is animportant issue because in 1998 (the most recent year for which data are available)roughly half of all U.S. families did not own stock either directly or indirectly(through mutual funds, retirement accounts, and other managed assets). Moreover,large percentages of U.S. families in their prime saving years did not own stock in1998: 41 percent of families headed by someone ages 45 to 54, and 44 percent of

CHAPTER FOUR STRATEGIES FOR PREPARING FOR AN AGING POPULATION 69
20. Many of those families do not own stock because they have low income and do not save; however, stocks alsoaccount for a disproportionately small fraction of the portfolios of low-income people who have assets.
21. Andrew Samwick and Jonathan Skinner, “Abandoning the Nest Egg? 401(k) Plans and Inadequate PensionSaving,” in Sylvester Schieber and John Shoven, eds., Public Policy Toward Pensions (Cambridge, Mass.: MITPress, 1997).
22. General Accounting Office, Pension Plans: Survivor Benefit Coverage for Wives Increased After 1984 PensionLaw, GAO/HRD-92-49 (February 1992).
23. For more details, see Congressional Budget Office, Social Security Privatization: Experiences Abroad, CBO Paper(January 1999).
families headed by someone ages 55 to 64 (see Table 3).20 Of course, that may not bea permanent state of affairs: stock holdings could become more widespread over timeand people more knowledgeable about financial markets.
In addition, some people may have trouble making wise financial decisions.Evidence suggests that some people spend their retirement accounts early when theyhave the freedom to do so. For example, in 1990, nearly $50 billion in pension assetswere distributed to people before they reached age 59½, and roughly half of thosedistributions were spent rather than rolled over into another qualified account.21 Inaddition, some married workers might not pick annuities that provide coverage fortheir spouse without government regulations. The General Accounting Office foundthat the share of retired married men selecting joint and survivor annuities (whichprovide coverage for their spouse) increased by 15 percentage points after passage ofthe Retirement Equity Act of 1984, which required workers to get written approvalfrom their spouse before choosing an annuity that did not provide such coverage.22
Third, policymakers would have to set up a regulatory structure to oversee anysystem of private accounts. Regulations could be aimed at protecting investors fromfraud and incompetence, ensuring that investment funds had enough capital, andpreventing people from investing in overly risky assets during their working life orfrom spending down their assets too fast in retirement and then relying on publicassistance programs if they ran out of resources. Dealing with that last issue mightrequire having retirees annuitize part of their wealth so they would not outlive theirresources.
The experience of private retirement accounts in the United Kingdom illustratessome of the potential risks of inadequate oversight and regulation. The U.K. instituteda reform that allowed workers to switch funds from their occupation-based pensionplans to personal accounts. In the so-called misselling scandal, representatives offinancial firms used high-pressure sales tactics to persuade some people to switchfrom favorable occupational pensions to personal pensions that provided lower re-turns.23

70 SOCIAL SECURITY: A PRIMER September 2001
Table 3.Families’ Direct and Indirect Holdings of Stock, by Type of Family
1989 1992 1995 1998
Percentage of Families with Direct or Indirect Holdings of Stock
All Families 31.6 36.7 40.4 48.8
Families by Income (In 1998 dollars)Less than 10,000 * 6.8 5.4 7.710,000 to 24,999 12.7 17.8 22.2 24.725,000 to 49,999 31.5 40.2 45.4 52.750,000 to 99,999 51.5 62.5 65.4 74.3100,000 or more 81.8 78.3 81.6 91.0
Families by Age of Family HeadLess than 35 22.4 28.3 36.6 40.735 to 44 38.9 42.4 46.4 56.545 to 54 41.8 46.4 48.9 58.655 to 64 36.2 45.3 40.0 55.965 to 74 26.7 30.2 34.4 42.675 or more 25.9 25.7 27.9 29.4
Median Value of Stock Holdings Among Families with Stock(In thousands of 1998 dollars)
All Families 10.8 12.0 15.4 25.0
Families by Income (In 1998 dollars)Less than 10,000 * 6.2 3.2 4.010,000 to 24,999 6.4 4.6 6.4 9.025,000 to 49,999 6.0 7.2 8.5 11.550,000 to 99,999 10.2 15.4 23.6 35.7100,000 or more 53.5 71.9 85.5 150.0
Families by Age of Family HeadLess than 35 3.8 4.0 5.4 7.035 to 44 6.6 8.6 10.6 20.045 to 54 16.7 17.1 27.6 38.055 to 64 23.4 28.5 32.9 47.065 to 74 25.8 18.3 36.1 56.075 or more 31.8 28.5 21.2 60.0
(Continued)

CHAPTER FOUR STRATEGIES FOR PREPARING FOR AN AGING POPULATION 71
Table 3.Continued
1989 1992 1995 1998
Stock Holdings as a Percentage of Families’ Financial Assets
All Families 27.8 33.7 40.0 53.9
Families by Income (In 1998 dollars)Less than 10,000 * 15.9 12.9 24.810,000 to 24,999 11.7 15.3 26.7 27.525,000 to 49,999 16.9 23.7 30.3 39.150,000 to 99,999 23.2 33.5 39.9 48.8100,000 or more 35.3 40.2 46.4 63.0
Families by Age of Family HeadLess than 35 20.2 24.8 27.2 44.835 to 44 29.2 31.0 39.5 54.745 to 54 33.5 40.6 42.9 55.755 to 64 27.6 37.3 44.4 58.365 to 74 26.0 31.6 35.8 51.375 or more 25.0 25.4 39.8 48.7
SOURCE: Congressional Budget Office based on Arthur B. Kennickell, Martha Starr-McCluer, and BrianJ. Surette, “Recent Changes in U.S. Family Finances: Results from the 1998 Survey of Con-sumer Finances,” Federal Reserve Bulletin, vol. 86, no. 1 (January 2000).
NOTES: Indirect holdings of stock are those held in mutual funds, retirement accounts, and other man-aged assets.
* = 10 or fewer families surveyed.
Changing the Rules of the Current Social Security System
Policymakers have discussed a third approach for addressing the budgetary challengesof an aging population: phasing in cuts in future Social Security benefits so as to slowthe growth of the program’s spending. In addition, some people have proposed in-creasing the rate of the Social Security payroll tax. Cutting benefits and raising taxesrepresent different choices about how to divide economic resources between workersand retirees and between current and future generations. Although tax increases couldimprove the solvency of the Social Security trust funds and the balance of the federalbudget, they might not address the broader economic challenges created by an agingpopulation.

72 SOCIAL SECURITY: A PRIMER September 2001
24. See Congressional Budget Office, Long-Term Budgetary Pressures and Policy Options (May 1998), Chapter 3.
25. Laurence Kotlikoff, Kent Smetters, and Jan Walliser, “Privatizing Social Security in the U.S.—Comparing theOptions,” Review of Economic Dynamics, vol. 2, no. 3 (July 1999).
26. Jonathan Gruber and David Wise, eds., Social Security and Retirement Around the World (Chicago: Universityof Chicago Press, 1999).
Reducing Benefits
Slowing the growth of Social Security spending by reducing benefits to future retireescould be one way to lessen future pressures on the federal budget and expand theeconomy in the long run.24 Indeed, economic models suggest that many types ofbenefit cuts could increase GDP in the long run, although those long-term gains couldtake a couple of decades to appear fully.25 How benefit cuts would affect the economyin the near term is uncertain.
Reducing benefits would probably increase national saving, although the size ofthe effect—and its path over time—is very uncertain. The results would depend onhow much workers anticipated and responded to the cuts in benefits. Workers whowere forward looking would probably reduce their current consumption and increasetheir saving in anticipation of receiving smaller benefits. However, some peoplemight not be so forward looking. They would also have to lower their consumption,but that would probably occur in retirement when they received smaller benefitchecks.
The effect on the labor supply of cutting future benefits would depend on theprecise nature of the cuts. Some reductions in benefits might encourage people towork more. For example, raising the age for early retirement could cause some work-ers to delay their retirement. The size of that impact is uncertain, but an analysis ofretirement behavior around the world suggests that there is a strong link between theearliest age at which workers can claim public pension benefits and the age at whichthey retire.26 In the United States, the number of men retiring at age 62 rose signifi-cantly after policymakers added a provision to Social Security in 1961 that allowedearly retirement at that age (see Figure 17). Benefit cuts might also encourage workby reducing expected lifetime income, causing people to work more to make up someof the difference. Conversely, benefit cuts could discourage work by reducing theamount by which expected future benefits rise with each additional hour of work.
Slowing the growth of Social Security spending by cutting benefits would prob-ably reduce the lifetime resources of some transitional generations. Later generations,however, would most likely have higher real wages and pay lower taxes, for tworeasons: the additional national saving that would result from lower spending wouldboost the capital stock and raise their wages, and the cuts in benefits would lessen thechance that taxes would be raised in the future.
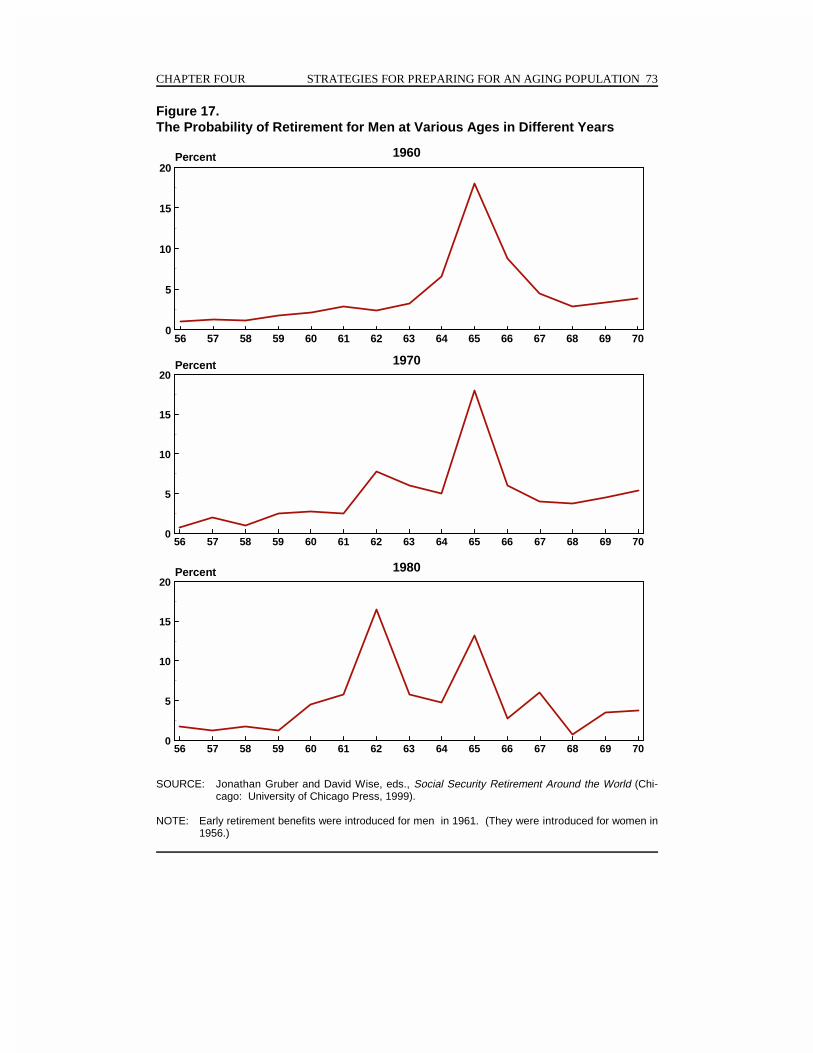
CHAPTER FOUR STRATEGIES FOR PREPARING FOR AN AGING POPULATION 73
56 57 58 59 60 61 62 63 64 65 66 67 68 69 700
5
10
15
20Percent 1960
56 57 58 59 60 61 62 63 64 65 66 67 68 69 700
5
10
15
20Percent 1970
56 57 58 59 60 61 62 63 64 65 66 67 68 69 700
5
10
15
20Percent 1980
Figure 17.The Probability of Retirement for Men at Various Ages in Different Years
SOURCE: Jonathan Gruber and David Wise, eds., Social Security Retirement Around the World (Chi-cago: University of Chicago Press, 1999).
NOTE: Early retirement benefits were introduced for men in 1961. (They were introduced for women in1956.)

74 SOCIAL SECURITY: A PRIMER September 2001
Because Social Security benefits are a major source of income for many people,it would be important to announce any benefit cuts well in advance so people wouldhave enough time to respond by adjusting their plans for saving and retirement. More-over, if the changes were made in a way that preserved the benefits of low-incomepeople, then larger cuts would be necessary in the benefits received by other retiredworkers.
Some of the major issues involved in reducing benefits can be seen by lookingat three options: speeding up the increase in the retirement age, lengthening the num-ber of years of employment for which Social Security benefits are calculated, andreducing annual cost-of-living adjustments.
Accelerate the Increase in the Retirement Age. Under current law, workers bornbefore 1938 become eligible for full Social Security retirement benefits at age 65.That normal retirement age increases in two-month increments for people born there-after, reaching 66 for workers born in 1943. It remains at 66 for workers born be-tween 1944 and 1954 and then begins to rise again in two-month steps, reaching 67 forpeople born in 1960 or later. Workers will still be able to start collecting reducedbenefits at age 62. But as the NRA increases and moves further away from age 62, thesize of that reduction will grow.
Members of Congress and others have recommended speeding up the change toa normal retirement age of 67. One option would steadily increase the NRA by twomonths per year until it reached 67 for workers born in 1949. Under that option, thefirst people to face a normal retirement age of 67 would become eligible for reducedbenefits (at age 62) in 2011, which is 11 years sooner than under current law.
The savings from that change would begin as workers in the first affected agegroup (people born in 1944) reached age 62 in 2006. Each year after that, the savingswould grow as more beneficiaries were affected, with each successive group incurringlarger reductions in benefits. Workers in the first group who began collecting benefitsat 62 would receive about 1 percent less than they would under current law. Workerswho turned 62 in 2011 would receive about 7 percent less than they would undercurrent law. Some Social Security beneficiaries with low income would qualify forfederal means-tested programs, such as Supplemental Security Income and FoodStamps, so part of the savings in Social Security benefits might be offset by greaterspending for other programs.
Proponents of raising the normal retirement age point out that, on average,people are healthier and live longer today than was the case in the early days of SocialSecurity, and thus they may be able to work for a longer part of their lives. Opponentsargue that raising the normal retirement age is nothing more than another way to cutfuture monthly Social Security benefits.

CHAPTER FOUR STRATEGIES FOR PREPARING FOR AN AGING POPULATION 75
27. Advisory Commission to Study the Consumer Price Index, Toward a More Accurate Measure of the Cost ofLiving, final report submitted to the Senate Finance Committee (December 4, 1996).
Lengthen the Computation Period for Benefits. Social Security retirement benefitsare based on the average indexed monthly earnings of workers in jobs covered by thesystem. The current formula computes those earnings on the basis of a worker’s 35highest-earning years of employment. Lengthening that averaging period would gen-erally lower benefits slightly by requiring more years of lower earnings to be factoredinto the benefit computation.
One argument for lengthening the computation period is that it would encouragepeople, who are now living longer, to stay in the labor force longer as well. It wouldalso reduce the advantage that workers who postpone entering the labor force some-times have over people who get jobs at a younger age. Because the AIME calculationis based on 35 years of employment and thus can ignore many years of low or noearnings, people who enter the labor force later suffer little or no loss of benefits fortheir additional years spent not working and not paying Social Security taxes.
Opponents argue that this option would hurt beneficiaries who retire early be-cause of poor health or unemployment—the people who would be least able to con-tinue working. It would also disproportionately affect people who spent significanttime outside the Social Security system—such as parents (usually women) who inter-rupted their career to raise children—and workers who were unemployed for longperiods.
Reduce Cost-of-Living Adjustments. Each year, the Social Security Administrationmust adjust recipients’ monthly Social Security benefits for inflation. To do so, itraises benefit payments by the percentage increase in the consumer price index. Somepolicymakers suggest that the law be changed so that the yearly COLA equals theincrease in the CPI minus a specified amount, such as 0.5 percentage points.
Many economists believe that the CPI may overstate increases in the cost ofliving, but they disagree about the size of the overstatement. There are conceptualproblems with devising a “true” cost-of-living index, as well as difficulties collectingand compiling data for such an index. For those reasons, economists have had troublereaching a strong consensus on this issue. In 1996, the Advisory Commission to Studythe Consumer Price Index (known as the Boskin Commission) concluded that the CPIprobably overstates the change in the cost of living by between 0.8 and 1.6 percentagepoints a year.27 Since the commission’s report was issued, the Bureau of Labor Statis-tics has made several changes to the way it calculates the CPI and eliminated some ofthe problems with the index. But some thorny issues remain, including how to mea-sure the cost of living for Social Security beneficiaries.

76 SOCIAL SECURITY: A PRIMER September 2001
28. Social Security Administration, The 2001 Annual Report of the Board of Trustees of the Federal Old-Age andSurvivors Insurance and Disability Insurance Trust Funds (March 19, 2001).
29. Another option for raising revenues would be to increase the maximum level of earnings subject to the payroll tax.
To the extent that the CPI still overstates increases in the cost of living for thosebeneficiaries, policymakers could reduce COLAs by a corresponding amount withoutmaking Social Security recipients’ real benefits lower than they were when the recipi-ents became eligible for the program. Moreover, reducing cost-of-living adjustmentsby a relatively small amount could save a great deal of money.
The impact of even a small cut in COLAs, however, would be significant forfuture older beneficiaries, whose benefits would reflect the cumulative effects of aseries of smaller COLAs. In the long run, the people whose benefits would be mostaffected would be the oldest recipients and those who first became eligible for SocialSecurity at an early age on the basis of disability.
The Effects of Raising Payroll Taxes
Another option—which would address the narrow issue that promised Social Securitybenefits are expected to exceed the revenues dedicated to the program—would be toraise payroll taxes. Because what really matters is the overall budget balance, any taxcould be increased to finance future Social Security spending. However, to limit thescope of the analysis, this report focuses on the Social Security payroll tax.
The Social Security trustees project that the gap between the program’s incomeand costs in 2050 will be about 4.6 percent of the nation’s taxable payroll.28 Thus,increasing the combined payroll tax on workers and their employers from 12.4 percentto 17.0 percent at that time would be one way of dealing with the shortfall.29
The payroll tax rate has been raised several times since the Social Securitysystem was created in the 1930s (see Figure 18). The total rate (including the sharespaid by employers and employees) was only 2 percent when the program began, but itincreased in a series of steps over the years to the current rate of 12.4 percent. Thewage base to which the tax rate applies also rose during that period. In 1951, thepayroll tax was assessed on workers’ earnings up to $3,600, which was 148 percent ofthe average wage at that time (see Table 4). By 1999, the payroll tax applied to earn-ings up to $72,600, or 251 percent of the average annual wage. This year, the maxi-mum level of earnings for the tax is $80,400.
Although employers nominally pay half of the payroll tax, the burden of the taxlargely falls on workers. Both economic theory and empirical studies suggest thatmost of the tax is shifted to workers in the form of lower wages and less generous

CHAPTER FOUR STRATEGIES FOR PREPARING FOR AN AGING POPULATION 77
30. For new evidence and review of the literature, see Jonathan Gruber, “The Incidence of Payroll Taxation: Evidencefrom Chile,” Journal of Labor Economics, vol. 15, no. 3, part 2 (July 1997), pp. S72-S101.
31. That would be true for anyone facing a total marginal tax rate on labor compensation of almost 50 percent (suchas a federal income tax rate of 28 percent and a state income tax rate of 5 percent, in addition to the 12.4 percentpayroll tax for Social Security and the 2.9 percent tax for Medicare).
32. This year, the earned income tax credit (EITC) phases out at a 21 percent rate for workers with two or morechildren and earnings between $13,090 and $32,121. For each additional dollar they earn, workers in that incomerange lose 21 cents of EITC benefits. Thus, the phaseout imposes a marginal tax of 21 percent on those workers.
Percent
1935 1940 1945 1950 1955 1960 1965 1970 1975 1980 1985 1990 1995 20000
2
4
6
8
10
12
14
Figure 18.The Payroll Tax Rate for Social Security, 1937-2000
SOURCE: Social Security Administration.
NOTE: The payroll tax rate includes both employee and employer payments.
fringe benefits.30 Workers would also bear most of the burden of any increase in thetax rate.
Raising the payroll tax rate would reduce the marginal return from working (thatis, the return from an additional hour worked). For many workers, raising the payrolltax rate by, say, 5 percentage points could reduce their marginal after-tax compensa-tion by almost 10 percent (compared with what that compensation would be other-wise).31 Those workers could include people in families in the 28 percent income taxbracket and some low-income workers who already face high implicit marginal taxrates because the earned income tax credit phases out as they earn more.32
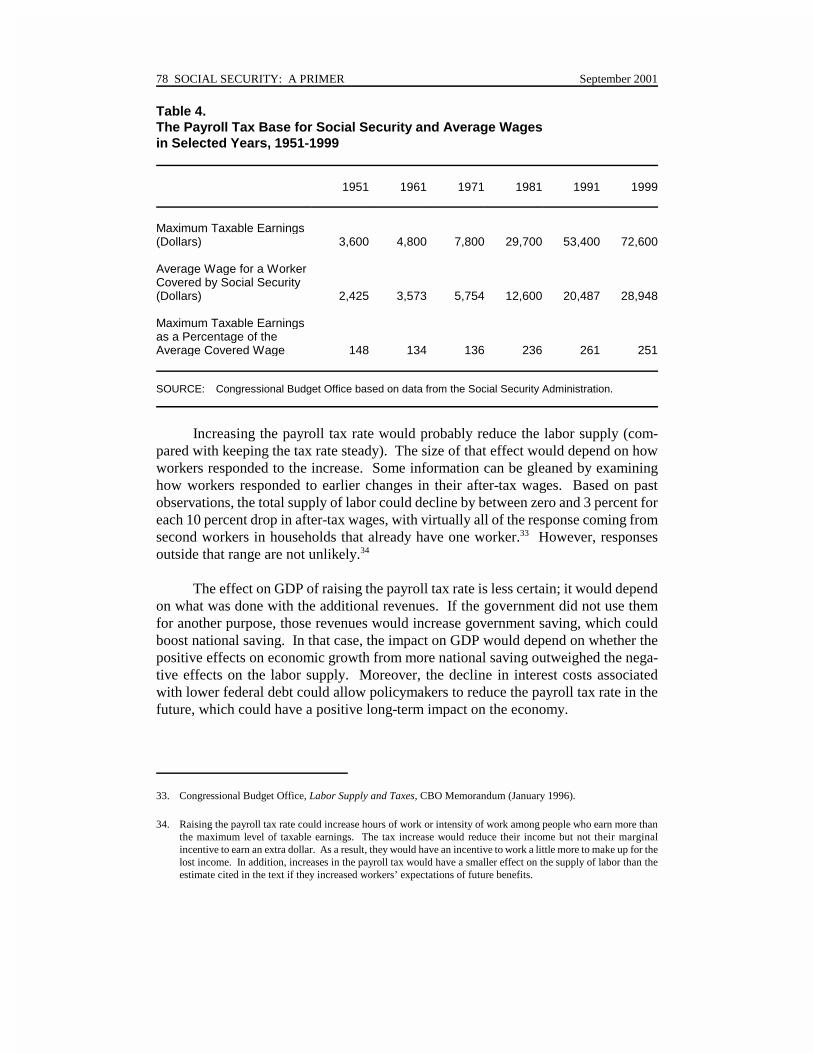
78 SOCIAL SECURITY: A PRIMER September 2001
33. Congressional Budget Office, Labor Supply and Taxes, CBO Memorandum (January 1996).
34. Raising the payroll tax rate could increase hours of work or intensity of work among people who earn more thanthe maximum level of taxable earnings. The tax increase would reduce their income but not their marginalincentive to earn an extra dollar. As a result, they would have an incentive to work a little more to make up for thelost income. In addition, increases in the payroll tax would have a smaller effect on the supply of labor than theestimate cited in the text if they increased workers’ expectations of future benefits.
Table 4.The Payroll Tax Base for Social Security and Average Wages in Selected Years, 1951-1999
1951 1961 1971 1981 1991 1999
Maximum Taxable Earnings(Dollars) 3,600 4,800 7,800 29,700 53,400 72,600
Average Wage for a WorkerCovered by Social Security(Dollars) 2,425 3,573 5,754 12,600 20,487 28,948
Maximum Taxable Earningsas a Percentage of theAverage Covered Wage 148 134 136 236 261 251
SOURCE: Congressional Budget Office based on data from the Social Security Administration.
Increasing the payroll tax rate would probably reduce the labor supply (com-pared with keeping the tax rate steady). The size of that effect would depend on howworkers responded to the increase. Some information can be gleaned by examininghow workers responded to earlier changes in their after-tax wages. Based on pastobservations, the total supply of labor could decline by between zero and 3 percent foreach 10 percent drop in after-tax wages, with virtually all of the response coming fromsecond workers in households that already have one worker.33 However, responsesoutside that range are not unlikely.34
The effect on GDP of raising the payroll tax rate is less certain; it would dependon what was done with the additional revenues. If the government did not use themfor another purpose, those revenues would increase government saving, which couldboost national saving. In that case, the impact on GDP would depend on whether thepositive effects on economic growth from more national saving outweighed the nega-tive effects on the labor supply. Moreover, the decline in interest costs associatedwith lower federal debt could allow policymakers to reduce the payroll tax rate in thefuture, which could have a positive long-term impact on the economy.

CHAPTER FOUR STRATEGIES FOR PREPARING FOR AN AGING POPULATION 79
By contrast, if the extra payroll tax revenues were used to finance more govern-ment consumption spending, national saving would not rise. Further, because thelabor supply would probably fall, the policy would most likely reduce GDP. In thatcase, the tax increase could make it more difficult for the nation to prepare for anaging population.


Appendixes


1. Kent Smetters, Investing the Social Security Trust Fund in Equities: An Option Pricing Approach, TechnicalPaper 1997-1 (August 1997), available from CBO’s Macroeconomic Analysis Division or at www.cbo.gov/tech.html.
Appendix A
The Economic Effects ofHaving the Government Issue Debt
to Finance Investmentsin the Stock Market
Some proposals for Social Security reform envision having the government issuedebt and invest the proceeds in corporate stocks. Such a policy raises concernsabout possible government interference in corporate decisionmaking (discussed
in Chapter 4). It also raises questions about how such investments would affect theoverall economy. Those economic effects are uncertain, however, because they wouldultimately depend on how future Congresses allocated the risks and the returns ofstock investments among various people.
Such a policy would essentially represent a swap of assets between the publicand private sectors. The government would buy shares of stock from private investorsand issue Treasury bonds of the same value. Other things being equal, such an ex-change cannot create wealth for the government: the value of the stocks in the govern-ment’s portfolio would exactly match the value of the bonds that it sold to the public.
The investment policy would affect the economy only to the extent that it redis-tributed income. That redistribution could either increase or decrease saving depend-ing on how the government reallocated the income from the investments. If, for exam-ple, current generations received higher benefits when the stock market did well butdid not receive lower benefits when the market soured, government investments instocks would redistribute income toward current generations. That would encouragecurrent consumption, reducing national saving and future gross domestic product.1
Current generations would be better off because of such a policy, but future genera-tions would be worse off.

84 SOCIAL SECURITY: A PRIMER September 2001
2. People may not own stocks for a variety of reasons, including transaction costs (the explicit charges associated withbuying or selling stocks as well as the implicit costs of acquiring information about the stock market).
3. Peter Diamond and John Geanakoplos, Social Security Investment in Equities I: Linear Case, Working Paper No.7103 (Cambridge, Mass.: National Bureau of Economic Research, April 1999).
4. Andrew B. Abel, “The Effects of Investing Social Security Funds in the Stock Market When Fixed Costs PreventSome Households from Holding Stocks,” American Economic Review, vol. 91, no. 1 (March 2001), pp. 128-148.
The government could also redistribute investment income to people who do notown stocks now.2 However, the economic impacts of such a policy are uncertain. Onone hand, that redistribution could raise interest rates, which might cause some peopleto save more.3 On the other hand, it would increase the income of people who savebut do not own stocks, which could cause some of those people to save less. Thelatter effect could be significant: by one estimate, it could cause the private stock ofcapital to decline by 50 cents for each dollar invested by the Social Security trustfunds.4
Some people argue that because the government could pool the risks of stockinvestments broadly over time and among people, it could bear such risks at less costthan individuals can. However, that argument ignores the fact that people alreadyimplicitly share the risks and rewards of stock market investments through the incometax system. Indeed, some of the recent improvement in the federal budget can betraced to the rise in the stock market and the resulting revenues from capital gainsrealizations. Explicit stock investments might produce no additional benefit. More-over, to pool risks, the government would have to distribute stock losses as well asgains to people who do not hold stocks now. There are doubts that the governmentwould really do that, especially since many of those people have low income.
In addition to the effects on saving and risk sharing, government investments inthe stock market could raise interest rates on government debt and reduce returns onstocks. Those possibilities stem from the fact that to induce private investors to buyadditional government bonds instead of stocks, interest rates on bonds would have torise relative to those on stocks.
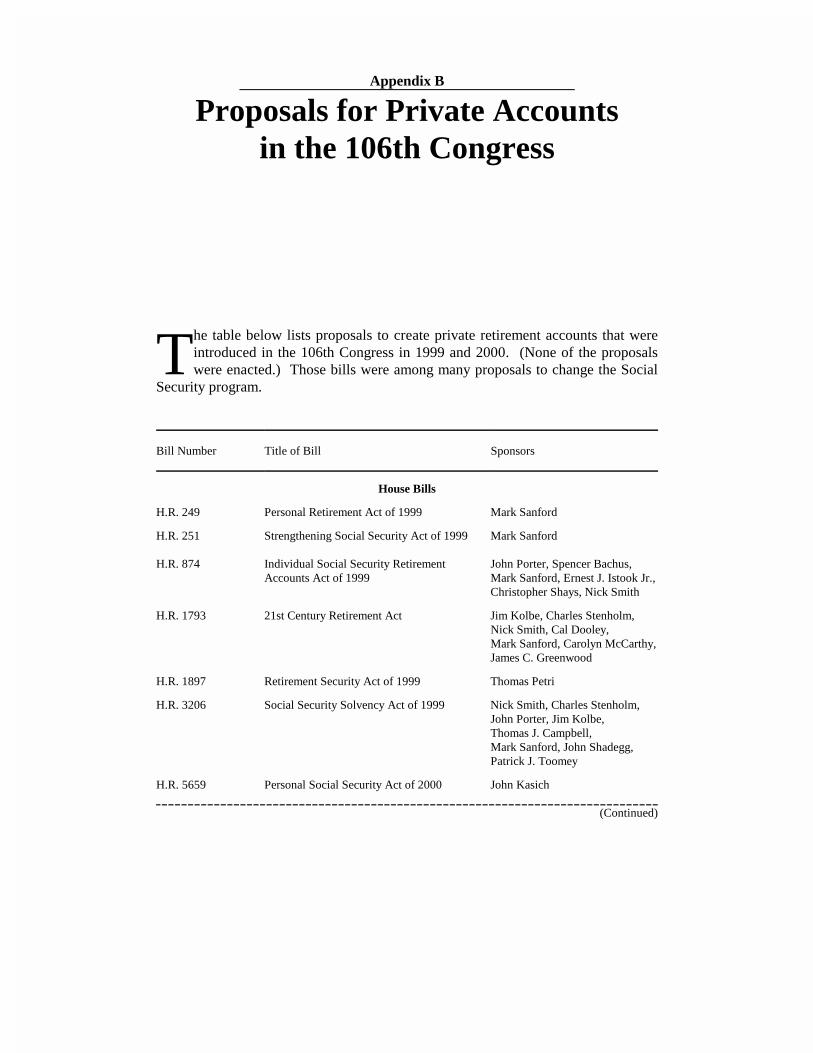
Appendix B
Proposals for Private Accountsin the 106th Congress
The table below lists proposals to create private retirement accounts that wereintroduced in the 106th Congress in 1999 and 2000. (None of the proposalswere enacted.) Those bills were among many proposals to change the Social
Security program.
Bill Number Title of Bill Sponsors
House Bills
H.R. 249 Personal Retirement Act of 1999 Mark Sanford
H.R. 251 Strengthening Social Security Act of 1999 Mark Sanford
H.R. 874 Individual Social Security RetirementAccounts Act of 1999
John Porter, Spencer Bachus,Mark Sanford, Ernest J. Istook Jr.,Christopher Shays, Nick Smith
H.R. 1793 21st Century Retirement Act Jim Kolbe, Charles Stenholm,Nick Smith, Cal Dooley, Mark Sanford, Carolyn McCarthy,James C. Greenwood
H.R. 1897 Retirement Security Act of 1999 Thomas Petri
H.R. 3206 Social Security Solvency Act of 1999 Nick Smith, Charles Stenholm,John Porter, Jim Kolbe, Thomas J. Campbell, Mark Sanford, John Shadegg, Patrick J. Toomey
H.R. 5659 Personal Social Security Act of 2000 John Kasich
(Continued)

86 SOCIAL SECURITY: A PRIMER September 2001
Bill Number Title of Bill Sponsors
Senate Bills
S. 21 Social Security Solvency Act of 1999 Daniel Patrick Moynihan, Robert Kerrey
S. 588 Social Security for the 21st Century Act Jim Bunning
S. 1103 Personal Security and Wealth in Retirement Act of 1999
Rod Grams
S. 2740 Savings Accounts Are Valuable for Everyone Act of 2000
Mary Landrieu
S. 2774 Bipartisan Social Security Reform Act of 2000
Judd Gregg, Robert Kerrey, John Breaux, Charles Grassley,Fred Thompson, Charles Robb,Craig Thomas
S. 3200 Social Security KidSave Accounts Act Robert Kerrey, Rick Santorum,Daniel Patrick Moynihan, Charles Grassley, John Breaux

Appendix C
Contributors to the Primer
The following Congressional Budget Office (CBO) staff played important rolesin preparing this publication.
Authors
Ralph Smith of CBO’s Health and Human Resources Division wrote Chapters 1, 2,and 3 under the direction of Joseph Antos. Kate Bloniarz and Emily Shelton providedresearch assistance.
Douglas Hamilton of the Macroeconomic Analysis Division wrote Chapters 1 and 4and Appendixes A and B under the direction of Robert Dennis. John McMurray andEric Warasta provided research assistance.
Reviewers
Barry Anderson, David Brauer, Kathleen Buto, Paul Cullinan, Arlene Holen, StevenLieberman, Deborah Lucas, Noah Meyerson, Robert Murphy, Benjamin Page, KathyRuffing, John Sabelhaus, Robert Shackleton, Robert Sunshine, Bruce Vavrichek, andTom Woodward of CBO provided helpful comments on the manuscript, as did JuneO’Neill (formerly of CBO).
Editing and Production Staff
Christian Spoor edited the report, and Leah Mazade proofread it. Ronald Moore andLinda Lewis Harris produced the initial drafts. Kathryn Winstead produced the graph-ics and prepared the report for publication. Annette Kalicki prepared the electronicversions for CBO’s Web site (www.cbo.gov).