Geology and Ground Water in the Santa Rosa and Petaluma ...Geology and Ground Water in the Santa...
284
Geology and Ground Water in the Santa Rosa and Petaluma Valley Areas Sonoma County California By G. T. CARDWELL GEOLOGICAL SURVEY WATER-SUPPLY PAPER 1427 Prepared in cooperation with the California Department of Water Resources UNITED STATES GOVERNMENT PRINTING OFFICE, WASHINGTON : 1958
Transcript of Geology and Ground Water in the Santa Rosa and Petaluma ...Geology and Ground Water in the Santa...
Geology and Ground Water in the Santa Rosa and Petaluma Valley Areas Sonoma County CaliforniaBy G. T. CARDWELL
GEOLOGICAL SURVEY WATER-SUPPLY PAPER 1427
Prepared in cooperation with the California Department of Water Resources
UNITED STATES GOVERNMENT PRINTING OFFICE, WASHINGTON : 1958

UNITED STATES DEPARTMENT OF THE INTERIOR
FRED A. SEATON, Secretary
GEOLOGICAL SURVEY
Thomas B. Nolan, Director
For sale by the Superintendent of Documents, U. S. Government Printing Office Washington 25, D. C.

CONTENTS
PageAbstract___ ___________________________-_---_-____-_--._-_-_----- 1
Introduction.________________________-__-__-______-_----___-__--__ 3Location of the area--_____--______--_---------------_--------- 3Purpose a.nd scope of the investigation.__________________________ 5Acknowledgments ____________________________--_--___---__-_-- 6Previous work related to water resources,________________________ 6Well-numbering system___________________________-_...._.-____-.-_ 6
Geography__ ________________-_____,.____-___--___--__--_--------- 7Physical features______________________________________________ 7
Topography. _.______.____________________-___-_.-_----__-_ 7Drainage.____________-_____________---_-_---_-__---___-_- 9
Climate.. ._...._._-_._.._.__._..__.___. :.__. 12General features_____-______--________________-_---__---_ 12Precipitation__ _ _________________________________________ 12
Culture._____________________________________________________ 17
History of water use.______.___________-_-_______-________---------- 18
Geology_______________________________ 23Previous work_______________________________________________ 23Description and general water-bearing character of the rocks______-_ 23
General features_--__-_--__-__--__________-------_--------- 23Consolidated rocks of Jurassic and Cretaceous (?) age____------- 29
Franciscan group-------------------------------------- 29Knoxville formation.__________________________________ 31Novato conglomerate._________________________________ 31
Sedimentary and volcanic rocks of Tertiary age_______________ 325Tolay volcanics of Morse and Bailey (1935) _______________ 32Petaluma formation____________________________________ 32Sonoma volcanics____________________________________ 35
Tertiary and Quaternary deposits. ___.________________________ 38Merced formation_____________________________________ 38Glen Ellen formation_________________________________ 38
Pleistocene and Recent deposits.____________________________ 54Older alluvium and terrace deposits.________---_-_-__-__. 54Younger alluvium (Recent)_____________________________ 55
Geologic structure-____________________________________________ 57Folds,___________-_-_____--____________-_-____-_-__-_ 57Faults________--___-___-_-____--____---_-________.__ 58
Geologic history___________________-___________________________ 59Mesozoic era____________________________________________ 59Cenozoic era______________________________________________ 59
Pre-Pliocene events.___________________________________ 59Pliocene and Pleistocene epochs_ _:______________________ 60
in

IV CONTENTS
Page Ground water____________________________________________________ 62
General hydrologic principles_________________________________ 62Santa Rosa Valley area_________________________ 66
Principal water-bearing formations______________________ 67Younger alluvium.__________________________________ 67Older alluvium and terrace deposits____________________ 68Glen Ellen formation________________________________ 68Merced formation___________________________________ 69Sonoma volcanics__________________________________ 70Petaluma formation_______________________________ 72
Principal water body_____________________________________ 72Extent, nature, and depth to water______________________ 72Fluctuations of water levels___________________________ 74
Other water bodies________________________________________ 79Source and recharge_____________________________________ 80Movement______________________________________________ 83Natural discharge.__________________________ 84Pumpagefrom wells_______________________________________ 86Quality of water_____________________________ 90
General requirements and suitability,________________ 91Chemical character..._______________________________ 93Ground water containing boron________________ ___ 96Relation of specific conductance to sum of ionized constitu
ents____________________________ ._ 98Storage capacity___ ____ ____________ ____ __ 100
Santa Rosa Valley_____________-__-_-_-___ 101Bennett, Rincon, and Kenwood Valleys __________________ 102Estimated storage capacity. ____________________________ 103Usability of storage capacity--------..-------. _.-- 106
Petaluma Valley area--____ __ _____________________ 108Principal water-bearing formations.. __ _ _ _____ 109
Younger alluvium_--___-__---_-----_---_---_- _ 109Older alluvium-_____________-_-_-_--_-_----_---_------ 110Merced formation_____________---_--___ _____________ 111Sonoma volcanics___________________ ____ _____ 111Petaluma formation____ _______________________ __ 111
Principal water body_________________ __________________ 112Extent, nature, and depth to water. __________ 112Fluctuation of water levels_______ ____________________ 113
Other water bodies_____________ __________________ _____ 114Source of water__--_---___---_------- _____________ 117Movement of water_____________ _______________________ 118Natural discharge and pumpage------.-.-------------------- 119Quality of water_______ __ ___ __ ___________ 120
Suitability of water for domestic, industrial, and irrigationuse________________-________-__-_---__-----_----_- 121
Principal ground-water body__---_-_--------_----------- 122Merced formation_______________-___--------_--_------ 127Petaluma formation________________---.---__--_-------- 127Relation of specific conductance to sum of ionized constitu
ents____________________________--_ -- 128Surface water______________-----___----------_-------- 128
Storage capacity_________________________ ____________ 130

CONTENTS
Literature cited.Page 132
Tables of basic data_______________________________________________ 135Description of wells_________________________________________ 135Periodic water-level measurements_____________________________ 137Analyses of water____________________________________________ 137Drillers'logs__________.._._____. __________________ 139
______-_-________--____--_-_---____-_------_--____-------- 271
ILLUSTRATIONS
[Plates 1-5 are in pocket]
PLATE 1. Geologic map of the Santa Rosa and Petaluma Valley areas, showing location of wells.
2. Water-level contour map of the Santa Rosa and Petaluma Valley areas.
3. Geologic sections across the middle of Santa Rosa Valley.4. Geologic sections across the north end of Santa Rosa Valley.5. Geologic section across the southern end of Cotati Plain.
Page6. Nearly vertical beds of basaltic tuff of the Sonoma formation. _ 407. Fossiliferous sandstone of the Merced formation__________ 418. A, Lenticular beds of loose, poorly sorted gravel of the Glen *
Ellen formation; B, conglomerate and compact sandy clay of the Glen Ellen formation._________________________ 48
FIGURE 1. Index map showing location of the Santa Rosa and PetalumaValley areas_________________________________________ 4
2. Increase in irrigation and gross pumpage, 1945-49- _________ 213. Map showing ground-water storage units and pumpage areas _ _ 224. Geologic section across Petaluma Valley near Petaluma.____ 255. Geologic sections across Kenwood Valley and the Glen Ellen
area._____________________________________________ 286. Hydrographs showing fluctuations of water levels, and graph
showing monthly rainfall____________________________ 747. Hydrographs showing fluctuations of water levels in paired
shallow and deep wells____-_______--__--__-___________ 758. Hydrographs showing fluctuations of water level in wells
tapping the Merced formation_________________________ 769. Hydrographs of wells at mouth of Bennett Valley._________ 77
10. Hydrographs of wells tapping the principal water bodies inRincon and Kenwood Valleys____-_-_-_---____-________ 78
11. Diagram showing chemical character of the ground water inthe Santa Rosa Valley_--_----______________________ 94
12. Graphical representation of chemical analyses of water fromwells tapping the principal water-bearing formations______ 95
13. Relation of specific conductance to sum of ionized constituentsin the ground waters in Santa Rosa Valley_____________ 99

VI CONTENTS
ILLUSTRATIONS ContinuedPage
FIGURE 14. Hydrographs showing fluctuations of water levels of wells in Petaluma Valley, and graph showing monthly rainfall at Petaluma, 1949-54-._______________________ 115
15. Diagram showing the chemical character of the ground waterin the Petaluma Valley area___---_----__-_-_-----_---- 115
16. Variation of chemical constituents in water with increasingdepth in the principal water body in Petaluma Valley_____ 124
17. Changes in quality of water in the principal water body inPetaluma Valley ___________._________________ 126
18. Relation of specific conductance to sum of ionized constituentsin ground water?) in Petaluma Valley______________-___-- 129
TABLES
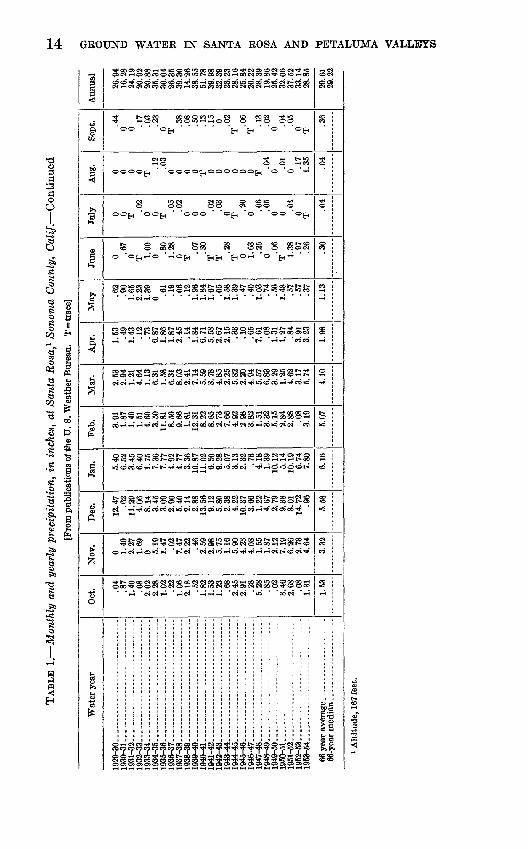
Page TABLE 1. Monthly and yearly precipitation, in inches, at Santa Rosa____ 12
2. Annual rainfall, in inches, at five stations in the Santa Rosaand Petaluma Valley areas_______-_____--_---_---_----- 15
3. Data for additional precipitation stations in and near the SantaRosa and Petaluma Valley areas--__-___-_--_--_-------- 16
4. Distribution, in 1950, and percent increase in population, 1940-50, in Sonoma County and the Santa Rosa and Peta luma Valley areas___-_------___----__----_-_---------- 17
5. Areal distribution of irrigation wells and development of irriga tion by periods________-____-__-_______-__----------- 20
6. Stratigraphic units distinguished in the Santa Rosa and Peta luma Valley areas----_-__----__------------------_--_- 26
7. Ground-water pumpage, in acre-feet, in the Santa Rosa Valleyarea, 1945-49__________________-__-__ - 87
8. Duty of water factors in the Santa Rosa Valley area.________ 889. Summary of chemical character of water from the principal
water-bearing formations in the Santa Rosa Valley area____ 9310. Categories used for classification of materials described by
drillers, and estimates by category, of specific yield in the Santa Rosa and Petaluma Valley areas________-_-_____-- 104
11. Average estimated specific yield of ground-water storage unitsin the Santa Rosa Valley area______________-_---__---_- 104
12. Estimated gross ground-water storage capacity, in acre-feet,in the Santa Rosa Valley area-_____-___---__---__------ 112
13. Comparison of water levels in closely spaced wells of differentdepth in the principal water body.---------------------- 106
14. Ground-water pumpage, in acre-feet, in the Petaluma Valleyarea, 1945-49_____________________________ 119
15. Chemical analyses of surface waters in the Petaluma Valleyarea___--____--________________-----_---_------------ 130
16. Estimated gross ground-water storage capacity, in acre-feet,in the Petaluma Valley area__-__-__-__----_---_-_------ 131
17. Description of water wells in the Santa Rosa Valley area- _ _ _ _ _ 140
CONTENTS VII
TABLES ContinuedPage
TABLE 18. Description of representative developed springs in the SantaRosa Valley area_____-._-____-_-_-______-__-___________ 206
19. Periodic water-level measurements in wells in the Santa RosaValley area.______________________-___ 207
20. Chemical analyses of water from wells in the Santa Rosa Valleyarea_________________________________ 220
21. Partial chemical analyses of water from wells and springs in theSanta Rosa Valley area____-_-___-_--__.._-_-----------_ 222
22. Drillers'logs of wells in the Santa Rosa Valley area.________ 22323. Description of water wells in the Petaluma Valley area____ 25024. Periodic water-level measurements in wells in Petaluma Valley. 26425. Chemical analyses of water from wells in Petaluma Valley-_-_ 26126. Partial chemical analyses of water from wells in Petaluma
Valley.._____________.________________ 26627. Drillers'logs of water wells in the Petaluma Valley area..____ 267

GEOLOGY AND GROUND WATER IN THE SANTA ROSA AND PETALUMA VALLEY AREAS, SONOMA COUNTY, CALIFORNIA
BY G. T. CARD WELL
ABSTRACT
Santa Rosa and Petaluma Valleys are the westernmost of the several small valleys immediately north of San Francisco Bay, California. The two valleys occupy alined, structurally controlled depressions in the Coast Ranges of northern California. Together they extend from the northern margin of San Francisco Bay northwestward about 35 miles to the Russian River. The valleys are under lain by unconsolidated marine and continental sediments and volcanic rocks of Tertiary and Quaternary age. This material is water bearing in large part and makes up a relatively deep ground-water basin. Santa Rosa Valley, the northern most and larger of the two valleys, contains about 90 square miles of the approxi mately 150 square miles of plains and essentially flat-lying lands in the area. Petaluma Valley contains about 45 square miles of alluvial plains, of which about 10 square miles is unreclaimed tidal marsh. The remaining area includes Bennett, RincoB, and Kenwood Valleys, small intermontaine valleys east of Santa Rosa, and a portion of the Russian River flood plain. Ground water is the principal source of water supply for the area, which is chiefly agricultural and has (1950) a population of about 85,000. The overall area of investigation comprises about 450 square miles.
The geologic formations in the area are grouped in three classes based on rela tive capacity to yield water: (1) consolidated rocks of Jurassic and Cretaceous age which yield essentially no water and include, in ascending order, the Fran ciscan group, the Knoxville formation, and the Novato conglomerate; (2) sedi mentary and volcanic rocks of Tertiary age which are mainly secondary aquifers and include the Tolay volcanics of Morse and Bailey (1935), the estuarine and continental Petaluma formation, and the Sonoma volcanics, all of Pliocene age; and (3) deposits of late Tertiary and Quaternary age which are unconsolidated or poorly consolidated and include the marine Merced formation of Pliocene and Pleistocene (?) age and the continental Glen Ellen formation of Pliocene and Pleistocene age, the older alluvium and terrace deposits of Pleistocene age, and younger alluvium of Recent age. The formations of class 3 are the most impor tant aquifers in the area.
Rocks in class 1 are chiefly sandstone, shale, and conglomerate in this area. Locally they yield enough water for domestic use, mainly from fractures or from beds in which limited primary porosity is preserved. The Tolay volcanics (class 2) are not tapped by wells. The Petaluma formation has a maximum thickness of about 4,000 feet and consists primarily of clay, sandstone, and minor con glomerate. It is tapped by wells mainly on the northeastern flank of upper Petaluma Valley, where it generally yields enough water for domestic needs, and locally as much as 300 gallons per minute (gpm) to individual wells. The Sonoma volcanics consist of interbedded lavas, tuff and tuff breccia, reworked tuff, and
1

2 GROUND WATER IN SANTA ROSA AND PETALUMA VALLEYS
volcanic sediments, and have a thickness of about 2,000 feet. The heterogeneity of these volcanic rocks makes for a wide range in permeability and in the depth of wells, but generally moderate yields can be obtained; irrigation wells commonly yield more than 500 gpm, and locally more than 1,000 gpm.
The Merced and Glen Ellen formations (class 3) have the greatest areal and vertical extent. The Merced crops out principally on the western sides of Santa Rosa and Petaluma Valleys. It consists mainly of fine-grained fossiliferous sand, sandstone, and sandy clay, tuffaceous in part, and has a maximum thickness of 2,000 feet or more. The permeability is fairly low, but wells tapping a thick section in the upper part of the formation have good yields, commonly 500-1,000 gpm if the wells are properly constructed; the lower part of the formation is indurated and has lower permeability. The Glen Ellen formation consists of lenticular bodies of poorly sorted gravel and sand and silty and clayey material, and coarse conglomerate and reworked tuff near the base. It is exposed in the northern part and on the eastern side of Santa Rosa Valley and in the Kenwood Valley-Glen Ellen area. Fair yields are obtained from wells in the upper part of the formation, commonly 300-750 gpm in the northern part of Santa Rosa Valley. Yields are generally low in other areas. The older alluvium and terrace deposits consist of gravel, sand, silt, and clay deposited as alluvial fans and valley alluvium. Terrace deposits locally yield water to wells in the Russian River area, and the older alluvium is an important aquifer in Petaluma Valley where the estimated maximum thickness is about 200 feet. Yields commonly range from about 20- 200 gpm. The younger alluvium is the principal aquifer in the Russian River valley where extensive channel deposits of gravel and sand yield water freely to wells. Younger alluvium locally contributes to the yield of wells tapping older deposits in Santa Rosa Valley. In Petaluma Valley maximum yields reported from younger alluvium are about 150 gpm; in Novato Valley, about 50 gpm.
The principal ground-water body in the Santa Rosa Valley area is in the Glen Ellen and Merced formations, which interfinger beneath Santa Rosa Valley. East of Santa Rosa Valley separate water bodies occur in the Sonoma volcanics and locally in the Glen Ellen formation. The Merced formation and the younger and older alluvium comprise the principal water body in Petaluma Valley. Both water-table and confined conditions occur in the ground-water bodies, but the conditions can be distinguished only locally. Generally the separation within principal water bodies is small in Santa Rosa and Petaluma Valleys. Deeper wells commonly have lower heads than shallow wells during summer and autumn, but head differences generally level off in the spring. In the Glen Ellen formation east of Santa Rosa Valley, in the Sonoma volcanics, and in the Petaluma formation, confined conditions are common.
An estimated 10,000 wells (1950) pump ground water for domestic, public- supply, irrigation, and other uses in the Santa Rosa Valley and Petaluma Valley areas. About 200 irrigation wells were in use in 1952. The total pumpage in 1949 was about 15,000 acre-feet (about 13,000 in the Santa Rosa Valley area and 2,000 in Petaluma Valley), an increase of 65 percent over 1945, the earliest year for which pumpage was computed.
The source of ground water in the area is rainfall, which recharges the water bodies by infiltration and deep penetration in the soil zone and by lateral and downward percolation from the beds of shallow streams that cross permeable zones. In Santa Rosa Valley the direction of ground-water movement is gen erally toward the Laguna de Santa Rosa and Mark West Creek, where discharge takes place. The average gradient across Santa Rosa Valley is about 20 feet per mile. The depth to water in most of the relatively flat-lying portions of the Santa Rosa Valley area ranges from 5 to 20 feet in the spring; the average seasonal

INTRODUCTION 3
fluctuation ranges from 5 to 20 feet. Although locally seasonal fluctuations have increased slightly as a result of increased development, the recovery of water levels each spring generally reflects the rainfall regimen and does not indicate overdraft.
Ground water in the Santa Rosa Valley area is of good quality for most uses and generally is a moderately hard bicarbonate water. Water in two local areas has a high boron content.
The gross storage capacity of the upper 200 feet of deposits lying beneath the flat-lying part of the Santa Rosa Valley area (excluding the adjacent part of the Russian River flood plain) was computed to be about 1,000,000 acre-feet.
In Petaluma Valley, ground water moves toward Petaluma Creek and down valley to discharge into tidal sloughs. In the upper part of Petaluma Valley, the area of heaviest ground-water development, the gradient is 20-50 feet per mile. Water levels in wells in the alluvial-plain area of upper Petaluma Valley generally are 10-25 feet below the land surface in the spring; water levels in the tidal portion are near the land surface. Seasonal fluctuations range from less than 1 foot to about 20 feet. Local overdevelopment is indicated in the vicinity of Petaluma, where water levels are near sea level and withdrawals are con centrated.
Ground water in the principal ground-water body in upper Petaluma Valley is of good quality, generally a calcium magnesium bicarbonate water containing 250-500 ppm of dissolved solids. Local encroachment by brackish water from tidal sloughs occurs in the lower part of Petaluma Valley as far north as Petaluma. Connate water, of poor quality, occurs locally in the Petaluma formation.
The gross storage capacity of upper Petaluma Valley is estimated to be about 200,000 acre-feet between the land surface and a depth of 200 feet. The usability of the storage would be affected by the amount of ground-water recharge that could move in from the upland area underlain by the Merced formation and the gradient that could be maintained at the south end of upper Petaluma Valley without inducing brackish tidal water to move into the fresh-water body.
Although the period of record for water-level observations in the Santa Rosa and Petaluma Valleys is relatively short, it appears that the ground-water re sources of the area are in a relatively early stage of development as compared with potential development.
INTRODUCTION
LOCATION OF THE AREA
The Santa Rosa and Petaluma Valley areas are in Sonoma County, Calif., immediately north of San Francisco Bay (fig. 1). They are the westernmost of the so-called North Bay valleys, the valleys draining to the bay from the north. The areas lie between 38°05' and 38°35/ north latitude and between 122°25 / and 122°55 / west longitude. Santa Rosa, near the center and the largest city, is about 21 miles east of the Pacific Ocean and 26 miles northwest of San Pablo Bay, which forms the northern portion of San Francisco Bay.
The area covered by this report is delimited on the north by the Russian River, on the south by San Francisco Bay, on the east by the Mayacmas and Sonoma Mountains, and on the west by the Mendocino Range. It includes about 450 square miles and has a

GROUND WATER IN SANTA ROSA AND PETALUMA VALLEYS
123°00' 122°30'
FIGURE 1. Index map showing the location and extent of the Santa Rosa and Petaluma Valley areas Sonoma County, Calif., described in this report.
north-south length of 36 miles and an average east-west width of 12 miles.
The Santa Rosa Valley area, as defined for this report, includes Santa Rosa Valley and the smaller Bennett, Rincon, and Kenwood Valleys which lie east of it. The area includes also a small contiguous part of the Russian River valley which adjoins the northwestern part of Santa Rosa Valley. The Petaluma Valley area includes Petaluma

INTRODUCTION 5
Valley and the smaller contiguous Novato Valley on the south. These areas are covered by the following topographic quadrangle maps of the U. S. Geological Survey: Calistoga (1945), Healdsburg'(1940), Mare Island (1916), Petaluma (1914), Santa Rosa (1944), and Sebastopol (1942). In addition, topographic maps of the U. S. Army, Corps of Engineers, are available for the Mare Island (1942), Petaluma (1942), and Point Reyes (1940) quadrangles. All maps are published at a scale of 1:62,500 and have a contour interval of 25 feet, except the Calistoga quadrangle of the Geological Survey and the Petaluma and Point Reyes quadrangles of the Corps of Engineers, which have a contour interval of 50 feet.
PURPOSE AND SCOPE OF THE INVESTIGATION
The investigation whose results are given in this report was begun in September 1949 in cooperation with the California Division of Water Resources (now California Department of Water Resources) as a part of the program of reappraisal of the water resources of the State by that agency. The work has been limited largely to the determi nation of the geologic conditions, particularly the subsurface geologic conditions of the occurrence of ground water. An estimate of the gross storage capacity of the several ground-water basins has been made, and factors bearing on usability of the storage have been considered.
The collection of basic hydrologic and geologic data constituted a large part of the investigation and was essentially completed in the spring of 1951. Most of the data are found in tables in the back of the report and represent information for about 1,100 wells. Logs for about 1,050 of the wells were available: 800 for wells that were located in the field, 250 for wells whose locations were approximately established. Periodic measurements of water level were made in about 70 wells, and chemical analyses were made of water from 200 wellsv 80 analyses being relatively complete.
The geologic map of the area was compiled chiefly from the mapping of others. However, the geology was field checked, revised, supple mented, and correlated throughout the area. Several months of field work was devoted to geologic mapping, which was completed in the summer of 1952. An intensive study was made of the water-bearing formations and deposits.
Similar work was carried on concurrently by the Geological Survey in cooperation with the California Division of Water Resources in contiguous valley areas to the east [Sonoma and Napa Valleys (Kunkel and Upson, 1957, written communication)], and to the north in alluvial valleys along the Russian River and other valleys in Mendocino County.
6 GROUND WATER IN SANTA ROSA AND PETALUMA VALLEIYS
ACKNOWLEDGMENTS
The cooperation of many people of Sonoma County materially aided the investigation. Industries, local ranchers, and other people of the area aided the study by furnishing data on their wells and by allowing access to their properties for collection of geologic and hydrologic data. Special thanks are due officials of the Water Department of the City of Santa Rosa, the Sonoma County farm advisor and his staff, the Pacific Gas and Electric Co., the California Water Service Co., and local well drillers who freely furnished well data or other useful information. The writer acknowledges the advice and criticism of colleagues of the Geological Survey, especially the critical review of the text by G. F. Worts, Jr., and A. R. Leonard. J. E. Upson gave assistance in and valuable suggestions concerning the geologic map ping. W. J. Hiltgen, D. H. Kuhlman, and Fred Kunkel assisted in the collection of data.
PREVIOUS WORK RELATED TO WATER RESOURCES
Previous investigations related to water resources of the area have been limited chiefly to the collection of data having a bearing on specific problems. In 1940-41 the United States Bureau of Reclama tion 1 studied a poorly drained area in the northern part of Santa Rosa Valley to determine the feasibility of using wells for drainage. In 1950, the Whipple Engineering Co. made a survey for the Sonoma County Board of Supervisors concerning the adequacy of ground water to meet needs for future development. Weaver (1949, p. 200-202) included in his geologic report a section on water resources which discussed briefly some of the general features of ground-water occurrence in the area.
WELL-NUMBERING SYSTEM
In California the Geological Survey uses a well-numbering system based upon the location of the well in the rectangular system used for the subdivision of public land. Many of the valleys were acquired privately through land grants made by the Spanish or Mexican governments and have never been so subdivided. For these areas the system is extended by projecting or superimposing an arbitrary land grid.
The well-location number has two basic parts: For example, in the number 7/8-29R2, the part preceding the hyphen indicates the town ship and range (T. 7 N., R. 8 W.) and the remainder indicates the section (29) and the position within the section. The letter indi-
» Gamer, R. L., Geological and ground-water reconnaissance of Santa Eosa Plains Russian River stud ies general investigations, California: unpublished rept. in files of the Geology Branch, U. S. Bur. Reclama tion, 1942.

GEOGRAPHY
cates the 40-acre subdivision as shown in the diagram, and the last number indicates the serial number within the 40-acre tract. Thus, well 7/8-29R2 is the second well canvassed by the Geological Survey in the SE%SE% sec. 29. Letters indicating cardinal directions follow
D
E
M
N
C
F
L
P
B
G
K
O
A
H
J
R
the first two parts of a number if an area spans two or more quadrants of a base line and meridian. Because all the Santa Rosa and Petaluma Valley areas are north and west of the Mount Diablo base line and meridian, the letters indicating cardinal direction are omitted from the well number.
Incomplete numbers, such as 6/9-lB or 5/7-20, indicate locations of wells, springs, or sampling points which are approximate to the extent indicated by the symbol. These locations are not shown on the base map. This system is used also to indicate the location of some rock outcrops or other points or areas that are mentioned in the text.
GEOGRAPHY
PHYSICAL FEATURES
TOPOGRAPHY
The Santa Rosa and Petaluma Valleys occupy a northwest-trending structural depression in the southern part of the Coast Ranges of northern California. This depression divides the Mendocino Range on the west from the Mayacmas and Sonoma Mountains on the east. The Mendocino Range in this area is made up mostly of low, rounded hills that increase in altitude from about 200 feet adjacent to Santa Rosa Valley to 600-1,200 feet at the crest, 8-10 miles west of Sebasto- pol. West of the southern end of Petaluma Valley are the Marin Mountains, in which Burdell Mountain, immediately adjacent to the valley, rises to an altitude of 1,560 feet. The Sonoma Mountains rise steeply on the eastern side of Santa Rosa and Petaluma Valleys to altitudes of 1,000-2,000 feet; their maximum altitude is 2,465 feet. They descend to the south and dip beneath San Pablo Bay. North-

8 GROUND WATER EST SANTA ROSA AND PETALUMA VAI^LETS
ward, the Mayacmas Mountains rise less steeply, and ridges bordering the valley range in altitude between 500 and 1,000 feet.
Santa Rosa Valley, which contains about 90 square miles of plains, is the largest physiographic unit of the area. On the northwest it adjoins the Russian River plain, to which it is connected by a narrow gap in the hills about 3 miles southeast of Healdsburg (8/9-3). From this gap it extends about 20 miles south-southeastward where it is terminated by a series of low hills just north of Penngrove. These hills have been breached by south-flowing drainage, and the topo graphic divide is in Santa Rosa Valley about 2 miles northwest of Penngrove. Normal to the axis, the valley width ranges from 4 to 7 miles. Although the Santa Rosa Valley is a plain in comparison with the adjoining upland and mountain areas, much of it is not very level and it is marked by several internal topographic features. Along the western side a swampy area, Laguna de Santa Rosa, forms the lowest part of the valley trough. Along the eastern side lies a flat, gently sloping alluvial plain, 1-2 miles wide, which merges with the alluvial plains of Mark West and Santa Rosa Creeks and, to the south, with the Cotati plain. The northwestern two-thirds of the valley has an uneven surface produced by erosion of weakly consolidated continen tal deposits. The southern part of this area is characterized by low mounds and poorly drained depressions which are typical of Pleisto cene deposits in northern California. Local relief increases northward, so that north of Santa Rosa Creek the surface is rolling or hilly. Most of the valley is between altitudes of 50 and 150 feet.
Petaluma Valley contains about 45 square miles of alluvial plain. It is 16 miles long and 2-3 miles wide over most of that length and has a maximum width of 3% miles at Petaluma. Most of the upper part of Petaluma Valley, about 20 square miles, is between sea level and an altitude of 50 feet. Most of the lower part of Petaluma Valley is at or as much as 3 feet below sea level, although much of it has been reclaimed by a system of levees and drainage ditches so that only about 10 square miles is presently occupied by tidal swamps and the drowned portions of Petaluma Creek.
Novato Valley adjoins Petaluma Valley near San Pablo Bay, and the two are separated by a ridge of consolidated rocks through which a low divide has been cut just north of the town of Novato. Novato Valley contains about 12 square miles of alluvial plain, of which about two-thirds is tidal marsh and lies at or slightly below sea level. The remainder, about 4 square miles, lies between sea level and an altitude of 200 feet, but most of it is less than 100 feet in altitude.
That part of the Russian River valley extending from about 1 mile south of Healdsburg to Wilson Grove is included in the area of this report. It comprises about 6% square miles of flood plain and is 5
GEOGRAPHY 9
miles long and 1-1% miles wide. Altitudes range between 50 and 100 feet.
Bennett Valley is an aUuvium-filled structurally controlled valley that parallels Santa Kosa Valley to the east and joins it just east of the city of Santa Kosa. The lower part of Bennett Valley is under lain by a continuous body of alluvium, having a surface area of about 1% square miles; it is 3 miles long and 1% miles wide at the mouth. The valley floor ranges in altitude from 200 to 300 feet.
Kincon Valley is north of Bennett Valley, from which it is separated by a breached ridge of volcanic rock. The eastern part of Rincon Valley occupies part of a structural depression extending from Sonoma Valley northwestward to and beyond Mark West Creek. The valley floor comprises about 2% square miles.
The Kenwood-Glen Ellen area, which is in the Kenwood-Sonoma structural trough, includes Kenwood Valley and the country north and northwest of Glen Ellen lying adjacent to and between Sonoma and Calabazas Creeks. The floor of Kenwood Valley covers about 5 square miles; it has a length of 6% miles and a maximum width of \% miles. Most of the valley-floor is at altitudes of 400-500 feet.
In all, the area covered by the report comprises two principal and five subsidiary valleys containing about 150 square miles of alluvial land. Geologic and hydrologic continuity exists between several of the valleys, as shown by the geologic map and water-level contours (pis. 1 and 2).
DRAINAGE
The drainage divide between Santa Rosa and Petaluma Creeks, about a mile southeast of Cotati in Santa Rosa Valley, and a similar one between Santa Rosa and Sonoma Creeks, about 2 miles north west of Kenwood, separate the area into parts of two of the seven major hydrographic divisions of the State (California State Water Resources Board, 1951, pi. 2). The northern portion drains into the Pacific Ocean through the Russian River and belongs to area 1, north coastal area; the southern portion drains into San Pablo Bay and is part of area 2, the San Francisco Bay area.
The Russian River, one of the major streams of the north coastal area, flows southward along the northwestern edge of Santa Rosa Valley, then turns westward toward the Pacific Ocean just west of Wilson Grove.
Santa Rosa and Mark West Creeks rise in the Mayacmas Mountains northeast of Santa Rosa and are the principal streams draining Santa Rosa Valley. Most of the runoff originates in the mountains on the east side of the valley and flows westward through Santa Rosa and Mark West Creeks to collect in the Laguna de Santa Rosa, from which it moves northward and discharges into the Russian River
443616 58 2

10 GROUND WATER IN SANTA ROSA AND PETALUMA VALLEYS
through a narrow outlet. The Laguna de Santa Rosa, or the Laguna, as it is known locally, is a swampy, intermittent drainage course at the western edge of the floor of Santa Rosa Valley that extends from about 4 miles southeast of Sebastopol (in 6/8-17) to about half a mile east of Trenton (in 7/9-3F). Along the Laguna are several permanent lakes or "lagoons," the largest of which are in 7/9-10 and in 7/9-26 and 7/9-35 (pi. 1). However, the extent of the lakes ranges considerably, particularly during winter and spring when the water surface of the Laguna generally expands owing to storm runoff. The lake level in 7/9-14 commonly rises 8-12 feet above the dry-season level, and, at times, the Laguna area is one continuous body of water as much as 10 miles in length and ranging in width from a few hundred feet to as much as 1% miles locally.
Mark West Creek has a perennial flow from its headwaters to Laguna de Santa Rosa. A gaging station was operated by the Geological Survey from April 1940 through September 1941 at the bridge on U. S. Highway 101, about 4 miles southeast of Windsor. The observed extremes hi discharge were 6,500 cubic feet per second (cfs) on April 4, 1941, and 0.3 cfs during the period September 18-23, 1941. Runoff during the 1941 water year (October 1, 1940, through September 30, 1941) was 80,680 acre-feet (Parker and others, 1942, p. 379).
Santa Rosa Creek is perennial upstream from the city of Santa Rosa. Records from a gaging station on Santa Rosa Creek, 30 feet downstream from the A Street bridge in Santa Rosa, operated by the Geological Survey from December 1939 through September 1941, show a maximum discharge of 8,600 cfs on April 4, 1941, and a mini mum of 0.1 cfs during several days of September, October, and November 1941. Total runoff for the water year 1941 was 94,440 acre-feet. The drainage area above the gage embraces 53 square miles (Parker and others, 1942, p. 378).
The figures given for runoff of the two creeks are not, however, representative of normal conditions in the drainage basin; precipita tion during the water year 1941 was 70-80 percent greater than normal, as based on Weather Bureau records for stations within the area.
Surface outflow from Laguna de Santa Rosa usually is not peren nial. The Geological Survey operates a gaging station on the Laguna at the Guerneville Road bridge (7/9-15) from which records of water- surface altitude or gage height and contents hi acre-feet are available. Contents of the Laguna have ranged from less than 500 acre-feet (gage height, less than 52.3 feet) during several months of each year, to the maximum of 61,408 acre-feet (gage height, 72.1 feet) on Feb ruary 28, 1940 (Paulsen and others, 1952, p. 413). Several creeks

GEOGRAPHY 11
heading in the Sonoma Mountains, notably Crane, Copeland, and Lichau Creeks, cross the Cotati plain; Crane and Copeland Creeks drain into Laguna de Santa Rosa and Lichau Creek is tributary to Petaluma Creek. All are perennial for varying distances upstream from the edge of the valley floor, but Crane and Copeland Creeks have through flow to the Laguna only during the rainy season. Cope- land Creek, according to unconfirmed local reports, formerly was tributary to Petaluma Creek, but during the early stages of land development was channeled to Laguna de Santa Rosa to improve local drainage conditions.
Petaluma Creek is the principal stream draining Petaluma Valley. It is tidal from its mouth to the city of Petaluma, the greater part of its length. Flow in the reach above tidewater is seasonal, generally beginning in the period from October to December and continuing until the following June. A gaging station has been operated by the Geological Survey 2 miles northwest of Petaluma, 70 feet downstream from the Corona Road bridge, from October 1948 to date. For the 1950 water year the total discharge was 8,400 acre-feet; the mean daily discharge rate was 11.6 cfs. The drainage area above the gage comprises 29.6 square miles (Paulsen and others, 1952, p. 407). The tributaries to Petaluma Creek are small, the principal ones being Lichau Creek (and its tributary, Willow Brook), Lynch Creek, and Adobe Creek (pi. 1). San Antonio Creek drains a large area on the west side of the lower Petaluma Valley and discharges into the tidal portion of Petaluma Creek.
Novato Creek, which drains Novato Valley, discharges into San Pablo Bay. In October 1948 the Geological Survey established a gaging station 1 mile west of U. S. Highway 101, 500 feet downstream from the county road bridge. The mean daily discharge during the 1950 water year was 7.91 cfs, and total runoff amounted to 5,730 acre-feet. The drainage area above the station comprises 16.9 square miles (Paulsen and others, 1952, p. 406).
Rincon and Bennett Valleys are drained, respectively, by Brush and Matanzas Creeks, tributaries of Santa Rosa Creek. Brush Creek is a small intermittent stream, and Matanzas Creek has a perennial low flow that extends onto the alluvial plain of lower Bennett Valley before sinking into the alluvium.
The northwestern part of Kenwood Valley is drained by a small unnamed tributary of Santa Rosa Creek. The southeastern part is drained by Sonoma Creek, which together with its principal tributary, Calabazas Creek, also drains the Glen Ellen area, and flows south eastward to Sonoma Valley. Sonoma Creek is perennial except for short stretches of channel underlain by permeable deposits, which go dry in the summer. No records of streamflow are available except

12 GROUND WATER IN SANTA ROSA ANI> PETALUMA VAULEfTS
for an isolated measurement made by the Geological Survey at the Warm Springs Road bridge, 2.0 miles northwest of Glen Ellen, on July 27, 1950, when the flow was 1.0 cfs, excluding several diversionsupstream.
CLIMATEGENERAL, FEATURES
The climate of the region is of the Mediterranean type. The temperature is controlled largely by the proximity of the Pacific Ocean and San Pablo Bay, and seasonal and daily variations are moderate. In the northern and eastern parts of the area, seasonal and diurnal fluctuations of temperature increase directly with the altitude and the amount of enclosure provided by the adjacent up lands. In high enclosed valleys the moderating influence of the water bodies has little effect.
The growing season is long, the usual number of frost-free days per year ranging from about 280 in the south to about 240 in the north. The average annual temperature is about 57 degrees and the monthly average ranges from about 47 degrees in January to 66 degrees in July; temperatures below freezing are rare. Fog and high humidity are common in the mornings, especially during the summer, and the fog is dense during about 20 days of each year. During July the average relative humidity is about 80-90 percent in the early morning, and 60-65 percent at noon. Hours of daily sunshine average 9-10 in the summer. The prevailing wind is from the south for the area as a whole, although it varies, somewhat, within the area, being mainly from the west at Petaluma.
PRECIPITATION
Precipitation is the utlimate source of recharge to the ground-water reservoir. Essentially all the precipitation in the area is rainfall, although limited amounts of snow fall on the higher ridges and peaks in the Mayacmas Mountains during winter storms when the tempera tures are subnormal. Most rainfall occurs between the months of October and May, the greatest amount falling during the period December through March. (See table 1 for monthly rainfall at a representative station.) Rainfall from April 1 to September 30 generally amounts to less than 5 inches, or only 10-15 percent of the yearly total.
The general distribution of rainfall over the area is shown by table 2, which gives yearly rainfall for five representative stations. Monthly and daily rainfall for all those stations except Lakeville are available in the publications or files of the U. S. Weather Bureau, San Francisco.
Data for eight additional stations in or near the area for which precipitation records are available are listed in table 3. More com plete data are omitted because the records are relatively short and

TAB
LE 1
. M
onth
ly a
nd y
earl
y pr
ecip
itat
ion,
in
inch
es,
at S
anta
Ros
a,1
Sono
ma
Cou
nty,
Cal
if.
[Fro
m p
ublic
atio
ns o
f the
U. S
. Wea
ther
Bur
eau.
T=
trace
]
Wat
er y
ear
1887
-88.
. -. .
..1888-8
9 . -
18
89
-9
0
18
90
-9
1.
.
18
91-9
2....
1892-93
18
93
-9
4
18
94
-9
5
.
18
95
-9
6.
1896-97. .
18
97
-9
8
.
1898-9
9....,.
18
99
-0
0
19
00
-01
.- .
1901
-02.
. ........ -_ ._.
19
02
-0
8
1903
-04.
. ...
1904-06 .-
19
05
-0
6
1906-07
19
07
-0
8
19
08
-0
9
1909
-10
1910-1
1
19
11
-12
. .
1912
-13.
... .
19
13-1
4...... .......-
......
19
14
-1
5
1915-16
1916
-17
.1
91
7-1
8..
. . .
...... ...
.... .........
19
18
-1
9
1919
-20.
. .
1920-2
1... - ... ..-.
1921-2
2..
. .
.......................
19
22-2
3
1923
-24
1924-25."
.
..1926-26 ...
192
6-2
7.
. ......
19
27
-2
8
19
28
-2
9
Oct
.
0.00
8.78
0 .20
1.44 .52
2.55 .00
1.50
1Q
Q
1.07
5.94
4.41
1.16
3.70 .64
4.60
T.0
0S
7
1.37
1.73 .68
KS
1.47 0 1.91 .20
1.17
0 i t\
i.2
53.
00 .63
2.79 .50
4.34 .19
1.37
1.98 .34
Nov
.
3.48
4.39
0 1.50
3.37
4.82 .89
1.83
5.09
2.18
1.16
5.44
5.60
4.22
5.00
9.65
2.74
1.97
1.88 .13
2.12
4.53
1.76 .72
5.11
7.50
1.30
1.71
2.68
1.49
3.96 .30
7.78
2.03
4.92 .48
2.35
3.53
12.6
47.
484.
28
Dec
.
5.37
15.9
43.
938.
646.
552.
6113
.41
2.95
6.42
6.82
1.20
4.78
3.35
2.25
4.43
3.59
4.50
1.81
6.79
6.30
4 00
7.61
1 fi
S
2.41
1.78
11.1
57.
238.
345.
922.
252.
554.
358.
658.
7810
.84
1.25
7.33
1.53
2.91
3.71
5.02
Jan
. 1.77
12.8
41.
253.
434.
139
fti18
.42
10.5
72.
271
S1
87
7
4.98
6.05
1.79
6.38
1.77
5.53
10.9
57.
575.
6118
.45
4.94
14.2
03.
396.
1114
.00
9.08
15.2
02.
371.
435.
59 Af\
9.60
1.10
2.27
4.50
1.88
8.84
6.82
3.10
1.48
Feb
.
0.35
4.74
10.4
95.
075.
563.
783.
35 .69
6.25
5.32 nn .77
5.77
14 d
t)2.
5812
.23
4.26
5.24
5.17
A
ft
74
3.75
2.75
1.09 .58
5.60
13.5
23.
535.
157.
068
ff>1.
351.
836.
811.
145.
5814
.42
6.88
10.9
33.
522.
10
Mar
.
7.92
6.15
1.22
4.14
6.59
1.31
2.94
3.53
5.50 .66
8.57
3.72 on
4.54
6.49
12.9
35.
597.
9511
.21
1.45
q QQ
4.17
4 O
ftA.
ft
Q
2.73
1 49
3.98
1.89
1.22
4.73
2 O
ft
3.06
2.74
3.66 .05
.83
3.93 .25
3.68
6.96
2.10
Apr
.
1.09
1.82
2.39
2.65
2.07
1.08
1.35
4.70
1.03 4
8
.67
2.83
3.31
2.61 .60
2U
Q
1.45 .72
.34
Oft
0 .85
3 04
1 54
1.91
1.66 .65
0 2K
9
.86 50
2.46 .75
.25
5.24 43
1.77
9.58
3.47
1.97
1.30
May 2.
93i
dn1.
233.
78 .80
1 84
1.39
1.45 .57
3.32
2.09 .60
1 1
9
1.79
T.2
42.
933.
31 .32
QC
T.0
8.4
42.
881.
28 .95
4.82 .65
.14
.03
.20
0 1.19 .52 22 .33
5.11 .40
.43
.18
.13
June 0.
250 0 0 0 1
300 0 .8
3.1
70 .1
60 0 .0
3.0
70 1.
231
00 .08
.07
.05
.02
1.14 .05
.41
0 .06
.02
T 0 .50
T.0
6.4
4.0
1.0
1T
dn0 2.
48
July 0.00
0 0 .75
0 0 0 .33
0 0 0 0 0 0 T 0 T 0 0 0 .02
0 0 T 0 .07
0 0 .61
0 0 0 .06
0 T 0 .01
.07
.02
.01
0 0
Aug
.
0.00
0 0 0 0 0 0 0 0 0 0 .15
0 0 T T T 0 0 0 0 T 0 0 0 0 0 0 .32
0 .03
0 0 0 0 .22
.01
.01
.03
.01
0 0
Sept
.
0.62
0 .20
.20
0 .25
1.50 .37
.46
.10
.62
0 0 1.17
0 T 4.39
T.1
6.4
6T 1.
29 .01
T 2.99
0 .07
0 .32
.33
2.52 .58
.10
.15
0 1.78 .01
1.17 .02
.01
T 0
Ann
ual
23.1
656
.26
21.4
629
.41
30.7
628
.37
45.0
026
.18
29.5
623
.16
23.6
829
.22
31.6
832
.76
29.2
148
.50
31.6
033
.34
34.7
420
.49
40.0
227
.72
29.5
321
.43
21.0
942
.83
42.4
932
.83
21.5
220
.40
25.2
412
.83
35.6
923
.84
29.9
113
.94
42.3
931
.27
42.6
828
.90
19.2
3
G> I
i Alti
tude
, 16
7 fe
et.
CO
TAB
LE 1
, M
onth
ly a
nd y
earl
y pr
ecip
itatio
n, i
n in
ches
, at
San
ta R
osa,
1 Son
oma
Cou
nty,
Cali
f. C
onti
nued
[Fro
m p
ublic
atio
ns o
f the
U.
S. W
eath
er B
urea
u.
T=
trac
e]
Wat
er y
ear
1929
-30.
.... .
.-.
__
....
... .
...
1980-3
1.... .
... -
1931
-32.
...
1932
-33.
-. -
1933
-34.
..
1934
-35.
...
_ .
19
35-3
8... -
1936-3
7-.
.
1937
-38.
. ---
----
----
----
----
- --
193
8-3
9...
1939
-40
194
0-4
1. .-
- - . ..
1941
-42
1942
-43.
_
1943-4
4...
1944
-45
1945
-46
1946-4
7....
1947-4
8... ...
1948
-49.
.
1949
-50
. -
1950-5
1..... .
.. --------- -
-.-_
__
1951
-62.
.
1952
-53.
. ------- . -
1953-64...
-
Oct
. .04
.87
i dn .08
2.02
2.28
1.02 .22
1.06
2.18 .5
21.
821.
531.
23 .68
2.45
2.91 .28
5.28 .85
.02
3.46
2.68 .0
81.
31
1.53
Nov
.
0 1.40
2.27
1.69
0 5.19
1.47 .02
7.47
2.22 .46
2.59
2.98
5.75
1.16
5.90
4.23
4.08
1.55
1.87
2.12
7.19
6.26
2.73
4.64
3.32
Dec
.
12.4
7.6
211
.29
4.06
8.14
3.45
3.09
2.90
5.40
2.14
2.88
13.5
69.
125.
802.
384.
2210
.37
3.66
1.22
4.67
2.79
9.38
8.01
14.7
2.9
6
5.58
Jan. 5.
406.
523.
456.
401.
757.
367.
774.
924.
773.
3610
.87
11.0
26.
509.
285.
073.
132.
32 .76
4.18
1.39
10.1
25.
1410
.19
6.74
7.80
6.16
Feb
.
3.91
1.87
1.49
1.51
4.69
3.50
11.8
18.
599.
661.
6112
.31
8.22
8.65
2.73
7.66
4.92
2.98
3.82
1.51
3.32
5.15
2.84
2.88 .08
3.19
5.07
Mar
.
2.53
2.94
1.21
4.64
1.13
6.31
1.58
8.03
2.41
7.14
5.59
3.78
4.85
2.25
5.82
2.20
4.94
5.57
6.83
3.29
1.25
4.62
3.17
5.74
4.10
Apr
.
1.53 .49
1.43 .12
.73
6.87
1.86
1.87
2.45 .14
1.84
6.71
5.58
2.67
2.15 .33
.10
.65
7.61 .0
81.
311.
27 .84
3.91
3.23
1.98
May .6
2.9
01.
652.
231.
390 .6
1.1
9.0
6.1
21.
961.
841.
67 .05
1.58
1.39 .47
.40
1.03 .74
.56
1.48 .57
.57
.37
1.13
June 0 .6
70 T i
nn0 .8
01
280 T.0
7.3
0T T
.28
T 0 1.63 .25
0 .06
T 1.38 .97
.26
.30
July 0 0 T.0
20 0 T.0
5.0
20 0 0 .0
2.0
30 T.2
00 .0
6.0
50 0 .0
40 T
.04
Aug
.
0 0 0 0 T.1
2.0
30 0 0 0 T 0 0 0 0 0 0 T
.04
0 .01
0 .17
1.35 .04
Sep
t. .44
0 0 .17
.03
.23
0 T.3
8.0
8.5
0.1
3.1
5 0 .02
T.0
6T
.13
.02
0 .04
.05
0 T
.36
Ann
ual
26.9
416
.28
24.1
920
.92
20.8
835
.31
30.0
426
.35
39.3
014
.26
38.5
551
.78
39.9
832
.39
23.2
328
.16
25.8
420
.22
28.3
919
.86
25.4
232
.06
37.5
233
.14
28.8
5
29.6
129
.22
i Alt
itud
e, 1
67 fe
et.

GEOGRAPHY 15
represent only small parts of the area investigated. However, records for these stations indicate more clearly than table 2 the range in the amount of rainfall over the area. Typically the range in rain fall within the Coast Ranges of northern California is large.
The data in tables 2 and 3 show that the rainfall is greater on bordering mountains than on the valley floors, increasing eastward and westward from the valley areas and also increasing northward within the Santa Rosa-Petaluma valley trough. No rainfall records are available for Rincon, Bennett, and Kenwood Valleys, east of Santa Rosa, but the annual average is probably somewhat greater than at Santa Rosa, and may be on the order of 35 inches. The in crease of rainfall northward is probably due, at least in part, to the general rise in altitude of the Coast Ranges from the bay northward. Much of the higher watershed receives considerably more rainfall than the lower, areas, and runoff also is greater.
TABLE 2. Annual rainfall, in inches, at five stations in the Santa Rosa and PetalumaValley areas, California
[Data from publications of the U. S. Weather Bureau, except for Lakeville]
Water year *
1874 1874-76 1875-76 1876-77 1877-78 1878-79 1879-80 1880-81 1881-82 1882-83 1883-84 1884-86 1885-86 . 1886-87 1887-88 1888-89 1889-90 .-1890-91 1801-92 -. - . 1892-93 1893-941894-96 1895-96 .1896-97---.--- _ 1897-381898-99 . .1900 1900-O1 1901-021902-03- __ - _ . _1903-041904-06 1905-06 1906-07 1907-08 . 1908-09 .1909-10.. 1910-11 . .1911-12 1912-13 1913-14.- - .
Healdsburg (altitude, 110 feet)
68.2741.6045.1145.9430.8539.2730.8915.3554.0529.8235.4836.2872.6532.0938.4955.0036.6361.5345.0638.9123.9729.5941.7540.6351.3139.1767.7048.5052.2154.3928.9062.3428.9332.8628.3026.7260.42
Graton (altitude, 190 feet)
39.8725.6522.6240.8342.2146.6042.4267.8643.8949.5047.4929.0659.8835.2936.7327.4329.4061.88
Santa Rosa (altitude, 167 feet)
23.1666.2621.4629.4130.7628.3745.0026.1829.6623.1623.6829.2231.6832.7629.2148.5031.6033.3434.7420.4940.0227.7229.5321.4321.0942.83
Petaluma (altitude,
10 feet)
26.2018.1825.5913.8539.4021.3925.0024.8517.0918.6424.4914.9228.9417.0818.6623.1946.0818.4419.43
23.6429.82
41.20
Lakvffle, Sleepy Hol low Dairy * (altitude,
75 feet)
See footnotes at end of table.

16 GROUND WATER INT SANTA ROSA AND PETALUMA VAT/LEYS
TABLE 2. Annual rainfall, in inches, at five stations in the Santa Rosa and Petaluma Valley areas, California Continued
[Data from publications of the U. S. Weather Bureau, except for Lakeville]
Water year '
1914-15 -.. 1916-16 1916-17 1917-18 1918-19 1919-20 1920-21 1921-22 1922-23 _ 1923-24 1925 1925-26 1926-27 1927-28 1928-29 ..- _ . ___ . 1929-30 1930-31 1931-32- .1932-33 1933-34 1934-36 1935-36 ___ ..... . ....1936-37 _ 1937-38 1938-39 1939-40 _1940-41. _ 1941-42 1942-43 1943-^4. __ .. 1944-45 1946-46 1946-47- _ 1947-48 . 1948-49 1950. __ .1950-51 1951-52
Healdsburg (altitude, 110 feet)
56.7846.2025.8225.1932.1118.8255.549ft QO
32.0415.3750.2734.8751.3036.1524.3338.8123.6730.3626.6731.1945.5637.4433.9356.0919.2757.0572.1954.8738.4731.8334.5937.5425.8236.1128.0430.1040.0852.82
'40.3738.37
Graton (altitude, 190 feet)
54.7844.9331.0028.3235.0723.3151.2328.3538.7218.0455.2134.3053.7336.1227.0136.5122.7329.1525.9228.6243.6043.3338.2158.1821.8352.5770.5651.9241.1234.0138.9437.1226.0035.2231.1935.2046.4757.65
439.5539.39
Santa Rosa (altitude, 167 feet)
42.4932.8321.5220.4025.2412.8335.6923.8429.9113.9442.3931.2742.6828.9019.2326.9416.2824.1920.9220.8835.3130.0426.3539.3014.2638.5551.7839.9832.3923.2328.1625.8420.2228.3919.8625.4232.0637.52
S29.5628.60
Petaluma (altitude,
10 feet)
36.5130.2917.1915.0821.0511.5828.0018.6924.7510.76
26r26
21.5216.2818.4714.9222.6017.1718.0227.6824.9524.7033.9813.2130.9845.6932.5024.9321.0022.8525.2316.6119.0317.6220.6026.4330.31
«23.7823.89
Lakville, Sleepy Hol low Dairy 2 (altitude,
75 feet)
15.5512.7520.4613.0615.7721.7419.3920.1732.8611.3226.6838.0632.6222.7219.6819.6722.7616.0114.1617.0016.9724.1027.75
'20.9220.92
1 A water year begins on October 1 of any designated year and ends on September 30 of the succeeding year.2 Private record supplied by M. S. Herzog of the S. K. Herzog Co.s 74-year average.4 56-year average.6 64-year average.6 60-year average.1 23-year average.
TABLE 3. Data for additional precipitation stations in and near the Santa Rosa and Petaluma Valley areas, California
StationDistance (miles) and
direction from Santa Rosa
21 WNW _ 16WNW- 29SSE 13NNW 18 S ... ..... . 13WSW 14SSW -7WSW . -
Altitude (feet)
1,040115 276
3501,000
27175
1952 annual 1 rainfall (inches)
94.7464.4432.9847.15
70.56
Length of record, as
of 1952 (years)
13131978
139
16
[ Weather Bureau averages for climatic year July 1-6 June 30.

GEOGRAPHY
CULTURE
17
Most of the population in the Santa Rosa and Petaluma Valley areas is rural. The following figures, taken largely from the 1950 census, show the distribution in 1950 and the percentage increase of population during- the period 1940-50 in Sonoma County and the Santa Rosa-Petaluma area.
TABLE 4. Distribution in 1950 and percent increase in population, 1940-50, in Sonoma County and the Santa Rosa and Petaluma Valley areas
Type of population
TJrban.... .!lL. .. . Rural L
Total .
Sonoma County
34, 076i 69, 329
103, 405
Percent Increase 1940-50
47.251.0
49.7
Santa Rosa and Petaluma Valley areas
30,818a.354,000
885,000
1 67 percent of total population. 2 64 percent of total population. 8 Estimated.
The principal urban areas of Sonoma County are Santa Rosa (1950 population, 17,902) and Petaluma (1950 population, 10,315) in Santa Rosa and Petaluma Valleys, respectively. The population of Santa Rosa is about one-half of the urban population of the county, and, together with that of Petaluma, constitutes four-fifths of the total urban population of the county. Sebastopol, the only other incor porated city within the area, had a population of 2,601 in 1950.
As suggested by the distribution of population (table 4), the economy of the area is predominantly agricultural. Among agricul tural products poultry and poultry products have led for a long time in total market value; they were followed in 1950 by dairy products, fruits and nuts, field crops, livestock, seed crops, and vegetable crops, in that order. Eggs are the leading commodity produced, followed by milk and dressed poultry. Apples and prunes are the leading fruits produced. Wine grapes are important, but are restricted chiefly to the hilly areas and to the northern part of the county. Hops are grown on the flood plains of Mark West and Santa Rosa Creeks and the Russian River. Leading annual crops are hay and oats. In 1941 dairy products ranked below fruit and nuts and live stock in value of production. By 1950 the value of dairy products had tripled, whereas the value of other products had increased only 150-200 percent of 1941 values. This increase was largely a result of the accelerated development of sprinkler-irrigated pastures, leading to increased production and higher-grade products. Potatoes were once a principal crop, and about 2,600 acres were grown in 1854. However, they have gradually been replaced by other crops.

18 GROUND WATER IN SANTA ROSA AND PETALUMA VALLEYS
Until the early 1950's, local industry was limited almost entirely to the processing of agricultural products, which included the packing and canning of orchard products, wine production, processing of poultry products, milk processing, and milling of livestock and poultry feeds. Newer important industries are the manufacture and remanufacture of lumber products, primary and fabricating metal work, and the manufacture of textiles, apparel, and machinery. The trend in industry and in population growth indicates an expansion that is closely related to the development of the water resources ofthe area.
HISTORY OF WATER USE
The development of ground water in the area began shortly before 1850, when settlement of the area began. Water for domestic and livestock supply was obtained largely from springs or shallow dug wells. Later wells were bored by hand tools or drilled by crude horse- or steam-powered rigs. The oldest bored or drilled wells canvassed during this investigation were constructed in rabout 1875. Most of the wells put down from 1900 to 1945 were drilled by cable- tool (percussion) methods. Since 1945 an increasing number of wells, especially irrigation wells, have been drilled by the rotary method.
Many dug wells remained in use until fairly recently. A well canvass made by the Bureau of Reclamation in the Santa Rosa area in 1940-41 revealed a large number of dug wells in use, and a few used dug wells were found by the Geological Survey during the 1949-51 canvass. These dug wells are not necessarily an indication of a shallow water table, as many of them were more than 30 feet deep. In the area west of Sebastopol a few dug wells as deep as 90 feet were still in use. Some springs are still being used in the area, several for irrigation.
In 1951 about 10,000 wells were in use, of which approximately 95 percent were used primarily for domestic purposes, indicating the large amount of ground water needed to support the large rural popu lation. Because of the intensive irrigation of gardens, lawns, and small pastures, and the large amounts of water consumed by animals, in addition to that reserved for domestic use, the use of water on a per-capita basis is greater in rural and suburban portions of the Santa Rosa and Petaluma Valley areas than in the urban portions and probably is much greater than the national average per-capita use, rural or urban.
In addition to being pumped for rural domestic use, ground water is also pumped for public-supply, irrigation, stock, dairy, orchard (spraying), industrial, and commercial uses. The chief industrial users are canneries, ice plants, breweries, wineries (for cooling),
HISTORY OF WATER USE 19
packing plants, and plants having air conditioning. Commercial use is restricted largely to swimming pools and bottling.
Municipal water-supply systems serve Santa Kosa, Sebastopol, Cotati, and Petaluma. All are publicly owned except that for Petaluma, which is owned and operated by the California Water Service Co. Several privately owned or community-owned systems are operated in the more densely settled suburban and rural areas, but probably each has less than 100 connections. Water is supplied to Sebastopol and Cotati exclusively by wells, and to Santa Rosa and Petaluma partly by wells and partly by surface-water diversion. Santa Rosa diverts water from Santa Rosa Creek into a surface reservoir to augment the supply from 6 wells in the mouth of Bennett Valley and from 2 at the south end of Rincon Valley. The Petaluma water system uses a surface reservoir in the Sonoma Mountains, northwest of the city, and stream diversions as the principal supply; supplemented by pumpage from wells. In years of deficient rainfall and runoff, wells become the principal source of supply. During the 1951 calendar year the city of Petaluma obtained 48 percent of its supply from ground water. In recent years considerable expansion of the water-supply systems for Petaluma and Santa Rosa has been necessary to keep pace with the population increases of 28 and 42 percent, respectively, during the period 1940-50.
Irrigation. Irrigation of land has developed largely since 1900. So far as is known, water was first obtained for irrigation from sumps or small reservoirs produced by damming small creeks or from low- flow diversions of the larger creeks. Gravity flood-irrigation was used at first; later low-lift pumps powered by internal-combustion engines were used in some instances. The 13th census (1910) listed 631 acres under irrigation on 38 farms in Sonoma County. Of this amount, 434 acres was irrigated from streams, 40 acres from springs, and 157 acres from 11 wells. Adams (1913) reported that 60 acres of 90,000 acres of "valley agricultural land" in Santa Rosa and Petaluma Valleys was under irrigation, 15 additional acres being irrigated in Kenwood Valley. Judging from these figures, it appears that only 4 or 5 irrigation wells were in use in the Santa Rosa and Petaluma Valleys by 1913. The remainder of the 11 irrigation wells reported in 1910 were probably located on the Russian River flood plain. There was some expansion of irrigation from wells during the 1930's, but the major development occurred from 1945 to 1950.
During the canvass of wells conducted by the Geological Survey in this investigation, 210 irrigation wells were located. Table 5 shows the areal distribution and the increase in number of irrigation wells in the area from 1940 through 1952.

20 GROUND WATER IN SANTA ROSA AND PETALUMA VAULTS
TABLE 5. Areal distribution of irrigation wells and development of irrigation byperiods *
Area
Bennett Valley . ........... .... __ .. __ .
Total . . . ...
Wells In use, 1940
28 2 1 3 1 9 0 0
44
New wells In use, 1941-50
73 1014 5
315
10 8 2
137
New wells in use, 1951
19 2 0 0 3 0 3 0
27
New wells In use, 1952 2
2 0 0 0
0 0 0
2
Total
122 14 15 8
19 19 11 2
210
' Only wells canvassed by Geological Survey are included.* Incomplete.3 Includes two wells in eastern part of Glen Ellen area not shown on map.
It is believed that the well canvass included all irrigation wells that were in use before and during 1951, except for a few small- capacity wells. Eight irrigations wells, in addition to the two can vassed, are known to have been put in use during 1952, and there were probably others. About 230 irrigation wells are estimated to have been put in use at the end of 1952. The period of greatest development, to date, was 1947 through 1950, when 113 irrigation wells were drilled, an average of more than 28 wells per year.
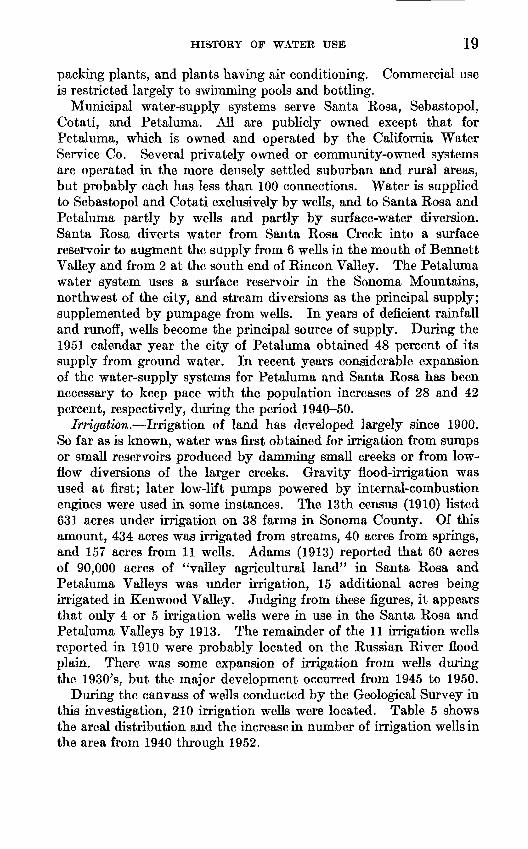
The 1939 Census ol Agriculture reported 4,195 acres under irrigation by both surface water and ground water in Sonoma County. A similar census in 1949 reported 9,285 acres irrigated on 348 farms, 3,995 acres on 210 farms being irrigated by sprinklers. Most of the increased acreage was probably in the Santa Rosa and Petaluma Valley areas. Figure 2 shows the irrigation pumpage for the years 1945-49 compared to the gross pumpage for the same period. It indicates that most of the increase in gross pumpage is attributable to the increase in irrigation.
The wells in use in the area in 1951 provided water for the irrigation of about 5,200 acres; most of this water was distributed by sprinkling systems. The approximate number of acres irrigated were as follows: For permanent pasture and hay, 3,800; hops, 900; alfalfa, 160; English walnuts, 100; garden truck, 90; seed, 65; prunes, 55; lawn (golf course), 25; nursery plants, 20; and orchard and pasture (com bined), 20. In some years of low rainfall small acreages on which other crops are grown, such as corn and potatoes, are irrigated. Permanent pasture has the highest water requirement of the irrigated crops. Because it is perennial, it is irrigated from the cessation of the spring rains until rainfall begins in the fall, generally a period of 5-6 months. Hops are irrigated once or twice in the early summer. The acreages on which they are grown are the only ones in this area
HISTORY OF WATER USE 21
15,000
I- 10.000UJ UJu.
UJo: o
5000
Gross pumpoge
Irrigation pumpage\Nj>? \\\\\\\\\\i\\\\\\\\^\\\ ///
FIGURE 2. Increase In irrigation and gross pumpage, 1945-49, Santa Rosa and Petaluma Valley areas,California.
which are flooded in general practice, although some sprinkler irriga tion is used. Alfalfa is irrigated in the same manner as permanent pasture. Walnuts are usually irrigated after seasons of deficient rainfall or early cessation of spring rains. Prunes are irrigated once or twice during the spring and again in the fall if rains are late,

22 GROUND WATER IN SANTA ROSA AND PETALUMA VALLEYS
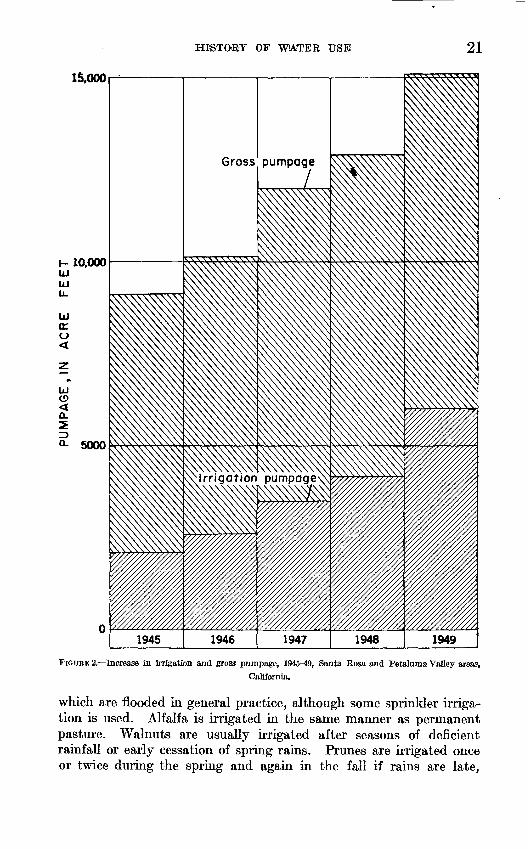
R.9W. R.7W.
Line of 200-foot depth to top of Merced formation; (used as boun dary of Laguna ground-water storage units)
Line showing depth, in feet to top of Sonoma volcanics
STORAGE UNITS IN SANTA ROSA VALLEY
Al, Windsor-Fulton unitA2, Santa Rosa unit
' A3, Cotati plain unitA4, Laguna unit
B, Bennett Valley unitC, Rincon Valley unitD, Kenwood Valley, north unitE, Kenwood Valley, south unit
PI, Upper Petaluma Valley unitP2, Penngrove unit
2 01,1,1_____I______
6 MilesI
FIGURE 3. Map showing ground-water storage units and pumpage areas, Santa Eosa and Petaluma Valleyareas, Sonoma County, Calif.
although some growers favor only the fall irrigation. Water require ments for seed culture depend upon the crop and season. Most seed crops are not irrigated at all. Nurseries and golf courses have a high water requirement. Irrigation of orchard acreages on which

GEOLOGY 23
cover crops have been planted for the dual purposes of preventing weed growth and soil erosion and providing forage for grazing in the summer is a new practice being tried in the Sebastopol area.
A small amount of surface water is used for irrigation along Mark West and Santa Rosa Creeks and near Laguna de Santa Rosa.
Since 1951 storage reservoirs have been built on small creeks in increasing numbers, many in cooperation with the Soil Conservation Service, to store winter runoff for irrigation or stock use and to prevent soil erosion.
In 1952 about 90-95 percent of the water used in the Santa Rosa and Petaluma Valley areas was ground water. Total water pumped from wells in 1949 amounted to about 15,000 acre-feet. The storage units and their areas and subdivisions are shown on figure 3.
GEOLOGY
PREVIOUS WORK
The chief contributors to the knowledge of the geology of the Santa Rosa and Petaluma Valley areas are Osmont (1905), Dicker-son (1922), Morse and Bailey (1935), Weaver (1949), Gealey (1950), Travis (1952), and F. A. Johnson.2 Osmont drew geologic sections across the Coast Ranges and subdivided the Sonoma volcanics. Dickerson mapped the Santa Rosa and Petaluma quadrangles and discussed the Petaluma and Merced formations, naming the former. Johnson made a comprehensive study ot the Merced formation. Morse and Bailey described the Petaluma formation and adjacent rocks and mapped an area northwest of Petaluma in detail. Weaver compiled the results of studies made by himself and others over the period 1903-35, including the geologic mapping of nine 15-minute quad rangles of which parts of three Santa Rosa, Petaluma, and Mare Island are included in the area of this report. Travis and Gealey mapped the Sebastopol and Healdsburg quadrangles, respectively. The work of all was used to some extent in this report, and the map ping of Weaver, Gealey, and Travis was used with some modification in preparing the geologic map (pi. 1).
DESCRIPTION AND GENERAL WATER-BEARING CHARACTER OFTHE ROCKS
GENERAL FEATURES
The valley areas are underlain by the alluvial deposits of gravel, sand, silt, and clay ranging in age from Pliocene to Recent. In Santa Rosa Valley the alluvium is interbedded with marine sediments.
* Johnson, F. A., Geology of the Merced, Pliocene, formation north of San Francisco Bay, Calif.: unpub lished dissert, for Ph. D., Calif. Univ., 1934.

24 GROUOT> WATER IN SANTA KCW3A AND PETALUMA VALLEYS
Underlying the valley fill are volcanic, continental, estuarine, and marine rocks ranging in age from Jurassic to Pliocene. Most of the area investigated is underlain by rocks that are water bearing to some extent, although the deposits beneath the valleys form the principal ground-water reservoirs.
For the purposes of this report the rock units in the Santa Rosa and Petaluma Valley areas are divided into three classes based largely upon their relative capacity to hold and to yield water. The con solidated rocks of Jurassic and Cretaceous age, which yield some water from joints and other fractures, and locally from poorly cemented beds, are the poorest water-yielding rocks. They include, in upward succession, the Franciscan group of Jurassic (?) and Cretaceous(?) age, the Knoxville formation of Late Jurassic age, and the Novato conglomerate of Cretaceous(?) age. On the geologic map (pi. 1) these rocks are shown as one unit (KJ). The sedimentary and volcanic rocks of Tertiary age include units which, though water bearing in part and important locally, do not form an appreciable portion of the ground-water reservoir. In upward succession the units are the Tolay volcanics of Morse and Bailey (1935), the Petaluma formation, and the Sonoma volcanics, all of Pliocene age. The Tertiary and Quarternary deposits that are uncon- solidated or poorly consolidated yield appreciable quantities of water to wells, and, therefore, have received the most critical study in this investigation. Included, in ascending order, are the Merced and Glen Ellen formations of Pliocene and Pleistocene age; the older alluvium, of Pleistocene age; and the younger alluvium, of Recent age.
The various stratigraphic units that were distinguished in this study, their general character, and their water-bearing properties are summarized in table 6, and their areal distribution is shown on plate 1. Stratigraphic relations, generalized lithology, and structure are shown on the cross sections (pis. 3, 4, 5, and figs. 4 and 5).
A peg model of Santa Rosa Valley was constructed to aid in the study of the subsurface geology. Logs of about 530 wells were re produced on quarter-inch dowels or pegs placed on a base map of the area (scale 1:20,000) which was affixed to a table. A color scheme was used to make each peg represent the generalized lithology pene trated by an individual well as reported by the driller's log. The vertical scale of the model is 1 inch equals 50 feet, and the horizontal scale is 1:20,000, so that the vertical exaggeration is 33K times.
So that most deep wells could be shown, sea-level datum was established 20 inches (or 1,000 feet) above the table. On each peg a 2-inch length was left above the top of the log (land surface) to allow space for numbering; thus the surface connecting the tops of the pegs represents the normal topography exaggerated 33 K times.

Qyo
l. Q
ool
HP
v%
://
Stru
ctur
e be
neat
h al
luvi
um a
nd S
onom
a Va
lanl
cs
is d
iagr
amm
atic
Loca
tion
of
sect
ion
show
n an
pl
ate
I 0
2 M
iles
Hor
izon
tal
SE
DIM
EN
TA
RY
R
OC
KS
Gra
vel a
nd c
lay
I sc
ale
exag
gera
ted
two
times
EX
PLA
NA
TIO
N
LIT
HO
LOG
IC
SY
MB
OLS
S
TR
AT
IGR
AP
HIC
S
YM
BO
LS
Qya
l You
nger
allu
vium
Qo
al O
lder
allu
vium
QT
m M
erce
d fo
rmat
ion
Tsv
Son
oma
votc
anic
s
Tp P
eta
lum
a fo
rmat
ion
VO
LCA
NIC
R
OC
KS
Lava
, an
desi
te,
hard
vo
lcan
ic r
ock,
roc
kK
Ju J
uras
sic
and
Cre
tace
ous
rock
s un
diffe
rent
iate
d
Volc
anic
ash
, as
h, s
oft
volc
anic
roc
k
Con
tact
, das
hed
whe
re a
ppro
xim
ate
Faul
t, sh
owin
g re
lativ
e m
ovem
ent
Sand
y clay
, silt
, soil
FIGT
TBE
4. G
eolo
gic
sect
ion
acro
ss P
etal
uma
Val
ley,
nea
r Pe
talu
ma,
Cal
if.to

TAB
LE 6
. St
rati
grap
hic
unit
s di
stin
guis
hed
in t
he S
anta
Ros
a an
d P
etal
uma
Val
ley
area
s, S
onom
a C
ount
y, C
alif
.
Geo
logi
c ag
e
Rec
ent.
Plei
stoc
ene.
Plei
stoc
ene
andP
lio-
ce
ne(?
).
Plei
stoc
ene
(?)
and
late
Plio
cene
.
Form
atio
ns a
nd
sym
bol o
n pl
ate
one
You
nger
al
luvi
um
(Qya
l).
Loc
al u
ncon
form
ity.
Ter
race
dep
osits
(Q
t)
and
olde
r al
luvi
um
(Qoa
l).
Ang
ular
unc
onfo
rmity
.
Gle
n E
llen
form
atio
n (Q
tge)
.
Mer
ced
form
atio
n
(QT
m).
Prev
ious
ly m
appe
d un
its
incl
uded
Allu
vium
and
you
nger
allu
vi
um o
f oth
ers.
Par
ts
of
youn
ger
allu
vium
an
d M
onte
zum
a fo
rmat
ion
of W
eave
r (1
949)
.
Incl
udes
Gle
n E
llen
form
atio
n of
Wea
ver
(194
9),
cont
inen
ta
l Mer
ced
of Jo
hnso
n (1
934)
, up
per
part
of
Sono
ma
grou
p of
Gea
ley
(195
0),
and
olde
r al
luvi
um o
f T
ravi
s.
(195
2)
Incl
udes
pa
rt
of
Sono
ma
grou
p of
Gea
ley
(195
0).
Thi
ckne
ss
(fee
t)
0-20
0±
0-20
0±
0-3,
000
0-2,
000±
Gen
eral
cha
ract
er
Stre
am-c
hann
el a
nd fl
ood-
plai
n de
posi
ts,
pred
omin
antl
y si
lt a
nd c
lay,
but
con
ta
inin
g sm
all,
disc
ontin
uous
gra
vel
lens
es,
exce
pt
bene
ath
the
Rus
sian
R
iver
pl
ain
whe
re
thic
k bo
dies
of
gr
avel
and
san
d ar
e en
coun
tere
d In
w
ells
.
Poor
ly s
orte
d fl
uvia
l de
posi
ts o
f gr
avel
, sa
nd,
silt
, an
d cl
ay;
unco
nsol
idat
ed
exce
pt
for
loca
l su
rfac
e in
dura
tion
. C
aps
stre
am-c
ut
terr
aces
(Q
t)
and
form
s el
evat
ed
allu
vial
de
posi
ts
at
valle
y m
argi
ns;
unde
rlie
s pa
rts
of
allu
vial
pla
ins.
Poor
ly s
orte
d le
ntic
ular
dep
osits
of s
ilty
cl
ay,
clay
ey g
rave
l, sa
nd,
and
grav
el.
Low
er p
art
tuff
aceo
us a
nd c
onta
ins
muc
h co
arse
con
glom
erat
e.
Rew
orke
d tu
ff b
eds
at b
ase.
C
onsi
dera
bly
de
form
ed
at
valle
y m
argi
ns.
Inte
r-
bedd
ed w
ith
Mer
ced
form
atio
n be
ne
ath
Sant
a R
osa
Val
ley.
Med
ium
- to
fi
ne-g
rain
ed
foss
ilife
rous
m
arin
e sa
nd,
sand
ston
e,
and
silt
y cl
ay,
wit
h m
inor
int
erbe
dded
gra
vel
and
pebb
ly b
eds;
gen
eral
ly f
airl
y w
ell
sort
ed; t
uffa
ceou
s In
par
t; in
terb
edde
d w
ith
Sono
ma
volc
anlc
s an
d G
len
Elle
n fo
rmat
ion.
Wat
er-b
eari
ng p
rope
rtie
s
Per
mea
bili
ty
gene
rally
low
(e
xcep
t in
R
ussi
an R
iver
val
ley)
; gr
eate
r th
ick
ne
ss o
f de
posi
ts a
bove
sat
urat
ed z
one;
lo
cally
con
trib
utes
sm
all
amou
nts
of
wat
er to
wel
ls ta
ppin
g ol
der f
orm
atio
ns.
Ter
race
de
posi
ts g
ener
ally
abo
ve
satu
ra
ted
zone
. O
lder
al
luvi
um
yiel
ds
smal
l to
mod
erat
e am
ount
s of
wat
er to
w
ells
fro
m g
rave
l an
d sa
nd;
wat
er o
f go
od q
uali
ty a
lthou
gh g
ener
ally
har
d.
Yie
lds
are
adeq
uate
for
dom
estic
wel
ls
over
m
ost
of e
xten
t. L
ocal
ly
yiel
ds
are
fair
to
good
for
irr
igat
ion
wel
ls.
Per
mea
bili
ty m
oder
atel
y lo
w i
n S
anta
R
osa
Val
ley;
ver
y lo
w o
n va
lley
side
s an
d In
K
enw
ood-
Gle
n E
llen
area
s.
Qua
lity
of w
ater
goo
d ex
cept
for
loc
al
high
bor
on c
onte
nt.
Upp
er
part
of
form
atio
n yi
elds
wat
er
free
ly t
o w
ells
and
is
tapp
ed b
y m
ost
irri
gatio
n or
oth
er d
eep
wel
ls o
n w
est
side
of
S
anta
R
osa
and
Pet
alum
a V
alle
ys .
Low
er p
art o
f for
mat
ion
mor
e co
mpa
ct a
nd s
omew
hat
cem
ente
d, b
ut
yiel
ds a
dequ
ate
dom
estic
sup
plie
s to
w
ells
wes
t of S
anta
Ros
a V
alle
y.
Wit
h G
len
Elle
n fo
rmat
ion
form
s pr
inci
pal
aqui
fer
In S
anta
Ros
a V
alle
y.
Qua
lity
of
wat
er g
ener
ally
goo
d.
to $

Lat
e an
d m
iddl
e Pl
ioce
ne.
Mid
dle
or e
arly
Plio
ce
ne.
Ear
ly
Plio
cene
or
m
iddl
e.
Cre
tace
ous (
?)
and
Jura
ssic
.
Sonom
a volc
anic
s (T
Sv).
Ang
ular
unc
onfo
rmity
.
Pet
alum
a fo
rmat
ion
(Tp)
.
Tol
ay
volc
anic
s of
M
orse
an
d B
aile
y (1
935)
(no
t exp
osed
). A
ngul
ar u
ncon
form
ity.
Jura
ssic
an
d C
reta
ce
ous r
ocks
und
iffe
r-
enti
ated
(K
J).
Low
er p
art
of S
onom
a gr
oup
of O
eale
y (1
960)
.
Ori
nda
form
atio
n of
Joh
nson
(1
934)
.
Fran
cisc
an
form
atio
n F
ran-
ci
scan
-Kno
xvill
e gr
oup
of
Tal
iafe
rro
(194
3b),
Kno
x-
ville
form
atio
n, N
ovat
o co
n
glom
erat
e.
0-2,
000(
7)
0-4,
000
4,00
0+
7,00
0+
Inte
rbed
ded
lava
flo
ws,
tuf
f, t
uff
brec
ci
a,
and
aggl
omer
ate;
sa
nd,
grav
el,
and
cong
lom
erat
e of
vol
cani
c or
igin
, an
d re
wor
ked
tuff
.
Con
tine
ntal
an
d br
acki
sh-w
ater
cl
ay,
shal
e, s
and,
and
san
dsto
ne,
and
som
e co
nglo
mer
ate
and
nodu
lar
limes
tone
; ge
nera
lly f
ine
grai
ned
and
som
ewha
t co
mpa
cted
or
cem
ente
d.
Vol
cani
c ro
cks
not
expo
sed
to a
rea
of
plat
e 2
but
pres
ence
kno
wn
from
oil
test
s.
Con
solid
ated
sa
ndst
one,
sh
ale,
ch
ert,
and
cong
lom
erat
e, a
nd m
etam
orph
ic
and
igne
ous
rock
s.
Mor
e pe
rmea
ble
rock
s of
un
it
yiel
d m
oder
ate
amou
nts
of w
ater
to
wel
ls.
Loc
ally
, exc
elle
nt y
ield
s ob
tain
ed f
rom
tu
ffs.
D
ense
r vo
lcan
ics
may
yi
eld
quan
titi
es s
uffi
cien
t fo
r do
mes
tic s
up
plie
s fr
om
frac
ture
s or
fl
ow-c
onta
ct
zone
s.
Qua
lity
of
w
ater
ge
nera
lly
exce
llent
.
Yie
lds
mod
erat
e qu
anti
ties
of
wat
er t
o w
ells
whe
re a
ppre
ciab
le t
hick
ness
of
sand
s pe
netr
ated
. Q
uali
ty
of
wat
er
poor
in
plac
es b
ecau
se o
f hi
gh s
odiu
m,
chlo
ride
, and
sul
fate
.
Not
kno
wn
to b
e pe
netr
ated
by
wat
er
wel
ls.
Impe
rmea
ble
and
gene
rally
not
w
ater
be
arin
g; lo
cally
sm
all s
uppl
ies
obta
ined
fr
om
frac
ture
s or
po
orly
ce
men
ted
sand
ston
e an
d co
nglo
mer
ate.
Q
uali
ty
of w
ater
ran
ges
wid
ely;
dis
solv
ed s
olid
s m
ay b
e hi
gh.
to

500-
Sea
leve
l -
500'
- 10
00'-
2000
'-
EXPL
ANAT
ION
LIT
HO
LO
GIC
S
YM
BO
LS
SE
DIM
EN
TA
RY
R
OC
KS
to 00
Sand
y cl
ay a
nd g
rave
l Sa
ndy
clay
, silt
, soi
l
Clay
g3
5^^&
Kv
^?>
''5g
'v<
8-.
-.^->
TJ
^^^^^^
VO
LC
AN
IC
RO
CK
S
Lava
, and
esite
, ha
rd
volc
anic
roc
k, r
ock
la a
o »
i>|
t
6 4
-a
V
J[A
a o
a <
<
Volc
anic
ash
, as
h, s
oft
volc
anic
roc
k
ST
RA
TIG
RA
PH
IC
SY
MB
OLS
Qya
l Yo
un
ger
allu
vium
Qo
al O
lder
allu
vium
QT
ge
Gle
n E
llen
.form
atio
n
Tsv
So
no
ma
volc
anic
s
Con
tact
Faul
t, sh
owin
g re
lativ
e m
ovem
ent
IMile
FIG
UEE
5. G
eolo
gic
sect
ion
acro
ss K
enw
ood
Val
ley
(E-E
1) an
d th
e G
len
Elle
n ar
ea,
Cal
iforn
ia (
alon
g lin
es E
-E' a
nd F
-F',
resp
ectiv
ely,
of p
late
1).
I

GEOLOGY 29
The model shows the change from marine (Merced) sand to continen tal (Glen ElJen) deposition from west to east and in places indicates the interfingering relations of the two formations. It was useful in laying out geologic cross sections and in considering local problems. Because of the lack of marker beds that could be correlated definitely from well to well, the details of subsurface structure could not be worked out on the peg model.
CONSOLIDATED ROCKS OF JURASSIC AND CRETACEOUS (?) AGE
FRANCISCAN GROUP
General features. The basement complex of the area is formed by the Franciscan group of rocks of Late (?) Jurassic and Cretacous age. The name was given by Lawson (1895, p. 347) to a series of sandstones, cherts, and limestones exposed on the San Francisco peninsula. They are described in detail by Lawson (1914, p. 4-7) in the San Francisco folio and by Taliaferro (1943b, p. 109-219). More recently these rocks have been described within the area of this investigation by Weaver (1949, p. 19-28), Gealey (1950), and Travis (1952). These rocks have been treated in the literature as both a formation and a group. Because of the proximity of the area covered by this report to areas where the rocks have been subdivided, the group term is used here.
The Franciscan group consists of a series of sedimentary, meta- morphic, and igneous rocks having a maximum thickness of possibly 40,000 feet or more. Weaver (1949, p. 20) reports 10,000 feet of sandstone of the Franciscan exposed west of Petaluma Valley; Travis (1952, p. 11) reports 7,000 feet of unrepeated beds of the Franciscan and Knoxville exposed; and Gealey (1950, p. 13) gives an indicated exposed thickness of 16,000 feet of the Franciscan in the Healdsburg quadrangle. In the area of the present report the sedimentary rocks are most abundant and are composed predominantly of massive arkosic sandstone, but include some shale, foraminiferal limestone, radolarian chert, and conglomerate. Although most of the rocks are fine grained, a cobble conglomerate was noted along San Antonio Creek, several hundred yards west of U. S. Highway 101 in 4/7-14.
The base of the Franciscan group is not exposed in the area. How ever, to the west on the Point Reyes peninsula, the group is in fault contact with crystalline rocks of Paleozoic(?) age. Overlying the Franciscan in places is the Knoxville formation of Late Jurassic age. The base of the Knoxville is not exposed, but Gealey (1950, p. 19) in mapping the Healdsburg quadrangle considered the contact as "probably gradational." Between Petaluma and Novato Valleys, Weaver, (.1949, p. 46) found the Franciscan in contact with conglomer ate which he calls Cretaceous(?), but he does not describe the nature
30 GROUND WATER Iff SANTA ROSA AND PETALUMA VALLEYS
of the contact. Unconformably overlying the Franciscan at various places are the Petaluma and Merced formations, the Sonoma volcanics, and alluvium.
No distinctive fossils have been found in rocks at the type section, and the age assigned to the Franciscan group has remained somewhat unsettled, generally being given as Late Jurassic(?). Taliaferro (1943b) considered the age as middle Upper Jurassic, on the basis of fossils and field relationship to the Knoxville formation of Late Jurassic age. Recently published reports however, suggests that the Franciscan is in part of Cretaceous age (Schlocker, Bonilla, and Imlay, 1954; Church, 1952; Cushman and Todd, 1948). It seems probable that the age of the Franciscan differs from place to place and that it includes rocks of both Jurassic and Cretaceous ages.
The Franciscan group underlies essentially the entire area, and surface exposures in and near the area are widespread. It crops out intermittently to the west in places where the overlying Merced formation has been eroded away, and is exposed west of the Russian River. Immediately northeast of the area it forms the core of the Mayacmas Mountains. South of Petaluma, the Franciscan bounds the western side of the valley and crops out along the crest of the ridge on the eastern side. East of Petaluma it is uplifted by the Tolay fault.
The rocks of the Franciscan group consist largely of clastic and chem ical sediments of marine origin and are intercalated with pillow basalts and more basic igneous rocks. Some metamorphic rocks are associated with the group, namely, serpentine, glaucophane and related schists, greenstone, and silica-carbonate rock. In the upper part the rocks are considerably finer grained in general than those composing the lower part, shales and lenses of radiolarian chert predominating. The lower part is comprised primarily of massive arkosic sandstone and mudstone.
Drillers have little difficulty in recognizing the Franciscan group, especially when the hard sandstones or metamorphic rocks are en countered. They commonly log the Franciscan as "serpentine," and sometimes as "shale," though the latter term, or both, may sometimes indicate the Knoxville formation.
The Franciscan group is intensely folded and faulted, and in many places there are zones of shearing and crushing. No attempt was made to map the complex structure in the Franciscan group.
Water-bearing properties. Rocks of the Franciscan group are so well consolidated that they are considered to be essentially not water bearing. Locally, however, small supplies of water sufficient for do mestic or stock use have been developed where coarse-grained, poorly cemented zones or fracture systems have been penetrated. The log of

GEOLOGY 31
well 5/7-33Q1,3 which penetrates the Franciscan group, shows 5 feet of water-bearing cemented "gravel." (See table 27.) Generally, drilling is stopped when the Franciscan is recognized at depth, unless there are indications that fractured zones are present or unless a premium is placed on obtaining even an extremely small yield.
KKOXVHIE FORMATION
The Knoxville formation as referred to here is the Knoxville stage of the Franciscan-Knoxville group of Taliaferro (1943a). The formation was named by White (1885) for exposures at Knoxville, Napa County. As defined by White, the formation includes about 20,000 feet of marine elastics, largely sandstone and shale, in the lower part of the Shasta series. He assigned it to the Lower Cretaceous epoch. As redefined by Taliaferro, the Knoxville is restricted to the Upper Juras sic and includes a maximum thickness of about 12,000 feet of domi- nantly fine-grained elastics, largely shale, interbedded with thin strata of siltstone and containing small lenses of sandstone and limestone. Thin flows of pillow basalt and beds of impure chert are found in the lower part of the formation. Recently published evidence indicates that the Knoxville is probably of Jurassic (?) and Cretaceous age (p. 30).
In the area of this report the Knoxville appears to grade upward from the underlying Franciscan group without evidence of a marked contact. For this reason Taliaferro has used the term Franciscan- Knoxville group. Taliaferro differentiated the two formations in the field by the predominantly fine-grained character of the Knoxville rocks as compared to the coarser Franciscan, The Knoxville is over lain unconformably by the Sonoma volcanics, Merced and Glen Ellen formations, and alluvium.
The distribution of the Knoxville formation is not indicated on plate 1 but probably is limited to the northern part of the mapped area of the Franciscan and Knoxville. The water-bearing character of the Knox ville is similar to that of the Franciscan.
NOVATO CONGLOMERATE
The name Novato conglomerate was given by Weaver (1949, p. 46) to beds exposed over an area of about 3% square miles on the west side of Petaluma Creek just upstream from the mouth. Good exposures occur along State Highway 37 near Black Point, about 3 miles east of Novato. There the Novato is composed of poorly consolidated well- rounded cemented pebbles and cobbles which in places grade into grit or coarse sandstone.
* For a description of the well-numbering system, see pp. (r-7.

32 GROUND WATER IN SANTA ROSA AND PETALUMA VALOEYS
The Novato is surrounded by alluvium except on the west side in 3/6-5 and 8 where it is reported by Weaver (1949) to rest on the Fran ciscan group and to be in fault contact with the Sonoma volcanics. Weaver tentatively assigned the Novato conglomerate to the Cretace ous system because of its resemblance to conglomerate in the Chico formation farther east. Similar conglomerate, considered to be of Cretaceous age by Gealey (1950), occurs just north of the area on the west side of Alexander Valley.
The Novato conglomerate is fairly well consolidated but locally is poorly cemented and friable. It is cut by numerous joints and veinlets that contain secondary deposits, probably of calcium carbonate, which would tend to reduce the movement of ground water. Nothing is known of wells that may penetrate the Novato conglomerate, but lo cally small yields might be obtained from it.
SEDIMENTARY AND VOLCANIC ROCKS OP TERTIARY AGE
TOIAY VOICANICS OF MORSE AND BATT.EY (1935)
Morse and Bailey (1935, p. 1441) gave the name Tolay volcanics to a thick series of lava flows, breccia, tuff, and agglomerate encountered in a core hole drilled in the Petaluma oil district (in 5/6-30). They report that 4,162 feet of these rocks were logged without penetrating the entire thickness. They also reported an outcrop of the Tolay volcanics in a small area west of Tolay Creek near Lakeville School. Weaver (1949), who apparently questioned their mapping, mapped these exposed beds as part of the Sonoma volcanics and his mapping is followed in this report. He indicated (1944, p. 588) that the Tolay was not exposed at the surface but occurred at depths of 2,223-5,964 feet in a well on Adobe Creek. These rocks do not influence the occurrence of ground water in the area and they are mentioned only to show the position they occupy in the stratigraphic sequence.
Morse and Bailey considered the Tolay volcanics to be of early Pliocene age. However, inasmuch as the uppermost strata of the Tolay are interbedded with the lowermost beds of the overlying Petaluma formation, now believed to be of middle or late Pliocene age, the Tolay volcanics are probably of middle Pliocene age.
PETAIUMA FORMATION
The Petaluma formation is composed of strongly folded continental and brackish-water clay, shale, sand, and sandstone, and contains some conglomerate and nodular limestone. The formation is uncon- fonnably overlain by the Sonoma volcanics, Merced formation, and alluvium. Morse and Bailey (1935, p. 1441) reported the Petaluma to be conformably underlain by the Tolay volcanics at one place. The Petaluma may be in depositional contact with the Franciscan

GEOLOGY 33
group, but only fault contacts have been mapped. In general, the Petaluma formation is a distinct lithologic unit, although some of the thicker sands appear to be similar to those of the overlying Merced formation.
Age and areal distribution. Dickerson (1922, p. 540-543) named the formation from exposures northeast of Petaluma, assigned it to the upper Miocene on the basis of brackish- and fresh-water mollusks, and considered it to be a phase of the marine San Pablo formation. Previously, Osmont (1905, p. 57) had assigned these beds to the Pliocene on the basis of a horse tooth from the uppermost beds, im mediately below the Sonoma volcanics. These same beds were con sidered by Dickerson to belong in the Sonoma volcanics. Morse and Bailey (1935) supported Osmont's correlation and found two addi tional horse teeth which Stock (oral communication in Morse and Bailey, 1935) regarded as indicative of a Pliocene age. Stirton (1939, p. 393) concluded, further, that the tooth of a horse identified as Neohipparion gidleyi Merriam from the Petaluma formation could be no older than late middle or early late Pliocene. Johnson 4 and Morse and Bailey (1935, p. 1447-1449) correlated the Petaluma with the Orinda formation, which is exposed across San Pablo Bay to the southeast. Most workers have noted a marked lithologic similarity between the Petaluma and the Orinda, but Stirton (1952, p. 2013) believes that this does not necessarily reflect an identical age but is to be expected, because they occupy the same structural trough. The flora of the Petaluma formation is considered by Axelrod (1944, p. 186-187) to be not older than middle Pliocene.
Exposures of the Petaluma formation are largely confined to a belt 1-2 miles wide along the southwestern flank of the Sonoma Mountains, extending from north of Penngrove to near the mouth of Tolay Creek. In that belt the formation is closely folded into a series of narrow anticlines and synclines and is cut by numerous faults. Small exposures occur about 3 miles west and about 3% miles northeast of Cotati. Weaver (1949) mapped about 5 square miles of the Petaluma formation near the head of Bennett Valley, and his mapping is followed on plate 1. That area was not studied in detail for this report, but data from well logs and brief surface reconnaissance suggests that the Glen Ellen formation crops out and overlies the Sonoma volcanics in the eastern part, and that a structural discontinuity exists between that area and the exposures of the Petaluma in the western part.
Thickness and origin. In the Petaluma Valley the thickness of exposed beds of the Petaluma formation probably exceeds 3,000 feet. Morse and Bailey (1935, p. 1444) estimated a total thickness of more
4 Johnson, F. A., 1934. (See footnote, p 23.)

34 GROUND WATER IN SANTA ROSA AND PETALUMA VALI/ETB
than 4,000 feet, which they subdivided into two units: their upper Petaluma formation, of fluviatile or lacustrine origin, consists of poorly stratified gray-green clay containing thick lenses of poorly sorted sand and gravel and is as much as 4,000 feet thick. The lower Petaluma, which is 500-600 feet thick, contains beds of estuarine origin consisting of dark laminated clay shale and thin sand inter- bedded locally with thin beds of limestone. The contact between the two units is gradational. Morse and Bailey report that the basal part of the Petaluma contains a transition zone of alternating beds of volcanic rock and shale which grade downward into the Tolay volcanics.
Lithology and subsurface distribution. Dickerson noted (1922, p. 540) that the Petaluma formation is characterized by a great abun dance of clay, and this observation seems to be supported by evidence from exposures and well logs. A stratigraphic section measured by Weaver (1949, p. 86-87), consisting of 1,059 feet of beds in the lower part of the so-called upper Petaluma unit near Lakeville, contained about 70 percent clay, shale, and clayey or shaly beds; 25 percent sandstone; and 5 percent pebbly conglomerate. In the exposures visited during this investigation only a few gravel or conglomerate beds were observed. Those beds were compact, poorly consolidated, and composed largely of debris from the Franciscan group. The following section was measured in a road cut on Old Adobe road 0.4 mile southeast of Waugh School:
Section of upper part of Petaluma formation exposed in well 5(7-160Feet
Sandstone, medium-grained, yellow to gray___________ _______ 10Clay, yellow to white; contains large nodules and ledges of limestone___ 25 Sandstone, thinly crossbedded, friable, yellow to blue; contains thin pods of
argillaceous limestone-________________________________ 35Clay, silty; grades downward from clay at top to sandstone at base of
exposed section; contains large nodules and ledges of limestone._ ___. 24
94
Johnson 5 describes the clays of the Petaluma as "diseoidal," and that type of fracture appears to be a characteristic of the massive clay shales in the formation. The Petaluma formation, as exposed in a small branch of Gossage Creek which cuts across the Washoe anti cline about 2% miles west of Cotati, consists of dark-gray diseoidal clay shale and lighter fissile shale. Those beds are overlain by yellowish-brown silty sandstone and pebble conglomerate, having lower dips than the steeply dipping shales and differing in strike by 30-60 degrees, which strongly suggests an unconformity. On this
5 Johnson, F. A., 1934. (See footnote, p. 23.)
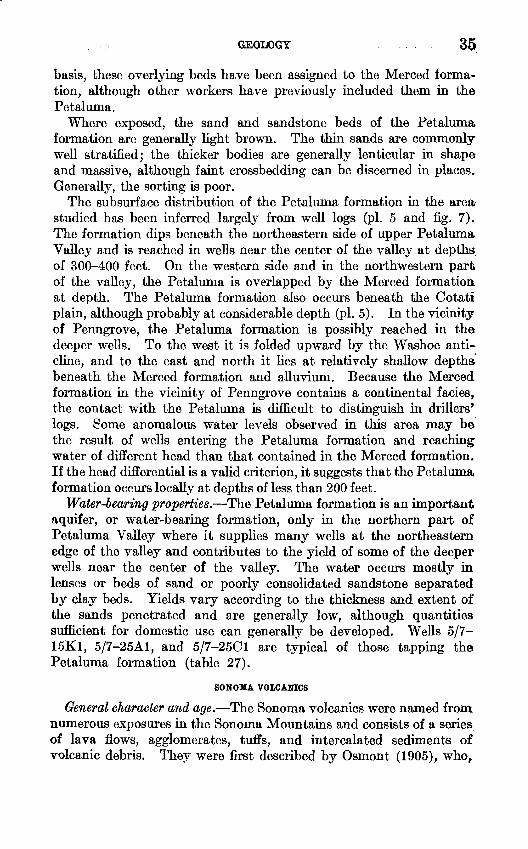
GEOIX)GY 35
basis, these overlying beds have been assigned to the Merced forma tion, although other workers have previously included them in the Petaluma.
Where exposed, the sand and sandstone beds of the Petaluma formation are generally light brown. The thin sands are commonly well stratified; the thicker bodies are generally lenticular in shape and massive, although faint crossbedding can be discerned in places. Generally, the sorting is poor.
The subsurface distribution of the Petaluma formation in the area studied has been inferred largely from well logs (pi. 5 and fig. 7). The formation dips beneath the northeastern side of upper Petaluma Valley and is reached in wells near the center of the valley at depths of 300-400 feet. On the western side and in the northwestern part of the valley, the Petaluma is overlapped by the Merced formation at depth. The Petaluma formation also occurs beneath the Cotati plain, although probably at considerable depth (pi. 5). In the vicinity of Penngrove, the Petaluma formation is possibly reached in the deeper wells. To the west it is folded upward by the Washoe anti cline, and to the east and north it lies at relatively shallow depths beneath the Merced formation and alluvium. Because the Merced formation in the vicinity of Penngrove contains a continental fades, the contact with the Petaluma is difficult to distinguish in drillers' logs. Some anomalous water levels observed in this area may be the result of wells entering the Petaluma formation and reaching water of different head than that contained in the Merced formation. If the head differential is a valid criterion, it suggests that the Petaluma formation occurs locally at depths of less than 200 feet.
Water-bearing properties. The Petaluma formation is an important aquifer, or water-bearing formation, only in the northern part of Petaluma Valley where it supplies many wells at the northeastern edge of the valley and contributes to the yield of some of the deeper wells near the center of the valley. The water occurs mostly in lenses or beds of sand or poorly consolidated sandstone separated by clay beds. Yields vary according to the thickness and extent of the sands penetrated and are generally low, although quantities sufficient for domestic use can generally be developed. Wells 5/7 15K1, 5/7-25A1, and 5/7-25C1 are typical of those tapping the Petaluma formation (table 27).
SONOMA VOLCANICS
General character and age. The Sonoma volcanics were named from, numerous exposures in the Sonoma Mountains and consists of a series of lava flows, agglomerates, tuffs, and intercalated sediments of volcanic debris. They were first described by Osmont (1905), who,

36 GROUND WATER IN SANTA ROSA AND FETALTJMA VALLEYS
regarding them as a group, subdivided them in ascending order into the Mark West andesite, Sonoma tuff, and St. Helena rhyolite. Dickerson (1922) also referred to the volcanic series as the Sonoma group, although he followed Weaver's then unpublished work in terming Osmont's subdivisions members. Morse and Bailey (1935), who first published the name Sonoma volcanics, considered the rocks as one formation, as did Weaver (1949). Detailed studies and de scriptions of the formation have been made by Weaver (1949) and in Sonoma and Napa Valleys by Kunkel and Upson (written communi cation, 1957).
The Sonoma volcanics accumulated over an area about 30 miles in east-west extent and about 40 miles in north-south extent. The sources apparently were numerous vents and fissures that intermit tently erupted material of variable chemical and lithologic composition during a long period, so that an extremely complex assemblage of flows, dikes, plugs, mudflows, breccias, pumice beds, and intercalated bodies of stratified material, essentially volcanic in composition but sedimentary in deposition, was formed. These rocks have been folded, faulted, and eroded so that they now form a series of elongate ridges separated by narrow alluvial valleys.
In places, especially in areas where the rocks include thin flows, stratified tuff, or rhyolite, regional structure is discernible in the Sonoma volcanics. However, intense faulting is common in the forma tion (pi. 6), as indicated by narrow, closely spaced folds, steeply dipping beds, overturned beds, and small structures. Thus observed attitudes are often misleading and determinations of regional structure difficult to make. The volcanic sequence generally differs considerably between adjacent areas because of the effects of diastrophism and of the inherent heterogeneity of the formation.
The Sonoma volcanics unconformably overlie the Petaluma forma tion and underlie the Merced formation; on the basis of its strati- graphic position, the formation is believed to be post-middle Pliocene in age and probably is late Pliocene. Additional evidence supporting this age assignment is provided by plant fossils found in diatomaceous deposits in the upper part of the Sonoma volcanics and identified by Axelrod (1944, 1950).
That deposition of the Merced formation began slightly before or near the beginning of Sonoma time is indicated by occurrences of basalt overlying sandstone of the Merced and the prominent tuff bed intercalated with sandstone near the base of the Merced. Thus, the lower part of the Merced is contemporaneous with part of the Sonoma volcanics. Possibly the Sonoma volcanism began first but did not extend into the area of Merced deposition until after the first sandstones were laid down.
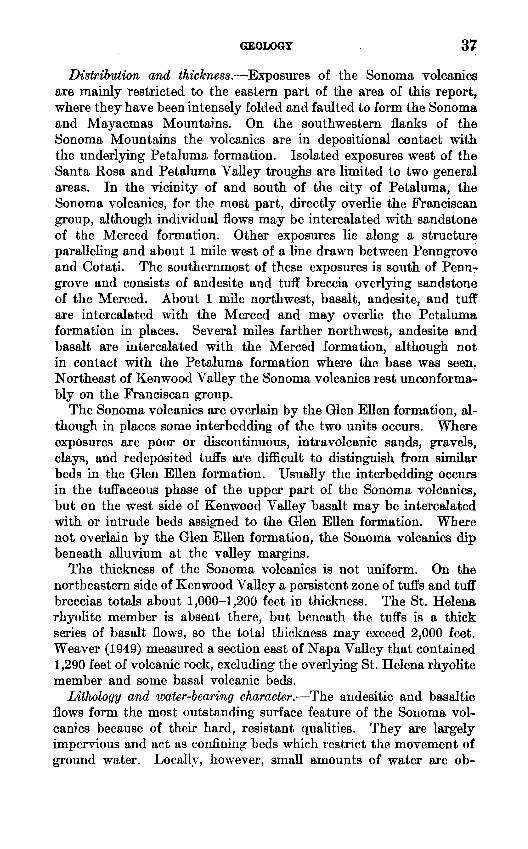
GEOLOGY 37
Distribution and thickness. Exposures of the Sonoma volcanics are mainly restricted to the eastern part of the area of this report, where they have been intensely folded and faulted to form the Sonoma and Mayacmas Mountains. On the southwestern flanks of the Sonoma Mountains the volcanics are in depositional contact with the underlying Petaluma formation. Isolated exposures west of the Santa Rosa and Petaluma Valley troughs are limited to two general areas. In the vicinity of and south of the city of Petaluma, the Sonoma volcanics, for the most part, directly overlie the Franciscan group, although individual flows may be intercalated with sandstone of the Merced formation. Other exposures lie along a structure paralleling and about 1 mile west of a line drawn between Penngrove and Cotati. The southernmost of these exposures is south of Penn grove and consists of andesite and tuff breccia overlying sandstone of the Merced. About 1 mile northwest, basalt, andesite, and tuff are intercalated with the Merced and may overlie the Petaluma formation in places. Several miles farther northwest, andesite and basalt are intercalated with the Merced formation, although not in contact with the Petaluma formation where the base was seen. Northeast of Kenwood Valley the Sonoma volcanics rest unconforma- bly on the Franciscan group.
The Sonoma volcanics are overlain by the Glen Ellen formation, al though in places some interbedding of the two units occurs. Where exposures are poor or discontinuous, intravolcanic sands, gravels, clays, and redeposited tuffs are difficult to distinguish from similar beds in the Glen Ellen formation. Usually the interbedding occurs in the tuffaceous phase of the upper part of the Sonoma volcanics, but on the west side of Kenwood Valley basalt may be intercalated with or intrude beds assigned to the Glen Ellen formation. Where not overlain by the Glen Ellen formation, the Sonoma volcanics dip beneath alluvium at the valley margins.
The thickness of the Sonoma volcanics is not uniform. On the northeastern side of Kenwood Valley a persistent zone of tuffs and tuff breccias totals about 1,000-1,200 feet in thickness. The St. Helena rhyolite member is absent there, but beneath the tuffs is a thick series of basalt flows, so the total thickness may exceed 2,000 feet. Weaver (1949) measured a section east of Napa Valley that contained 1,290 feet of volcanic rock, excluding the overlying St. Helena rhyolite member and some basal volcanic beds.
Lithology and water-bearing character. The andesitic and basaltic flows form the most outstanding surface feature of the Sonoma vol canics because of their hard, resistant qualities. They are largely impervious and act as confining beds which restrict the movement of ground water. Locally, however, small amounts of water are ob-

38 GROUND WATER IN SANTA EOSIA AND PETALUMA VAI&EYS
tained from fractures or scoriaceous zones and possibly larger amounts from clinkery or rubbly flow-contact zones. Some of the flow rocks exhibit well developed platy jointing or sheeting which apparently developed parallel to flow surfaces and which may, in places, supply fair yields to wells.
Pumice tuff, tuff breccia (pi. 6), and redeposited stratified tuff form a large part of the formation, are of chief importance in the occurrence of ground water in the Sonoma volcanics, and generally occur inter spersed with andesite and basalt flows. The water-yielding capacity of this type of material apparently is not uniform, being dependent on the size of the interstitial openings and on the amount of intercon nection as well as the degree of weathering. From drillers' logs and well samples it is inferred that the best yields are usually obtained from beds of coarse reworked tuff or volcanic ash. All wells in the Sonoma volcanics from which good yields are reported penetrate considerable thicknesses of tuff or tuffaceous material, generally called volcanic ash or ash by drillers.
Well 7/7-29D1 (see table 22) in Bennett Valley yields sufficient water to irrigate 70 acres of pasture and alfalfa. The well penetrated 130 feet of "gray ash," which the driller reported "appears to have had stream action," and which forms the chief aquifer. Also in Bennett Valley, well 7/7-32G1 has a natural artesian flow of 150 gpm from volcanic ash and basaltic tuff interbedded with basalt flows; and well 6/7-3Q1 is reported to yield 1,200-1,500 gpm, with a drawdown of about 50 feet, from gravel and white ash. The deeper wells in the city of Santa Rosa, situated in the mouth of Bennett Valley, probably obtain much of their water from Sonoma volcanics of this type. The subsurface character of the Sonoma volcanics in the mouth of Bennett Valley and the manner in which they interfinger with the Merced formation and continental deposits is shown by geologic section B-B' (pi. 6).
Other types of volcanic rock, such as agglomerate, scoria, rhyolite, perlite, welded tuff, and obsidian, as well as diatomite, are commonly encountered in wells and are largely not water bearing. Extensive beds of scoria, commonly called "sponge rock," may contribute moderate amounts of water to wells, and some agglomerate beds may supply small amounts.
TERTIARY AND QUATERNARY DEPOSITS
MERCED FORMATION
General character. The Merced formation is a marine deposit, locally fossiliferous, consisting chiefly of massive beds of fine sand and sandstone and thin interbeds of clay and silty clay, lenses of gravel, and pebble stringers. The lower part is tuffaceous and con tains one extensive stratum of pumiceous tuff. On the basis of fossils

GEOIXM3Y 39
collected from strata in this area, Dickerson (1922, p. 543-550) corre lated the strata with the Merced at the type locality, named by Lawson (1893, p. 142-149) from exposures near Lake Merced, on the San Francisco peninsula.
The most comprehensive study of the Merced to date was made by Johnson 6, who considered the sources of material and conditions of deposition. He concluded that the Merced was deposited in a semi circular subsiding embayment which corresponded in extent roughly to the present-day distribution of outcrops of the Merced. The main source of the material, Johnson concluded, was to the north, and from it a large south-flowing trunk stream carried detritus from the Fran ciscan group to the basin, where it was spread out by long-shore currents. Johnson believed that a "lagoonal barrier" an offshore bar seems to be implied largely prevented admixture of continental deposits from the east until it was eroded away after subsidence ended. Such a barrier was inferred to have been present somewhere near the present axis of Santa Rosa Valley. However, the field work and study of well logs suggests that a simple interfingering of marine with continental deposits occurred near the margin of the basin of deposition, rather than the effective separation of marine and conti nental deposits as suggested by Johnson. If such a barrier existed it must have disappeared long before the end of Merced time, judging from the thickness of the interbedded section.
Stratigraphy. Surface mapping by the Geological Survey on both the eastern (see p. 75) and western sides of Santa Rosa Valley and examination of logs of wells on the Santa Rosa plain show that marine strata of the Merced are interbedded with both the Sonoma volcanics and younger continental beds, which here are placed in the Glen Ellen formation (pis. 3 and 4). These continental beds were called "fresh water Merced" by Johnson 6 and were placed by Gealey (1950) in the upper part of his Sonoma group.
Beneath much of the area over which it occurs the Merced formation rests unconformably upon an irregular erosion surface cut on rocks of the Franciscan and Knoxville. In the western part of the area the Merced is in fault contact with the Franciscan and Knovxille in many places. At the south end of Santa Rosa Valley and in the north part of Petaluma Valley, the Merced formation overlies the Petaluma formation with marked angular unconformity. West of Petaluma Valley the Merced locally overlies basalt of the Sonoma volcanics; in at least one place, however, it underlies basalt.
At the northern edge of the area over which it occurs the Merced is overlain in places by terrace deposits of the Russian River. Where
(See footnote, p. 23.)

40 GBOTJND WATER IN SANTA EOSA AND PETALUMA VALLEYS
it dips beneath the valley areas it is overlain by younger or older alluvium, except in the northern part of the Santa Rosa Valley where it is overlapped by deposits assigned to the upper part of the Glen Ellen formation.
The Merced is a distinct stratigraphic unit, except in areas where it is believed to be interbedded with the Glen Ellen formation and Sonoma volcanics. Parts of the Petaluma formation are somewhat similar, but, in general, the Petaluma is darker and contains a much higher percentage of clay than the Merced. The Petaluma is usually more compact and thinly bedded. Because the Merced formation contains some material from the Sonoma volcanics, and the Petaluma is generally considered to consist chiefly of debris from the Franciscan, the absence of volcanic material has sometimes been taken to indicate Petaluma. However, the Petaluma does contain some material derived from the Tolay volcanics, at least in the basal part, and locally the Merced appears to consist solely of Franciscan debris; thus this criterion is of little use.
Interbedding of the lower part of the Merced with the Sonoma volcanics is exhibited on the western side of Petaluma Valley in the vicinity of Petaluma and near Burdell Mountain (Weaver, 1949; Dickerson, 1922). In the Washoe anticline on the southwestern flank of Santa Rosa Valley, basalt of the Sonoma volcanics is underlain and overlain by strata assigned to the Merced formation. There the un derlying beds include lenses of gravel and clay as well as beds of sand stone. On the eastern side of the valley, immediately north and south of the notch cut through the Sonoma Mountains by Santa Rosa Creek, beds probably belonging to the Merced formation are inter- bedded with strata lithologically similar to the Glen Ellen formation, and with the Sonoma volcanics. Well logs in this area definitely show interbedding of volcanics with sand and sandy clay containing "clam shells" which probably represent the Merced formation. The nonvolcanic deposits on the eastern side of the valley were all mapped as Glen Ellen because the separation of the Merced and Glen Ellen formations there is too intricate lo show at the mapping scale. John son found evidence of interfingering of marine and continental deposits near Penngrove. Although the deposits there were mapped by the present writer as the Merced formation, some wells penetrate beds not typically marine.
Age and correlative formations. The age determination of the Merced formation north of San Francisco Bay was first made from marine mollusks by Gabb (1869, p. 25), who identified them as Pliocene. Grant and Gale (1931, p. 61) considered the Merced fauna as middle Pliocene, and C. W. Merriam in a written communication

GEOLOGICAL SURVEY WATER-SUPPLY PAPER 1427 PLATE 6
NEARLY VERTICAL BEDS OF BASALTIC TUFF OF THE SONOMA VOLCANICS.

GEOLOGICAL SURVEY WATER-SUPPLY PAPER 1427 PLATE 7
FOSSILIFEROUS SANDSTONE OF THE MERCED FORMATION.

GEOIX)GY 41
to Johnson 7 considered the Merced fauna to be "not older than middle Pliocene."
Stirton (1939, 1952) redetermined the age of the underlying Peta- luma formation as late middle or early late Pliocene. If this deter mination is correct, the Merced formation, which rests with marked unconformity on the Petaluma, is not older than late Pliocene. The faunal assemblage of the Merced, as reviewed by Durham and Stirton (Stirton, 1952, p. 2014), is indicative of late Pliocene age. In general, Merced time is believed to span the time interval occupied by the Sonoma volcanics of Pliocene age and the Glen Ellen formation of Pliocene (?) and Pleistocene age. Evidence bearing on the relative ages of basal Merced and Sonoma is uncertain, but Glen Ellen deposi tion probably continued, overlapping Merced sediments, after the Merced sea retreated.
At the type locality on the San Francisco peninsula the Merced formation has been subdivided into two members: a lower member, considered to be of middle or late Pliocene age, and an upper member, considered to be of Pleistocene age (Schlocker, Julius, oral communica tion, 1951).
A factor bearing on the age determination of the Merced formation is the stratigraphic horizon exposed at the localities where the marine fossils have been collected and identified. At each of the localities the beds sampled appear to be within a few hundred feet of the base of the formation. Accordingly, because no fossils have been identi fied from beds near the top, the upper part of the Merced formation in this area, as on the San Francisco peninsula, may be considerably younger than the fossiliferous lower part. Fossils, collected from a new locality about 7 miles west-northwest of Santa Rosa on the Denner ranch, in an artificial channel dug as a distributary to Mark West Creek (7/9-10A), were identified by L. G. Hertlein of the California Academy of Sciences, who supplied the following faunal list and discussion (written communication, Oct. 7, 1954):
Pelecypoda GastropodaArea, trilineata Conrad Calicantharus fortis CarpenterCardium of. C. meekianum Gabb cf. C. angulatus ArnoldMacoma nasuta Conrad Nassarius moranianus MartinProtothaca staleyi Gabb Polinices lewisii GouldSiliqua cf. S, patula Dixon Thais emarginata ostrina Gould
This list contains nine species (five pelecypods and four gastropods) of which five are extinct and are not known to occur later than Upper Pliocene. The five extinct species and two others, Recent ones, occur in typical lower Merced beds along Seven Mile Beach near San Francisco. This portion of the Merced is generally considered to be of Middle or Upper Pliocene age.
' (See footnote, p. 23) p. 99,104. 443616 58 4

42 GROUND WATER IN SANTA ROSA AND PETALUMA VALILEYS
This locality may be considerably higher stratigraphically than other fossil localities of the formation but because of possible struc tural complications its stratigraphic position is uncertain.
Distribution and thickness. The Merced formation is exposed ex tensively in both the Santa Rosa and Petaluma Valley areas, mainly along the western side of the Santa Rosa-Petaluma Valley trough from Wilson Grove, on the Russian River, southward to Petaluma. The width of the outcrop ranges from about 1 mile to about 6 miles (west of Sebastopol). The Merced crops out westward as far as the coast in isolated bodies separated by large areas of the Franciscan and Knoxville. One small outcrop of the Merced occurs north of the Russian River at Rio Dell. On the geologic map the Merced is not shown on the eastern side of Santa Rosa Valley, although fossil- iferous beds were observed there. The formation extends eastward across the axis of the valley just north of Penngrove, and an isolated exposure south of Penngrove is separated from the main body by a tongue of alluvium. Exposures of the Merced are absent in the interval between the above-mentioned exposure and the lower part of Petaluma Valley, where it again crops out from the vicinity of Lakeville southward to the point where the Sonoma Mountains merge with the alluvial plain. The northwestern part of this latter exposure was called "upper Petaluma" by Morse and Bailey (1935); but Weaver (1949), whose mapping is followed here, mapped the area as the Merced formation. Woods 8 mapped the southward extension of these beds as the Merced formation and collected fossils which indicate a fairly late Pliocene age.
The subsurface distribution of the Merced formation has been determined from the study of well logs. In Santa Rosa Valley shallow wells immediately east and north of Laguna de Santa Rosa penetrate the formation, and deeper wells, 500-1,000 feet deep, encounter it at distances as great as 2 miles from the edge of the out crop. (The area in which the Merced formation is encountered at depths of 200 feet or less is shown on figure 3.) There the subsurface evidence indicates that the beds were gently downwarped and over lapped from the east by gravel and clay beds of the Glen Ellen forma tion. In Petaluma Valley the Merced is encountered at shallow depths in the extreme northern part and beneath the southwestern side of the alluvial plain as far south as Petaluma and at increasing depths toward the center of the valley. Because of the lack of good well logs, the relation of the Merced formation to the underlying Petaluma formation beneath the valley eastward from the south western part of upper Petaluma Valley is unclear. The thickness and
8 Woods, H. D., 1952, Geology of the Sears Point landslide, Sonoma County, Calif.: unpublished report submitted to fulfill requirements for graduate course, Univ. Southern Calif., 1952.

GEOLOGY 43
distribution of the Merced probably are affected by the Tolay fault, whose position beneath Petaluma Valley is not precisely known. In addition, as the area is near the postulated shoreline of the Merced «ea, facies changes also may complicate correlation. Such complica tion is indicated by logs of wells 5/7-28A3 and 5/7-28H1 (table 27), which show continental-type strata in an interval which probably represents the Merced formation. On the northwest side of the valley, between Lakeville and State Highway 37, the Merced is penetrated by wells for a considerable distance westward from the edge of the alluvial plain.
The Merced has been estimated to be less than 300 feet and as much as 1,500 feet thick. Weaver (1949, p. 92) reports the Merced as "usually less than 300 feet thick," and Johnson 9 from cross sec tions, inferred an original maximum thickness of 1,300 feet and con cluded "that the original maximum thickness was probably not more than 1,500 feet." On the basis of the persistent dip of the formation from the easternmost band of exposures of the Franciscan west of Sebastopol, the present writer estimates the thickness to be as much as 2,000 feet.
Another indication of maximum formation thickness is obtained from the log of oil-test well 7/9-24Jl, drilled in 1948, 2.6 miles north east of Sebastopol in Santa Kosa Valley (table 22). This well appears to penetrate marine deposits of the Merced from a depth of 195 feet to the bottom of the well at 2,075 feet, except for an interval of con tinental deposits between 615 and 826 feet. These continental de posits probably have a marine equivalent, so that the thickness of the Merced penetrated was 1,880 feet. Thus, a total thickness of 2,000 feet is probably a reasonable estimate for the Merced formation.
Lithology from surface exposures. The Merced formation is typically a fine- to very fine-grained soft sandstone, locally clayey or silty, but contains beds of medium- to coarse-grained standstone and local pebble trains. Travis (1952, p. 19) reports: "Mechanical analyses of five samples showed that 75 to 94 percent of the sand is composed of grains between 0.2 and 0.05 millimeter in diameter. Most of the remaining material is finer grained." The color is commonly yellow, gray, or reddish brown but may be nearly white. Beds are generally massive, although at places they exhibit faint crossbedding. The sandstones are fairly well sorted and grains generally are fairly well rounded. Clay or claystone and siltstone generally occur in thin beds interbedded with fine sandstone. Conglomeratic sandstone occurs near the base, where the pebbles are largely derived from the Fran ciscan group and near the top, where pebble stringers contain rocks typical of both the Franciscan and the Sonoma volcanics.
» P. 118. (See footnote, p. 23.)

44 GROUND WATER IN .SANTA ROSA AND PBTALUMA VALLEYS
The character of the upper part of the formation is illustrated by the beds exposed in the road cut on the north side of Guerneville Road immediately west of the bridge over Laguna de Santa Rosa (7/9-15). There yellow-to-red fine-grained soft sandstone is interbedded with coarse-grained sandstone and thin clay layers and contains scattered pebble stringers and occasional nodules of pumice. The clay appears to be composed largely of weathered volcanic ash. Many of the beds- exposed along the eastern edge of the outcrop area are tuffaceous. In some exposures in the vicinity of Cotati and Penngrove, the Merced contains a considerable amount of gravel derived from the Sonoma volcanics.
At the western edge of the area a prominent and persistent stratum of pumiceous tuff 10-20 feet thick is intercalated with the Merced formation about 200 feet above the base. This tuff crops out almost continuously for a distance of about 9 miles and terminates west of Sebastopol. A similar and probably equivalent bed, just north of Trenton, was placed by Gealey (1950) in his Sonoma group, although Travis (1952) considered it a member of the Merced formation. North of Mark West Creek the massive tuff thickens considerably and locally is well jointed. Travis (1952) estimated the thickness there to be 50 feet. While deepening well 8/9-34E1 the driller penetrated 44 feet of the tuff below the bottom of the existing well but did not reach the base of the stratum. The yield of the well was not in creased, indicating a very low permeability for the tuff. Therefore, it may act as an aquiclude that is, may retard the vertical movement of ground water and thus cause confined conditions where it is con tinuous for appreciable distances.
About 2 miles west of Cotati (in 6/8-3 3A) a branch of Washoe Creek parallels the local structure, exposing a pebble-gravel bed 15 feet thick overlain by silty clay grading to silty sand and yellow tuffa ceous sandstone. The beds are near the base of the formation. Half a mile west, beds of the Merced of similar lithology overlie the Peta- luma formation and are overlain by basalt of the Sonoma volcanics.
In some parts of the area the sand is loosely packed and uncemented, so that good exposures do not occur. At other places the beds are poorly cemented with iron oxide or argillaceous cement. Locally, thin fossiliferous beds are well cemented with calcareous cement leached from mollusk shells.
As would be expected in a formation having a northerly source of materials, the percentage of clay in the Merced appears to increase toward the south. Thick layers of clay encountered by wells in the central part of Santa Rosa Valley probably are lagoonal deposits laid down during Merced time.

GEOIjOGY 45
Fossiliferous strata occur widely in exposed strata of the Merced tut, as previously mentioned, most of the explored fossil localities are near the base of the formation. Good outcrops of fossiliferous strata occur near Freestone. In a narrow, curved band flanking the city of Sebastopol on the west, beds containing clamshells are re ported to crop out and are penetrated at shallow depths by wells. At Wilson Grove and southward for about 1J£ miles, shell beds crop out near the eastern edge of the exposed Merced. Other known outcrops are on the eastern side of Laguna de Santa Rosa near the mouth of Mark West Creek (pi. 7) and in a creek bed on the Schi- decker ranch in 7/9-9K.
Subsurface lithology. The subsurface character and lithology of the Merced formation where penetrated by wells are essentially the same as they are at the surface. The most noticeable difference is the lesser degree of coherence of sands at depth in the upper part of the formation. This difference is probably due to surface indura tion. The looseness and fineness of the sand hinder the construction and development of wells in the Merced formation, especially in the vicinity of and southeast of Sebastopol where thick layers of fine to very fine uniform sand are encountered. A short distance west of Sebastopol, deep wells encounter a fairly well indurated blue sandstone which apparently is basal Merced and which probably has remained below the zone of oxidation since its deposition. Several miles west of the eastern edge of the exposed Merced the indurated sandstone is covered only by soil or a thin weathered zone, and commonly wells are completed using only a few feet of surface casing. The sandstone is conglomeratic in places, and generally boulders or clamshells are encountered near the contact with the Franciscan and Knoxville rocks. (See table 22, logs of wells 6/9-22Al, 7/9-5N1, and 7/9-29J2.)
Beds containing fossil shells are found throughout the Merced, and at places they are almost a coquina (pi. 7). They are generally less than 10 feet thick, and commonly only 1-2 feet thick, and may occur as loose sand or sand and gravel or as cemented zones that may contain small interconnected solution cavities. (See table 22, logs of wells 6/9-2C1 and 7/9-21 Gl.)
Wells drilled near outliers of the Franciscan, which formed islands in the Merced sea, commonly enter beds of gravel and clay that were derived from these masses of the Franciscan by marine erosion.
The lithology of the strata penetrated in well 8/9-33J1 may repre sent this type of deposition, although it might represent a continental facies of the Merced that is, a tongue of the Glen Ellen formation. The "decomposed rock" in the interval from 150 to 190 feet may correlate with the intercalated tuff bed of the Merced exposed about

46 GROUND WATER IN SANTA ROSA AND PETALUMA VALLEYS
400 feet east of the well, if the bed is undulating as suggested by the outcrop pattern. Tuff breccia is sometimes logged by drillers as decayed rock; however, fine-grained tuff is commonly logged as limestone (probably confused with marl).
Much of the material in the Merced formation logged by drillers as clay or sandy clay probably could be classified more strictly as silt or even very fine sand. However, well logs suggest that the formation becomes finer grained eastward beneath Santa Rosa Valley, where it is interbedded with continental deposits of the Glen Ellen formation. This interbedded relationship, the nonrestrictive use of the term "clay" by drillers, and the common occurrence of clay in the Glen Ellen formation make the subsurface differentiation of the Merced and Glen Ellen formations very tenuous.
Geologic cross sections A-A' and B-B' (pis. 3 and 4) illustrate diagrammatically the interbedded relationship of the Merced and Glen Ellen formations as interpreted from well logs. Section B-Br also indicates interbedding of the Merced and the Sonoma volcanics. Logs used to construct these cross sections and other logs showing the relationship reported above are given in table 22.
In Petaluma Valley the Merced deposits are somewhat finer grained than in correlative beds farther north, and both the exposed and subsurface units of the formation are considerably thinner than in the Santa Rosa Valley area. (See fig. 4.)
South of Lakeville, beds of marl are included in the sand and sandy clay of the Merced formation, and tuffaceous strata occur from Lakeville southward to Sears Point and possibly elsewhere.
Water-bearing properties. Because of its extent, high porosity, and moderate transmissibility, the Merced formation is probably the most important water-bearing formation in the area. A high percentage of the material below the water table yields water, and the forma tion is comparatively homogeneous so that wells drilled below the water table almost anywhere in the formation yield water. Because of the looseness and fair degree of sorting, the porosity is high; but because of the fineness of the sands and the small amount of coarse material contained, the transmissibility is only moderate and large drawdowns are necessary to produce sizable yields.
The most common cause of well failure is the entry of very fine sand ("quick sand" in drillers' terms) into the casing through per forations or through the open bottom of the casing. Local well- construction and -development practices have not yet progressed suf ficiently to enable obtaining the best yields. Until recently most domestic wells were drilled by cable-tool methods, the blank casing being landed in indurated sandstone strata or, rarely, a gravel, so as to avoid pumping of sand. Because of the low transmissibility of the

GEOLOGY 47
semicemented zones and because of the small intake area exposed at the bottom of the casing, most of the overlying saturated water bearing material either is not tapped or, if no aquicludes are pene trated, is rendered relatively ineffective because of the large "entrance" or frictional losses. Recently, rotary-drilled gravel-wall wells were introduced, but generally the gravel selected is much too coarse and only one or two of the coarsest intervals penetrated are perforated. Nearly all large industrial, irrigation, and public-supply wells are now constructed in this manner, and better yields are obtained, but well longevity and relatively high yields will be realized only when the proper perforation and gravel-pack sizes are used.
On the basis of the observations of various drillers, it is believed that some of the most prolific water-bearing zones in the Merced formation are in fossiliferous strata. Some of these strata consist of shells and sand cemented together but contain small interconnected cavities probably resulting from solution of the shells. Other strata, described as "clamshells" or "loose clamshells," apparently are es sentially a coquina or gravel composed of shells. Probably many of the fossiliferous deposits represent beach or near-shore deposition, so that the material associated with them may include some clean coarse sand and gravel of high permeability. "Gravel and clam shells" or "shells and gravel" are reported in logs of wells 7/9-14K1, 8/9-27K1, 8/9-34R1, and 8/9-34R2, and "shells, sand, and grit" in 6/9-2C1.
The yields of properly constructed wells in the Merced formation average 100-1,500 gpm. The drawdowns average 10-100 feet, and specific capacities range from 2-30 gpm per foot of drawdown. In order to obtain yields of this magnitude, the wells are commonly drilled to depths of 200-600 feet.
GLEN ELLEN FORMATION
Definition and general character. The Glen Ellen formation was named by Weaver (1949, p. 98) for exposures of continental deposits near Glen Ellen at the northern end of Sonoma Valley. As defined by Weaver (1949, p. 98-99), the Glen Ellen formation consists of stratified gravel and sand alternating with thick layers and lenses of conglomerate composed of andesite cobbles averaging 3-6 inches in diameter. Weaver states that the formation rests on the folded Sonoma volcanics and that the deposits near Glen Ellen are at least 300 feet thick. He mapped the Glen Ellen formation only at the northern edge of the Santa Rosa 15-minute quadrangle from Glen Ellen to the northern part of Rincon Valley. As referred to in this report, the Glen Ellen formation consists of the thick sequence of deformed continental deposits that discontinuously overlie and locally
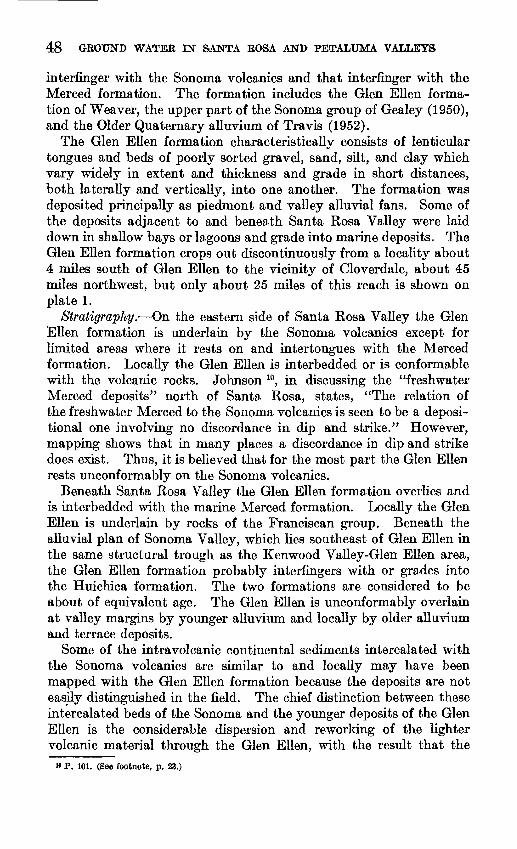
48 GROUND WATEK IN" SANTA ROSlA AND PETALTJMA VALLEYS
interfinger with the Sonoma volcanics and that interfinger with the Merced formation. The formation includes the Glen Ellen forma tion of Weaver, the upper part of the Sonoma group of Gealey (1950), and the Older Quaternary alluvium of Travis (1952).
The Glen Ellen formation characteristically consists of lenticular tongues and beds of poorly sorted gravel, sand, silt, and clay which vary widely in extent and thickness and grade in short distances, both laterally and vertically, into one another. The formation was deposited principally as piedmont and valley alluvial fans. Some of the deposits adjacent to and beneath Santa Rosa Valley were laid down in shallow bays or lagoons and grade into marine deposits. The Glen Ellen formation crops out discontinuously from a locality about 4 miles south of Glen Ellen to the vicinity of Cloverdale, about 45 miles northwest, but only about 25 miles of this reach is shown on plate 1.
Stratigraphy. On the eastern side of Santa Rosa Valley the Glen Ellen formation is underlain by the Sonoma volcanics except for limited areas where it rests on and intertongues with the Merced formation. Locally the Glen Ellen is interbedded or is conformable with the volcanic rocks. Johnson 10 , in discussing the "freshwater Merced deposits" north of Santa Rosa, states, "The relation of the freshwater Merced to the Sonoma volcanics is seen to be a deposi- tional one involving no discordance in dip and strike." However, mapping shows that in many places a discordance in dip and strike does exist. Thus, it is believed that for the most part the Glen Ellen rests unconformably on the Sonoma volcanics.
Beneath Santa Rosa Valley the Glen Ellen formation overlies and is interbedded with the marine Merced formation. Locally the Glen Ellen is underlain by rocks of the Franciscan group. Beneath the alluvial plan of Sonoma Valley, which lies southeast of Glen Ellen in the same structural trough as the Kenwood Valley-Glen Ellen area, the Glen Ellen formation probably interfingers with or grades into the Huichica formation. The two formations are considered to be about of equivalent age. The Glen Ellen is unconformably overlain at valley margins by younger alluvium and locally by older alluvium and terrace deposits.
Some of the intravolcanic continental sediments intercalated with the Sonoma volcanics are similar to and locally may have been mapped with the Glen Ellen formation because the deposits are not easily distinguished in the field. The chief distinction between these intercalated beds of the Sonoma and the younger deposits of the Glen Ellen is the considerable dispersion and reworking of the lighter volcanic material through the Glen Ellen, with the result that the
»«P. 101. (See footnote, p. 23.)

GEOLOGICAL SURVEY WATEK-SUPPLY PAPER 1427 PLATE 8
A. LENTICULAR BEDS OF LOOSE, POORLY SORTED GRAVEL OF THE GLEN ELLENFORMATION.
B. CONGLOMERATE AND COMPACT, SANDY CLAY OF THE GLEN ELLEN FORMATION.


GEOIXX5Y 49
constituents of the Glen Ellen are more highly weathered than are the parent materials in the Sonoma volcanics.
Age and correlative formations.' Weaver assigned the Glen Ellen formation to the Pleistocene epoch because it overlies the Sonoma volcanics of late Pliocene age. Although no diagnostic fossils have been found in the type area, the Glen Ellen is believed to embrace parts of two epochs; deposition possibly began in very late Pliocene time but probably occurred largely in early Pleistocene time. Some difference may exist between the ages of the basal deposits of the Glen Ellen from place to place because volcanic activity may not have ceased everywhere at the same time. As referred to in this report, the Glen Ellen is considered to be of Pliocene(?) and Pleistocene age because (1) the basal beds interfinger locally with rocks of the Sonoma volcanics, (2) the Glen Ellen interfmgers with marine strata of the Merced formation of Pliocene and Pleistocene (?) age through a thick sequence beneath Santa Kosa Valley (pi. 4), and (3) the Glen Ellen in the area of this report seems to be correlative with several formations of Pliocene and Pleistocene age in nearby areas. Correlative forma tions are the Merced and Huichica formations in Santa Kosa and Sonoma Valleys, respectively, possibly the San Antonio formation of Trask and Kalston (1951, p. 1082-1089) in the San Francisco Bay area, and the Tehama formation on the western side of the Sacramento VaUey.
Distribution and thickness. The deposits of the Glen Ellen forma tion accumulated in two principal structural troughs, the Windsor and Kenwood-Sonoma synclines, which were later steepened and the latter folded into a series of smaller anticlines and synclines (fig. 5). The deposits are exposed in the northern part of Santa Rosa Valley and on the northeastern flank of the valley where the inferred thick ness is about 3,000 feet (pi. 4). Gealey (1950, p. 23) reports a max imum exposed thickness of 3,000 feet of elastics for the upper part of his Sonoma group, which part is equivalent to the Glen Ellen forma tion. He states, "It is estimated that a diminution by one-half occurs across the Windsor Syncline [synclinal axis of Santa Rosa Valley]." This diminution suggests that the Glen Ellen is not more than 1,500 feet thick on the west side of the valley.
Subsurface evidence indicates that the Glen Ellen is present be neath alluvium as far south as Penngrove (pi. 5), and some deposits may extend west of Santa Rosa Valley. On the south side of Mark West Creek, about half a mile west of Trenton, some gravel beds exposed in road cuts were mapped by Travis (1952) as older alluvium. However, the deposits have an attitude similar to those of the Merced and probably represent deposits laid down as an extensive tongue of the Glen Ellen formation, possibly as channel deposits of a large stream

50 GROUND WATER IN SANTA KO8A AND PETALTJMA VALILEYS
which built a delta into the Merced embayment. They are shown on the geologic map (pi. 2) as Glen Ellen. These deposits may be the conglomerate referred to by Johnson 11 and placed by him in the Merced formation.
In the Kenwood-Glen Ellen syncline, exposures of the Glen Ellen are continuous except for short gaps at both ends of Kenwood Valley from a point about 5 miles north of Santa Rosa southeastward to a point about 4 miles south of Glen Ellen (about 1 mile east of the area of pi. 1). These deposits are considerably more deformed than those in Santa Rosa Valley, and the maximum thickness is considerably less.
The Glen Ellen formation is believed not to be exposed in Petaluma Valley; however, some of the material mapped as older alluvium possibly may include remnants of the Glen Ellen.
Lithology. Observations made in mapping the Glen Ellen forma tion indicate that it is extremely heterogeneous. Along the strike it is not unusual to pass from coarse boulder conglomerate directly into a massive siltstone in which the largest grains may be scattered granules.
The contact with the underlying Sonoma volcanics commonly oc curs in a tuffaceous zone. The lower part of the zone is usually pumiceous tuff and is assigned to the Sonoma volcanics. The zone varies in thickness from place to place and is intermittently missing, indicating an unconformity. Upward, the tuff merges with a tuffa ceous sandstone, which merges gradually with silt. This interval generally has a thickness of 25-100 feet and is overlain by interbedded boulder conglomerate and conglomeratic and tuffaceous silt.
Good exposures of the Glen Ellen formation, especially of layers of conglomerate and more resistant sandstone and siltstone, are fairly common, but continuous exposures for appreciable distances are rare. Described below is a relatively thin section exposed in the type area:
Section of Glen Ellen formation exposed about 0.5 mile northwest of Glen Ellenin 6/6-16F
Silt and tuffaceous silt and occasional lenses of coarse crossbedded sand- Feft stone and pebble stringers 5-6 feet long____________________________ 20
Conglomerate, medium sand to cobbles________________________ 8Silt and clay, brown and yellowish-brown; contains sand and pebble lenses
2-3 feet thick_____________________________________ 10 Concealed._____________________________________________________ 5Sandstone, fine- to medium-grained, thinly crossbedded, light-olive-brown. 10 Siltstone and sandy clay, pebbly, tan to yellowish-brown, and occasional
gravel stringers ____________________________________________ 15
Total..___________________________________ 68
" P. 106. (See footnote, p. 23.)

GEOLOGY 51
In the Glen Ellen area and along the margin of Kenwood Valley, the Glen Ellen formation contains thick lenses of faMy compact silty or sandy clay in addition to sand and conglomerate (pi. 8J5). The material is nearly everywhere poorly sorted, except for some of the sand, and in many places is poorly cemented. Good exposures occur northwest of Glen Ellen in the creeks tributary to Sonoma Creek, along Warm Springs Road, and along Henno Road immediately north of Glen Ellen. In Kenwood Valley outcrops are generally poor and discontinuous.
Along the road to the Santa Rosa Golf and Country Club (in 7/7-10N), coarse conglomerate of the Glen Ellen formation is exposed, and along the east slope of Rincon Valley the strata exposed are principally gravel beds which have a nearly vertical dip near their contact with the Sonoma volcanics. The steeply dipping beds cause artesian conditions in wells in the vicinity of 7/7-8A, 8H, and 9D.
In the hills immediately north and south of Santa Rosa, steeply dipping continental beds of the Glen Ellen crop out and are associated with marine sandstone, probably of the Merced formation. In nearby wells, shells are commonly encountered hi marine sands interbedded with the continental Glen Ellen formation. Because the Merced is exposed over a small area, the sandstone, although mapped in the field, is included on the geologic map with the Glen Ellen formation. The Merced and Glen Ellen are associated with the upper part of the Sonoma volcanics, but the relations and degree of interbedding are largely obscured and complicated by faulting and steep, closely spaced folds.
Farther north on the eastern side of Santa Rosa Valley, where slopes are gentle, beds are well exposed at only a few places, and those exposures are generally of small vertical and areal extent. Coarse conglomerates are less common there than in the Glen Ellen area. The section described below, which probably occurs near the base of the formation, is believed to be typical of the Glen Ellen in that area.
Section of Glen Ellen formation exposed in 8/8-21PFeet
Tuffaceous sandstone, medium-grained, buff-colored, and fine-grainedreworked tuff___________________________________________________ 4-5
Concealed by slope mantle_____________________________ 25Sandstone, very fine to silty, compact; only slightly friable.____________ 15Gravel, poorly sorted, weakly cemented; composed chiefly of volcanic
rock, both vesicular and nonvesicular______________________________ 2Sandstone, coarse-grained and tuffaceous at top, grading to fine-grained at
bottom of exposed section (glassy tuff in Sonoma volcanics exposed lessthan 100 feet lower, stratigraphically)______________________________ 10
Total...____.....___________ ______ _____ __ _ 56-57

52 GROUND WATER IN SANTA ROSA AND FETALTTMA VALLEYS
On the eastern side of Chalk Hill Road in 8/8-1 7D, about 175 feet of loose, poorly sorted lenticular gravel interbedded with light-buff compact silt and gritty sand is exposed (pi. SA) ; these materials may be representative of those encountered in well 8/8-20Q1 (table 22). The gravel is composed of debris from the Sonoma volcanics, includ ing some obsidian, and much of it is of cobble size.
On the western side of Santa Rosa Valley, north of Mark West Creek, strata of the Glen Ellen, where exposed, are finer textured than the deposits to the east and are more nearly horizontal. In many places they are difficult to distinguish from the older terrace deposits along the Russian River. North of Wilson Grove for several miles the gravels are interbedded with sandstone. This relation probably reflects oscillations of the shoreline of the Merced sea. A typical section in the area is described below.
Exposure of the Glen Ellen formation, about half a mile northeast of Wihon Grovein 8J9-22P
FeetSandstone, fine to very fine grained, tuffaceous, compact but poorly
cemented, yellow. Grades downward into unsorted granular to pebbly sandstone having a clay matrix, then into a fairly well sorted sandy silt- stone. Bottom obscured by soil ___ _ __ _____ ________ _ 10
Clay silty, yellow; stained by iron-oxide____________---_-__---___---_- 12Clay stone, somewhat sandy, hard, yellow; stained by iron-oxide. ________ 3Obscured (although covered by slump and soil mantle, there are indications
of the presence of silty and clayey gravel)-- _ ______________________ 70Clay, sandy, hard; stained by iron-oxide __ __________________________ 6Sandstone, medium to coarse, angular, friable; stained by iron-oxide.
Massive and fairly well sorted, becoming pebbly at bottom- __ __ ____ 4Gravel in thin lenses interbedded with thin layers of gritty sandstone- ___ 4 Clay, silty______ _ __ __ __ _ __ __ _______ _ ________________ 4
Total
Only a few small exposures of the Glen Ellen foimation occur in the slightly to moderately dissected area of the valley trough, and most consist of poorly sorted gravel. In the bed of Mark West Creek the predominant material cropping out is siltstone which in places appears to be tuffaceous.
Water-bearing properties. Beneath the Santa Rosa Valley the lithology and water-yielding characteristics of the Glen Ellen forma tion vary considerably. In general wells not more than 100 feet deep will provide enough water for domestic use, and wells 250-600 feet deep will provide enough for irrigation.
Drillers' logs indicate that most wells penetrate lenticular bodies of unconsolidated, poorly sorted silty clay, clayey gravel, sand, and gravel. Computations made from drillers' logs to determine the

GEOLOGY 53
storage capacity of Santa Kosa Valley indicate that in the Windsor- Fulton storage unit (fig. 3), which is underlain primarily by the Glen Ellen formation, an average of about 40 percent of the material penetrated in a zone 200 feet thick is clay. Of the remaining material, about 20 percent is gravel and sand whose water-bearing qualities are relatively good, and (40 percent is poorly assorted material containing much silt and clay, whose water-bearing qualities range from poor to fair. The gravels are composed mostly of debris from the Sonoma volcanics but include minor amounts of chert of the Franciscan group. The subsurface lithology of the Glen Ellen formation is shown by logs in table 22 of the appendix and diagramatically on cross sections A-A' and B-B' (pis. 3 and 4).
The range in materials and in yield is illustrated by wells 8/8-17Ll and 8/8-20Q1 (table 22) which are only IK miles apart. In well 17L1 a considerable amount of coarse material was penetrated between the surface and a depth of 278 feet, but it was so poorly sorted and con tained so much clay that the yield of the well was only 10 gpm and the drawdown more than 100 feet. In contrast, well 20Q1, which is 312 feet deep, penetrated mostly poorly sorted gravel and yielded 300 gpm; the drawdown was 10 feet. Thus the specific capacity of well 20Q1 is about 300 times that of well 17L1. This range probably is close to the extreme for the formation.
Most of the wells on the eastern side of Santa Rosa Valley and north of Mark West Creek obtain all or most of their water from the Glen Ellen formation; no extensive tongues of the Merced are tapped by wells except at depth near the mouth of Mark West Creek. However, many wells in the eastern half of Santa Rosa Valley from Santa Rosa north to Mark West Creek encounter what appear to be fairly exten sive lenticular bodies of blue clay or silty clay. Many wells penetrate more than 50 feet of the clay and some as much as 300-400 feet. The clay bodies do not form a well-defined zone in wells and apparently are discontinuous. Thus, they probably represent flood-plain or interfan deposits rather than lagoonal clays.
Most wells drilled in the Glen Ellen formation in Santa Rosa Valley tap only the upper part of the formation, which generally yields water more freely than the lower part, which is a relatively poor aquifer. This difference in yield is due in part to the large amount of weathered tuff disseminated in the lower part of the Glen Ellen formation. The reworked tuff is more weathered, finer grained, and more compact than the tuff of the Sonoma volcanics and therefore is less permeable.
In Rincon and Kenwood Valleys and in the Glen Ellen area only low to moderate yields are obtained from the Glen Ellen formation, probably because of the extreme heterogeneity of the deposits and the relatively large amount of tuffaceous material. However, it is

54 GROUND WATER IN SANTA ROSA AND PETALUMA VAMJEITS
the chief aquifer in the valley areas, except for the southern part of Kenwood Valley where fairly thick deposits of Recent alluvium are underlain by Sonoma volcanics, and in the vicinity of Glen Ellen where most large-capacity wells tap the Sonoma volcanics.
PIjEISTOCENE AND RECENT DEPOSITS
OLDER ALLUVIUM AND TERRACE DEPOSITS
General character, extent, and thickness. The older alluvium and terrace deposits are shown on the geologic map (pi. 1) by the same pattern. The older alluvium, where exposed, consists principally of alluvial-fan deposits but is probably contemporary with and includes some terrace deposits and old valley fill. In Petaluma Valley some of the older alluvium shown on the map may belong to the Glen Ellen formation. The older alluvium is generally slightly to moder ately dissected; thus its initial surface has been altered or eroded away. No effort was made to map terraces other than the alluvial- fill terraces; where the bedrock is exposed, cut terraces are not shown.
The older alluvium and terrace deposits are probably of late Pleisto cene age and locally overlie older deposits unconformably. The most extensive exposures of older alluvium are on the northeastern side of upper Petaluma Valley where the deposits overlie the Petaluma for mation and consist principally of alternating clay or silt and gravel and some cemented gravel and sand. They were mapped by Weaver (1949), who assigned them to his Montezuma formation. The ter race deposits and older alluvium are mapped separately in Kenwood Valley, and extensive terraces are shown on the sides of the Russian River valley (pi. 1).
The older alluvium is well exposed in only a few places, but where examined it appears to consist of unconsolidated and poorly sorted sand or sand and gravel and interbedded silt and silty clay. Some coarse conglomerate exposed in the Glen Ellen area along the old railroad cut north of Calabazas Creek is cemented locally with argil laceous material. The maximum exposed thickness of the unit is less than 100 feet but the subsurface thickness in Petaluma Valley is estimated to be as much as 200 feet. The terrace deposits, especially along the western side of the Russian River valley, where they occur at several levels, are fairly well exposed. They consist of buff to light-brown poorly sorted crossbedded gravel and sand and have a maximum observed thickness of several hundred feet.
Because the older alluvium is similar to the uppermost deposits of the Glen Ellen formation, the two units are difficult to distinguish in drillers' logs. In exposures the older alluvium is generally dis tinguished from underlying deposits of the Glen Ellen or Petaluma formation by its flatness. However, according to Higgins (1952, p.
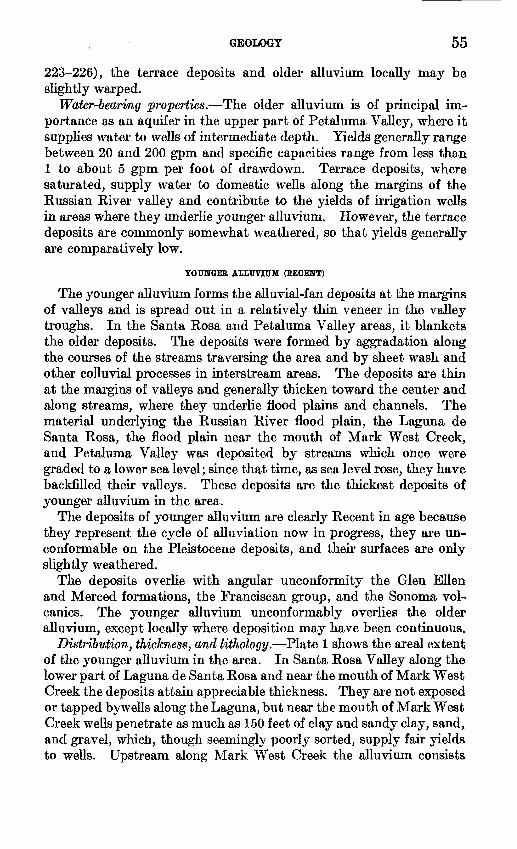
GEOLOGY 55
223-226), the terrace deposits and older alluvium locally may be slightly warped.
Water-bearing properties. The older alluvium is of principal im portance as an aquifer in the upper part of Petaluma Valley, where it supplies water to wells of intermediate depth. Yields generally range between 20 and 200 gpm and specific capacities range from less than 1 to about 5 gpm per foot of drawdown. Terrace deposits, where saturated, supply water to domestic wells along the margins of the Russian River valley and contribute to the yields of irrigation wells in areas where they underlie younger alluvium. However, the terrace deposits are commonly somewhat weathered, so that yields generally are comparatively low.
YOUNGEE ALLUVIUM (RECENT)
The younger alluvium forms the alluvial-fan deposits at the margins of valleys and is spread out in a relatively thin veneer in the valley troughs. In the Santa Rosa and Petaluma Valley areas, it blankets the older deposits. The deposits were formed by aggradation along the courses of the streams traversing the area and by sheet wash and other colluvial processes in interstream areas. The deposits are thin at the margins of valleys and generally thicken toward the center and along streams, where they underlie flood plains and channels. The material underlying the Russian River flood plain, the Laguna de Santa Rosa, the flood plain near the mouth of Mark West Creek, and Petaluma Valley was deposited by streams which once were graded to a lower sea level; since that time, as sea level rose, they have backfilled their valleys. These deposits are the thickest deposits of younger alluvium in the area.
The deposits of younger alluvium are clearly Recent in age because they represent the cycle of alluviation now in progress, they are un- conformable on the Pleistocene deposits, and their surfaces are only slightly weathered.
The deposits overlie with angular unconformity the Glen Ellen and Merced formations, the Franciscan group, and the Sonoma vol- canics. The younger alluvium unconformably overlies the older alluvium, except locally where deposition may have been continuous.
Distribution, thickness, and lithology. Plate 1 shows the area! extent of the younger alluvium in the area. In Santa Rosa Valley along the lower part of Laguna de Santa Rosa and near the mouth of Mark West Creek the deposits attain appreciable thickness. They are not exposed or tapped by wells along the Laguna, but near the mouth of Mark West Creek wells penetrate as much as 150 feet of clay and sandy clay, sand, and gravel, which, though seemingly poorly sorted, supply fair yields to wells. Upstream along Mark West Creek the alluvium consists

56 GROUND WATEB IN SANTA ROSA AND PETALUMA VALLEYS
mainly of poorly sorted silt and silty clay and thin crossbedded layers of sand and fine gravel.
At the mouth of Bennett Valley and at the head of the Santa Kosa Creek fan, deposits of the younger alluvium may attain a thickness of 30 feet or more in places. The thickness is uncertain because the base cannot be readily identified in drillers' logs. The deposits consist of coarse gravel, sand and gravel, clay, and sandy clay which may con tribute appreciably to yields of wells. (See logs for wells 7/7-18Ll, 18N1, and 18R2.)
In Petaluma Valley the younger alluvium is thickest near the bay where the maximum is possibly as much as 300 feet, but no confirming data are available. The material is chiefly fine grained, consisting of silt, sandy clay, some sand, and scattered beds of thin gravel. The ma terials comprising some strata may be fairly well sorted, but the perme ability is low because of the overall fineness of the deposits. In the northern part of Petaluma Valley the younger alluvial deposits prob ably are relatively thin except possibly on the southwestern side in the vicinity of Petaluma, where it is difficult to distinguish the younger from the older alluvium.
In Novato Valley the younger alluvium rests on the Franciscan group and on older alluvium. In the vicinity of Novato the thickness of the younger and older alluvium, combined, exceeds 50 feet locally, and in places the younger alluvium alone may attain that thickness. The deposits consist of interbedded clay or sandy clay and gravel that have low to moderate permeability.
The deposits underlying the Russian River flood plain consist prin cipally of poorly sorted channel deposits of sand and gravel interbedded with flood-plain deposits of silt and clay. Because of the difficulty in distinguishing in drillers' logs between the younger alluvium, terrace deposits, and the Glen Ellen formation, the thickness of the younger alluvium is not definitely known but may have a maximum of about 150 feet. A study of the well-log and well-yield data indicates that the younger alluvium is underlain by the Glen Ellen formation or older alluvial deposits of similar character at depths ranging from a few feet to 50 feet or more on the eastern side of the Russian River south of Healdsburg, and that the younger alluvium is probably thickest, about 100 feet, on the western side near the present course of the river.
Water-bearing properties. The younger alluvium is important as a water-yielding formation in Novato Valley, in parts of Petaluma Valley, and in the Russian River valley. In Novato Valley yields are generally less than 25 gpm, and only locally as great as 50 gpm. In the northern part of Petaluma Valley the permeability, and yield to wells, of the younger alluvium are low. In the southern part of Petaluma Valley the highest yields from younger alluvium are 100-150

GEOLOGY 57
gpm. However, in the Russian River valley the younger alluvium contains a relatively high percentage of gravel and sand and good yields are obtained from wells 30-100 feet deep. Yields are commonly above 500 gpm and specific capacities generally 20-100 gpm per foot of drawdown or more.
GEOLOGIC STRUCTURE
The Santa Rosa and Petaluma Valley areas are in the northwest- trending structural province of the Coast Ranges of northern Cali fornia. The regional structure consists primarily of northwest-trend ing folds and a few major faults, the most prominent of which is the San Andreas fault, a right-lateral fault, about 16 miles west of the area. The regional downwarp occupied by Santa Rosa and Petaluma Valleys extends from San Pablo Bay northwestward for about 50 miles. Folds and faults have deformed or displaced all formations except the younger alluvium of Recent age.
FOLDS
Folds in the rock strata are the most important geologic structures bearing on the occurrence of ground water in the Santa Rosa and Petaluma Valleys areas. In general, the major synclines or downfolds tend to localize the accumulation of and preserve the sediments that form the ground-water reservoirs. Largest of these is the major syncline that forms Santa Rosa Valley, named by Gealey (1950, p. 31) the Windsor syncline. At the north end of Santa Rosa Valley is a relatively broad asymmetrical downwarp characterized on the west side by low dips and on the east side by steeper dips and some dis placement by faulting. Southward, in the vicinity of Mark West Creek, the east side becomes more complicated and is intricately folded and faulted (pi. 6). The present structure evolved during the Pleistocene epoch; before that time the area was occupied by a depres sion, probably monoclinal, which formed during middle or late Pliocene time and in which the marine Merced and continental Glen Ellen formations accumulated. This depression was uplifted and modified by erosion before the most recent orogeny. Where aquicludes, or confining beds, are folded in the syncline, artesian conditions are common locally. However, because of the low dips and lenticularity of the deposits in the axial part of the Windsor syncline, marked arte sian conditions are not common there; they are prominent locally in the steeper eastern limb and in the gently dipping western limb where more extensive confining beds occur.
The Washoe anticline (Weaver, 1949) is a relatively minor fold on the western limb of the Windsor syncline in the southwestern part of Santa Rosa Valley. It extends from the margin of Petaluma Valley, south of Penngrove, northwestward to Gossage Creek, a distance of
443616 58 5

58 GR'OUND WATER IN SANTA KOSA AND PETALUMA VALLEYS
about 6 miles. It is not a simple structure; rather, the limbs are undu- latory, and between Washoe and Gossage Creeks the anticline branches into several parallel folds. It locally limits the extent of the ground- water basin in Santa Rosa Valley. An anticlinal structure along the northeastern side of Petaluma Valley, which probably involves only the Petaluma and older formations, in part determines the southern extent of Santa Rosa Valley.
Petaluma Valley lies southward in the same general synclinal trough as Santa Rosa Valley, and it also has undergone some faulting. During the latter part of the early Pliocene, the syncline occupied a larger area than the present ground-water basin and received deposi tion of the Petaluma formation. It was modified by deformation during the middle Pliocene, after which the Merced formation was laid down. During the latter part of the Pliocene and probably con tinuing into the Pleistocene, the extent of the basin was localized, and sediments forming the upper part of the ground-water reservoir subsequently were deposited.
The Kenwood-Sonoma syncline determined the distribution of the Glen Ellen formation in the eastern part of the area. After the deposition of the Glen Ellen the extent of the basin was modified by folding, which produced narrow, closely spaced folds in the Glen Ellen area (fig. 5) and in the southwestern corner of the Calistoga quadrangle, north of Santa Rosa.
FAULTS
The northwest-trending faults at the margins of the valleys, especially in the Santa Rosa Valley area, have displaced the formations and therefore in part control the thickness of water-bearing deposits in the basins and the general form of the valleys. Steeply dipping beds exposed in some places along valley margins probably represent drag folds along faults. Wells such as 7/8-14A1, drilled into impermeable or poorly permeable near-vertical beds, generally have low yields. Even those wells drilled in more permeable vertical beds may have large drawdowns, because the vertical bedding may limit stringently the horizontal extent of the local aquifer, and its recharge.
On the basis of mapping in adjacent upland areas, several faults are inferred to pass beneath the valley areas. The largest of these is the Tolay fault (Weaver, 1949), which has been mapped from the mouth of Tolay Creek at San Pablo Bay northwestward to the vicinity of Hessel (pi. 2). The Tolay fault is not known to cut strata younger than the Merced formation and therefore probably has little subsurface effect on the hydrology of Petaluma Valley. However, it controls the thickness of water-bearing deposits, at least in the central part of Petaluma Valley, by bringing up impermeable strata of the

GEOLOGY 59
Franciscan group. (See fig. 4.) Logs of oil and gas test wells in 5/6-30A reveal more than 2,000 feet of the Petaluma formation, even though the site is near the crest of an anticline. The log of well 5/7-26K1 near the center of the valley reveals bedrock of the Fran ciscan group at a depth of 800 feet and indicates that the Petaluma formation has thinned to about 300 feet. The shallow depth to bedrock suggests that the position of the Tolay fault buried at depth beneath the valley is northeast of the well, as the upthrown side of the fault is the southwestern side.
Some of the faults mapped at the margins of Santa Rosa Valley probably cut the Merced and Glen Ellen formations beneath the valley, but no barrier effects that can be directly attributed to faults have been recognized. However, in 8/9-22 a fault is inferred from chemical data to affect the water quality. (See section on Quality of Water in Santa Rosa Valley area.)
Minor structures consist chiefly of drag folds and small faults and are common in the Sonoma volcanics and locally in the Glen Ellen and Merced formations, especially in areas affected by large-scale faulting. These locally restrict the occurrence, movement, and quality of ground water.
GEOLOGIC HISTORYMESOZOIC ERA
The known geologic history of the area began during the latter part of the Jurassic period of the Mesozoic era, when the dominantly clastic marine sediments of the Franciscan group and Knoxville formation accumulated in a broad, slowly sinking geosyncline. During and after deposition, these sediments were intruded by basic and ultrabasic igneous rocks. The end of the Jurassic period was marked by uplift and local warping, but the general shape of the geosyncline was not destroyed and deposition of elastics continued into the Cretaceous period. At the end of the Cretaceous period sedimentation was interrupted by uplift accompanied by folding and faulting. Most of the Cretaceous rocks probably were removed by erosion during Late Cretaceous or early Tertiary time when sedimentation was taking place eastward; the only remaining Cretaceous deposit is the Novato conglomerate.
CBNOZOIC BRA
PRE-P1IOCENE EVENTS
Pre-Pliocene Tertiary rocks are not exposed in the area studied, and such rocks, if deposited there, must have been largely removed by erosion before mid-Pliocene time. However, during the middle part of the Miocene epoch the marine Monterey shale was deposited over a wide area and is postulated by Morse and Bailey (1935, p. 1439)
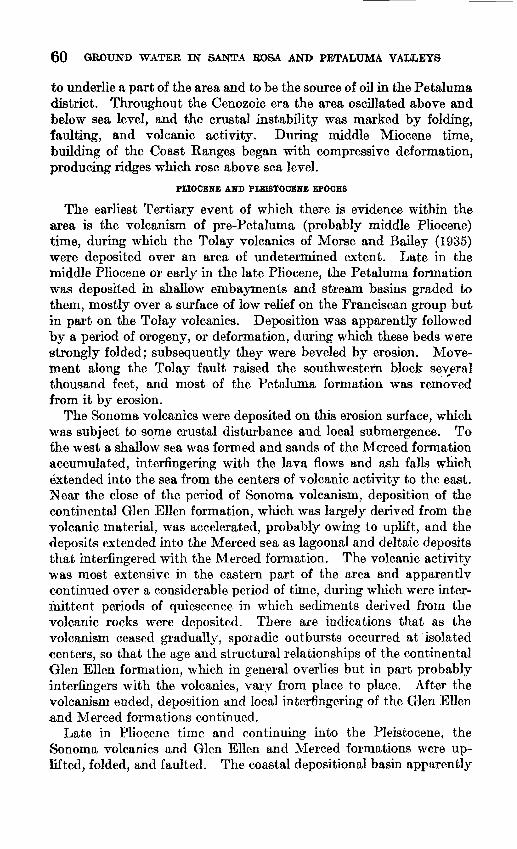
60 GROUND WATER IN SANTA ROSA AND PETALUMA VAIXEYS
to underlie a part of the area and to be the source of oil in the Petaluma district. Throughout the Cenozoic era the area oscillated above and below sea level, and the crustal instability was marked by folding, faulting, and volcanic activity. During middle Miocene time, building of the Coast Ranges began with compressive deformation, producing ridges which rose above sea level.
PLIOCENE AND PLEISTOCENE EPOCHS
The earliest Tertiary event of which there is evidence within the area is the volcanism of pre-Petaluma (probably middle Pliocene) time, during which the Tolay volcanics of Morse and Bailey (1935) were deposited over an area of undetermined extent. Late in the middle Pliocene or early in the late Pliocene, the Petaluma formation was deposited in shallow embayments and stream basins graded to them, mostly over a surface of low relief on the Franciscan group but in part on the Tolay volcanics. Deposition was apparently followed by a period of orogeny, or deformation, during which these beds were strongly folded; subsequently they were beveled by erosion. Move ment along the Tolay fault raised the southwestern block several thousand feet, and most of the Petaluma formation was removed from it by erosion.
The Sonoma volcanics were deposited on this erosion surface, which was subject to some crustal disturbance and local submergence. To £he west a shallow sea was formed and sands of the Merced formation accumulated, interfingering with the lava flows and ash falls which extended into the sea from the centers of volcanic activity to the east. Near the close of the period of Sonoma volcanism, deposition of the continental Glen Ellen formation, which was largely derived from the volcanic material, was accelerated, probably owing to uplift, and the deposits extended into the Merced sea as lagoonal and deltaic deposits that interfingered with the Merced formation. The volcanic activity was most extensive in the eastern part of the area and apparently continued over a considerable period of time, during which were inter mittent periods of quiescence in which sediments derived from the volcanic rocks were deposited. There are indications that as the volcanism ceased gradually, sporadic outbursts occurred at isolated centers, so that the age and structural relationships of the continental Glen Ellen formation, which in general overlies but in part probably interfingers with the volcanics, vary from place to place. After the volcanism ended, deposition and local interfingering of the Glen Ellen and Merced formations continued.
Late in Pliocene time and continuing into the Pleistocene, the Sonoma volcanics and Glen Ellen and Merced formations were up lifted, folded, and faulted. The coastal depositional basin apparently
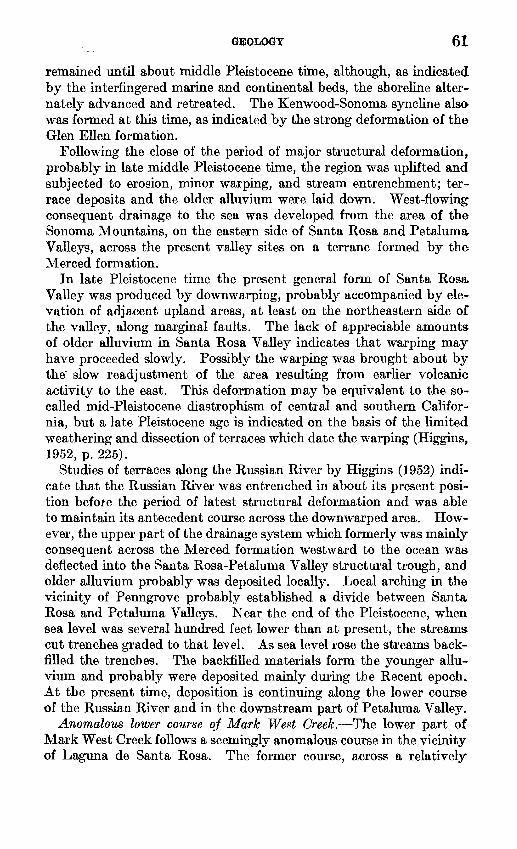
GEOLOGY 61
remained until about middle Pleistocene time, although., as indicated by the interfingered marine and continental beds, the shoreline alter nately advanced and retreated. The Kenwood-Sonoma syncline also was formed at this time, as indicated by the strong deformation of the Glen Ellen formation.
Following the close of the period of major structural deformation, probably in late middle Pleistocene time, the region was uplifted and subjected to erosion, minor warping, and stream entrenchment; ter race deposits and the older alluvium were laid down. West-flowing consequent drainage to the sea was developed from the area of the Sonoma Mountains, on the eastern side of Santa Rosa and Petaluma. Valleys, across the present valley sites on a terrane formed by the Merced formation.
In late Pleistocene time the present general form of Santa Rosa. Valley was produced by downwarping, probably accompanied by ele vation of adjacent upland areas, at least on the northeastern side of the valley, along marginal faults. The lack of appreciable amounts of older alluvium in Santa Rosa Valley indicates that warping may have proceeded slowly. Possibly the warping was brought about by the" slow readjustment of the area resulting from earlier volcanic activity to the east. This deformation may be equivalent to the so- called mid-Pleistocene diastrophism of central and southern Califor nia, but a late Pleistocene age is indicated on the basis of the limited weathering and dissection of terraces which date the warping (Higgins, 1952, p. 225).
Studies of terraces along the Russian River by Higgins (1952) indi cate that the Russian River was entrenched in about its present posi tion befo/e the period of latest structural deformation and was able to maintain its antecedent course across the downwarped area. How ever, the upper part of the drainage system which formerly was mainly consequent across the Merced formation westward to the ocean was deflected into the Santa Rosa-Petaluma Valley structural trough, and older alluvium probably was deposited locally. Local arching in the vicinity of Penngrove probably established a divide between Santa Rosa and Petaluma Valleys. Near the end of the Pleistocene, when sea level was several hundred feet lower than at present, the streams cut trenches graded to that level. As sea level rose the streams back filled the trenches. The backfilled materials form the younger allu vium and probably were deposited mainly during the Recent epoch. At the present time, deposition is continuing along the lower course of the Russian River and in the downstream part of Petaluma Valley.
Anomalous lower course of Mark West Creek. The lower part of Mark West Creek follows a seemingly anomalous course in the vicinity of Laguna de Santa Rosa. The former course, across a relatively

62 GROUND WATER IN SANTA ROSA AND PETALUMA VALLEYS
wide flood plain in the SK of 8/9-34 and 35, has been abandoned in favor of the present course, a rather circuitous route to the Laguna between low outliers of the Glen Ellen formation. From the Laguna the creek flows through a narrow channel cut in bedrock of the Franciscan group east of Trenton, then in an alluvial channel, which it apparently has occupied continuously during Recent time, to its junction with Windsor Creek. There are several possible explanations for the anomalous course, but the following is deemed the most plausible from what is presently known.
A comparison of stream courses suggests that the alluviation of trenches cut when sea level was lower has taken place more rapidly along the lower part of Mark West Creek than in the Laguna de Santa Rosa, thus impeding through drainage from the Laguna and maintaining swampy conditions there. When the flood plain of Mark West Creek at the northern end of the Laguna had been aggraded to near its present level, the creek, when at floodstage, spilled over its flood plain into the Laguna. The creek probably became entrenched in the course of a short tributary to the lower Laguna, so the process, in part, may have been stream piracy. When the level of the Laguna rose sufficiently to allow through flow to the Russian River, the outlet fortuitously occupied an old bedrock saddle cut by a tributary of the old drainage system that was graded to a lower sea level. The evidence suggests that the diversion of the creek into the Laguna and the reestablished flow through the bedrock channel have occurred during late Recent time. During flood periods the main current flows over the flood plain so that deposition on the flood-plain surface is continuing.
Some writers have attributed the marshy conditions along the Laguna, at least in part, to local subsidence; however, the more rapid aggradation along the lower part of Mark West Creek, as suggested above, seems a more likely cause and is at least a contributing one.
GROUND WATER
The two principal ground-water basins in the area are in Santa Rosa Valley and in Petaluma Valley. Because the hydraulic inter connection between the two is relatively poor, ground water in each has been discussed separately.
GENERAL HYDROLOGIC PRINCIPLES
The occurrence of ground water in the area of this report, as elsewhere, is controlled by climate and geologic conditions. Precipitation is the ultimate source of essentially all ground water of economic importance. Rainfall enters the ground-water reservoir by direct infiltration and

GROTJND WATER 63
by downward or lateral percolation from streams that are above the water table.
Practically all ground water is in motion, moving from points of higher altitude in the intake or recharge areas to points of lower altitude in the discharge areas. Rates of movement usually range from a few feet per year to several feet per day. Discharge from any given area by natural means occurs by evapotranspiration (combina tion of evaporation from soil and transpiration by plants), effluent seepage into streams, and underflow through water-bearing materials where physical conditions permit.
Any formation or stratum yielding water in sufficient quantity to be important as a source of supply is an aquifer, or "water-bearing formation" (Meinzer, 1923a, p. 52). An aquifer may hold water in storage, or, more commonly, "transient storage," the amount available being dependent on the specific yield and the dimensions of the aquifer. Unconsolidated deposits gravel, sand, and clay are commonly more porous than sandstone and other consolidated rocks which may be compacted or have cementing material filling many of the interstitial spaces. However, many rocks in the latter group are sufficiently permeable to function as important ground-water reser voirs. If pore spaces are relatively large and interconnected, as in sand and gravel, water is transmitted freely and the deposit is said to be permeable. If the spaces are small or poorly connected, as in clay or cemented sandstone, the rock is of low permeability and water is transmitted very slowly, and the rock may be called an aquiclude. Thus, permeability is the capacity of a rock to transmit water under pressure, and the coefficient of permeability may be defined as the rate of flow of water, in gallons a day at a temperature of 60° F, through a cross-sectional area of 1 square foot under a hydraulic gradient of 100 percent, or through each mile of the water-bearing bed under investigation (measured at right angles to the direction of flow) for each foot of thickness of the bed and for each foot per mile of hydraulic gradient. If the determination is made under prevailing conditions in the field, the principal difference being that it is made at the prevailing temperature of the water rather than at 60° F, the constant is called the field coefficient of permeability. The product of the field coefficient of permeability and the thickness of the saturated portion of the aquifer, in feet, is the coefficient of transmissibility (Wenzel, 1942, p. 7).
The specific yield of a deposit may be defined as the ratio of the volume of water the deposit will yield by gravity to the saturated volume of the deposit (Meinzer, 1923b, p. 28). This ratio is commonly much less than the porosity because of specific retention, the volume of

64 GROUND WATER EST SANTA ROSA ANJ> PETALUMA VALOSTS
water held in pore spaces against gravity by molecular attraction and capillary force, compared to the total volume of the deposit.
If the water in an aquifer is not confined by an overlying imperme able stratum and has a "free" surface at atmospheric pressure, water- table conditions prevail. Water is obtained from an aquifer of this type by dewatering the deposits in the vicinity of the well, and water- level fluctuations reflect actual changes in ground-water storage. The water table is generally defined as the level at which unconfined ground water will stand in an opening of supercapillary size (such as a well) in an aquifer. If an aquifer is overlain by an impermeable stratum, the water in it is called confined water, and the water-level fluctuations reflect changes in pressure of the confined water. If water in a well penetrating the aquifer rises above the top of the confining stratum under hydrostatic pressure, the water is said to occur under artesian conditions (Meinzer and others, 1942, p. 451). When such water is yielded by the aquifer, dewatering of the deposits adjacent to the well does not occur, and the aquifer acts as a conduit to transmit water from areas of recharge to the well. Some water is supplied by its own expansion and the compression of the aquifer due to the lowering of hydrostatic pressure.
The amount of water yielded from storage under either water-table or artesian conditions is expressed by the coefficient of storage. The coefficient of storage is defined as the volume of water released from 01 taken into storage per unit surface area of the aquifer per unit change in the component of head normal to that surface. For water- table conditions the coefficient of storage is essentially equal to the specific yield of the material unwatered during the pumping. The coefficient of storage for a confined aquifer is much smaller than that for a water-table aquifer formed of the same material, drained by gravity. Generally, in deeper ground-water basins containing valley- fill deposits, such as in the area of this report, both water-table and confined conditions occur, and the water levels in wells reflect com posite conditions. Locally in the Santa Rosa and Petaluma Valley areas water occurs under water-table, artesian, and subnormal pressure-head conditions. Under subnormal pressure-head conditions the static level in wells is lower than the water table (Meinzer, 1923b, p. 38).
The yield of a well is dependent on the following factors: (1) Depth, diameter, and type and efficiency of construction of the well; (2) depth to water and saturated thickness of permeable materials penetrated (aquifers); (3) permeability of the aquifers; (4) amount and type of well development; and (5) capacity of the pump.
The geologic and hydrologic conditions that affect the amount of water in and movement of water through the aquifers tapped by the

GROUND WATER 65
well determine how uniformly the yield will be sustained. The first four of these factors affect the specific capacity, a term generally used to indicate the productivity of a well. The specific capacity is defined as the amount of water, in gallons per minute (gpm) , yielded for each foot of drawdown of water level in the well. Because of differences in well depths and the manner in which wells are completed, specific capacities are not an exact measure of the relative permeability of the water-bearing materials tapped by individual wells. To obtain a rough measure of the permeability of the material yielding water to a well, a comparative index, termed yield factor, is sometimes used. The term was originally introduced by Poland, Sinnott, and others 12 and was expressed "as an approximate relative measure for the permea bility of the water-bearing material tapped by a well." It was defined as the specific capacity divided by the thickness, in feet, of the water bearing material yielding water to the well. The quotient obtained was multiplied by 100 to avoid decimal values. In the initial use of the term in the Long Beach-Santa Ana area in California, the specific capacity was divided by the thickness of water-yielding material open to the perforations. As used in this report, the yield factor is defined as the specific capacity divided by the thickness of saturated material penetrated by the well, multiplied by 100. The modification of the original usage was necessary because some of the wells are gravel-wall wells to which most of the gravel-wall section of the hole contributes water, not just the section opposite the perforations in the casing, and because perforation data are lacking for many other wells in the Santa Rosa and Petaluma Valley areas. Furthermore, to the extent that there is vertical continuity of the permeable materials, the entire thickness of the aquifer contributes water to any well that is perforated in a part of its thickness. The derivation of the yield factor in dimen sional units is given below: 13
v . , , , , Yield factor=
o -c - t fdischarge (gpm)l Specific capacity -= -j-5 ,f 'r r j Ldrawdown (feet)J . j ,, . , - Saturated thickness
=gpm/ft/ft/X100
Although the differences in well depth are accounted for in deriving the yield factor, differences in well efficiency resulting from differences hi construction are not. Thus, for the best results, wells similarly constructed and perforated should be selected for comparison.
M Poland, J. F., Sinnott, Alien, and others, Withdrawals of ground water from the Long Beach-Santa Ana area, California: unpublished rept. in flies of U. S. Qeol. Survey, 1945, p. 57.
13 In this area the saturated thickness used was depth of well minus average depth to water below the land surface during spring, the assumption being made that the vertical continuity of the permeable materials was poor enough that the part of the aquifer, if any, below the bottom of the well contributed little water to the well. Where data on depth to water in the well were lacking, the local average depth to water was used.

66 GROUND WATER IN SANTA ROS'A AND PETALUMA VAULTS
Transmissibility may be roughly estimated by the Thiem formula (Wenzel, 1942, p. 81) using the drawdown in the pumped well, the estimated effective well diameter (generally 10-12 inches), and an assumed radius for the cone of influence a value of 300 feet for water- table conditions and 3,000 feet for confined conditions can be used to represent average operating conditions. An estimate of the field coefficient of permeability can then be obtained by dividing the transmissibility by the thickness of the aquifer, if it is completely penetrated by the well. If the well only penetrates part of the aquifer, permeability estimates greater than actual values will be obtained. However, in many cases, entrance losses due to poor well development or incomplete screening, even of fully penetrating wells, will tend to produce the effect opposite to, and thus compensate for, partial penetration, so that the rough values obtained are comparable to actual values. This method of obtaining an estimate of permeability is essentially the same as that used to obtain the yield factor; therefore, rough quantitative estimates for peimeability may be obtained by multiplying the yield factor by a number which from experience in other areas has been found to be about 15 for water-table conditions and 20 for confined conditions. In several valley-fill areas in Cali fornia where semiconfined conditions exist, as in this area, multiplying the yield factor by 17 has given permeability estimates that compare reasonably well with values obtained in pumping tests. When the full saturated thickness penetrated is used in deriving the yield factor, however, and the factor is multiplied by 17, the rough value of permeability so obtained is an average for all the saturated materials penetrated, including clay and silt as well as sand and gravel. The average permeability of the water-yielding beds tapped would be higher than that of the full saturated section, in inveise proportion to the percentage of water-yielding beds as compared to the full saturated section. Thus, if the average permeability of the saturated deposits tapped by a well as estimated by multiplying the yield factor times 17 is 1,000, and if only one-quarter, or 25 percent, of the saturated de posits tapped are water-yielding beds (sand, gravel, or other permeable materials), the average permeability of the water-yielding beds so estimated would be 4 times as great, or 4,000. It is important to keep this fact in mind in the following discussion, which derives estimated permeabilities for the full saturated section tapped by wells.
SANTA ROSA VALLEY AREA
The Santa Rosa Valley area includes Santa Rosa Valley and its minor tributaries, that portion of the Russian River flood plain border ing it on the northwest, and Bennett Valley, Rincon Valley, Kenwood Valley, and the Glen Ellen area on the east. The principal ground-

GROUND WATER 67
water basin in the area is Santa Rose Valley. Hydrologic interconnec tion exists between Santa Rosa Valley and the Russian River flood plain, between Santa Rosa Valley and Bennett Valley and Rincon Valley, between Rincon and Kenwood Valleys, and between Kenwood Valley and the Glen Ellen area.
The principal water-bearing deposits underlying Santa Rosa Valley are the Glen Ellen and Merced formations; beneath the Russian River flood plain, the younger alluvium; and beneath the small valleys east of Santa Rosa Valley, the younger and the older alluvium, the Glen Ellen formation, and the Sonoma volcanics. The areal distribution of these formations is shown on the geologic map (pi. 1), and the sub surface extent, lithology, and thickness are shown on cross sections (pis. 3-5, and fig. 5).
PRINCIPAL WATER-BEARING FORMATIONS
YOUNGER AIIUVIUM
Except for small areas in the lower portions of the principal valleys and in the Russian River valley, the younger alluvium generally consists of only a thin veneer of poorly sorted, mostly fine-grained material resting on the older deposits. Much of it is not perennially saturated and is probably of low permeability. In the downstream parts of Rincon and Bennett Valleys, and near the mouth of Mark West Creek, the younger alluvium may yield some water to wells. Many wells penetrate the younger alluvium, but generally they are not perforated opposite these deposits.
Pump-test data for a few wells on the Russian River flood plain provide the only information relating to the yield of the younger alluvium, other than a few verbal reports of yields in Petaluma Valley. A test of well 8/9-9H1, which penetrated "loose yellow sand and gravel" between depths of 2 and 38 feet, indicated a yield of 250 gpm and a drawdown of 3 feet below a static depth to water of 13 feet at the beginning of the test; the yield increased to 350 gpm at the end of the test, and no additional drawdown was reported. This test indi cates a specific capacity of about 115 gpm per foot of drawdown and a yield factor of about 460. By use of the method outlined onpage 65, the permeability of the sand and gravel bed is estimated to be on the order of 7,000-8,000 gallons a day per square foot. Well 8/9-15Ml has a specific capacity of about 70 gpm per foot of draw down, and specific capacities for wells tapping the younger alluvium which were not influenced by recharge from the Russian River have been reported to be as high as 450 gpm per foot of drawdown.
Ground water in the younger alluvium generally is unconfined or only slightly confined. Locally in the southern end of Kenwood Valley poorly permeable beds near the surface cause slight confinement.

68 GROUND WATER IN SANTA EOSA AND PETALUMA VALLEYS
Well 7/6-32F1, which penetrates "tule mud" between the surface and a depth of 21 feet, generally has a head slightly above the land surface during the spring (pi. 10); however, this phenomenon may result from confinement in the Glen Ellen formation, which the well penetrates beneath the younger alluvium.
Ground water moves from points of recharge down gradient, and much of the recharge to the younger alluvium percolates downward to recharge the underlying more heavily pumped formations. In general, the quality of the water in the younger alluvium is good for most uses; however, for domestic use it may be slightly hard and may contain objectionable quantities of iron.
OLDER ALLUVIUM AND TERRACE DEPOSITS
The terrace deposits have a limited extent and are mostly above the average position of the water table when it is at its seasonal low, except along the western side of the Russian River where they attain greater thickness and yield water to some wells. However, because these are small, isolated aquifers, they yield large quantities of water only where they extend beneath the younger alluvium. Water in these deposits probably is unconfined and locally is in hydraulic contact with that in the younger alluvium. Well yields are moderate to poor. The quality of the water is good except for a high iron content.
In the Santa Rosa Valley area, the older alluvium probably yields water to wells in Ken wood Valley and in local areas where it underlies the younger alluvium. Where exposed as isolated, thin, elevated deposits, it probably yields little water. Because of the inferred limited subsurface occurrence and difficulties in distinguishing the older alluvium from the overlying younger alluvium and underlying Glenn Ellen formation, well yields cannot be used as a general index of the permeability, but the lithology indicates that the permeability is relatively low. Water in the older alluvium may be confined locally. The water is inferred to be of good quality, but locally it probably is slightly hard and contains iron in sufficient quantities to be objection able for domestic use.
GLEN ELLEN FORMATION
The Glenn Ellen formation underlies the greater part of Santa Rosa Valley and together with the Merced formation forms the principal ground-water reservoir in the area. The Glen Ellen supplies water to numerous wells, including many irrigation wells. Some wells produce more than 500 gpm, but for most wells the specific capacities are less than 10 gpm per foot of drawdown. For wells deriving all their water from the Glen Ellen formation, the highest specific capacity reported was 30 gpm per foot of drawdown for 8/8-20Q1. The yield factor for

GROUND WATER 69
this well is 10, suggesting a permeability of roughly 170 gallons per day per square foot for the formation locally. The yield factor for well 8/9-23L1 was 6, suggesting a permeability of about 100. The deposits of the Glen Ellen formation tapped by wells in Santa Rosa Valley probably are in the upper part of the formation, and, except near the outcrop along the northeastern side of the valley, are finer grained than the lower part but less consolidated and generally more permeable.
In Kenwood and Rincon Valleys and on the eastern side of lower Bennett Valley, most wells tap considerably deformed and hetero geneous beds near the base of the Glen Ellen formation that yield only small to moderate quantities of water to wells. In Kenwood Valley and in the Glen Ellen area, the yields are extremely low and commonly a thick section must be penetrated to obtain an adequate supply even for domestic use. From a very few wells sufficient water is obtained for limited irrigation, but the pumping lifts commonly exceed the economic limit. The low permeability in these areas may be due to the high percentage of weathered tuff contained in the deposits.
Water in the Glen Ellen formation is confined locally in areas of folding and faulting along the margins of some valleys, and also in other parts of the valleys where extensive lenses of impermeable material are present. Flowing wells and other wells having heads considerably above the water table are located on the southeastern side of Rincon Valley; in limited marginal and upland areas, north (mostly in 7/8-13D and 7/8-12N) and south of the city of Santa Rosa; and in synclinal areas northwest of Glen Ellen. However, beneath most of Santa Rosa Valley, water in the Glen Ellen formation occurs under water-table conditions.
MERCED FORMATION
The Merced formation forms the low hills on the western side of Santa Rosa Valley and underlies them to depths exceeding 1,000 feet. The formation dips beneath the valley and is penetrated by many wells on the western side of the valley. Figure 3 shows the line west of which wells obtain water from the Merced formation at depths of less than 200 feet. The depth jx> the top of the Merced varies, depending on the distance from the line of outcrop and the local relation of inter- bedding with the Glen Ellen formation. On figure 3, the two eastward bulges on the 200-foot contour suggest areas where prominent tongues of the Merced extend eastward at relatively shallow depths.
In general, the Merced formation is only poorly to moderately permeable; however, much of the material penetrated by wells gen erally is water yielding. Locally, some clean sand beds in the Merced,

70 GROUND WATER IN SANTA ROSA AND PETALUMA VALLEYS
Which are believed to be old beach deposits, are highly permeable. The specific capacities of wells for which records of pump tests are available range from 2 to 29 gpm per foot of drawdown. The highest values obtained were for wells near the contact with the Glen Ellen in the western part of Santa Rosa Valley, where the upper part of the Merced is tapped, and the lowest were for wells near the western edge of the outcrop, where the indurated basal deposits are tapped. The average specific capacity of wells tapping the lower part of the Merced is about 1 gpm or less per foot of drawdown, whereas in the upper part the average is more nearly 5-6 gpm. The yield factors for these wells range fiom 1 to 15, suggesting a range in permeability from 15 to 250 and an average of roughly 100 gallons per day per square foot for the Merced formation.
Ground water in the Merced formation is not confined except locally where differences in vertical permeability create pressure heads which are slightly above the water table in some wells. Many wells west of Graton in the downstream parts of the valleys of Atas- cadero and Green Valley Creeks flow or have heads slightly above the water table. Of these, some are deep and some are relatively shallow. In April 1951, water in wells 7/9-28P1 and 28P2, 585 and 100 feet deep, respectively, flowed over the top of the casings, which extended about 2 feet above the land surface. The flow of the deeper well was about 30 gpm and the temperature of the water was 69° F; of the shallow well, 5 gpm and 60° F. These data suggest the presence of one or more confining strata. Well 6/8-17K3, 132 feet deep, and several wells in 6/9-12 flow during the spring. Beneath Santa Rosa Valley, ground water in the Merced and Glen Ellen formations is essentially a single water body, and no significant hydraulic disparity exists between the two formations. The quality of water from the Merced formation is generally satisfactory.
SONOMA VOLCANICS
Although the Sonoma volcanics underlying the Santa Rosa Valley do not form a significant part of the ground-water basin, they are an important source of water in the tributary valleys, especially Bennett Valley, the southeastern part of Kenwood Valley, and the eastern part of the Glen Ellen area.
In the upper part of Bennett Valley good yields are generally obtained at depths of less than 500 feet from volcanic ash interbedded with basaltic flows underlying alluvium of the Glen Ellen formation. The water is generally confined and locally is under appreciable head. For example, on April 18, 1950, well 7/7-32G1 had an artesian flow of about 150 gpm; and the water levels in wells 7/7-29L1 and L2 were about at the land surface on the same date. The artesian water is

GROUND WATER 71
separated from the unconfined water in the overlying alluvial deposits by relatively impermeable lava beds.
In places along the margins of the northwestern part of Kenwood Valley, wells tap the volcanic rocks tuff breccia, andesite, basalt, and rhyolitic tuffs and flows but generally the yield is small. On the northwestern and southeastern flanks of Kenwood Valley, rhyolitic beds crop out and dip beneath the valley. The low yields of wells in that area and in rhyolitic terrane west of Kenwood, compared with the relatively good yields of wells in basaltic terrane east of Glen Ellen and in Bennett Valley, suggests that the basic volcanic rocks are more permeable than the acidic ones.
At the western edge of Rineon Valley and in most of the area between Rineon and Santa Rosa Valleys, adequate supplies for domes tic use can be obtained from wells drilled in the volcanic rocks. Well depths and yields have a considerable range, owing to the hetero geneity of the rocks, the position of the water table, and the local topography. The water beneath those areas may be confined locally, but no abnormally high heads have been noted.
In the southeastern part of Kenwood Valley the largest yields are obtained from wells tapping the volcanics. Well 7/7-29M1, 400 feet deep, is reported to yield 500-600 gpm; well 7/6-32H1, 406 feet deep, is reported to have a natural flow of about 200 gpm and to yield 1,000 gpm when pumped. Both wells penetrate several hundred feet of volcanic rocks. The yield of the latter well increased about tenfold after it was drilled into the volcanic rocks. Thus, ground water is locally confined by lava beds, and the water has considerable head in some wells. However, near the center of the valley, water levels in wells tapping the volcanic rocks are similar to those in wells penetrating only the alluvium, suggesting that locally ground water in the two units is in hydraulic continuity. Ground water moving up into the alluvium from the Sonoma volcanics may contribute to the water logging in the "wet" area southeast of Kenwood.
In the Glen Ellen area, most of the better yielding wells tap the Sonoma volcanics and probably obtain water from tuffs or waterlaid volcanic ash and fractured flow rocks. Similarly, on the southeastern side of Santa Rosa Valley, numerous domestic wells obtain water from rocks of the Sonoma volcanics, perhaps chiefly from tuff breccias and intercalated volcanic sediments and fractured flows. Here the relation of water in the volcanic rocks to that in the principal water body beneath Santa Rosa Valley is not clearly understood, but locally water in the volcanic rocks appears to merge with the principal water body.
In Bennett Valley the deep wells, 900-1,200 feet deep, in the main well field of the city of Santa Rosa (7/8-24A) obtain much of their

72 GRIOTJND WATER EST SANTA ROSA AND FETALUMA VALLEYS
water from the volcanic rocks. These wells yielded 500-2,000 gpm during tests; the shallow wells in the same field which tap only alluvium and the Glen Ellen formation yield less than 500 gpm. Many wells farther east penetrate the volcanic rocks at relatively shallow depths and are partly supplied from them. Lines on figure 13 show the approximate depth to the top of volcanic strata in this area. Many wells drilled into the volcanic rocks at the eastern edge of lower Bennett Valley obtain only meager yields. Water levels measured in that area in the spring of 1951 indicate that some of the water in the volcanic rocks is under a lower head than that in the alluvium. Water in volcanic strata beneath alluvium in the lower part of Bennett Valley is somewhat confined, but, in most wells tapping either one or both, a common head is usually found.
On the western side of Santa Rosa Valley, the Sonoma volcanics are not an important source of water, and beneath the central valley floor no water wells are known to tap the volcanic rocks. The quality of water in the Sonoma volcanics is generally satisfactory, although the dissolved-solid content is somewhat high.
PETALUMA FORMATION
The Petaluma formation is not an important source of ground water in the Santa Rosa Valley area. It may be penetrated by a few deep wells at the southern end of the Cotati plain, but the beds tentatively identified as the Petaluma formation are chiefly tough clays. Well 6/8-33E1, 215 feet deep, apparently taps the Petaluma formation where it is uplifted along the Tolay fault, but it produces only about 5 gpm. A few other wells in this area may obtain small amounts of water from the Petaluma formation. Deep wells in the low bills that separate the Cotati plain from the small valley southesst of Penngrove penetrate the Petaluma formation; however, most obtain little water from it.
PRINCIPAL WATER BODY
EXTENT, NATURE, AND DEPTH TO WATER
The principal water body in the Santa Rosa Valley area is contained in the unconsolidated deposits, consisting of the younger and older alluvium and the Glen Ellen and Merced formations, which occupy the large structural downwarp of which the floor of Santa Rosa Valley is the modified surface expression. The water body extends laterally beneath the hills on the west side of the valley, which are underlain by deposits of the Merced formation, and beneath the bordering hills on the east, which are underlain by the Glen Ellen formation and some volcanic rocks that are not separated from the principal body by stratigraphic or structural barriers. In all, it underlies an area of

GROUND WATER . 73
about 150 square miles. This water body is hydraulically connected with many of the smaller water bodies in the minor tributary valleys. However, the water is continuous with only the unconfined water in Bennett and Rincon Valleys, which in turn is connected with the ground water upstream in Kenwood Valley. In Bennett, Rincon, and Kenwood Valleys the principal water body is in the younger and the older alluvium, in the Glen Ellen formation, and locally in the Sonoma volcanics.
The principal water body does not occur under true water-table conditions, but, on the other hand, tbe incomplete confinement that does exist rarely produces large differences in head. Head differences, as reflected by water levels in wells, normally are small and are caused by differences in vertical permeability in the lenticular de posits tapped. True water-table conditions occur in shallow wells where permeable deposits extend to and above the water level. Wells tapping several permeable zones usually have a water level that represents a composite or average pressure head which may be higher or lower than the water table, depending upon the head in the aquifers. In the northern part of Santa Rosa Valley, extensive, thick lenticular deposits of clayey material (drillers usually log it as "clay") impede the vertical movement of water sufficiently to produce large differ ences in head during the pumping season in adjacent wells tapping beds above and below the "clay." Wells tapping deeper beds gener ally have lower water levels than nearby shallow wells. The be havior of water levels in two pairs of adjacent shallow and deep wells is shown on figure 7. In the vicinity of the Cotati auxiliary landing field (6/8-23), artesian conditions occur locally in wells tapping the Merced formation, possibly as a result of poorly permeable continental- type deposits overlying permeable, dipping sands of the Merced. The separation within the principal water body is not sufficiently wide spread to warrant a separation into zones; furthermore, in places where there is separation the vertical boundary ranges widely.
The depth to water in the principal water body ranges within comparatively narrow limits, depending chiefly on the terrain, as the water table generally assumes a shape that corresponds in generalized form to that of the land surface; water levels in the upland area are higher than those on the valley floor but are farther below the land surface. During spring of 1951, water levels in wells in the flat valley areas generally were only 5-20 feet below the land surface, and in the lowest parts of the valleys they were locally less than 5 feet below. Along the sides of the valley, where the land surface slopes upward, water levels normally increase in depth, except where the water is confined.
443616 58 6

74 GROUND WATER IN SANTA ROSA AND PETALTJMA VALLEYS
FLUCTUATIONS OF WATER IEVELS
In the Santa Rosa Valley area about 60 wells were measured periodically during the period 1949-52 to determine the general character and magnitude of the water-level fluctuations. Periodic measurements were begun in about 30 wells in the fall of 1949. Initially the measurements were weekly, being changed first to a monthly, then to a semiannual, and finally to an annual basis. About 50 wells were measured in 1950 and about 60 in 1951. Measurements were con tinued in most wells until the autumn of 1952, when the well-measur ing program \vas reduced so as to embrace only 25 wells, which were measured semiannually. This schedule was continued through April 1954. Since April 1954, the only measurement made was in the spring of 1955. The periodic measurements are given in table 19. In addition a study was made of the fluctuations themselves, automatic water-level recorders being operated in three wells (fig. 6) during the time that field work was in progress. Hydrographs were plotted for most observation wells.
Water-level fluctuations fall mainly into three general categories short-term, seasonal, and long-term. In general these fluctuations show different hydrologic features. Short-term fluctuations include daily changes in water level due to pumping; effects of variations in natural discharge, earth and ocean tides, changes in barometric pressure, and wind; and instantaneous fluctuations caused by earth quakes and by movement of heavy loads, such as railroad trains, in the vicinity of the well. Short-term water-level fluctuations, in
RAINFALL AT SANTA ROSA.CALIFORNIA
1949 I960 1951 1952
FIGURE 6. Hydrographs showing fluctuations of water levels in three wells in the Santa Rosa Valley, and graph showing monthly rainfall at Santa Rosa, Calif., 1949-52.

GROUND WATER 75
9/9-34NI (depth 198
v-1"X /v^~\\ Pumping\ tevel /
/^^"" ^-^/ /
8/9-I5MI (depth 42 fee_^V /^\
^V/"^^____ ^^__^/
7/8-20LI (depth 58 feet)r\/\
7A~
7 V V7/8-20KI (depth 626 feet) 7
7. Hydrographs showing fluctuations of water levels in paired shallow and deep wells in the Santa Rosa Valley area, California, 1949-54.
general, reveal characteristics of the aquifer, whereas the seasonal and long-term fluctuations commonly serve as an index to the amount of water in storage and may indicate whether there is an overdraft or .a surplus.
Seasonal fluctuations. Depending upon the distribution and amount .of rainfall and the magnitude and duration of the pumping, water levels in Santa Rosa Valley are usually highest in the spring, during or shortly after the rainy season, and are lowest in the autumn, at the end of the pumping or irrigation season. The water levels in .deep wells may change more slowly than those in shallow wells because the deep aquifers receive recharge more slowly than do the shallow ones. The hydrographs on figure 7 show that the rise of the water level in well 7/8-20K1, 626 feet deep, lagged behind that in well 7/8-20L1, 58 feet deep, about 1 month in the winter of 1950 .and about 3 months in the winter of 1951. However, the hydrographs of shallow well 8/9-15M1 and deep well 9/9-34N1 show that the water levels rose at about the same rate. Figure 6 shows hydrographs of the three wells in which automatic water-level recorders were oper- .ated. Shallow well 7/8-29Q1 has a graph similar to that of deep well 7/8-31C 1. However, the large amplitude of the fluctuation and the rapid response to pumping of the level in the deep well, as shown on the weekly recorder chart, indicates that the water is confined to some extent; whereas the slow response in the shallow well indicates es sentially water-table conditions.

76 GROUND WATER IN SANTA RQ®A AND PETALTJMA VAIXEYB
In Santa Rosa Valley water levels normally are 5-20 feet below the land surface in the spring. Before pumping is begun in the spring, high water levels in deep wells generally approximate those in nearby shallow wells. In the autumn the disparity in levels between shallow and deep wells depends chiefly on the amount of draft from the groun^- water body during the pumping season. The disparity in levels decreases in proportion to the rate of recovery of pressure head in the deep aquifers after pumping stops. The autumn water levels in deep wells range from 15 to 35 feet below the land surface; in shal low wells, from 10 to 20 feet, Thus, during 1950 and 1951 the .average seasonal decline of water levels in shallow wells was less than 10 feet; in deep wells, less than 15 feet. However, as the develop ment of ground water increases, the seasonal fluctuation of water levels also increases.
In the hilly area in the vicinity of Sebastopol the depth to water varies widely with the undulating topography in a few places the levels are above the land surface; in others they may be as much as 100 feet below the land surface. However, in the spring, most levels are between 10 and 50 feet below the^land surface. The seasonal fluctuation of water level is generally 5-10 feet, seldom more, and locally is less than 5 feet. The water level in well 7/9-35D2 (fig. 8)
V 0
-J 15
Gj20
t 25 U-
J.30
6/8--7P2 (depth \ZO
I
-
eet)
/\ /
' S /V
VyKV/\ /
- /
-
£257/9-3502 (depth 167
(No perforation^
-
eel)
^-^-
^-x-
-
FIGURE 8. Hydrographs showing fluctuations of water levels in three wells tapping the Merced formation in Santa Rosa and Petaluma Valleys, Calif., 1949-54.

GROUND WAT EB 77
7/7- I8QI (depth 250 feet)
V Shallow strata sealed off during time interval
between measurements
FIGURE 9. Hydrographs for three wells in the mouth of Bennett Valley, Calif.
stood higher in October 1952 than in April 1951, and the hydrograph shows an overall upward trend for the period 1950-52. The rise probably reflects the increased rainfall during the period, and slow response to recharge from a distant source.
Wells in the mouth of Bennett Valley show a relatively wide range of water-level fluctuations, probably owing to large withdrawals from the Santa Rosa city wells in 7/8-24A. The ranges in water levels in wells 7/8-24H1 and H2 were 17.46 and 21.35 feet, respectively, in the 1953 pumping season. However, the rise in levels from November 1952 to April 1953 were 32.90 and 29.34 feet, respectively. Spring peak water levels do not indicate a net decline, but they do indicate an increase ii« the seasonal fluctuation (fig.9).
The abnormal 1953 seasonal decline of water level in well 7/7-18Ql (fig. 9), which amounted to more than 30 feet, compared with a normal fluctuation of 15-20 feet, apparently reflects a local difference in head between shallow and deep water. Shallow strata in the well,
78 GROUND WATER EST SANTA ROSA AND PETALUMA VALLEYS
7/7-6RI [depth 133 f >et)
~"^"~-~..~--..._^
-~-./x\"^/
7/6-19NI (depth 149 feet)
7/6-32FI (depth 190 feet)
. J^^-^^^ ,
FIGURE 10. Hydrographs for three wells tapping the principal water bodies in Eincon and KenwoodValleys, Calif.
250 feet deep, were sealed off during the late spring or summer of 1953, and subsequent measurements indicate that the hydrostatic head in the deep zone, which is heavily pumped locally, is lower than in the shallow zone. In the spring of 1954 the level was about 20 feet below the normal spring level.
Water levels are relatively high in Rincon Valley and in the southern part of Kenwood Valley (fig. 10). In the northern part of Kenwood Valley and near the margins of Rincon Valley the local seasonal fluctuation may be relatively large because of the relatively low permeability of the Glen Ellen formation in those areas.
Long-term fluctuations. Other than records of a few water-level measurements made by the U. S. Bureau of Reclamation 14 hi the autumn of 1941 and the spring of 1942 and scattered measurements by drillers, data on the long-term fluctuations of water levels in the Santa Rosa Valley area are limited to the relatively short period 1949-54. Of the wells measured by the Bureau of Reclamation 24 were subsequently measured by the Geological Survey. Of those wells, 20 were measured at about the same tunes of the year by the
» Gamer, E. L., Geological and ground-water reconnaissance of Santa Eosa plains Eussian Eiver studies-general investigations, California: unpublished rept. in flies of Geologic branch, U. S. Bur. Eecla- mation 1942.

GROUND WATER . 79
two agencies. (See table 17.) A comparison of the autumn levels in 1941 and 1949-52 reveals that levels in 10 wells declined by amounts ranging from 1 to 13 feet, averaging 4.6 feet, and that levels in 3 wells rose by amounts ranging from 1 to 16 feet, averaging 12.7 feet. Selective averages showed an average decline in 8 wells of 2.7 feet and an average rise in 2 wells of 2.6 feet. Comparison of spring levels reveals that levels in 7 wells declined over the period 1942 to 1950-52 by amounts ranging from 0.1 foot to 9.2 feet, averaging 3.4 feet, and that levels in 3 wells rose by amounts of 0.5 foot to 1.7 feet, averaging 1.1 feet. The selective average for 6 wells in which water levels declined is 2.6 feet.
However, rainfall for the water years 1940, 1941, and 1942 was far above average, amounting to 38.55, 51.78, and 39.98 inches, respec tively. By comparison, rainfall during the water years 1949, 1950, and 1951 amounted to 19.86, 25.42, and 32.06 inches, respectively. Therefore the water-level changes, as suggested by the above com parisons, are significant only in that they show that the recharge was greater during the water year 1942 than during the water year 1952, owing to the greater rainfall.
The hydrographs for the period of record show no significant or widespread water-level trends other than those attributable to the amount of yearly rainfall. Except for some wells in areas where ground-water draft has increased, the range in seasonal fluctuation has been small, and the rise of water levels during the spring has, in general, been proportional to the amount of rainfall. Thus, water levels in most wells were slightly higher in 1951 than in 1949, and in many wells the highest levels of record were reached hi 1952. There was a small decline in water levels during the spring from 1952 to 1953, which is correlative with the lower rainfall and, hence, less re charge, in 1953.
Even in areas of concentrated pumping no net decline in water levels during the spring has been observed. During the spring, water levels in wells 7/8-24H1, 24H2, and 7/7-18Q1 (fig. 10) showed a net rise in the period 1950-52, reflecting the above-normal rainfall. The same trend is indicated by the hydrographs for wells in other areas where ground-water withdrawals are relatively large. Thus, the fluctuations for the period 1949-53 show that the principal ground- water body has been essentially fully recharged in the spring of each year, which in turn indicates that there is no overdraft in Santa Kosa Valley.
OTHER WATER BODIES
Most of the ground water in the Sonoma volcanics occurs as isolated bodies contained in permeable beds separated by relatively imperme able lava strata. The folding and faulting have produced compart-

80 GROUND WATER IN" SANTA ROSA AND- PETALTJMA VAU/EYS
ments in which the isolated water bodies are found. They are separate and distinct from the principal water body and therefore respond in dependently to the effects of recharge and pumping. No attempt has been made to study these small water bodies in detail. It is known that some occur under confined conditions and others may occur under water-table conditions. It is known also that, locally, water in the volcanic rocks is in hydraulic continuity with the principal water body.
The water-bearing properties of the younger alluvium and channel deposits in the Russian River valley are entirely different from those containing the principal water body in Santa Rosa Valley, and there fore the water in the younger alluvium and channel deposits is arbi trarily classed as another water body. This water body will be de scribed more fully in a report on the geology and ground-water condi tions in the Russian River valley now in preparation by the Geological Survey.
SOURCE ANI> KBCHARGB
The source of most ground water in the Santa Rosa Valley area is rainfall and seepage from streams that infiltrates the soil zone and permeable zones beneath the stream beds and percolates downward to the ground-water body. Because the water levels are close to the land surface, there is little opportunity for recharge by seepage from streams. If water levels were drawn down substantially, recharge from streams probably would increase greatly. In general, surface conditions permit recharge of the ground-water body by rainfall hi much of the Santa Rosa Valley area, but the rate of recharge is likely to be low at most times and places.
The amount of recharge in relation to rainfall depends on topog raphy, surface geology, and vegetation as well as on the distribution of rainfall, storm intensity, and winds. In the valley areas the topography is favorable, as most of the land is fairly flat and water that accumulates on the surface runs off slowly. In the upland areas the reverse is true. The surface geologic conditions are not everywhere favorable for recharge. The areas mapped as younger alluvium are generally most favorable for recharge because the younger alluvium is capped by permeable soils; however, the soils generally are fairly fine grained, except for those occurring on channel deposits in the Russian River valley, and recharge is slow. Soils in areas underlain by older alluvium or by the Glen Ellen formation commonly have well-developed profiles and include clay or hardpan, which impedes downward movement of water. However, in some places rainfall percolates to the water body through those formations fairly readily, judging from the sharp rise in water levels that have been observed in some wells. For example, the level in well 7/8-29Q1, during or im mediately after storms, responds rapidly to recharge from rainfall.

GROUND WATEB 81
The sandy soils developed on the Merced formation (Goldridge soil series) accept recharge comparatively readily. On January 13, 1941, the U. S. Soil Conservation Service gaged the runoff of a small drainage basin, consisting of 83 acres, on a terrain formed by the Merced for mation on the Taber farm near Sebastopol15 . The highest rate of runoff measured was 0.95 cfs per acre, associated with a rainfall rate of 1.30 inches per hour for a period of 30 minutes. The rate of rainfall was produced by a storm of about 5-year frequency. The amount of rain falling on the test area in the 30 minutes corresponded to a rate of 1.31 cfs per acre. This amount, minus the runoff rate of 0.95 cfs per acre, indicated an infiltration rate of 0.36 cfs per acre, or 0.35 inch per hour in terms of rainfall. During the preceding 2 days, 1.60 inches of rain had fallen on the test area and during the 15 days preceding them, 4.50 inches had fallen. These amounts suggest that the soil moisture must have been essentially replenished, so that the indicated infiltration rate is presumably near the maximum rate at which the test area will accept recharge. Although the rate may be relatively low, especially as compared to rates that likely would occur in some areas of alluvial materials of Recent age, it would allow for considerable recharge in the large area underlain by the Merced formation, most of which normally receives 40 inches or more of rainfall annually.
Recharge through infiltration of rainfall in areas underlain by the Sonoma volcanics is somewhat inhibited by the steep slopes, which cause rapid runoff, but those areas underlain by tuffs or tuffaceous deposits, volcanic sand and gravel, and fractured flow rocks are sufficiently permeable to be recharged. However, weathering tends to reduce the permeability, especially of the tuffaceous rocks.
Vegetation affects infiltration of rainfall chiefly by holding and protecting the soil and by slowing the movement of runoff water in upland areas and on alluvial fans; thus it increases the opportunity for infiltration. Where vegetation does not occur, the water tends to run off more swiftly and erode the soil. However, so far as its effect on recharge is concerned, vegetation not only intercepts some rainfall but also consumes a major part of that which infiltrates the soil, thereby reducing the amount that reaches the ground water body.
Distribution of rainfall and storm intensity are important factors in recharge, especially where soils permit only slow infiltration. If the rate of rainfall greatly exceeds the infiltration rate, as commonly occurs during whiter storms in the Santa Rosa Valley area, the ratio of recharge to rainfall is small, and the greatest part runs off. Long
"U.S. Dept. of Agriculture, Report of survey, Russian River watershed, California, for runoff and water flow retardation and soil erosion prevention for flood control purposes: unpublished rept. in flies of Soils Conservation Service, U. S. Dept. Agriculture, 1950, app. 2, p. 21-22.

82 GROUND WATER IN SANTA ROSA ANB PETALUMA VALLBYB
periods between storms permit some depletion of the soil moisture through evapotranspiration and downward movement of soil moisture. The rate of depletion is accelerated if windy conditions prevail. Thus, rain falling on the soils when their moisture content is low must first satisfy the soil-moisture deficiency before it can infiltrate deeply and, hence, recharge the ground-water body.
In the Santa Rosa Valley area there is ordinarily an appreciable time lag between the advent of the rainy season and the beginning of recharge to the water body. Before the wet season begins, water levels may rise slightly as a result of decreased evapotranspiration due to lower autumn or early winter temperatures or recovery from pump ing for irrigation or to both, but in the water-level records for shallow wells these responses can generally be distinguished from the effects of recharge.
The shape of the water-level contours (pi. 2) suggests that a large part of the recharge is from local precipitation, especially in interstream areas along the valley sides. Thus, the westward bulges in contours north and south of Santa Rosa Creek in the northwest part of 7/8 and in the south part of 7/8 and north part of 6/8 indicate ground- water movement from the interstream areas toward tributary streams, such as Santa Rosa Creek, and toward the Laguna de Santa Rosa.
No data are available concerning seepage losses and gains by streams in the area, but the water-level contour map (pi. 2) shows that the streams traversing Santa Rosa Valley are mainly effluent that is, ground water is discharged into them during the spring. Except near the Laguna de Santa Rosa, Mark West and Santa Rosa Creeks are incised 15-20 feet below their flood plains, so that their channels intersect the water table. Hence, except for areas of local heavy pumping near them, little recharge from the streams occurs. Low gradients away from the streams may be established late in the pumping season, when stream flow is low. In the middle reach of Mark West Creek, deposits having low permeability crop out or are inferred to be overlain by a thin veneer of channel deposits, so that downward percolation from the stream bed may be retarded there. However, water percolating laterally may reach old channels which cut the poorly permeable beds and thus facilitate recharge. The possibility that the recharge potential of the streams may be large is emphasized. However, this potential cannot be realized until such time as the adjacent ground-water levels are drawn down substantially below the historic levels.
Minor additions to the ground-water body may be made by upward leakage of water of higher head confined in the Sonoma volcanics or from connate, or deeply circulating, ground water rising along faults. Addition from a deep source locally in northern Santa Rosa

GROUND WATER 83
Valley is indicated by chemical analyses of water from well 8/9-23L1. (See section on quality of water.)
Finally, in areas where ground water is pumped for irrigation, some of the water applied to crops reaches the ground-water body in the same manner that rainfall does. This "irrigation return" could be classed as recharge. However, it is not a primary source of recharge, amounting only to the difference between the amount pumped and the amount consumed by crops. This difference varies in different areas, depending on the local irrigation practices and soil types; it is significant only where the land is generally overirrigated.
Over a period of time the net recharge tends to equal the discharge. Runoff indicates that potential recharge generally exceeds the amount that can infiltrate the soil and be transmitted to the ground-water body. Therefore, the recharge is limited, in part, by the amount and distribution of precipitation, the transmissibility of the soil and surficial deposits, and the availability of storage space within the aquifer.
MOVEMENT
Plate 2 shows contours connecting points of equal altitude on the water surface in the principal ground-water bodies in the Santa Rosa and Petaluma Valley areas. The contours are based chiefly on depth- to-water measurements made in April 1951, although a few measure ments were made a short time before and after April 1951 to get better control locally. Water levels in about 450 wells were measured. This was done during the spring because at that time of the year the disparity between water levels in deep and shallow wells is at a mini mum. Accordingly, the levels in both deep and shallow wells were used to draw the contours. Where anomalous water levels could not be satisfactorily explained or do not appear to reflect general condi tions within the water body, they were not used to control the con tours and are shown on the map as figures representing the altitude of the water surface in the wells.
Because ground water moves down gradient from points of higher altitude to points of lower altitude, or from points of high potential to points of low potential, the contours indicate direction of movement and areas of ground-water recharge and discharge. In the Santa Rosa Valley area the altitude of the water surface is highest at the eastern margin of the valley, in the eastern tributary valleys, and along the ground-water divide between Santa Rosa Valley and the valleys of Atascadero and Green Valley Creeks. Altitudes are lowest at the western side of the valley along the Laguna de Santa Rosa and along the lower parts of Mark West and Windsor Creeks. A ground-water divide lies beneath the Cotati plain, noith of which water moves toward the Russian River and south of which water

84 GROUND WATER EST SANTA ROSA AND PETALTJMA VALLEYS
moves into Petaluma Valley. The water-level contours show also the configuration of the water surface and reflect to some degree the overlying topography; in some areas they show, by changes in the hydraulic gradient, the effect of changes in the permeability and cross-sectional area of the deposits through which the water is moving.
In Santa Rosa Valley the direction of movement from the east, west, and south is generally toward the Laguna de Santa Rosa and locally toward the streams that are tributary to it. The hydraulic gradient in Santa Rosa Valley is mostly between 10 and 40 feet per mile. In the upland area underlain by the Merced formation, gradients are as much as 120 feet per mile or more, reflecting the low transmissibility of the deposits as well as the steeper topography. The widely spaced contours in the Cotati plain mainly reflect the flatness of the terrain and, to some extent, the large cross-sectional area and the increased transmissibility of the deposits. The general steepening of the gradient eastward reflects,a decrease in permeability or cross-sectional area of the deposits, or both. Control is lacking in the area of low hills separating Santa Rosa Valley from the alluvial plain of the Russian River, but, on the basis of the meager data available, the only ground- water divide in that area appears to be immediately north of Mark West Creek; from this divide, water moves through the Glen Ellen and Merced formations, then into the alluvial deposits along the Russian River.
At the western edge of the Cotati plain (6/8-16, 17) the 60-foot contour is closed, indicating a depression in the surface of the water body. The proximity of several irrigation wells suggests that this may be a small residual "pumping hole" produced by withdrawing ground water at a rate exceeding recharge.
NATURAL DISCHARGE!
Natural discharge from the ground-water reservoir occurs by seep age into streams and springs, evapotranspiration, and underflow. Before ground water is developed, the total natural discharge is a rough measure of the yield of a basin in that it represents the water which could theoretically be obtained for use. Generally it is not feasible to salvage all the natural discharge; on the other hand, if the ground-water reservoir is readily rechargeable, artificial discharge (pumping) may induce more annual recharge than would occur nor mally and thus would increase the yield beyond the rate of natural discharge.
Except for pumpage, no quantitative estimates were made for the ground-water discharge in the Santa Rosa Valley area. The water- level contour map (pi. 2) shows that there must be considerable dis charge into Santa Rosa, Mark West, and other creeks; spring water

GROUND WATER '85
levels in wells near the streams generally stand several feet higher than the stream beds, except locally where residual pumping depres sions exist. Discharge into streams occurs also in the valleys trib utary to Santa Rosa Valley, as well as in the Russian River valley, and may constitute the largest single type of natural discharge.
Much ground water is discharged from the Merced formation on the western side of Santa Rosa Valley through springs and seeps. Most of these are gravity springs, occurring on the steeper slopes or in gullies where the water table intersects the land surface; but some are contact springs, occuring along the outcrop of the contact between a permeable and an impermeable or poorly permeable bed. Springs, of the contact type, are a common means of ground-water discharge from the Sonoma volcanics also. Some contact springs occur in the Glen Ellen formation, and many occur in the Franciscan group, con stituting an important method of discharge and a local source of water. Some spring discharge sustains low flow in stream beds. However, many springs and seeps are marked by growths of vegetation which consume most of the discharge and release it to the atmosphere by eyapotranspiration. Much water is lost from the Merced formation in this manner.
Evapotranspiration occurs on a large scale along the Laguna de Santa Rosa at the western side of Santa Rosa Valley in a swampy area that varies in size with seasonal rainfall conditions but averages about 1,000 acres during the summer (McBride, 1945). This area is subject to natural losses by evaporation from the water surface and by transpiration from reeds, tules, willows, and other water-loving plants which flourish around the margins of the Laguna. On the basis of studies made by Lee (1931, p. 247-304) of the tidal marshes of Suisun and San Pablo Bays, it is estimated that between 4,000 and 6,000 acre-feet of water is discharged annually from this area alone, mostly during the summer months when evapotranspiration rates are highest and when the watertable is at about the same level surface as that of the Laguna. Most of this evapotranspiration is believed to be supplied by ground-water inflow.
Other areas that lose considerable ground water by evapotranspira tion are along the margins of streams where phreatophytes plants whose roots extend to the water table or to the capillary fringe grow in profusion, and hi the lower parts of basins where the water table in spring is at or near the surface. Near the Laguna, the channels of Santa Rosa and Mark West Creeks support large growths of wil lows, poplars, live oaks, and various bushes that discharge ground water. At the southern end and along the southwestern side of ICenwood Valley the water table is at or near the surface in spring,
losses by evapotranspiration occur. It is reported that the

86 GROUND WATER IN SANTA ROSA AND PETALUMA VALOLEYB
Cotati plain, before it was artificially drained for cultivation, was a swampy area during the spring and early summer. A large area in the lower part of Green Valley is poorly drained and loses much water by evapotranspiration.
The amount of underflow, or discharge of ground water from the area by movement through the aquifers, was not studied. The water- level contours indicate that ground water was discharging from Santa Rosa Valley to the Russian River valley through the low hills under lain by the Glen Ellen formation. Farther south ground water in the Merced formation discharges westward into the valleys of Atascadero and Green Valley Creeks. Better control of contours and data on the average transmissibility and the extent of the aquifer would be necessary for estimating the underflow from the area.
PUMPAGE PROM WEULS
An attempt was made to estimate as closely as possible the amount of ground water pumped in the Santa Rosa Valley area. As a basis for computation, the uses to which the water is put were categorized as follows: (1) Public-supply, which includes the water-supply systems of cities, towns, and communities for which some record of water con sumption or pumpage is available; (2) used by industries having their own supply wells, including dairies; (3) irrigation; and (4) domestic, stock, and other uses, which include use by the large rural and subur ban population for purposes other than irrigation.
Because several methods were used to obtain and to check the pump- age estimates (see table 7), the estimates are believed to be the best available for the several areas. The irrigation pumpage was largely computed on the basis of yearly totals of kilowatt-hours of electrical energy consumed by pumping plants and plant-efficiency tests that were kindly furnished by the Pacific Gas and Electric Co. The data for most wells cover the 5 years beginning in March 1945 and ending in March 1950, and they were tabulated by areas which in most cases coincide with the physiographic and ground-water storage divisions of the Santa Rosa Valley area as defined in this report (fig. 3). Be cause most irrigation occurs during the months April or May through October, the bulk of the pumpage computed is for the calendar years 1945 through 1949. All figures excepting totals were rounded to two significant figures. Depending on their probable accuracy, some figures were rounded to the nearest 100 acre-feet.
Pumpage for domestic, stock, and other uses was estimated for the entire Santa Rosa Valley area on the basis of the number of wells in use in the area during 1950. It is estimated that there were about 10,000 wells in the Santa Rosa and Petaluma Valley areas, about 85 percent, or 8,500, in the Santa Rosa Valley area and the remainder in

GROUND WATER 87
the Petaluma Valley area. Half an acre-foot of water per well was estimated to be a reasonable average amount used annually for domestic, stock, and miscellaneous purposes. This factor was applied to the number of wells in use each year (scaled down from the 1950 estimate in proportion to population difference), diminished by the number of wells included in the public-supply, industrial, and irriga tion categories. The figures obtained in this manner correspond to an average per-capita consumption of about 75 gallons per day (gpd) for the estimated rural population. Inasmuch as urban consumption generally averages between 100 and 150 gpd per person, the estimate for this category is probably very conservative because it includes pumpage from many wells that though not classed as irrigation wells, irrigate gardens and small pastures covering (less than 5 acres).
TABLE 7. Ground-water pumpage, in acre-feet, in the Santa Rosa Valley area,1945-49
Area and pumpage category
Santa Rosa Valley:
Total' .-.-. - .-.- _..
Sebastopol area:
Industrial.. __________________ ....
Total'.. ........ . _- - _._.._.__.._.
Other areas (irrigation only) : Rincon Valley .. ... ................Bennett Valley ____ ____ ... _______
Kenwood Valley, south part, and Glen Ellen area- Russian River plain 8 ______ ...............
Santa Rosa Valley area:
Industrial. ________ ____________
1945
2,200200800
3,200
280300
0
580
604080
110 900
2,500500
2,0002,800
7,800
1946
2,400200
1,000
3,600
300300
20
620
709080
150 1,100
2,700500
2,5003,000
8,700
1947
2,900200
1,300
4,400
320300
80
700
9018080
120 1,600
3,200500
3,4003,300
10,400
1948
2,800200
1,400
4,400
340300110
750
130360100180
1,700
3,100500
4,0003,600
11,200
1949
2,800200
2,300
5,300
340300170
810
150740160260
2,000
3,100500
5.8003,900
13,300
1 Pumpage from domestic, stock, and other wells not estimated for individual areas. ' Includes the Russian River flood plain from Rio Dell to Dry Creek on the west side and to Fitch Moun
tain on the east side.
Santa Rosa Valley. In Santa Kosa Valley most of the public-supply pumping is done by the city of Santa Rosa. Water pumped from the principal well field is metered, but water from two <ffcher wells is not metered and is pumped into a surface reservoir, Lake Ralphine. The amount of unmetered water, estimated on the basis of pump dis charges and hours of pumping reported by the city water department, usually amounts to 15-25 percent of the total amount of ground water pumped by the city. Water consumed by the Sonoma County Hospi tal was estimated on the basis of the average daily consumption of 250,000 gpd reported for 1949 by the engineering department. Con-

88 GROUND WATER IN SANTA ROSA AND PETALUMA VALLEYS
sumption for years other than 1949 was estimated on the basis of the estimated population for the county. Water pumped by the Cotati Public Utility District was estimated on the basis of figures supplied by Robert A. Clothier, director. A small privately owned public- supply system is operated in the village of Windsor, but because no figures were available, estimates were based on the rural use.
All the industrial pumpage estimated, other than that for dairy use, was for industries in Santa Rosa that have their own wells. The estimate was based partly on data supplied by certain companies and partly on estimates. Possible errors in the estimates are small com pared with the overall pumpage, because the total pumpage by in dustrial wells amounted to only 50 acre-feet. Dairy pumpage was estimated to average 5 acre-feet per year per dairy.
Irrigation pumpage was computed by dividing yearly totals of kilo watt-hours consumed by pumping plants engaged in each of two general types of irrigation sprinkler and flood by factors represent ing the average number of kilowatt-hours (kwhr) required by pump ing plants in each group to pump an acre-foot of water. Pump-effi ciency tests were available for 6 wells that pumped water for sprinkler irrigation. The average number of kilowatt-hours consumed by three wells was taken as 400 kwhr per acre-foot of water pumped. The average number of kilowatt-hours consumed by 5 wells that pumped water for flood irrigation was taken as 340 kwhr per acre-foot of water pumped. Pumpage by wells for which figures on kilowatt-hour consumption were not available was estimated on the basis of acreages irrigated and the average "duty of water" 16 for the particular crop irrigated. For most years the pumpage estimated in this manner amounted to less than 20 percent of the total irrigation pumpage. In addition, the total irrigation pumpage for each area was estimated on the basis of acreages and duty of water as a check on the figures derived from kilowatt-hour consumption. The average duty of water for various crops was computed on the basis of information supplied by many owners of irrigation wells in the Santa Rosa Valley area (tableS).
TABLE 8. Duty of water factors for the Santa Rosa Valley area
Acreage irrigated
Alfalfa, pasture, cemeteries, golf courses,
Orchards, prunes, seed culture - _____ _
Feet of water
applied per acre
(acre-feet)
2.52.01.0.8.6.6
18 The amount of water, expressed in feet (acre-feet per acre), applied to a crop during the growing or irrigation season.

GROUND WATER 89
The yearly totals obtained for irrigation pumpage for Santa Rosa Valley, based on the above factors and total acreages for irrigated crops in Santa Eosa Valley, were found to be higher than those com puted on the basis of kilowatt-hours of electricity consumed. The differences ranged from 10 percent in 1946 to 57 percent in 1948 and averaged 28 percent. Thus the figures obtained by the two methods seem to be in reasonably close agreement. The computation of pumpage on the basis of acreages irrigated and duty of water data is considered to be the less accurate of the two methods for the follow ing reasons: the size of the acreages was partly reported and partly estimated; no allowances were made for changes from year to year in water duties as a result of variations in precipitation; and data gener ally were not available for estimating the portion of the season that a well was used during its first year of operation.
Sebastopol area. The Sebastopol pumpage unit spans the ground- water divide between Santa Rosa Valley and the valleys of Atascadero and Green Valley Creeks. Although the bulk of the pumping is in the Green Valley Creek area, the basins are contiguous, and increased withdrawals in Santa Rosa Valley probably would shift the ground- water divide westward. In tabulating the electric-power consump tion on which the pumpage figures are largely based, it was deemed advisable to make the units as large as possible. Because pumping lifts throughout the Sebastopol unit are relatively high, owing to deeper static water levels in the hills adjacent to Santa Rosa Valley, and to low specific capacities resulting in large drawdowns in the western part of the unit, pumpage in the area was lumped rather than divided between two units as might otherwise have seemed logical.
Pumpage for the town of Sebastopol was reported by the city water department to be about 336 acre-feet for 1949 and was extrapolated for years before 1949 on the basis of the estimated change in popula tion. The pumpage by the Fircrest Water District was based on the number of families served and was estimated to be about 10 acre- feet (1949).
Industrial pumpage in the vicinity of Sebaatopol was principally for fruit-processing plants and dairies. Data supplied by one large plant indicate that it pumped about 40 acre-feet a year, and the average annual pumpage of each of nine plants known to operate in the area was estimated to be about 20 acre-feet. Thus, the total was about 200 acre-feet a year.
Because data on electric-power consumption were available for only about half the irrigation pumpage in the Sebastopol area, and because no data on plant-efficiency tests were available, the irrigation pumpage was computed on the basis of reported and estimated sizes of acre-
443616 58 7

90 GROUND WATER IN SANTA ROSA AND PETALTJMA VALLEYS
ages irrigated, using the duty of water computed for Santa Rosa Valley. Most of the irrigation is in Green Valley.
Other areas. In the Bennett, Kenwood, Rincon, and Russian River valleys and the Glen Ellen area, the pumpage for irrigation, except in the northern part of Kenwood Valley, was computed from elec trical-energy totals on the basis of computed or estimated power fac tors (kilowatt-hours per acre-foot). Pumpage from wells for which records of power consumption were not available was estimated on the basis of the sizes of acreages irrigated and the duty of water, and in most areas amounted to less than 25 percent of the total pumpage. The computed pumpage was checked using irrigated acres and water duties and generally compared closely.
In Rincon Valley the power factors for two wells pumping most of the water in the area were computed from pumping levels, using assumed plant efficiencies of 50 percent, and estimated operating pressures, which produced power factors of 400 and 500 kwhr per acre-foot. For other wells, a factor of 400 kwhr per acre-foot was used. In Bennett Valley, plant-efficiency tests were available for three wells; for others, pumping levels were used as a basis for esti mating factors, which ranged from 125 to 500 kwhr per acre-foot. In the northern part of Kenwood Valley, north area (D), data on plant-efficiency tests were not available, and there was some doubt that the electrical-energy totals represented power used solely for lifting water from wells; therefore, the irrigation pumpage was esti mated on the basis of the size of the irrigated acreage and the duty of water. For the southern part of Kenwood Valley and for the Glen Ellen area, a factor of 400 kwhr per acre-foot was used. Estimates of the sizes of the acreages irrigated in the latter areas during 1945-47 apparently were unreliable; pumpage figures obtained by the two methods of computation for those years varied widely, but for 1948 and 1949 the figures agreed very closely.
On the Russian Russian River flood plain, pumping lifts are rela tively low. No efficiency tests were available for the area for which pumpage was computed, but a factor of 150 kwhr per acre-foot was assumed on the basis of test data available for similar areas upstream. During the 5-year period, between 20 and 40 percent of the with drawals for irrigation were from the eastern side of that part of river valley, included in the area of this report.
QUALITY OF WATER
As used in this report, "calcium bicarbonate," designates a water in which calcium amounts to 50 percent or more of the bases (cations), and bicarbonate, to 50 percent or more of the acids (anions), in chemical equivalents. "Calcium magnesium bicarbonate" designates

GROUND WATEB 91
a water in which both calcium and magnesium exceed sodium, yet neither amounts to 50 percent of the bases. If magnesium exceeds calcium the water is designated "magnesium calcium bicarbonate." If the concentrations of the principal bases are nearly equal, the water is designated by all three, listed in order of relative abundance. "Bicarbonate chloride" and "bicarbonate sulfate" designate waters in which those two radicals predominate among the acids, in order of relative abundance, but neither amounts to 50 percent, in chemical equivalents, of the acids in the water.
Chemical analyses of water samples collected from wells in the Santa Rosa Valley area indicate that the quality of the ground water is generally satisfactory for most uses. (See tables 20 and 21 of appendix for analyses.) The dissolved solids commonly range from 250 to 350 ppm, and the waters are of the calcium and/or magnesium or sodium bicarbonate types. The hardness generally ranges between 60 and 160 ppm (between moderately hard and hard), but in a few wells it exceeds 400 ppm. The average hardness is about 120 ppm.
GENERAL REQUIREMENTS AND SUITABILITY
It is beyond the scope of this report to present detailed data con cerning water-quality requirements, and only the general criteria used to determine the suitability of water for domestic, industrial, and agricultural use have been considered. Specific water-quality criteria have been given in publications of the California State Water PoUution Control Board (1952, 1954).
Domestic use. The chemical character of water to be used for domestic purposes is generally judged according to the standards of quality for drinking water set by the U. S. Public Health Service (1946), as listed below.
Maximum concentration
Constituent (ppm)Chloride (Cl)______._.__.__._.___. ___.___._...__..__.._...._. 250Sulfate (SO4)__________________________________ 250Magnesium (Mg)____________________________________________ 125Iron and manganese (Fe+Mn)____________________________ 0. 3Fluoride (F)____________________________________. 1. 5Lead (Pb)__--________-___________,_.________________________. .1Selenium (Se)___________________________________ . 05Chromium, hexavalent (Cr)___________________________________ . 05Arsenic (As)________________________________________________ . 05Zinc (Zn)______._______________________________ 15Phenolic compounds (in terms of phenol)_________________________ . 001
In addition, the total solids should not exceed 500 ppm for a water of good chemical quality. However, if such water is not available, a dissolved solids content of as much as 1,000 ppm may be permitted.
Waters in the Santa Rosa Valley area meet these standards, except

92 GROUND WATER IN SANTA ROSA AND FETALUMA
locally where iron and manganese may exceed slightly the permissible concentration. Also, locally, the hardness may be sufficiently high to be objectionable unless the water is treated.
It is widely believed that nitrate should not exceed 10 ppm as nitrogen or 44 ppm as NO3 in waters used for feeding infants, as higher concentrations may cause infant cyanosis (methemoglobine- mia) (Maxcy, 1950). A high concentration of nitrate commonly indicates pollution from decaying organic matter, such as septic-tank leachings or other organic wastes. However, it may result also from other sources, such as nitrogenous fertilizers leached from the soil zone by return irrigation waters or by deep penetration of rainfall. A relatively high concentration of nitrate may be present in water circulating through deposits laid down in a swampy environment. Except for the water in well 6/8-25Q1, which contained 30 ppm of nitrate, the concentrations of nitrate were low in the water samples analyzed.. Water samples analyzed for fluoride contained from 0.2 to 0.8 ppm, or less than the permissible limit of 1.5 ppm.
Industrial use. Ground water in the Santa Kosa Valley area is suit able for most common industrial uses. For many of the more critical uses, however, most of the water would require some treatment. Generally, the depth of a well and the manner in which it has been completed must be considered if soft water of low iron-manganese content is to be obtained for use at breweries, laundries, and soft-drink bottling plants and in boilers. Generally, the depth of perforations must be chosen carefully to obtain the best water for these purposes. The average temperature of water from wells less than 100 feet deep in the Santa Kosa Valley area is about 63° F, making the water fairly suitable for cooling purposes. Because the temperature of earth materials generally increases about 1° F for each 50-100 feet below the land surface, the temperature of water from deep wells is usually higher than that from shallow wells. Thus, the shallow wells usually provide slightly better water for cooling purposes.
Agricultural use. The suitability of water for irrigation purposes is dependent on (1) the concentration of dissolved solids, (2) the per centage of sodium, (3) the concentration of boron, and (4), in some instances, the concentration of bicarbonate in relation to the concen trations of calcium and magnesium. In the Santa Rosa Valley area Items (2) and (3) are of most concern. The percentage of sodium, or percent sodium as it is commonly designated, is the ratio of the milligram equivalents per liter of sodium to the sum of the milligram equivalents per liter of the principal cations (Ca+Mg+Na+K), multiplied by 100. Ordinarily, waters having more than 50 percent sodium are likely to have a detrimental effect on soil texture, the
GROUND WATER 93
magnitude of the effect depending on the soil and the drainage conditions. A water having a high percent sodium may be safely used on a well-drained soil, whereas it would damage a heavy or poorly permeable soil. In water from some wells tapping the Glen Ellen formation the percent sodium is high enough to make the water unsuitable, especially on soils of low permeability.
Also, locally, water in the Glen Ellen formation contains a relatively high concentration of boron, making it unsuitable for irrigation use. Small amounts of boron are necessary for the proper growth of most plants, but above a critical concentration, which is generally con sidered to be 0.4-0.5 ppm, boron has deleterious effects on certain boron-sensitive plants, such as citrus, walnuts, and camellias. In concentrations higher than 3 or 4 ppm it is detrimental to most plants. As with sodium, soil drainage may determine the limit of tolerance.
Dissolved solids, especially chloride, largely determine the suitability of water for use by livestock. All the waters that were analyzed are suitable for this purpose.
CHEMICAL CHARACTER
Analyses of typical waters from wells tapping the principal water bearing formations in the Santa Rosa Valley area were plotted on a trilinear water-analysis diagram (fig. 11) for study and to show the types of water from the various formations. The analyses were also plotted as bar diagrams (fig. 12) to indicate more clearly the relative concentrations of principal cations and anions. Table 9 presents a summary of the chemical quality of water in the principal water bearing formations.
TABLE 9. Summary of chemical character of water from the principal water-bearingformations in the Santa Rosa Valley area
[Based on analyses in tables 20 and 21 and other analyses in flies of IT. 8. Geological Survey.]
Dissolved solidsppm
Hardness (CaCOa) ppm-.
Chloride __ ppm..
Percent sodium .....
Iron and manganese ppm..
PH.. ....... ........
Glen Ellen formation
about 280 Range, 15-390; normally
80-140. Range, 7-69; normally
about 30. Generally 40-70. __ ......
not more than 2.5; (local contamination in north ern Santa Rosa Valley and Glen Ellen area).
Commonly less than 0.3; locally, slightly more than 0.3.
Merced formation
Range, 205-350 ______
Range, 35-220; commonly 50-60.
Range, 9-85; normally about 30.
May contain objection able quantities, especi ally in lower part of formation; commonly less than 0.2 in upper part.
Range, 7.1-9.1
Sonoma volcanics
Range, 93-404; generallyabout 275.
Range, 100-145.
Normally about 30.
Commonly 40-45.
Generally less than 0.2.

Are
a o
f ci
rcle
In
dica
tes
can
cen
tra
tio
in
port
s pe
r m
illio
n,t
hu
s:
Sca
le o
f di
amet
ers
Serial
no.
Sou
rce
of
wate
r
Mer
ced
form
atio
n
Me
rce
d
ond
Gle
n E
llen
form
ations
Gle
n
Elle
n
form
ation
Son
oma
vo
lca
nic
s
ond
Merc
ed
form
ation
Son
oma
volc
an
ics
&P.VJ
Wel
l nu
mbe
r
5/9
-3G
I 1,
008
6/8
-5E
I 63
66/9
-2C
I.F
I 260,6
00
7/7
-I7A
I 64
67/7
-32G
I 40
37/9
-I3R
I 37
57/9
-29J2
65
78/8
-20Q
I 31
08
/9-I
OR
I 40
0
PE
RC
EN
TA
GE
R
EA
CT
ING
V
AL
UE
S
FIGU
RE 1
1. D
iagr
am s
how
ing
the
chem
ical
cha
ract
er o
f gro
und
wat
ers
in th
e Pe
talu
ma
Val
ley
area
, Cal
iforn
ia.
0

GROUND WATER 95
EXPLANATION
Chloride, fluoride. and nitrate
Carbonate and bicarbonate
Merced formation
FIGURE 12. Graphical representation of chemical analyses of water from wells tapping the principal water bearing formations in the Santa Rosa Valley area, California.
Glen Ellen formation. The water from welJs in the Glen Ellen formation has a greater range in character than that in other forma tions. Some of the best and some of the poorest water in the area is obtained from the Glen Ellen. From the analyses available, the dissolved-solids content ranges from 106 ppm in well 8/9-14P1, 264 feet deep, to 427 ppm in well 7/8-15G1, 65 feet deep. By comparison, the water from well 8/9-36K1, 1,325 feet deep, contained only 407 ppm of dissolved solids. However, this well taps water not only in the Glen Ellen formation but probably in the Merced formation also. Normally, softer water is obtained from wells tapping deep water bearing zones in the Glen Ellen and in the Merced foimation than from wells tapping shallow zones. This softening may be due principally to the process of base exchange, whereby the calcium and magnesium ions in the water are replaced by sodium ions as ground water moves

96 GROUND WATER IN SANTA ROSiA AND FETALUMA VALLEYS
through fine-grained deposits containing large amounts of replace able sodium.
In the northern part of Santa Rosa Valley, well 8/9-1OH1 and a few neighboring wells penetrating the Glen Ellen formation are reported to yield water that develops an oil scum, even though most of the pumps are lubricated with water. The wells are on the west limb of the Windsor syncline (pi. 1), but logs of wells do not suggest the presence of petroliferous beds. The "oil" scum could consist of precipitated iron oxide. Several miles south, "coal" has been re ported. Locally, wells in the Glen Ellen formation tap water high in boron. (See section on local ground water containing boron.)
Merced formation. Generally, less than 350 ppm of dissolved solids occur in ground water in the Merced formation, and the over all quality of the water is satisfactory. However, locally, waters having high concentrations of iron or manganese, or both, may be objectionable for many domestic uses, especially laundering, unless treated; such waters also are likely to be corrosive and to damage well casings and pump columns. These conditions are especially prevalent in the western part of the area in which the Merced forma tion crops out, where wells tap thick sections of "blue" (unoxidized) sandstone. Apparently base exchange does not occur in the Merced to as large a degree as in the Glen Ellen formation, although analysis 1 of well 5/9-3G1 (fig. 11) indicates a relatively high sodium content. Waters that have been plotted near the lower apex of the central diamond on figure 11, represent water that is believed to have under gone base exchange.
Sonoma volcanics. The samples analyzed indicate that ground water in the Sonoma volcanics is of all-around satisfactory quality, and the range in character from place to place appears to be small. Because of a higher geothermal gradient in the volcanic rocks, ground- water temperature is slightly higher in deep wells tapping the volcanics than in wells of comparable depth in other formations. On April 18, 1950, the temperature of water from wells 7/7-29L2, 365 feet deep, and 7/7-32G1, 403 feet deep, both of which are supplied principally by the Sonoma volcanics, was 72° F and 74° F, respectively, which is about 6-8 degrees warmer than that in wells of comparable depth in the Merced and Glen Ellen formations.
GROUND WATER CONTAINING BORON
Analyses of ground water indicate two local areas in the Santa Rosa Valley where the boron content of the water is high. One area, apparently small, in the northern part of Santa Rosa Valley was dis closed by analyses of water samples taken during July 1950 from irri gation well 8/9-23L1, which had been put into limited use during the
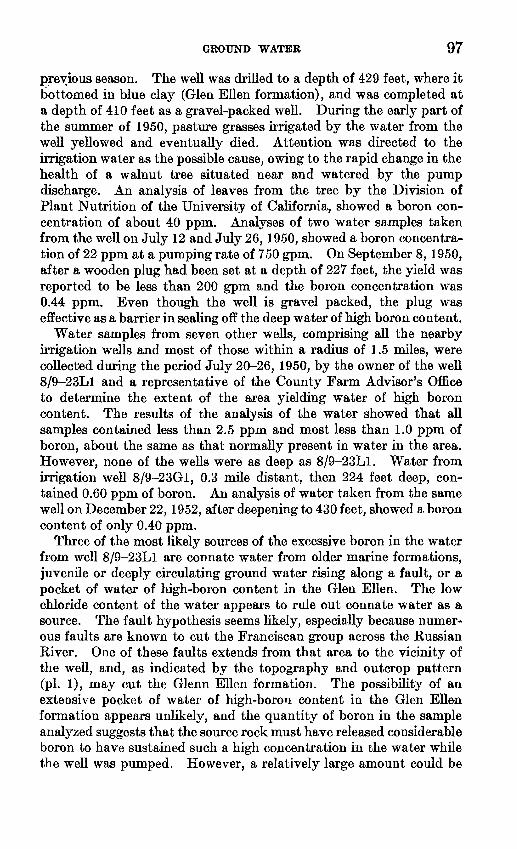
GROUND WATER 97
previous season. The well was drilled to a depth of 429 feet, where it bottomed in blue clay (Glen Ellen formation), and was completed at a depth of 410 feet as a gravel-packed well. During the early part of the summer of 1950, pasture grasses irrigated by the water from the well yellowed and eventually died. Attention was directed to the irrigation water as the possible cause, owing to the rapid change in the health of a walnut tree situated near and watered by the pump discharge. An analysis of leaves from the tree by the Division of Plant Nutrition of the University of California, showed a boron con centration of about 40 ppm. Analyses of two water samples taken from the well on July 12 and July 26, 1950, showed a boron concentra tion of 22 ppm at a pumping rate of 750 gpm. On September 8, 1950, after a wooden plug had been set at a depth of 227 feet, the yield was reported to be less than 200 gpm and the boron concentration was 0.44 ppm. Even though the well is gravel packed, the plug was effective as a barrier in sealing off the deep water of high boron content.
Water samples from seven other wells, comprising all the nearby irrigation wells and most of those within a radius of 1.5 miles, were collected during the period July 20-26, 1950, by the owner of the well 8/9-23L1 and a representative of the County Farm Advisor's Office to determine the extent of the area yielding water of high boron content. The results of the analysis of the water showed that all samples contained less than 2.5 ppm and most less than 1.0 ppm of boron, about the same as that normally present in water in the area. However, none of the wells were as deep as 8/9-23L1. Water from irrigation well 8/9-23G1, 0.3 mile distant, then 224 feet deep, con tained 0.60 ppm of boron. An analysis of water taken from the same well on December 22,1952, after deepening to 430 feet, showed a boron content of only 0.40 ppm.
Three of the most likely sources of the excessive boron in the water from well 8/9-23L1 are connate water from older marine formations, juvenile or deeply circulating ground water rising along a fault, or a pocket of water of high-boron content in the Glen Ellen. The low chloride content of the water appears to rule out connate water as a source. The fault hypothesis seems likely, especially because numer ous faults are known to cut the Franciscan group across the Kussian River. One of these faults extends from that area to the vicinity of the well, and, as indicated by the topography and outcrop pattern (pi. 1), may cut the Glenn Ellen formation. The possibility of an extensive pocket of water of high-boron content in the Glen Ellen formation appears unlikely, and the quantity of boron in the sample analyzed suggests that the source rock must have released considerable boron to have sustained such a high concentration in the water while the well was pumped. However, a relatively large amount could be
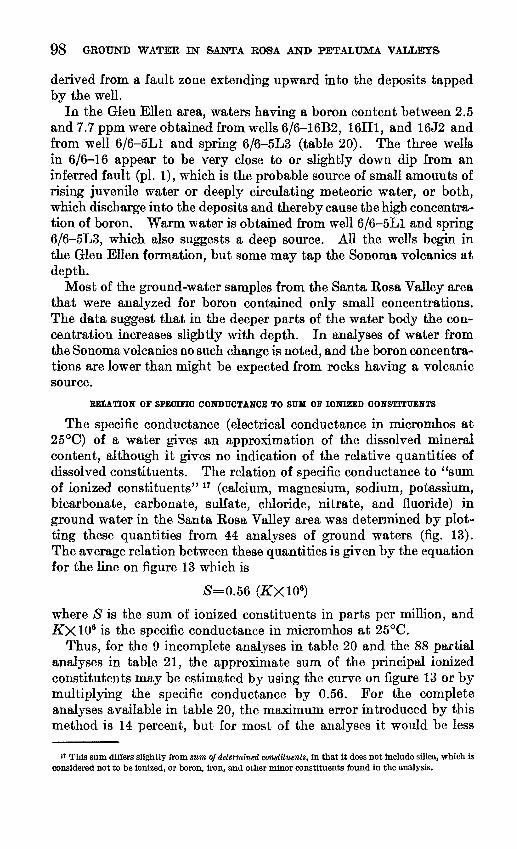
98 GROUND WATER nsr SANTA ROSA AND PETALUMA VALLEYS
derived from a fault zone extending upward into the deposits tapped by the well.
In the Glen Ellen area, waters having a boron content between 2.5 and 7.7 ppm were obtained from wells 6/6-16B2, 16H1, and 16J2 and from well 6/6-5L1 and spring 6/6-5L3 (table 20). The three wells in 6/6-16 appear to be very close to or slightly down dip from an inferred fault (pi. 1), which is the probable source of small amounts of rising juvenile water or deeply circulating meteoric water, or both, which discharge into the deposits and thereby cause the high concentra tion of boron. Warm water is obtained from well 6/6-5L1 and spring 6/6-5L3, which also suggests a deep source. All the wells begin in the Glen Ellen formation, but some may tap the Sonoma volcanics at depth.
Most of the ground-water samples from the Santa Rosa Valley area that were analyzed for boron contained only small concentrations. The data suggest that in the deeper parts of the water body the con centration increases slightly with depth. In analyses of water from the Sonoma volcanics no such change is noted, and the boron concentra tions are lower than might be expected from rocks having a volcanic source.
RELATION OF SPECIFIC CONDUCTANCE TO SUM OF IONIZED CONSTITUENTS
The specific conductance (electrical conductance in micromhos at 25°C) of a water gives an approximation of the dissolved mineral content, although it gives no indication of the relative quantities of dissolved constituents. The relation of specific conductance to "sum of ionized constituents" 17 (calcium, magnesium, sodium, potassium, bicarbonate, carbonate, sulfate, chloride, nitrate, and fluoride) in ground water in the Santa Rosa Valley area was determined by plot ting these quantities from 44 analyses of ground waters (fig. 13). The average relation between these quantities is given by the equation for the line on figure 13 which is
£=0.56 (#X106)
where S is the sum of ionized constituents in parts per million, and .KX106 is the specific conductance in micromhos at 25°C.
Thus, for the 9 incomplete analyses in table 20 and the 88 partial analyses in table 21, the approximate sum of the principal ionized constitutents may be estimated by using the curve on figure 13 or by multiplying the specific conductance by 0.56. For the complete analyses available in table 20, the maximum error introduced by this method is 14 percent, but for most of the analyses it would be less
» This sum differs slightly from sum of determined constituents, in that it does not include silica, which is considered not to be ionized, or boron, iron, and other minor constituents found in the analysis.

GROUND WATER 99
«o o
^o o
0600IDCJ
5
<n o3j 500
Occ. o
UJ-400 OzI*o oo 300 oo
oUlS) 200
_ o o
/
Specific conductance x 0.56 - sum of ionized constituents
Source of water
o More than one formation in principal water body
Merced formation
a Glen Ellen formation
+ Sonoma volcanic*
A Sonoma valcanics and (or) other formations
100 200 300 400 500
SUM OF IONIZED CONSTITUENTS, IN PARTS PER MILLION
60O
FIGURE 13. Relation of specific condnctance to sum of the ionized constituents in ground waters in the Santa Rosa Valley area, California.
than 7 percent. It should be pointed out, however, that the ratio for contaminated water, especially water contaminated by saline water, may differ considerably from that for normal ground water. A slightly higher factor is obtained for uncontaminated water from the Sonoma volcanics than for water from other formations, suggesting that the quantity of dissolved solids for a given conductivity is higher

100 GROUND WATER IN SANTA ROSA AND PETALUMA VALiLETS
for the uncontaminated water from the Sonoma volcanics. However, not enough analyses are available to fix a curve for water from the Sonoma volcanics.
STORAGE CAPACITY
Ground-water storage capacity was computed for Santa Rosa, Bennett, Rineon, and Kenwood Valleys, using the same general methods used to estimate the ground-water storage capacity of the Sacramento Valley (Poland and others, 1951). The estimates are of gross, or total, ground-water storage capacity, not the usable storage capacity. 18 The gross storage estimates serve as an approximate measure of the water that is potentially available for use or as a basis for estimating usable storage capacity.
In general, for the Santa Rosa Valley area, the overall zone of cyclic storage was considered to extend from a level 10 feet below the land surface, which approximates the average position of the water table, to a depth of 200 feet below the land surface. For most of the area this 190-foot zone was subdivided into three depth zones, 10-50 feet, 50-100 feet, and 100-200 feet below the land surface. These zones correspond to those used by the Geological Survey for computing storage capacity in other northern California valleys which contain thick sections of water-bearing alluvial deposits.
Under the present state of development, cyclic dewatering of deposits forming the ground-water reservoir in the Santa Rosa Valley area takes place within the 10- to 50-foot zone. The 50- to 100-foot zone probably could be dewatered under present economic conditions. The 100- to 200-foot zone may represent the maximum storage space that could be utilized under future conditions of full development. It is beyond the scope of this report to consider the overall feasibility of utilizing the storage, especially in the 50- to 200-foot range, but pertinent factors bearing on usability are set down in the latter part of this section.
Except where noted in discussions of individual storage units (fig. 3), the units were treated as having vertical sides. Because in most places the deposits forming the sides of the valleys are water yielding and, to some extent, are hydraulically connected with the water bodies beneath the valleys, the lateral limits of the storage units are somewhat arbitrary. Some were selected for convenience, but most coincide with natural features.
11 Poland and others (1951, p. 621) define usable storage capacity as "That reservoir capacity that can be shown to be economically capable of being dewatered during periods of deficient surface supply and capable of being resaturated, either naturally or artifically, during periods of excess surface supply. Obviously it must contain usable water, which may be denned as that having a satisfactory quality for irrigation and occurring in sufficient quantity in the underground reservoir to be available without uneconomic yield or drawdown."

GROUND WATEE 101
Storage units were restricted to the generally flat-lying valley areas, because the basins beneath them contain most of the storage space of the area, and in addition they could be dewatered and recharged most readily and most economically. The only area of appreciable ground-water storage that is not considered here is the upland area west of Santa Rosa Valley underlain by the Merced formation. This area was omitted because of insufficient data on water levels, depth to bedrock, porosity and permeability of the deposits, and the effect of faults on occurrence and movement of ground water.
The factors directly determining ground-water storage capacity are the volume of the material that is or can be saturated and the specific yield of the material. Volumes were obtained by planimeter- ing the surface area of storage units, and multiplying this area by the thickness of zones. The specific yield was estimated by assigning an arbitrary specific-yield value to each category of material reported on the drillers' logs and averaging the material in the several categories, as explained on pages 103-104. The specific-yield values assigned were those used by Poland and others (1951, p. 624-25) for the Sacramento Valley.
SANTA ROSA VALLEY
The Santa Rosa Valley was divided into four ground-water storage units on the basis of geology, differences in specific yield, recharge characteristics, and grouping of wells. These units (fig. 3) are the Windsor-Fulton unit (-41), Santa Rosa unit (-42), Cotati plain unit (-43), and the Laguna unit (-44).
The Windsor-Fulton unit (.41) is underlain principally by soils of low permeability. However, on the eastern side a large area has a veneer of younger alluvium and on the western side local stream channels and flood plains incise older deposits, thus affording op portunity for recharge. In addition, isolated terrace remnants and local gravel beds, which have been exhumed by erosion, provide areas of recharge.
The Santa Rosa unit (-42), as shown on figure 3, roughly cor responds in extent to the alluvial fan of Santa Rosa Creek. Along the creek and its tributaries the unit has relatively permeable soils, formed on younger alluvium, but the western part of the unit has soils that probably are of low permeability; locally, however, they have been cut through by erosion.
The Cotati plain unit (-43) is named for the Cotati plain, with which it is essentially coextensive. All the soils are formed on younger alluvium, so that artificial recharge possibly could be ac complished fairly readily.
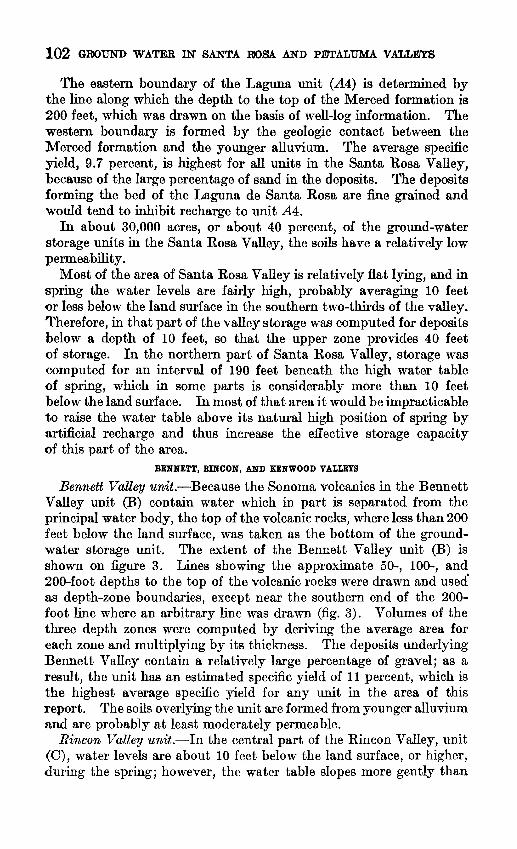
102 GROUND WATER IN SANTA ROSIA AND PETALTTMA VALLEYS
The eastern boundary of the Laguna unit (A4) is determined by the line along which the depth to the top of the Merced formation is 200 feet, which was drawn on the basis of well-log information. The western boundary is formed by the geologic contact between the Merced formation and the younger alluvium. The average specific yield, 9.7 percent, is highest for all units in the Santa Rosa Valley, because of the large percentage of sand in the deposits. The deposits forming the bed of the Laguna de Santa Rosa are fine grained and would tend to inhibit recharge to unit A4.
In about 30,000 acres, or about 40 percent, of the ground-water storage units in the Santa Rosa Valley, the soils have a relatively low permeability.
Most of the area of Santa Rosa Valley is relatively flat lying, and in spring the water levels are fairly high, probably averaging 10 feet or less below the land surface in the southern two-thirds of the valley. Therefore, in that part of the valley storage was computed for deposits below a depth of 10 feet, so that the upper zone provides 40 feet of storage. In the northern part of Santa Rosa Valley, storage was computed for an interval of 190 feet beneath the high water table of spring, which in some parts is considerably more than 10 feet below the land surface. In most of that area it would be impracticable to raise the water table above its natural high position of spring by artificial recharge and thus increase the effective storage capacity of this part of the area.
BENNETT, RINCON, AND KENWOOD VAIIEYS
Bennett Valley unit. Because the Sonoma volcanics in the Bennett Valley unit (B) contain water which in part is separated from the principal water body, the top of the volcanic rocks, where less than 200 feet below the land surface, was taken as the bottom of the ground- water storage unit. The extent of the Bennett Valley unit (B) is shown on figure 3. Lines showing the approximate 50-, 100-, and 200-foot depths to the top of the volcanic rocks were drawn and used' as depth-zone boundaries, except near the southern end of the 200- foot line where an arbitrary line was drawn (fig. 3). Volumes of the three depth zones were computed by deriving the average area for each zone and multiplying by its thickness. The deposits underlying Bennett Valley contain a relatively large percentage of gravel; as a result, the unit has an estimated specific yield of 11 percent, which is the highest average specific yield for any unit in the area of this report. The soils overlying the unit are formed from younger alluvium and are probably at least moderately permeable.
Rincon Valley unit. In the central part of the Rincon Valley, unit (C), water levels are about 10 feet below the land surface, or higher, during the spring; however, the water table slopes more gently than

GROUND WATER 103
the land surface, so that spring water levels near the margins of the valley commonly are considerably more than 10 feet below the land surface. To make the storage volumes comparable with those in other areas, 190 feet of storage was computed for the entire valley 10-200 feet below the land surface in the central part of the valley and 190 feet below the springtime water table in the rest of the valley.
Kenwood Vattey, north unit. In the northern part of Ken wood Valley, unit (D), storage was computed, as hi Rincon Valley, for three zones, 10-50, 50-100, and 100-200 feet. This unit has an estimated specific yield of 5.5 percent, which is the lowest average specific yield for all the units for which storage was computed.
Kenwood Valley, south unit. In the southern part of Kenwood Valley, unit (E), the alluvial plain has a low slope and is flatter than in the northern part of the valley, and water levels are higher, prob ably averaging less than 10 feet below the land surface in the spring. Storage in the zones 10-50 feet and 50-100 feet below the land sur face was computed. Because of an insufficient number of logs and lack of data on the vertical extent of the confined water body in the underlying Sonoma volcanics, computations were not made for the zone 100-200 feet below the land surface.
The storage in the southern part of Kenwood Valley, unit (E), was computed separately from that hi the northern part, because the specific yield was estimated to be greater and because more data were available for the 100- to 200-foot depth zone in the northern part of the valley.
ESTIMATED STORAGE CAPACITY
The methods used to obtain the estimated gross ground-water storage capacity in the Santa Rosa Valley area are described below. These same methods were employed to obtain the storage estimates in the Petaluma Valley area. (See p. 131-132.) The steps involved in the computation of storage capacity are as follows:
1. The deposits beneath valleys were divided areally into eight units, designated A1-A4, B, C, D, and E in the Santa Rosa Valley area, as described in the preceding section, and into units P\ and P2 in the Petaluma Valley area.
2. Depth zones, generally 10-50, 50-100, and 100-200 feet below the land surface, were used. Where average springtime water levels were more than 10 feet below the land surface, the zones were taken from the water table to a maximum depth of 190 feet below it. The volumes of the zones in the units were obtained by multiplying the area by the thickness of each zone.
3. The logged materials in the wells in each depth zone were assigned to one of six specific-yield categories, based on the adaption by Poland and others (1951, p. 624-625) of work done by Eckis (1934)

104 GROUND WATER IN SANTA ROSA AND PETALTJMA VALLEYS
TABLE 10. Categories used for classification of materials described by drillers, and estimates, by category, of specific yield in the Santa Rosa and Petaluma Valley areas
Assigned specific
yield Category ' (percent)
Gravel (boulders, cobbles, gravel, and shells)________________________ 25Sand (clamshells, sand and gravel, gravelly sand)____________________ 20Clay, sand, and gravel (dirty sand, quicksand, coarse sandstone, silt)____ 10Clay and gravel (cemented gravel, hard sandstone)____________________ 5Clay (decomposed rock, hardpan, shale where probably clay)__________ 3Rock (hard shale, shale if not clay, serpentine, basalt, or lava)_________ 0
1 First term or terms denote category in which drillers' terms, enclosed by parentheses, have been grouped.
and Piper and others (1939, p. 101-122). A total of nearly 500 well logs were used in the computations, and about 300 different drillers' terms were grouped into the six categories described in table 10.
4. The average specific yield was computed for each depth zone in each unit by multiplying the percentage of each type of material by the assigned specific-yield value and totaling the sums. The results are given in table 11.
TABLE 11. Average estimated specific yield of ground-water storage units in the Santa Rosa Valley area, California
Depth zone » (feet)
Number of feet logged, percentage of feet logged, and average specific yield (percent) for indicated categories * of material
Gravel SandClay,
sand, and gravel
Clay and
gravelClay Rock Total
Number of logs
in which depth zone is
de scribed
Storage unit -41
60-KKK percent logged . _ (specific yield ______
100-200-jpercent logged.. _
3269.32.32
2979.3 232
32210.7 268
37510.7214
3119.8 1.96
2267.5 1.50
206<; o.59
4.9 .49
1635.4 .54
1,21534.7
1.741,309
41.1 2.06
1,07735.8
1.80
1,37539.41.18
1,11134.9
1.051,220
40.6 1.22
00000 0000
3,497100.0
ao3,183
100.0 7.9
3,001100.0
7.7
89
86
42
Storage unit A2
60-lOwpercent logged.. ....
percent logged __
76410.52.62
77813.2 3.30
4478.4 210
5507.51.50
3886.6 1.32
13726 .52
2503.4.34
2384.0 .40
13024
2,09528. 7
1.441,715
29.1 1.46
1,80933.8
1.69
3,57549.11.47
2,64145.0
1.352,680
50.1 1.50
60.8
0124
2.1 0
14327 0
7,294ioao7.4
5,884ioao7.8
5,346100.0
6.0
185
172
78
Storage unit A3
10-50<percent logged _______
50-lOwpercent logged ______
percent logged _____
1055.51.38
1426.5 1.63
1997.41.85
23712.42.48
25111.59 ^_fi
30411.2
1899.9.99
261120 1.20
1646.1
58030.2
1.5172733.3
1 6673327.1 1.36
80742.0
1.2680136.7
1.101,294
47.8 1.43
00000
10.4
0
1,918100.0
7.62,182
100.0 7.9
2,704100.0
7.5
49
50
38
See footnotes at end of table.

GKOTJND WATER 105
TABLE 11. Average estimated specific yield of ground-water storage units in the Santa Rosa Valley area, California Continued
Depth zone ' (feet)
Number of feet logged, percentage of feet logged, and average specific yield (percent) for indicated categories 8 of material
Gravel SandClay,
sand, and gravel
Clay and
gravelClay Rock Total
Number of logs
in which depth zone is
de scribed;
Storage unit At
(specific yield.... _
lOO-aXHpercent logged __
1063.9.98
2288.22.05
602.3.68
50918.83.76
60321.64.32
59322.7 4.54
28910.71.07
60721.82.18
80130.6 3.06
51519.1
.9660921.9L10
68326.1 1.30
1,28047.5
1.4273826.5
.8047Q18.3
.55
000000 00 0
2,699100.0
8.28, 785
100.010.4
%616100.0
1ft 0
71
71
«
Storage unit B
100-2(XKpercent logged.. _
10622.65.65
14327.96.98
9424.1 6.02
153.2.64
356.81.36
4712.1 2.42
224.7.47
102.0.20
205.1 .51
16034.2
1.7118335.8
1.7914236.4 1.82
16535.3
1.1014127.5
.838722.3
.67
00000000 0
4fittieo.o
9.661?100.011.2
3W100.0 11.4
1?
1?
1
Storage unit C
SO-lO&jpercent logged......
100-200<percent logged ., [specific yield ......
936.01.50
744.8 1.20
261.7 .42
1268.11.62
654.2 .84
332.1 .42
865.5.55
1097.0 .70
1197.8 .78
67143 02.15
72646.6 2.33
84155.0 2.75
41526.6
.8037424.0
.72284
18.6 .56
16910.80
209U4 0
22614.8 0
1,860ioao
6.61,357
100,0 5.8
1,529100.0
4,9
3ft
40)
2?
Storage unit D
50-100<percent logged.. ....
100-200<percent logged.. ...
122.7.68
91.5 .38
252.2.55
4.9.18
00 0
201.7 .34
143.2.32
101.7 .17
151.3 .13
36081.84.09
40767.6 3.38
94282.0 4.10
5011.4
.3417629.2
.8814712.8
.38
00000 000 0
440100.0
5».6602100.0
4.81,149
100.05.5
13
13
1!
Storage unit E
50-10CKpercent logged . ...
100-200<percent logged.-.-
6418.04.50
398.7 2.18
4812.4 3.10
82.3.46
112.5 .40
00 0
5916.61.66
204.5.45
00 0
11632.71.64
18441.3 2.06
15740.5 2.02
10228.7
.8617839.9
1.2016840.7
1.22
61.70
143.1 0
256.4 0
365100.0
9.1446160.0
6.3388160.0
6.3
$
J
*
»In units Al, C, and D, storage was computed to a depth of 190 feet below the springtime high water, table and divided into zone thicknesses of 40,50, and 100 feet, so as to be comparable to the storage computed^ for other units (see p. 102-103).
2 See table 10 for explanation of categories and the specific yieids assigned to the categories..
443616 68 8
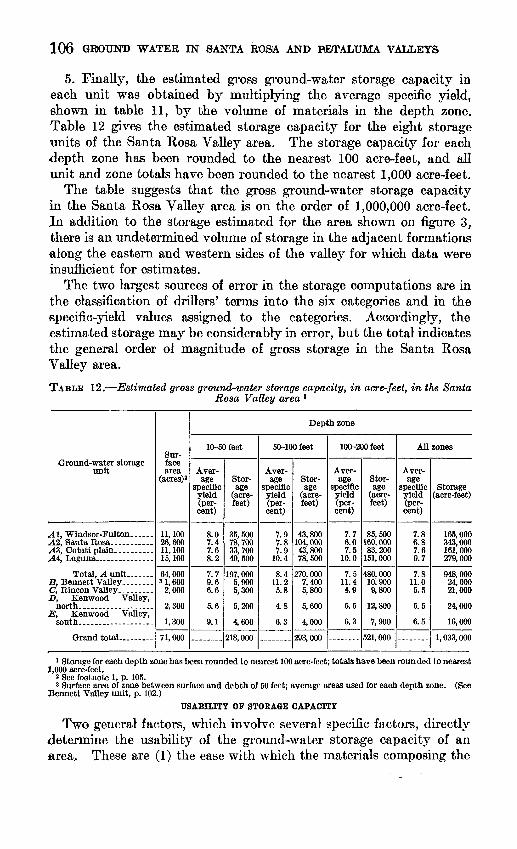
106 GROUND WATER IN SANTA ROSA ANI> PETALUMA VALLEYS
5. Finally, the estimated gross ground-water storage capacity in «ach unit was obtained by multiplying the average specific yield, shown in table 11, by the volume of materials in the depth zone. Table 12 gives the estimated storage capacity for the eight storage units of the Santa Rosa Valley area. The storage capacity for each depth zone has been rounded to the nearest 100 acre-feet, and all unit and zone totals have been rounded to the nearest 1,000 acre-feet.
The table suggests that the gross ground-water storage capacity in the Santa Rosa Valley area is on the order of 1,000,000 acre-feet. Jn addition to the storage estimated for the area shown OD figure 3, there is an undetermined volume of storage in the adjacent formations along the eastern and western sides of the valley for which data were insufficient for estimates.
The two largest sources of error in the storage computations are in the classification of drillers' terms into the six categories and in the specific-yield values assigned to the categories. Accordingly, the estimated storage may be considerably in error, but the total indicates the general order of magnitude of gross storage in the Santa Rosa Valley area.
TABLE 12. Estimated gross ground-water storage capacity, in acre-feet, in the SantaRosa Valley area '
Ground-water storage unit
Al, Windsor-Fulton......
D, Kenwood Valley,
E, Kenwood Valley,
Sur face area
(acres)'
11, 100 26,600 11, 100 15, 100
64,000 s 1, 600
2,000
2,300
1,300
71, 000
Depth zone
10-50 feet
Aver age
specific yield (per cent)
8.0 7.4 7.6 8.2
7.7 9.6 6.6
5.6
9.1
Stor age
(acre- feet)
35,500 78, 700 33,700 49,500
197, 000 5,900 5,300
5,200
4,600
218,000
50-100 feet
Aver age
specific yield (per cent)
7.9 7.8 7.9
10.4
8.4 11.2 5.8
4.8
6.3
Stor age
(acre- feet)
43,800 104,000 43,800 78,500
270, 000 7,400 5,800
5,600
4,000
293,000
100-200 feet
Aver age
specific yield (per cent)
7.7 6.0 7.5
10.0
7.5 11.4 4.9
5.5
6.3
Stor age
(acre- feet)
85,500 160,000 83,200
151,000
480, 000 10,900 9,800
12,800
7,900
521, 000
All zones
Aver age
specific yield (per cent)
7.8 6.8 7.6 9.7
7.8 11.0 5.5
5.5
6.5
Storage (acre-feet)
165, 000 343, 000 161, 000 279, 000
948,000 24,000 21,000
24,000
16,000
1,033,000
1 Storage for each depth zone has been rounded to nearest 100 acre-feet; totals have been rounded to nearest 1,000 acre-feet,
3 See footnote 1, p. 105.8 Surface area of zone between surface and debth of 50 feet; average areas used for each depth zone. (See
Bennett Valley unit, p. 102.)USABILITY OF STORAGE CAPACITY
Two general factors, which involve several specific factors, directly determine the usability of the ground-water storage capacity of an area, These are (1) the ease with which the materials composing the
GROUND WATER 107
storage zone can be dewatered by gravity drainage (pumping), and (2) the ease with which the deposits can be resaturated so as to utilize cyclic recharge from sources such as surplus winter runoff in streams. Both time and economic factors enter into the general considerations, but the specific factors are the transmissibility of the water-yielding materials and the permeability of the surficial materials which control the rate of recharge.
Because water contained in the Merced formation in the large area underlying and forming the low hills adjacent to the alluvial plain on the western side of Santa Rosa Valley is continuous with water in the deposits beneath the valley floor, it would not be possible to dewater the entire zone for which the storage volume was computed without inducing additional inflow from the adjacent, saturated deposits of the Merced. Therefore, the usable ground water in storage that is available for withdrawal is potentially greater than the storage figures indicate, by the amount of the underflow that would be induced. Conversely, the volume of dewatered materials beneath the valley floor that could accept recharge would be considerably less than the amount of the withdrawals, for the same reason. However, large-scale pumping in the valley would result in additional dewatering of deposits in the upland area. Thus, obtaining adequate data concerning the transmissibility of the deposits of the Merced formation would be one necessary factor in determining usable storage capacity. Other formations not considered in the storage units would require similar studies.
Because the specific-yield values obtained were in a medium-to- low range for most of the storage units and because data on the lithology and water-yielding character of the deposits suggest that gravity drainage of the deposits would proceed relatively slowly making the consideration of economic yield and drawdown pertinent factors it might be difficult to utilize storage to the full 200-foot depth within a limited period of time.
Water quality probably would not be impaired by dewatering the ground-water reservoir to depths of 200 feet below the land surface in the Santa Rosa Valley area. However, in areas where faults are believed to cut the deposits at relatively shallow depths, local boron contamination might ensue as the head in the aquifers was drawn down and the head of the water in the faults became relatively greater. (See pi. 2 and section on quality of water.)
Lowering the water table in the Santa Rosa Valley area would result in increased recharge from rainfall or from streams in areas where the water table normally is close to the land surface, salvaging of some of the natural discharge now lost through evapotranspiration, ground-water outflow to streams, and subsurface flow from the area.

108 GROUND WATER IN SANTA ROSA AND PETALUMA VALLETS
PETALUMA VALLEY AREA
The Petaluma Valley area of this report comprises Petaluma Valley; the small tributary valleys; and contiguous areas, which include the small alluvial valley southeast of Penngrove, upland areas adjoining the valley especially areas underlain by deposits of the Merced formation in the northwestern and southeastern parts of the valley and Novato Valley.
The principal water-bearing deposits are the younger and the older alluvium and the Merced formation. Locally, water occurs in the Petaluma formation and in the Sonoma volcanics; in a few places minor amounts of water are obtained from Cretaceous and Jurassic rocks.
In much of the Petaluma Valley area the ground-water reservoir has limited vertical extent, owing to faulting. East of Petaluma on the southwestern side of the Tolay fault the Franciscan group is- penetrated at depths of only 400-800 feet. Northeast of the fault the Petaluma formation lies at the surface, or is encountered at shallow depth, and extends to a considerable depth, but the water-bearing beds it contains have low permeability.
In the Petaluma Valley area about 1,500 wells (1950) pump ground water, principally for domestic, public-supply, irrigation, industrial, and stock use. In the northern part of Petaluma Valley water wells- range in depth from 10 to 688 feet, excluding converted oil and gas- test wells in the Petaluma formation. Domestic wells on the valley floor are generally 75-150 feet deep; in the upland area they are commonly deeper, owing to the greater depth to water. Most of the wells are for domestic use; these wells yield 10-50 gpm and are not designed to produce large yields. The specific capacity of most domestic and stock wells is low commonly about 1 gpm per foot or less because most of the wells are perforated only near the bottom or have open-end casings only, so that much water-yielding material is cased off. In addition, wells other than those drilled for irrigation use generally are not developed for maximum yield. Irrigation, public-supply, and industrial wells are commonly 250-600 feet deep and yield 50-350 gpm.
In the central part of the valley east and southeast of Petaluma, the indicated range in average permeability, based on yield factors of 16 wells of relatively large yield tapping the principal water body, ranges from 5 to 145 gpd and averages about 50 gpd per square foot, On the basis of the yield factors of these wells it appears that, although larger yields are obtained from the deeper wells, the yield per foot of material that the well penetrates decreases with depth.
In the southern part of Petaluma Valley, wells range in depth from
GROUND WATER 109
15 to 736 feet, but most wells are 75-250 feet deep. Yields range from a few gpm to about 150 gpm.
In Novato Valley, in the vicinity of Novato, most wells are 30-60 ieet deep and yield 10-50 gpm.
PRINCIPAL WATER-BEARING FORMATIONS
YOUNGER AI1UVIUM
The younger alluvium has a considerable thickness in Petaluma Valley, especially in the southeastern (lower) part. However, because most of the southern part of the valley is tidal, not everywhere does the younger alluvium form a usable part of the ground-water reservoir. 'The maximum thickness of the younger alluvium in the northern part of Petaluma Valley has not been definitely ascertained, but on the basis of well logs it is believed to be as much as 200 feet. In the extreme northern part the thickness is much less, decreasing to a feather edge at the margins of the alluvial plain.
In the southern or downstream part of Petaluma Valley the thick ness of the younger alluvium may be as much as 300 feet, depending on the gradient of the pre-alluvial trench cut by ancestral Petaluma Creek. This trench doubtless was graded to the canyon cut through the Golden Gate of San Francisco Bay, which is 381 feet or more below sea level (Hinds, 1952, p. 170). No logs are available of deep wells in the southern part of Petaluma Valley except along the north eastern edge of the valley; thus the maximum thickness in that area is not known.
The younger alluvium yields small-to-moderate supplies of water of good quality to many wells in the northern part of Petaluma Valley and to a few in the southern part, but most wells that have large yields completely penetrate the younger alluvium and tap the older alluvium or the Merced formation, or both. Few data are available on the water-yielding character of the younger alluvium. Specific capacities computed from bailer tests run by drillers on a few wells in the northern part of Petaluma Valley range from less than 1 to as much as 5 gpm per foot of drawdown.
In the southern part of Petaluma Valley, according to logs of a few scattered shallow wells, the younger alluvium consists mostly of clay and silt, and the yields are relatively low. Wells 3/6-4D1 and 5Al encountered 6 feet of gravel at a depth of about 80 feet; well 5Al yielded 37 gpm of brackish water when pumped with a centrifugal pump. Well 4/6-33R1, 180 feet deep, across Petaluma Creek from the above wells, is reported to yield 150-200 gpm.
The quality of the water is poor in a large proportion of the southern part of the valley, and near Petaluma Creek and tidal sloughs the

110 GROUND WATER IN SANTA ROSlA AND PETALUMA VALLEYS
water is commonly brackish. On the central alluvial plain, wells yield fresh water only near the northeastern margin and in an area of reclaimed land at the southern margin near the bay. Younger alluvium locally may contribute some fresh water to wells along the northeastern margin, but at the southern margin the wells are all comparatively deep (mostly 200 feet or more). These facts suggest either that the shallow water is brackish or that the uppermost deposits are poorly permeable, so that the bulk of the water probably is supplied by basal younger alluvium or older deposits. The wells are all old and no logs are available. Many have been recased several times with liners, which suggests that water of poor quality occurs in the section tapped. Many of the wells flow and the water levels in the others are near the land surface.
Ground water in the younger alluvium occurs under essentially water-table conditions in the northern part of Petaluma Valley and is probably coextensive with water in the older alluvium; downstream it is semiconfined or confined. Some of the wells flow during high tide, and all respond to tidal fluctuations.
OLDER ALLUVIUM
The older alluvium makes up a principal part of the deposits comprising the ground-water reservoir in the Petaluma Valley area. The unconsolidated deposits of silty or sandy clay, sand, and gravel crop out only locally on the northeastern side of the valley but extend across the valley beneath the younger alluvium, where they overlap deposits of the Merced formation. Logs of wells that penetrate the older alluvium indicate a possible maximum thickness of about 200 feet.
The older alluvium supplies moderate to fair yields to wells in upper Petaluma Valley, but the specific capacities are low. In a well field in 5/7-28, the average specific capacity for 9 wells, which range in depth from 83 to 483 feet and obtain most of their water from older alluvium, is about 3.5 gpm per foot of drawdown. Possibly the capacity is lowered somewhat by interference between wells. The range in yield among the wells is 30-180 gpm, the deeper wells having the higher yields. Yield factors for these range from 0.2 to 9.0 and averaged 4.0, suggesting a range in permeability of 5-150 gpd and an average of about 70 gpd per square foot. The deepest four wells may tap the Merced formation also. Other wells tapping both the younger and the older alluvium yield as much as 300 gpm.
Water in the older alluvium is essentially unconfined, although the lenticularity and heterogeneity of the deposits causes poor inter connection and locally may produce slight confinement or zonation within the water body. Also, where overlain by fine-grained deposits
GROUND WATER 111
hi the younger alluvium, the older alluvium is confined. The quality of the water is good for most uses. (See section on quality of water.)
MERCED FORMATION
The Merced formation is the principal aquifer in the upland area, northwest of the city of Petaluma, in the northwestern part of the valley, and on the northeastern flank of the lower valley, and the Merced is tapped by deeper wells near the center of the valley and near the bay.
Reported specific capacities generally are extremely low, many less than 1, because most wells are not constructed to obtain maximum yields from the fine sand of the Merced formation. However, when the development test was made of gravel-packed well 5/7-20C1, which appears to obtain a large part of its yield from the Merced, the well produced 650 gpm and had a drawdown of 140 feet, showing a specific capacity of 5 gpm per foot of drawdown. This well had the largest reported yield in the valley at the time of the well canvass by the Geological Survey. Yields of wells suggest that the permeability of the Merced is less in the southeastern part of the valley than in the northwestern part.
Water in the Merced formation is known to be confined in the north ern part of Petaluma Valley (5/8-13, 24), where several wells flow dur ing the spring. The head is only a few feet above the water table, and the water is probably confined by impermeable beds of local extent. The Merced formation is undoubtedly confined in other places, such as near the bay, by fine-grained alluvium. The quality of water in the Merced formation is generally satisfactory. Locally, near the bay, water in the Merced may be brackish.
SONOMA VOICANICS
The Sonoma volcanics form only a small part of the ground-water reservoir in Petaluma Valley, but locally they supply moderate yields to a few wells, probably from tuff and fractured lava. South of Penngrove and southwest of Petaluma are the two principal areas in the Petaluma Valley area where wells penetrate volcanic rocks. Except in the immediate vicinity of outcrops (see pi. 1), volcanic rocks are not encountered in wells beneath the alluvial plain. The quality of water obtained from the Sonoma volcanics is generally satisfactory,
PETALUMA FORMATION
Near the northeastern margin of Petaluma Valley, supplies of water of good quality sufficient for domestic use generally can be obtained from the Petaluma formation, although wells tapping this formation may have to be deeper than average because the deposits are largely compact and fine grained. Locally, wells obtain enough water for

112 GRlODND WATER IN SANTA ROSA AND PETALUMA VALLEYS
small-scale irrigation developments. Well 5/7-25C1, which on the basis of the log appears to receive most of its water from the Petaluma formation, is 235 feet deep and when drilled was reported to have pro duced 350 gpm. Water analyses suggest that the formation may con tribute to the yields of a few deep wells in the north-central part of Petaluma Valley. (See section on quality of water in the principal ground-water body.) In the upland area the yields are small, and the quality is generally poor in places, too saline for human or animal consumption.
Considerable confinement or separation of water bodies occurs in the Petaluma formation. The head of water in the Petaluma forma tion is generally lower than in the younger and the older alluvium, locally by as much as 100 feet or more. However, some wells have artesian heads produced by deformed impermeable beds or by fault barriers. Because of the considerable disparity between the altitudes of water levels in wells tapping the Petaluma formation, water-level contours are drawn on the levels in the formation only in local areas (pl. 2).
PRINCIPAL! WATER BODY
EXTENT, NATURE, AND DEPTH TO WATER
The principal water body in Petaluma Valley includes water in the younger and the older alluvium and in the Merced formation. Lateral ly, it underlies the alluvial plain of the upper part of Petaluma Valley and much of the adjoining upland area which is underlain by the Merced formation or older alluvium; vertically, it occupies those deposits overlying the Petaluma formation, and locally that formation where it is not confined.
In general the water body is either unconfined or semiconfined, although locally it is confined and may produce artesian heads. Also, there is some evidence of poor vertical connection locally within the water body. On April 4, 1951, the water levels in four closely spaced wells near the center of the valley wells which had not been pumped since the autumn of 1950 are given in table 13.
TABLE 13. Comparison of water levels in closely spaced wells of different depth inthe principal water body
Well number
5/7 28A2.____--__-_____._....____.._________...28A3...... ..... .........................28H1 _ . ___ ............................28H2......................................
Depth(feet)
99280483
95
Perforatedinterval (feet)
78-90, 220-260.-. 154-315, 323-483....
Altitudeof landsurface(feet)
35353535
Depth towater(feet)
16.9915.7921.5016.57
GROUND WATER 113
Water levels in shallow wells 5/7-28A2 and 28H2 and in well 5/7-28AS of intermediate depth are similar and average about 16.5 feet, or about 5 feet higher than the water level in deep well 5/7-28H1. This differ ence in water levels suggests that locally the water body is separated vertically by impermeable beds which impede recharge to the deep part of the aquifer.
Because the alluvial deposits are highly lenticular, differences in head may occur in relatively short distances. Well 5/7-35B1, 28}£ feet deep, reportedly "went dry" temporarily during the test pumping of well 5/7-26R1, 428 feet deep, despite the fact that the latter well was not perforated above a depth of 140 feet and was cemented from the surface to a depth of 118 feet. Thus it appears that in the vicinity of these wells there is no effective separation of deep and shallow water. The similar water-level fluctuations in wells 5/7-26R1, 428 feet deepr and 26R2, 35 feet deep, (pi. 14) support this conclusion.
The depth to water in the principal water body varies somewhat from place to place and is controlled largely by the local topography and well depth and construction. However, in the spring, water levels in most wells on the alluvial plain are generally 10-25 feet below the land surface, being closest to the surface toward the axi& and the southern end of the valley. In the autumn, levels commonly are 15 10 feet below the surface, except where intensive development has temporarily lowered them still more.
South of the storage boundary shown on figure 3, the quality of water in much of that part of the principal water body contained in the younger and the older alluvium is such that the water cannot be used for most purposes. However, along the sides of the valley and locally beneath the alluvial deposits, water of fair or good quality i& obtained in small quantity. The depths to water below the land surface are commonly a few feet in the valley trough and from 20 to 50 feet or more on the valley slopes.
FLUCTUATION OF WATER LEVELS
During the field study, periodic water-level measurements were made in a number of wells 19 to determine the general character and amount of the seasonal fluctuations of water level. These are given in table 24 of the appendix. In addition, an automatic water-level recorder was operated for several months in well 5/7-26R1 and briefly in well 3/6-5A1 to determine in more detail the character of the water-level fluctuations in the principal water body. The chief
» Water levels in six wells were measured periodically during the autumn of 1949, and in six additional wells during 1950 and 1951; measurements of one well were discontinued during 1950 and 1951. In 1952 measure ments were made semiannually (spring and autumn), and in the autumn of 1952 the number of wells measured was decreased to five. Measurements have been continued in these wells since 1952.
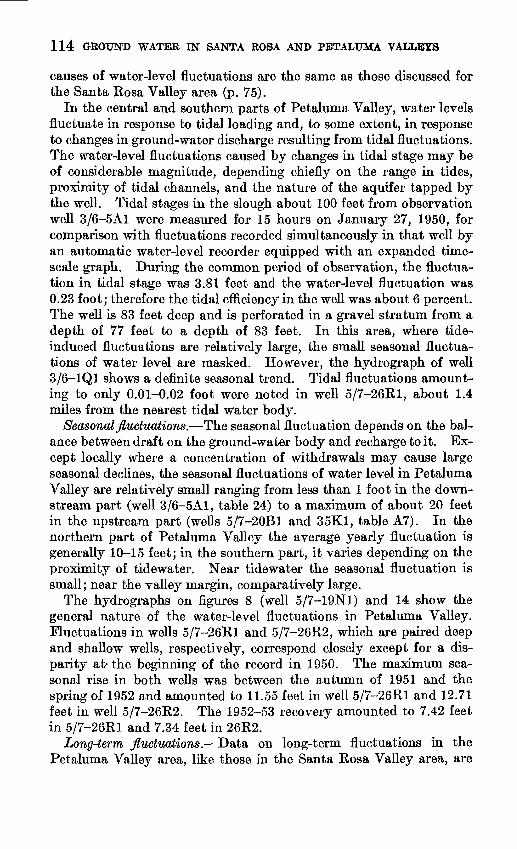
114 GROUND WATER EST SANTA ROSA AND PETALUMA VALI/ETS
causes of water-level fluctuations are the same as those discussed for the Santa Rosa Valley area (p. 75).
In the central and southern parts of Petaluma Valley, water levels fluctuate in response to tidal loading and, to some extent, in response to changes in ground-water discharge resulting from tidal fluctuations. The water-level fluctuations caused by changes in tidal stage may be of considerable magnitude, depending chiefly on the range in tides, proximity of tidal channels, and the nature of the aquifer tapped by the well. Tidal stages in the slough about 100 feet from observation well 3/6-5A1 were measured for 15 hours on January 27, 1950, for comparison with fluctuations recorded simultaneously in that well by an automatic water-level recorder equipped with an expanded time- scale graph. During the common period of observation, the fluctua tion in tidal stage was 3.81 feet and the water-level fluctuation was 0.23 foot; therefore the tidal efficiency in the well was about 6 percent. The well is 83 feet deep and is perforated in a gravel stratum from a depth of 77 feet to a depth of 83 feet. In this area, where tide- induced fluctuations are relatively large, the small seasonal fluctua tions of water level are masked. However, the hydrograph of well 3/6-1Q1 shows a definite seasonal trend. Tidal fluctuations amount ing to only 0.01-0.02 foot were noted in well 5/7-26R1, about 1.4 miles from the nearest tidal water body.
Seasonal fluctuations. The seasonal fluctuation depends on the bal ance between draft on the ground-water body and recharge to it. Ex cept locally where a concentration of withdrawals may cause large seasonal declines, the seasonal fluctuations of water level in Petaluma Valley are relatively small ranging from less than 1 foot in the down stream part (well 3/6-5A1, table 24) to a maximum of about 20 feet in the upstream part (wells 5/7-20B1 and 35K1, table A7). In the northern part of Petaluma Valley the average yearly fluctuation is generally 10-15 feet; in the southern part, it varies depending on the proximity of tidewater. Near tidewater the seasonal fluctuation is small; near the valley margin, comparatively large.
The hydrographs on figures 8 (well 5/7-19Nl) and 14 show the general nature of the water-level fluctuations in Petaluma Valley. Fluctuations in wells 5/7-26R1 and 5/7-26R2, which are paired deep and shallow wells, respectively, correspond closely except for a dis parity at- the beginning of the record in 1950. The maximum sea sonal rise in both wells was between the autumn of 1951 and the spring of 1952 and amounted to 11.55 feet in well 5/7-26R1 and 12.71 feet in well 5/7-26R2. The 1952-53 recovery amounted to 7.42 feet in 5/7-26R1 and 7.34 feet in 26R2.
Long-term fluctuations. Data on long-term fluctuations in the Petaluma Valley area, like those in the Santa Rosa Valley area, are

GROUND WATER 115
Roinfoll deficit fo prior 21 yeart
I I I CUMULATIVE DEPARTURE OF RAINFALL FROM
14. Hydrographs for three wells in Petaluma Valley, 1949-54, and rainfall at Petaluma, Calif. -1
limited to the relatively short 4-year period, 1950-54. The most significant water-level trends in upper Petaluma Valley appear to be related to the rainfall regimen (fig. 14). Water levels in 5 wells that were measured during the springs of 1950, 1951, and 1952 showed a net rise averaging 5.4 feet in the 2 years. Rainfall during the period was above average. The levels^ 3 of the wells that were measured in the spring of 1953, had declined 1-3 feet since the spring of 1952. Although the rainfall for the 1953 water year was slightly below that recorded in each of the proceeding 2 years, it was still about 1.4 inches above normal.
The period of record is too short to serve as a good index, especially because rainfall was generally above normal throughout. Also, the fresh-water body of the area is threatened with salt-water encroach ment. Where water levels are depressed below sea level for con siderable periods of time in areas near tidewater, a reversed water-level
116 GROUND WATER IN SANTA ROSA AND PETALUMA VALLEYS
or hydraulic gradient may result in encroachment of sea water and in eventual deterioration of the ground-water quality. Continued periodic water-level measurements and chemical analyses would provide data on possiblities of sea-water encroachment.
OTHER WATER BODIES
Isolated water bodies in the Petaluma, formation. As previously indicated (p. 112), ground water in the Petaluma formation occurs locally in isolated bodies which are separated from the principal water body. Water-level fluctuations and depth to water commonly vary considerably between wells. Although a large number of wells tap the formation on the northeastern side of upper Petaluma Valley, their draft is relatively small.
Water body in Novato Valley. The ground-water body in Novato- Valley is essentially separate from that in Petaluma Valley. The water occurs principally in deposits of younger and older alluvium that rest on bedrock of the Franciscan group. The older alluvium is exposed only in a small area on the northern side of the upstream part of the valley, but it presumably underlies the younger alluvium in most of the valley. Well-log data are insufficient to permit an accurate estimate of the total thickness of the younger and older alluvium, but in the vicinity of Novato the thickness is locally at least 60 feet; it probably ranges from a few feet at the head of the valley to 200 feet or more at the mouth, downstream from Novato. The surfaces cut on rocks of the Franciscan group commonly are very irregular, so that even in the downstream part of the valley the thickness of the allu vium may vary considerably from place to place. Around the margins of the valley small supplies of ground water are obtained from the Franciscan group. In the hills north of the mouth of the valley the Novato conglomerate is tapped by some wells.
Confined and semiconfined conditions probably prevail in the water body, although fine-grained deposits in the downstream part of the valley may cause extensive confinement, as in Petaluma Valley. The depth to water is generally 5-10 feet below the land surface in the vicinity of Novato during the spring, and is less in the tidal area. The seasonal fluctuation is small and autumn levels near Novato are generally 10-25 feet below the land surface.
The pumpage by the North Marin Water Co., which serves the town of Novato, was 210 acre-feet in 1949. Other pumpage in the valley is chiefly for domestic and stock use, which includes use by several dairies. The total pumpage for 1949 was probably about 300 acre- feet, and, although the population of the area has increased con siderably, the current annual pumpage (1954) probably is not more than 400 acre-feet.

GROUND WATEB 117
Although the ground water normally moves down valley to discharge into San Pablo Bay, tidal fluctuations, which cause intrusion of brackish water into it, render much of the downstream part of the ground-water reservoir unusable. Even above the tidal reach, inten sive withdrawals may cause deterioration of water quality by inducing brackish water to move into the fresh-water body. This factor reduces considerably the usable ground-water storage.
SOURCE OF WATER
The ground water in the Petaluma Valley area is recharged in large part by the deep infiltration of rainfall but also in part by seepage loss from streams that cross permeable deposits that lie above the water table. However, seepage gain occurs along the main stem of Petaluma Creek upstream from the tidal reach. Tributaries draining the Sonoma Mountains along the northeastern side of the valley supply recharge where their courses cross permeable beds. Some of this re charge is from low flows sustained by ground-water discharge from the Sonoma volcanics and Petaluma formation in the Sonoma Mountains. Along the course of Adobe Creek across the valley floor, water levels in wells are lower than the stream bed during most years, indicating that the creek is generally influent with respect to the ground water where the channel is permeable. Streams draining terrane of the Merced formation are mainly effluent; those draining the Sonoma Mountains are locally and intermittently influent. Rainfall records show that less rain falls in Santa Rosa Valley than in Petaluma Valley. Hence, the unit recharge available in the Petaluma Valley area is also less than that in the Santa Rosa Valley area, and the amount decreases in the direction of San Francisco Bay.
MOVEMENT OF WATER
Ground water in the principal water body in the Petaluma Valley area moves generally northeastward and southwestward toward Petaluma Creek and downstream toward the tidal sloughs (pi. 2). Ground water in the valley trough south of Petaluma moves in the same general directions. The water-level contours generally are more closely spaced than those in Santa Rosa Valley, suggesting lower permeability or smaller cross-sectional area of the deposits, or both. The hydraulic gradient in the northern part of Petaluma Valley is between 20 and 50 feet per mile except in the rolling upland area underlain by the Merced formation, where it is greater than 50 feet per mile.
In the southern part of the valley the local interchange of water between the water body and Petaluma Creek is related to tidal fluctua tions. Also, in the vicinity of the city of Petaluma, heavy draft on the ground-water body locally results in reversal of the hydraulic

118 GROUND WATER IN SANTA ROSA AND PETALUMA VALLEYS
gradient, which allows saline water to enter the water body, causing deterioration of water quality. Up to 1951 this deterioration was fairly limited in extent, mostly within a few hundred feet of the tidal channel.
Water in the Petaluma formation moves generally down dip and may discharge into the principal water body locally. However, movement of ground water in the Petaluma formation is controlled to a consider able degree by geologic structure, and no contours were drawn on the water levels in the isolated water bodies.
NATURAL. DISCHARGE AND PUMPAGE
In the Petaluma Valley area ground water is discharged mainly by seepage into streams, evapotranspiration, and pumping from wells. During the spring, ground water in the northern part of Petaluma Valley discharges into Petaluma Creek and into the tidal sloughs. However, a west-trending trough in the water body probably results from the concentration of pumping east and north of the city of Peta luma, and it may intercept much of the water that under natural condi tions would be discharged to the sloughs.
Because the water table is perennially close to the land surface beneath the alluvial plain near the tidal sloughs, evapotranspiration undoubtedly accounts for a large part of the ground-water discharge, especially where tules, reeds, and cattails flourish. Upstream, how ever, in the flat areas at the head of the valley where water is dis charged from the Merced formation into thin fine-grained alluvium, most losses by evapotranspiration probably occur during the winter and spring when water level? are highest. Limited losses by evapo transpiration occur along Petaluma Creek and its tributaries, princi pally transpiration by willows and other vegetation.
Pumping is the only form of discharge for which quantitative data are available. Although no attempt was made to estimate the peren nial yield of the valley, the relatively high water levels in the northern part of the valley indicate that there has been no basin-wide overdraft.
In Petaluma Valley the gross ground-water pumpage was estimated for the 5-year period 1945-49. (See table 14.) The pumpage for public supply was the water withdrawn by systems supplying Peta luma, Penngrove, and Two Kock Ranch Army Base. The California Water Service Co., which supplies the city of Petaluma and vicinity, furnished figures on metered pumpage from its wells. Because this pumpage accounts for about 90 percent of the total public-supply pumpage, the figure for public supply is believed to be fairly accurate. The pumpage for Penngrove was estimated on the basis of the popu lation served; for Two Rock Ranch Army Base, from figures furnished by the post engineer.

GROUND WATER 119
TABLE 14. Ground-water pumpage, in acre-feet, in the Petaluma Valley area,1945-49
Use
Industrial _________________________
1945
42014080
620
1,300
1946
600130130650
1,400
1947
720110140680
1,600
1948
660210130700
1,700
1949
760250120720
1,800
Irrigation pumpage was computed on the basis of plant-efficiency tests and kilowatt-hours of electrical energy consumed, data on which were kindly made available by the Pacific Gas and Electric Co. Irrigation pumpage from wells for which electrical-power records were not available was estimated on the basis of acreages irrigated, using the same duty-of-water factors that were estimated for Santa Rosa Valley (table 8). This pumpage amounted only to 24 acre-feet in each year from 1945 through 1948 and 30 acre-feet in 1949. Pumpage for irrigation in Petaluma Valley during 1949 only amounted to about 14 percent of the total estimated pumpage for that year.
The pumpage for irrigation in the Petaluma Valley area was estimated in the following manner: The average efficiency of 12 wells, for which 26 plant-efficiency tests were available, was about 30 percent, which corresponds to an energy factor of about 3.5 kwhr per acre-foot of water pumped for each foot of lift. Although none of these tests were for irrigation wells, they were for wells having similar horsepower and type of pump, and their average efficiency was probably about the same as the average for the area. Pumping levels were measured or estimated from the available data. Because all irrigation was by sprinkler systems, which operate under a pressure of about 30 pounds per square inch, or 70 feet of water, the equivalent of 250 kwhr per acre-foot was added to the computed energy factor to account for lifting the water to pump-discharge level. Thus, the energy factor used to compute pumpage for irrigation in the Petaluma Valley area was 600 kwhr per acre-foot, which, when divided into the kilowatt-hours consumed in the area, gave the gross pumpage in acre-feet. Because of the broad assumptions involved in deriving the estimates, no allowances were made for seasonal fluctuations in pumping levels.
As a check on the irrigation pumpage, an estimate was made using reported and estimated size of acreages irrigated and a duty of water of 2.5 acre-feet per acre for pasture and 1 acre-foot per acre for garden truck. For 1949 this method suggests pumpage of 245 acre-feet, as compared with 230 acre-feet computed on the basis of electrical- power consumption and energy factors.

120 GROUND WATER IN SANTA ROSA AND PETALUMA VALLEYS
Only one industrial well that pumped an appreciable amount of water was canvassed. Probably most of the water pumped for industrial use, other than pumped for use by dairies, is furnished by public-supply wells or is included in the estimates made for domestic, stock, and other uses. It is estimated that there were 12-15 dairies operating in the Petaluma area during the period 1945-49. A unit factor of 5 acre-feet per year was applied, as in the Santa Rosa Valley area.
In 1950 about 1,500 wells were active in the Petaluma Valley area (exluding Novato Valley). Only about 2-3 percent of the wells were pumped for irrigation, public-supply, and industrial uses; the remainder were pumped for domestic, stock, and other uses. A factor of 0.5 acre-foot per well per year was used for these wells (see p. 87), and the number in use each year was derived by scaling down the number of wells in use in 1950 in proportion to the difference in population. The largest source of error in the estimate of total pumpage is probably in this last category, which consists of 40-50 percent of the total, because of the general assumptions that were necessarily made in the estimate.
Although the indicated draft for the period 1945-49 is fairly small, most of it is concentrated in an area of about 3,000 acres east and northeast of Petaluma which is only slightly above sea level. A substantial increase in the pumping might lower water levels below sea level, reverse the natural seaward hydraulic gradient, and induce sea-water encroachment into the pumping area.
QUALITY OF WATER
In order to determine the quality of ground water in Petaluma Valley, 67 analyses, of samples from 55 wells and 4 surface streams in the area, were assembled. These consist of 34 complete analyses and 33 partial analyses and are listed in table 15 and in tables 25 and 26 of the appendix to this report. A few analyses made available after completion of the tables are referred to and are available in the files of the Geological Survey.
The analyses show that the quality of the ground water varies widely from place to place. In general the quality of water obtained from wells tapping the principal water body in the northern part of Petaluma Valley is good. The water normally is of the calcium magnesium bicarbonate or sodium bicarbonate type, and generally contains between 250 and 500 ppm of dissolved solids (fig. 15). In the central part of Petaluma Valley, commencing a short distance southeast of Petaluma and continuing downstream, many wells tap water which seems to be contaminated by intrusion of brackish bay water or unflushed connate water of similar chemical character

GROUND WATER 121
(figs. 15 and 17). This water is of the sodium chloride type, and the content of dissolved solids is greater than in the water farther up the valley.
SUITABILITY OF WATER FOR DOMESTIC, INDUSTRIAL, AND IRRIGATION USE
Excepting some water from the Petaluma formation and from that portion of the southern part of Petaluma Valley in which the ground water is contaminated by saline water, ground water in Petaluma Valley generally meets the standards set up by the U. S. Public Health Service (see p. 91) for drinking water. In uncontaminated waters the hardness ranges from about 40 to about 320 ppm and averages about 160 ppm ("moderately hard").
For many industrial uses, the ground water in Petaluma Valley would be objectionable because of hardness. For cooling purposes, the temperature of the principal water body, which averages about 63° F in shallow wells, is generally satisfactory.
Uncontaminated water in the principal water body is generally suitable for agricultural uses. (See p. 92 for general criteria.) Locally, especially in some deep wells, the percentage of sodium may exceed 50; but only a few of the waters for which analyses are available have sodium percentages that are dangerously high for irrigation water; and generally it is feasible to counteract the undesirable effect of the sodium by applying agricultural gypsum.
The capacity of plants to tolerate chloride varies considerably, so that the maximum permissible chloride concentration in irrigation water is dependent to some extent on whether the crops are adapted to the soil and climate of the area, as well as on the local soil-drainage conditions. The highest chloride concentration in water used for irrigation in upper Petaluma Valley is 362 ppm (well 5/7-34G1, September 1954). This concentration is far below a maximum permissible concentration for irrigation of pasture grasses, the most generally irrigated crop in the area, as waters containing more than 1,000 ppm of chloride have been used for irrigation in Sonoma Valley. During 1950, W. Q. Wright successfully irrigated a small test plot of Birdsfoot trefoil on reclaimed marshland soil hi the southern part of Petaluma Valley near well 3/6-5A1; he used water having a chloride concentration of about 3,400 ppm. In the lower part of Petaluma Valley numerous wells yield water that contains more than 1,000 ppm of chloride, and some water containing more than 3,000 ppm of chloride is used for watering stock. In Australia (Calif. State Water Pollution Control Board, 1952, p. 154) it has been found that cattle may drink water containing 5,000-7,000 ppm of sodium chloride before suffering detrimental effects, and that adult sheep may safely drink water containing as much as 10,000 ppm
443616 58 9

122 GROUND WATER IN SANTA ROSA AND PETALTJMA VALLEYS
of sodium chloride. However, water containing more than 5,000 ppm of sodium chloride may reduce the milk production of dairy cattle.
In Petaluma Valley, water containing large amounts of boron are known to occur only in the Petaluma formation. In the principal water body the highest concentrations of boron that have been re ported are 1.1 ppm and 0.64 ppm, in wells 5/7-34A2 and 5/7-34G1, respectively. Inasmuch as water from these wells has a relatively high concentration of chloride, and because of the proximity of tidal Petaluma Creek, the greater part of the boron may have been intro duced by encroaching saline water from San Francisco Bay.
PRINCIPAL GROUND-WATER BODY
The principal ground-water body comprises parts of the younger and the older alluvium and the Merced formation. The data are insufficient to define clearly the water quality in each formation beneath the alluvial plain in the northern part of Petaluma Valley, so that only the general quality within the water body as a whole has been considered. Water in the younger and the older alluvium is probably of similar character because of its essentially free move ment within the body.
For study purposes, most complete analyses were plotted on a trilinear water-analysis diagram (fig. 15). On this diagram, analyses 5, 6, 9, 10, 11, 12, 17, and 18, which have been plotted on the lower left-hand area of the diamond portion of the diagram, are about typical for the water in the principal water body. Those plotted in the upper part of that sector are of calcium magnesium bicarbonate water, and those in the lower part are of sodium bicarbonate water. (See p. 90.) When analyses of water from a common water body are plotted in both the upper and lower parts of the lower left half of the diamond diagram (fig. 15), it is generally indicated that base exchange occurs in the water body. Figure 15 shows that, in general, the sodium percentage increases with depth in the water body; it is inferred that calcium and magnesium ions in the ground water are exchanged for sodium ions contained in fine-grained deposits with which the ground water comes in contact. Thus, in general, a softer water can be obtained from wells screened only in the deep water- yielding strata than from those tapping shallow deposits. On figure 15 a comparison of analyses numbered 9 and 5 demonstrates this phenomenon. Some of the analyses plotted on figure 15 appear to deviate from the above conditions; for example, numbers 11 (well 5/7-28A3, 280 feet deep) and 12 (well 5/7-28H1, 483 feet deep). In some cases the deviations can be explained by differences in perforated intervals. Concerning the above two wells, it is suggested that most of the yield of the deeper well may be contributed by a shallow zone;

: circ
le
indi
cate
s co
ncen
trat
ion,
pa
rts
per
mill
ion
thus
:
s \t> \ ,
,O
cea
n\
wat
er ^ /
\
Ser
ial
no. l 2 3 4 5 6 7 8 9
Wel
l nu
mbe
r
5/7
-801,2
-IO
QI
-I9H
I-2
081
-22Q
I-2
2Q
2-2
4F
I-2
5C
I-2
6R
I
Dep
th
(fee
t)
1 25
462
305
600
92
97
450
23
54
28
Se
ria
l no
. 10 1 1 12 13 14 15 16 17 18
Wel
l nu
mbe
r5/7
-28A
2-2
8A
3-2
8H
I-3
3N
2-3
4A
I-3
4A
2-3
4G
I-3
5H
I-3
5K
I
Dep
th
(feet)
99
280
483
30
0+
410
520
230
542 78
oS
ourc
e
of
wate
r
We
lls
tappin
g
princip
al
wa
ter
body
b
en
ea
th
allu
via
l p
lain
Peta
lum
a
form
ation
Merc
ed
form
ation
Son
oma
volc
anic
s
CA
TIO
NS
AN
ION
SP
ER
CE
NT
AG
E
RE
AC
TIN
G
VA
LUE
S
FIG
URE
15 D
iagr
ams
Row
ing
the
chem
ical
cha
ract
er o
f gro
und
wat
ers
in th
e Pe
talu
ma
Val
ley
area
, Cal
ifor
nia.

124 GROUND WATER IN SANTA ROSA AND PBTALUMA VALLEYS
o_J
UJa.
I-(T
tn v-
UJ
H-
h- 0)
O O
_1 < CJ
iUJXo
350
300
250
100 200 300
DEPTH, IN FEET
400 500
FIGURE 16. Variation of chemical constituents with depth in water from ten closely spaced wells in the principal water body in the Petaluma Valley area, California.
whereas the well of intermediate depth may be supplied principally from strata near its bottom.
Figure 16 illustrates the differences in chemical character of water in the principal water body at different depths. These differences suggest that chemical changes in the water occur as the water moves

GROUND WATER 125
downward or laterally at depth beneath Petaluma Valley. The dissolved solids, bicarbonate, sodium, and chloride increase with depth. On the other hand, the hardness decreases, and the amount of sulfate changes very little. The decrease in hardness and increase in sodium is inferred to represent natural softening by base exchange.
The chemical character of water from deep well 5/7-20B1 and from several others differs slightly from that of water from most deep wells. Possibly the difference is due to admixing of waters from the Petaluma formation and other, older, formations, either directly through the wells or indirectly by leakage of water from the older formations into this principal water body.
Analyses 14, 15, and 16, (fig. 15), which have been plotted between other analyses of water from the principal water body and analyses of marine or connate water, indicate contamination by brackish water. Figure 17 shows graphically three analyses of water samples collected in 1950, 1951, and 1954 from well 5/7-34A2 (analysis number 15). It is a gravel-packed irrigation well, 520 feet deep and about 0.7 mile north of Petaluma Creek. The analyses suggest that a progressive deterioration of the quality of the water has occurred locally in the water body, probably as a result of the relatively inten sive local ground-water development. This development causes a seasonal depression of water levels below sea level, thereby inducing recharge to the aquifer from the brackish water of tidal Petaluma Creek. The analyses (table 25) show that from August 21, 1950, to February 26, 1954, the chloride concentration increased from 216 to 325 ppm, hardness from 150 to 205 ppm, and dissolved solids (ex cluding silica) from 404 to 721 ppm. The ratio of the equivalents per million (epm) of calcium to the equivalents of magnesium (cal cium-magnesium ratio) shifted from 1.05 to 0.86 in the same period. A shift in this ratio showing an increased proportion of magnesium has been used as a criterion indicating contamination by water similar to sea water. (See Piper and Garrett, 1953, p. 88-90.)
In gravel-packed irrigation well 5/7-34G1, 230 feet deep and about 1,000 feet closer to Petaluma Creek than 34A2, the concentration of chloride increased from 310 ppm on August 27, 1951, to 362 ppm 20 on May 20, 1954; hardness increased from 320 to 358 ppm; dissolved solids (excluding silica) increased from 735 to 818; and the calcium- magnesium ratio changed from 0.94 to 0.98. The latter change is not diagnostic of sea water and it is possible that well 34G1, even though closer to Petaluma Creek than is well 34A2, is being contaminated from a different source. Sources to be considered are the Petaluma formation and the Franciscan group, from which water might be
*o An analysis of water collected from well 5/7-34G1, August 22, 1954, sbowed tbe following: Chloride, 425 ppm; hardness, 448; dissolved solids (excluding silica), 909; calcium-magnesium ratio, 1.10.

126 GROUND WATER IN SANTA ROSA AND PETALUMA VALLEYS
EXPLANATION
1950 1951 1952 1953 1954
FIGURE 17.- Changes in quality of water in the principal water body in Petaluma Valley, as indicated by three analyses for we]] 5/7-34A2, near Petaluma, California.
moving up into the principal water body owing to the reduced hydro static head in the heavily pumped area. On the other hand, a change as small as from 0.94 to 0.98 does not rule out Petaluma Creek as a source.
Water from well 5/7-35K1, 78 feet deep and located about 0.8 mile from Petaluma Creek, showed the following changes from May 26, 1947, to May 20, 1954: 21 Chloride increased from 42 to 47 ppm, hardness from 214 to 242 ppm, dissolved solids from 337 to 423 ppm, and calcium-magnesium ratio from 1.14 to 1.68. The latter change is the reverse of what normally occurs when water quality deteriorates because of sea-water encroachment. It is possible that the changes reflect progressive changes caused by deep penetration of irrigation water or of rain that leaches from the soil the salts accumulated by evaporation of irrigation water.
21 An analysis of water collected from well 5/7-35K1, August 22,1954, showed the following: Chloride, 42 ppm; hardness, 224 ppm; sum of dissolved solids, 386; calcium-magnesium ratio, 1.26.

GROUND WATER 127
MERCED FORMATION
Analysis 3 (fig. 15) from well 5/7-19Hl, which is 305 feet deep, is fairly typical of water in the Merced formation. It is of a calcium bicarbonate water having a hardness of 190 ppm. The percent sodium is only 25, which suggests that the character of the deposits is not conducive to base-exchange softening of the contained water. Analysis 1 is of a blend of water from wells 5/7-8D1 and -8D2, which presumably tap the Merced formation. However, the position on the diagram (fig. 15) and the higher sum of dissolved solids than normally is found in water from the Merced formation suggest that the wells may tap water also in the Petaluma formation. Partial analyses of waters from wells tapping the Merced formation in the southern part of Petaluma Valley indicate that the concentration of dissolved solids is slightly higher than in the northern part, possibly a result of slightly less rainfall or less thorough flushing of the formation.
PETALUMA FORMATION
In the Petaluma Valley area, water in the Petaluma formation has a considerable range in quality, depending on the hydrologic condi tions of occurrence, which in turn depend largely on the local struc tural and stratigraphic relations. Generally, the dissolved solids content is relatively high, commonly 600 ppm or more, and some water is unpotable because of excessive sodium, chloride, and sulfate. The concentration of chloride is known to be as high as 2,400 ppm. The concentration of boron is as high as 7 ppm in water from some deep wells in 5/7-24. The occurrence may be related to faults, which are numerous in the Petaluma formation, or to connate waters.
Analyses 2 and 7 (fig. 15) for wells 5/7-1 OQl and 5/7-24F1, re spectively, plot near an analysis of ocean water, suggesting that water in the Petaluma formation is locally contaminated by water of connate origin. Analysis 8 shows that water from well 5/7-25C1, which taps the Petaluma, is of the sodium bicarbonate type. By comparison with analyses 2 and 7, analysis 8 indicates that fairly thorough local flushing of the formation has occurred, and the water is similar to water in the Merced formation except that it has undergone con siderable base exchange. Thus, in wells tapping the Petaluma forma tion, water of a wide range in quality can be expected to occur.
Partial analyses of water from deep abandoned oil-test well 5/6-29R1, which penetrates about 1,000 feet of the Petaluma formation, show a chloride content ranging from 2,400 to 2,530 ppm. This well has a head slightly above the land surface, about 100 feet above sea level, indicating a potential threat of contamination of the freshwater body by upward leakage. However, impermeable beds may largely im pede any substantial upward movement into the overlying formations

128 GROUND WATER IN SANTA ROSA AND PEfTALTJMA VALLEYS
tapped by water wells. Deep test holes or wells should be proper ly plugged to prevent upward circulation of water of poor quality into the zones tapped by wells.
RELATION OF SPECIFIC CONDUCTANCE TO SUM OF IONIZED CONSTITUENTS
A curve showing the relation of specific conductance to the "sum of ionized constituents" 22 was plotted for ground water in the Petaluma Valley area on the basis of 26 fairly complete analyses (fig. 18 and table 25). The equation of the average curve is
where S equals the sum of principal ionized constituents (calcium, magnesium, sodium and potassium, carbonate, bicarbonate, sulfate, chloride, nitrate, and fluoride) in parts per million and .KXlO6 equals the specific conductance in micromhos at 25° C. The span of the analyses suggests that the maximum deviation is about 9 percent. Ground water contaminated by sea water has been plotted to the left of the average curve, so that the conversion factor becomes less than 0.55; however, within the range of the plotted graph no large error is introduced by using this factor. For some of the partial analyses (table 26) in which the results for specific conductance and chloride are high, the curve probably cannot be extrapolated without increasing the deviation considerably.
SURFACE WATER
Petaluma Creek, the principal stream in Petaluma Valley, is mainly an effluent stream in the area upstream from tidewater and therefore has essentially no effect on ground-water quality. In the tidal reach, some interchange of water does occur locally as a result of ground- water draft and tidal fluctuations, and the salty water in the creek intrudes the principal water body. Upstream from the tidal reach the low flow in the creek is maintained by and is representative of discharging ground waters. The analysis in table 15 shows that on January 28, 1954, the water had about equal concentrations (in epm) of calcium, magnesium, and sodium and potassium, and the principal anions (in epm) were bicarbonate (39.4 percent) and chloride (35.1 percent). The chloride concentration is higher than that in uncon- taminated ground waters in the Merced formation and in the principal water body.
» See footnote 17, p. 98.

GROUND WATER 129
«O 900
UJ0.600
EXPLANATION
Specific conductance X 0.55=sumof ' ionized constituents
Source of water
o Principal water body
Principal water body where contamination by saline water is indicated
Petaluma formation'x
Sonoma volcanics
100 200 300 400 500 600 700 800
SUM OF IONIZED CONSTITUENTS, IN PARTS PER MILLION.
FIGURE 18. Relation of specific conductance to sum of ionized constituents in ground waters in the Petaluma Valley area, California.

130 GROUND WATER IN SANTA ROSA AND PEfTALUMA VALiLETS
TABLE 15. Chemical analyses of surface waters in Petaluma Valley
No.
1234
5
67
Source
do. -do .Petaluma
CrSan Antonio
Cr.. .. Novato Cr....... do...
rS
81 0
4-1-521-28-543-11-54
1-28-54
1-28-541-28-541-28-54
||
R§"§oo^-o
O3
265289244
648
323467
4,600
"O
fe §
2tsi 803
1175187163
390
177275
2,900
Constituents in parts per million
ti io
942519
46
132169
fla 1
1
9,21111
25
2024
143
fl 3 o
03
151512
41
1437
750
a.2
I
4 343
11
4 96.7
41
103
.§
12893
155
11014369
§£ £ O
016
0
000
ffl
S
§
139,6
68
2237
543
SS§
1410
80
2660
1,280
11fc
5 11 0
IS
7.61.19.1
g o
00
07
16
.07
.08
.51
-S
S
0,12
1
.1
.1
.4
M
®
w98
10893
218
115151760
3
g
£PH
252221
2K
203467
1 Estimated.1. In 5/7-35K, 15 feet west of well 5/7-35K1; flow, about 1 cfs.2. At highway bridge in 5/7-35K, 350 feet upstream from (1) estimated flow, 3 cfs.3. Same location as (2); flow, 3 cfs.4. At Geological Survey gaging station 70 feet downstream from Corona Road Bridge in 5/7-20M; esti
mated flow, 10 cfs.5. In 4/7-14Q at east side of bridge on U. S. Highway 101. Water clear; estimated discharge, 15 cfs.6. In 3/6-19C at east side of bridge on U. S. Highway 101. Above tidal influence; estimated flow, 15 cfs.7. In 3/6-21M at north side of bridge, on State Highway 37, 0.8 mile east of U. S. Highway 101. Esti
mated discharge, 100 cfs; murky appearance; apparently mixed with sea water.
Adobe Creek drains terrane of the Petaluma formation and of the Sonoma volcanics. The creek is mainly an influent stream and re charges the principal water body along much of its reach across the valley floor. The analyses in table 15 indicate that during the winter and spring the water is of the calcium magnesium bicarbonate type and is low in dissolved solids.
The analysis of water from San Antonio Creek (table 15) shows that the water is of the magnesium bicarbonate type. This type probably reflects the presence of serpentine and other ultrabasic rocks in the Franciscan group, which crops out over much of the drainage basin of San Antonio Creek.
Analyses 6 and 7 (table 15) are of samples of water collected from two different points along Novato Creek. Analysis 6 shows that the water above tidal influence is of the bicarbonate type, having magne sium as the principal cation (in epm, 41 percent) and having a relatively high percent sodium (34 percent). Analysis 7 is of water collected about 0.6 mile upstream from San Pablo Bay and suggests that con siderable mixing of creek and bay waters occurs in the lower reach of the creek.
STORAGE CAPACITY
The area for which ground-water storage capacity was estimated in the Petaluma Valley area is essentially that underlain by the younger and the older alluvium as shown on plate 2. It includes the entire area of these deposits from the head of the valley near Penngrove southward to a locality about 2K miles southeast of the city of Petaluma, where, on figure 3, a line was drawn across the

GROUND WATER 131
valley to indicate the southern boundary of the area. This line coin cides with a natural constriction of the valley between bedrock hills; it is near what would be the normal limit of tidewater in Petaluma Creek, if the channel had not been dredged; and it coincides roughly with the 1950 upstream limit of occurrence of brackish water in wells. The large alluvial area south of the boundary is excluded because, over its greatest part, it either now contains brackish water in at least some zones or it is subject to ready infiltration of the marsh water. Vertical boundaries were used for the storage units because the alluvium is bordered nearly everywhere by unconsolidated deposits which are water bearing and which supply water to wells near the edge of the alluvial plain.
The area for which ground-water storage capacity was estimated, as shown on figure 3, is divided into two units. Unit PI consists of the main Petaluma Valley and its small tributaries, and is bounded on the north by the Corona road crossing of the narrow valley neck about 1 mile south of Penngrove. Unit P2 consists of the small valley area lying east of Penngrove and north of the Corona road. This area is contiguous with Petaluma Valley, but the yields of wells are much lower.
The methods used to derive the storage estimates are the same as those described for the Santa Rosa Valley area. A total of 39 well logs were used, 30 in storage unit PI and 9 in unit P2, to obtain the percentages of the different types of material; and the specific-yield values assigned to the six categories in the Santa Rosa Valley area (p. 103-104) were used in the Petaluma Valley area. Table 16 shows the estimated gross storage capacity in the Petaluma Valley area.
Although the procedures followed in deriving the storage estimate warrant the reporting of the values as shown in table 16, it should be understood that for practical use the estimates are approximate and are for gross rather than usable storage.
The principal factors affecting the usability of the storage are the ease with which the deposits might be dewatered by means of
TABLE 16. Estimated gross ground-water storage capacity, in acre-feet, in thePetaluma Valley area 3
Ground-water storage unit
PI, Upper Peta-
P2, Penngrove... _
Surface area
(acres)
11, 100 950
12, 050
Depth zones
10-50 feet
Average specific yield
(percent)
10.96.8
10.5
Stor age
(acre- feet)
48,400 2,200
51, 000
60-100 feet
Average specific yield
(percent)
10.7 6.2
10.3
Stor age
(acre- feet)
69,400 2,600
62,000
100-200 feet
Average specific yield
(percent)
8.1 6.6
7.9
Stor age (acre-
feet)
89,900 6,300
95,000
All zones
Average specific yield
(percent)
9.45.6
9.1
Stor age
(acre- feet)
198, 000 10,000
208,000
1 Storage for each depth zone has been rounded to nearest 100 acre-feet; totals rounded to nearest 1,000 acre-feet.

132 GROUND WATER IN SANTA ROSA AND PETALUMA VALLEYS
wells, the ease of recharge and availability of water for recharge, and the maintenance of water quality and prevention of salt-water encroachment. Although relatively high specific yields were obtained for the larger unit, the yields of wells in Petaluma Valley are very low, by comparison with those in some other areas, owing to the predominance of fine-grained materials in the deposits; thus, dewatering an appreciable amount of the storage volume might be difficult to accomplish within a short period. However, wells specifi cally constructed for dewatering the deposits above a depth of 200 feet might have considerably higher yields than the largest capacity wells now in use.
Recharge is accomplished by infiltration of the alluvial deposits by rainfall and stream water, and by infiltration of rainfall in those parts of the Merced formation that are contiguous with the valley and in which the ground water is in hydraulic continuity with that in the alluvial deposits. Recharge probably proceeds slowly; considerable time would be required to recharge, by natural means, deposits that had been dewatered to a depth of 200 feet. Most of the trough of Petaluma Valley lies between sea level and an altitude of 35 feet. Therefore, without providing some artificial barrier to the inflow of bay water from the south, utilization of the full storage would be unfeasible, as the depression of water levels necessary to utilize the storage would ultimately result in encroachment of bay water. At present the quality of the water is good throughout all except a small part of the area for which storage was calculated.
It is known that deep wells in the Petaluma formation locally reach water of poor quality. Whether large withdrawals and depletion of storage would cause this water to move up into the principal water body is not known.
LITERATURE CITED
Adams, Frank, 1913, Irrigation resources of California and their utility: U. S.Dept. Agr., Office Exp. Sta. Bull. 254.
Axelrod, D. I., 1944, Pliocene floras of California and Oregon: the Sonoma flora:Carnegie Inst. Washington Pub. 553, p. 162-J206.
1950, A Sonoma florule from Napa, Calif.: Carnegie Inst. WashingtonPub. 590, p. 23-71.
California Dept. of Finance, 1941, California Blue Book. 1950, California Blue Book.California State Water Pollution Control Board, 1952, Water quality criteria:
pub. 3. 1954, Water quality criteria: pub. 3, addendum no. 1.California State Water Resources Board, 1951, Water resources of California:
bull. 1, pi. 2,Church, C. C., 1952, Cretaceous foraminifera from the Franciscan Calera lime
stone: Contrib. Cushman Found. Foram. Research, v. 3, pt. 2, p. 68-70.

LITERATURE CITED 133
Cushman, J. A., and Todd, Ruth, 1948, A foraminiferal fauna from the NewAlmaden district, California: Contrib. Cushman Lab. Foram. Research,v. 24, p. 90-98.
Dickerson, R. E., 1922, Tertiary and Quaternary history of the Petaluma, PointReyes, and Santa Rosa quadrangles: Calif. Acad. Sci. Proc., ser. 4, v. 11,no. 19, p. 527-601.
Dorf, E., 1930, Pliocene floras of California: Carnegie Inst. Washington Pub.412, p. 1-112.
Eckis, Rollin, and others, 1934, South coastal basin investigation; gieology andground-water storage capacity of valley fill: Calif. Dept. Public Works,Div. Water Res., bull. 45, 273 p.
Gabb, W. M., 1869, Paleontology: Calif. Geol. Survey, v. 2. Gealey, W. K., 1950, Geology of the Healdsburg quadrangle, California: Calif.
Div. Mines Bull. 161, 50 p. Grant, U. S., 4th, and Gale, H. R., 1931, Pliocene and Pleistocene Mollusca of
California: San Diego Soc. Nat. Hist. Proc., v. 1. Higgins, C. G. 1952, Lower course of the Russian River, California: Calif. Univ.,
Pub. in Geol. Sciences, v. 29, no. 5, p. 181-264. Hinds, Norman E. A., 1952, Evolution of the California landscape: Calif. Dept.
Nat. Res., Div. of Mines, Bull. 158. Holmes, L. C., and Nelson, J. W., 1917, Reconnaissance soil survey of the San
Francisco Bay region, California: U. S. Dept. Agr., Bur. Soils, 112 p., andsoil map.
Lawson, Andrew C., 1893, The post-Pliocene diastrophism of the coast of southernCalifornia: Calif. Univ., Dept. of Geol. Sci. Bull., v. 1, p. 115-160.
1895, Geology of the San Francisco Peninsula: U. S. Geol. Survey Ann. Rept. 15.
1914, Description of the San Francisco Quadrangle: U. S. Geol. Survey,Geol. Atlas, San folio, 193.
Lee, Charles A., 1931, Evaporation and transporation with special reference to asalt water barrier below confluence of Sacramento and San Joaquin Rivers:Calif. Dept. of Public Works, Div. Water Res., Bull. 28, App. C, p. 247-307.
Maxcy, K. F., 1950, Report on the relation of nitrate concentration in well waterto the occurrence of methemoglobmenia: Nat. Research Council, BulLSanitary Eng., App. O, p. 275.
McBride, Brice, 1945, Field investigation of drainage of Laguna de Santa Rosa",Sonoma County, Calif.: U. S. Fish and Wildlife Service.
Meinzer, O. E., 1923a, The occurrence of ground water in the United States,with a discussion of principles: U. S. Geol. Survey Water-Supply Paper 489.
1923b, Outline of ground-water hydrology, with definitions: U. S. Geol. Survey Water-Supply Paper 494.
Meinzer, O. E., and others, 1942, Hydrology: Nat. Research Council, Physics of the Earth Ser., v. 9, New York, McGraw Hill Book Co., Inc.
Morse, R. R., and Bailey, T. L., 1935, Geological observations in the Petaluma district, California: Geol. Soc. Am. Bull., v. 46, p. 1437-1456.
Osmont, V. C., 1905, A geological section of the Coast Ranges north of the Bay of San Francisco: California Univ., Dept. of Geol. Sci. Bull., v. 4, p. 39-87.
Parker, Glenn L., and others, 1942, Surface water supply of the United States, 1941, part 11, Pacific slope basins in California: U. S. Geol. Survey Water- Supply Paper 931.
Paulsen, C. G., and others, 1952, Surface water supply of the United States, 1950, part 11, Pacific slope basins in California: U. S. Geol. Survey Water- Supply Paper 1181.

134 GROUND WATER IN SANTA ROSA AND PEITALUMA VALLEYS
Piper, A. M., Gale, H. S., Thomas, H. E., and Robinson, T. W., 1939, Geology and ground-water hydrology of the Mokelumne area, California: U. S. Geol. and Survey Water-Supply Paper 780, p. 101-122.
Piper, A. M., and Garrett, A. A., 1953, Native and contaminated ground waters in the Long Beach-Santa Ana area, California: U. S. Geol. Survey Water- Supply Paper 1136.
Poland, J. F., Davis, G. H., Olmsted, F. H., and Kunkel, Fred, 1951, Ground- water storage capacity of the Sacramento Valley, Calif.: Calif. State Water Res. Board Bull. 1, in Water resources of Calif ornia:app. D, p. 617-632.
Schlocker, Julius, Bonilla, M. G., and Imlay, R. W., 1954, Ammonite indicates Cretaceous age for part of Franciscan Group in San Francisco Bay area, California: Am. Assoc. Petroleum Geologists Bull., v. 38, p. 2372-2381.
Stirton, R. A., 1939, Cenozoic mammal remains from the San Francisco Bay region: Calif. Univ., Dept. Geol. Sci. Bull., v. 24, p. 339-410.
1952, Are Petaluma horse teeth reliable in correlation: Am. Assoc. Petro leum Geologists Bull., v. 36, no. 10, p. 2011-2025.
Taliaferro, N. L., 1943a, Geologic history and structure of the central Coast Ranges of California: Calif. Div. Mines Bull. 118, p. 119-163.
1943b, Franciscan-Knoxville problem: Am. Assoc. Petroleum Geologist Bull., v. 27, p. 109-219.
1951, Geology of the San Francisco Bay counties; in Geologic guidebookof the San Francisco Bay counties, Calif.: Calif. Div. Mines Bull. 154,p. 117-154.
Trask, P. D., and Ralston, J. W., 1951, Engineering geology of San FranciscoBay, California: Geol. Soc. America Bull., v. 62, no. 9, p. 1111-1148.
Travis, R. B., 1952, Geology of the Sebastopol quadrangle, California: Calif.Div. Mines Bull. 162, 33 p.
U. S. Bureau of the Census, 1910, Bull, of the 13th Census of the U. S., 1910;farms and acreage irrigated, irrigation works, cost of construction, costof operation and maintenance, and crops irrigated.
1950, Population.U. S. Public Health Service, 1946, Drinking water standards: v. 61, no. 11.Watson, E. B., and others, 1917, Soil Survey of the Healdsburg area, California:
U. S. Dept. Agriculture, Bur. Soils, 59 p., and soil map. Weaver, C. E., 1949, Geology of the Coast Ranges immediately north of the
San Francisco Bay region, California: Geol. Soc. America Mem. 35. Wenzel, L. K., 1942, Methods for determining permeability of water-bearing
materials, with special reference to discharging-well methods: U. S. Geol.Survey Water-Supply Paper 887.
White, C. A., 1885, On the Mesozoic and Cenozoic paleontology of California:U. S. Geol. Survey Bull. 15, p. 19-32.
Wilmarth, M. G., 1938, Lexicon of geologic names of the United States: U. S.Geol. Survey Bull. 896.

TABLES OF BASIC DATA
Tables of basic data consist of 11 tables (tables 17-27) comprising much of the data available for the wells that were canvassed during the investigation for this report. For convenience of the reader, data are presented by areas, the Santa Rosa Valley area being separated from the Petaluma Valley area. A brief description and explanation of the symbols used is given below.
DESCRIPTION OF WATER WELLS
Tables 17 and 23 present descriptive data most of which were gathered during the years 1949-52, on 970 water wells in the Santa Rosa Valley area and 180 water wells in the Petaluma Valley area respectively. Included are most irrigation, industrial, and public- supply wells that were in use at the close of the field canvass, and a large number of domestic, stock, and other wells for which logs, chemical, and other data were available. Locations of wells and springs are shown on plate 1.
Year completed. Given in well logs or by owners. The year of original construction is reported for all wells, including those that have deepened since original construction.
Altitude of land-surface datum. Altitude of the average land surface at the well. Most altitudes were obtained by interpolation from topographic maps having a contour interval of 25 feet and, generally, are reported to the nearest 5 feet, except where supplemental data on altitudes enabled closer interpolation. Altitudes of wells on the Sears Point 7K-minute quadrangle map (lower part of Petaluma Valley), which has a contour interval of 5 feet and altitudes of a few wells on the Petaluma NE quadrangle (NE% of the old Petaluma 15-minute topographic quadrangle map) are reported to the nearest foot. The altitudes of 5 wells in Petaluma Valley, 4 of which were used for periodic water-level observations, were determined by spirit leveling and are reported to the nearest one-tenth of a foot. Altitudes of wells in the vicinity of Santa Rosa Naval Air Base were taken from a map having a contour interval of 1 foot, and few altitudes deter mined by altimeter are reported to the nearest foot.
Depth. Depths shown to the nearest foot were reported by owner or obtained from a drillers' log; those shown to the nearest one-tenth of a foot were measured by the Geological Survey.
Type of well and diameter oj casing. "Type of well" refers to method of construction and is indicated by symbol, as follows: B, bored
135

136 GROUND WATER IN SANTA ROSA AND PEtTALUMA VALLEYS
(augered); D, drilled; Dug, dug; G, gravel-packed. For rectangular dug wells the largest dimension is listed. Where more than one casing size is used, the largest and the smallest are listed in that order.
Water-yielding zone or zones open to well. Only the material that is opposite to or appears to be in hydraulic connection with a per forated interval, or is otherwise open to the well, is listed. All the water-bearing material is listed for gravel-packed wells, although for some wells it was necessary to consolidate or generalize the driller's description to fit the table. If perforation data are not available this column is left blank. Where only the number of feet of casing per forated is known, this figure alone is given. Bottom-hole data are given only where perforation data are known or the well is known to have an open-end casing with no perforations, as for some domestic wells in the Merced formation. Data for the uncased parts of wells in consolidated or semiconsolidated rocks are given. The material is reported in the order of the relative amounts present, the predominant materials being reported first. The geologic formation or formations from which the well is judged to obtain its water are given where possible. Symbols used are the same as those on the geologic map (pi. 2).
Water level. All water levels and dates of measurement are listed for wells in which no more than 5 measurements were made. If 6 or more measurements were made in a single well the initial measurement is listed and the other measurements are given in tables 18 and 24. Measurements by the Geological Survey are referred to the "land- surface datum." Measurements made by the driller or owner are indicated by footnote and are reported verbatim, generally to the nearest foot. Not all these latter measurements are referred to the "land-surface datum."
Temperature. Temperature of the pump discharge was measured at land surface with a mercury thermometer.
Type of pump and horsepower. C, centrifugal; J, jet; L, lift; P, pitcher (suction); T, turbine; Ts, submersible turbine. The numeral indicates the rated horsepower of electric motors. "Gas" and "Wind" indicate that the source of power is a gasoline engine or windmill, respectively.
Pump discharge. Rate at which the plant pumps under normal operating conditions (usually not the same as the "rated capacity"). Most of these data are reported by the owner or operator.
Results of tests. The drawdown (pumping level minus static level) listed for most wells is the approximately stabilized drawdown pro duced by the bailing or pumping rate shown. Yields reported by the driller in gallons per hour have been converted to gallons per minute, rounding to the nearest whole number where necessary. Most of the

TABLES OF BASIC DATA 137
bailer tests are for incompletely developed and partially perforated wells drilled for domestic use and, in general, probably do not indicate true aquifer performance.
Use. A, abandoned and destroyed; D, domestic; Dy, dairy; Ind, industrial; Irr, irrigation (more than 5 acres); irr, irrigation (less than 5 acres); O, orchard; PS, public supply; RR, railroad; S, stock; Sw, swimming pool; U, unused.
Other data available. Data available in the files of the Geological Survey. Most of the data are given in other tables of basic data. C, chemical analysis; Cp, partial chemical analysis; E, electric log; L, driller's log; W, additional water-level measurements.
PERIODIC WATER-LEVEL MEASUREMENTS IN WELLS
Tables 19 and 24 contain records of periodic water-level measure ments made in 53 wells in the Santa Rosa Valley area and in 12 wells in the Petaluma Valley area from 1949 to April 1953. Except where noted, all measurements were made by the Geological Survey. Water levels are reported as depth below or above (+) land-surface datum. Levels that depart appreciably from static levels are not given, except where several pumping levels that may be compared are available. Distances of wells from roads or streets are measured from the center- line. Measurements are being continued in selected wells.
ANALYSES OF WATER
Tables 20 and 25 contain chemical analyses and tables 21 and 26 partial analyses of water. Table 20 contains analyses, 47 complete and 11 incomplete, of samples of water from 52 wells and 1 spring in the Santa Rosa Valley area; table 25 contains analyses, 29 complete and 3 incomplete, of samples of water from 27 wells and 1 stream in the Petaluma Valley area. The incomplete analyses include determi nations and the three principal cations, and also the chloride and boron ions, and the hardness and conductivity; complete analyses include determinations of the three principal cations and anions and of other constituents, depending upon the source or purpose of each analysis. The partial analyses include specific conductance and determination of the chloride ion and the hardness.
Samples obtained from the Sonoma County Farm advisor were of water collected by personnel in the Farm Advisor's office or received from the well owner and transmitted to the University of California, Berkeley, where the analyses were made by the Division of Plant Nutrition, under the direction of J. C. Martin. These analyses were made primarily to determine the agricultural suitability of the water and the concentration of each constituent of most samples is reported to the nearest 5 ppm.
443616 58 10

138 GROUND WATER IN SANTA ROSA AND FETALTJMA VALLEYS
The sum of determined constituents is the arithmetic sum of all constituents determined, with the following qualifications: (1) for all analyses except those indicated by the symbol "UC," bicarbonate was converted to carbonate equivalent by dividing by 2.03, and because analyses made by the University of California were somewhat approximate, bicarbonate was halved to convert to carbonate equiva lent before summing constituents; (2) for many samples, boron and phosphate were not determined, and the standard practice of adding them only if they exceed 1.0 ppm was adopted. For many analyses, the figure for the sum of determined constituents as computed by the Geological Survey may differ from the figure for total dissolved solids listed on the original analyses, owing to slight differences in the manner in which the sum was determined; for some analyses, the original figure may represent total solids by evaporation.
With the exception of analyses by the Geological Survey and some by the University of California, most of the results for sodium were obtained by subtracting from the sum of the anions the sum of calcium and magnesium in equivalents per million, and multiplying the differ ence by 23, the combining weight of sodium. The value reported, therefore, includes the equivalent of the potassium concentration also, as sodium, as well as any error in the analysis.
For the University of California analyses, the sum of determined constituents and, in most cases, the hardness were computed by the Geological Survey. Percent sodium and sum of determined con stituents were computed by the Geological Survey for some Brown and Caldwell analyses and for all California Water Service Co. analyses.
Because of the diversity among analyses in constituents determined the sum of determined constituents must be used only as a basis for general comparison of water.
The type of water as designated in this report is determined from the relative amounts, in equivalents per million, of the principal ionized constituents of the water. It does not take into account the silica concentration. For example, if the concentration of sodium makes up more than 50 percent of the total anions and bicarbonate makes up more than 50 percent of the cations, the water would be classified as a "sodium bicarbonate water" (Na-HCOs). In a bicar bonate water in \v hich calcium, magnesium, and sodium were present in about equal concentrations, the type would be given as "Ca, Mg, Na-HCO3," the cations being listed in order of relative concentration.

TABLES OF BASIC DATA 139
DRILLERS' LOGS OF WELLS
Tables 22 and 27 contain drillers' logs: table 22, logs of 103 water wells and 1 oil-test hole in the Santa Rosa Valley area selected from about 900 logs collected during the investigation, of which 700 were located in the field; table 27, logs of 17 water wells in the Petaluma Valley area selected from 150 wells, of which 120 were located in the field. Most of these logs are available for inspection in the office of the Geological Survey or of the California State Department of Water Resources in Sacramento, Calif. Included in the tables are all logs shown on the geologic cross sections and additional logs to give general coverage of the area. The logs, as reproduced here, are in the same form as they were received from the drillers, except for minor changes in spelling and punctuation, and, in some logs, rearrange ment of descriptive terms. In a few logs, explanations or interpre tations of the drillers' terms have been entered in parentheses. Data on perforations and yield appear in brackets immediately above some logs. Stratigraphic assignments have been made where possible.

M
<
1
gi «.s
u00
s
CD
Gravel; sand stone: clay and gravel.
§
lico coo^ pi O
fw\
§?
o
f< Tt
S§ P 5 w ^S
' ^< t^ IQ P"
o> a: ' 51 S- o S ff S S* " ^0 gS"rl 1 ' § IJ- i i s s.r ||J 5"|
COO Ol 00 "^ W 00
SS !8 £= jo S1"1
xoo §3 O to K> o
oo o o o oo 0000 00 00 00 OOOO
» rs 5 hj 2!
o 200
!imi*F
1 1 £) &PJ PI il PI PI .J S S S S 0 O ff
t ! ^
f?tf?t? r ? rr
ii^,p M»iII
,= « - S *:
8D^l Oi OO O CJT
§g g § sso
JO O O "^ OO00
Of f tr1 tr1 iHtn 3
^
i5
Otani Brothers.
> V '
1
5
e
uoo
" i
^g
= i
=fr S
^ v
c*
H
5
U
^
H01
as
oo
*-"
1Ic^v
w tel to i
L. Haberer .... .....do.........
O< SO
g g
S 51
0 0O> 00
1 * V ??
'eoco
tj£} fe
1
H
8
g
=*2p
Henas
3
33O
g
O
o>o i-jc§
Year completed
Altitude of land-surface datum (feet)
Depth (feet)
Type of well and diameter of casing (inches)
Depth to top (feet)
Thickness (feet)
0cr
1 i
Geologic formation
Date measured
Distance above (+) or below land-surface datum (feet)
Water-yielding zone or zones open to
well
Water level
Temperature (° F)
Type and horsepower
Discharge (gpm)
Bailing or pumping rate (gpm)
Drawdown (feet)
t)
Eesults of tests
Use
Other data available
anv VSOH vustvsajsraoiHD

TABLES OF BASIC DATA 141
o"
£ £ i=
kO Tf<CD Tfl
§ Q 51
S
Q \S*
EH EH
S
CD CO
1-1 S 1""1 1H
S e j ' '
O1 T | j ; T
fe QQ 0 t»^ , '3 ** t8Tj fgj,Q a CB o oB flrrt SSffl "SiiTO M8*.-§«'3 ijag ifi gg
SQflQiS^csfciS^-is!HTflSacQ^^CWCOOBQ
t> GQM 0 0
COCO (N >O
t*
"I 1 1
o O*9 *H -ob ^P P^ P
CN O OS3 S S
«5 oo oo
f-4 i 1
2 = <g ^
PS
i-l i-l C4
<) O O
i
to PS'
coEH'
*4 J D h4 h4o h4 n4i4 o o o h4
^wp^wlogll ^ Q Q5 ft OP Q 0 £ ft
88' "°
8 -a i o
i S! ^1O 1O
£H H»£H i-s Q i-
g I
- s£
^4< § *Q
i cttl
I
c
p
ii1"f
O
co'oePP
4
p
00
1
o00 ^s
3 8
SQ> L
M 03 C
00 «
p p
§ gg § I
6EH
3
«
K£
S 5)55 S S S
»O COO ** Q N TH CO tN
1 1 tH c< N C1 ,^
Ms H^t-> ^ ^ M ^
IS
9 S 9 £S Si lOO C< OO^f CO O "^H O^ i t GO Oil CO ^ r-t -^ ^OCDO C4C4
11 8S pi! 11E- EHtSE-' ? § HSE1 <3>Or O? ! Qr^O
Broken basalt..
«
00 CO?
p pp
<2
r^&
-aSf fe&§00"
c< oo *o
QD CO
rJ co oo u- o(
p PP p p
a si g ®§ § i
-S
iOS
CM
8
co'
P P
S §CM i=l
1 §1 1 S9S§8§g§§9§8 ^
i §| i § i i ii i is i iI-ICD 1-1 »H 1-1 1-1 i-Hl-l 1-1 1-Hl-l »H i-H
: jsi g : i i ; j A
P^ h"sS W M S PQ^ W ^W S H
^ ,_( _i c<
Tf« tftkO 1CA D 0 W£ fa OPS PH « ^o co co oooo oo CB CB o cc
i « 1i 01 HJ
1 o
ton
Glen Ellen
Waterworks. Carback.......
jtnotes at end
0
i-l i-l DQ

£2 J5 J5 Sooooo tj tj S SSS cjSQ W W felHQ > > <C> <C>Se3 10 t-> t3 i tci-'i-' tct-« ta <-* *
B ^ Q ^o2^ W W r* !^l ^ !?
P u J? tag <a gl 5 | |^g |b=" wS H^H H5 ^^''52 S.§ ffieppg§s'«i§?> s r8 r g" g' B § r*! «i :? 1 ! T5 "** ' ' P" ! ! ' !
i i i i§i i i i in §CO tO tO COOOi *>>* *> M ^j j fe? ^
B laSiksSSisgiO 0 O OOO O3 OS O5 O5
Sl^ MO O Wrf"
* oo to So 01 en i-i
<j O2 jj S
sj^gi §ff ^11^ *|
! <O t^& ^ p-aP S '| ;
i iiien "3"*."«>
|
M (0 en t9
i s
S B
en >^ en i-1
0 O O O OOO O35 C15 OO OO OSO5O5 C15
1 'III 1 ' 1 1 1
*. Co en cnoooo x to o o*.co
bO OO CO OO! to
O 5 O2
111 1
p*
^ ! <OIP"1?
Mgtato
g enrf^en j^
« -
* S
H ^ «H
Sand........... "Quicksand" _ "Shn.le"^______
^Pff^?
- - -S
xeS-p^
r"tH VH iS>*^ *
-j O 4*. 4*. 00
3 fil S
O M O O
0 w & sr tr° ° ° OOOO O ^ ^ q q
JH JH ^ ^ |Hr tH p tHtHtHJH p
T. 6 N., R. 6 W. Continued
1
o
0
2 o *ic1
Year completed
Altitude of land-surface datum (feet)
Depth (feet)
Type of well and diameter of casing (inches)
Depth to top (feet)
Thickness (feet)
Q
!
Geologic formation
Date measured
Distance above (+) or below land-surface datum (feet)
Water-yielding zone or zones open to
well
Water level
Temperature (° F)
Type and horsepower
Discharge (gpm)
Bailing or pumping rate (gpm)
Drawdown (feet)
sB d
Results of tests
Use
Other data available
VKJlTLVvLadC QKV VSOH ViNV^ NI H3I,VA1

T.
6 N
., R
. 7
W.
n
9Ti
3H1
9ri
1
4B1
7E1
7P1
*7"D
1
QP
l
10A
1
10E
1
10P1
16D
117
E1
18H
1
18R
1
19D
1
19N
1
29P1
9Q
P9
30L
1
T. P
lant
M
r. W
alk
er
T H
op
ct
boni
ni.
Scho
ol
Dis
tric
t.
wor
th.
stoc
k.
F. R
iebli
-.
.... . d
o
Alli
e C
rane
. _.
1941
1949
1949
i Q
Kn
1949
1949
1947
1946
1920
-19
301Q
4Q
1948
1Q4Q
1950
1947
1939
1949
1951
965
575
555
AA
(\
94
0
265
155
775
600
525
575
660
225
195
160
115
117
200
200
145
358
520
417
609
278
150
265 38 350
112 74 38 650
145
250
108
340
185 30 22
.4
D
D
, G
10-
8
D,
G12
-10
D
...
D 8
D 8
D 6
. .
Do
D 8
_
D12
D... .
...
D 8
..
D 8
-
D8-6
-.-
D 8
D ....
D 8
D,G
12-
.
D 1
0
Dug
36-
335
( 27
< O
S[
125
f 8
1 10
9
I 12
7 95 55 8
1 '
I 12
7
23
12 292 16
3 2 7 15 86 103 58
Roc
k....
.......
Gra
vel .
....
....
Whi
te a
sh... .
..
Cla
y an
d gr
avel
grav
el.
el; s
andy
cla
y.
el.
Roc
k; c
lay
and
Tsv
_ _
Qya
l,T
sv.
QT
ge
QT
ge
d
o .
.
d
o
QT
ge (
?)
Tsv
Tp
<?)-
..
... d
o
Tsv
-
QT
ge(T
).
QT
ge(?
).T
Qm
.T
sv..
.--
-,d
o-
d
o
0,ya
l..--
10-
?-41
4-19
-50
L 4^
19-5
0
2- 7
-50
4-4-
51
. 4-
4-51
1 9-
7-4
9
1-25
-50
4- 4
-51
4-20
-50
4-19
-50
4- ?
-49
7- ?
-48
3-28
-51
3- 1
-50
4- 4
-51
2- 7
-50
4- 4
-51
9 -?
-39
6- ?
-49
1-25
-50
8- 8
-50
4- 4
-51
8- 3
-44
11-2
9-49
4- 4
-51
11-3
0-49
4-4-
51
9-29
-49
1335 1.
97
355.
0
114.
28
112.
0 10
6.4
110 26
.14
i 21
. 49
«1.6
2
49.4
0
124 18
6.50
'10 8.
88
17.7
68
10. 4
1 12
4 19
10.3
1U
2 9.73
12.5
8.
009.
707.
964.
71
13.8
7
f--
T40
LI'
S
Jl}4
Ji£
J5 T10
J T &
i
L J J 2
J 1J
S
T 5
0
J2 L
167
1,00
0
2412
0
A, 2
001
U, 5
00/
11 10 5 121$
30
35-4
0 75 51
355 70 12 32 130
126 45 12
.5
D
Stl Ir
r
A D U
D,
S
D,
S
Dy,
Irr,
S
Irr
PS
D,
S
D.I
rr.S
Irr
D D,S
irr
irr D U TJ
L.
L,
L.
L.
L.
L.
L.
L.
L.
C.
L.
L.
L.
L.
C,L
.
W.
See
foot
note
s at
end
of
tabl
e.
00
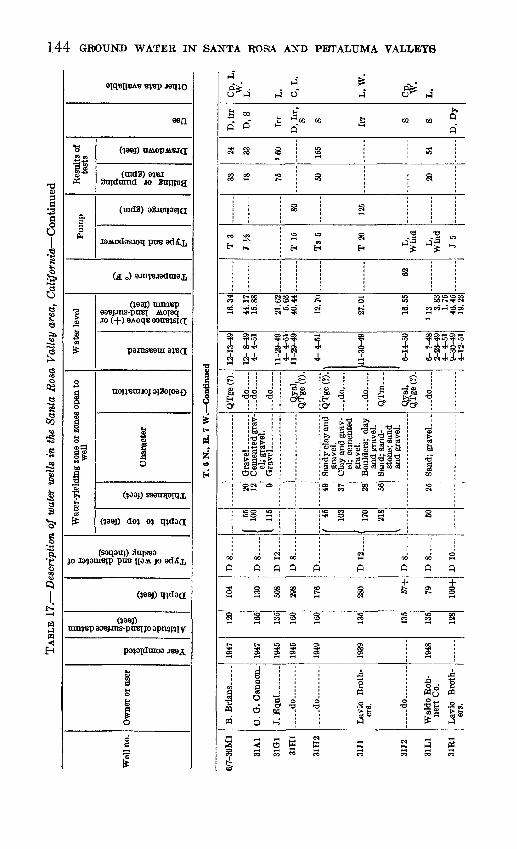
CO CO
s 5
Waldo Koh- nert Co. Lavio Broth-
i
i £8 o?
g M
d 0 S P°
s
to Cn
02
S
a. "-3<= S,
S£*- *-> 33 t-toaoa*--JOO CnCnCO
Sr 1
8
soa » <1
r .^
W CO CO CO W OS CO
S 5 5 5 g E gf !-* p td
"S -4 W O 1 J
§ "S" D1 = -g ^ §
2. of? p ji i i s i i
DO CO » » CO OS |0Cn Cn O O Cn Cn O
<I O O> 00 00 O rffc
d O O d d O U 00 jg °° S j» °°
n2 tj o * S OCn 00 O CO Cn Cn O Cn
Cn fc5 CO *- t-*tOSs SB -j co co too
s w 2 i1 ? S1?
0 ,0 i i «§ «§£> i "§^ y O O "^ TO *<J 3 o 3 Cg
S CO I 1 COH^CO h- ' CO CO
» M JO OCnJ-i Cnj^S
71 O *^} ^ CJi O5 00 H- 1 GO
S
S en S »dv co
t '
Cn £
S*^7 H- i CO Cn 00 CO
i i 8 K
O M
ft % DO D0*_ §* -_
5 « q
n5 JT1 O f Tsj0
? ^ t^
tgo
isc§
Year completed
Altitude of land-surface datum (feet)
Depth (feet)
Type of well and diameter of casing (inches)
Depth to top (feet)
Thickness (feet)
O
1
Geologic formation
Date measured
Distance above (+) or below land-surface datum (feet)
Water-yielding zone or zones open to
well
Water level
Temperature (° F)
Type and horsepower
Discharge (gpm)
Bailing or pumping rate (gpm)
Drawdown (feet)
21
Kesults of tests
Use
Other data available
S2LKTIVA<IKV VSOH VJLNVS

6/8-
1G
1
2C1
2C2
2D1
2D2
2F1
2K1
2K2
2N1
2Q1
3B1
3D1
3L1
3L2
3N1
3R1
M.
J.
Ban
k-he
ad.
A.
F.
Boyri
e
W. J.
Luc
us ..
.
J. F
ickel
.. ...
.
G.
Gus
tafs
son.
McC
oy. .
.....
C.
Mode......
Kli
st..
. .
B.E
.Ro
ettg
er.
Mis
s G
. M
al-
lory
. V
. F
. T
arra
n-ti
no.
G.
W.
Nel
son.
R.
A.
Hal
l-m
an.
M.
C.
McK
in-
ney.
1949
1946
1945
1950
1950
1945
1948
1949
1948
1948
1950
1940
1951
1951
1951
225
115
115
110
110
110
110
115
102
105
110
103 95 95
-
95 100
276 98 90 140 79 75 60 102 52 66 60 70 57 57 188
123
D 8
.
D 6
-
D 8
-
D 8
..
D 6
D 8
.
D 8
..
D, G
6..
D 8
..
D 8
D 6
.
D ..
..
D 8
-.
D 8
-
DIG
.
D 8
..
I " 80
N
68 48
| 92 51 51 43 12
0
4 87 60 11 27 23 101 6 14 3
el.
inte
rval
.)
and
grav
el.
grav
el.
Gra
vel,
clay
an
d gr
avel
.
grav
el.
coar
se g
rave
l.
and
grav
el.
Tsv
...d
o
...d
o
do
... d
o... -
... d
o
... d
o
...d
o
... d
o
d
o
...d
o
...d
o
... d
o
...d
o
... d
o
d
o... ..
...d
o
1-24
-50
4- 4
-51
10-
6-49
8- 7
-45
2-16
-50
4- 4
-51
2-21
-51
4- 4
-51
9- 7
-45
2-16
-50
4-4-
51
6- 7
-48
2-16
-50
4- 4
-51
9- ?
-48
2-17
-50
4- 5
-51
7- 7
-48
1-24
-50
4- 5
-51
2-7-
512-
8-5
1
108.
311
0.0
15.2
117 12
.17
9.81
5.80
5.79
112 5.
30
2.80
19 4.
61
3.48
112 3.
20
3.17
12
1 2.6
1.98
16
...
18..
.
1 f
Ts
j yt j i
T 7
W
J J 1
J 2
J 1 J J JH T5
134 25 200 13 30 27 20
15 16 8 28 11 14 33
D D D Irr
D D
D,
irr
D D
D,
PS
D
D,S D D Irr
D,
S
L. W
.
L.
L.
L.
L.
L.
L.
L.
L.
L.
L.
L.
L.
See
foot
note
s at
end
of
tabl
e.

Sto Cn
^J -J-JQO 00 O CnOO Cn
-J^M 00 OO OS O
d OOO OOO 0Q to *4 ?^
CQM M S3 ,
£>
-> OSOSCTI^J
gg-g
«
,O
IEK»tO
si
3 £
§
031Ot-j
1
Year completed
Altitude of land-surface datum (feet)
Depth (feet)
Type of well and diameter of casing (inches)
Depth to top (feet)
Thickness (feet)
Q
1
Geologic formation
Date measured
Distance above (+) or below land-surface datum (feet)
Water-yielding zone or zones open to
well
Water level
Temperature (° F)
Type and horsepower
Discharge (gpm)
Bailing or pumping rate (gpm)
Drawdown (feet)
1iResults of tests
Use
Other data available
QNV VSOH VJLNVS NI9^ \

8A1
8B1
8H1
8Q1
BO
9O
v^i
9B1
9J1
9E1
9R2
10B
1
10E1
10R
1 11
G1
11K
1
11K
2
12C
112
J1
12K
1
12K
2
13R
1
14L1
14L
2
14M
1
J. E
. A
scoo
p.-
E. C
ast
ell
l.
P.
Mue
lrat
h..
Ger
ald
L.
Sm
ith.
..... d
o..
...
.E
. G
obbi
Wil
kin
son
M.
Los
coto
fl..
L. W
rlgh
t.. ...
J. C
. B
rick
- ho
use.
C
. H
anse
n, J
r.
W.
A.
Kin
ser.
W
. L
. E
hler
t.
Mrs
. Ray
burn
H.
W.
Con
- ne
ly.
G.
W. P
rice
W. H
. Sp
ragu
e
..
do...
Wal
do R
ohn-
er
t C
o.
A.
Far
audo
. . .
J. E
arle
s ...
...
DeC
arlo
_ ...
1944
1930
1948
1938
1937
1937
1948
19
51
1951
1948
19
48
1938
1949
1939
1939
1950
1936
1942
1945
1951
on on on 75 90 on AC on QE
100
100
115
130
120
120
115 Q* 95 90
248
Qfl
200+ 10.9
105 82 114 60 126 89 62 66 102
223
205 28
2675 99 81
Da
D 8....
D
8....
DO
D..
....
.D
aD
o
Da
D 6..
-
Da
D
8....
D
8....
D
6_
D 8
D ..
..D
8
.
D 6.
Dug.....
D6
....
.
D8
__
._.
QA an 88
( 60
1 96 54 66 48
f 40
1 10
0 I
185 70 90
91 Q 3 8 2 4 6 60 20 20 29
sand
; sa
ndy
clay
and
gr
avel
; cl
ay
and
grav
el.
Gra
vel .
....
. do... ..
. .
and
grav
el.
sand
; co
arse
sa
nd a
nd
grav
el.
fora
tions
.)
(Per
fora
ted
inte
rval
.) d
o
..
.
do.
..
grav
el;
grav
el.
Coa
rse
sand
....
QT
ge,
QT
m.
QT
ge.
..
do
QT
m(7
).
QT
ge.
..
... d
o
...d
o .
...
. do
... d
o
d
o
QT
m (
7)
... d
o
...d
o.....
do
d
o
d
o
Ld
o .
.j ..
. do
Qya
l,Q
Tge
, Q
Tm
(?)
. Q
Tge
(?).
d
o
9-29
-50
4-11
-51
9-29
-49
9-29
-49
2-24
-50
2-24
-50
4-5-
51
i (5
- 7-
37
' U
- 5-
51
5- 7
-48
3-8-
51
2-3-
516-
26-5
1
9- 7
-48
6- ?
-48
2-15
-50
4- 5
-51
2-15
-50
2-21
-51
4- 5
-51
6- 7
-39
6- ?
-39
2-15
-50
4- 5
-51
2-24
-50
2-24
-50
4-5-
51
1-25
-50
6- ?
-42
2-16
-50
4- 5
-51
2- 7
-45
2-16
-50
4- 5
-51
2-14
-51
19.9
79.
33
17.3
8
8.84
8 9.
90
6.49
5.43
7.09
15
711
2 18 10.6
7
114 19 2.
123.
05
1.45
0.86
2.
20
120
120 22
.40
22.6
14.5
0
9.80
5.21
» 12
. 46
191.
78
1.18
15
1.97
1.
1311
2
} \
3 J Jl
LI
J2 L LI
J
Jl^ J
L
i<5
LI
JVA C J
13
40 8
00 4 20 30 25 30 30 580 25 20
30 22 13 29 28 50 40 7 13
D
D,
S
D,D
y,8
D,
S
UD
,Dy,
SD D
a
DD
, 8
D D D D D DD
, 0
D,
Irr
U D D D D
L.
L.
Cp,
L.
W.
W.
L,
W.
L.
L.
L.
Cp,
L.
L.
L.
L.
L.
Cp,
L.
L,
W.
L.
L.
L.
See
footn
ote
s at
end
of t
able
.

S 25
dd
§g___g
f ' O ^> f 'o 5 OO)CQ OQ CQQ
'I iTSI
Cn Cn
(TO O tl
CD CO *4
.0
B tf? :
CO CO
£3 SJ
to ento co en en
IS
gO
J? o
H(
Year completed
Altitude of land-surface datum (feet)
Depth (feet)
Type of well and diameter of casing (inches)
Depth to top (feet)
Thickness (feet)
Q
1 HI
Geologic formation
Date measured
Distance above (+) or below land-surface datum (feet)
Water-yielding zone or zones open to
well
Water level
Temperature (° F)
Type and horsepower
Discharge (gpm)
Bailing or pumping rate (gpm)
Drawdown (feet)
^1 o
Kesults of tests
Use
Other data available
SJL3TIVAVSOH VJ.NVS

16C
1
16E
1 16
F1
16F2
16J1
16K
1
16K
2
16M
1
16R
1
16R
1
17H
1
17K
1
17K
3
17M
1
18G
1
18Q
1
20A
1
L.
Cer
fogl
ia...
Wh
iteh
ead
_
Geo
rge
Hol
la
nd.
F.
Lei
sen.. _
W. G
arr
is..
H.
Sch
ulz
e..-
.
Mrs
. R
. B
row
n.
J. P
eter
son....
J.
Ped
ranz
ini.
..... d
o .
.. ..
.
Mazzoni.
..
B.
Woo
d-
wor
th.
Ben
Woo
d-
wor
th.
G. S
. Aza
vedo
.
E.
John
son ..
..
Elm
er C
ox
...
H.
Pai
ne, Jr.
.
1950
1950
19
48
1941
1945
1948
1950
1948
1947
1950
1938
1949
1950
1949
1950
1950
1942
85 85 85 85 90 85 on OK 90 90 80 140 75
80 QA
1 fitc
IQfl
.
96 642 76 136
710±
on 147
568
1,20
4
120
210
132
QA 52 ISO
103
D8-
D,
G 1
0.D
, G
8-.
D8.
D8
-.
_
D 1
2.-
..
D8- -
D8-6
...
D 1
2..
..
D T> f
t
j 55
I
105 58 97 794
930
1,05
0
1,15
0
f 6
1 50 68 25 61 22
11 18 31 32 50 11 7 16
64 4 82 16 27 78 81
grav
el.
grav
el.
"qui
cksa
nd";
"c
lay
silt
."
clay
; sa
nd
and
grav
el.
Gra
ve]
and
sand
. d
o .
.. ..
..Sa
ndy
ce
men
ted
grav
el.
grav
el;
boul
ders
.
Gra
velly
san
d..
Pea
gra
vel a
nd
coar
se s
and;
sa
nd.
smal
l gr
avel
.
grav
el a
nd
sand
; sa
nd;
grav
elly
cl
ay.
sand
and
gr
avel
; sa
ndy
clay
.
d
o
...d
o.
.
QT
ge_ d
o ...
..
QT
ge,
QT
m.
QT
W (V
\
QT
m...
QT
ge,
QT
m.
QT
m...
d
o
... d
o
d
o
QT
m...
Qyal.
...
QT
m...
Qya
l(T
)..
QT
m...
... d
o
do
9-11
-50
4-18
-51
2- 7
-50
10-
?-41
11-
?-45
4-13
-51
6-25
-51
8- ?
-48
2-17
-50
4-13
-51
2-16
-50
| 6-1
4-50
4-
5-5
1
2-24
-50
4-11
-51
8-29
-51
2-9-
50
4-11
-51
4-24
-63
8- ?
-49
2-21
-51
4-11
-51
11-2
9-50
3-30
-51
12-
?-42
2- 9
-50
135 32
.23
12.3
2
18 US 32
.42
31.2
122 36
.82
»39.
1 22
.36
1130 11
.62
8.63
27.5
9 40
.3
3 49
. 65
«
(4) 391.
23
1.78
U
O 44.6
1
U9 17
.56
66
T20
T20
J
T2
0
J*i
Jl^
T20
T20
J J2 T20
T1
0
J2 Jl
650
«10"
| 87
5 1
100 10
650 23 40 17
7300
3315 50
0 12 25
86 42 31 113
100
152
«90 20 70 61
D In
to D,S D
Irr
D
D,
S
Irr
Irr
D
Dy,
Irr
to Irr
D
D.S
.Irr
D
L.
L.
L.
L.
L.
Cp.L
.
C,
L.
L.
Cp.
L.
Cp,L
.
L.
L.
L.
L.
See
foot
note
s at
end
of
tabl
e.

2 8 888 888 g 888
bo *K'*B" " * * * OB *
38 = !_,§ 1-^ U M i W B'opI § fs ! § ? * § 'I s i 1 p | 3 ? ? I » ! v r !
*-*
g 1 III 1 I 5 i III
» g gtoco to rf^ co to w w g
-4 t_4 H-* t co t~* » co to » *
o o » 00
23
H-
Sand and gravel.
a. p
030
2.
0XI
'£ If*. C7* Cp l*fc t^
w 0 10 10 ȣ. o>
30 00 ?O
CO
-8
-
0
»
iftocoOJD Oi CO
3 O O o 0 W 0» o> po oo oo oo oo
O Cn 00 i^ to O to
H-* t-* H-« KS fcO * * -"?0 COto O *. Cn 03
Q Qtn OQ OQ Q CO
?
ru
-
( * I *
ooo oo
si i
11^ i*!^ '"e< I
3 O3 O OS O 0
; i : i !
is i§
Cw*4 *» t-«t-«t-«cn *° (-* O5 *Jt O CO CO Cn CO OJ JO tO
| ;
«-<
i (-* t-*
)-A £J
0 0 0 -° 0 ° OQ oa OD »- oo §"
f |r't-'tH t^ t^ t^ t-1 Sr1 Q t-" t^
T. 6 N., R. 8 W. Continued
<BSS D p
0
1o »-
*i
Year completed
Altitude of land-surface datum (feet)
Depth (feet)
Type of well and diameter of casing (inches)
Depth to top (feet)
Thickness (feet)
QBT s
Geologic formation
Date measured
Distance above (+) or below land-surface datum (feet)
Water-yielding zone or zones open to
well
Water level
Temperature (° F)
Type and horsepower
Discharge (gpm)
Bailing or pumping rate (gpm)
Drawdown (feet)
"T)
a
Results of tests
Use
Other data available
SX.3TIVAQlsLV VSOH ViNVS XI H3I,VAL aJSTILOHt)
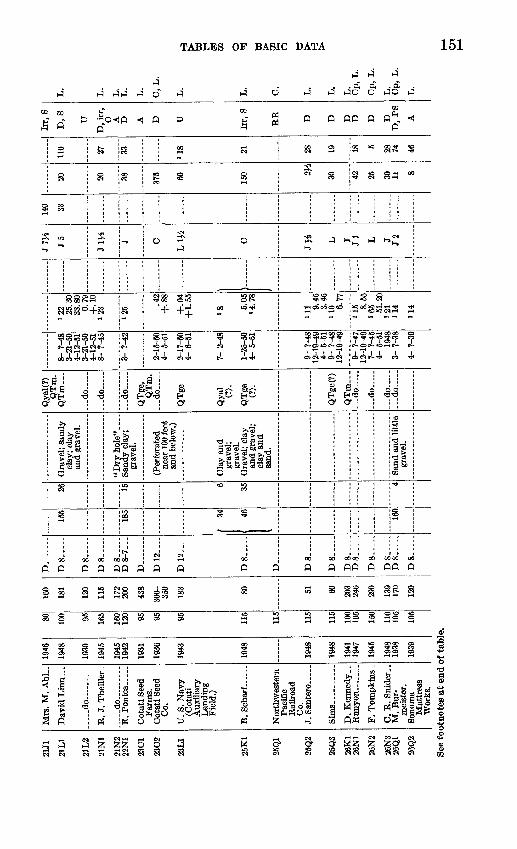
Mrs
. M
. A
hL.
.....d
o
E.
J. T
heil
ler.
do .
....
Far
ms.
frit
ati
Sl
AA
fl
Co. (Cot
ati
Aux
iliar
y L
andi
ng
Fiel
d.)
Paci
fic
Rai
lroa
d C
o.
M.
Bur
-m
eist
er.
Mat
tres
s W
orts
.
1946
1948
1930
1945
1945
1942
1931
1936
1943
1948
1948
1948
1941
1947
1945
1948
1938
1939
80 100 95 165
160
120 95 Q<
\
95 115
115
115
115
100
105
150
110
105
105
160
181
120
115
172
200
438
300- 350
183 SO 51 60 203
246
290
139
170
120
D D8
...-
D8.-
~
D8
--
D8
-
-TV
c_7
D.
...
D12-
D12..._
D8..
._.
D_
D8-
D8
-
.
D8
_
D8_
.
D8-
D8-
D8-
D8--
-..
155
1O
K 34
46 160
26 15 6 35 4
clay
; cl
ay
and
grav
el.
grav
el.
near
100
fee
t an
d be
low
.)
Cla
y an
d gr
avel
; gr
avel
.
and
grav
el;
clay
and
sa
nd.
grav
el.
Qya
l(?)
QT
m.
QT
m
...d
o... .
.
do
do
.
QT
cre
QT
m.
OT
Vfi
Qya
l(?
).
QT
ge (?).
QT
ge(?
)
QT
m-.
-.d
o
_
...d
o
... d
o.....
8- ?
-48
3-21
-50
4-12
-51
3-21
-50
4-12
-51
8- ?
-45
3- ?
-42
2-15
-50
4- 5
-51
2-17
-50
4- 6
-51
7- 2
-48
1-25
-50
4- 5
-51
9- ?
-48
12-1
9-49
4-
5-5
1 9-
?-4
812
-19-
49
9- ?
-47
12-1
9-49
7-
?-4
54-
5-5
1 19
483-
7-3
8
4- ?
-39
122 25
.30
33.8
0 0.
79+
.10
123
!25
.42
+.8
8
4.
f)4
+1.
55
18 5.05
84.7
8
ill 9.
45
3.45
U
O 6.77
U5 8.
55
165 51
.20
121
114
114
J7J4
J5 Jl!-
$
J C
L1J
4
C
31$ L J Jl L J J2
140 33
20 20 38 375 60 150 2J
4
30 42 25 30 11 8
110 27 33 '
18 21 28 19 18 5 28 74 46
Irr,
8
D,
S
U
D,
irr,
O
A D A D U
Irr,
S
RR D D D D D D
D,
PS A
L.
L.
L.
L.
L.
C,
L.
L. L. C.
L. L.
L.
Cp,
I
Cp,
1
L.
Cp,
L.
21J1
21L1
21L2
21N
1
21N
2 22
N1
23C1
23C
2
23L1
25K
1
25Q
1
25Q
2
25Q
3
26K
1 26
N1
26N
2
26N
3 26
Q1
See
foot
note
s at
end
of
tabl
e.

S * 4 4 1 *d 2 SW^G^ W
* ! iliil II II i i § i& ^ "-1 Q Q <C co co
K> 01 COOi^-sj^- -sj
O O O O O O5 Q " ?°
i P i
1 l§ gse a "1 CO Oa H-» c?i en H-» If. OOCO OI-OO 0
O O|> OQg3 M
: i ; <o <o <o <o <op p D p D g CJg g C?£, g
0 0X 00
rf^
§
Sand and clay; sand and gravel; gravel.
^<0
fj frrr tgtr?tr?rcp ?
I& issi mssigiSs^ 4 - - .- COO CO ^- CO CO COOOOCnH^ CO CO OS
^ to en * en O en *< Oi i3&- en en
= 01
Cn Cn ^
g
0 ScogWgHJ 1-
j | co S S S 3 S
S 51 o o o c»5 -u "S _p OD °°_K3
j3
tr1
T. 6 N., B. 8 W. Continued
CD5"o
O
Year completed
Altitude of land-surface datum (feet)
i
Depth (feet) t< '
Type of well and diameter of J casing (inches) "J-
Depth to top (feet)
Thickness (feet)
Qtr
Geologic formation
Date measured
Distance above (+) or below land-surface datum (feet)
Water-yielding zone or zones open to
well
Water level
| Temperature (° F) ^
s
Type and horsepower
Discharge (gpm)
Bailing or pumping rate (gpm)
Drawdown (feet)
*.
(3 C
1 CC1H-
C
Results of tests
Use
Other data available
<IMV VSOH vustvs majstaoao

28E
1
28R
1
29A
1
29B
129
E1
29F1
30F1
30F2
32B
132
01
33E
1
33M
1
33P1
84Q
134
N1
34N
2
35A
1
35A
235
A3
3501
J. M
am
a......
shaw
si.
C.
W.
Kld
d..
.
A
C16
V6
W. J
. Whe
eler
-
E.
Pln
tis.
.....
Uti
lity
Dis
tr
ict.
..
...d
o.........
1849
1950
1941
1949
1930
±
1948
1960
1942
1047
IQdf
i
1950
1942
1948
1949
1950
1946
1941
1948
195
140
135
140
200
215
290
290
310
inn
250
210
265
190
195
205
tin
110
110
125
200
135
259
1,94
928
5
170
248
288
202
190
215
261
338
213 82 119
660
100 75
D8-6
...
D8_.._.
D7
..--
.
D8..
...
D8..
D,.-_
-_.
D8..-.
.
D.G
8-.
D8--
T>
8
T> 8
D10.-
--
D 8
-6-4
.
D8
-.
D8--
.-
D8._
D..
....
.
D 1
2..-
D6--
-..
D8..
...
65
f 12
0I
131 12 195 219
inn
lift
207
101
925 67
83 8 2
234 58 69 98 27 6 18 8
clam
she
lls.
grav
el.
fora
tion
s ab
ove
104
feet
).
San
d... .
.......
San
dsto
ne;
sand
and
gr
avel
.
grav
el,
mix
ed.
and
fine
gr
avel
.
grav
el.
grav
el.
Era
vel.
...d
o.....
QT
m(7
).
...d
o..
...
...d
o..
.....d
o.....
...d
o-.
.....d
o.....
...d
o.....
Tsv
<?)
~Q
Tm
(?).
Tp......
...d
o..
..
Tsv
(?)
..Q
Tm
...
... d
o.....
QT
m-.
-
...d
o .
.
9- ?
-49
3- 2
-50
4-12
-51
8-10
-50
8- ?
-41
3-21
-50
4-12
-51
5- ?
-49
3-29
-50
4-12
-51
4- ?
-48
9-20
-50
9- 5
-47
3-29
-50
4-12
-51
6- ?
-45
4-11
-51
Q_9R
_R
n
3-24
-50
4- 6
-51
10-
?-48
3- ?
-49
3- 2
-50
4- 6
-51
9- 5
-50
12-
9-49
10-
7-41
U5 34
.64
8 35.
03
126
131 15
.90
15.1
5
180 22
.22
19.8
9
186 10 32
.23
34.5
2 11
210
3. 9
5 14
0
11 79
. 5+
76.0
3
^63 16
1.42
0.93
16
8.33
U7
J 2
L W J
2
LlJ
-i
J 1 J J 3
% 31
20 8 17 17"4
0 4 10 5 30 25 11 8 33
45 89 149 27 30 12 100 68 41 54 73
D.D
y,
D,S D Ind
D,S D
D,0
D,S
D
,S
D,S
D,i
rr
D,S PS
D D
L.
L,
W.
L.
L.
Cp.L
.
L.
Cp.L
.
L.
L.
See
foot
note
s at
end
of
tabl
e.
CO

» £>£> t5 I * tO * * H*
.<" ad a;
«H £Ef2 WS Psm 05 «**g w 3 ;S.
^ CO 4* S
n O Oi Cn
CO OOO 00
r?tZh-tO
tp to Sen
3 dd d X OOOO OO
1 C7t cno ^
o-l? ^
?-S g>K| "3.
! 8tO Ci O en
to co
G O?° b ' o°
t£» >ft CO ) t »-* CnCOUO O C" COM Cft Cn CS <O OO CO COO
O5COi *tn rffc. *4 rf^ O
QQ Q Q Q gQ
^f § £. ^&°*£.| §-! ^ I ?& ra ^** © p O *"" ' CXt'^*' Q* *"* PJ
11* al" ? ^o. t~'
<o zx> i-3 ^* i<D 3 O D
3
ftjffftf'i3
5»i£W«
i i <o5559 5 O O 3
' j 3
tj t? ^icp OiH-Oi rf^ Cn I***H* CO H* CO
CO CO CO Otoo h£o
P x t. 5 *
i*" -s I «a Ms g «
d dd d
fcH JH.f ^
d FCQ
f r
<B
§
O^1o »-jC
1Year completed
Altitude of land-surface datum (feet)
Depth (feet)
Type of well and diameter of casing (inches)
Depth to top (feet)
Thickness (feet)
O
t-t
Geologic formation
Date measured
Distance above (+) or below land-surface datum (feet)
Water-yielding zone or zones open to
well
Water level
Temperature (° F)
Type and horsepower
Discharge (gpm)
Bailing or pumping rate (gpm)
Drawdown (feet)
" d
o
Results of tests
Use
Other data available
QNV VSOH VJLNCVS MI SK&LVAL onaoao
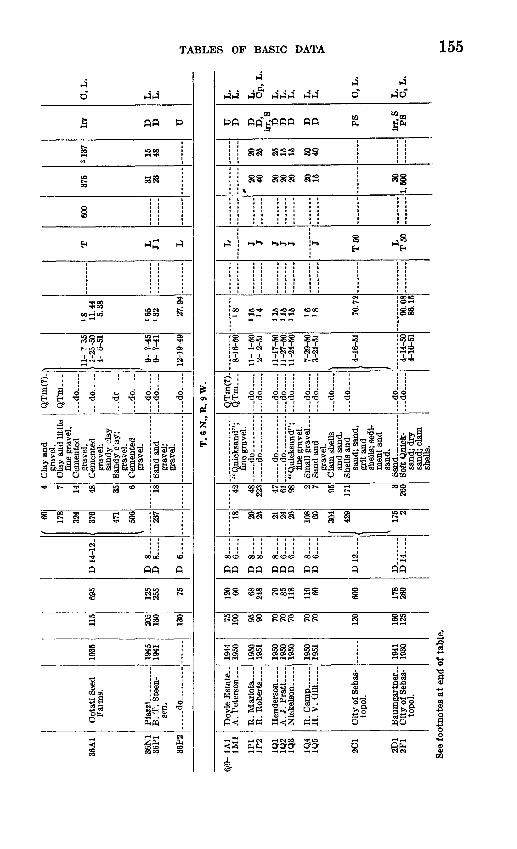
36A
1
36N
136
P1
36P2
Cot
atl
Seed
F
arm
s.
B.
T.
Ste
en-
sen.
....
.do
...
...
1935
1945
1941
115
205
130
130
695
125
255 75
D 1
4-12
.
D
8--
-.D
8
D
6_...
60
178
324
376
471
506
237
4 7 14 48 35 6 18
Cla
y an
d gr
avel
. C
lay
and
litt
le
fine
grav
el.
Cem
ente
d tr
avel
Cem
ente
d gr
avel
; sa
ndy
clay
. Sa
ndy
c'ay
; gr
avel
. C
emen
ted
grav
el.
grav
el;
grav
el.
QT
m(?
)-
QT
m..
.
do
...d
o.-
..
.. .d
c ..
do.
...d
o ..
...d
o-.
..
...d
o
ll-
? 35
1-25
-50
4-
6-51
9- ?
-45
9- ?
-41
12-1
9-49
18 11.4
4 5.
38
165
132 27
.94
T L 31 L
600
375 31 23
3 13
7
15 48
Irr
D D U
0,
L.
L.
L.
T.
6 N
., R
. 9
W.
6/9-
1A
11M
1
1P1
1P2
1O1
1Q2
1Q3
1Q4
1Q5
2C1
2D1
2F1
A.
Pet
erso
n..
.
A.
J. P
ratt
.
H.
V. G
ill-
topo
l.
Cit
y of
Seb
as-
topo
l.
1944
1950
1950
1951
1950
1950
1950
1950
1951
1941
1930
75 190 95 90 70 70 70 70 70 120
160
125
120 60 68 248 70 85 118
110 60 600
178
260
D 8 -
D 6~
-
D
8-
D 8 -
D 8
.D
6-~
-D
6
..-.
D 8
.
D
6--
~
D12..-
D-
D14_.._
18 20 25 21 24 20 108 60 304
429
175 2
42 48 223 47 61 98 2 7 95
171 3
260
"Qui
cksa
nd";
fine
gra
vel.
d
o---.
.do
.... . d
o ..
...
fine
grav
el.
grav
el.
Cla
m s
hells
an
d sa
nd.
grit
and
shel
ls; s
edi
m
ent
and
sand
. Sa
nd _
_ .
Soft
Qui
ck
sand
; dr
y sa
nd;
clam
sh
ells
.
QT
m(T
).Q
Tm
... d
o
do
do.....
do
..
. do
d
o
do
do .
... d
o -
do
....
...
.do..
...
8-16
-50
11-
1-50
2- 2
-51
11-1
7-50
11-2
7-50
11-2
4-50
7-29
-50
3-21
-51
4-16
-51
4-14
-50
4-16
-51
18 >15 14 115
115
115 «6 18 70
.72
90.0
886
.15
L J J J J J J
T60
LT
50
» 20 40 20 20 20 20 15 30
1,50
0
20 25 25 15 15 60 40
U D D D,
irr,
8
D D D D D PS
irr,
SP
S
L.
L.
L.
Cp,
L.
L.
L.
L.
L.
L.
C,
L.
L.
0,L
.
See
foot
note
s at
end
of t
able
.C
n

CO CO
g g ta i
neral Home. N. Shaeffer..- do... .
1 1
3 SO en
COCO CO M U t5
111 t^ O rt-hj 2 g *t y
1 T *4
1
i
i i 1§ §§ S S
Tt5 KJtO to JO
W QJ"9 Q g
8 g S1?1
1 II § 1
g ii i
iSKII S g g gggd00
8
g
sand and some gravel.
CO
g PI
3. 9
dX
dd d d d dd dd-J CO 00
.88 s s s s8
o.
sL
ge s s g iBlack sand __ Sandstone;
a. p,5 0
tttttt
H* O H^ O H-* O
S3S
ggsia (O Ol 00 00 OOCn o
-< *e
8
S
§
;-!
S too<
5Q DO Q OQ CQ DO
§
-H
h* »J
3.a. p.3 p
a. a.3 3
tt |t
Oi Oj O» Cg
gg SJS
V-
GOB
1
5
o
id dQ 00
g
8
Soft sand; shells.
3
f
1
O
3
SH
«» »££ « « a 2«gs«t< P
OT 5 A.
P
a1
JH {-I [H JH JH [H t^f JH
TIVA VKITIVJmi <INV V80H VvLJSH
T. 6 N., R. 9 W. Continued ^
(Di"
Isc 1
Year completed
Altitude of land-surface datum (feet)
Depth (feet)
Type of well and diameter of casing (inches)
Depth to top (feet)
Thickness (feet)
Q1
1
Geologic formation
Date measured
Distance above (+) or below land-surface datum (feet)
Water-yielding zone or zones open to
well
Water level
Temperature (° F)
Type and horsepower
Discharge (gpm)
Bailing or pumping rate (gpm)
Drawdown (feet)
o
Results of tests
Use
Other data available
a: HaiiVM ONHOUID c
TABLE 17. Description of water wells in the Santa Rosa Valley area, California Continued H"1

3N1
4F1
4L1
4M1
5A1
501
5F1
5H1
5L1
6Q1
7D1
7F1
7L1
8F1
8F2
8K1
8K2
8N1
8E1
9E1
9N1
10B1
10H
1
11A
1
11A
2
11A
3
11B1
Pau
l B
ondi.
..A
ndre
wO
anda
son.
W.E
.R
ober
ts.
O. H
agam
an..
O.
Cun
ning
-ha
m.
A.
W. A
nder
-so
n.Jo
hn J
.S
chm
itt.
Cha
rles
Rob
ert.
Alb
righ
t-.-
S.
C. H
aU
..
John
Cot
ella
H.
Sutli
flA
. W. W
arne
r.
H.
D.
John
son
O.
P.
Jose
ph..
A.
B.
Sex
ton.
._
d
o .
.....
Gol
d R
idge
Co.
Dr.
J.
H.
D.
Rog
er.
C. E
. Van
Hom
e.Y
oung
berg
....
D
. A
. M
cD
onal
d.C
arl
Scho
-w
alte
r.
H.
W.
Gat
es
S. S
. B
lair
.
P.J
. A
lkir
e...
H. G
erkin
..
1934
1946
1948
1949
1950
1944
1945
1946
1946
1947
1946
1947
1948
1946
1947
1943
1946
1941
1946
1946
19
44
1945
1945
1947
1948
1950
240
220
275
365
160
280
290
145
175
240
590
726
530
445
420
255
280
660
430
435
520
285
315
180
130
170
170
165
140
190
230
165
190
155
100
116
100
170
280
120
190
112 40 120
168
140
280
250
180
400
195
110
220
420
D 8
D
8
D
6..
..
D 8.
D 8
..-
D
7-
Do
D 8.
Do
D 6..
-
D 8.
D 8.
D 8 .
D
6..
..
D
6..
..
D 8 .
D 7.
D 8
-
D -
D 6
D8-6
...
D 8..-
D 8
-
D 8
~-
D 8
.
D 8
.
D
6-.
..
80 166 40 21 130 60 26 12 8 70 3 80 5 40 55 90 136 0 16 160
178
183 2
106 50
85 132 3fi
100
144 60 100 75 104 92 100
277 40 185 67 65 75 5
280
234 18 222 12 108
115
370..
...d
o.. .
....
. .d
o
.....d
o
ston
e.
clam
she
lls.
....
. do
...... ..
. ......d
o. ..
. ...
with
laye
rs
of b
lack
rock
.
.....d
o. ..
. ...
.d
o.
.
ston
e.
....
.do..
... .
....
sand
.
....
.do
Cla
y an
d sa
nd
ston
e; "
stic
ky
ston
e"; s
and
st
one.
Sand
; cla
m
shel
ls.
ston
e.
Fine
san
d;fi
ne s
and
and
erav
el.
-.do.....
...d
o. .
QT
m
... d
o..
...
... d
o
...d
o .
.
... d
o... ..
...d
o.....
... d
o.
...
.do
QT
m(?
).
QT
m...
QT
m;
JK<?
) Q
Tm
..
...d
o.
...
.do
...d
o
...d
o
...d
o.....
...d
o
...d
o .
...d
o..
...
...d
o
...d
o .
.
...d
o .
.
...d
o
3- 7
-34
11-
7-49
4-16
-51
8-22
-50
4-26
-50
4-25
-50
4-16
-51
4-17
-51
4-27
-50
4-16
-51
4-9
7 f
f\4-
14-5
1 4-
26-5
04-
14-5
1
7-31
-46
4-4-
504-
14-5
1 4-
6-50
4-14
-51
6-30
-50
132
1142 15
1.2
10 59.0
.
9.07
8.22
9.
0510
.73
7.67
46.6
546
.42
93.9
079 »150
885.
546
.60
25.7
724
.62
135
LI
J2 LI J LI
LI
Jl
Jl J
JJi
LI
JH L L3 L JH
12 2tt
7 38 7 12
10 15 8 7 25 2
28 40 »35
100
D,
OD
.In
d
D D D D
D,
O
D D D D U D
D,
0
D D jrr O U D D
'D,
0
D,
O
D D D D
L.
L.
L.
L.
L.
L.
L.
L.
L.
L.
L.
L.
L.
Cp,
L.
L.
L.
L.
L.
L.
L,
L.
CP
,L.
L.
L.
L.
L.
L,
See f
ootn
otes
at e
nd o
f tab
le.

8 to
?
oW yy^t^oo o
W .«- w 3 w > P W ya. '^ g 8 I W p P 0 §
5 » f § I w S ~ & £a i i s I s r "& § : : i : s : i s :
IE- Cn1 1 1 I 1 11
_4 f-t <o 2? 2? S3 s* jfe fe ^
OK? tl O CO CO W CO tp Cn O O Cn Cn 00 O O O
e op ooooooe» O5 O oo oo oo oo oo oo oo
j p» I I 5 J ! I !
SS8u,SfeSSi 3
gggsassls gw ^1-0 a2 i1
§
r
9°
*>\
MH*
O
8
j
ttttrt Cng Cn
Kl
OQ OQ OQ
D p.^.
»*»
r ttrt Tt?g gsg
§ S2§
H Ir"
3
§"3
o ff w e e cj T-.G G G " "! " 0 ~ § o % 0 <B
JH JH JH JH JH Q JH JH JH
^P
T. 6 N., K. 9 W. Continued
Ig
O
88 1
Year completed
Altitude of land-surface datum (feet.)
Depth (feet)
Type of well and diameter of casing (inches)
Depth to top (feet)
Thickness (feet)
O
Geologic formation
Date measured
Distance above (+) or below land-surface datum (feet)
Water-yielding zone or zones open to
well
Water level
Temperature (° F)
Type and horsepower
Discharge (gpm)
Bailing or pumping rate (gpm)
Drawdown (feet)
^)1 o
Results of tests
Use
Other data available
<LNV VISOH VJLNVSCLNUIOIHO

12D
3
12G
1
12G
2
12K
112
N1
13A
1
13A
2
13A
313
A4
13B1
1301
13D
1
13G
1
13H
1
13J1
13L1
1401
14J1
14M
1 14
R1
14R
2 15
B1
B. L
. LaB
lue.
.
E.
W.
Mc-
D
anie
l. B
assi
gnan
i B
roth
ers.
H.
Scho
lzJ.
B. H
amil
ton
J. K
raus
e
J. S
. Sha
rp ..
..
Han
zel _
_ ..
.R
ay F
red-
ri
cks.
W.
G.
Sto
ne. .
R.
Kol
by. .
...
F.
F. S
co
tt
A.
C. E
dd
y..
.
Llo
yd G
ra
ham
.
A.
Val
entin
e. .
J. M
atte
r!. .
...
C.
Stef
an
Mrs
. E
. B
ur-
bank
. H
arry
Hen
nig.
L
angf
ord _
__
Hig
ginb
otha
m
A.
Lor
enzo
....
1951
1948
1939
1951
1950
1942
1935
1948
1943
1943
1950
1947
1950
1938
1946
1950
1945
1939
1949
19
46
1949
19
47
130 95 85 125
215
185
195
150
175
175
235
260
240
190
200
260
325
330
370
255
325
300
278
104
155 84 65
101
126
114
185
212
204
471
133 88 280
360
365
394
181
185
200
100
D 6
-..
D
8..
..
D
8..
..
D
8-.
..D
8
....
D 8.
D
6..
..
D 8
.....
D 7
D 6
D 8
-
D 8
-6
D 8
D.......
D 8
-
D 8
-6
D 8
.....
D 8
..
D 8
.....
D 6
D 8
__
D 8
.....
3fi
130 9 4 60 200 32 60 58 239 0 9
298
243 25 54 106
135 12 172 73 26 41 360
172
and
clam
sh
ells
; "q
uick
sand
";
part
ly-c
e
men
ted
clam
shel
ls.
men
ted
grav
el.
grav
el.
sand
and
w
ater
gra
vel.
el;
sand
; gr
avel
.
and
sand
.
grav
el.
fine
gra
vel.
and
Sand
; gr
avel
.
grav
el.
"Qui
cksa
nd";
sand
and
gr
avel
; san
d.
Sand
ston
e __
...d
o
...d
o...._
do
...d
o.
...
. do
...d
o
do
....
.
...d
o..
...
...d
o..
...
--do.....
do
....
.
...d
o.....
...d
o.
do
do
....
.
do.....
...d
o.....
d
o
d
o
do
...d
o.....
do
3-17
-51
9- ?
-48
3-22
-50
8- ?
-39
4-14
-50
12-2
8-50
3-22
-50
4-14
-51
3-22
-50
6- ?
-48
3-30
-50
4-14
-51
9-15
-50
11-
?-47
3-
30-5
04-
14-5
1 12
-13-
50
2- ?
-46
3-30
-50
4-16
-51
11-
?-45
4- 6
-50
4-16
-51
3-30
-50
>32
140
0% («)
123 35
.90
32.6
58 7
4. 0
5
139 25
.97
21.2
5 13
5
150 47
.04
42.4
8 15
0
155 58
.0
55.9
5
150 62
.58
55.4
6
63.9
2
J L Jl L J 1 J L L
2 L L L J 1
«2 «2
20 8 15 8 10 8 15 8 15 3 25 8
«5 20 ^20 27 33 50 24 35 15 170
D D,
8
D D D
D,i
rr,
8 D D D,
S
D,
S
D D D D,
S
D D
D,
0
O D D,
SD
, S
D
L.
Cp,
L.
O,
L.
L.
L.
L.
L.
L.
Op.L
.
L.
L.
L.
L.
L.
L.
L.
See
foot
note
s at
end
of
tabl
e.C
O

S &
S -s 3* H
§ §
^ $
O 0
r p
S '5
CO
3 ST( CO
^ PI? p
CO A
"r1 S^
eo ~"~ en ^
«H ^
S
e
i
0 ^
tr1 Q
tr1
§ 11
merus. H. Nielson.... Spradley. __ R. Redfern. _
p- Cn *. <1 H* *.
3 1 1-J t ' OO
Cn Cn 0
00073 O5 00
S 3
-j to os CO Cn O
»MMQ
X PJ i
*t Cn Cn<I H* O
i i s8
=H «H
62 Cn O
g to
O 3 y QQ*-»
F tr1 Q
tr1
s<
13
3*
i
i0
0
s
! a- n^
i 3
0
tr1
~n cn
S E
w
^ rf^ 10 oo
s i0 09 p>
si
Sand; hard sand; gravel and sand.
i- ^
* 03
S
5 Sg *
H
s;
o d
t-1
pi Cn Cn cn
^i i P
II 1 1
Wtfr. *. CO
SS 3 §
58 i iOO 0 0-*oo co oo
- os S§ H* J5
55 CO I-1 H^ OO O) OOCn OiCn I? ~q
CO CQCQ Q CO
33 33 ? g
ife-COCO rft !».
Cn cn t^ Cn Cn t->OOi H» O
cnco eg oo
sCn
«H F «H
S
^5" H $?
OK 0
FF Q tr1
H cn5S
» ce
^
iB_ 5"
1CM
OS5*p
oi-» sc$ -I
Year completed
Altitude of land-surface datum (feet)
Depth (feet)
Type of well and diameter of casing (inches)
Depth to top (feet)
Thickness (feet)
Q
S"
Geologic formation
Date measured
Distance above (+) or below land-surface datum (feet)
Water-yielding zone or zones open to
well
Water level
Temperature (° F)
Type and horsepower
Discharge (gpm)
Bailing or pumping rate (gpm)
Drawdown (feet)
2 1
Eesults of tests
Use
Other data available
SJL3TIVAV8OHJlQ(LNHOHO Q9T

23M
1
24A
1
24D
1
27G
1
H.
W.
Kee
ler.
Har
old
Nay
lor
J. E
. B
aker
.. .
J. M
atto
s. _
.
1944
1930
±
1940
±
1950
260
150
235
265
107
130
167
105
D 7
D 7
D 8
.
D 8
-.
42 70 18
65 97 78
sand
and
cl
ay; "
shel
l ro
ck."
ston
e."h
ard
sand
st
one.
"
... d
o.....
...d
o.....
do
..
d
o
8-27
-50
'18
J L 1 J
1530
D,
0
D,D
y,
3 U
D,
S
L.
L.
L.
L.
T.
7 N
., R
. 6
W.
7/6-
19F1
19N
1
19N
2
19B
1
29K
1
29M
1
29N
1
29P1
30A
1 30
A2
30B
1 31
N1
31P1
32A
1
32A
2
Seef
o
A.B
.Kno
wle
s.
Har
old
Hor
ton
McD
onal
d __
Fran
k G
emin
i.
Sher
woo
d C
offin
. 0.
L. P
er-
men
ter.
...d
o ..
....
A.
C. H
ogan
.. R
icha
rds .
.....
do..
.-.
Sam
Eic
ci. ...
. N
ewha
ll- ..
...
Col
. Whi
te-
side
. H
. Q
. Haw
es..
.....d
o......
...
otno
tes
at e
nd
1947
1950
1944
1950
1948
1948
1948
1948
19
49
1930
± 19
49
1949
1951
Of ta
b
675
465
475
465
435
415
405
415
450
445
440
495
470
430
445
le.
585
149
334
300
130
400
155
112
105 25
137 90
205
390
D 1
2
D 1
0 .
D 8
-
D 8--
D12.._.
D....
...
D8.-
._.
DlO
....
D
8.-
D
ug 4
8..
D8
. .
D8-
D8.._._
D
D 1
0
35
28 130 1220
260
f 80
<
119
f 63
X
102
530 9 19 40
40 5 36 12
10
Cla
y an
d gr
avel
. C
oars
e gr
avel
an
d cl
ay;
clay
and
sm
all g
rave
l "w
ater
st
rata
."
Gra
velly
cla
y;
coar
se p
acke
d gr
avel
.
Smal
l bou
lder
s an
d co
arse
sa
nd.
Vol
cani
c as
h ...
.
Gra
vel..
_ ..
..
and
clay
. G
ravel
.... .
....
. do
.._
- . .
QTg
e,
Tsv
(?).
Q
Tge
(?).
QT
ge...
...d
o
... d
o....
Tsv
(?)
.
Qya
l, Q
Tge
(?),
Tsv
(?)
QTg
e(?)
. Q
Tge
...
...d
o..
....
. do
.....
Qya
l
d
o....
do
... d
o....
7-5-
50
3-29
-51
|_ 7-26
-50
7- 5
-50
i 7-
5-50
} 7-
7-5
0
7-21
-50
7-27
-50
7-27
-50
7- 5
-50
8-29
-51
39.0
3
5.00
«3.0
0
15.3
0
6.08
10.7
8
11.6
0 3.
34
30.3
6
8 15
. 45
'85
70
J 1
T7
Ji
J10
T20
JH
Jl « Jl
Jl
T5
T1
0
7
100
200+
50
0
600 20
10
«.'8
0
20
10 65
20
187 80 80 1
U D D Irr
D,I
rr,S
Irr D D D
D,i
rr
Irr
D,S
D
D, I
rr,
Sw Irr
L.
L.
L.
L.
Cp. L.
L.
L.
L.
L.
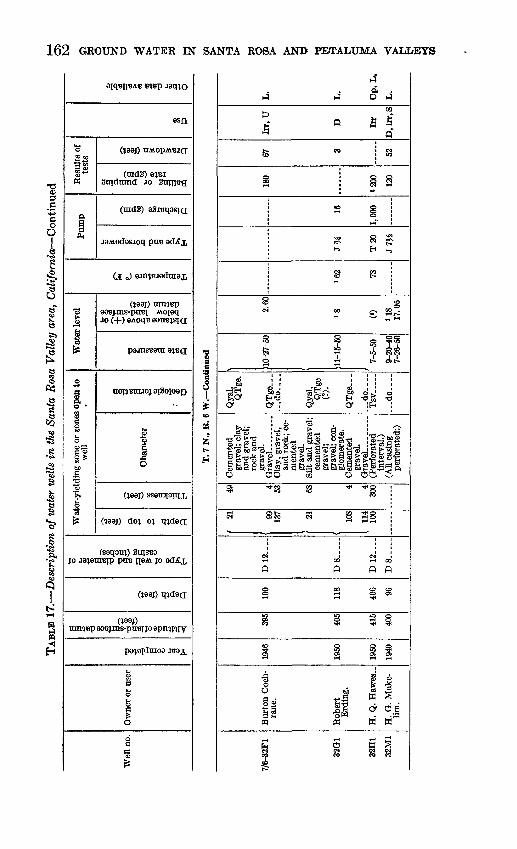
ea eo co to to toS W Q
FPP Si g H 5*^*" jo 0*3
9 S
1 1 1
1 g 1
Os Os GO
0 O 0 "5 P°
§h-» O ^ 00
1. ,
B" "^^ ? §
' f ' f ^
r? r r SS T s 1 1 2J 1 Cn ^ O Cn
^OO ^ OO
Cn
oo to
IS 2O Cn
§ ito i co
O
'? 51 o
t* Q t*
r
1^w
?lQ
1
1
i
0
P
s Kg ,0
8 8» *
Ee 9? S1 6 *^H Sp^f°*^Op'^tt
iS§8p'L jjL^&^g §p.as-3^ -e^-| *na ' p.0 £» B 5"' 2®'q w<i p.^oa. (j.p - » a> B
.4 ? -^£> <O <O
§! ''! *§! S 8
ito8
i
3
cj
t*
3 & g
O
S oi
H<
Year completed
Altitude of land-surface datum (feet)
Depth (feet)
Type of well and diameter of casing (inches)
Depth to top (feet)
Thickness (feet)
O
1
Geologic formation
Date measured
Distance above (+) or below land-surface datum (feet)
Water-yielding zone or zones open to
well
Water level
Temperature (° F)
Type and horsepower
Discharge (gpm)
Bailing or pumping rate (gpm)
Drawdown (feet)
2BV
Results of tests
Use
Other data available
QNV vsoa vijsrvs
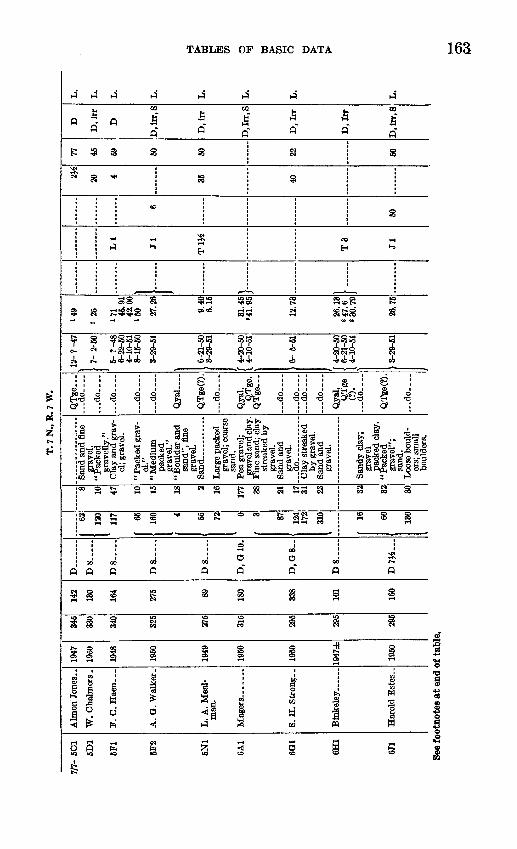
T. 7
N.,
B. 7
W.
7/7-
5C
1
5D1
5F1
5F2
5N1
6A1
6G1
6H1
6J1
W.
Cba
lmer
s .
F.
C. H
aen _
A.
G. W
alke
r.
L.
A.
Mea
l-
man
,
Mag
ers.
-.- _
S. H
. S
tron
g..
Bin
kele
y ...
...
Har
old
Est
es..
1947
1960
1948
1950
1949
1950
1950
1947
±
1960
345
330
340
325
315
295
295
295
142
130
164
275
Off
180
338
101
160
D... .
...
D8 -.
D8
-
D8
- .
D 8
.---
-
D,
G 1
0-
D.G
8--
D8-
D 7
#...
162 Izu
117 6fi
160 4 55 72 0 3 87 124
172
310
f 1R
60 130
8 10 47 10 15 18 2 16 17
7 38
21 17 31 23 32 32 30
Sand
and
fin
egr
avel
.
grav
elly
."
el; g
rave
l.
el."
pack
ed
grav
el."
"B
ould
er a
nd
sand
", f
ine
grav
el.
Sand
__ ..
.
grav
el;
coar
se
sand
. P
ea g
rave
l;
Fin
e sa
nd;
clay
st
reak
ed b
y gr
avel
.
grav
el.
by g
rave
l.
grav
el.
San
dy c
lay;
grav
el
pack
ed c
lay.
"P
acke
d gr
avel
";sa
nd.
Loo
se b
ould
er
s; s
mal
l bo
ulde
rs.
QT
ge.
.._
do.
...
...d
o....
...d
o....
...d
o..
..
...d
o....
Qyal
....
QT
ge(?
).
...d
o....
Qya
l,Q
Tge
. Q
Tge
...d
o....
...d
o _
. d
o _
.
...d
o. .
..
Qya
l,Q
Tge
(?).
...d
o ..
..
QT
ge(7
).
do....
12-7
-47
7- 2
-50
5-?-
486-
22-6
0 4-
10-5
1 8-
15-6
0
3-29
-51
6-21
-60
3-29
-51
\ 4-
20-6
0I
4-10
-61
6- 5
-51
4-20
-60
6-21
-60
4-10
-51
3-29
-51
149
J 25 171 45
.91
42.0
0 15
0 27.2
6
9.40
6.15
31.4
584
1. 9
5
12.7
3
26.1
3«4
7.6
830.
79
26.7
5
}......
.
f-
LI
Jl
Tl#
T3 Jl
6
50
2#
20 4 35 40
77 45 59 50 50 22 50
D
D.i
rr
D
D.i
rr.S
D, i
rr
D.I
rr.S
D, I
rr
D.I
rr
D.i
rr.S
L.
L.
L.
L.
L.
L.
L.
L.
See
foot
note
s at
end
of t
able
.
CO

3»
wF
1
i§dQ00
g-
<
si
d t
F t
§
»
Hg
1
i
<£
dOO5
?
I
3 (
-1 t
£w w
f
1
i(O
K
d
Q05
a
i D
§
:)
-1
3
f
1
*
S
O
O5O5
CO
Qravel and
£>
w
r
i
!
d 5
r1 t
*i to
»H
O
g
*
1
d
OX
1
olpC7t Ol
O OO
X
s :
^ :
3 t
H t
r**$ > w w w w l-J f h" W to f
F M ^ w H O W d p S- O gS ' P L B e r~°
it f 1 F 5 r" i i i i ?
^. en CTI Cn Cn $> 5 0 o M 0 00
1 i §§88
i g 1 s g i
o o o d o o10 i y-. i i
1 t^ 1 1
8 & SS 3 5
.- - ^
||||| * ^*" ^ <ic»-'<d'< g,«<j t- j~* t~* i"*^
J | f p | § ^f
! I -ll 5 r-5l ^ en cnCTtcn en cnc/tcn^CD 0 SotOh- h- OH'OOO
^ CO CO Ql ®
I
-( «H F
» ^ »H »H H;
CM
S 8 i K 8
4 (O O (O tOk C7t O O CO
3d -M 0 d oo
-* F F F F F
H-»as» -»*
Continue
6.
3£. 5*o
!8B
*
Year completed
Altitude of land-surface datum (feet)
Depth (feet)
Type of well and diameter of casing (inches)
Depth to top (feet)
Thickness (feet)
Q
I(9 t
Geologic formation
Date measured
Distance above (+) or below land-surface datum (feet)
Water-yielding zone or zones open to
well
Water level
Temperature (° F)
Type and horsepower
Discharge (gpm)
Bailing or pumping rate (gpm)
Drawdown (feet)
t5
Besults of tests
Use
Other data available
SA.3TIVAQNV VSOH V.LKVSH3XVA1
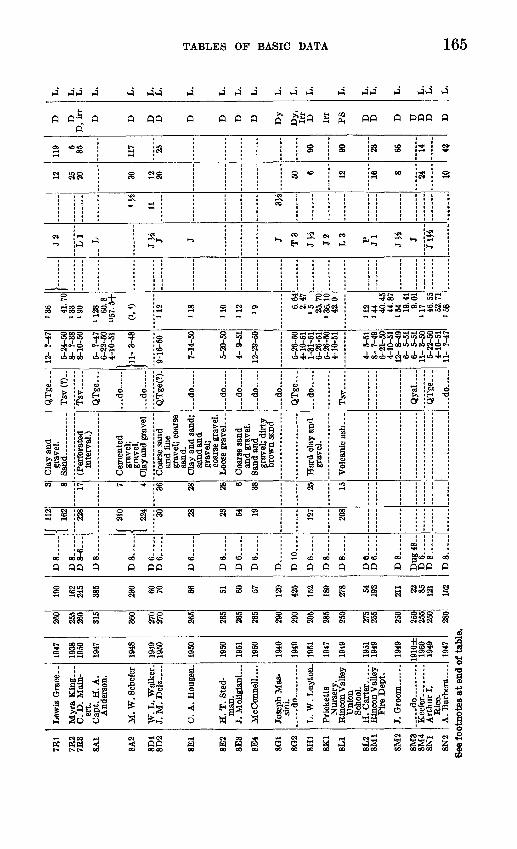
7B1
7B2
7R3
8A1
8A2
8D1
8D2
8E1
8E2
8E3
8E4
8G1
8G2
8H1
8K1
8L1
8L2
8M1
8M2
8M3
8M4
8N1
8N2
Lew
is G
race
. .
Myr
a K
ing ...
C.
D.
Mai
n-er
t.C
apt.
H.
A.
And
erso
n.
M. W
. Sch
efer
W.
L. W
alke
r.J.
M.
Del
z...
.
C.
A. H
ouge
n.
H.
T.
Sted
-m
an.
J. M
olig
iani
...
McC
onne
ll ..
..
Jose
ph M
as-
sini
...
...d
o..
....
...
L. W
. L
ayto
n.
Pri
cket
tsN
urse
ry.
Ein
con
Val
ley
Uni
onSc
hool
.H
. C
arte
r . ,
,R
inco
n V
alle
yF
ire
Dep
t.
J. G
room
. .
.....d
o... .
.....
Kee
fer ..
...
Art
hur
I.B
ice.
A.
Bar
ber
a .
1947
1938
1950
1947
1948
19-1
919
50
1950
1950
1951
1950
1940
1949
1951
1947
1949
1951
1949
1949
1910
±19
5019
49
1947
260
255
260
315
360
270
270
265
265
265
265
290
290
295
285
250
275
255
250
250
255
250
280
190
162
245
385
230 60 70 56 51 60 57 120
425
152
189
278 54 193
211 22 85 121
152
D8
-.._
.
T"»
S
D8-6
...
D8..._
_
D8..__.
D6__...
D6
..-.
_
D6..
...
D6..
._.
D6
. _ .
D6.-
--.
D..
....
.
D 1
0....
D6..._
.
D8._
...
D8..
._.
D6..
D6....
.
D8..
...
Dug
48.
.D
6..._
.D
8-.
.._
D8..
...
f 11
2
1 16
2
228 1210
224 30 28 23 54 19 127
208
3 8 17 7 4 36 28 28 6 38 25 15
Cla
y an
d
Sand in
terv
al.)
Cem
ente
d gr
avel
;gr
avel
.
and
fine
gr
avel
; co
arse
sa
nd.
sand
and
gr
avel
; co
arse
gra
vel.
and
grav
el.
grav
el;
dirt
y br
own
sand
grav
el.
QT
ge-
-
Tsv
(?)
..
Tsv
. _ ,
QT
ge.
..
...d
o.....
...d
o... .
.
QT
ge(?
).
...d
o.....
...d
o..
d
o.
.
...d
o
...d
o.....
QT
ge-
-
...d
o... .
.
Qya
l...
.
QT
ge.
..
...d
o.
-
12-
7-47
5-24
-60
8- ?
-38
8-10
-50
5- 7
-47
6-22
-50
4-10
-51
111-
3-4
8
9-16
-60
7-14
-50
5-20
-60
4- 9
-51
12-2
9-50
5-26
-50
4-10
-51
1-31
-51
6-26
-51
5-26
-50
4-10
-51
4- 5
-51
8- 7
-49
6-21
-60
4-10
-51
12-
8-49
6- 5
-51
6-5-
5111
- 3-
605-
22-6
04-
10-5
1 11
- 7-
47
136 41
.70
133
190
U28 60
.8
"57.
5+
('.«
)
112
118
110
112 19 6.
642.
47
»5 25.7
0 8 3
6. 1
042
.0
112
144 40
.45
44.8
7 15
4 19.4
1 »ni
H7 46.5
552
.71
168
}---
J2 LI
..
L J» J J T3
JK J2 L3 P Jl
JH J
Jm
w 11 3}i
12 25 20 30 12 20 60 6 12 16 8 24 W
119 5 85 117 25 90 90 23 66 14 43
D DD
, Ir
r
D D
D
D Dy
Dy
, Ir
r D Ir
r
PS
See
foot
note
s at
end
of t
able
.Cm

2 ^!§ wo o
-t hd' 02 ITJ t"1- MSpag»gf ^ ofQ J^P-iK S fl3 gj ^|o | 8
D CD b3 CO CD *D
* *DU- LL w Otr IT
CD OO OOOO y ^tj ^tj ^
p 1 p o|tt I-J ^ ^
Oj Oi rf*. rf*.
1 §g 1 1 § i i 88
06 °H- H-
0 t 2 Tt-» SS
O i-UtJ 0
& ^0
0oo
3 ft s >
\
d 0 0-» oo o s3 » i
8 3 8£ s §
^ O; ^D oo
000 oo o oo
.
O Cl CC CC
O ^ rf^ to O Cji Cn O -4 b5
O ^ OO ^ H
" ft"
3 O p O 3 P P
£5!^ 5 ^ ?? "" * S? $ff Jfe ^ SC
"* * H* ** ** M H-ffl fc3 H- H*H*O OjP» t-« H* OCn
bs s b
8 £
i
1 c
3^
*2
i
Sandy gravel... Volcanic ash ... Fine packed gravel and sand. Coarse gravelly
ft i^ ft O ot) i O1 ® 1 j
0
0sg
t * t * t * bo
s mi* ig|i
\ S
H t,
^ x;H ^H
->
Ji2 * *
S fe
ffH « «
S «D OlS
s sis
e o oo
P* f f f f Qt^ p
H
1 i
\
3 g §
OS s s>1
Year completed
Altitude of land-surface datum (feet.)
Depth (feet)
Type of well and diameter of casing (inches)
Depth to top (feet)
Thickness (feet)
Q
1S
Geologic formation
Date measured
Distance above (+) or below land-surface datum (feet)
Water-yielding zone or zones open to
well
Water level
Temperature (° F)
Type and horsepower
Discharge (gpm)
Bailing or pumping rate (gpm)
Drawdown (feet)
t3
Results of tests
Use
Other data available
S&3TIVA<TNV VSOH VJJSVS JsH H3J.V.M. CLKLaOHO 99 T

1501
15C
2
15M
1
16A
1
16C
1
1602
17A
1
17A
2
17N
1
17N
2
17N
3
17P1
18D
1
18E
1
18E
2
18E
3
18F1
18J1
18L1
See
fo
Mrs
. M
ead
Cla
rk.
F. B
andu
ccL
_
R.
C. H
ans-
pe
ter.
E. J
acks
on _
_
J. C
. Vio
letti
es
tate
. Fr
ank
Sil-
vest
ri.
City
of S
anta
R
osa
(Lak
e R
alph
ine
wel
l).
City
of S
anta
R
osa.
E
. W.
Car
l- so
n.
Shuk
er _
__
_
d
o .
F. E
ligg
i
H.
Kea
ts.. _
_
M.
Gal
eazz
i
..... d
o..
....
Ber
t Reed
H. S
team
s..
Tex
Car
ley.
...
L. F
. A
pple
- ga
te.
>tno
tes
at e
nd
1939
1950
1949
1951
1949
1940
1947
1952
1949
1948
1948
1950
1950
1950
1930
±
1945
1947
)f t
ab]
375
365
435
325
335
310
290
285
220
220
220
260
245
240
245
240
220
215
215
e.
39?
205
250
263
190
278
846
1,01
8
104
111
139
104
183
157 70
.0
170
300+
161
D.
...
D8-.
D8..
D8-6
-.-
D6...-
D8
...-
-
D12--
-.
D,
G 1
6.
D,
G6
._
D8..
D8._
D8
...-
D8--
-.-
D6
_.
D8-.
-.
D6
...~
D8-6
...
D16(?
).
D 1
2..
..
40 150
185 50
I U
i 89 60
12
5 90
130
144
f 36
1 "
25 20
20 263 10
12 23 25
22
146 26 42 79
Sand
, gra
vel,
and
clay
; pea
gr
avel
. Sa
nd a
nd
grav
el.
(Per
fora
ted
inte
rval
.)
("A
ll ca
sing
pe
rfor
ated
.")
Soft
volc
anic
as
h.
Poro
us v
olca
nic
rock
; sof
t vo
lcan
ic a
sh.
(Per
fora
ted
inte
rval
.) .....d
o... .
Roc
k....
.. ..
...
Cla
y an
d gr
avel
.
QT
ge...
...d
o
.
do
..
. do -
...d
o-
d
o
QTg
e(T)
.
Tsv
. Q
Tm Tsv
.
...d
o
--.d
o
d
o
-.d
o
...d
o
d
o .
.
d
o
d
o
d
o
do
..
Qoa
l(?)
.
5-26
-50
11-
1-50
5-26
-50
3- 6
-51
4-20
-50
4-10
-51
4-20
-50
6- ?
-47
4-29
-52
1-26
-50
4-10
-51
7- ?
-38
2- 1
-50
4-10
-51
2- 1
-50
4-10
-51
2- ?
-48
2- 2
-50
4-10
-51
9-2
2-50
2-13
-50
1-18
-50
12-1
0-49
6-
26-5
1 4-
?-4
5 5-
24-5
0 4-
10-5
1 1-
26-5
0 3-
1-5
0 9-
?-4
7 1-
26-5
0 4-
10-5
1
(<) 18
101.
9
«80 6.
459.
44
W 184 22
.16
33.4
283
6.90
13
2 1.64
27
.20
30.3
726
.52
179 71
.22
78.2
2
»70
158
178
158 43
.13
125 29
.7
34.8
21
.74
21.6
0 13
1 35.7
0 26
.53
73
F--
T7^
L1M J J3 J3
T25 Jl
3H 32
LI J Jl
Jlj
i
Jl^i
T15
«1 10
610
550
20 7 35 30 35
485
290 50 12 15 30 16 17 40 100
'160 13
0 59 5
340 64 264 3 40 15 12 44 2 0 16
D, i
rr
D D D
D, i
rr
D, i
rr
PS PS D U D D,S D D D D
D,O
D.I
rr
Irr
T, T, T,.
T,, ^-i V; T, T, T, T, T,,
T,. (
T,,
L.
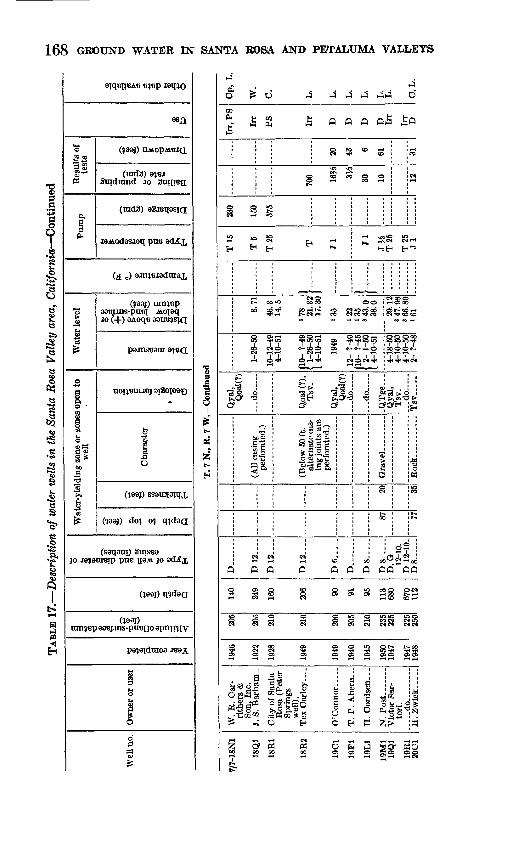
O CD S CO CD CD OO OO OO OOid ^OS tr* ^ Q £d £d (O H-*
<I^ B i-3 O H O ^ ^||^ Q * Q SgggJ» jag.^
g-p-g o o § QC^.°o y? y.
s? ^ S1 V I § " SM^ ll^s?p 3 i ^ 8-g. p
fr. MiCn $ tS *. S to IO *- <I -sj O CJt O CO CD 00 bO O>
i S8 S g 1 g g g i
O o CO Oi 1 ' O Cn O CO O
o^po
3° i
2S
g
i-3<O<
4-18-50 4-10-50 4-10-50
§5DH- 00 tO
^ "3Cn ^
2 2
&^
O -39
0XI
a.5
tl5?
po wen 00
«-4M *^
3 O 0 O O OS H- H- 1-"
iff! if<O <O !
r g ??] ?? ? pk. co Cn Cn »^ Cn *& Cn
O Cn ~-j H^ oo *& 5s OO CO OO Cn CO *a
0
o 1
- H 8 » S
a i iO O W OS O >r* *«*a
2 OS £ 8 j
q1 5*0 o o o H S ^ "GO
'
tr4
T. 7 N., R. 7 W. Continued
o
O
Year completed
Altitude of land-surface datum (feet)
Depth (feet)
Type of well and diameter of casing (inches)
Depth to top (feet)
Thickness (feet)
Qg"
Geologic formation
Date measured
Distance above (+) or below land-surface datum (feet)
Water-yielding zone or zones open to
well
Water level
Temperature (° F)
Type and horsepower
Discharge (gpm)
Bailing or pumping rate (gpm)
Drawdown (feet)
hj
a
Results of tests
Use
Other data available
SJL3TIVAVSOHQM1OHO 891

W. R
. War
ren.
Cor
neliu
s. ..
...
H.
Ber
tola
ni..
J. d
e B
arb
e...
P.
X.
Sm
ith.
.
.do..
..
J. J
. C
oney
....
do.
....
.do
....
....
. d
o
Stat
e of
Cal
i
forn
ia (
Los
G
uilu
cos
Scho
ol f
or
Gir
ls).
.....d
o... .
... .
.
C.
E.
Gun
n.
E.
F.
Bet
h-ar
ds.
1949
1950
1939
1950
1947
1945
1948
1948
1941
1948
19
45
1931
1949
19
48
20D
1
20D
2
20F1
20F2
20P1
23A
1
23A
2
23C
1
23F1
23G
1 23
K1
24A
1
24B
1
25A
1 29
B1
See
footn
ote
s at
end
of
tabl
e.
nfj
fl
215
?,S5
235
245
475
450
4?0
4?0
430
475
565
56*i
450
ft
"91.0
96 95 109
9JQ
365
337
Ion
AX
-
440
1,10
0+52 622
585
400+
9^n
D,G
8..
T> a
T)
o
D8-6
...
D10
D8-
D 8
D
.
D 1
2..
..
D 1
2H--
D6..
.._
D 1
2....
D..
....
.
D10-
T)
8
16 73
65 85 250
303
36 63
31 17 50 62
Gra
vel
and
boul
ders
; sa
nd a
nd
grav
el;
clay
Sand
; sa
nd
and
grav
el;
cobb
les1
san
d an
d cl
ay.
grav
el.
low
40
ft.)
C
lay
and
grav
el;
grav
el;
sand
y cl
ay
grav
el;
cem
ente
d gr
avel
; sa
ndy
clay
an
d gr
avel
.
(Bel
ow 7
5 ft
.al
tern
ate
20-
ft. j
oint
s ar
e pe
rfor
ated
.)
feet
; no
per
fo
ratio
ns.)
Qyal
....
Tsv
_...
Qoa
l(?)
~
...d
o..
-
...d
o.....
QT
ge.
..
...d
o.....
...d
o.....
Qoa
l(?)
..Q
Tge
.
OT
»p
Tsv
..
Tsv
> 1-2
6-50
4-10
-51
10-2
2-50
f 6-
?-*
39
\ 1-
26-5
0[
4-10
-51
11-6
-50
1-26
-50
4-10
-51
11-3
-44
\ 7-
5-5
0
( 5-
?-4
8I
7- 5
-50
6-22
-50
9-11
-45
7- 5
-50
7- 5
-50
7- 5
-50
4- ?
-48
6-16
-50
4-10
-51
38 0
432
.70
165
136 47
.36
49.8
2 18
0 42.0
650
.88
126
»172
+
16
\U
20
+/
6.25
110
8 73
. 25
49.5
5
1.15
1178 17
9.5
194.
55
}--
Jl^i
J
T15
T3
Ll^
i
T20
T1
5
LT
15
T1
0
T20
L2
600
10-1
5
6-8
125
150 60
25 10 40 48
I
27 32 100 6
100 20
»70 12 11 0
H70 20
7
>55 40
3137 0
Irr
D D D Irr
Irr
Irr
Irr
Irr
U s Irr,
PS
Irr, PS
Ir
rD
L.
L. L.
L. L.
L. L.
E,L
.
L. E,L
.L
.C
,L.
L.
L.
Ci
CO

COCO
ok
I1
1
i00
T00to
gCemented
4-19-50 4-10-51
oi o
09
ea
i
o »
t-i
8 8
il *o S
gto Cn
i-> *.
2 8
00 f O 00
to oo
00*.too
Gravel- __ Volcanic ash; volcanic ash and basalt; ash and clay.
3 >^<O
3 \
f J
2
S oen
i
gH-* 0
? 5f Q~f
3 8
0?
g s
1 iltd * CO ht^ CO 00
0 O 0 OX 00
3 £5^ ^S^mt,
W «q
? ^ n cn
2
^
S
3
i S
» sf p.
§td
<
1
%
3 fen
O
1
4-10-51
CO
1.
T1
3 B
I
gIO5
a3
t- 1
S|wt
5
3
g
o
I - u
Q
1
S 5
g III 1U 0
00
> CO*.o oo
i g§
Loose gravel- .. Sand and gravel; shale;
boulders. Volcanic ash-..
H J0£>
tt
ggl
S &
1
3
Q H
r V1
H -jy,
» ~i^
Continue
&
3o>
0 p
O
SS
* «
Year completed
Altitude of land-sorfacedatum (feet.)
Depth (feet)
Type of well and diameter of casing (inches)
Depth to top (feet)
Thickness (feet)
O
o5
Geologic formation
Date measured
Distance above (+) or below land-surface datum (feet)
Water-yielding zone or zones open to
well
Water level
Temperature (° F)
Type and horsepower
Discharge (gpm)
Bailing or pumping rate (gpm)
Drawdown (feet)
" tf
tJ
Results of tests
Use
Other data available
VSOH VJDMVSQZl

36A
1
36J1
M. W
. Gar
den
1942
1948
615
525
284
102
D
8..
..
D
8_...
160
177
45 9
Gra
vel;
coar
se
grav
el;
clay
an
d gr
avel
.
-.d
o..
...
... d
o..
...
Tsv
1 1-
?-4
2
10-2
7-48
'97
17
L11 16
%
3 63
D,8
D
L.
L.
T.
7 N
., R
. 8
W.
7/8-
301
3D1
3D2
3L1
3L2
3M1
3M2
3Q1
3Q2
4B1
4B2
4B3
4E1
4H1
5C1
5Q1
5G2
5G3
E.
Pet
oud ..
...
J. B
ell-
-
..d
o..... .
W.
E.
Sam
ueJ-
so
n.
. d
o..
.. .
B.E
.Mit
cheU
. K
ing
...
....
Lew
is V
elde
...
Mar
tin
Lam
be
rt,
do..
....
...
H. A
. Wei
n-
land
. V
. C. E
as-
mus
sen.
A
. G. H
asw
Bll.
A.
Luc
ehes
i ...
C.
Bor
dess
a ...
B.R
eBer
- na
rdo.
W.E
.Kie
ser.
.
1946
1937
1951
1946
1926
19
50
1951
19
50
1940
± 19
00±
1944
19
41
1949
1951
1949
19
43
1940
1950
175
160
160
150
150
140
140
145
160
150
150
150
145
145
135
140
135
140
235 88
65 150 61
.5
75
72
171+
15
0 21.4
74
152
102'
63 153
110 70 60
D
8-.
._
D 8..
-
D
8....
D
8....
D
6_._
_D
6-.
_.
D
6_...
D10-.
..D D
5....
D
8..
..
D 8
.
D
8....
D
8....
D 8
D
8....
D
6....
D
6....
47
48 20
86 130 62
69 70 60
21
f 87
\
105 64 54
68 10
32 34
20 13 3 4 42
42 5 3 6 6
Cla
y an
d gr
avel
.
Sand
and
gr
avel
; san
d;
grav
el.
Sand
and
gr
avel
; gr
avel
; san
d;
sand
y cl
ay.
Sand
y cl
ay;
grav
el.
Gra
vel _
__
_ .
Sand
and
gr
avel
. Sa
nd;
coar
se
sand
and
gr
avel
; co
arse
gra
vel.
Gra
vel.
. ...
..... d
o .
..
Gra
vel,
"cha
n-.
nel"
.
Coa
rse
grav
el ..
.
QT
ge.
..
QT
ge.
... d
o
...d
o
... d
o
QT
ge-
-
QT
ge--
.Q
yal(
?)~
QT
ge.
..
...d
o
-.d
o
...d
o. .
... d
o
... d
o..
...
-.d
o..
...
...d
o.... .
8- 3
-46
8- ?
-37
3-10
-50
1-16
-51
6-22
-51
5-8
-46
6-21
-51
6-21
-51
6-23
-50
5-9-
51
3-28
-51
9-29
-49
9-23
-41
9-29
-49
11-2
2-49
4-
18-5
1 3-
24-5
1 6-
22-5
1
1 12-1
2-41
1-
23-5
0 4-
18-5
1
«11
>13
13 19 7.53
124 44
.0 7.25
U
8
16
12.5
4
10.6
0
133.
8 13
.22
13.2
6 7.
89
112 5.
07
IS 1
1 8.16
8.
25
J 3
J 1
J 1
LI J y L J 1
T7>
i
T3
J 1
#
T7H
J
1 J
19
10 33
30
20 5 24 25
120
100 60
189 27
27
31 66 42 18
72.7
18
D,
S
D
D D U
D
D
U U
D,
OIr
r
Irr,
S
D,
in
to
D
D,
S
D
L.
L.
L.
Cp.L
.
L.
L.
L.
W.
L.
L,W
.
L.
L.
L.
L.
L.
L.
See
foo
tno
tes
at
end
of t
able
.

5 2 SOi Cn Cn Cn
fill
CO CO
H-* CO OOtoo oo
O 00 0OOO 000 OOOO 00
ai »o to to
W 2?9Q Q
*H tr1
G" G
el d all el
£>£>
oo
tr-at-1 f
15" Po
15
Year completed
Altitude of land-surface datum (feet)
Depth (feet)
Type of well and diameter of casing (inches)
Depth to top (feet)
Thickness (feet)
Q
1
Geologic formation
Date measured
Distance above (-J-) or below land-surface datum (feet)
Water-yielding zone or zones open to
well
Water level
Temperature (° F)
Type and horsepower
Discharge (gpm)
Bailing or pumping rate (gpm)
Drawdown (feet)
*a
1
Results of tests
Use
Other data available
QJSEV VSOH VXNVS HIONHOHD

6Q1
8C1
8K1
8K2
8L1
8P1
8Q1
9D1
9H1
9H2
9H3
9L1
9P1
9Q1
9Q2
9R1
10E
110
L1
10M
1
10M
210
P1
11B
111
G1
11K
1
A.
Mac
cari
o. .
E. B
abbin
i
J. L
aih
o _
-~
---do ..
.-F
iner
Sch
ool
Dis
tric
t.W
. D
.Pa
chec
o.C
. W
illi
ams-
Geo
rge
Gal
ea .
Mar
gare
t B
.
Saw
yer
E.
Giu
sepo
nL.
E.
John
son _
_G
eorg
e A
vel-
lar.
A.
Lar
sen ....
.B
. W.
Mc-
Gra
th.
Sch
urer
.. .....
Car
l E
as-
mus
sen.
Mrs
. Lam
bert
.E
. E
. H
ardi
es.
Paul
son ..
..
D.
C.
Moo
re. .
B.
Mar
cus.
...
O.
Hei
no ..
....
L.
R.
Jens
en..
R.
B.
Mid
ge-
ley.
1949
1945
1944
1947
1949
1943
1943
1949
1937
1950
1950
1940
1951
1949
1951
1948
1950
1935
1950
1950
1941
1948
1949
1941
130
135
130
130
130
125
130
130
125
125
125
125
125
120
115
120
150
135
125
125
130
295
290
300
150 63 30 60 72 81 67 200 80 51 60 119 52 140 40 210 57 212 51 68 150
194
237
254
D10
.
T> 8
D6_
.
r» &
T"»
8
D6_
D6-
. D
IO
DE
..
D6.
D6
-
. T>
a
D6..
...
D12
_
D6_
DH
L...
D6--
--D
12..__
D6. .
D6-
D8
._,-
.
T» 8
D8
_
D8_
f 38
80
13
8 24 60 65
f 5
{ " 48 48 22
!35
136
162
180 50
10
0 44 57
139
122
238
9 10
12 6 8 2 26 6 12 4 18
15 3 3 7 7 14 3 9 j 16
Peb
bly
sand..
. G
rave
l
Gra
vel;
cem
ente
d gr
avel
.
"Har
dpan
and
gr
avel
."
..
do
.. .
... .
Coa
rse
sand
an
d gr
avel
.
Coa
rse
grav
el. .
Sand
and
gr
avel
.
.. d
o .. ..
... .
.do .
Har
d gra
vel
"
Lig
ht g
rave
l"
and
som
e co
arse
san
d.
Sand
and
gr
avel
.
Sand
ston
e _ ..
.
QT
ge.-
-... d
o
d
o
do
do .
d
o
... d
o
...d
o
... d
o
... d
o
... d
o -
... d
o
...d
o
... d
o
QT
ge-~
_._ d
o
QT
ge.
..
.-.d
o..
...
... d
o
d
o
do
... d
o
d
o
...d
o
... d
o
d
o
... d
o
....d
o
...d
o
11 2
2-49
i 4-
18-5
1
12-1
3-49
4-
18r5
1
1-23
-50
8-26
-43
12-1
3-49
4-
18-5
18-
?-3
7 12
-13-
49
4-12
-51
I 9-
9-5
0
9-19
-50
4-30
-51
12-
9-49
4-
12-5
1 3-
28-5
1
1 8-
?-4
8
10-2
7-50
10
-13-
49
6-21
-50
9-26
-50
3-19
-41
6-20
-51
4- ?
-48
2- ?
-49
4- 7
-50
4-19
-50
7- 2
-41
118.
20
10.3
1
15.4
7 9.
95
0013
. 56
120 12
.83
4.86
19
10.4
9 4.
57
122
U4 19
6.37
1.
7917 19 12
0 21.6
0
118
121
UO
18
.70
157
190
394
8190
+
1100
' W
arm
Cl^
i
J*i
JH
J
JH Jl^
T
15
LH J Jl T J T T
15
J*4 L
L
10 150
337
67 30 50 20 100
100 24
276 31 10
42 8
. 7 22
3 2 18
320 20 10
47
.5
30 26
33 137
155
Irr
D,
S,
irr D 8 PS D D
Irr,
S
D D D
D,
S
D Irr
D
Irr D U D D
D,
S
D
D D
L.
L.
L.
Cp,
LPw
.L
L.
L.
L.
L.
Cp,
L.
L.
Cp,
L.
L.
W.
L.
L.
Cp,
L.
L.
L.
L.
See
footn
ote
s at
end
of t
able
.oo

TABL
E 1
7.
Des
crip
tion
of w
ater
wel
ls i
n th
e Sa
nta
Ros
a V
alle
y ar
ea,
Ca
lifo
rnia
Con
tinu
ed
Wel
l no.
Ow
ner
or u
ser
1 4 3 8 i £
ta o le il ^^ "S s I 5
'S V .g Q
"o S <Q If
*M
"S.3 1
"S t"
Wat
er-y
ield
ing
zone
or
zone
s op
en to
w
ell
£ 43 a
o 2 1 (D Q
(D 5J i 1
Cha
ract
er
g 1 | *w I O
Wat
er le
vel
g 3 1 3 1 P
o c? s"!©
^jj
8
^
||1
P
C ~ 1 ts I
Pum
p
i a a 1 3 1 &
ft £2 & 1 P
Res
ults
of
test
s
I li SS °s fs «
"8 s g P 1 P$ t5
.2 OS « i o
T.
7 N
., R
. 8 W
. Con
tin
ued
7/8-
11M
1 12
E1
12E
2
12Q
1
12H
1
12K
1
12N
1
12Q
1 12
Q2
13C
1 13
D1
13D
2
Sono
ma
Cou
nty
Hos
pita
l. d
o.. .,
Mrs
. K
. C
. B
aum
ann.
F
. M
orri
s ...
..
C.
Don
t _ . .
..
Cum
min
gs. _
W.
For
ni _
..
A.
Koc
h. ...
..L
aura
Mur
ra
y.
I. 0
. O
. F
. C
emet
ery
Ass
ocia
tion.
1939
1948
1950
1950
1949
1946
1949
19
49
1951
19
47
1925
±
160
245
245
375
460
480
190
405
430
190
185
200
55.0
51
16
4
298
175
255
347 80 200
220 70
11
5 75
D8-.
...
D10
D12
____
D8-6
-..
D6
...-
-
D6..._
_
D12_...
D ... .
D8. _
D6._
D
10-
D
8....
80
(83
U
24
1.154
/1
60
\208
27
3
125 26
218 20
22
21
24
47
74 95
36
(Per
fora
ted
inte
rval
).
d
o. ..
....
...
... .
.do..........
Sand
, cl
ay a
nd
grav
el;
sand
an
d ro
ck.
Sand
y cl
ay
and
grav
el;
clay
and
gr
avel
. Si
lt; s
andy
silt
-
Tsv
.....
...d
o,.
...
i.-d
o .
.
j.-d
o--
...
_ do
.....
QT
ge,
Tsv
Tsv
-'. ..
...
. do ..
Qya
l(?)
-
...d
o..
...
12-1
5-49
10
-13-
49
10-
6-50
2-
27-5
0
11-1
4-49
4-19
-50
4-11
-51
8- ?
-49
10-1
3-49
5-21
-51
4-19
-50
1.08
35
.1
165
"75 16
5
» +
0. 7
0 U
5.24
187
1123 19 +0.
01
t War
m
JH
T
10
T15
C
J J J3 J3
100
300 H
450 9 15
8
76-8
0
20
20 58
»171
52 50
13
»20-
22 43
27
U
PS
PS
D D
D Irr
D
D D
In
to
W.
L.
L.
L.
L.
L.
L.
L.
L.
L.

....
.do
..
.
Whi
tehe
ad. .
..
Deg
hi.
-.-
..
E.B
.Sch
neck
E.
E.
Rot
hert
.
J. K
. B
ryan
t..
R. J
. V
ande
r-
beck
. V
on G
rafe
n ...
....
.do
...
...
....
.do. ..
...
W. J
. Jac
kson
.
Dr.
Mic
hael
- so
n.
Geo
rge
Proc
to
r, S
r. D
r. C
. M
. C
arls
on.
I. O
. O
. F
.C
emet
ery
Ass
ocia
tion.
..
do
.. .
...
1930
±
1951
19
51
1951
1950
1950
1951
1948
1952
1946
"195
0
1943
1948
1941
1948
1950
200
185
190
190
200
200
200 20 210
200
200
180
180
175
13D
3
13E
1 13
F1
13F2
13H
1
13H
2
13H
3
13J1
W13
J1
13J2
13J3
13K
1
13M
1
13N
1
14A
1
»14A
1 Se
e fo
otn
ote
s at
end
of t
fibj
e,
90 49
54 60
146 100
49 85 263
210 60 529 100
77 560
901
/Du
g
XD
12.
D 6
-.-
D
6-
D 6
.
D
8..
..
D
71}.
$.
D
8....
Do
D.......
D
8..
..
D12....
D
8..
..
D
8..
..
D 1
2-10
.
D
8..
..
h/ 20
I 45
26
f 31
\
55
12 56
68
36
70 34 148
188
! e 1 56
129
272 65
22 4 28 12 5 35 8 78
32
30 15 105 18 4 4 6
159 30
Fin
e sa
nd;
silt
.out.
... .-
Soft
silt
; co
arse
gr
avel
; si
lt an
d w
ood.
Fi
ne s
and ..
....
Fin
e gr
avel
ly
clay
; pa
cked
m
ediu
m
grav
el;
silt.
Pa
cked
med
iu
m g
rave
l. P
acke
d gr
avel
an
d bo
ulde
rs.
Fin
e pa
cked
gr
avel
; sa
nd.
Silt;
vol
cani
c as
h an
d gr
avel
; gr
av
elly
cla
y.
Coa
rse
grav
el- -
(Per
fora
ted
inte
rval
.)
Sand
and
gra
v
el.
Coa
rse
sand
an
d gr
avel
. C
emen
ted
grav
el.
Cla
y an
d gr
avel
; ce
m
ente
d gra
vl;
cor
ase
grav
el, c
lay.
G
rave
l; bo
uld
er
s.
...d
o
JQya
K?)
. _ do
. ....
Qyal
....
Qya
lC?)
.
QT
ge (
?)
... d
o.
.
gyal,
Tge
(?)
QT
ge
Qyal
...-
QT
ge(?
)-
QT
ge(T
).
Tsv
(?)_
- Q
Tge
(?)
do.....
QT
ge.
..
... d
o... .
.
QT
ge (
?)
... d
o.....
QT
ge.
..
Tsv
..
5-23
-51
4-11
-51
j 5-
22-5
1
10-2
3-50
11-
1-50
5-15
-51
7- ?
-58
6-22
-50
4-11
-51
5-27
-47
d~.o
e_ KO
4-20
-50
10-2
5-41
1-
26-5
0 4-
11-5
1 12
- ?-
48
10-1
1-49
4-11
-51
«9
U 19
'35
i;28
U2
122 19
.58
27.2
3
17
120 6.
77
126 18
.9
M9.
40
"0 5.85
(+)0
.07
'War
m
T5
J J J J T3 T3 T J Jl
12
10 33 50
60 50
17 12
23
57 43
361 30 26
140
»160
Irr
D
D D
D D D
D,
irr
Irr D Irr
D,[
irr
W.
Irr U

§ § §P p r3
3 o ^
f i f§ s I
§» i-> o en
2 ^O^i fd gf Qg g ^ H d
Slf^Q 2 ^S! Sl! m ** ^ «V" Q^ !> ' M§ ' <5'tH§ ?go'°^' ' fc Wg-io'S' ^ § ^|.P
S$!2 § § ittCOOD £, |_|
= C1 * t£k CO0 en 0
en !$>.P- CSLL LL S LL °"
Co *-oi en cs en en o cnen en o en d
l-i 1-1 N i_> -j CO ** en t^**jcses t^ t^tft cstft to t*^ cs o
CO 00
d d Odd po p p [ 05
gg 8 8
en en « o
3 <! p £, """p* '
<O £) p.i-3 i i-3 MQ 3 TO
g
CK
1 3
r t?? t
i,g£5
|< <::::
1 i
ft B S
l-> »o I-1 0 06 00
Q <
L
*
d
33
w
3
?
f
S
5
d dd d
CO*. rfkoobs en
oco o
(Perforated interval.) Coarse gravel _. Corase sand
and gravel.
3 O O O
i ib. Cn Co
-« tj3O> Cp
n CnCK Cn D (-'(-' I-1
JO ^ >-»> ootc oo
g
H ^
S^ o
si?
6 i >
«H
=H
dt-iO
5"
d d
0 OB
00 00
to en
Sand and gravel. Gravel ____
^ 3"
d d
to tc
O rf^ tO
CO en l-i CK i^ en
?5 S.1^ S? S to *?? §
p.
3 o p reIt®
(-» ^*
n en g it *
» B S IS tc
-3 -1
N
S
g
-3 H S g
S
8
g
^ t? t? d d dddd g dd d-" d ^ -^ -^
H ^ DD DD
t-1 tr1 t-1!-"ft-1 fcifc-1 p r1 t-1 o r1
T. 7 N., R. 8 W. Continued T. 7 N., R. 8 W. Continued
3a §o
8 8
Year completed
Altitude of land-surface datum (feet)
Depth (feet)
Type of well and diameter of casing (inches)
Depth to top (feet)
Thickness (feet)
Q
*»
Geologic formation
Date measured
Distance above (+) or below land-surface datum (feet)
Water-yielding zone or zones open to
well
Water level
Temperature (° F)
Type and horsepower
Discharge (gpm)
Bailing or pumping rate (gpm)
Drawdown (feet)
*T)
I d
Results of tests
Use
Other data available
;
<INV vsoa92,1

17L1
17N
1
17E
117
E2
17E
3
1OJV
1
18M
118
M2
18Q
1
1901
19H
1
19J1
1QTT
1
19P
1
K.
Eic
h
E. W
end
el -
....
.do
....
. .
F. S
iem
er.
.
Will
iam
Stre
bel.
son.
1947
1933
1936
±
1960
1951
Old
1Q
/11
1947
1933
1Q4Q
1QJ.
Q
1947
90 85 95 100 95 oO so 90 Oft 90 on sn 90 SO
44.0
544 16
.719
0
4zU
640 75 811
196
100
186
176
245
D 1
2....
D 1
3.-
.
Dug 4
8..
D 1
0-6.
.
D..
....
.
D,
G 1
0.
D,
G 1
2.D
D 1
2 .
D 8
....
.
Dug
84
D 1
2-10
D
8- .
D 1
0
o. ...
.
' 3 52
16
2
234
376
424
\ 50
6
1 "
i 40
I
330 60
130
192
222
175
/ 20
45 16
0
219
33 10 2 34 8 6 10 14 2 86 5 23 6 14
21 12
20 30
16
Soft
sand
ston
e;
grav
el.
Gra
vel
Cem
ente
d gr
avel
.
soft
str
eaks
cem
ente
d gr
avel
. C
emen
ted
grav
el.
Sand
ston
e _ ..
.
Sand
and
gr
avel
.G
rave
l .........
...-
do..........
San
dy cl
ay a
nd
grav
el.
Cem
ente
d gr
avel
; sa
nd
Coa
rse
cem
ent
ed
gra
vel.
Cla
y an
d gr
avel
.
fine
gra
vel.
Sand
; gr
avel
. G
rave
l; ce
m
ente
d
Sand
, gr
avel
; sa
nd,
sedi
m
ent.
Gra
vel
....
....
.
... d
o..
...
Qy
al
QT
ge.
..
_ d
o..
...
...d
o.....
...d
o..
...d
o.....
...d
o.....
'Pfl
fp
QT
ge(?
).
QT
ge
_ do
__
OT
^fro
_ do
.....
... d
o..
...d
o..
...
...d
o..
...
...d
o..
...
...d
o.....
...d
o.....
...d
o.....
... d
o..
...
... d
o..
...
d
o..
...
QT
m..
.
QT
ge.
..
11-
8-49
4-13
-51
11-3
0-49
4-13
-51
9-29
-49
12-2
0-49
4-13
-52
4-4-
51 15-25
-60
8-9-
51
4-29
-52
1-20
-47
6-20
-51
11 3
0-49
4-13
-51
9- ?
-49
12-
6-49
4-13
-51
11-3
0-49
4-13
-51
10.7
04.
05
13.7
59.
68
7.31
14.2
57.
64
5.29
18 20.3
3
.99
»37 27
.5
10.4
24.
44
78.1
0
19.5
314
.39
21.5
615
.77
T 3
..T
25
T 1
0
T 2
0
T 3
0
T 1
.5
T 5
T 2
0
T 5
T 1
5
35 250
130
100 15 25 200 94
15 43
?53 65
'39
Irr
Irr
U
Irr
Irr
Irr D Irr
D, S
irr,
S
Irr
Irr
L.
L. Cp,
L.
Cp,
L.
See
footn
ote
s at
end
of t
able
.

to to to to toto toto to to to i 1 ft-*1 ft-*1 (-* ft ft-* ft-1 OO O O O CD*"tf W G G OCd jiOlr1 W G O *"tf ft- tO ft- ft- ft-
J"1 O W O^O *^J> trj trj S^ ^
CO
to
OC"lE'd.cT w tJ P W,!T j m i_i m ftfl Ht3 jv, j. o"*! rss-fto^^ S3 62 B Sr!0 g « -dss0 w* r-' 8°' § § § 'M §
! » ! 2. »S ! j j |
si i 1 11o ft- o o ft-to to Cn d Cn Oi OO Cn
l-> CO
K-
G GCm 00
is
CnCn
Gravel. __ ... Clay and gravel.
^g-
St.
cC
G G P °°
g
o
O
1
I
3
ml llHooo-too ooo
s§ssb % '
«e;
*1
OG
ftf.
O
s 1 L'P, s p
4-13-51 12-23-60
H* OCn
is
G P
.5.
CO Cn CO Cn £».
CD CO CO CD CO Op Cn 00 O O O O
Cn § QO S O> c»
G G ° G G i i_i o > > o to to p
p p j
IsCO O CO ft o» totocoi->coo
OQ a= O
if Hiljr"315 a?: i cc a, p, p,p, p.p,p,p, a,^ : 3 3O O 5 5 3 3VQ 1 I
G
0r
>->Cp OOOCTJ rf»>--' tOrf->bO
ni^ft^oi? CnftPk Cn&i&i
.PCD ObO O 5°^ Cn O Cd
3 «o
^ ^ H-a ^ * o 5 £
1§ Is
g 2 o
-H
<3
fcl ^G a G G go -^a ff 51 51 GO
* ^^ " ? * hM * ~
T. 7 N., B. 8 W. Continued
3£0p
O
S e S
Year completed
Altitude of land-surface datum (feet)
Depth (feet)
Type of well and diameter of casing (inches)
Depth to top (feet)
Thickness (feet)
O
i
Geo/ogic formation
Date measured
Distance above (+) or below land-surface datum (feet)
Water-yielding zone or zones open to
well
Water level
Temperature (° F)
Type and horsepower
Discharge (gpm)
Bailing or pumping rate (gpm)
Drawdown (feet)
nj
o
Besults of tests
Use
Other data available
ON:V vsoa VUSEVS§2,1

21P2
2201
22H
1
22J1
22K
1
22Q
122
Q2
22R
122
R2
22R
3
23E
1
i«23
El
23L
1
23M
1
23M
2
23M
3
23M
4
R.
Alb
ini
R.
Acq
uist
a-pa
ce.
W.
A.
Tay
lor
& C
o.C
hris
tian
esta
te.
J. I
mw
alle
....
... -
do
....
.do
...
A. E
. Bob
bett
.P
aul
Ber
toli
...
Mrs
. P
eter
Bog
dano
ff.
Gra
ce B
ros.
Ice
& C
old
Stor
age
Co.
__
.do.
. __
_ .
Gra
ce B
ros.
Bre
win
g.C
o. (
Dav
isSt
. wel
l).
Gra
ce B
ros.
Bre
win
gC
o. (
New
wel
l).
Gra
ce B
ros.
Bre
win
gC
o.("
Pom
ona
wel
l").
Gra
ce B
ros.
Bre
win
gC
o.So
nom
aV
alle
yW
hole
sale
Gro
cery
Co.
1949
1938
1930
±
1939
1928
1925
1944
1940
1930
±
1941
1944
1951
1947
1942
1936
1920
±
105
130
145
140
135
140
140
140
145
140
145
155
155
155
155
150
70 108 31 46 285
360 86 98 205 60 56
.
100
300
990
210
'300
1,27
9
See
foot
note
s at
end
of
tabl
e.
70 108 31 4fi
285
360 86 98 205 60 56
3
100
300
990
210
300
279
D
6....
D
6....
D14_...
D..
D12..
..
D 1
2..
..
D
6-.
._
D
6....
D 1
2..
..
DH
L...
D 1
0-8.
.
D,
G12
- 10
.
D1
0-8
-.
D 1
0..
..
D 1
4..
..
65 32 62
f 48
{
132
I 27
3 54 320
500
751
955
5 24 46 4 1 5 66 15 127 63 15
grav
el.
Sand
y cl
ay;
clay
and
gr
avel
.
Gra
vel
....
..
do .
... d
o...
ing
stre
aks
of
sand
and
gr
avel
; gr
avel
. Sa
nd a
nd
Sand
and
red
gr
avel
; san
d.
San
d
..... .
... -
do
....
do
d
o.....
_ d
o
QT
ge
QT
ge
d
o
QT
ge (
?).
QT
ge.
..
QT
m (
?)-
d
o
do
QT
ge (
?).
12-2
0-49
4-11
-51
1-23
-50
4-12
-51
1-23
-50
4-12
-51
1-23
-50
4-12
-51
1-24
-50
4-12
-51
10-
5-49
4-12
-51
7- 9
-47
19
35
9- 2
-48
10-1
1-49
4-12
-51
5- ?
-42
11-2
1-49
6-5-
51
13.2
8
10.8
2
14.9
915
.14
5.23
'9.9
7
4.10
9.33
7.
479.
10
" 19
. 55
'5.5
', 8
79. 2
135
'100
.1
19
0+
8137
.85
165 27
.86
52.1
2
'66
1 1
V Jl
T3
T10
T L JJ£
T5
T1
0
Ts4
0
T1
0
150
125
125 90 150 35 450
135
20 20 75 100
295 20
35
'201
.7
115
DD
, S
Ind. D Lrr
Irr
irr U Irr U Ind.
Ind
Ind
Ind U U
Cp.
L.
L.
L. C,
L.
C,
L.
L.

TABL
E 1
7.
Des
crip
tion
of w
ater
wel
ls i
n th
e Sa
nta
Ros
a V
alle
y ar
ea,
Cal
ifor
nia
Con
tinue
d
Wel
l no.
Ow
ner o
r use
r"2 1 i i *
i i AS
c"o "S 3 *)
1 «S 43 & fi
I 1?
«""
gS n
$ j* *
Wat
er-y
ield
ing
zone
or
zone
s op
en to
w
ell
a A a fi
j? ? 1 »^ *
Cha
ract
er£ * H 0
Wat
er le
vel
a i § 3 o
O
Q
-f-'S III ill '"j
S-e
Q
S" 1 g eS
Pum
p
S3 2 g i K EH
| n Q
Res
ults
of
test
s
* a § 3-
S>? ffi
n
s S B | 2 fi« t»
1 9 1 05 1 O
t-i S o
T. 7
N.,
R. 8
W. C
onti
nu
ed
7/8-
23N
1
23N
2
23P1
24A
1
24A
2
24A
3
24A
4
Nat
iona
l Ice
an
d C
old
Stor
age
Co.
....
.do.
..
R &
L B
ever
ag
e C
o.
City
of S
anta
R
osa
(No.
1)
. C
ity o
f San
ta
Ros
a (N
o.
2).
City
of S
anta
R
osa
(No.
3)
. C
ity o
f San
ta
Ros
a (N
o.
4).
1940
1900
±
1918
1904
1940
145
145
150
195
195
195
195
37 150d
b
17?
266
» 49
. 9
930
300
1,00
0
D....
...
Dg6
0,
D.
D
8....
Dug
60.
.
D1
4-
5%.
D 1
2-10
.
D 1
6-10
.
90
116
258
5 22 6
Cla
y an
d gr
avel
. C
lay
and
grav
el;
cem
ente
d gr
avel
; gr
avel
. C
lay
and
grav
el.
Qya
K?)
-
QTg
e(7)
.
...d
o
QT
ge...
...d
o... .
.
...d
o.
.
Qyal.
Qya
i, Q
Tge,
T
sv(?
).
Qyt
&
QTg
e.
Qya
L Q
Tge,
T
sv(?
).
10-1
3-49
10-1
3-49
4-
12-5
1 4-
1-4
0
11-9
-49
4-12
-51
10-1
2-49
5-26
-49
10-
9-49
5-26
-49
10-
9-49
17.6
5
14.7
2 9.
85
116 26
.7
40
.52
44.6
8
'159
'166
'240
'2
40
'84
'70
'86
T5
T5
T5
T10
T30
T3
0
T75
278
1,00
4
4340
Ind
Ind
Ind
PS
PS
PS
PS
W.
L.
C.
C.
C,
L.

24A
5 C
ity
of S
anta
19
47
190
24A
6 C
ity
of S
anta
19
50
190
24H
1 W
ecke
rly.
..-.
1949
19
0
24H
2 .do.
1947
19
0
24K
1 C
.Har
poid
-.
1950
18
0
25E1
C
. J.
Cas
tell
i..
1949
16
025
E2 . d
o ...
160
25F1
D
. E
. S
utte
r..
1950
19
025
F2 _do.
1950
19
0
25Q
1 S
tandif
ord
..-
1951
19
025
L1
Q.
K. H
ard
t-
1960
17
5
25R
1 E
.M.
Wea
ver
1947
23
6
26H
1 W
. S.
DeW
itt
1960
16
5
26J1
J.
Bongi
19
50
150
26L1
W
.Van
Aal
sti
1940
13
5
27A
1 J.
H.P
eeble
s.-
1943
14
0
27A
2 M
.S.W
hit
- 19
40
135
ake
r.27
A3
L.
G. B
onar
...
1939
13
527
G1
H.W
.Pet
er-
1949
12
5s
on.
27H
1 E
. E
. M
ecch
i. 19
51
130
27J1
O
.F.C
onne
rs.
1949
13
527
J2
O. B
luch
er
19
51
130
27M
1 G
. F
itch
. .
19
44
115
27M
2 Q
. C
ampb
ell-
192
5±
115
27M
3 C
. F.
Bor
be...
19
49
115
See
foot
note
s at
end
of
tabl
e.
291 m 102 74
Ox
Q
100 40 102
136
175
745
320 60 79 36
, 5
fifl
«0 50 fi4 fi7 56 63 100
100+ 78
D
D,
030-
16.
Da
D8..
T"i
Q
_K
T*
ft
D6
-
D8_
BU
L
BS
D
, 0
8..
B8
.
B6
B6..
B8
-
B6
T* a
B8
-
TS 8
B6
-
B8
--.
D 8
. ....
..
B8.
D 1
0--~
D6.....
50 186 43 234 98 165
270
545 30 40 60 48 55 54 48 f!8
\42 22
120
102 56 2 4 10 100
200
120 18 20 2 5 10 9 18 14
31
inte
rval
).
and
grav
el.
feet
).
Inte
rval
.)
Inte
rval
.)
sand
grav
el.
and
grav
el.
Gravel
-do
and
grav
el.
QT
ge-
.
Qya
l(?)
QT
ge,
Tsv
(?
).
QT
ge.
..
QT
ge
d
o
d
o
Tsv
(?).
~
do
QT
ge
Tsv
(?)~
QT
ge
... d
o.... .
d
o..
...
... d
o .
d
o
... d
o... .
....d
o .
.
... d
o..
...
d
o .
d
o
d
o -
... d
o
d
o
do
7-10
-49
10-
9-49
7- 3
-50
(11-
?-4
9 1
2- 1
-50
1 11-
21 5
2 I
4-13
-53
4-12
-51
11-2
1-52
4-
13-6
3 12
-19-
50
4-12
-51
2- 7
-50
9- 8
-50
9- 1
-60
6-16
-51
6- 6
-51
7-31
-50
10-1
1-50
12-2
2-49
4-12
-51
12-2
0-49
4-12
-51
12-2
2-49
11-
?-39
2- 7
-60
4-12
-61
1- 4
-51
jll-
28-4
92-
8-5
1
12-2
1-49
4-12
-51
1-24
-50
4-13
-51
'105
U43
'59
160 28
.25
57.2
5 24
.35
28.1
855
.76
26.4
1 J6
0 14.6
117
.75
14 >16
(1.4
)10
.65
120
>12 14
.41
6.04
11
.6 6.07
» 1
1. 6
5
121 7.
378.
43
112
124 18 11
.99
11.7
2.
54.
37
?66
I--" 70
Tsl
5
J1H 1 S J
3 14 J3 Jl J Jl
Ol
O J Jl
382 16 30 16 13
1,99
4 25 10 2 20 100 6 30 12 25
138.
5
25 180 80 20 '20
745 11 30 10 6
PS PS D D D D UN
D U D U Dy D
D,
irr
D U D D D D D D D U D
L.
O,
E,
L.
L.
00

Q ^ MO W jgj g Q **J ^ Wri 53
^ .^ ^r" g*w S 3 S W ^ S3 S o L ffwlrj 9 § »!!«!?'£« §8 in o &§. S.
| § r|| It f If ^
I If 1 | | 1 1 1 II S
s s §2 S s isliiis
2» C
dot
2g
to
Sand and silt ... Sand and gravel.
5" s1 5 :
t t?
E £! I-" )-«CC
0. *.p
sc
C.
8
s
g
1 , 8 38<|9fi88
3O O > n oo
g
to
a P c°p|l
a i
^ pu
O
ft5
rfik.^ ^U
Cn Cn Cn i^k t O H-* <O
« V->pi CO cnp
^
e o o o oo
CO Cn ^ &i
ij CD -ICO
0 Q OQ M HJ »-J M O -*
&i !Ml ere £. ere H '-I OT 3 JB CO
3 S 552,g £,& &
5 3 5 5 p 3 C
0
Q 0
ill i IsS
^-oop to H-OOO 14
i i
H 2 5= 2
s i
« jj8 g g i i
3fO
hi
0 0o e eo (.. d <» e e o e« '
f p JH JH JH f, JH tH £H pJH p
aB p
0
Io -t
Year completed
Altitude of land-surface datum (feet)
Depth (feet)
Type of well and diameter of casing (inches)
Depth to top (feet)
Thickness (feet)
Qcr
Geologic formation
Date measured
Distance above (+) or below land-surface datum (feet)
Water-yielding zone or zones open to
well
Water level
Temperature (° F)
Type and horsepower
Discharge (gpm)
Bailing or pumping rate (gpio> -
Drawdown (feet)
c S o
Results of tests
Use
Other data available
SIMTIVA<LKV VSOH VJJSTS JOT(INUHMK)

29H
1
29J1
29M
1 Jo
hn
son
..
. 19
43
90
29N
1 Q
. A
. Jo
nes
...
1943
90
29P1
29P2
29P3
Ja
ho
rsto
rfer
...
1950
90
29
Q1
C.
J. W
eln-
be
rger
.
San
ta R
osa
Nav
al A
ir
Bas
e.
Q.
A.
Jone
s. .
.
L.
E. D
eit
le.
Jah
ors
torf
er..
. S
anta
Ros
a N
aval
Air
B
ase.
d
o... .
. do. .
.T
. J. M
enne
d
o.
-
D. Q
ross
i..
L.
0.
Mos
es ..
.
S. J
ohns
on ..
..
C. D
ott
i..
.
Mo
rell
i
do..... .
C.
Dott
i. -
1939
1943
1943
1943
1942
1942
1950
19
25
1943
1943
1944
19
00±
1947
1951
1943
19
49
1943
1943
29R
1 .. d
o... .
1943
93
29R
2 . .do. .
1943
94
30D
1 T
.J. M
en
ne
1944
90
30D
2 d
o - 1
900±
90
3011
D
. Q
ross
i..
19
47
90
30E
2 L
.O.M
ose
s...
1951
92
30J1
S
.Johnso
n.
1943
95
30P1
C
. D
ott
i-. .
1949
85
30P2
M
ore
lli
1943
90
30P3
do..... .
.......
90
31B
1 C
. D
ott
i......
1943
85
See
foot
note
s at
end
of
tabl
e.
58 700 86 64 00 70 60 61
.7
682
801 62 35
.5
150
148 70 205 90 43 5
80
D6._
...
D,
G12
-10
D
8--
..
D
6..
..
D 8
.
D
6..
..
D
6..
..D
8-.
-.
D 1
2-10
.
D12
__._
D
6....
D
6..
..
D 8
.
D
6....
D
6..
..D
8--
D
8....
D
6....
D
6....
62 55 110
130
150
175
238
650
f 60
i
140
2 5 10 15 7 22 15 29 10 8
men
ted
0-20
ft.) grav
el.
Cla
y, g
rave
l, bo
ulde
rs.
and
grav
el.
grav
el.
grav
el.
grav
el; s
andy
se
dim
ent.
Cla
y an
d gr
avel
grav
el.
...d
o.....
...d
o..
...
...d
o
d
o
d
o
d
o
do
...d
o..
...
d
o
d
o
... d
o
do
do
OT
c«s
d
o -
d
o
d
o
d
o
do
TO
era
TQ
m(?
).
nTc«
s
d
o
...d
o
9- ?
-39
12-
1-41
12
-20-
49
4-12
-51
10-
4-49
4-12
-51
I 4-
4-5
2 12
-29-
494-
12-5
1
( 3
-8-4
2
U2-
20-4
9[
4-12
-51
- 1-
11-5
04-
12-5
1 5-
23-5
011
-17-
49
10-
4-49
19
1Q 4
Q4-
12-5
1
1 3-
3-5
1
12-2
1-49
4-12
-51
f!2-
1-4
1 {1
2-21
-49
I 4-
12-5
1 12
-21-
494-
12-5
1
112 8.
5 9.
60
2.79
22
.14
16.1
015
.48
12.2
65.
21
»1 9.87
4.79
19
/19
4.93
»6 1
0
Qd
20.8
6
26.5
121
.90
110 10
.45
84.8
1
"13
14
.96
7.25
10
.67
5.04
}---
\-
\-
31 T20
J 1
JH L J
T20
J P J J T5
T2 L
16 450 37 27 480
450 23 20 450 8
U60
192 35 25 90 40 33
D,S
PS
D,
irr
D
D,
S
D D U PS A D U D,
S
D DIr
r, 8 D U S
L.
C,
Cp,
L.
L.
L.
L.
L.
L.
W.
C,
L,
W.
L.
L.
L.
L.
L.
L.
L.
L.

i
g
§
§ iS. Kiendl. , A. D'Adam. ..
1 1
§§ §§
wCO <D52 g;
8 8 II 1
S
Oo0
*. -J*- Q> M O tO O
O OO 0
g ggg «gg g.o c5 co ~-i -<i c2)
» OJ
pr^ h^ [-H h^j tzjy M ^ O
tdi"1 W ^ ^^ W f^ ^
I| g e ||! 1 llj *B" S- § r*B *?i i i ! ! j ji§1 5 S I§ I 1 i
OCD <D CD (Dtp GO M 00 cnCO en en cnO o en en
fe§ 5 SB g§ S § S
0o
gco oiw *! e#
00 O OQ QQ 00
to
Sand and gravel.Coarse sand. ... Coarse sand _
3 O 3 3 O;q 3 O 3 5 O; ] B i j
r ? ?r £ t g & gs s s
g oo cso w
i
Ol
DO
CH
0
S
Cn
8
**>
000
a. a. i.
0X
i.
'^T'r*'' TV'T» -> <O h- <O >- CO
» Cri f-1 CO <O Cri O ^ O CO StS **3 OOO OJCOOI Men
£ S ^
«
CH
0X
i.
O O G0= 0= g
£> C>2, ^3^0^
H-t
sgsl g
cntocno o
:tr1
8
o oo b o° s -° g0 d o d CO ^ CD ^ CO
O ir1 Ftr1 tr1 Ir'tr1 ir1 ir'lr1 ir1 ir1 £
r
T. 7 N., R. 8 W. Continued
a p
o
80
Year completed
Altitude of land-surface datum (feet)
Depth (feet)
Type of well and diameter of casing (inches)
Depth to top (feet)
Thickness (feet)
O
1 1
Geologic formation
Date measured
Distance above (+) or below land-surface datum (feet)
Water-yielding zone or zones open to
well
Water level
Temperature (° F)
Type and horsepower
Discharge (gpm)
Bailing or pumping rate (gpm)
Drawdown (feet)
S1BV
Results of tests
Use
Other data available
TABLE 17. Description of water wells in the Santa Rosa Valley area, California Continued
SUL3TIVA<uscv vsoa VJLJSLVS .MIajsmoao

33N
1
33R
1
34K
1
34M
135
A1
35B
1
35O
1
35G
1
35H
135
M1
35Q
1
36C
1
36D
1
36D
2
Mrs
. J.
Kre
mes
ec.
J. M
arsh
all.
._
J. W
. C
ar-
roth
ers.
J.
W.
Mil
ler-
.
R.
O.
Phel
ps-
Tay
lor.
-___
---
H.
O.
New
-be
rry.
F
. T
. A
d-sh
ade.
R.
R. T
odd
1951
1951
1950
1951
1938
1949
1937
1948
1930
±19
50
1925
±
1951
1949
1946
95 100
115
105
155
140
135
140
150
120
120
180
166
165
74 70 62 45 102
133
114 52 270
152 75 194
140
252
D8..
._.
D8...-
D6..
.._
D6
...-
D8
...~
D8...-
B8-.
.-
D6._
...
D12-S
-.D
10-
D8
. _
D7^...
D8..
D8
..
[ 60 72 32 57 32 35
60 12
2 44 160
241
7 2 38 5 12 5 12 8 44 34 8
Coa
rse
grav
el..
and
grav
el.
grav
el.
Coa
rse
sand
and
grav
el.
San
dy c
lay
and
grav
el.
Sand
and
gr
avel
.
inte
rval
.)
...d
o..
...
... d
o -
d
o
... d
o
...d
o
d
o .
.
... d
o
...d
o
... d
o .
.
...d
o
-.d
o -
. d
o
...d
o
...d
o
QT
ge(7
).
Tsv
(7).
_.
I 4-
23-5
1
1-26
-51
6-2&
-51
11-8
-50
1- &
-51
1-24
-50
4-11
-51
12-1
6-49
7- ?
-37
10-
7-48
1-24
-50
4-11
-51
1946
4-20
-50
4-11
-51
&-1
2-51
1- ?
-49
1-24
-50
4-11
-51
6-24
-46
U2
112 6.
73
110
112 37
.66
34.2
9
123
120
130 16
.45
17.6
9 74
2 10.7
38.
34
123
46 47
.2
40.9
8 U
2
60
J# J LI
LI
JJs
T3^
T7^
LH J Jl
7
8 31 33 100 30 9 17 42
87 40 13 2433
0 '3 120 74 8
D D D D D Ind D D
D,l
rr,S
Irr
D,
S
D D D
L.
L.
L.
L.
L.
L.
L.
L.
L.
Op,
L.
L.
T.
7 N
., R
. 9
W.
7/9-
1C1
in 201
202
2F1
Seef
o<
P.
W.
Bus
s-
man
. D
an B
al-
docc
hi.
Mrs
. H
. M
euh.
.. d
o ....
John
Rue
d ....
>tno
tes
at e
nd
1944
1932
1939
tf ta
b]
90
100 70
65 100
e.
110 80 610
145
D10-.
..
D._
__
D12....
D12..._
D8--
.-.
Qya
l, Q
Tge
. Q
Tge.
..
Qya
l, Q
Tge
, Q
Tm
. Q
yal,
QT
ge
(?).
QT
ge,
QT
m
(?).
10-
5-49
12-1
0-41
12
-13-
49
4-10
-51
11-1
6-49
4-
13-5
1
11-1
8-49
4-
13-5
1
Fal
l 19
39.
12-1
0-41
18.1
1535
18
.89
15.2
5 14
.01
12.5
9
10.5
0 7.
60
130
"35
J3
T2
T20
J2
Jl
1,00
0
D,
Ind.
P
S.
D,
Ind
Irr
D
D,
8
>
%.
L.
L.
t
00
Cn

Cn O* d CJi Cn **» t*»->~? g [-H Q Q^ %
°|| |f||
5 S I I I
§ § g § gg i_i i_i 1-1
d
si!
?i
g
^
^
1
d d d d OO 00 OO OO
OO *- Cn en O CM
H* CO rfik-
o en to
Open-end casing. Sandstone __ _ _.do. . .. ..
s s p
Cn en en tn
CO Cn en 00
<1&1&3O>
-H M ^ H*
Sandstone.. ._,_
>
Dolph Hill, Sr. do... ..
tog
§§ ! S 1^> 5S p d
2. "* §* §
1 1>£*. t£t. rf*- -^ i^ ^k.
» So to 5 g g g
§ « g . S£ id d en oodera
§?
8
S B
Soft sand; sandstone.
CD
§CL
to
d
i & £> CL a H H 0 ? B B_
i J .,3
r T? Cn Cn C" O i * i *
to SJEto w en
-H
ts9
i
to
!
en
\
£
1 '
W
^.o? (^.
tr?
WCOfcO
d dd dOO OoS !-* . era f
Jo °°
5
to
?»» -
89 p 5?
fi» Hi ij H^
B
1 *
h-i W W W W *> <I t^O5 C" ^ [-*
g!-* Cn *> feO Cn Cn
-H ^ =H
5
5
|
M d d5 d cj d dcj > d d d P- 00
Ot-'^t^lr* ^ftn f rt Q .* ' > *
T. 7 N., R. 9 W.-Continued
p
O
o
Year completed
Altitude of land-surface datum (feet)
Depth (feet)
Type of well and diameter of casing (inches)
Depth to top (feet)
Thickness (feet)
Q
1
Geologic formation
Date measured
Distance above (+) or below land-surface datum (feet)
Water-yielding zone or zones open to
well
Water level
Temperature (° F)
Type and horsepower
Discharge (gpm)
Bailing or pumping rate (gpm)
Drawdown (feet)
d
Results of tests
Use
Other data available
TABLE 17. Description of water wells in the Santa Rosa Valley area, California Continued
ajsrv VSOH vusrvs HI HSLLV.M.981
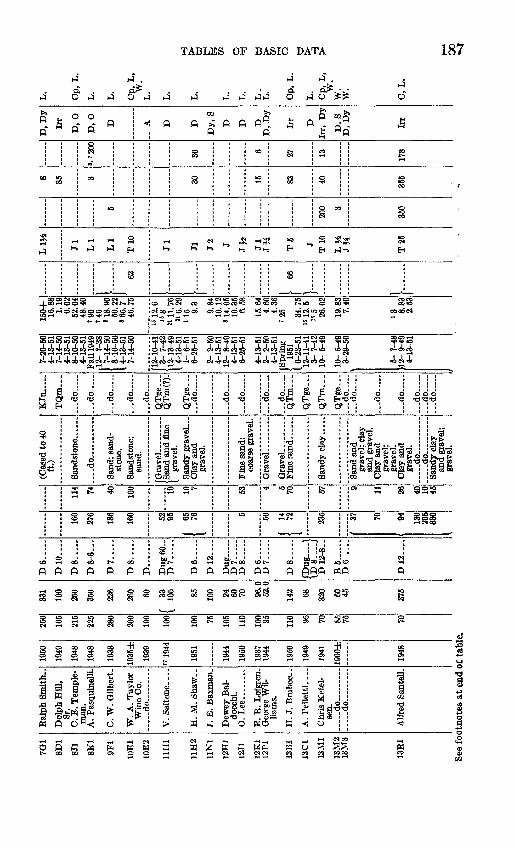
7G1
8D1
8J1
8K1
9F1
10E
1
10E
2
11H
1
11H
2
11N
1
12H
1
12J1
12K
112
P1
13B
1
13C
1
13M
1
13M
213
M3
13B
1
Dol
ph H
ill,
Sr.
man
.
C.
W.
Gil
bert
.
W.
A.
Tay
lor
Win
e C
o.
....
.d
o ..
...
V.
Sai
tone
- ...
H.M
.Shaw
..
J. E
. B
axm
an.
Dew
ey B
al-
docc
hi.
0. L
ee.
Geo
rge
Wil
li
ams.
H.
J. B
rabe
c-.
A.
Pel
lett
i. ...
Chr
is K
etel
-se
n.
..... d
o
....
.... .do ..
. .
Alf
red
San
tell
.
1950
1949
1948
1948
1938
1935
±
1939
"194
4
1951
1944
1950
1937
1944
1950
1949
1941
1900
±
1948
250
105
215
225
280
200
190
100
100 75 105
110
inn 95 110 95 70 85 75 70
331
100
250
350
226
260 60
/ 33
X 10
5 85 100 24 60
70 96.0
52.0
142 68 320 60 45 375
D 6
D10. _
D8..
...
D8
-6..
.
D7
D8-
D.
Dug
60
-D
7
D6.
Du
g
D7
D8
_
D6.
D7. .
D8.-
/Dug 1
\D8. /
D1
2-8
-.
B 5
..
.D
6..
...
D12..
..
160
276
186
160 52 95
1 76
I 76 5 50
( 14
J 70
I ' 235 37
70
04 130
265
330
114 74 40 100
""1
6 10 7 53 4 5 70 57 9 11
26 40 10 45
ft.)
.... d
o... .
... .
...
Sand
; san
dst
one.
Sa
ndst
one;
sand
.
[Gra
vel
{Sa
nd a
nd fi
neI
grav
el.
Sand
y gr
avel
...
Cla
y an
dgr
avel
.
Fine
san
d:co
arse
gra
vel.
Gra
vel .........
Gra
vel _
___
Fine
san
d .
Sand
y cl
ay. .
Sand
and
gr
avel
; cla
y an
d gr
avel
. C
lay
and
grav
el;
grav
el.
grav
el.
__ do
_____
do..
.. ..
....
Sand
y cl
ay
and
grav
el;
grav
el.
KJu
.....
... d
o
... d
o
...d
o.....
... d
o
... d
o
QT
ge...
Q
Tm
(7).
QT
ge...
... d
o
... d
o
... d
o
d
o
QT
m ..
.
QT
ge...
QT
m
_ d
o
... d
o
do
....
.
... d
o.....
...d
o.....
... d
o
...d
o.....
7-20
-50
4-13
-51
7-14
-50
4-13
-51
8-10
-50
4-13
-51
Fal
l 194
9|1
2- ?
-38
1 7-
14-5
01
8-10
-50
I 4-
13-5
1 7-
14-5
0
I^V
^
I 4-
13-5
1 1-
6-5
1 6-
26-5
1
2- 2
-50
4-13
-51
12-
8-49
4-13
-51
6-26
-51
4-13
-51
2- 2
-50
4-13
-51
i 19
51I
6-23
-51
12-1
1-41
3- 7
-42
10-
6-49
10-
5-49
3-29
-50
5- ?
-48
12-
9-49
4-13
-51
150+
16.8
81
10
0.02
52
.04
48.4
0 i o
n'4
6
818.
9050
. 22
865.
7 46
.75
"12
.615
g
21 1
1. 7
6 «
6.2
9
115 9.
3
9.84
10.1
2 8
14. 0
510
.35
6.58
1 *\
fi
d.
4.60
4.36
'2
5 34.7
5 i«
12.
51
55 26
.02
19.8
37
40
13 8.83
2.53
J
62
i 66
> 1
LIJ
i
Jl
LI
LI
T10
Jl
Jl J2 J Jl
JH T5 J
T10
LJ4
T2
5
5
200 3
350
85 3 30 15 83 40 355
».'2
00
in 6 27 13 178
D,
Dy
Irr
D,
O
D,
0
D
.. A D D
Dy,
S
D D DD
, D
y
Irr D
D,
SD
,Dy
Irr
L.
Cp,
L.
L.
L.
Cp
,L,
W.
L.
L.
L.
L.
L.
L.
L.
Cp,
L.
L.
Cp,
L,
W.
W.
W.
C,
L.
See
foot
note
s at
cud
of
tabl
e.
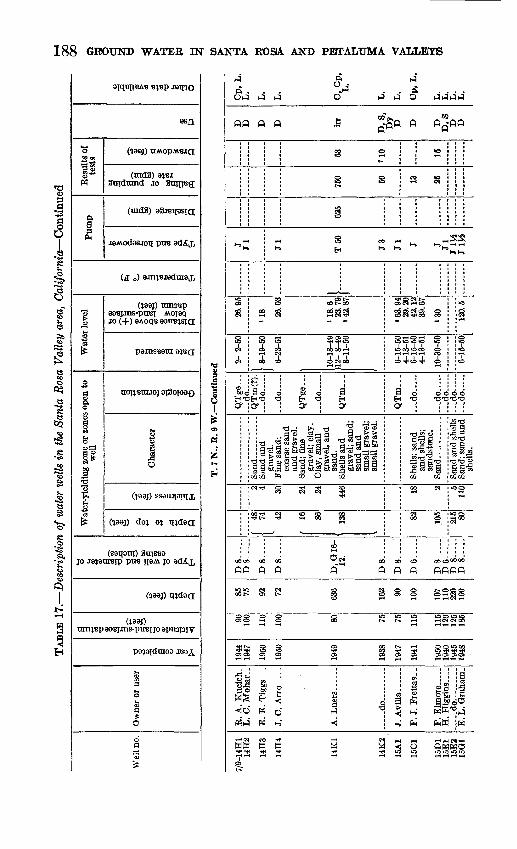
^i Cn Cn Cn en en ^ >*» rf* >£ rf^. i4*.
i tOh"»i-i i-1 "-1 to i-1 ^ CO tOl
^ft'w'^ -JH « a '^ -° W o'^
Iff! a ? ° S . i g »I; f f p j | f f niiii 111 1 i i si»fcOfcO» l-» -<I -<I QO OH- O®<5cnOCn cn cn cn O o O OO
I8i§ §8g i BS3,OOxoo
gg
Sen
Sand and shells Sand; sand and
a a.
£
iOi
Ss
oo o 3s 00 G3
o oo 01 tO
to oo
Shells; sand and shells; sandstone.
Sand ____ ..
a. a. ft ^s o
O00
3
Oi 01 en en 01
****
* ^
Cn »
5
-
0 O O O30 ***Gi °° °°
OO O3 5 tO 1(^00
OS ** fi^ O ^ tO
O2 Q «2 h:J O2O2
H ft ^ ft ftH
Bo EJQ o o a 1 O >>P
I-* H- 1
1 it
^cooo p oo 2S305 g
CO g H.
to
s i
O CO
030
aD
0 oo
0HrqCD
1=
5
:-
O0°0 0 0^ ^ 0 0 OO
r'lr'ir't* o t* f o tr1 jr1 {^Q ? ' TO ' ' ^
T. 7 N., R. 9 W. Continued
^p o
O^ p 3 o»^
^
Year completed
Altitude of land-surface datum (feet)
Depth (feet)
Type of well and diameter of casing (inches)
Depth to top (feet)
Thickness (feet)
O
1
Geologic formation
Date measured
Distance above (+) or below land-surface datum (feet)
Water-yielding zone or zones open to
well
Water level
Temperature (° F)
Type and horsepower
Discharge (gpm)
Bailing or pumping rate (gpm)
Drawdown (feet)
«
Besults of testa
Use
Other data available
s?a
g?
oI 1*
ativ VSOH VJLMVS inOMIOHO 88 x
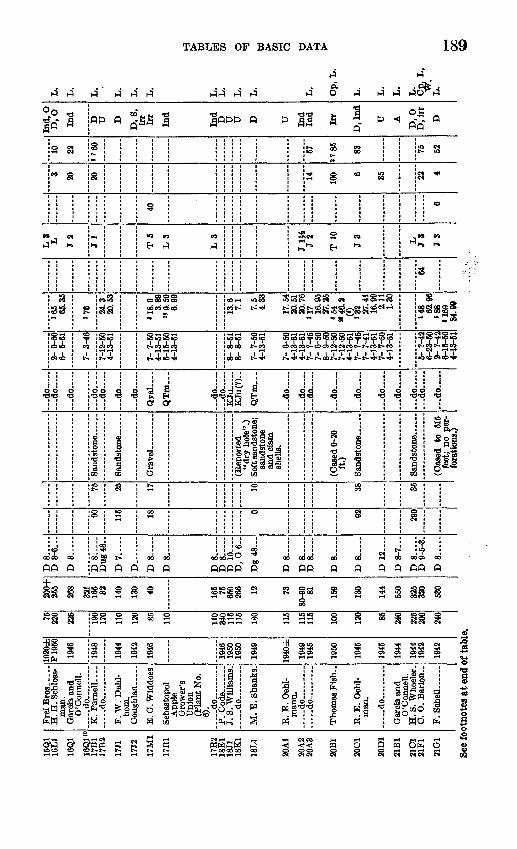
15Q
116
L1
16Q
1
16Q
1»17
B1
17B
2
17J1
17J2
17M
1
17R
1
17R
218
E1
18J1
18K
1
18L1
20A
1
20A
220
A3
20B
1
2001
20D
1
21B
1
21O
121
F1
31G
1
man
.
O'C
onne
ll.
.d
o
K. P
arae
ll ....
do..-
F.
W.
Dah
l-bo
m.
E.G
.Wid
does
App
le
Gro
wer
's U
nion
(P
lant
No.
6)
. ..
. .. d
o .
P.
Cod
e.. _
_ .
J. 8
. Will
iam
s.
do..
....
...
M. E
. Sha
nks.
R. E
. O
ehl-
mau
n.
d
o.
d
o
Tho
mas
Fis
h..
R. E
. O
ehl-
man
.
....
.do
....
....
.
O'C
onne
ll.
H.
S. W
heel
er.
O.
O.
Bar
ton..
F. S
chell
1920
±P1
950
1946
1948
1944
1942
1946
1946
1950
1950
1949
1940
±
1949
1945
1950
1945
1945
1944
1944
1942
1942
75 220
225
190
170
110
120
110
110
340
115
116
180
115
115
116
100
120 85 240
225
200
9.4f
t
200+
255
268
321
165 32 14ft
130 40 165 75 650
266 12 73
80-9
0S
I
159
130
144
550
325
320
530
D 8
D 8
-6
D 8
.-
D 8
Dug
48
-
D 7
D .
.....
D 8
Do
Do
Do
D 1
0
D, G
6-
Dg
48
DQ
Do
DQ
DQ
DQ
D1O
Dft
-7
Do
DQ
-K-3
D 8
90 115 18 0 O9
9Qft
76 25 17 10 38 35
"dry
hol
e".)
sand
ston
e an
d cl
am
shel
ls.
(Cas
ed 0
-20
ft.)
(Cas
ed
to
615
feet
; no
per
fo
ratio
ns.)
-.do..
...
d
o
do
..
d
o.
... d
o.
.
... d
o
...d
o..
...
Qyal
QT
m...
d
o.....
d
o
KJu
.....
KJu
(?)_
.
QT
m.-
do
....
.
...d
o.....
d
o
d
o -
d
o
do
....
.
... d
o..
...
... d
o
... d
o
...d
o.....
2-9
-60
6- 5
-51
7-3
-46
7-I£
504-
13-5
1
7- 7
-50
4-13
-51
5-15
-50
4-13
-51
8-8-
518-
8-51
7- 7
-50
4-13
-61
7-6
-50
4-13
-51
4-13
-51
7-?
-45
7-6-
50
8- 9
-50
7-12
-50
7-12
-50
4-13
-51
7- ?
-45
7-7-
41
4-13
-51
7-7-
504-
13-5
1
5- ?
-42
6-23
-50
2-?
-42
6-15
-50
4-13
-51
165 65
.35
»76 24
.320
.53
<18
.93.
89
"9.5
06.
99
13.6 7.1
7.5
4.33
17.5
420
.51
20.7
6»1
7 16.9
5 27
.25
<54
M40
.2,<?
,27
.41
16.9
9 2.
111.
30
148 62
.95
188
U69
84
.99
*u
L3 L J 2
J 1
T 5
L3
L 3
J 1W J 2
T 1
0
J3 L 3 3
J 3
40
6
3 20 20 14 100 6 35 22 4
10 22
"60 57
«'8
5 83 76 52
Ind
, O
D,
O
Ind
D U D
D,
8,ir
r Ir
r
Ind
Ind D U U D U Ind
Ind
Irr
D.I
nd U A
D,
OD
.irr
D
L.
L.
L.
L.
L.
L.
L.
L.
L.
L.
L.
Op,
L.
L.
L.
L.
L.
Op,
L,
W.
L.
See f
ootn
otes
at e
nd o
f tab
le.

1
MO
^J
3 £7 i- *»i- i-1"* cota
Q td Q W OH ^W £ * eeoo" '
r? 1 ' 1 IP^I * i * i
1 § i 1 I 1 i IIa s a a g S gg gg
s is g 1 § SgfiKbe>
en
O«
s3I
b
^fi
b o b b* J»Sjp So
s
Silk * * H*OO 001^ So en -ai-> Sits
^ t? t? o« W h^ h^ O to to Ooi-> -4Cn
(B O °° C Nil g"1?!
S-P S*" 9 £ "" OO ' 9'i-'3,a>SDI SOS'S
' &IIg|l| « ^&i ^! "* pi§ sLp* 5" ' P*S"'PJ**"* j i QO >
o i :!!:;; h^ pi li pi pi pipi Pipi SO 5 O O O O O O
1 ! ! ! ! ! j
i i i i i i i
Ilii i i irWg
l-**. fcocn
is i s P(x5 00
S 2
1i
b "
""* ?3 g
g& O
Ub b
i 1O OO
Sandstone ...... Sandstone ...
P<P< P- 99 3
T
i
;-:
OO
g
b
3
H
N3
j« » « » «»!-=H fs ^< Q fi t^tr* bt*^
T. 7 N. f R. 9 W. Continued
0 o
S
Year completed
Altitude of land-surface datum (feet)
Depth (feet)
Type of well and diameter of casing (inches)
Depth to top (feet)
Thickness (feet)
Q
Geologic formation
Date measured
Distance above (+) or below land-surface datum (feet)
Water-yielding zone or zones open to
well
Water level
Temperature (° F)
Type and horsepower
Discharge (gpm)
Bailing or pumping rate (gpm)
Drawdown (feet)
I
Results of tests
Use
Other data available
QKV VSOH VJ^EVS NI06 T

quis
t.
.do,
Fre
d H
ardi
ng.
do .
Gin
o B
. R
ossi
.
..d
o.....
W.
A. D
uer
Rut
h W
.Fi
nley
.
Rut
h W
.F
inle
y
Coo
p.
Seba
stop
ol
App
le
Gro
wer
sU
nion
(P
lant
No.
5)
.....do .
.. ..
.
L.
H. W
ells
wal
d.
IQcn
1940
1945
1040
1047
1046
1050
1048
1051
1041
5
1Q4Q
1044
1035
±
1044
1046
1040
1951
1040
1945
66 70 100 05 100
100
100 80 05 00 85 80 100 75 145
165
150
170
m
30,6
150
140
330
160
145 63 86 256
138
140
190
206
146
110
260
370
200
185
154
T> 8
D8
....
-
D8
-
D.G
IO.
D 1
0..
..
D8 -
D6- -
D8
-
D8
-
D8~
...
D7 ..
D8 -
D6
-
D8--
D8
D.G
8--
D8 -
D8.
D8
-
37
65 05 581
"I
65 90 190 35 12 0 90 110
11
22 37 5 10
20 16 16 110
248 47 280 44
Cem
ente
d gr
avel
. Sa
ndst
one;
grav
el;
grav
el.
Sand
ston
e;
grav
el.
Cla
y an
d gr
avel
.
San
d.
..
..
do...... ..
..
clam
she
lls."
clam
she
lls;
sand
and
gr
avel
; sa
nd.
Sand
and
gr
avel
; qu
icks
and.
grav
el a
nd
sand
.
Sand
ston
e an
dsh
ells
; sa
nd
and
shel
ls.
QT
ge QT
m.
QTg
e(?)
_
QT
ge,
QT
m
QT
ge.
..
do
QT
m(?
).
QT
ge.
.. d
o..
...d
o .
.Q
Tm
...
....
do
r^
T^c
ro
...d
o....
-_.d
o .
.Q
Tm
...
d
o
...d
o... .
.
... d
o
...d
o
...d
o.....
d
o
...d
o..
...
do
ll-
1-50
4-13
-51
12-
6-49
4-18
-51
11-3
0-49
4-18
-51
4-18
-51
12-
6-40
4-18
-51
7-27
-50
! 2-
2-5
0
4-18
-51
4-31
-51
12-1
9-40
4-18
-51
4-12
-50
4-18
-51
4-12
-50
4-18
-51
4-18
-51
5- ?
-51
6-23
-50
4-18
-51
14.2
17.
04
11.0
511
.10
17.
320
.47
a 33.
30
30.
27
40.6
9
110 0.
15
7.34
19 20.1
717
.48
10.0
320
.30
10.6
327
.50
26.4
0
»0 10.6
27.
33
02*i
J2 J3 J
LI
T2
Jl
J2 Jl J
T7tf
L Jl
130 60 17
a>60 350
100 60 100
300
100
a 12 35 '30 30 100
D S
D,S Irr D U D
D,D
y
D,S
D,S
D,S
D,S D U D Ind
Ind
Ind
D,O
D,S
Cp,
L.
L. L. L.
L.
L. L.
L. L.
L.
L. L. L.
L.
L. L.
L. L.
L.
23Q
1
23R
1
24L1
24L2
24M
1
24M
2 24
M3
25A
1
10 25
A1
25H
1
25J1
25
R1
26M
1
26N
1
26P1
26P2
27
E1
27E2
27F1
27G
1 27
J1
See
foot
note
s at
end
of t
able
.

>, O *
tg fcg
Q W
O O
O 0 0 O O O(O (O to O (O
sg
X
|' f°ag.g
ifc. *.
83
H3 «H
8 S
otr<QQQ a -a w
££ w
saw Q
OO O0000 01
Fre gr
§ §
tit -^ OO
cncn
++JOfSoo
g
1u p
o
S S
Year completed
Altitude of land-surface datum (feet)
Depth (feet)
Type of well and diameter of casing (inches)
Depth to top (feet)
Thickness (feet)
Q
1
Geologic formation
Date measured
Distance above (+) or below land-surface datum (feet)
Water-yielding zone or zones open to
well
Water level
Temperature (° F)
Type and horsepower
Discharge (gpm)
Bailing or pumping rate (gpm)
Drawdown (feet)
»tf
a
Results of tests
Use
Other data available
ONLV VSOHHSLXVAV. cuiaoao

30G
1
30G
2
30H
1
30J1
30K
1
31A
1
31J1
31L1
31Q
131
Q2
31Q
3
32E
1
32F1
32F2
32
01
32H
1
32Q
1
33A
1
33D
1 33
D2
33F1
34B
1
3401
34J1
Ele
anor
Kue
d.
do.
V. W
ell
s
Bru
ce
Fred
er
icks
. G
eorg
e B
utle
r.
G.
Pri
gmor
e..
D.
Kla
uder
...
M.
Am
eral
....
Mar
tin _ ..
...
Pey
ser.
.... ..
.
Will
iam
W
ierd
sma.
C
. M
elli
nger
..
R.
E.
Dor
an.-
T.
Lud
lam
_ .
Don
ald
Mar
ti
n E
. M
arsh
.. ..
.
C.
A. A
ltm
an.
Cap
t. A
. T
. Sw
anso
n.
Sara
h So
llars
.. L
. C
. M
ille
r..
L.
B.
Wal
ker.
G. A
. P
age.
J. D
. H
orn-
bu
ckle
. H
. A
. H
utch
- in
son.
1949
1949
1947
1948
1944
1946
1960
1948
1944
1947
1947
1945
1944
1946
19
47
1946
1947
1943
1945
19
47
1946
1935
±
1951
1940
155
200
210
285
375
410
465
500
480
450
470
485
390
395
290
245
205
225
170
155
165
200
195
190
m 200
100
m 140
240
352
m 235
IfiO
250
200
182.
0
365
180
170
140
?45
170
300
200
160
358
230
D14_...
D 1
2. _
D
6....
D
8__.
_
D 6
.
D
8-6
..
D,
G6..
D
6...-
D
7..
..D
8
..-
D 8
.
D 8
.
D
7....
D
8-6
..D
ug,
D6.
D
8...-
D
6....
D
7..
..
D 8
..-
D12....
D 8
..-
D
6....
D
8-6
.-
D
8....
0
160 fin
' 40 18
5
296 8 90 170
80 90 15 160 0
349
100 40 60 22 56 56
112
145 20 100 77 125 10 200 9
ft.;
perf
orat
ed
.)
(Cas
ed t
o 11
4ft
.)
soft
sand
.
..d
o- -
.
clam
she
lls.
cont
aini
ng
stre
ak g
rave
l.
sand
ston
e."
belo
w 5
ft.)
belo
w 8
ft.)
belo
w 6
ft.)
.do..
sand
.
ston
e.
torn
; no
per
fo
ratio
ns.)
Coa
rse
soft
sand
ston
e.
(Cas
ed to
204
ft.)
Qya
l (?
),Q
Tm
.
QT
m...
...d
o....
...d
o.....
...d
o..
...
do
....
.
do
...d
o..
...
-.d
o..
...
d
o
... d
o
d
o
d
o.....
do
...d
o..
..
...d
o .
.... d
o
... d
o... -
d
o
.
...d
o
... d
o
do
... d
o
... d
o..
...
do
do.....
6-23
-50
4-18
-51
7-6-
504-
18-5
1 6-
4-5
04-
10-5
1
6- 4
-50
4-10
-50
2- ?
-56
5-4
-50
^ 4-
10-5
0
4-27
-50
4-10
-51
4- ?
-44
6- ?
-47
Fal
l 194
94-
1-5
1 7-
?-4
5
4-25
-50
4-10
-51
7- 6
-50
4-10
-51
7- 6
-50
4-10
-51
4-25
-50
4-10
-51
4-13
-50
4-17
-51
4-13
-50
4-13
-50
4-11
-51
4-11
-51
6-23
-50
4-11
-51
3 28
4'2
1.2
6
35.8
733
.76
8.87
8.10
51.7
08
81. 9
1 »8
5 86.7
086
.91
46.1
542
.21
7071
4
?145 68
.5
U80 12
7.80
126.
6
67.1
764
.67
76.9
577
.06
1.85
2.96
"3
6+
818.
23.
70
34.6
530
.97
140 53
.147
.71
61
J5 JH L L LI
J LI
LI
Ll^ Jl
LI
L Jl
J3 T2
L L2
40 7 13
13 10 8 5 7 26
45
'100
J?20
5
30
Irr U D D
D
D,
0
D D D D D D D D D
D,
irr
D U o Irr
D,
irr
D,
S
D
D.I
nd
T, T, T, T, T, T, Cp
T, T, T, L,
T, T, T, T, T, T, T, T, Op
r\v
T, T, T,
I 00 § I I
See
foot
note
s at
end
of t
able
.C
O
00

SCO CO CO en en en
g S2 3
1 S a
IF? p. 1 1
HJI-' I-"
w enen S
g ss gg; s s |
^ Ht^ ^dt^ O y 2 ^-HO * " fc_t " QQfi»
§|^p W? >-|< W
01 s* B'sr 5" g.
III II 1 i 1CO 01 CO COO O O -JlCn O Cn CT* O O O Cn
as 5 ggg SSSSi0 0
s
Sand; gravel and sand; clam shells.
? ?
tttv
Sg:J
f «H
en co
K
^ 0oo
U»
5 i
itf&liHp.
GO
1
0* 3*
C5Se?
O
2.
ttt
ooo oto
- H
S^
t) t)X) OO
1
8
CO
Sand; sand and clam shells; gravel sand, and clam shells.
s. p. » P
0 U U U39 en oo oo
i Cn i
CO CO 0 3 0
S en 8
(Perforated interval.) Sand. ____ .. Soft sand;
sandstone.
s. P4 s. i-3
tJJUJJ f
o H* o H* o H* o 35
COJOgJOCOgg «
SgSc^Efe"
*H<H t4 *^
o
S 8
§5 g
0 Ud U U -UU -UU 0 B. g O GD1^ ^*>* » *
tr1
T. 7 N., R. 9 W Continued
$ & go
8 8
Year completed
Altitude of land-surface datum (feet)
Depth (feet)
Type of well and diameter of casing (inches)
Depth to top (feet)
Thickness (feet)
Q
t
Qeologic formation
Date measured
Distance above (+) or below land-surface datum (feet)
Water-yielding zone or zones open to
well
Water level
Temperature (° F)
Type and horsepower
Discharge (gpm)
Bailing or pumping rate (gpm)
Drawdown (feet)
>-d
o
Results of tests
Use
Other data available
S2L.3TIVAdJKEV VSOH ViHVS JO HHiVAi. (LNUKXHD

36R
1
36A
1
36F1
36Q
1
36H
1
36M
1
Bar
low
Bro
s..
J. E
qult
khan
- of
l.
W.
L. H
ep-
wor
th.
....
.do
....
....
.
J. E
quit
khan
- of
f.
Seba
stop
ol
Mea
t C
o.
1048
1041
1049
1960
1937
60
85 85
SO
85
70
00
46 270 80
568 88
D 1
0..
..
D 4
....
D,
Q 1
0.
D
8..
..
D,
Q 1
2.
D
8..
..
42
/ 40
60 16
0 20
0 (70
280
28 5 00 18
70 32
230
Sand
and
gr
avel
; gr
avel
; san
d,
clay
and
gr
avel
;
Fine
gra
vel;
larg
e gr
avel
. R
iver
san
d __ -
Fine
and
co
arse
gr
avel
; qu
icks
and.
Gra
vel ..
Sa
ndst
one;
gr
avel
and
sa
nd; s
and.
...d
o.....
QT
ge...
...do
..__.
QT
m..
. do
.....
OT
ep
...d
o.....
QT
m..
.
4-12
-60
4-10
-51
12-2
9-49
10-
4-49
'l2-
1-41
10
- 4-
49
12-2
8-49
7-
14-5
0 11
-10-
50
4-10
-51
8- ?
-37
12-
1-41
3-
7-4
2 10
- 4-
49
4-10
-51
.5
1.18
13.7
7
31.3
5
is 14
« 3
2. 5
5 26
.96
115 24
.60
13.2
7
W 14
is
9 « 1
6. 5
1 81
8.20
L
T25 T5
460
550
100 33
26 40
34
XT 8 LT
D,
Dy
LT
Ind
L.
L.
Cp,
L,
L.
L.
T. 8
N.,
R. 8
W.
8/8-
5P1
17L1
18E1
18F1
18F2
E. R
ich.......
Mrs
. A
. B
last
.
Mrs
. L
. Pr
octo
r.
.....d
o........
1960
1947
1960
1039
310
185
125
130
130
147
278
147
120 16
D
8..
..
D
8..
..
D
8..
..
D
8..
..
Dug
48.
.
90
13
5 80
35
10 67
Cla
y an
d gr
avel
. C
oars
e sa
nd;
cem
ente
d gr
avel
.
"Loo
se b
og",
sa
nd a
nd
grav
el; s
and
and
grav
el.
QT
ge...
...d
o.....
...d
o.....
...d
o.....
...d
o..
..
6-22
-50
3-28
-51
5-?-
47
4-21
-50
7-22
-50
5-25
-51
9- 7
-39
4-21
-50
4-12
51
fll-
10-4
1 I
3- 5
-42
1 4-
21-5
0 I
4-12
-51
125 18
.53
1103
74
.8
140 22
.76
132 22
.85
16.2
5 is
11
"1.4
3.
5 .02
} 1
J L3
Jl
6
37 10
20 25
35 132 SO 30
8
D,O
D
D,
O,
8. V
Cp,
L.
L.
L.
See
foot
note
s at
end
of t
able
.C
O

i s § I 1 i IE EF $ F § .* < p F p
1 1 II i 1 i i1 § is § S § s
1 * sn Ss35d 0 U U OOOOO
O» 00 0> h- 00 00 00 i O ' *
tO I ill
i gg 4 ^ i g ga ^5 ss s ! » s
!1}|! "¥ V-PL 8s S ? 9 ' i £.
i i i i i : i g> Q, 1>P- P. & &J lj PJ PJ >J
oao °P P9 P pin
t£ T t^tis ^t£ ? ?
rf S ^ 5i.5S
i j 1
^ ^ « *H ~>«VH««" __ ^ ^ "
J J
i si g § s! i->
O U O w t) "L, 0 5* L. U U
Q t* t* IT* tr1 t*"P * ' <! ' *
T. 8 N., R. 8 W. Continued
1g
O
o
Year completed
Altitude of land-surface datum (feet)
Depth (feet)
Type of well and diameter of casing (inches)
Depth to top (feet)
Thickness (feet)
Q
S
Geologic formation
Date measured
Distance above (+) or below land-surface datum (feet)
1
er-yielding zone or zones open to
well
3>-lS"
a
Temperature (° F)
Type and horsepower
Discharge (gpm)
Bailing or pumping rate (gpm)
Drawdown (feet)
a
Besults of tests
Use
Other data available
Hw
i t -a
1S? §to
5"s-
1toog |
I
|1-I
am visas vuscvs in HHXYM. atiaoao 961

19N
1
19R
1
20B
1
20B
2
20D
1
20E1
20
E220
F1
20Q
1
27K
1
29C
1 29
C2
29D
1 29
E1
29G
1
29G
2
29G
3
3001
30E1
B.
Gri
ggs
Matt
el
E.
D.
Sea
ton.
.
...d
o- .
J. H
enni
ngse
n.
d
o... ..
.
Ann
Ber
g .....
H.
A.
Fau
ght.
John
Gre
pe. .
.
Wag
gone
r- ..
..
M.
O.
Ells
- w
orth
. C
. B
. H
urs
t...
W
. D
. W
at-
ters
on.
Will
iam
s an
d R
ice.
M.
Ras
mus
- se
n.
R.
L.
Hin
ch-
man
.
C. W
ulf
.
W.
W. H
owe.
.
1951
1950
1944
1946
1949
1944
± 19
3819
50
1950
1949
1950
19
51
1951
19
50
1950
1950
1951
1950
1960
±
105 12
0
190
185
145
145
145
150
140
180
136
135
125
125
140
136
135
110
110
249
130 88 231
260
MIOO 10
010
1
310
117 68
63 57
51 81 68
67 154 54
D, Q
10.
D 1
0
Do
Do
D 1
0..
..
Do
Ba
Da
D,
G 1
0.
D,
G 6
..
Da
Da
D 6
.....
Da
D 7
#
D 6
.....
Da
D10
T> 8
27
105
160
200 20 AQ
nt\
n
OA
60
60
Kf\ 15
J 36
1 C
A 45 63 47
1 " 94
I
142
18
n OR 49
110 40 275
QA 10 14 8 3 17 8 6 11
Pack
ed f
ine
sand
y gr
avel
: co
arse
pac
ked
grav
el.
and
coar
se
sand
. Pa
cked
coa
rse
grav
elly
san
d.
coar
se s
and;
co
arse
gra
vel.
and
grav
el.
grav
el; g
rave
l.
grav
el.
sand
; gra
vel
and
som
e cl
ay: g
rave
l.
...d
o .
....
...
grav
el.
Pack
ed m
edi-
fine
grav
el.
Gra
vel.
. d
o.
grav
el.
Sand
and
gr
avel
.__ d
o.. _
_ ..
Sand
. _____
and
sand
.
d
o.
... d
o....
... d
o
d
o.
... d
o....
... d
o
d
o
... d
o
...d
o
... d
o
...d
o
-..d
o--
..
Qya
l,T
sv(7
).
OT
ee
d
o
...d
o
... d
o
d
o
... d
o
... d
o
...d
o
...d
o.
...d
o--
..
...d
o. .
..
...d
o.....
I 4-
19-5
18-
30-5
1
4-21
-50
4-12
-51
11-2
2-44
5-25
-51
8-15
-46
5-25
-51
4-28
-50
11-2
1-49
2-28
-50
12-1
6-50
6- 7
-50
8-30
-51
11-2
1-50
...d
o...
1- 4
-51
6-15
-50
1 7-
20-5
0
1*>
O*>
KA
2-2-
51
19- 3
-50
6-21
-51
»12 17
.30
7.95
8.68
17 10.8
»3
5 55.9
4 38
.02
36.8
816
.63
"50
» 20
U03 '30
130 18 »7 18
1 Q
A >8 U6
MS.
6
[......
.
70 65 162 66
T 5 J
1
L 2
T7J
S
J3 L J
T40
JH 3 J J 3K 3
i T
15
290
210 6 20 200 15 300 20 20 30 17 10 30 200
61 «100 60 120
»,«1
60
20 10 10 10 16 30 10 on 35 84
Irr
Irr D
D, O Irr
S, O
D, O D Irr D
PS PS Irr
D
L. Cp,W.
Cp.W.
L. C, Op.
L. L.
L.
L.
Cp,
L.
L.
See
foot
note
s at
end
of t
able
.C
O
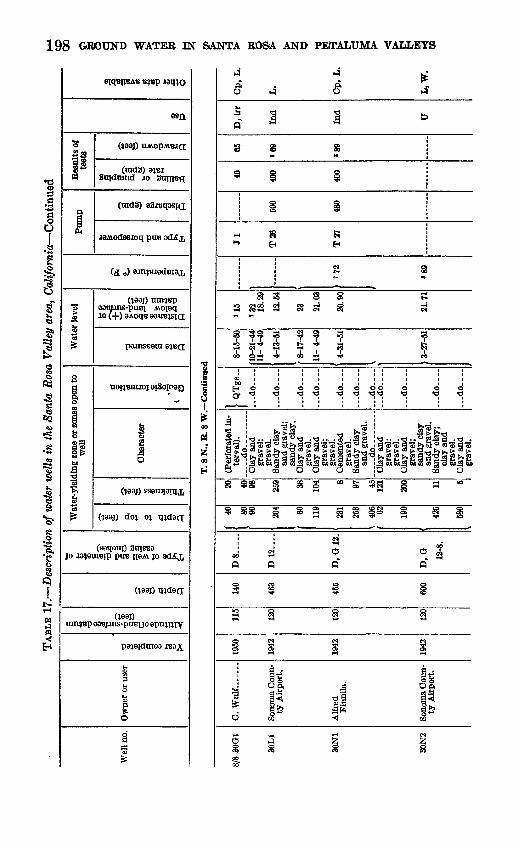
Q g0 0*OQ O
"
S3 E- S» !- <P O
Q O! » Q O Q m§?mm£i;S*^m3*^rt^Q.m PSS*^3*^£-
§ § p, <OO 1-3
?
8 g
3 » cg
O
*1
s-1
Year completed
Altitude of land-surface datum (feet)
Depth (feet)
Type of well and diameter of casing (inches)
Depth to top (feet)
Thickness (feet)
Q
s-
Geologic formation
Date measured
Distance above (+) or below land-surface datum (feet)
Water-yielding zone or zones open to
well
Water level
Temperature (° F)
Type and horsepower
Discharge (gpm)
Bailing or pumping rate (gpm)
Drawdown (feet)
0
Results of tests
Use
Other data available
QNV won VXMVS JOT861

31B
1
31D
1
31L
1
32Q
1
3202
33A
1
33D
1
33D
2
34L
134
Q1
36H
1
A.
Qil
ardo
ni..
Dol
phC
amill
i. W
. B
. W
ood.
.
A. H
. D
uk
es
A.
H.
Duk
es. .
Fin
ley
Ran
ch.
Mar
k W
est
Uni
on
Scho
ol.
. d
o-__
Kie
rgaa
rd.. ...
J. W
. A
nder
-so
n.
Wal
lace
Scho
ol
Dis
tric
t.
1947
1948
1950
1950
1939
1950
1951
1948
1942
115
110
110
140
140
180
150
150
225
345
375
210 89 46 53 102
127 40
.7
85 285
136
D8
....
.
D 1
0 .
D8..
._.
D6
.--_
.
D..
..
D8
..
D8-~
.
D6
-
D6-.
..D
8-6
--
D8--
_.
188
{ "
1 4f
t
40 116 80
18 6 6 12 11 5
and
grav
el.
Sand
and
.d
o-.
...d
o....
...d
o..-
...d
o..
..
... d
o..-
... d
o-.
~
... d
o..-
... d
o..-
do
....
5-3-
4711
-18-
49
4-10
-51
11-1
8-49
4-11
-51
11-1
8-49
4-10
-51
ll2-
23-5
0
12-2
1-50
6-12
-39
4-21
-50
4-12
-51
5- 1
-50
3-15
-51
4-12
-51
J 22 18
.14
16.9
2 19
.52
15.5
5 9.
5710
.00
C)4
15 128 18
.83
8 15
. 70
120 2.
405.
05
162
Jl
J10 JH JM j J3 J3 OK ji j
10
50 20 30 30 40 200
'31 37 20 35 27 47
D.D
y,Ir
r
D, I
rr
D Ind
D,
OD
, P
S,
0
PS
PS D D PS
Op,
L.
L.
L.
L.
L.
L.
L.
L.
L.
T.
8 N
., R
. 9
W.
8/9-
1M1
2H1
2Q1
2R1
3P1
4H1
9H1
9.T1
9J2
9R1
8. R
. D
eM
agio
.
J. B
. M
oo
re..
.
R.
Rem
olif
l _
Mo
rris
h..
.. ..
.
R.
Rem
olif
l ...
Mrs
. W
. H
.C
alho
un.
d
o.
1950
1940
1945
1942
1950
1940
±
1949
1935
±
1935
±
1935
±
185
160
130
135 75 60 70 65 65 65
315
135
101
154
110 45 40 25 29
.5
35
D6..-.
.
D8.-
-..
D ... .
D8
-
.
D10
.___
D12..
..
D10..
..
D6.-
__
D12....
D6.-
...
!250
261
281
298
147
J 35
] 85 2
2 1 1 2 6 17 13 36
Sand
and
gr
avel
.
..d
o.-
.......
..d
o.-
...
.
grav
el.
Gra
vel;
sand
Sand... .
Loos
e sa
ndan
d gr
avel
.
... d
o..-
... d
o..
-....d
o.-
....
. do..-
...d
o..
-.
... d
o..-
...d
o....
... d
o....
do
....
OV
nl
Qyal
. ...
do...
.....
do...
.. d
o.....
3-27
-51
11-
3-49
4-12
-51
5- ?
-45
11-3
-49
4-12
-51
7
V 4
.9
5-25
-50
4-12
-51
5-25
-50
4-12
-51
5-25
-50
4-12
-51
5-25
-50
4-12
-51
5-25
-50
4-12
-51
5-25
-50
4-12
-51
69.7
66.8
257
.84
125 33
.62
31.0
0 13
7
(+)0
.72
/j_^n
» 18
. 93
17.6
0 12
.23
11.7
0 9.
539.
437.
787.
13
10.8
19.
56
69
1 16
5
164
L2
Jl
Jl
J1H
T15
fl
(T
.AQ
500
12 17 23 90 350
28 25 1 63 3
D,
O
D.O
.S
D
D,
Irr
Irr,
8
Irr
Irr
. Ir
r
Irr
Irr
L.
L.
Op,
L.
L.
L.
L.
L.
See
foot
note
s at
end
of t
able
.

TABL
E 17.
Des
crip
tion
of w
ater
wel
ls i
n th
e Sa
nta
Ros
a V
alle
y ar
ea,
Cal
ifor
nia
Con
tinue
d
Wel
l no.
Ow
ner
or u
ser
Year completed
Altitude
of
land-surface
datum (fee
t)
Depth (feet)
"8
1 o 1
Wat
er-y
ield
ing
zone
or
zone
s op
en to
w
ell
o> a
o o a a
fi
Thickness (feet)
Cha
ract
erGeolog
ic formatio
n
Wat
er le
vel
Date
measured
Distance
above
(+) or
below
land-surface datum
(feet
)Tempera
ture (°
F)
Pu
mp
Type
and
horsepower
Discharge
(gpm)
Res
ults
of
test
s
Bailing or pumping rate
(gpm
)Drawdow
n (fee
t)
1
Other
data
available
T.
8 N
., R
. 9
W. C
onti
nued
8/9-
10H
1
10N
1
10P1
10R
1 11
A1
11B
1
11E
1
11F1
11F2
11L1
11P1
11
Q1
12C
1
12C
2
G. W
iede
r-
hold
. M
rs.
W.
H.
Cal
houn
..... . d
o ..
.
R.
Hog
an. .
...
M.
M.
Feig
- le
y.
L.
R.
Den
na-
hoe.
Mrs
. Is
abel
Jo
hnso
n.
M.
L.
Spa
rks.
W.
Ford
.. .
J. A
. C
ole
V. R
afan
elli
H
. H
ughe
s....
P
. B
robell
i
. do ......
1949
1935
±
1938
19
45
1950
1950
1941
1950
1950
1948
19
50
1940
=fc
150 65
70 165
135
130
130
130
135
125
120
110
145
145
81
38.0
52 400
116.
8
90 87
97 98 100
150
126
184 30
D6
D12..
..
D8
-.
D10-.
..D
8.-
...
D8_.-
..
D8.-
--
D8
-,
D6..-.
.
Due
48.
_
75 65
79 84
71 78 70 35 110
120
6 4 2 4 16
18 28 63 40 3
San
d ..
..
Sand
and
gr
avel
. G
rave
l and
sa
nd.
Cla
y an
d gr
avel
; gr
avel
.
Cla
y an
d gr
avel
; sa
nd
grav
el.
Coa
rse
grav
el
and
sand
.
QT
ge.
..
Qyal.
...d
o
QT
ge
... d
o
do.....
do
... d
o
... d
o
...d
o.....
d
o
d
o
... d
o...
...d
o... .
.
...d
o .
.
5-25
-50
4-12
-51
5-25
-50
4-12
-51
11-2
9-49
4-
12-5
1 1-
10-5
0 5-
?-4
5 11
- 3-
49
4-12
-51
1 9-
9-5
0
7- ?
-50
11-1
0-41
11
-17-
41
6-30
-50
4-12
-51
5-12
-50
8-11
-50
6-27
-51
7-31
-50
11-1
4-41
6-
13-5
1 6-
13-5
1
61.4
3 56
.09
7.37
6.
51
9.49
3.
56
80.1
5 »2
4 33.2
5 32
.60
'26
«40
127
1527
31
.68
32.6
«3
3
135 29
.2
»45
"33
829.
88
(«)
63
63.5
i* T20 J J5
T10
L
P
200
200 20 12 12
25 10 40 120
100
32
26 35 17
29 45
11 10
D
Irr
D,
O
D
D D D
D D Irr
Irr
D
D IT
L.
O,
W.
L.
L.
L,
L.
L.
L.
L.
L.
Op,
L.
On.
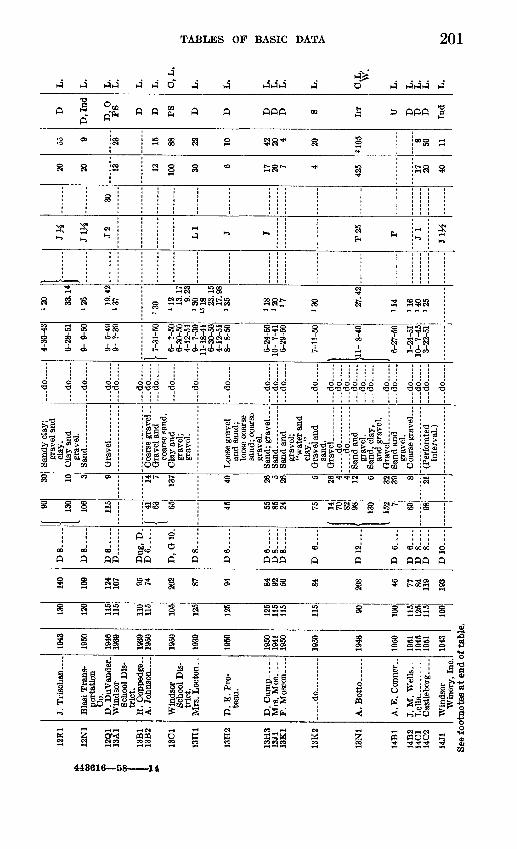
443616 58 It
12E
1
12N
1
12Q
1 13
A1
13B
1 13
B2
13C
1
13H
1
13H
2
13H
3 13
J1
13K
1
13K
2
13N
1
14B
1
14B
2 14
C1
14C
2
14J1
See
f oo
J. T
risc
han.
...
Bla
si T
rans
po
rtat
ion
Co.
D
. D
uVan
der.
W
inds
or
Scho
ol D
is
tric
t.
H.
Cop
pedg
e..
A.
John
son .
Win
dsor
Sc
hool
Dis
tr
ict.
M
rs.
Lo
cto
n..
D.
E.
Pro
- te
au.
D.
Cam
p...
Mrs
. M
oe _
_ _
F.
Mos
con.
...
. do.........
A. B
ott
o.
A. E
. C
onne
r.-
J. M
. W
ells
- _
Leil
a
Cas
tleb
erg.
...
Win
dsor
W
iner
y, I
nc.
tnot
es a
t en
d o
1943
1950
1946
19
39
1939
19
50
1950
1939
1»50
1950
19
41
1950
1960
1946
1950
1951
19
45
1951
1943
ftab
l
130
120
115
115
110
115
105
125
125
125
115
115
115 90
100
115
125
115
100
e.
140
109
124
107 95
74 202 87 94 84
92
50 84 208 46 77
84
119
193
D8-
D8_.
D8..
._.
D
...
Dug
, D
-D
6-
D,
G 1
0.
D8_..
..
D6..
--
D6...-
.D
8..
...
D8...-
_
D 6..
-
D 1
2..
..
D
6--
..
D
6..
..D
8....
D
8-_.
_
D10..
..
90 130
106
115
( 41
i "
65 45 55 85 24 75
/ 14 70 82 98 130
152 7 69 98
30 10 3 8 14 13
7
AQ 26 5 26 5 26 4 4 12 6 32 39 8 21
Sand
y cl
ay;
grav
el a
nd
Cla
y an
d gr
avel
.
Coa
rse
grav
el. .
coar
se s
and.
grav
el;
grav
el.
and
sand
; lo
ose
coar
se
sand
; co
arse
gr
avel
.
grav
el;
"wat
er a
nd
clay
."
sand
.
... .
.do
...
....
....
-do.
..-.
..Sa
nd a
nd
Sand
, cla
y,
and
grav
el.
grav
el.
inte
rval
.)
... d
o
...d
o
do
... d
o
d
o .
d
o
d
o -
d
o -
... d
o...
..
... d
o
...d
o
--d
o
d
o .
. d
o
... d
o
d
o
.-do
... d
o
...d
o.....
... d
o
. d
o.....
do
--do .
.
do
..
. do
.....
d
o
...d
o
4-30
-43
6-28
-51
9- 9
-60
9- 5
-49
9- 7
-39
I 7-
31-5
0
6- ?
-50
6-30
-50
4-12
-51
9- 7
-39
11- 1
8-41
6-
30-5
0 4-
12-5
1 8-
8-5
0
6-24
-60
10-
?-41
6-29
-50
7-11
-50
11-
8-49
6-27
-50
1-24
-51
10-
7-45
3-22
-51
«20 33
.14
126 19
.42
137
1 30 »12 13
.17
9.23
»3
0i«
18
23.1
5 17
.98
135
118
'20 >7 130 27
.42
114
116
140
125
JM
Jl^ J2 LI J J
T25
P J 1
Jl^
30
20 20 13 12 100 30 6 17 20 7 4
425 17 20 40
55 9 23 15 88 22 10 42 20 4 20
8105 8 50 11
D
D.I
nd
D,
OP
S D D PS D D D D D S Irr
U D D D Ind
L.
L.
L.
L.
L.
L.
0,
T,
L.
L.
L.
L.
L.
L.
0,L
,W
.
L.
L.
L.
L.
L.
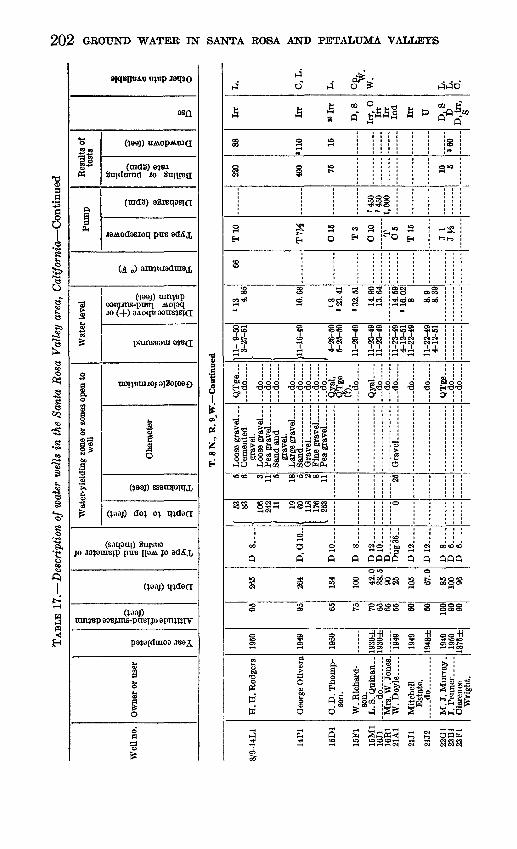
|O tO tO tO to fcO f-* »-* »-* K* »-* >-* »-*biofco £* i i osgscx «* c* rf* rf*
!5 B ji!, g~ £L '
i ?
3 . ' C tr* 3 *-^ ? »**H' B" S o^
I p ^ 1 | 1 » ! -3 i»
r H" i H~ H~ i
to too o? o? ooo o oJ1P^O^^4 "^ O5 CO COjiencnO Cn Si Cn en
^OCn ^<l en Cn O po bO O tfr* *^ en
O Cn O
GG35 05
i 2.
£
G»
o
1
0H-»
o
d Gi- C 3 era
o^
o
JO Cn
Gravel- _
lullfo0 boS
^
0,0
i;
s
O M -*. ^* dj *3
GGG Obo
fi> P-p.^3 3 £,
dee e
P i
isSss sSs ss
("OObOCnOO Cni-<CO O» Cn
2.^ | &£.§ P-§
Q.O.O,1 ! ! <O?'Grq^O??52 o?? ^Grq
® " i i ! CD
$£ £ ?| r ^
co*. to K oo p i^.co
i
1
Oj Qen 5
iii
a
H3 Q ^ ^3Jt ^g^ O
a 1 §
>- K oo en o So
^<B<5I~ . M 5* 5* ^H"*0 03 q * **
Qtr*^ ^ Q t< Q f ^ p
T. 8 N., R. 9,W. Continued
CDt=!
g
O
3 S
*^
Year completed
Altitude of land-surface datum (feet)
Depth (feet)
Type of well and diameter of casing (inches)
Depth to top (feet)
Thickness (feet)
Q ?
1
Geologic formation
Date measured
Distance above (+) or below land-surface datum (feet)
Water-yielding zone or zones open to
well
Water level
Temperature (° F)
Type and horsepower
Discharge (gpm)
Bailing or pumping rate (gpm)
Drawdown (feet)
i o
Results of tests
Use
Other data available
Hf> a
SUSTIVAv$OH

P.
Zen
zune
n..
-d
o...
J. E
. H
aski
ns.
Cla
renc
e W
righ
t.
Ver
non
Dad
o.
M. S
arto
ri .
.
Fra
nkB
albi
...
Mr.
Aut
ru. .
..
Eal
ph B
rook
s.
V. L
. Kir
k-
patr
ick.
E. E
. Will
iam
s
C.
A.
Kle
mm
.
G.H
.Sil
k.....
Edw
ard
Kne
cht.
Bad
ger
....
...
H.
A.
Fau
ght.
-..
.do
...
J. T
. G
race
A.
F.
Em
ert.
.
1949
1952
1950
1949
1945
19
45
1945
1950
1949
1950
1950
1944
1948
1947
1951
1934
....
..
1949
75 95 75 100 90 80 105
105
110 90 100 75 120
115 60 80
75 100
23G
1
i»23
Gl
23J1
23L1
24A
1 24
B1
24E1
24L1
25B
1
26B
1
26B
2
26C
1
26D
1
26E
1
26F1
27K
1
27L1
28B
1 33
G1
See
foot
note
s at
end
of
tabl
e.
225
440 71
2' 42
9
190
120
330
150
161 80 84 145
464
188 80 333 74
.0
30 358
D,G
10.
.
D 6 .
D, G
12..
D 1
2..
..D
10
..
D 1
2-10
.
D 8
-6
D1
0-.
-
D
6_
D 6--
D 6
D1
2..
._
T» a
D6...-
T\
to
T* a
D6-
D.......
18 37 79 128
200
276 57
1 " 56
J 74 306
376 70 100 67
J 60
1 75 90 1240
394
177 74
1 "
1 30
3
10 15 16 10
23 11 36 14 11 45 27 80 to 8
KA 40
68
11 6 2 30
grav
el.
San
d an
d gr
avel
. G
rave
l ...
....
....
. -d
o..
. ...
. ...
.-..
.do
-..
....
sand
.
Coa
rse
sand
an
d w
ashe
d sh
ale.
Inte
rval
).
San
d
.
Sand
and
Sand
y cl
ay a
nd
grav
el; g
rave
l. C
lay
and
grav
el; g
rave
l.
Sand
and
gr
avel
.G
rave
l an
d cl
am s
hells
. ...d
o.... ..
....
..
hole
.)
... d
o..
.. .
d
o
d
o
...d
o.....
... d
o ,
do
....
. d
o.
. d
o
d
o
d
o
do
... d
o. .
d
o
do
Qya
l(?)
,Q
Tge
. T
Qge.
..
do
QT
m(?
).
QT
ge.
..
d
o..
QT
ge
do ..
QT
ge.
..
d
o
. d
o
QT
m-
... d
o
11-1
6-40
4-12
-51
11-2
6-52
8-17
-50
11-1
6-49
4-12
-51
11-
8-49
4-12
-51
1-11
-50
4-12
-51
10-2
0-50
6-27
-51
4 9
1 *J
\4-
12-5
1 6-
15-5
0
i 9-
21-5
0
2- ?
-48
11-1
5-49
4-
11-5
1
U1
A A
.Q4-
11-5
14 9
7 ^
111
-13-
41
3- 5
-42
11-1
6-49
4-
11-5
1 11
-22-
494-
11-5
1
4.48
» »
16. 5
3
»18
'38 28
.54
15.2
1
13.0
73.
00
3.09
(4)
MO 35
.05
8Q
99.
95
»35
U8 >2
0 25
.95
20.6
8
3858
2858
1
2215
12 918
16.
112
.07
32.0
029
.18
65 60
[ 66
65 I--
T30
T15
T 1
0
T15
T5 m
%
T20
T7#
T25 L L3
225
200
450
130
800
200 8
750
600
125
240 15 10 485
*70 12
»69
«.*6
0
35 30 32 70
Irr D Irr
Irr
Irr
Irr
Irr
Irr
D D D
D,
Irr
D.I
rr
D Irr
D,
8
D,
SII
(XT,
,
L.
L.
|"1
ft-
'LE
Cp,
I
L.
L.
L.
Cp,
I
°'L
CI
Cp,
I
L.
C,
L.
L.
to o GO
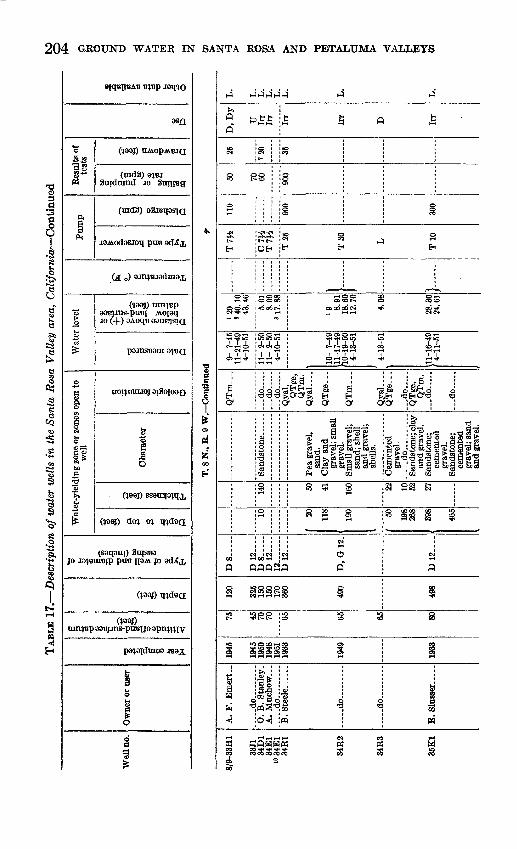
CO CO CO CO Cjji jji 3». 3»-
~
<O O5 <O Cn
00 00 02
i ' S1-
SS8
t-* K-t-lfio l-l
3SS8 8
KOUO O
ft
('*"(
o >-cj
£.&p" - P.
KOOOOOO
c
3 S
1§o
I5Year completed
Altitude of land-surface datum (feet)
Depth (feet)
Type of well and diameter of casing (inches)
Depth to top (feet)
Thickness (feet)
Qtar
8
Geologic formation
Date measured
Distance above (+) or below land-surface datum (feet)
Water-yielding zone or zones open to
well
Water level
Temperature (° F)
Type and horsepower
Discharge (gpm)
Bailing or pumping rate (gpm)
Drawdown (feet)
o
SE»&
^
Use
Other data available
SiUTIVAOMV VSOH V.LNVS JsTI JTSiVAl <Ltt£L03K)

38M
1
36Q
1
36G
2
36K
1
36L1
36N
1
36N
2
36P1
J. I
. H
aas
F.
W.
Woo
d..
. .d
o..
.
Cam
eron
B
roth
ers.
Mrs
. Pe
ggy
P.
W.
Bus
s-
man
, .
.do
....
.
... .
.do
1034
1935
1947
1933
1945
65
100
100 96 95
90
90
90
476
642 24
.7
1,32
5
565 89
.0
185
1,04
8
D12-.
..
D 1
2....
D6-.
D1
2..
..
D12
-8-.
D12
__._
D12....
D 1
2-10
.
Qya
l, Q
Tge,
Q
Tm
.
Qya
l, Q
Tge
(?).
OT
o-p
Qya
l, Q
Tge
. ..
.do..
...
QT
ge,
QT
m.
11-1
6-49
4-
11-5
1
11-1
7-49
4-
11-5
1 5-
23-5
1 11
-17-
49
4-11
-51
5-23
-51
11-1
7-49
4-
11-5
1 5-
23-5
1 11
-18-
49
4-11
-51
10-1
4-49
11-2
4-41
11
-17-
49
10-
5-49
15.1
8 11
.12
16.0
8 14
.27
14.0
5 17
.32
11.8
3 12
.88
45.9
8 47
.03
47.7
8 35
.5
28.7
2 10
.25
i«9 10
.70
22.5
6
T25
T25
P
T20
T25 T
Ts4
0
800
600
450
150
650
750
« 75
890
150
Iff
Irr
U
to Irr
U
Irr
Irr
C.
L.
W.
Cp,L
, W
.
T. 9
N.,
R. 9
W.
9/9-
34B
1
34D
1
34N
1
Fra
nk D
lany
.
Lou
is F
op-
pian
o.
W.
C.
Bea
u-
1922
1946
110
105 85
60
120.
5
198
D8..
DIG
.
D1
2..
..
Qyal.
Qt, Q
Tge.
Q
yal(?
),
10-2
0-49
4-
10-5
1 10
-20-
49
10-2
0-49
34.2
2 28
.34
30.1
9
14.8
2
LI
T15
400
500
120
D U
to
W.
L,
W.
I Rep
orte
d by
dri
ller.
8 O
rigi
nal
dept
h; n
ow p
artl
y fi
lled
by c
ave-
in.
a P
umpi
ng le
vel.
« W
ell f
low
ing;
sta
tic
leve
l abo
ve la
nd-s
urfa
ce d
atum
.5 W
ell p
umpi
ng n
earb
y.8 E
stim
ated
nat
ural
flow
.7 R
epor
ted
by o
wne
r.
s Pum
ping
rec
ently
.8 P
umpi
ng.
"> D
ata
for
deep
ened
wel
l.II
Obs
truc
tion
enco
unte
red
at d
epth
ind
icat
ed.
18 D
rille
r's r
econ
ditio
ning
rec
ord
avai
labl
e.
»3 T
est.
M T
est
hole
dri
lled
to 2
00 f
eet;
owne
r re
port
s ca
sing
cut
ofl
at
103
feet
and
hol
e fi
lled
wit
h gr
avel
to
101
feet
. "
Mea
sure
d by
Bur
eau
of R
ecla
mat
ion.
i« W
ater
flo
wed
up
outs
ide
of c
asin
g.w
Dat
e of
dee
peni
ng.
u M
easu
red
to t
op o
f oil
floa
ting
on w
ater
sur
face
.19
Tim
bere
d dr
ift,
5 fe
et h
igh,
5 f
eet w
ide,
and
rep
orte
d to
be
seve
ral h
undr
ed f
eet
in
leng
th; a
t a d
epth
of 5
0 fe
et.
It is
the
orig
inal
sou
rce
of m
unic
ipal
wat
er s
uppl
y fo
r the
ci
ty o
f San
ta R
osa.
2° W
ell r
epor
ted
and
fille
d co
vere
d, 4
-9-5
1.«
Mea
sure
men
t m
ade
in d
ug p
orti
on o
f wel
l."
Mea
sure
men
t mad
e 15
min
utes
aft
er p
ump
turn
ed o
ff.
» M
easu
red
by t
he G
eolo
gica
l Su
rvey
.«
App
roxi
mat
e.»
Wel
l de
stro
yed
betw
een
5-25
-51
and
4-12
-51.
* W
ell
repo
rted
to
have
flo
wed
dur
ing
prev
ious
win
ter
and
unti
l pu
mpi
ng b
egan
. »'
Plu
g se
t at
dep
th o
f 227
fee
t, Se
ptem
ber
1960
, to
shut
ofl
hig
h-bo
ron
wat
er.
.*8
Air
line
mea
sure
men
t.8

TABL
E 18.
Des
crip
tion
of r
epre
sent
ativ
e de
velo
ped
spri
ngs
in t
he S
anta
Ros
a V
alle
y ar
ea,
Cal
iforn
ia
No.
on
pL
l
6/8-
17K
2...
7/6-
33N
1...
6/6-
5L2.
....
6/6-
5L3.
.
7/9-
16A
1....
7/9-
16B
1....
7/9-
33F2
....
Ow
ner
wor
th,
H.
Q. H
awes
..
....
.do
....
....
.
L.
K. a
nd E
.L
ands
.
....
.do
...
L.
B.
Wal
ker.
Occ
urre
nce
thro
ugh
sand
and
san
dy
clay
in a
rea
of In
term
it
tent
gro
und-
wat
er d
is
char
ge.
drai
n.
And
esite
terr
ane.
face
ous r
ock
in e
ast b
ank
of S
onom
a C
reek
.
glom
erat
e on
eas
t ba
nk
of S
onom
a C
reek
.
Seep
age
area
mar
ked
byfl
atte
ning
of
ra
vine
; pr
obab
ly a
t int
erse
ctio
n w
ith w
ater
tab
le.
Soft
sand
ston
e te
rran
e.
head
of s
mal
l rav
ine.
gent
ly
slop
ing
hills
ide
unde
rlai
n by
sof
t sa
nd
ston
e.
Ass
ocia
ted
geol
ogic
fo
rmat
ion
.....d
o..
.. ..
....
....
.
.. d
o.....
....
.do
,. .
....
....
.
Altitude SB 425
340
345
120
140
165
Tempera ture
(°
F.
) 55
"6l" 90
"82 60
Discharge (gpm
)
4+ 3+
(0 5±
4-5 2
850 «4 65^
(0
Dat
e m
easu
red
Feb.
9,
195
0Fe
b.
21,1
951
May
21,
1951
A
pr.
24,1
953
July
21
,195
0
July
27
,195
0
May
8,
1952
July
14
,195
0
July
14
,195
0
Apr
. 17
,195
1
Use
Sto
ck
.................
Swim
min
g .
_.-
.
irri
gatio
n.4
Rem
arks
sum
p.
Part
ial c
hem
ical
ana
lysi
s in
tabl
e 21
.
deep
. O
wne
r re
port
s th
at d
is
char
ge s
how
s no
seas
onal
fluc
tua
tio
n.
of sp
ring
s kn
own
as L
os Q
uilu
cos
War
m S
prin
gs.
inch
es
in
diam
eter
. O
verf
low
s th
roug
h pi
pe 2
fee
t be
low
top
. C
ompl
ete
chem
ical
ana
lysi
s in
ta
ble
20.
Woo
d-cu
rbed
sum
p, 3
fee
t sq
uare
,4
feet
de
ep.
Col
lect
s gr
ound
- w
ater
dis
char
ge a
nd i
nter
cept
s flo
w fr
om sp
ring
at h
ead
of ra
vine
. Ir
riga
tes
7 ac
res.
7J
£-hp
cen
trif
ug
al p
ump.
diam
eter
, 5
feet
dee
p.
Top
1.0
fo
ot a
bove
lan
d-su
rfac
e da
tum
. R
epor
ted
to fl
uctu
ate
only
dur
ing
drie
st
part
of
ye
ar.
Apr
. 13
, 19
50, w
ater
leve
l in
rese
rvoi
r was
0.
2 fo
ot a
bove
land
-sur
face
dat
um
and
slig
htly
bel
ow o
verf
low
pip
e af
ter
rece
nt p
umpi
ng.
i Flo
win
g; d
isch
arge
not
mea
sure
d.' T
empe
ratu
re ta
ken
afte
r wat
er h
ad c
ircu
late
d th
roug
h he
atin
g co
ils b
enea
th fl
oor
of d
wel
ling.
8 E
stim
ated
.
< Ove
rflo
w fr
om s
ump
flow
s th
roug
h na
tura
l cha
nnel
to
dow
nstr
eam
sum
p an
d i
used
for i
rrig
atio
n.s A
vera
ge d
isch
arge
with
Int
erm
itten
t pum
ping
to p
ress
ure
syst
em.
6 Rep
orte
d no
rmal
flo
w.
i Not
flow
ing
this
dat
e,

TABLES OF BASIC DATA 207
TABLE 19. Water levels in wells, 1949-57, Santa Rosa Valley area, California
Date Water level
Date Water level
Date Water level
Well 6/7-30L1[A. Crane. About 1.8 miles east-northeast of Cotati, 0.52 mile west of Petaluma Hill Road, 110 feet south
of Cotati Avenue, 10 feet southwest of foundation of destroyed dwelling, 6 feet north of tank tower. Un used dug well; dimensions, 3x3 feet; depth, 24.4 feet. Measuring point: top of wood curbing, south side at land-surface datum, which is 145 feet above sea level]
Sept. 29, 1949 _ _Oct. 14
21 ...........Nov. 4
10 ..........
27 ...........Jan. 12,1950 _ ........
13.8715.1315.9317.5218.1720.6723.0124.2
Jan. 31,1950-..-. Feb. 23 .... __Mar 28
July 13
Sept. 7 __
13.574.882.083.575.587.579.90
12.73
Oct. 18, 1950 _ __Dec. 28Apr. 4, 1951 ...........
Oct. 16 _ __ .Dec. 7 ___Apr. 1, 1952 ___ .... .
16.736.401.744.62
15.485.981.41
Well 6/7-30M1[B. Brians. About 1.3 miles east-northeast of Cotati, 200 feet south and 75 feet east of Intersection of Cotati
Avenue and Snyder Lane, 100 feet southeast of dwelling, 40 feet east of fence. Domestic and irrigation well; diameter, 8 inches; depth, 104 feet. Measuring point: top of casing, north side, 1.5 feet above land- surface datum, which is 120 feet above sea level]
Dec. 00, 1947 _ ........13, 1949 _ ........
Jan. 31, 1960 .Feb. 23 _-__ .Mar. 28 __ .
July 13 ...........
i Reported by driller, a Pumping recently.
U4.516.3413.69
a 11. 269.83
10.7714.7215.13
Oct. 18Dec. 28Apr. 4, 1951 _ ....
Oct. 16Dec. 7 ___Apr. 1, 1952 _ ........
16.4515.7711 409.83
13.8816.6414.518.92
Nov. 20, 1952 _Apr. 17, 1953 __ ... _ -Nov. 3, __ .......Apr. 2, 1954 _ . ___ .
1, 1955 __ _ .3, 1956 _ .. .
Mar. 15, 1957 _ .... __
17.8610.4019.05
319.6611.9411.7916.74
Well 6/7-31J1[Lavio Brothers. About 1.5 miles north of Penngrove, 0.25 mile north of Railroad Avenue, 0.25 mile west
of Petaluma Hill Road, 12 feet north and 40 feet east of quarter-section fences, 22 feet east of well 6/7-31J2. Irrigation well; diameter, 12 inches; depth, 280 feet. Measuring point: bottom of notch in south side of casing, 0.9 foot above land-surface datum, which is 135 feet above sea level]
Nov. 30, 1949 Dec. 28 __ .......Jan. 31,1950 _ - _ ....Feb. 23Mar. 28
27.0119.3014.8210.128.218.05
June 14, 1950 _July 13Aug. 9 ...........Sept. 7Oct. 18Dec. 29
147.0722.6520.29
146.7818.0910.10
Apr. 4, 1951. _ ..
Oct. 16 __Dec. 7 __ . Apr. 1, 1952 _
5.6810.7218.9711.475.77
1 Pumping recently.
Well 6/7-31J2[Lavlo Brothers. About 1.5 miles north of Penngrove, 0.25 mile north of Railroad Ave., 0.25 mile west of
Petaluma Hill Road, 3 feet north and 15 feet east of quarter-section fences, 9 feet south and 22 feet west of well 6/7-31J1, beneath windmill tower. Stock well; diameter, 8 inches; reported depth," over 57 feet." Measuring point: bottom of pump base, west side, 0.5 foot above land-surface datum, which is 135 feet above sea level]
June 14, 1950 _ ........July 13 ...........
Sept. 7 ___ _ ._
16.5516.1812.3020.84
Oct. 18, 1950-- . 19.006.656.79
Oct. 16, 1951 _ . _ .Dec. 7 ...........Apr. 1, 1952 _ ...
12.54»9.31
2.27
i Pumping.
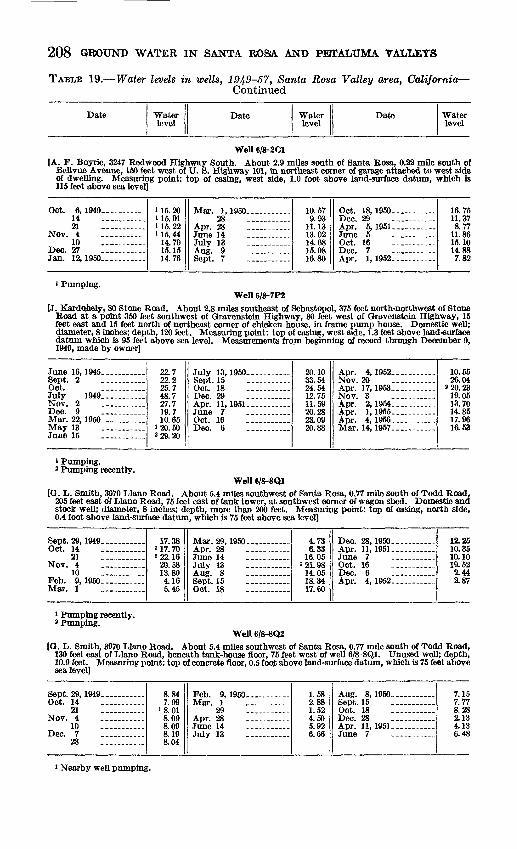
208 GROUND WATER IN SANTA ROSlA AND PEfTALUMA VALLEYS
TABLE 19. Water levels in wells, 1949-57, Santa Rosa Valley area, California- Continued
Date Water level
Date Water level
Date Water level
Well 6/8-2C1[A. F. Boyrie, 3247 Redwood Highway South. About 2.9 miles south of Santa Rosa, 0.22 mile south of
Bellvue Avenue, 160 feet west of U. S. Highway 101, in northeast corner of garage attached to west side of dwelling. Measuring point: top of casing, west side, 1.0 foot above land-surface datum, which is 11$ feet above sea level]
Oct. 6, 1949 _ ...14 ...........21
Nov. 410 .-.. .
Dec. 27 ___ . ....Jan. 12,1950 _ ........
115.201 15. 91115.22U5.44
14.7015.1514.76
Mar. 1,1950.28 ...........
Apr. 28 ...........
July 13 .... . A *icr Q
Sept. 7 ...........
10.579.93
11.1313.0214.6815.0816.80
Oct. 18,1950 _ -- .-.
Apr. 5,1951 _ .......
Oct. 16 .-. .-...
Apr. 1,1952.
16.7511.378.77
11.8615.1014.887.82
i Pumping.Well 6/8-7P2
[J. Kardohely, 80 Stone Road. About 2.8 miles southeast of Sebastopol, 375 feet north-northwest of Stone Road at a point 360 feet southwest of Gravenstein Highway, 80 feet west of Gravenstein Highway, 15 feet east and 15 feet north of northeast corner of chicken house, in frame pump house. Domestic well; diameter, 8 inches; depth, 120 feet. Measuring point: top of casing, west side, 1.3 feet above land-surface datum which is 95 feet above sea level. Measurements from beginning of record through December 9, 1949, made by owner]
June 16,1945 _ ........
Oct. ...........July 1949.--.......Nov. 2 __ .......Dec. 9 . __ .. ...Mar. 22, 1960 _ .... ...May 13 . __ ......
22.7
25.748.727.719.710.65
120.50a 29. 20
July 13,1980
Oct. 18Dec. 29 ...........A nr 11 1 Q*\1
Oct. 16 __ .......Dec. 6 . .-. ...
20.1033.5424.5412.7511.5920.2823.09
Apr. 4, 1952 _ ........
Apr. 17, 1953 _ . .. ...Nov. 3 -...- .-Apr. 2,1954.... _ ....Apr. 1, 1955 _ ........Apr. 4,1956 _ ........Mar. 14, 1957 _ .....
10.5526.04
a 20. 2319.0513.7014.8517.9616.53
i Pumping.3 Pumping recently.
Well 6/8-SQ1[G. L. Smith, 3970 Llano Road. About 5.4 miles southwest of Santa Rosa, 0.77 mile south of To<!d Road,
205 feet east of Llano Road, 75 feet east of tank tower, at southwest corner of wagon shed. Domestic and stock well; diameter, 8 inches; depth, more than 200 feet. Measuring point: top of casing, north side, 0.4 foot above land-surface datum, which is 75 feet above sea level]
Sept. 29, 1949 _Oct. 14 __ .......
21Nov. 4
10 ...........Feb. 9,1950 __ ......Mar. 1 __ ......
17.38i 17. 703 22. 16
20.5813.804.165.45
Mar. 29, 1950 .. ...Apr. 28 -
July 13
Sept. 15 ..... ...Oct. 18
4.736.33
16.05J O1 QO
14.0518.3417.60
Dec. 28,1950 Apr. 11, 1951 _
Dec. 6 ._... .Apr. 4,1952 _ ........
12.2510.3510.1019.522.442.87
i Pumping recently, 3 Pumping.
Well 6/8-8Q2[G. L. Smith, 3970 Llano Road. About 5.4 miles southwest of Santa Rosa, 0.77 mile south of Todd Road,
130 feet east of Llano Road, beneath tank-house floor, 75 feet west of well 6/8-8Q1. Unused well; depth, 10.9 feet. Measuring point: top of concrete floor, 0.5 foojfc above land-surface datum, which is 75 feet above sea level]
Sept. 29, 1949 __Oct. 14 __ ..
21 ...........Nov. 4 - _____ .
10 - .-.Dec. 7 .. . .
28 . .. .
8.847 00
18.018.098.098.198.04
Feb. 9, 1980 A>fcii* 1
29Apr. 28
July 13 -
1.582.881.524.505.926.66
Aug. 8,1950- Sept. 15Oct. 18 . Dec. 28 ..... ...Apr. 11, 1951 .... ...
7.157.778.282.134.136.48
i Nearby well pumping.

TABLES OF BASIC DATA 209
TABLE 19. Water levels in wells, 1949-57, Santa Rosa Valley area, California Continued
Date Water level
Date Water level
Date Water level
Well 6/8-9B1.
[E, Gobbi, 1030 Todd Road. About 4.2 miles south-southwest of Santa Rosa, 0.43 mile west of Stony Point Road, 325 feet south of Todd Road, 20 feet west of driveway in large frame pump house. Domestic and stock well; diameter, 8 inches; depth, 105 feet. Measuring point: top of casing, south side, 0.5 foot above land-surface datum, which is 90 feet above sea level]
Mar. 11,1942 _ ........Feb. 24, 1950 Mar. 29Apr. 28 ...........
1429.90
6.009.40
3 12. 98
July 13, 1950-
Sept. 15
Dec. 28
824.5514.12
223.002 17. 7537.95
Apr. 4, 1951 __ .......
Oct. 16
Apr. 4, 1952...........
5.91»15.91» 24.59'
10.52»13.0
i Measurement by U. S. Bureau of Reclamation.8 Pumping.»Pumping recently.
Well 6/8-13R1.
[Rohnert Seed Co. About 3.2 miles northeast of Cotati, 1.7 miles north of Cotatl Avenue, 380 feet west of Snyder Lane, 100 feet south of unnamed creek, 36 feet west of corral, at west edge of field road, in frame pump house. Domestic well; diameter, 15 inches; original depth, 675 feet; reported to be filled below depth of about 250 feet. Measuring point: top of casing, east side, 1.2 feet above land-surface datum, which is 115 feet above sea level]
Mar. 12, 1942...........Jan. 25,1950 Mar. 1 ...........
28 ...........May 3
July 13 ...........Aug. 9
17M2.46
9.83» 10. 92
Q QO
a 12. 5211.4312.00
Oct. 18 _
Apr. 5,1951 .
Oct. 16 _-. -
Apr. 1, 1952 .
12.6913.0710.098.138.43
14.5013.048.41
Nov. 20,1952 _ ........Apr. 17,1953 _ ________Nov. 3,1953 Apr. 2, 1954 _ Apr. 1, 1955 _ ........Apr. 3,1956 _ . __ Mar. 15, 1957 _ .. .
14.729.72
16.5510.5111.7011.4015.94
1 Measurement by U. S. Bureau of Reclamation.2 Pumping recently.
Well 6/8-15J1.
[J. Pedranzini, about 5.4 miles south of Santa Rosa, 355 feet east of Langner Avenue, 315 feet south of Wilfred Avenue, 50 feet north of fence, in field. Stock well, diameter, 12 inches; depth, 61.4 feet. Measuring point: top of casing, north side, at land-surface datum, which is 95 feet above sea level]
Mar. 12, 1942. _ .. ... Sept. 29, 1949 _ ........Oct. 14
21Nov. 4
10 ...........Dec. 27Jan. 31, 1950 _Mar. 1 ...... .....Mar. 28 ...........
127.126.696.616.025.684.813 492.081.05
May 3, 1950
July 13 ...........A no* QSept. 7 ._
Apr. 5,1951 _
Oct. 16
1.854.407.02
» 10. 058.349.074.825.08
18.4419.59
Nov. 6,1951 _ ..... .Dec. 7 ___ . Apr. 1,1952 _Nov. 20Apr. 17,1953 Nov. 3 ...........Apr. 2, 1954 _ ........Apr. 1, 1955 _ ........Apr. 3,1956 Mar. 15, 1957 _ ... _ ..
15.829.832.42
16.305.22
15.544.915.205.017.22
1 Measurement by TJ. S. Bureau of Reclamation.2 Pumping.
Well 6/8-15J3.
[T. Yasuda, 4528 Langner Avenue, about 5.3 miles south of Santa Rosa, 520 feet east of Langner Avenue, 375 feet north of Wilfred Avenue, 30 feet north and 24 feet west of fence corner. Irrigation well; diameter, 12 inches; depth, 166 feet. Measuring point: top of casing, east side, 0.5 foot above land-surface datum, which is 95 feet above sea level]
Oct. 14,1946 Mar. 1,1950 Apr. 5,1951--..-. _ ..Nov. 6,1951 _ ........Dec. 7 -_
181.312.53
16.8411.95
Nov. 20,1952 Apr. 17,1953 _Nov. 3 .. .........Apr. 2, 1954
2.3219.125.40
25.908.21
Apr. 1, 1956 Apr. 3,1956. __ ......Mar. 15,1957 _
8.7411.5716.16
Reported by driller.

210 GROUND WATER IN SANTA KOSiA AND PE1TALUMA VALLEYS
TABLE 19. Water levels in wells, 1949-57, Santa Rosa Valley area, California-Continued
Date Water level
Date Water level
Date Water level
Well 6/8-20A1
(Henry Paine. About 3.6 miles nearly northwest of Cotati, 0.37 mile east of Gravenstein Highway along Bartleson Road, 220 feet south of Bartleson Road, 5 feet south of garage beneath small pump shelter. Domestic well; diameter, 8 inches; depth, 103 feet. Measuring point: top of casing, north side, 1.0 foot above land-surface datum, which is 140 feet above sea level]
Dec. 19,1942 Feb. 9, 1950... ... __ .Apr. 11, 1951
U917.5617.78
May 21, 1951
Oct. 16 . ...
17.7720.6723.13
Dec. 6,1951. _Apr. 4, 1952..-.. ..
22.1]14.62
1 Reported by driller.Well 6/8-26N1
IRunyon. About 0.8 mile west-northwest of Cotati, 150 feet south-southwest of Gravenstein Highway, 75 feet southwest of Cotati Avenue, 50 feet east of dwelling, at east side of hedge. Domestic well; diameter, 8 inches; depth, 246 feet. Measuring point: hole in casing, south side, 0.7 foot above land-surface datum which is 105 feet above sea level]
Dec. 19, 1949- Feb. 9, 1950 Mar. 1 -.. .
29 ....
8.55!5.87
5.194 At)
5.55
June 14, 1950. July 13 ...
6.768.80
11.259.359.06
Dec. 28, 1950. _ .. _ ..Apr. 5, 1951 ____ ...
Apr. 4,1952
5.033.724.393.31.42
i Pumping.Well 6/8-29E1
IH. T. Parker. About 4.7 miles southeast of Sebastopol, at Turner Station, 450 feet north of Blank Road, 150 feet east of Hessel Road, 25 feet south of frame factory building. Industrial well; diameter, 8 inches; depth, 285 feet. Measuring point: top of casing, east side, 0.5 foot above land-surface datum, which is 200 feet above sea level]
Mar. 29, 1950 ______May 3 ....... ....
July 13 .. ...-
22.2220.7720.1821.3522.52
Sept. 15, 1950 __ _ .Oct. 18
Apr. 12,1951 .
21.8422.5419.5419.89
June 7, 1951 ...........Oct. 16 ..... __ ..Dec. 6 ...........Apr. 4,1952
18.7822.0319.8918.92
Well 6/9-11D2
JA. G. Pilcher, 475 Lynch Road. About 1.1 miles south-southwest of Sebastopol, 0.19 mile east and 200 feet south of the intersection of Pleasant Hill and Lynch Roads, in frame pump house which is 25 feet south and 15 feet west of southwest corner of dwelling. Domestic well; diameter, 8 inches; depth, 337 feet. Measur ing point: top of casing, east side, 1.0 foot above land-surface datum, which is 225 feet above sea level]
Apr. 6, I960. _ ... _ .
July 13 _ . ___ .Aug. 10 ...........
32.57139.03
37.97
Sept. 15, 1950
Dec. 29 ----... .Apr. 4,1951
153.0731.2330.8631.19
Oct. 16 ... __ ...Dec. 6 -... ....Apr. 4,1952
33.6032.6428.4929.42
' Pumping recently.Well 7/6-19N1
[H. Horton, 7750 Sonoma Highway. About 1.9 miles northwest of Kenwood, 0.48 mile northwest of Lawn- dale Road, 0.16 mile south of Sonoma Highway, 50 feet east of Creek, in corrugated-metal pump house. Domestic well; diameter, 10 inches; depth, 190 feet. Measuring point: top of casing, south side, 1.0 foot above land-surface datum, which is 465 feet above sea level]
July 18,1950 Mar. 29, 1951.-. ...Oct. 18 _____ .Dec. 6,1951
1165.00
28.345.67
Apr. 1, 1952 - Nov. 21, 1962.. .........
Oct. 27 .. . __
4.1763.465.386.82
Apr. 13, 1964.. .........Apr. 1,1955 Apr. 4,1956 Mar. 14, 1957
3.7310.394.624.46
Reported by driller.

TABLES OF BASIC DATA 211
TABLE 19. -Water levels in wells, 1949-57, Santa Rosa Valley area, California Continued
Date Water level
Date Water level
Date Water level
Well 7/6-32F1
(B. Cochrane. About 0.2 mile southwest of Kenwood, 54 feet northwest of Rohrer Avenue, 51 feet northeast of Mervyn Avenue (Warm Springs Road), In field. Unused Irrigation well; diameter, 10 inches; depth, 190 feet. Measuring point: top of casing, north side, at casing cover lock, 1.5 feet above laud-surface datum, which is 395 feet above sea level]
Oct. 1,1946 __ .......Oct. 27,1950. . ____Nov. 6, 1951.. .........
»32.603.340.21
Apr. 1,1952-.... _ ...Nov. 21 ...... __Apr. 13,1953........ ...Oct. 27 -. .--
+0.442.56
+0.192.61
Apr. 13,1954-.- Apr. 1, 1956... Apr. 4, 1956 __Mar. 14, 1957 __
+0.51+.17+.34+.41
1 Reported by driller.Well 7/7-18Q1
[J. S. Barbara. About 2.2 miles east-northeast of Santa Rosa, 0.20 mile southeast of Sonoma Avenue, 460 feet northeast of Yulupa Avenue, 400 feet north of creek, in corrugated-metal pump house. Unused well; diameter, 12 inches; reported depth, 250 feet. Measuring point: top of casing, southwest side, 0.5 foot above land-surface datum, which is 205 feet above sea level. (During the early summer of 1953 shallow strata were sealed off so that subsequent measurements reflect the head in the deep zone only, while earlier measurements reflect the composite head.)]
Jan. 26,1950 _Mar. 1 ...........
29Apr. 28 ...........June 7 . ___ ...July 12 __. Aug. 11 ___.
8.713.253.255.258.65
12.9513.5214.57
Oct. 17,1950 _Dec. 27Apr. 10, 1951........ ...
Nov. 6
Apr. 1,1952 _ ........Nov. 21
16.622.524.497.64
15.95.82
2.4223.81
Apr. 13,1953 _Nov. 3Apr. 1,1954 _ ......
Apr. 1,1965. Apr. 4, 1956 _Mar. 14, 1957 ..... _..
7.7741.3324.3027.6426.8623.9134.33
Wefl 7/8-4B1
{Martin Lambert, 3964 Coffee Lane. About 3.6 miles north-northwest of Santa Rosa, 0.22 mile south of 90-degree turn in Coffee Lane, 185 feet east of Coffee Lane, beneath north edge of tank tower and windmill. Unused well; diameter, 5 inches; depth, 21.4 feet. Measuring point: top of casing, north side, 0.7 foot above land-surface datum, which is 150 feet above sea level]
Mar. 8.1942 _ ........Sept. 29, 1949 _ ........Oct. 14 ___ ......
21 ...........Nov. 4 . . _..
10 ._ .....
28 ...........
14.510.6010.9211.0411.2511.2011.5811.71
Jan. 12,1950 _Feb. 28 ...-. Mar. 29Apr. 28
July 7 - . -..Aug. 9 ... __ .Sept. 7
10.573.65
23.985.076.507.338.49
10.08
Oct. 16,1950 __Dec. 27 ...........Apr. 12, 1951 _ _ ..
Oct. 18 ...... .....
Apr. 2,1952 _ ... _ ~
10.803.244.485.519.352.843.44
i Measurement by U. S. Bureau of Reclamation. a Nearby well pumped recently.
Well 7/8-4B3
H. A. Weinland, 3955 Coffee Lane. About 3.7 miles north-northwest of Santa Rosa, 0.19 mile south of 90-degree turn in Coffee Lane, 570 feet west of Coffee Lane, 900 feet west-northwest of well 7/8-4B1, in vineyard. Irrigation well; diameter, 8 inches; depth, 161.4 feet. Measuring point: hole in pump base, south side, 1.0 foot above land-surface datum, which is 150 feet above sea level]
Sept. 29, 1949. Oct. 14
21Nov. 4 ...........
10
28 _ ..... ...Jan. 12, 1950 ...........
13 2213.4913.7614.0013.9114.1214.3213.86
Feb. 28,1950 _ ........Mar. 29Apr. 28
July 7A 11ET Q
Oct. 16 -.-.
7.016.887 488.819.85
11.0212.1613.32
Dec. 27,1950 _Apr. 12, 1961.
Oct. 18 ____ ....
Apr. 2, 1962-
6.776.627.83
11.717.356.53

212 GROUND WATER IN SANTA ROSA AND PETALTJMA VALLEYS
TABLE 19. Water levels in wells, 1949-57, Santa Rosa Valley area, California Continued
Date Water level
Date Water level
Date Water level
Well 7/8-8L1
{Finer School District. About 3.5 miles northwest of Santa Rosa, 0.13 mile south of Finer Road, 200 feet west of Fulton Road, 100 feet north of school building, 6 feet east of red frame pump house. Public supply well; diameter, 8 inches; depth, 72 feet. Measuring point: top of casing, west side, 0.5 foot above land- surface datum, which is 130 feet above sea level]
Jan. 23, 1950 ._.........Feb. 28 ___ ......Mar. 29 __Apr. 28 __ ......June 7 ...........
13.5612.9411.8812.6013.48
July 6, 1950 _ Ante ROct. 16T\rtrt OO
Apr. 18, 1951 _ . _ ....
14.6015.3517.0911.9312.30
Tuna ft 1QK1Oct. 16
Apr. 2, 1952.. ... . .
12.9317.1413.7810.12
Well 7/8-10L1[E. E. Hardies, 2519 Hardies Lane. About 2.1 miles northwest of Santa Rosa, 0.3 mile north of Steele
Lane, 125 feet west of Hardies Lane. Unused irrigation well; diameter, 12 inches; reported depth, 212 feet. Measuring point: hole in pump base, south side, 1.0 foot above land-surface datum, which is 135 feet above sea level]
July 12, 1949 ___ .. __Oct. 13
21 ...........Nov 4 ...........
10
28 ___ . ....Jan. 12,1950 ______
117.121.6020.3418.2218.1015.2415.2112.19
Feb. 28,1950. _ ....Mar. 29 ...... _ ..Apr. 28 _ _ ....
July 7 __ . ......
Sept. 7 ____ ...
8.697.06
10.7514.8818.4821.0123.13
Oct. 16, 19(50... ..... T\0f> 97Apr. 12, 1951.
Oct. 18T"lftrt ft
Apr. 2, 1952.. .. .......
19.6615.868.26
17.2615.719.833.48
1 Measurement from Pacific Gas <fe Electric Co. pump test furnished by Water Dept., City of SantaRosa.
Well 7/8-11M1[1ST. B. Owen, 2500 Mendocino Avenue. About 1.7 miles north of Santa Rosa, 0.3 mile north of Steele
Lane, 200 feet northeast of Mendocino Avenue, 22 feet southeast of centerline of driveway, 6 feet west of garage. Unused well; diameter, 8 inches; depth, 55 feet. Measuring point: hole in pump base, north west side, 0.1 foot above land-surface datum, which Is 160 feet above sea level]
Dee. 15,1949...........21 _____ ..29
Jan. 26,1950 __Feb. 3 . ......
7 ...........9 ...........
15 ...........23 ...........
Feb. 28 ._ ....Mar. 29 ._.........
11.0811.0010.7910.129.779.509.459.359.539.439 37
Apr. 13,1950 _ . __ ..90
July 13Aug. 10
Oct. 31 ...........Dee. 27 ..........."Mar Ifi IQ^IApr. 11 _.._- ..-
9.1810.249.63
11.1412.0812.7612.539.409.018.58
June 7,1951... __ . _Oct. 18 ..
Apr. 2, 1952.. .. .......Nov. 21 ...........Apr. 17,1953- Nov. 6 ...... .Apr. 2,1954... ___ .Apr. 1, 1955 Apr. 11,1956. .
8.8812.629.627.52
10.217.86
10.297.087.837.04
WeB 7/8-20K1[Fred Siemer. About 2.8 miles nearly west of Santa Rosa, 0.21 mile east and 0.09 mile south of the inter
section of Fulton and Hall Roads, 450 feet south of road to Siemer labor camp, 20 feet west of drainage ditch, at east edge of hopyard. Irrigation well; diameter, 12 inches; depth, 626 feet. Measuring point:
. top of hole in east side of pump base, 1.1 feet above land-surface datum, which is 98 feet above sea level]
Oct. 4,1949... __ ...Nov. 10 ...........
23 ...........Dee. 9 ______
29 ...... _ ..Jan. 12, 1950 . _ ..Feb. 28 ...... _ ..Mar. 28 ...........Apr. 28 __ .. .....
20 4017.6617.4717.03
16.3413.6712.5312.31
June 7, 1950 _
10
Oct. 16 .... _ ....Dec. 28 ........ ...Apr. 11,1951 _ ...
Oct. 16 ...........
130.3529.3228.0524.1720.7412.808.999.47
26.40
Apr. 2,1952- Nov. 20 ....... ....Apr. 17,1953- Nov. 3 .... - Apr. 1, 1954... . .......Apr. 1, 1955 .Apr. 4, 1956. .. ___ -Mar. 14,1957..... ...
14.548.2E
23. 2C10.7524.7611.6212.86
6. 889.9S
i Pumping recently.

TABLES OF BASIC DATA 213
TABLE 19. Water levels in wells, 1949-57, Santa Rosa Valley area, California -Continued
Date Water level
Date Water level
Date Water level
Well 7/8-20L1{A. Fistolera, 675 Wright Road. About 3.1 miles nearly west of Santa Rosa, 400 feet south of Hall Road,
27 feet west of Wright Road, in open field. Unused well; diameter, 12 inches; depth, 57.7 feet. Measuring point: top of casing, south side, 1.0 foot above land-surface datum, which is 95 feet above sea level]
Sept. 29, 1949 Oct. 14 __ .. .....
21 ._ _
10 ._. 23 ...........
28 __.__... Jan. 12,1950... _ .....Feb. 28 _..-.
9.579.939.91
10.0210.0510.1510.0910.169.922.56
Mar. 28, 1950. __ ...Apr. 28 ....... _ .
July 6 ...........
Sept. 15 ..... _ ...Oct. 16 ..... . _ ..
Apr. 11, 1951.. .........
2.123.915.866.507.639.149.981.983.605.07
Oct. 16,1951 ___ ......
Apr. 2,1952 _ . __ ..Nov. 20 ...........Apr. 17, 1953. ........Nov. 3 ...........Apr. 1, 1954.. .........Apr. 1, 1955. .. __ ...Apr. 4, 1956 ___ . .....Mar. 14, 1957. .. __ . ...
9.112.8C2.22
10. «3.74
10. 0{1.253.933.4^4.1'
Well 7/8-23N1
[National Ice and Cold Storage Co., 8 Sebastopol Avenue. In Santa Rosa, 270 feet south of Sebastopol Avenue, 250 feet east of Northwestern Pacific Railroad tracks, 60 feet east of plant buildings, 130 feet north of well 7/8-32D2. Commercial and industrial well; 6 feet square in dug portion, 37.0 feet deep (dug por tion), reported to be 150 feet deep (including drilled portion). Measuring point: lower edge of access hole in well cover, 0.2 foot above land-surface datum, which is 145 feet above sea level. Well is pumped steadily daily, the dug portion acting as a sump; (most measurements were made during first part of morning to obtain highest level of the day)]
Oct. 13, 1949-.. -21
10 ___ T\et> 7
28 __. .Jan. 12,1950
17.6518.1018.2517.6517.3915.18
1 16. 73
Feb. 28,1950 ___ .....Mar. 29Apr. 28 ......
July 14
19.289.38
10.7712.6914.7022.7224.59
Oct. 18, 1950 ___Dec. 29Apr. 12,1951 __
Oct. 18Dec. 4Apr. 2, 1952 _ .. __ ..
17.208.409.65
11.5123.5614.628.33
i Afternoon measurement.Well 7/8-29Q1
Santa Rosa Naval Air Base. About 3.3 miles southwest of Santa Rosa, 0.10 mile south of Finley Avenue, 155 feet east of Wright Road, in frame pump house. Unused well; diameter, 8 inches; depth, 61.7 feet. Measuring point: top of casing, south side, at land-surface datum, which is 94 feet above sea level]
Nov. 17, 1949 _ 23 ._.... 30
Dec. 714 __ .... ...2128 .....
Ton 4 1Qt>n11 ___ .......18 __ .......25 ....
Feb. 1 ._.. .8 _
15 .... _ .22 ........
Mar. 1 .... 8
14 ... ....21 ...... 28
13 ..... .2128 __ . _ ...
10.94
10.8210.6910.6310.4910.38
10.118.777.306.004 564.084.084.354.484.634.553.483.864.024.505.12
May 9,1950 _ ........16 ...........24 ._
8 _-._ _16 23 ..... 30 . .
July 71420 __ .... 28
11 ...........18 _.... 25 -.. ..
15
29Oct. 8
16
6.036.186.777.557.888.298.419.209.559.44
10.039.78
10 4011.0311.0511.0611.3111.61
11.23511.31511.3811.7311.35
Oct. 20,1950- .27
Nov. 3 ... ..1017 _. ..-.24 __ ..30 ...........
152229 ...- .
Jan. 5,1951 _ 121926
Feb. 2 ....... 7
15 ...... .21
Mar. 19 ...........
15 ____ ....
11.2711.1310.9610.9010.679.0058.386.184.804.284.294.363.682.962.583.142.802.482.672.962.732.84

214 GROUND WATER IN SANTA ROSA AND PETALUMA VALLETS
TABLE 19. Water levels in wells, 1949-57, Santa Rosa Valley area, California Continued
Date Water level
Date Water level
Date Water level
Well 7/8-29R1
[Santa Rosa Naval Air Base. About 2.9 miles southwest of Santa Rosa, 0.09 mile west and 0.09 mile south of Intersection of Finley and Fresno Avenues, 400 feet south and 200 feet east of well 7/8-29J1,40 feet south of three wooden storage tanks, in white frame pump house designated by letter "T" on west end. Public supply well; diameter, 12 inches (reduced to 10 inches); depth, 682 feet. Measuring point: bottom-edge of pump base, east side, 1.3 feet (including horizontal distance of 0.3 foot from measuring point to top of casing) above land-surface datum, which is 97 feet above sea level]
Oct. 4,1949 __14 . - ..21
10 --_- 17
28 ...........
120.8621.00
124.8320.7920.1820.1220.44
1 18. 73
Jan. 12, I960--- ~Feb. 28 ... Mar. 28 ___________Apr. 28 -_ ___
July 7 ___________Aug. 11
19.6417.5315.3015.1618.35
2 21. 342 31. 13
Oct. 16
Mar. 15, 1951... ........Apr. 12 . .......
Dee. 6 ___ ...
24. 2121.2.18.116.6!15.820.033.7
Well nearby being pumped. Well nearby pumped recently.
Well 7/8-31C1[M. LaFranehi (C. H. Dotti, tenant). About 2 miles east-northeast of Sebastopol, 0.22 mile northeast of
intersection of old Sebastopol Road and State Highway 12, 30 feet southeast of old Sebastopol Road, in frame pump hous_e. Unused well; diameter, 12 inches (reduced to 10 inches); depth, 320 feet. Measuring point: top of casing, north side, at land-surface datum, which is 85 feet above sea level]
Aug. 11,1960 18 ... - .25 _.
8 __- _._1522 ..___ .29
Oct. 8 .._ . _1620 27
Nov. 3 _ _. _.10 _________17 ___-. ._.24 ...30
Dec. 816 _ 22 _ ...29 ...........
Jan. 6,1951.. 12 __.__
114.4016.22
115.3315.3015.6514.0313.8514.0513.9813.8813.84
U3.7313. 59513.6013.35512.1111.599.317.9257.537.487.537.09
Jan. 19, 1961- -26 . __.___.__
Feb. 2 .. _1521
Mar. 1 .... 9 .__..... .
16 ... 2330 .. ___
12 ._-.. 18 _ 26 .. -...
8 ..... 15 ..... 23 .-.- ...
1014 ..__.
28 .__
6.315.936.155.495.615.705.465.605.986.316.657.017.097.417.297.007.317.72
12.0911.5910.65
i 11. 161 13. 31
July 17,1951 __26 . .__
915 __ 24 . .....31
Oct. 1624
Nov. 7 ... .....16
Dec. 4Jan. 4, 1852 .Feb. 7Apr. 4 . _____M&y 7
16July 27Nov. 20Apr. 4, 1956 __ .......Mar. 14, 1957 __ .. _ ..
12.22» 13. 06* 13. 56.
13.0212.86.12.5412.7&16.7514.7115. 0&13.8713.4512.487.506.936.7T7.05.7.71
13. IS16.5610.464.17
1 Nearby well being pumped. ' Nearby well pumped recently.
Well 7/9-1C1
[P. W. Bussman. About 2.2 miles west-southwest of Fulton, 0.33 mile north and 0.56 mile east of the inter section of Woolsey and Olivet Roads, 360 feet north of abandoned railroad fill, 30 feet west of field road, at edge of hopyard, in frame pump-house tool shed. Domestic and industrial well: diameter, 10 inches; reported depth 110 feet. Measuring point: top of casing, southeast side, 0.4 foot above land-surface datum, which is 90 feet above sea level]
Nov. 24, 1941 _ ........Oct. 5,1949 _
14 ... __.21 -....
10 ._ ...17
Dec. 28 _. ...Feb. 1,1950..
28 .
1418.10
2 14. 91M2.692 12. 452 11. 74
11.4914.049.769.24
Mar. 29,1950 Apr. 28
July 13 ._. A ncr Q
Sept. 15 .... _____..Oct. 17 Dec. 28 _Apr. 10,1951 .Oct. 18 ...
7.0012.7223.9926.7030.4418.6514.049.50
11.4523.44
Dec. 4, 1951 __ .... . ...Apr. 2, 1962 .. .Nov. 20 .__._..Apr. 16,1953 _ .. __ ._Nov. 4, _.__ ...Apr. 1,1954 _ ..____-Apr. 1,1955.
Mar. 14, 1967
19.6215. 4&18.4612.3620.44
213.5018.5618.4119. 2»
i Measurement by U. 8. Bureau of Reclamation. ' Pumping recently.

TABLES OF BASIC DATA 215
TABLE 19. Water levels in wells, 1949-57, Santa Rosa Valley area, California- Continued
Date Water level
Date Water level
Date Water level
Well 7/9-5N1
[Petri Wine Co. In Forestville, 140 feet north of State Highway 12, 200 feet east of Covey Road, 20 feet west and 25 feet south of winery office, in corrugated-metal pump house. Industrial well; diameter, 12 inches; depth, 292 feet. Measuring point: hole in south side of pump base, 1.5 feet above land-surface datum, which is 170 feet above sea level]
July 20,1950. . --A n0" QSept. 15Oct. 18 -
' Pumping. 2 Pumping recently.
32.62i 46. 96
34.911 48. 90
Dec. 29,1950- Apr. 13, 1951-
23.00133.5
35.60
Oct.Dec.
16,1951 _ ........64,1952 __ ........
151.825.54
225.7
Well 7/9-10E1[ W. A. Taylor Wine Co., 2119 Laguna Road. About 7.6 miles west-northwest of Santa Rosa, 300 feet west of
Laguna Road, 275 feet south of School Road, in eastern storage room of winery, 40 feet west of east wall, 65 feet north of south wall. Industrial well; diameter, 8 inches; depth, 260 feet. Measuring point: top- inside edge of curbing at air line at west side of casing, 2.4 feet above land-surface datum, which is 200 feet above sea level]
July 14, 1950-
Sept. 15 ... ... .....
46.7550.75
i 51. 35
Oct. 18, 1950- Dec. 29 ....... ...Apr. 13,1951.-
151.8751.3349.84
Dec. 4 .... _ ....Apr. 4,1952-
49. 2C50.0547. 4*
i Pumping recently.Well 7/9-13M1
[C. Ketelsen, 3772 Guerneville Road. About 3.5 miles north-northeast of Sebastopol, 0.20 mile east and 0.10 mile south of the intersection of Guerneville and Olivet Roads, 300 feet southeast of dairy barn, at north side of earthen reservoir, beneath frame pump house. Irrigation well; diameter, 12 inches (reduced to 8 inches); depth, 316 feet. Measuring point: bottom of pump base, esat side, 1.1 feet (includes horizontal distance of 0.4 feet from edge of pump base to inside edge of casing) below land-surface datum, which is 75 feet above sea level]
Alter 1Q41Oct. 5,1949.
14 - 21
10Dec. 7
U426.02
226.0023.5523.6023.2923.17
Dec. 28,1949- Feb. 1,1950-
28 -- -Mar. 29 -_ Apr. 28 _-....
July 13 ...........
23.1522.1622.9021.0319.9922.5725.02
Aug. 9,1950 __ ........Oct. 16
Oct. 16 -- - Dec. 4 . __ . ..Apr. 2, 1952... .
26.1"30.1'28. 7*35.7421.5
»23.0I
i Reported by driller.5 Nearby well being pumped.
8 Pumping recently.Well 7/9-13M2
1C. Ketelsen, 3772 Guerneville Road. About 3.5 miles north-northeast of Sebastopol, 0.22 mile east of Olivet Road, 100 feet south of Guerneville Road, 60 feet southwest of windmill, 175 feet northeast of well 7/9- 13M3, beneath small wooden pump shelter. Domestic well; diameter, 5 inches; reported depth, 60 feet. Measuring point: top of casing, west side, 0.5 foot above land-surface datum, which is 85 feet above sea level]
Oct. 5, 1949 14 . .....
Nov. 410 - -_..
19.8320.7018.6719.44
28 __ .......Feb. 1,1950 .. .Mar. 29 _ __ .. ...
18.0818.3314.7412.72
June 14, 1950 _ . _ ....Apr. 13, 1951... ...Oct. 16
16.5914.7912.91
Well 7/9-13M3
1C. Ketelsen, 3772 Guerneville Road. About 3.5 miles north-northeast of Sebastopol, 0.20 mile east and 250 feet south of the intersection of Guerneville and Olivet Roads, 150 feet north and 50 feet east of well 7/9-13M1,10 feet north and 70 feet east of southeast corner of milking shed, in the open. Auxiliary dairy well; diameter, 6 inches; reported depth, 45 feet. Measuring point: top of casing, east side, 1.0 foot above land-surface datum, which is 75 feet above sea level]
Mar. 29, 1950 ______Apr. 28 ......
July 13 .....
«7.401 13. 421 13 28
15.42
Aug. 9,1950- Oct. 16 -- _ ...
Apr. 13, 1951....
17.2812.83.535.06
Oct. 16, 1951- Dec. 4 Apr. 2,1952 _ .... ....
12.413.622.80
'Pumping.

216 GROUND WATER IN SANTA ROSA ANI> PETALUMA VALLEYS
TABLE 19. Water levels in wells, 1949-57, Santa Rosa Valley area, California- Continued
Date Water level
Date Water level
Date Water level
Well 7/9-21F1[O. O. Barion, 3950 Mueller Road. About 3.4 miles northwest of Sebastopol, 0.09 mile north of the inter
section of Graton, Mueller, and Hicks Roads, 50 feet east of Hicks Road, 125 feet west and 10 feet north of dwelling, 10 feet south of tank house. Domestic well; diameter, 8 inches; depth, 320 feet. Measuring point: top of notch in east side of casing, 1.0 foot above land-surface datum, which is 200 feet above sea level]
June 23,1950 __ ... ... .Aug. 9 ...... .....Sept. 15Oct. 18 -_ -
62.9576.5065.2866.40
Dec. 29,1950... __Apr. 13,1951 _ ____
56.6159.562.04
Oct. 16, 1951... ____ .Dec. 6 ........ ...Apr. 4, 1952 ... ......
69.6658.2151.39
Well 7/9-35D2[P. Brunwin, 680 East Hurlbut Road. About 1.0 mile northwest of Sebastopol, 0.22 mile east of Hurlbut
Avenue, 0.08 mile north of East Hurlbut Avenue, 20 feet northeast of dwelling, at southeast end of pump house. Domestic and stock well; diameter, 8 inches; depth, 167 feet. Measuring point: top of casing, south side, 1.0 foot above land-surface datum, which is 135 feet above sea level]
Apr. 12,1950 _ .. _
July 13 ...- .
Sept. 15 ... - Oct. 18,Dec. 29 _... .
35.7036.3938.0337.1037.6838.1036.73
Apr. 11, 1951 _
Oct. 16
Apr. 4,1952- Nov. 20 ...........Apr. 17,1953-
37.634.0735.5035.9733.4230.1036.11
Nov. 3, 1953. . Apr. 2, 1954- __ ......Apr. 1, 1955 ____ ....Apr. 4, 1956.. _ ......Mar. 14, 1957
17.9036.434.530.1630.83
Well 7/9-36F1
[W. L. Hepworth. About 1.1 miles east-northeast of Sebastopol, 0.6 mile southwestward, along State Highway 12 from Llano Road, 0.25 mile northwest of State Highway 12, 600 feet north-northwest of dwell ing, 17 feet west of fence, in frame pump house. Irrigation well; diameter, 10 inches; depth, 270 feet. Measuring point: top of casing, east side, 0.6 foot above land-surface datum, which is 85 feet above sea level]
Oct. 4,1949 ... 1421 ___
Nov. 4 _-.. - 10
flan OQ
31.3531.4531.42
133.8532.3732.23
Jan. 12,1950 .........Feb. 28Mar. 29 .... .......Apr. 28 ' ...........
July 13
29.2627.4826.82
* 45. 951 51. 55a 55. 40
Aug. 8,1950 ______ .
Apr. 10
Apr. 4,1952. . _ .
i 40 47"60.60
31.06MO. 66
35.1028.23
1 Pumping recently. 8 Pumping.
Well 8/8-19E1[J. Dragoman, Route 1, Box 197. About 1.8 miles southeast of Windsor, 0.12 mile east of Hembree Lane,
0.09 mile north of Shiloh Road, 85 feet north and 25 feet west of dwelling, in the open. Irrigation well; diameter, 10 inches; depth, 142 feet. Measuring point: bottom-edge of pump base, west side, 1.0 foot above land-surface datum, which is 105 feet above sea level]
1ST ATT S 1 QdQDec. 7 __
28 ...........Feb. 1, 1950
28 __. . Mar. 29 ....... .Apr. 28 _ . .
10.47 9.22 6.88 6.59 5.13 4.90 4.86
i 37. 66
Oct. 17 ...........
Apr. 12, 1951-Oct. 18 _ .... .
i 39. 05 138.30 i 41. 21
14.73 6.65 7.70
15.62 9.85
Apr. 2,1952 ____ ...Nov. 20 ... .... ...Apr. 16,1953 ___ ......Nov. 4 ...........Apr. 1, 1954- .......Mar. 31, 1955- Apr. 4, 1966. ..........Mar. 14, 1957 _ ... .....
4.20 17.74 7.99
17.90 7.98 9.93
10.97 16.50
1 Pumping. Well 8/8-20D1
[J. Henningsen, 6030 Redwood Highway North. About 2.3 miles north of Windsor, 0.27 mile north and 0.18 mile east of the intersection of U. S. Highway 101 and Shiloh Road, 250 feet north and 210 feet east of
, . a, , . ing point; tapped hole in top of pump base, northeast side, 1.0 foot above land-surface datum, which is 145 feet above sea level]
Apr. 28,1950-
Aug. 9 ... -
38.021 42. 06
47.86143.8
41.88
Oct. 18,1951.
Apr. 2, 1952 __ .......
46.3942.8037.63
' Pumping recently.

TABLES OF BASIC DATA 217
TABLE 19. Water levels in wells, 1949-57, Santa Rosa Valley area, California Continued
Date Water level
Date Water level
Date Water level
Well 8/8-20E1
J. Henningsen, 6030 Redwood Highway North. About 2.3 miles north of Fulton, 0.2 mile north and 0.2 mile east of the intersection of U. S. Highway 101 and Shiloh Road, 230 feet east of dwelling, 20 feet north of branch of small creek, in frame pump house. Stock and orchard-spray well; diameter, 8 inches; reported depth, 100-110 feet. Measuring point: Ji-inch hole in pump base, northwest side, 1.0 foot above land- surface datum, which is 145 feet above sea level]
Nov. 21, 1949 ______Feb. 28,1950 __ . _ ...Mar. 29 __ . ___Apr. 28
36.8828.14
>32.2526.82
»35.25
July 13,1950-
Sept. 7 _____ .Oct. 17 ...........Dec. 28 ...........
31.633 35. 70
34.3635.1528.34
Apr. 12, 1951.. ......
Oct. 18 . .......Dec. 4 .... .......Apr. 2, 1952 ...........
24.6327.3034.6328.1425.91
1 Nearby well being pumped. »Nearby well pumped recently. » Pumping recently.
Well 8/8-20E2
[J. Henningsen, 6030 Redwood Highway North. About 2.3 miles north of Fulton, 0.20 mile north and 0.13 mile west of the intersection of U. S. Highway 101 and Shiloh Road, 80 feet south of dwelling, beneath north edge of elevated storage tank and windmill. Domestic well; diameter, 6 inches; reported depth, 100 feet. Measuring point: bottom of irregularly broken hole in west side of pump, 2.1 feet above land- surface datum, which is 145 feet above sea level]
Feb. 28, 1950 ...........Mar. 29 ___ . ....Apr. 28 ____ . _
July 13 __ . _ ...
16.6314.3916.7320.8417.98
Aug. 9,1950 ___ ..Sept. 7 ____ - ...Oct. 17 __ . .....Dec. 28Apr. 12, 1951 ______
27.7432.1934.0814.7715.47
June 6,1951 ._........_Oct. 18 ____ ..Dec. 4Apr. 2,1952 .....
20.8828.8511.32
122.18
1 Probably pumping recently.
Well 8/8-30N2 (former Fulton Air Base Well 3)
[Nagy. About 1.6 miles west-northwest of Fulton, 0.37 mile south of Lone Redwood Road, 65 feet west of paved road (designated "B" street by Army), 60 feet east of swimming pool. Unused well; diameter, 12 inches; depth, 600 feet. Measuring point: hole in top of steel plate welded over casing, at land-surface datum, which is 120 feet above sea level]
Mar. 27, 1951. .....
13 __ . .....18 - __ ......26 ___ . .....
May 1 ...........8
15 __ . .....23 _-.........
June 2 ..._.......10 .....___
21.7121.9522.5322.4122.5922.6122.4222.4122.8623.9625.11
June 14,1951- . _ .22 __..... ....28 .-. . .
July 17 ...........27 ...........
Aug. 210 .... ..... ..15 __ ... ....24 -.__ 31 ......
Sept. 13 ...........
25.4125.6227.0027.1627.4427.9128.4228.3529.5429.4429.07
Sept. 20, 1951 - _ .-Oct. 18
23
16Dec. 6 . ___ .Jan. 4,1952. ..........Feb. 7 ...........
July 15 .......
29.0828.5927.6727.6227.3625.8524.4822.8822 1422.7327.70
Well 8/9-10B1
[R. Hogan. About 1.1 miles west of Windsor, 0.58 mile west of Starr Road, 650 feet north of River Road, 100 feet north and 300 feet east of elevated storage tank, in frame pump house. Domestic well; diameter, 10 inches; depth, 400 feet. Measuring point: top of westernmost of two horizontal holes in south side of pump base, 1.5 feet above land-surface datum, which is 165 feet above sea level]
Jan. 10, 1950 __ .. ....Feb. 1 ... ......
28 ______ .Mar. 29 __ ......Apr. 28 ___ .. ...
80.1579.0382.0177.8077.8676.02
July 13, I960- ......Aug. 9 __..... _ .
Oct. 17Dec. 28 .... ....
73.5372.9273.5574.0272.07
Apr. 12, 1951 ______
Oct. 18 ...........Dec. 4 ...........Apr. 2, 1952... ........
70.6174.9674.3372.8879.82
443616 58 15

218 GROUND WATER IN SANTA ROSA AND PETALUMA VALLEYS
TABLE 19. Water levels in wells, 1949-57, Santa Rosa Valley area, California Continued
Date Water level
Date Water level
Date Water level
Well 8/9-12Q1
[D. DuVander, Route 1, Box 86. About 0.6 mile due east of Windsor, 400 feet north and 350 feet east of intersection of U. S. Highway 101 and Brooks Boad, 200 feet east of dwelling, on north side of ranch road and at south edge of orchard. Domestic and orchard-spraying well; diameter, 8 inches; reported depth, 124 feet. Measuring point: west edge of 2-inch pipe entering casing on west side, 0.5 foot above land-surface datum, which is 115 feet above sea level]
Dec. 7 . .....Feb. 1, 1950-
28Mar. 29 .........Apr. 28 __.........
19.4220.5316.7914.4313. 54
i 25. 05
Tnno Id IQ^ftJuly 13 _- A Tl(r Q
Oct. 17 .... ....
16.9722.10
i 32. 402 30. 97
22.30
Dec. 28,1950- .. __ .Apr. 12,1951- Oct. 18 ____ -.
Apr. 2.1952...........
16.0318.6221.6018.3412.06
1 Pumping.2 Probably pumping recently.
Well 8/9-15F1
[Warren Bichardson. About 1.7 miles west-southwest of Windsor, 0.46 mile south of Biver Boad, 35 feet west of Eastside Road, beneath elevated pump house. Domestic and stock well; diameter, 8 inches; depth, 100 feet. Measuring point: bottom outside edge of notch in casing, east side, 5.0 feet above land- surface datum, which is 75 feet above sea level]
Nov. 29, 1949 _ . ....
28 Feb. 1,1950 _ ........
28 --.. ..Mar. 29 . .........
32.5133.7933.8
> 26. 1711.8511.32
July 13,1950. Sept. 7 _-._ Oct. 17 __. -Dec. 28 ...........Apr. 12,1951.
18.1018.0017.0511.8315.14
Oct. 18,1951 __ ........Dec. 4 _ _____ .Apr. 2, 1952-. Nov. 20Apr. 16,1953. . .
24.0813.7611.4916.0314.32
Pumping recently.Well 8/9-15M1
[L. S. Quinan. About 1.9 miles west-southwest of Windsor, 0.63 mile south of Biver Boad, 0.18 mile west of Eastside Road, 35 feet south of field road, in orchard. Irrigation and orchard-spray well; diameter, 8 inches; depth, 420 feet. Measuring point: bottom-inside edge of notch in casing, east side, 0.5 feet above land-surface datum, which is 70 feet above sea level]
Nov. 23, 1949-.- -...Dec. 7
28 .... ....Feb. 1, 1950 ... . .-
28 . ....Mar. 29Apr. 28
14.9014.9214.8111.0613.06
i 10. 42i 13. 67
July 13 ...... Aug. 9 .____ Sept. 7 --_ -Oct. 17 ...........Dec. 28 ...........Apr. 12, 1951 _ ........
15.23i 18. 3515.6615.8115.7511.6513.44
Oct. 18 _____ --
Apr. 2, 1952. ..........Nov. 20 - .-_ Apr. 16,1953 _ ........
14 6417.5915.8312.8114.9112.98
Pumping recently.Well 8/9-36N1
[P. W. Bussman. About 2.4 miles west-southwest of Fulton, 0.46 mile north and 0.44 mile east of the Inter section of Woolsey and Olivet Roads, 1,145 feet north-northwest along field road from abandoned railroad grade to road crossing field, 440 feet south-south west along road crossing field, thence 60 feet north-north west, 18 inches southwest of used well 8/9-36N2. Unused well; diameter, 12 inches; depth, 89.0 feet. Measuring point: top of casing, south side, 0.2 foot above land-surface datum, which is 90 feet above sea level]
Oct. 14,1949 __ .... ....21
1017 ... ....
Dec. 7 -- 28 - .__.
Feb. 1,1950 28 ...........
10.2510.2710.4210.4110.4810.6310.786.904.19
A/Tor 9Q IQflfi
Apr. 28
July 13 .... .... A Tiff QSept. 15Oct. 16Tton 9S
Apr. 11,1951
4.895.716.80
»23.53124.25
9.159.673.485.49
Apr. 2,1952-
NOV. 4,1953-- .. _ -Apr. 1,1954. .Apr. 1,1955- __ ..Apr. 4,1956- Mar. 14,1957 _ ........
6.594.38
10.309.413.907.214.797.70
1 Nearby well being pumped.

TABLES OF BASIC DATA 219
TABLE 19. Water levels in wells, 1949-57, Santa Rosa Valley area, California Continued
Date Water level
Date Water level
Date Water level
Well 8/9-36P1[P. W. Bussman. About 2.3 miles west-southwest of Fulton, 0.46 mile north and 0.51 mile east of inter
section of Woolsey and Olivet Roads, 1,020 feet north-northwest along field road from abandoned railroad fill, 600 feet north-northwest along field road from well 7/9-1C1, 10 feet west of field road, in hopyard. Irrigation well; diameter, 12 inches (reduced to 10 inches); depth, 1,048 feet. Measuring point: top north side of casing at east side of notch cut for electric cable access, 0.8 foot above land-surface datum, which is 90 feet above sea level]
Oct. 5, 1949 _ 1421 __
Nov. 41017
Feb. 1,1950 28 ...........
21.86
21.8091 AH20.8719.3417.80
AT or 9Q 1 Q Py"l
Aiifr Q
Oct. 16Dec. 28Apr. 13,1951- May 23Oct. 18Dec. 7 -
17.3717.82
148.724.9524.3018.0217.2917.5341.8239.27
Apr. 2,1952-- Nov. 20Apr. 16,1953.
Apr. 1, 1954 _Apr. 1, 1955 _Apr. 4, 1956 ___ ... _Mar. 14,1957 _ - __ .
34. 5830. 5a25.4240. 3»31.0033.6531.7038.25
Pumping recently.Well 9/9-34D1
IFoppiano Wine Co., Route 2, Box 222A. About 1.8 miles southeast of Healdsburg, 0.15 mile northwest of Limerick Lane, 235 feet west of U. S. Highway 101, 20 feet north of winery driveway, in 4-foot by 3-foot shelter built onto east end of workshop. Unused well; diameter, 10 inches; depth, 120.5 feet. Measuring point: top of casing, north side, 0.8 foot above land-surface datum, which is 105 feet above sea level]
f>nt 9A 1Q4.Q
Nov. 10
28 __ ___Feb. 1,1950-
28 . Mar. 29
30.1930.3931.0933.5314.70
17.27
Apr. 28,1950 _ .
July 13Aug. 9
Oct. 17
23.8026.6328.0428.9729.6830.15
Dec. 28,1950-- Apr. 10, 1951- June 6 -. _Oct. 18Dec. 4 .- __ .--.Apr. 2, 1952 _____ _
8.9022.0124.5829.535.96
11.23
Well 9/9-34N1[W. C. Beaumont, Route 1, Box 399. About 2.5 miles south-southeast of Healdsburg, 0.8 mile south of
Limerick Lane, 0.34 mile west along field road from U. S. Highway 101, in 8-foot by 8-foot frame pump house. Irrigation well; diameter, 12 inches; reported depth, 198 feet. Measuring point: Vi-inch hole in pump base, east side, 3.3 feet above land-surface datum, which is 85 feet above sea level]
Oct. 20, 1949- Nov. 10 . ___ . _Dec. 7
28 - _Feb. 28,1950- Mar. 29
14.82U6.28
15.28
14.0511.68
June 13,1950-- July 13 .... Aug. 9
Oct. 17
17.3215.0416.0815.1215.13
Dec. 28, 1950-.. -------June 6, 1951 . _ ...Apr. 2,1952 _ ...Nov. 20Apr. 16,1953 _
12.0215.1812.5616.6714.7
1 Pumping recently.Well 9/9-34Q1
[E. H. Reiman. About 2.6 miles southeast of Healdsburg, 0.7 mile south of Limerick Lane, 450 feet south of railroad underpass, 150 feet east of railroad, in old orchard. Stock well; diameter, 6 inches; depth, 55.2 feet. Measuring point: notch in casing, east side, 1.0 foot above land-surface datum, which is 110 feet above sea level]
Oct. 20,1949 __Nov. 10Dec. 7
28Feb. 1,1950 _ .....
28 ...........Mar. 29 ...... ..
23.6124.8824.1425.5623.6522.6922.02
Apr. 28,1950 _
July 13Aug. 9Sept. 7Oct. 17 -
21.77
126.5328.1727.8428.5
Dec. 28,1950 _Apr. 10,1951-.. ..
Oct. 18 ___Dec 4Apr. 2,1952..........
no o/B
99 91
26.1897 n*>o O»T
1O A.\
Pumping recently.

TABL
E 2
0.
Che
mic
al a
naly
sis
of w
ater
from
wel
ls i
n th
e Sa
nta
Ros
a V
alle
y ar
ea,
Cal
iforn
ia[T
he l
abor
ator
ies
whi
ch a
naly
zed
the
sam
ples
are
ind
icat
ed b
y sy
mbo
ls a
s fo
llow
s: G
S, U
. S.
Geo
logi
cal
Surv
ey,
Qua
lity
of W
ater
Bra
nch;
U.
C.,
Uni
vers
ity o
f Cal
iforn
ia,
Div
isio
n of
Pla
nt N
utri
tion;
CW
S, C
alifo
rnia
Wat
er S
ervi
ce C
o.;
BC
, B
row
n an
d C
aldw
ell,
cons
ulta
nts]
Sum
of d
eter
min
ed c
onst
ituen
ts:
the
arith
met
ic s
um, i
n pa
rts
per
mill
ion,
of a
ll co
nstit
uent
s de
term
ined
, exc
ept f
or b
icar
bona
te, f
or w
hich
the
fig
ure
was
hal
ved
befo
re a
dditi
on.
Bor
on a
nd p
hosp
hate
, if
dete
rmin
ed,
are
incl
uded
onl
y w
hen
they
exc
eed
1.0
part
per
mill
ion.
T
he c
once
ntra
tion
of s
odiu
m w
as c
ompu
ted
by d
iffer
ence
and
incl
udes
the
conc
entr
atio
n of
pot
assi
um p
lus
any
erro
r of a
naly
sis.
Wel
l or
loca
tion
No.
5/9-
3G
1
6/6-
5L
1...
5L
1...
5L3
i..
16B
2...
16H
1
16
J2..
..
6/7
-16
D1
29
P1-
31H
1...
6/8-
5E
1__-
15
J3...
- 6/
8-16
R1-
- 2302...
25Q
1-..
26N
1
36A
1...
6/9
-2C
13
-.2F
1 ».
.7/
7-17
A1.
..
18R
1
24A
1...
29L
1...
29L
2...
32G
1
7/8-
9Q
1--.
9
R1
...
14D
1...
Analysis
by
OS
BC
O
S O
S O
S U
C
UC uc
cws
cws
GS
CW
Scw
s cw
s cw
sG
Scw
suc B
C
BC
( )
U
C
UC
U
C
BC
B
C
BC
Date
of
collection
8-30
-51
9-20
-51
6- 5
-52
5- 8
-52
9-19
-51
5-22
-51
10-2
5-49
2-
23-5
0 5-
26-4
7
6-26
-47
8-29
-51
5-27
-47
6-27
-47
6-27
-47
6-26
-47
4- 4
-52
6-26
-47
10-1
0-51
6-
19-4
8
1-22
-48
3-19
-45
5-27
-51
6-22
-51
10-2
6-51
2-
18-5
0 2-
10-5
0 2-
10-5
0
Depth
of
well
(feet)
1,01
0 13
3 6 21
1 21
0 28
0 38
197
298
638
166
568
(8) 246
636
260
600
846
160
622
365
365
403
140
210
300
Specific conductance (microm
hos at
25°C)
550
568
611
672
550
5.r*
300
434
286
451
339
588
357
455
282
278
360
597
610
450
500
490
464
447
449
& 9.1
7.6
8.0
8.2
8.3
8.6
7.0
7.6
7.3
7.8
8.0
7.7
8.2
7.7
7.2
8.3
7.6
8.1
8.5
8.3
8.0
7.7
7.2
Sum
of
determined con
stituents
(ppm)
342
375
430
442
314
316
145
274
196
302
226
368
228
289
191
205
<329 40
4 93 270
290
292
Con
stit
uent
s in
par
ts p
er m
illi
on
Silica
(SiOj)
20
57 81 74 44 42
47
41
67
43
35 46 95
Iron
(Fe)
0.18 .1
4
.03
4.7
0.10
0 1.
6 .06
.33
.32
.86
.98
Manganese
(Mn)
0.14 .03
.07
.03
.03
.03
.09
0 .12
.10
.20
<.3
2.5
4
Calcinm
(Ca)
7.6
18 15 3.7
5 15
10
30 28
20
32
33
31
39
14
18 50
31 34 4 30 30
30
Magnesium (Mg)
3.9
8.3
6.2
4.6
<5
10
15
17 12
12
14
16
21
21
9.2
3.7
10
25 21 8 15 15
10
Sodium (Na)
118
105 90 112
134
120 90
30
39 14
64
19
66
14
27
35
33 20
68 64
23
45 50 75
8 'S
h 0.4
13 9.0
1.0
Carbonate
(COa) 21
0 0 0 5 20 0 15 0 0 25 25
Bicarbonate
(HCOa)
236
273
282
300
195
120
130
242
144
246
204
244
214
212
108
140
339
346 98
24
0
320
265
Sulfate
(SO«)
23 .8 .3
.8
<
5
23
<5 3 2 1.
7 6 3 4 11 3 15 2.5
2.9
3 5 5 <
5
Chloride
(Cl)
32
51 58
60
80
90
20
19 13
26 9 62 9 22
33 30 20
32 16 6 30 30
20
13 10 10
Nitrate
(NO») 0 0
1.2 .5 2.5
14 8.7
0 .6
.7
30 2.5
5 3.5
1.0
......
§ I M 0.54
2.5
3.5
7.7
6.2
7.7 .64
.23
.04
.28
.36
.32
Fluoride
(F) 0.5 .7 .8
.3 0 .....
----
-
Hardness as
calcium carbona
te (CaCO
a)
35
68 63 28
15
80
87
145
120
100
137
149
163
183 73
61 14
5 18
0
172 43
135
145
115
130
146
168
* » £ 88 77 75
88
95
70
43
37 20
58
22
49
15
24
51
53 20
45 45
53
43 44
59
Typ
e of
w
ater
Na-
HC
Oj.
Do.
Na-
HC
Oj.
Do.
D
o.
Na-
Cl-H
CO
a.
Mg,
Na-
HC
Oa.
N
aCa,
Mg,
- H
CO
a.
Ca,
Mg-
HC
Os.
N
a-H
CO
s.
Ca.
Mg-
HC
Os.
N
a-H
CO
j. M
g.C
a-H
CO
s.
Ca.
Mg-
HC
Oj.
Na-
HC
Oj.
Ca-
HC
Os.
N
a.M
g.C
a-
HC
Os.
D
o.
Na-
HC
Os.
N
a,C
a,M
g-
HC
Os.
D
o.
Na-
HC
O».
to
to o I \ w

7/8-
15G
l._
18M
1.
19J1
...
20C
1--
20K
1..
24A
2..
24 A
3..
24A
4-.
24A
6-
29J1
...
29J1
...
7/9-
13M
1..
13R
1--
14K
1-.
23F
1-.
29J2
8/8-
20Q
1
8/9-
10R
1.
1301
.
13N
1...
14
P1
...
15
F1
...
23
F1
...
23Q
1
23L
1...
23L
1...
23L
1...
26D
1...
27K
1...
36K
1...
UC
UC
BC
BC
BC
BC
BC
BC
BC
GS
UC
U
C
UC
G
S
GS
GS
GS
UC
UC
GS
UC
UC
UC
UC
UC
UC
UC
UC
UC
3-14
-60
12-2
3-51
2-10
-50
2-14
-50
2-17
-50
1-26
-48
1-19
-48
1-19
-48
8-31
-50
2-26
-45
2- 8
-50
4- 2
-52
2-14
-52
10-2
3-50
8-27
-51
8-30
-51
8-30
-51
4- 2
-52
4- 2
-52
7-26
-50
7-26
-50
4- 2
-52
7-26
-50
7-26
-50
7-12
-50
7-26
-50
9- 8
-50
7-20
-50
7-26
-50
7-25
-50
Fal
l 19
50
65 640
186
625
626
930
300
1,00
0
685
325
375
588
610
657
312
400
202
175
264
100
130
224
410
?227 45
633
31,
325
810
480
524
722
475
Fid
*)
617
550
479
460
250
600
580
350
420
630
214
246
270
200
660
300
470
<inn
400
440
380
430
700
650
7.2
7,2
7 7
7.6
7 9
80
8.0
8.0
7 4
7.4
7.6
7,1
7 2
8 ?,
7 6
8.4
7.2
7.3
7.1
7.3
7 6
8 1
7,6
7.7
73
7.8
7 7
427
262
339
344
364
392
301
350
336
205
286
378
197
227
152
106
190
278
267
258
200
251
407
333
86 89 93 89 45 49 88 R4 10?
.90
.93
.06
.23
.29
.33
.27
.39
.44
.77
.22
.09
.13
.09
.07
.1 .28
50 15 28 30 28 9Q 20 14 16 15 15 30 23 4.8
9.6
15 15 18 15 15 15 30 15 10 16 15
65 5 17 19 16 18 17 6.6
6 10 5 13 25 4.1
12 15 10 27 15 10 10 25 10 5 6 15
25 85 52 48 69 68 61 32 120
110 65 40 51 31 23 25 15 78 45 85 75 25 65 85 150
inn
2.2
7.5
7.1
2.8
0 0 0 0 0 0 0 0 10 16 25 20 20 15 25
385
265
286
280
285
290
258
350
230
180
183
271
116
110
145 75 150
215
160
100
170
300
335
45 <5 .4 2.1 .9 9.9
6.4
<5
<5
<5 43 21 1.
81.
0
<5
<5
<5 6
<6
105
<5
<5
<6
50 25 45 69 22 14 18 27 28 25 23 14 35 85 30 18 29 7.0
22 25 20 56 25 30 45 33 25 60 35
0 0 0 7.0
0.8
0 .1 0
0.06 .20
.06
.36
1.3 .16
.20
.21
.63
.43
.12
.04
.36
.16
.60
22
.44
.40
1.0
«2.4
.8
0
,2 2 .2 .2
390 70 202
278
170
140
153
144
147
120
105 62 70 75 40 128
160 29 73 100 80 156
100 80 80 178 80 45 60 100
IS 73 45 41 47 50 6? 63 78 76 78 40 40 64 39 40 M 52 61 70 71 22 66 80 86 68
Mg-
HC
Os.
Na-
HC
O8.
HC
Os.
D
o.
HC
Os.
N
a-H
CO
8.D
o.
Na.
Na-
HC
Os.
Do.
Do.
Na,
Ca,
Mg-
HC
Os.
HC
Os.
N
a-H
CO
s.
HC
Os.
HC
Oa.
f*a
TV/T
o1 ^"
ft.
HC
Os.
Na.
Na-
HC
Os.
Do.
Do.
Na-
HC
Os.
Do.
Do.
Do.
I en § a o
i Spr
ing.
* R
epor
ted
dept
h, 3
00-3
50 f
eet.
» Sam
ple
from
res
ervo
ir su
pplie
d by
thes
e tw
o w
ells
.* T
otal
sol
ids
by e
vapo
ratio
n, 4
01 p
pm.
4 Cal
iforn
ia S
tate
Div
isio
n of
Hig
hway
s, M
ater
ials
and
Res
earc
h D
epar
tmen
t.
6 Dep
artm
ent
of P
ublic
Wor
ks, T
wel
fth
Nav
al D
istr
ict.
* Plu
g se
t in
wel
l at i
ndic
ated
dep
th.
8 Sam
pled
dur
ing
pum
ping
sea
son.
Sam
pled
sev
eral
mon
ths
afte
r en
d of
pum
ping
sea
son.
Po
ssib
ly n
ot p
umpe
d fo
r su
ffic
ient
tim
e to
obt
ain
repr
esen
tativ
e sa
mpl
e.
to fcO
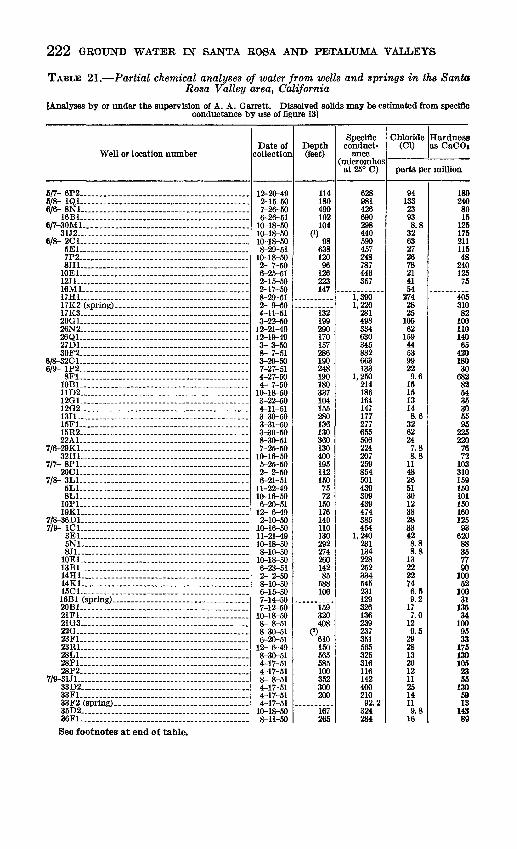
222 GROUND WATER IN SANTA ROSA AND PEfTALUMA VALLEYS
TABLE 21. Partial chemical analyses of water from wells and springs in the Santa Rosa Valley area, California
[Analyses by or under the supervision of A. A. Garrett. Dissolved solids may be estimated from specificconductance by use of figure 13]
Well or location number
6/7-6P2._____._.______.__.__._____________________6/8- 1Q1...... ............................. ........6/6- 8N1.__._ ............... _ ....................
16B1..... ................................. _ ..6/7-30M1.... ......................................
31J2....... ................ _ ..................6/8- 2C1...... .....................................
5E1__ _ .. __ ................. _ --__.-. ..7P2...........................................8H1..................... ......................
10E1..... .............................. __ ....12J1...... ........ __ ..........................16M1.. __ _.__-_- _- _ _. -._ _.____17H1...... .....................................17K2 (spring)... ................... __ ....17K3......................... ..... __ ......20G1_.._.__...-.. .-.-.-.. .._ .............26N2_.___ ......................................26Q1 .......-...-...-.-... .........-......27D1........ ...................................30F2............ _ _.-.-.-..__ - _.-__..
6/8-32C1.. .......--.-...-...-..... ..............6/9- 1P2.. .........................................
8F1...........................................10Bl.._.____...-..._.-._._.-_ ...............11D2..... ......................................1201...........................................12O2_..........................................13J1....... ....... ..............................15F1 _ ................... _ ..................15R2..... ..................... _ ..............22A1........... ... ...-.. .................
7/6-29K1..... ......................................32H1..... ..-___-.-. -_.-.-._...-.-.._-.-..__
7/7- 8P1 .. ..................................... .20Cl-._.-._ _-- _-.- ..
7/8- 3L1., ................ .........................5L1_, ...............-.-...-.-..._.....-.......8L1.. ................. ....... ._-...-..____
10P1............ ...............................19K1..... ................................. __ .
7/8-36D1....... ........ _ ...... __ ...............7/9- ICl.. __ ...... .. . .- .-.........
3E1... ........................................5N1...... ._....___ .-._._.-._.....-_._....._8J1........... ___ .. ____ . _ ..............
10E1..... ........ _ ...........................13B1........... ................................14H1......... ....... _ .......................14K1............. ..............................15C1-... .......................................16B1 (spring) ___ .. ______ . _______ .20B1.............................. .............21F1.... .......................................21O3-... .............. _ ......................22O.. ...... _ ..............................23F1.... ............................. .. ..23R1........ ............ _ . ___ .............28L1..................... ......................28P1................ ...........................28P2.. .................. _ . _ ................
7/9-31J1.-... _ ....................................33D2........ ...................................33F1____ .......................................33F2 (spring). .................................35D2........ _ ................................36F1-. .........................................
Date of collection
12-2CM9 2-15-50 7-26-50 6-26-51
10-18-50 10-18-50 10-18-50 8-29-51
10-18-50 2- 7-50 6-25-51 2-15-50 2-17-50 8-29-51 2- 9-50 4-11-51 3-22-50
12-21-49 12-19-49 3- 3-50 8- 7-51 3-29-50 7-27-51 4-27-50 4- 7-50
10-18-50 3-22-50 4-11-51 3-30-50 3-31-50 3-30-50 8-30-51 7-25-50
10-16-50 5-25-50 2- 2-50 6-21-51
11-22-49 10-16-50 6-20-51
12- 6-49 2-10-50
10-16-50 11-21-49 10-18-50 8-10-50
10-18-50 6-23-51 2- 2-50 8-10-50 6-15-50 7-14-50 7-12-50
10-18-50 8- 8-51 8-30-51 6-20-51
12- 6-49 8-30-51 4-17-51 4-17-51 8- 8-51 4-17-51 4-17-51 4-17-51
10-18-50 8-11-50
Depth(feet)
114180 490 102 104
(») 98
638 120 96
126 223 147
132199 290 170 157 286 190 248 190 180 337 104 155 280 136 130 360 130 400 195 112 150 75 72
150 176 140 110 130 292 274 260 142 85
588 100
159 320408
(2)610
150 565 585 100 352 300 200
167 265
Specific conduct
ance (micromhos at 25° C)
628 981 426 690 298 440 590 457 248 787 446 357
1,390 1,220
281 498 334 630 345 882 663 133
1,250 214 186 164 147 177 277 655 506 224 207 259 854 501 439 309 439 474 385 454
1,240 231 134 228 252 334 545 231 129 326 136 239 237 351 565 325 316 116 142 400 210 92.2
324 284
Chloride (01)
Hardness as CaCO»
parts per million
94 133 23 93 8.8
32 63 27 26 78 21 41 54
274 28 25
105 62
159 44 53 99 22 9.6
15 15 13 14 8.6
32 62 24 7.8 8.8
11 48 26 51 30 12 38 28 33 42 8.8 8.8
13 22 22 74 6.5 9.2
17 7.0
12 9.5
29 28 13 20 12 11 25 14 11 9.8
16
180 240 80 15
125 175 211 115 48
240 125 75
405 310 82
100 110 140 65
420 180 30
682 82 54 35 30 55 95
225 220
76 72
103 310 159 150 101 150 160 125 93
620 88 35 77 90
100 52
100 31
135 34
100 95 33
175 130 105 23 55
130 59 13
143 89
See footnotes at end of table.
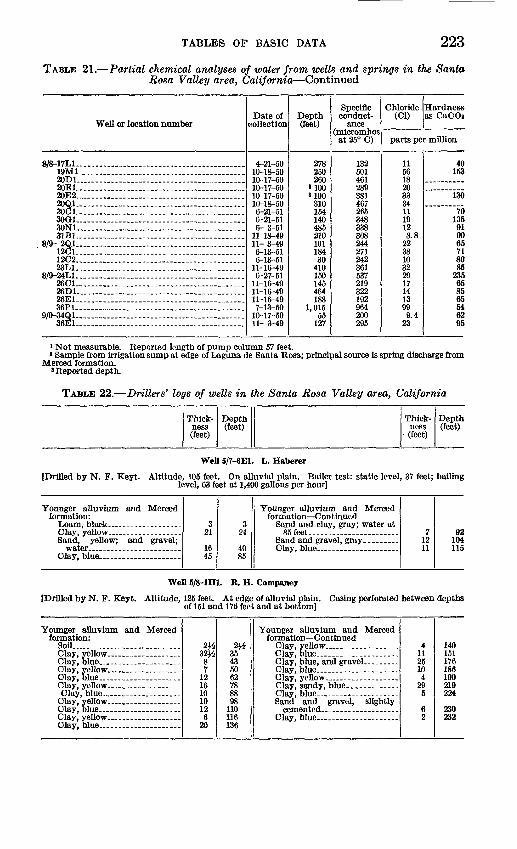
TABLES OF BASIC DATA 223
TABLE 21. Partial chemical analyses of water from wells and springs in the Santa Rosa Valley area, California Continued
Well or location number
8/8-17L1 .... . _ _ __ ...... _ . _ ....19M1.... ......................................20D1...................... ........... ..........20E1................ ...........................20E2........... .................................20Q1-.. -.. - .- .- ,. ..30C1. _ ..... _ ........ _ ........ _ ......30G1.._- ........... __ ......... _ ..... .......30N1.. _-..-. _ . ..................31B1..... ...... _ .... _ ......................
8/9- 2Q1. _ . _ ...................................12C1.... _. ..... ...... ...... ........12C2.................................. .......23L1.... - ..-- ,-- .-. _
8/9-24L1...........................................26C1. __ .....................................26D1.......... ...... ........................26E1................ ...........................36P1-. -- _ .-. .-._ _..- ...............
9/9-34Q1-... ........... - __ ._. -. ............36E1............. ..............................
Date of collection
4-21-50 10-18-50 10-17-5010-17-50 10-17-50 10-18-50 6-21-51 6-21-51 6-3-51
11-18-49 11- 3-49 6-13-51 6-13-51
11-16-49 6-27-51
11-16-49 11-16-49 11-16-49 7-13-50
10-17-50 11-3-49
Depth (feet)
278 250 260
«100 8 100
310 154 140 485 210 101 184 30
410 150 145 464 188
1,015 55
127
Specific conduct
ance (micromhos at 25° C)
132501 461 289 381 467 265 348 338 308 244 271 242 361 537 219 322 192 964 200 295
Chloride (01)
Hardness as CaCOi
parts per million
11 56 18 20 33 34 11 19 12 8.8
22 38 10 32 29 17 14 13 99 9.4
23
40 153
130
70 135 91 90 65 71 80 85
235 65 85 65 54 62 95
1 Not measurable. Reported length of pump column 57 feet.1 Sample from irrigation sump at edge of Laguna de Santa Rosa; principal source is spring discharge from
Merced formation. 8 Reported depth.
TABLE 22. Drillers' logs of wells in the Santa Rosa Valley area, California
Thickness(feet)
Depth(feet)
Thickness(feet)
Depth(feet)
Well5/7-6El. L. Haberer
{Drilled by N. F. Keyt. Altitude, 105 feet. On alluvial plain. Bailer test: static level, 37 feet; bailing level, 63 feet at 1,400 gallons per hour]
Younger alluvium and Merced formation:
321
1645
324
4085
Younger alluvium and Merced formation Continued
71211
92104115
Well 5/8-1H1. R. H. Companey
IDrilled by N. F. Keyt. Altitude, 125 feet. At edge of alluvial plain. Casing perforated between depths of 151 and 176 feet and at bottom]
Younger alluvium and Merced formation:
Soil... .................. .......
Clay, yellow __________
2W32^
87
12161010126
20
2&35435062788898
110116136
Younger alluvium and Merced formation Continued
4112510
4295
62
140151176186190219224
230232

224 GROUND WATER IN SANTA ROSA AND PETALUMA VALLEYS
TABLE 22. Drillers' logs of wells in the Santa Rosa Valley area, California Con.
Thickness(feet)
Depth(feet)
Thickness(feet)
Depth(feet)
Well 5/8-1 Jl. Faletti
[Drilled by A. J. Oberto. Altitude, 135 feet. On hillside. Casing perforated between depths of 44 and 60 feet. Bailer test: bailing level, 120 feet at_l,100 gallons per hour]
Merced formation:
Gravel, cement ________Clay.....-. ...............
2717
5121
274449
170
Merced formation Continued10
10010
180280290
Well5/8-lLl. Mrs. Reeves
[Drilled by N. F. Keyt. Altitude, 240 feet. On side of ridge. Bailer test: static level, 70 feet; bailing level,100 feet at 280 gallons per hour]
Merced formation: Topsoil .._ __
water, 5V ....................
Gravel... _____ __ ..
3198
17
530
8155
3223047
528290
105110
Merced formation Continued4515
527
36
1527
155170175202205211
4226253
Well 5/8-13B1. S. Pozzi
[Drilled by N. F. Keyt. Altitude, 45 feet. On alluvial plain.lBailer test: static level, 12 feet; bailing level,48 feet at 25 gpm]
Younger alluvium and Merced formation:
Abode soil ____________Sand; first water at 22 feet_...
389
392
Younger alluvim and Merced formation Continued
80 172
Well6/6-4Jl. Mr. E. Heins
[Drilled by J. Larbre. Altitude, 405 feet. At foot of low ridge. Cased between surface and depth of 86 feet. Dump test: static level 7 feet; pumping level, 100 feet at 400 gpm]
Sonoma volcanics: Volcanic conglomerate forma
tion (probably includes thin interval of terrace or fan
80 80
Sonoma volcanics Continued
Rock, red and black volcanic 73 37
153 190
WeIl6/6-8Nl. M. F. Hellman
[Drilled by O. J. Pearson. Altitude, 325 feet. On stream terrace]
Glen Ellen formation:16 4
45 20 15 95
1620 65 85
100 195
Glen Ellen formation Continued
Volcanic rock, soft (probably tuffaceous Glen E len strata) -
Sonoma volcanics:
10
240
45
205
445
490

TABLES OF BASIC DATA 225
TABLE 22. Drillers' logs of wells in the Santa Rosa Valley area, California Con.
Thickness(feet)
Depth(feet)
Thickness(feet)
Depth(feet)
Well6/6-9Rl. B. Brown
[Drilled by N. F. Keyt. Altitude, 300 feet. On low hill in valley. Casing perforated between depths of 65 and_170 feet. . Bailer test: static level 46 feet; bailing level, 80 feet at 30 gpm]
Glen Ellen formation:
atTOfeet . .
35
43
35
78
Glen Ellen formation Continued9418
3
172190193
Well 6/&-10F1. V. M. Alvord
[Drilled by J. Larbre. Altitude, 335 feet. On dissected stream terrace. Cased between surface and depth of 232 feet. Bailer test: static level, 31 feet; bailing level, 150 feet at 300 gallons per hour]
Glen Ellen formation:102 102
Sonoma volcanics:238 35C
Well 6/6-16B1. Miss I. Holt
[DrllledlbylJ. Larbre. Altitude, 400 feet. On hillside. Cased between surface and depth of 422 feet. Bailer test: static level, 40 feet; bailing level, 250 feet at 400 gallons per hour]
Glen'Ellen formation:8741223456
87128150184240
Glen Ellen formation Continued7735
74
317352
426
Well 6/6-17A1. H. Parcel!
[Drilled by J. Larbre. Altitude, 290 feet. On stream terrace. Cased between surface and4epthof!29 feet. Bailer test: static level, 18 feet; bailing level, 90 feet at 600 gallons per hour]
Quaternary terrace (?) deposits:33
65
33
OR
Glen Ellen formation Continued30
220
128130150
Well6/7-3Ql. W.Jacobs
[Drilled by Precision Drilling Co. Altitude, 555 feet. On bank of small creek. Gravel packed. Reported yield, 1,200-1,500 gpm at pumping level of 55 feet]
Glen Ellen formation: Clay....
Clay
2721
248
27485098
Glen Ellen formation Continued
Basalt _____
12
15292
110
125417
Well 6/7-19D1. A. T. Pomerlo
[Drilled by N. F. Keyt. Altitude, 115 feet. On alluvial plain. Pumping test: static level, 10 feet; pumpinglevel, 55 feet at 75 pgm]
Younger alluvium and Glen Ellen formation:
Clay, sandy, brown, gravelly..
813189]
821
100
Younger alluvium and Glen Ellen formation Continued
44
104108

226 GROUND WATEB IN SANTA ROSA AND FETALUMA VALLEYS
TABLE 22. Drillers' logs of wells in the Santa Rosa Valley area, California Con.
Thickness(feet)
Depth(feet)
Thickness(feet)
Depth(feet)
Well 6/7-29P1. F. Riebli
[Drilled by N. F. Keyt. Altitude, 200 feet. On low hill at edge of alluvial plain. Casing perforated between depths of 3 and 21, 30 and 39, 48 and 54, 60 and 63, 69 and 72, 78 and 81, and 102 and 108 feet. Bailer test: static level, 2}.£ feet; bailing level, 15 feet at 51 gpm]
Sonoma volcanics:
Rock. .. . .......... ........1
77 26 23
1 78
104 127
Sonoma volcanics Continued1328 17
140168 185
Well 6/7-31G1. J. Equi[Drilled by N. F. Keyt. Altitude, 135 feet. On alluvial fan]
Younger alluvium and Glen Ellen formation:
Black soil. ___ . --... ___
Sonoma volcanics (?):
Merced(?) formation:
6 34
232
27 35
121
6 40
272
289 324
445
Merced (?) formation Continued SandHard shell (probably cemented
Hard... ... . . .. . . __ ...
Petaluma formation(?) :
1
1 21
2 10 10
18
446
447 468 470 480 490
508
Well 6/7-31H1. J. Equi [Drilled by N. F. Keyt. Altitude, 160 feet. On alluvial fan]
Younger alluvium and Glen Ellen formation:
Soil. --- ........_ .
Clay, yellow, and gravel .......
5 7 6
11
5 12 18 29 44
Younger alluvium and Glen Ellen formation Continued
Clay, yellow, and boulders ....
Clay, blue ____________
35 60 77 3
43
115 175 252 255 298
Well 6/7-31J1. P. Bleish[Drilled by N. F. Keyt. Altitude, 135 feet. On alluvial plain. Casing perforated between depths of 45
and 94,103 and 183,189 and 198, and 225 and 228 feet]
Younger alluvium and Glen Ellen formation:
61326
499
OC
123013
61945
94103128140170183
Younger alluvium and Glen Ellen formation Continued
15
2021
2010236
198
218220221241251274280
Well 6/7-31L1. Waldo Rohnert Co.[Drilled by N. F. Keyt. Altitude, 135 feet. On alluvial plain. Casing perforated between depths of
54 and 65 feet. Bailing test: static level, 13 feet; bailing level, 67 feet at 20 gpm]
Younger alluvium and Glen Ellenformation:
Gravel
51039
38
182130
Younger alluvium and Glen Ellenformation Continued
2013124
50637579
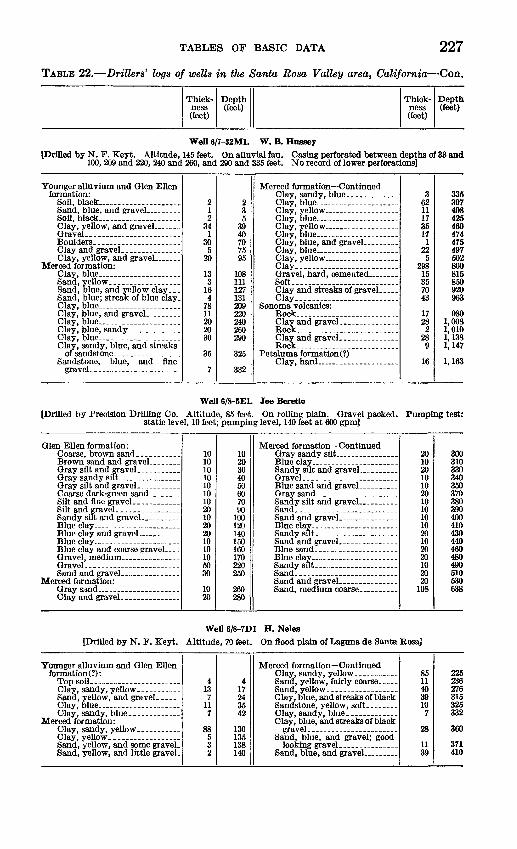
TABLES OF BASIC DATA 227
TABLE 22. Drillers' logs of wells in the Santa Rosa Valley area, California Con.
Thickness(feet)
Depth(feet)
Thickness(feet)
Depth(feet)
Well 6/7-32M1. W. B. Hussey[Drilled by N. F. Keyt. Altitude, 145 feet. On alluvial fan. Casing perforated between depths of 33 and
100, 209 and 220, 240 and 260, and 290 and 335 feet. No record of lower perforations]
Younger alluvium and Glen Ellen
Soil, black.............. _ ....
Soil, black............... _ ...
Sand, blue, and yellow clay...
212
341
305
20
133
164
7811202030
35
7
235
3940707595
108111127 131209220240260290
325
332
Merced formation Continued
Clay, yellow __________
Soft........ ............ _ ..._Clay and streaks of gravel . Clay _- . .-_-_-
Rock _ ---. --.- -. _ ..... ..
Rock____..__ _ .... ...........
36211173517
122
5298
153570 43
1728
2289
16
335397408425460474475497502800815850920 963
9801,0081,0101,1381,147
1,163
Well 6/8-5E1. Joe Beretto[Drilled by Precision Drilling Co. Altitude, 85 feet. On rolling plain. Gravel packed,
static level, 10 feet; pumping level, 140 feet at 600 gpm]Pumping test:
Glen Ellen formation:10101010101010201020201010105030
1020
1020304050607090
100120140150160170220250
260280
Merced formation Continued
Sand _ ......... __ __ . ..
Sand.--- .-.. _ .........
2010201010201010101020102020102020
108
300310330340350370380390400410430440460480490510530638
Well6/8-7Dl H. Neles
[Drilled by N. F. Keyt. Altitude, 70 feet. On flood plain of Laguna de Santa Rosa]
Younger alluvium and Glen Ellen
Merced formation:
413
711
7
88532
417243542
130135138140
Merced formation Continued
Clay, blue, and streaks of black
85114039107
28
1139
225236276315325332
360
371410

228 GROUND WATER IN SANTA ROSA AND PETALUMA VALLEYS
TABLE 22. Drillers' logs of wells in the Santa Rosa Valley area, California Con.
Thickness(feet)
Depth(feet)
Thickness(feet)
Depth(feet)
Well 6/8-12J1. G. W. Price[Drilled by N. F. Keyt. Altitude, 130 feet. On plain. Bailer test: static level, 20 feet; bailing level, 60
feet at 30 gpm]
Glen Ellen formation: Soil....... ....... ____ _ . 7
201
111122
797
281Q
6072
Glen Ellen formation Continued4
34257018
711132022.
Well 6/8-16R1. J. Pedranzini[Drilled by N. F. Keyt. Altitude, 90 feet. On low hummock. Casing liner perforated between depths
of 781 and 802, 930 and 951, 1,054 and 1,076, 1,097 and 1,120, and 1,144 and 1,204 feet. No record of upper perforations. Pumping test: static level, 130 feet; pumping level, 152 feet at 315 gpm]
Glen Ellen formation:
Blue clay ____________Yellow clay.. _________
1525321216
122
15209214
15407284
100101123
385400420512526
Merced(?) formation Continued
Blue clay and some gravel. ....
26811
11015
7
1131520303548
6
794805915930937
1,0501,0651,0851,1151,1501,1981,204
Well 6/S-17K1. C. Knudtsen [Drilled by N. F. Keyt. Altitude, 135 feet. On nose of ridge]
Merced formation:10
3555
74
10
45<>n55
129
Merced formation Continued Clay, sandy, blue, and gravel. 5
29
117
47
134ise14J15f16S21C
Well 6/8-22N1. E. Ponica[Drilled by N. F. Keyt. Altitude, 120 feet. Low isolated hill in valley. Casing perforated between
depths of 180 and 201 feet. Bailer test: static level, 25 feet; bailing level, 58 feet at 2,250 gallons per hour]
Merced formation: Soil.. ....... ________ .
Clay, blue ___________
31267
422552
31521287095
147
Merced formation Continued8
1515555
IK17C18J19C19£20C
Well 6/8-23C1. Waldo Rohnert Co.[Drilled by N. F. Keyt. Altitude, 95 feet. On Cotati plain]
Younger alluvium and Glen Ellen(?) formation:
Adobe _____________
Gravel. ........... ... ....
Merced formation:
sand
312
1035
565
4222
315
256065
130
172194
Merced formation Continued
Clay, yellow and gravelly;
4
625
7168
61198
108
260265
336342350
411430433
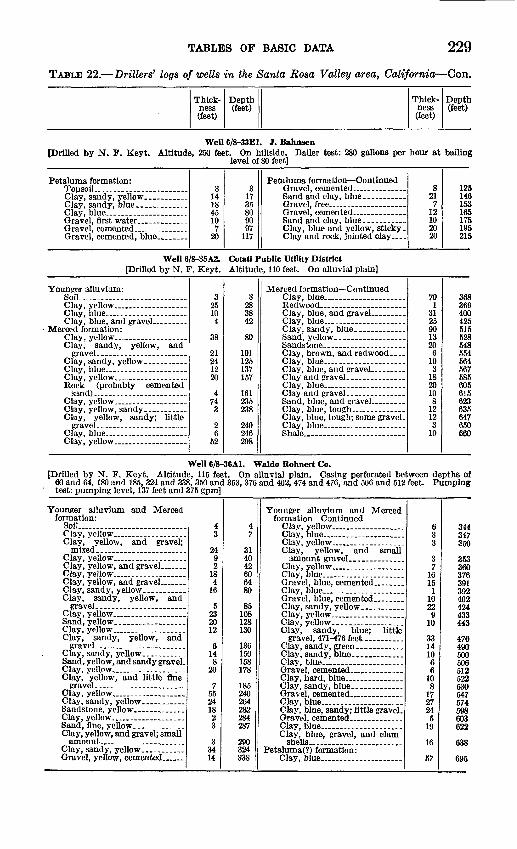
TABLE 22. Drillers'
TABLES OF BASIC DATA 229
of wells in the Santa Rosa Valley area, California Con.
Thick ness (feet)
Depth (feet)
Thick ness (feet)
Depth (feet)
Well 6/8-33E1. J. Bahnsen (Drilled by N. P. Keyt. Altitude, 250 feet. On hillside. Bailer test: 280 gallons per hour at bailing
level of 80 feet]
Petaluma formation: Topsoil _ ____ ...... 3
14 18 45 10 7
20
3 17 35 80 90 97
117
Petaluma formation Continued
Gravel, cemented _ .. ...
Clay, blue and yellow, sticky. Clay and rock, jointed clay ....
8 217
12 10 20 20
125146 153 165 175 195 215
Well 6/8-35A2. Cotati Public Utility District[Drilled by N. F. Keyt. Altitude, 110 feet. On alluvial plain]
Younger alluvium: Soil... .- __ . .
Merced formation:
Clay, sandy, yellow, and
Rock (probably cemented
Clay, yellow, sandy; little
325 10 4
38
21 24 12 20
4 74
3
2 6
52
328 38 42
80
101 125 137 157
161 235 238
240 246 298
Merced formation Continued
Clay, brown, and redwood....
Clay, blue, tough; some gravel-
Shale. _ .
70 1
31 25 90 13 20
6 10 3
18 20 10 8
12 12 3
10
368 369 400 425 616 628 548 654 564 667 585 605 615 623 636 647 650 660
Well 6/8-36A1. Waldo Rohnert Co.{Drilled by N. F. Keyt. Altitude, 116 feet. On alluvial plain. Casing perforated between depths of
60 and 64,180 and 185, 324 and 338, 350 and 363, 376 and 402, 474 and 476, and 506 and 512 feet. Pumping ' test: pumping level, 137 feet and 376 gpm]
Younger alluvium and Merced formation: Soil.. ___ . ___ ...
Clay, yellow, and gravel;
Clay, yellow, and gravel .......
Clay, yellow, and gravel .......Clay, sandy, yellow. __ .....Clay, sandy, yellow, and
Sand, yellow.. ...............
Clay, sandy, yellow, andgravel... _____ .......
Sand, yellow, and sandy gravel.
Clay, yellow, and little finegravel. ......................
Clay, yellow ___ _______
Clay, yellow _____ .. .......Sand, fine, yellow. ______Clay, yellow, and gravel; small
Gravel, yellow, cemented . ...
43
2492
184
16
5232012
6148
20
756241823
33414
47
314042606480
85108128130
136150158178
185240264282284287
290324338
Younger alluvium and Merced formation Continued
Clay, yellow _________ .
gravel, 471-476 feet ...........
Clay, blue ____________
Clay, blue, gravel, and clam
6
3
71616
1099
Q
10
33141066
10
1797t)A
51Q
16
57
344147
350
360376391OQO
At)*}
433443
476490
Kflft
612522530547574rno
603622
638
695

230 GROUND WATER IN SANTA ROSA AND PETALUMA VALLEYS
TABLE 22. Drillers' logs of wetts in the Santa Rosa Valley area, California Con.
Thick ness (feet)
Depth (feet)
Thick ness (feet)
Depth (feet)
WelI6/9-2Cl. CityofSebastopol[Drilled by H. L. Wilkinson Co. Altitude, 125 feet. On hillside. Well is cemented and casing perforated
between depths of 332 and 335, 345 and 350, 487 and 499, 512 and 514, 530 and 539, and 590 and 600 feet]
Merced formation: Topsoil, red. __________Sandstone ___________Sand...... ___ . __ . _ ...
Sand_.__.._ __________
Sand. _._... __________Sandstone.. __________ Sand. _____________
Sand, yellow _________
Sand. ....... ____ ___,___._.Sandstone
45341623241513241
232
603
9Q
662485171
113
4548
5253596164667071767780QO
8687
110
172175204
218222230235236243244255258
Merced formation Continued10
529
218
1932535
1112
104
213015
' 367
12672
1636
5110
268273302<tni3223233323353373423453503613623643743783QQ
429444AQf\
4874QQ
505512514530533539590600
WeII6/9-3Al. R. L. Browning
[Drilled by W. A. Duer. Altitude, 230 feet. On hill. Cased between surface and depth of 183 feet. Yield,1,000 gallons per hour].
Merced formation: Soil.- - . ... 4
26125
430
155
Merced formation Continued9510
250260
Well 6/9-22A1. M. E. Callan
[Drilled by Weeks Hardware Co. Altitude, 120 feet. At foot of slope. Cased between surface and depth of 35 feet (no perforations). Pumping test: static level, 0 (small natural flow); pumping level, 200 feet at 85gpm]
Merced formation:
Blue sandstone with shells. ....Blue sandstone, medium hard-Blue sandstone with shells....
819
74184622
820<u
112158180
Merced formation Continued
Blue sandstone, medium hard-Blue sandstone with shells. ...
462
194172
226228247288360

TABLE 22. Drillers'
TABLES OF BASIC DATA 231
of wells in the Santa Rosa Valley area, California Con.
Thick ness (feet)
Depth(feet)
Thick ness (feet)
Depth (feet)
Well 7/&-19N1. Harold Horton[Drilled by H. Nutting. Altitude, 465 feet. On alluvial plain. Casing perforated between depths of 30 and
40 and 130 and 149 feet. Bailer test: static level, 16 feet; bailing level, 96 feet at 7 gpm]
Younger alluvium and Olen El len (?) formation: Soil. . . ...
Yellow clay and small gravel. .
Blue clay and small gravel
Coarse gravelly yellow clay ....
132
15436
320
146
21 252834
3757
Younger alluvium and Olen El len (?) formation Continued
Small boulders and yellow clay-
Coarse packed gravel water
3025
67 5
105
4
87112118125 130140145
149
Well 7/&-19R1. F.Gemini[Drilled by H. Nutting. Altitude, 465 feet. On low hummock. Casing perforated between depth of 200
and 300 feet. Bailer test: static level, 35 feet; bailing level, 115 feet at 100 gpm]
Older alluvium(?) and Glen Ellen formation:
Soil, small, brown, gravelly .... Medium yellow gravelly clay..
Medium gravelly yellow clay.. Medium yellow packed gravel,
3 32
570
1080
3 35 40
110
120200
Older alluvium (?) aud Glen Ellen formation Con tinued
Small yellow boulders and coarse sand, water strata. ...
Sonoma volcanics(?): Blue volcanic ash, water in a
20 40
40
220 260
300
Well 7/6-32F1. B. Cochrane[Drilled by J. Larbre. Altitude, 395 feet. On alluvial plain. Cased between surface and depth of 175 feet.
Pumping test: static level, 3 feet; pumping level, 70 feet at 180 gpm]
Younger alluvium and Olen Ellen formation:
218
16251019
212945708099
Younger alluvium and Olen Ellen formation Continued
41717231515
103120137160175190
Well7/7-5Fl. F. C. Haen[Drilled by M. F. Keyt. Altitude, 340 feet. On low slope to alluvial plain. Casing perforated between
depths of 100 and 164 feet. Bailer test: static level, 71 feet; bailing level, 130 feet at 220 galons per hour]
Olen Ellen formation:
Oravel. ____________
22
435
20
24
475272
Olen Ellen formation Continued2
232012287
7497
117129157164
Well7/7-5NL L. A. Meatman[Drilled by H. Nutting. Altitude, 275 feet. On alluvial plain. Casing perforated between depths of 20 and
88 feet. Bailer test: static level, 8 feet; bailing level, 58 feet at 35 gpm]
Younger alluvium and Olen Ellen formation(?) :
Soil adobe, ....................Fine gravel __________Boulder and yellow sand ...... Sandy yellow clay __ .......Large yellow gravel hardpan. .
46
12 2310
410224555
Younger alluvium and Olen Ellen forrcation(?) Continued
Large brown packed gravel.
215142
57728688

232 CROWD WATER IN SANTA ROSA AND PETALTTMA VALLEYS
TABLE 22. Drillers' logs of wells in the Santa Rosa Valley area, California Con.
Thickness(feet)
Depth(feet)
Thickness(feet)
Depth(feet)
WelI7/7-6Gl. S. H. Strong[Drilled by Weeks Hardware Co. Altitude, 295 feet. On nose of low ridge. Casing perforated between
depths of 120 and 160,240 and 260, and 300 and 338 feet. Gravel packed. Pumping test: drawdown, 22 feet after 6 hours pumping at 40 gpm]
Qlen Ellen formation:3
27
1146211617
330
4187
108124141
Glen Ellen formation Continued313126146723
5
1722TC22?24C31C33:33J
WeU7/7-7F2. E. J. Throndson[Drilled by Weeks Hardware Co. Altitude, 245 feet. On hillside. Casing perforated between depths of
80 and 100, 180 and 200, and 260 and 320 feet. Gravel packed. Pumping test: drawdown, 70 feet after 6 hours pumping 20 gpm]
Sonorna volcanics: Top soil._..- __________
Boulders with red volcanic ash.
4 32
6 88 25 61
4 36 42
130 155 216
Sonoma volcanics Continued Red volcanic ash with boulders. 5
13 49 31
6
221 234 283 314 320
Well 7/7-8L1. Rincon Valley School District[Drilled by N. F. Keyt. Altitude, 250 feet. On low ridge. Cased between surface and depth of 198 feet
Glen Ellen formation: Yellow clay and boulders ......
Yellow clay and boulders ___
Yellow clay and boulders __ -
25 50
5 92
5 1 6
25 75 80
172 177 178 184
Sonoma volcanics:24 15 55
208 223 278
WeU7/7-9D2. Lelland Decker[Drilled by Crislip Drilling Co. Altitude, 385 feet. On hillside. Casing perforated between depths of
290 and 323 feet. Bailer test: static level, 15 feet; bailing level, 65 feet at 10 gpm]
Glen Ellen formation:
Yellow clay and gravel, sticky.
114 10 65 40 30 25 20
5 31 4
1 1525 90
130 160 185 205 210 241 245
Glen Ellen formation Continued5 5 8 4 8 5
20 7 5 8 3
250 255 233 267 275 280 300 307 312 320 323

TABLE 22. Drillers'
TABLES OF BASIC DATA 233
of wells in the Santa Rosa Valley area, California Con.
Thickness(feet)
Depth(feet)
Thickness(feet)
Depth(feet)
Well 7/7-15C1. Mrs. Mead Clark{Drilled by N. F. Keyt. Altitude, 375 feet. On alluvial terrace. Bailing test: static level, slightly above
land surface; bailing level, 160 feet at 20 gpm]
Younger alluvium: Soil.. ... . ___ . ___ 1
19
622
66411202119
1022
120
264854
108119139160179
189211
Glen Ellen formation Continued471912
415
310
203
1834
258277289293309312322
342345363397
Well 7/7-16A1. E. Jackson[Drilled by Crislip Drilling Co. Altitude, 375 feet. On hillside. Casing perforated between depths of
50 and 263 feet. Bailer test: static level, 60 feet; bailing level, 65 feet at 30 gpm]
Glen Ellen formation:200
723
8
200207230235243
Glen Ellen formation Continued642
1
249253255262263
Well 7/7-17A1. City of Santa Rosa[Drilled by N. F. Keyt. Altitude, 300 feet. On alluvial flat. Pumping test (made when well was 307
feet deep): static level, 80 feet; pumping level, 110 feet at 150 gpm. Pumping test (completed well): static level, 84 feet; pumping level, 148 feet at 485 gpm]
Younger and older(?) alluvium:
Clay, yellow, and gravel; small
Rock _______________
Ash, red, volcanic, and boul-
Ash, red, volcanic, and boul-
Gravel, blue cement, and
3
414
289
56
143520
408
455
526
4275728
27
3
44487685
9096
110145165
205213
258263
268270276
280307364392
419
Merced formation:
Sandstone, blue, and boulders.
(much of blue rock reported
Rock, blue, little red _____
670 1017
187
225
751613
672183
1524345
425495 505522
523631638660666640656669
675747765768783807841846
443610 58 16

234 GROUND WATER EST SANTA ROSA AND PETALUMA VALLEYS
TABLE 22. Drillers' logs of wells in the Santa Rosa Valley area, California Con.
Thickness(feet)
Depth(feet)
Thickness(feet)
Depth(feet)
Well 7/7-18L1. Sam Hartley[Drilled by N. F. Keyt. Altitude, 215 feet. On alluvial plain. Casing perforated between depths of 35
and 144 feet. Bailer test: static level 31 feet; bailing level, 47 feet at 100 gpm]
Younger and older (?) alluvium
364279
3678
157
Sonoma volcanics: Rock . . . _ .. 4 161
Well 7/7-18N1. W. R. Carithers and Son, Inc.[DriUed by N. F. Keyt. Altitude, 205 feet. On aUuvial plain. Yield: 230 gpm]
Younger and older (?) alluvium and Glen Ellen formation:
Soil-.- ~-
Rock__ - ---------------
11172
2015
63
1128305065RQ7578
Younger and older (?) alluvium and Glen Ellen formation C en.
27
2134
187
8087
108111115133140
Well 7/7-18R2. C. Carley[Drilled by N. F. Keyt. Altitude, 210 feet. On alluvial plain. Casing perforated from depth of 50 feet to bottom, alternate joints. Pumping test: static level, 78 feet; yield, 700 gpm. No record of pumping level]
Younger and older (?) alluvium
AdobeClay, blue
Clay, sandy, blue, and gravel.
416
5 519
15
4203035 40
5065
Sonoma volcanics:23
23383
8890
123206
Well 7/7-23A1. P. X. Smith [Drilled by N. F. Keyt. Altitude, 475 feet. On hillside]
Glen Ellen formation:
Rock.
3151233102174221743
318306373
168190207OCA
Glen Ellen formation Continued
Gravel8
123
273
17173
25
258270273300303320337340365
Well 7/7-23A2. Paul X. Smith[Drilled by N. F. Keyt. Altitude, 450 feet. On alluvial plain]
Younger alluvium and Glen Ellenformation:
Topsoil 2177
48
2179202250
Younger alluvium and Glen Ellenformation Continued 6
242433
256280304337

TABLES OF BASIC DATA 235
TABLE 22. Drillers' logs of wells in the Santa Rosa Valley area, California Con.
Thickness(feet)
Depth(feet)
Thickness(feet)
Depth(feet)
Well 7/7-23G1. J. J. Coney [Drilled by J. Larbre. Altitude, 430 feet. On alluvial plain]
Younger and older (?) alluvium and Glen Ellen formation:
Yellow clay and coarse gravel. .
499
28291120
45
593120 1322
243
4219
38281253
495886
115126146150155214245265 278300302345349370379417445457510
Younger and older (?) alluvium and Glen Ellen farmatiDn Con.
Shale. ._ -
Sonoma volcanics:
546158
6127
168301525
75201010301020
51070
515561576584645672840870885910
9851,0051,0151,0251,0551,0651,0851,0901,1001,170
Well 7/7-24A1. State of California Youth Authority[Drilled by Beedie. Deepened by Norris. Altitude, 565 feet. On slope above alluvial plain. Cased
between surface and depth of 208 feet. No perforations. Pumping test: static level, 40.7 feet; pumping level, 126.2 feet at 154 gpm]
Glen Ellen formation: Soil (described in log of well
boulders, 0-18 feet, and
feet)...... _. .Sonoma volcanics:
Hard red rock with many seams ______ _____
80
408814
59
80
120208222
281
Sonoma volcanics Continued Hard brown rock with many
Soft yellow-brown rock with
Harder red rock, very seamy ..
153
549240
2
434
488580620
622
Well 7/7-29D1. E. F. Bethards^Drilled by Precision Drilling Co. Altitude, 240 feet. On alluvial plain. Lithology by C. H. Chamberlain.
Gravel packed]
Younger alluvium and Glen Ellen formation (?):
Blue shale, hard streak of sand.
Sonoma volcanics: Top of basalt, drills very hard
first foot-.-------.-.. .-.---_
15
252070 30
20
80
15
4060
130 160
180
180
260
Sonoma volcanics Continued Basalt, dense, hard drilling __
Basalt, hard drilling _____Basalt, drilled like fractured,
stream action; drilled a foot
10 30103010
5010
130102018
270 300310340350
400410
540550570588
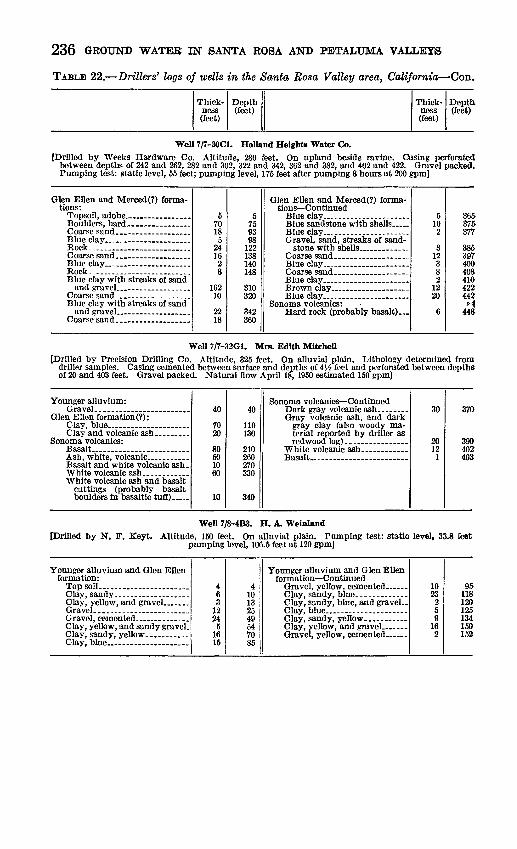
236 GROUND WATER IN SANTA ROSA AND PEfTALUMA VALLEYS
TABLE 22. Drillers' logs of wells in the Santa Rosa Valley area, California Con.
Thickness(feet)
Depth(feet)
Thickness(feet)
Depth,(feet)
Well 7/7-30C1. Holland Heights Water Co.[Drilled hy Weeks Hardware Co. Altitude, 280 feet. On upland heside ravine. Casing perforated
between depths of 242 and 262, 282 and 302, 322 and 342, 362 and 382, and 402 and 422. Gravel packed. Pumping test: static level, 55 feet; pumping level, 175 feet after pumping 8 hours at 200 gpmj
Glen Ellen and Merced(?) forma tions:
Blue clay ____________
Blue clay with streaks of sand
57018
52416
28
16210
2218
5759398
138140148
310320
342360
Glen Ellen and Merced(?) forma tions Continued
Sonoma volcanics:
610
2
812382
1220
6
365375377
385397400408410422442H
448
Well 7/7-32G1. Mrs. Edith Mitchell[Drilled by Precision Drilling Co. Altitude, 325 feet. On alluvial plain. Lithology determined from
driller samples. Casing cemented between surface and depths of 4^ feet and perforated between depths of 20 and 403 feet. Gravel packed. Natural flow April 18,1950 estimated 150 gpm]
Younger alluvium: Gravel.. ____________
Glen Ellen formation (?):
Basalt ______________
Basalt and white volcanic ash.
White volcanic ash and basalt cuttings (probably basalt boulders in basaltic tuff) .....
40
7020
805010 60
10
40
110130
210260270 330
340
Sonoma volcanics Continued
Gray volcanic ash, and dark30
2012
1
370
390402403
Well 7/8-4B3. H. A. Weinland[Drilled by N. F. Keyt. Altitude, 150 feet. On alluvial plain. Pumping test: static level, 33.8 feet
pumping level, 106.5 feet at 120 gpm]
Younger alluvium and Glen Ellen formation:
Top soil ....................... 463
1224
51615
410132549547085
Younger alluvium and Glen Ellen formation Continued
1023
259
162
95118120125134150152

TABLE 22. Drillers'
TABLES OF BASIC DATA 237
of wells in the Santa Rosa Valley area, California Con.
Thickness(feet)
Depth(feet)
Thickness(feet)
Depth(feet)
WeI17/8-6H2. E. Lovell{Drilled by H. Nutting. Altitude, 135 feet. On low hummock. Casing perforated between depths of
25 and 35, 75 and 104,125 and 169, 231 and 239, and 275 and 304 feet. Cable-tool pave! pack. Pumping test: static level, 10 feet; pumping level, 120 feet after 12 hours pumping 125 gpm]
Glen Ellen formation: Soil .- 2
6185
292221
7154265
28
26316082
103110125167232
Glen Ellen formation Continued
Merced formation:
34020
2331210
441
235275295
297330342352
356397
Well 7/8-9R1. C. Rasmussen
Perilled by N. F. Eeyt. Altitude, 120 feet. On plain. Bailer test: static level, 9 feet; bailing level, 29 feetat 100 gpm]
Glen Ellen formation:33
14843
1568
36
2028323550
118
Glen Ellen formation Continued18
35
183
157
136139144162165ISO187
Well 7/8-14A1. Odd Fellows Cemetery Association
fDrflledbyN. F.Eeyt. Altitude, 175 feet. On small alluvial flat. Gravel packed. Bailer test: static level, 0 feet; bailing level, 160 feet at 1,400 gallons per hour]
Younger alluvium and Glen Ellen
Clay, blue ___________
3157
1121632858010
31825
137153185270350360
Sonoma volcanics:
Rock ______________Clay... __ ... _ . _____
Clay... ...... .._...... .. -Rock __________ . .....
1101959731931
1282
470489548621640671899901

238 GROUND WATER EST SANTA ROSA AND PEfTALUMA VALLEYS
TABLE 22. Drillers' logs of wells in the Santa Rosa Valley area, California Con,
Thickness(feet)
Depth(feet)
Thickness(feet)
Depth(feet)
Well 7/8-14D1. Santa Rosa Jnnior College
[Drilled by N. F. Keyt. Altitude, 155 feet. On alluvial plain. Casing perforated between depths of 95 and 110,146 and 162,188 and 200, and 283 and 300 feet. Pumping test: static level, 12 feet; pumping level, 6S feet at 270 gpm]
Younger alluvium and Glen Ellen formation:
Soil.-.. .......... __ . _ ..Clay.........................
4133
65101536
4172085QC
110146
Younger alluvium and Glen Ellen formation Continued
16261260152015
1621882002502652853(H>
Well 7/8-20K1. F. Siemer
[Drilled by N. F. Keyt. Altitude, 100 feet. At edge of alluvial plain]
Younger alluvium: Soil.. ... - _. .-
121925
5145
1511103
2225
16356065798499
110120123145170
Glen Ellen formation Continued3
1213174152
16138
988589
173185198215256308
324462471557615626
Well 7/8-23M1. Grace Bros. Brewing Co.
[Drilled by Roscoe Moss Co. Altitude, 155 feet. On alluvial fan. Casing cemented between surface and depth of 54 feet, perforated between depths of 324 and 408 and 414 and 990 feet. Gravel packed. Pumping test: drawdown, 201.7 feet after 24 hours pumping at 295 gpm]
Younger and older (?) alluviums and Glen Ellen formation:
Clay, yellow; include sand and
61830
521436
60IfU1521
624
120156
216320335
Merced(?) and Glen Ellen(?) for mations Continued
Clay, yellow; includes gravel
24
62
583097735163
1411530
380
442
500530627700751814955970
1,000

TABLE 22. Drillers'
TABLES OF BASIC DATA 239
of wells in the Santa Rosa Valley area, California Con.
Thickness(feet)
Depth(feet)
Thickness(feet)
Depth(feet)
Well 7/8-23M4. California Packing Co.[Altitude, 150 feet. On bank of Santa Rosa Creek]
Younger and older (?) alluviums and Glen Ellen formation:
Clay......... ......-......Gravel _ ___________Clay.. .... ......
Glen Ellen(?) and Merced(?)
Hard and soft clay with gravel
Blue and yellow clay with
248
1115
770108
3468
937
10211
15215
2432435865
135145153
156202210
303310
412423
575590
Glen Ellen(?) and Merced(?) formations Continued
860-864
Blue clay with some gravel
Clay, gravel, sand, lime-
605
15
135151057
365
375
4511
298
650655
670
805820830835842
87g883920925
970981
1,27ft
Well 7/8-24A4. City of Santa Rosa[Drilled by N. F. Keyt. Altitude, 195 feet. On alluvial plain]
Younger and older (?) alluviums and Glen Ellen formation:
Glen Ellen(?) and Merced forma-
512
544
206
18161125
6104
1718151120121336
667
2928
51722263050567490
101126132142146
163181
207227239252255261327334363391
Glen Ellen and Merced forma tions C ontinued
Clay, blue, and boulders ... Rock
3713216824
52
365014
3251110154032
83843
45
357
162
428441462530554
606
642692706709-734745755770810842850888931935940975982998
1,000

240 GROUND WATER IN SANTA ROSA AND PEfTALUMA VALLEYS
TABLE 22. Drillers1 logs of wells in the Santa Rosa Valley area, California Con.
Thick ness (feet)
Depth (feet)
Thick ness (feet)
Depth (feet)
Well 7/8-28F1. J. Antone{Drilled by N. F. Keyt. Altitude, 100 feet. On plain. Casing perforated between depths of 42 and 66 feet.
Bailer test: static level 7 feet; bailing level, 30 feet at 25 gpm]
Glen Ellen formation:
Clay, sticky brown, and
510
15
515
30
Qlen Ellen formation Continued25
92
556466
Well 7/8-29J1. Santa Rosa Naval Air Base
(Drilled by E. B. Howk. Altitude, 97 feet. On plRhi. Casing cemented between surface and depth of 20 feet, gravel-packed between depths of 20 and 680 feet. Pumping test: drawdown, 130 feet at 300 gpm]
Glen Ellen formation:
Clay.... ...................Gravel, small, and sand; shale,
Clay..........................
Clay-. . ..-.
Clay.- ... ... .... ....... ...
Clay. ....-.
Clay with streaks of gravel- ...
4624
13214
1164
4
263537567352
4641
36
72
10
6
4101216295054
657175
7984
869295
100103110115121128131136138184188189191227
234236246
252
Glen Ellen formation Continued
Clay
Clay, hard, sticky, with
Clay.
Clay. Gravel, large, loose, good. Clay .... ...
4503
351
10
36
42
222218733
164
3021103
1136
221
3055
1514 39
256306309344345355357360366
408
430432434435443450453456472476515536546549560563569591592622627632647661 700
Well 7/&-30P1. C. Dotti
[Drilled by W. A. Duer. Altitude, 85 feet. On rolling plain]
Glen Ellen formation: Soil....-. ........ ... .....
103
1023
6994
47
21215254854637276
123
Merced formation:193
19
145
22
142145164
178183205

TABLES OF BASIC DATA 241
TABLE 22. Drillers' logs of wells in the Santa Rosa Valley area, California Con.
Thickness(feet)
Depth(feet)
Thickness(feet)
Depth(feet)
Well 7/S-31C1. M. La French!
[Drilled by H. Nutting. Altitude, 85 feet. On rolling plain]
Glen Ellen formation: Merced formation:11515
305320
Well 7/8-36D2. R. R. Todd[Drilled by N. F. Keyt. Altitude, 165 feet. On alluvial slope. Casing perforated between depths of 229
and 252 feet. Bailer test: static level, 42 feet; bailing level, 50 feet at 2,500 gallons per hour]
SoU............................
Cemented gravel, first water
8 20
49 15 22
8 28
77 92
114
Clay. ........... _ .
71 40 16 8 3
185 225 241 249 252
Well 7/9-3E1. D. Papers [Drilled by W. A. Duer. Altitude, 150 feet. On hillside]
Merced formation: SoU...........................Yellow clay... ________
4 33 18
4 37 55
Merced formation Continued
Clam shells and gravel (prob-8
67
63
130
Well 7/9-3M1. G. Bertolucci
[Drilled by W. A. Duer. Altitude, 100 feet. On hillside. Yield, 25,000 gallons per day]
Merced formation:61 11 6
16 8
61 72 78 94
102
Merced formation Continued4
19 2 4
106 125 127 131
Well 7/9-4N1. D. Hill, Sr. [Drilled by W. A. Duer. Altitude, 280 feet. On gently sloping hillside]
Merced formation: Soil...... ....-............. 4
26 25
430 55
Merc°d formation Continued41 24
96 120
Well 7/9-5N1. Petri Wine Co.[Drilled by W. A. Duer. Altitude, 170 feet. On hillside. Yield, 77 gpm. Cased between surface and
depth of 75 feet (open end). One ring of perforations at depth of 58 feet]
Merced formation: Soil. ............. ......Sand, hard yellow _______Clay, blue, and sandstone __ Sandstone, blue.. _____________Clay, blue, and sandstone __
36582 2035 15
368
150170205 220
Merced formation Continued
Clay, blue, and sandstone __
Franciscan group:
301022
5
5
250260282 287
292

242 GROUND WATER IN SANTA ROSA AND PEITALTJMA VALLEYS
TABLE 22. Drillers' logs of wells in the Santa Rosa Valley area, California Con.
Thick ness (feet)
Depth (feet)
Thick ness (feet)
Depth(feet)
Well 7/9-14K1. G. LeursIDrilled by Davis and Alcorn Drilling Co. Altitude, 80 feet. On rolling plain. Gravel packed. Pumping
test: static level, 22 feet; pumping level, 75 feet after 30^i hours pumping at 750 gpm]
Glen Ellen formation:
Sand ____ ..... ___ ....Clay, hard ___________Sand ___ ___ _____
Clay, small gravel, and sand..
2 14 4 3
12 5
22 24 20 32
2 16 20 23 35 40 62 86
106 138
Merced formation:
Sand, blue and some gravel. . .
Shale... ... ....... .. . .
70 49 39 62
202 10 14 52
208 257 296 358 560 570 584 636
Well 7/9-21G1. F. Schell
[Drilled by N. F. Keyt. Altitude, 240 feet. On upland at base of isolated hill. Cased between surface and depth of 515 feet. Open end, no perforations]
Merced formation:
Sand, blue.. ..................Sand, blue, and clam shells ....
2 54
117 12
1 19 39 26
2 56
173 185 186 205 244 270
Merced formation Continued Sand, blue, and clam shells ....
Sand, blue, and clam shells ....
46147
8 25 3 5
10 16
316 463 471 496 499 504 514 530
Well 7/9-24J1. L. Ramondo (Ramondo core' hole 1)On slightly dissected plain.{Drilled by E. W. Lenhart (operator). Altitude, 90 feet.
oil-test hole]Unproductive
Glen Ellen formation:
Blue sand and clay ............
Brown and blue clay. .._ __.
Coarse gravel _________Blue clay and blue sand .......
Brown shale _____ ....
Glen Ellen formation (?): Shale and boulders.. .........
Shale with brown sandy
Shale and boulders. ...........
387
Q7
444
5251124
60246
85173221040
801035
204026
38458286
1301351601711QC
25597Q
285370543565575615
69570574(1
760800826
Merced formation: Shale and limestone streaks,
shells . . . ___ . __ .
Very hard shale and limestone-
Small black boulders, sand. ...Sand and shale with lime
Blue sand and brown shale. Clay and limestone streaks. ...
Blue shale and hard black
Blue shale and limestone ... ... Blue sandy shale, limestone,
stone in wafer-like sections, J$-l inch thick.... ...... .
9450
220304515
1887
4535199220
193
2650
98
22
920970
1,1901,2201,2651,280
1,4681,4751,5201,5551.5741,6661,6861,879
1,9051,955
2,053
2,075
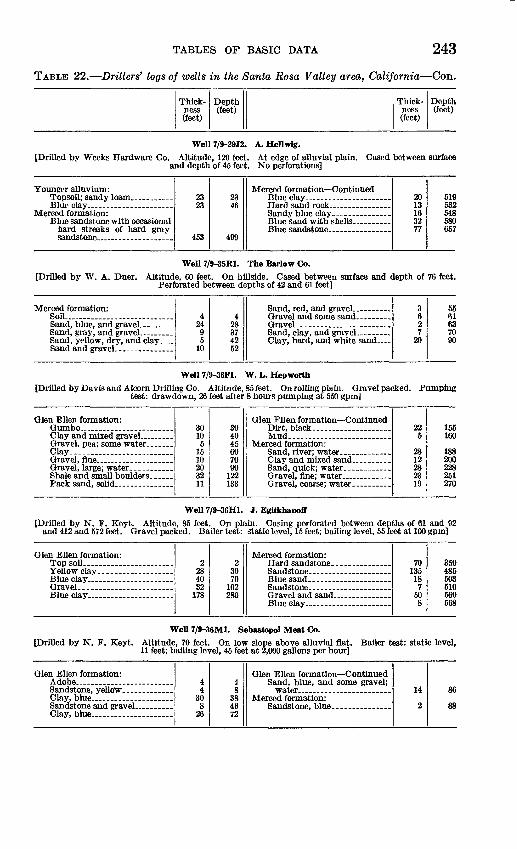
TABLES OF BASIC DATA 243
TABLE 22. Drillers' logs of wells in the Santa Rosa Valley area, California Con.
Thickness(feet)
Depth(feet)
Thickness(feet)
Depth(feet)
Well 7/9-29J2. A. Hellwig.{Drilled by Weeks Hardware Co. Altitude, 120 feet. At edge of alluvial plain. Cased between surface
and depth of 45 feet. No perforations]
Younger alluvium:2323
453
2346
499
Merced formation Continued2013163277
519532548580657
Well 7/9-35R1. The Barlow Co.[Drilled by W. A. Duer. Altitude, 60 feet. On hillside. Cased between surface and depth of 76 feet.
Perforated between depths of 42 and 61 feet]
SoU............................
Sand, yellow, dry, and clay ....
424
95
10
4283742 52
Clay, hard, and white sand _
3627
20
5561637090
Well 7/9-36F1. W. L. Hep worth[Drilled by Davis and Alcorn Drilling Co. Altitude, 85 feet. On rolling plain. Gravel packed. Pumping
test: drawdown, 26 feet after 8 hours pumping at 550 gpm]
Glen Ellen formation:
Clay..........................
3010
51510203211
304045607090
122133
Glen Ellen formation Continued Dirt, black........... ... _Mud-- .
225
2812282319
155160
188200228251270
Well 7/9-36H1. J. Egitkhanoff[Drilled by N. F. Keyt. Altitude, 85 feet. On plain. Casing perforated between depths of 61 and 92
and 412 and 572 feet. Gravel packed. Bailer test: static level, 15 feet; bailing level, 55 feet at 100 gpm]
Glen Ellen formation:2
284032
178
23070
102280
Merced formation:70
13518
750
8
350485503510560568
WeU 7/9-36M1. Sebastopol Meat Co.[Drilled by N. F. Keyt. Altitude, 70 feet. On low slope above alluvial flat. Bailer test: static level,
11 feet; bailing level, 45 feet at 2,000 gallons per hour]
Glen Ellen formation:44
308
26
8384672
Glen Ellen formation Continued
14
2
86
88

244 GROUND WATER IN SANTA ROSA AND PETALUMA VALLEYS
TABLE 22. Drillers' logs of wells in the Santa Rosa Valley area, California Con.
Thickness(feet)
Depth(feet)
Thickness(feet)
Depth(feet)
WeU8/8-17Ll. G. Bias![Drilled by N. F. Eeyt. Altitude, 185 feet. At edge of alluvial plain. Bailer test: static level, 103 feet;
bailing level, 235 feet at 10 gpm]
Glen Ellen formation:
Clay, yellow, and gravel;
303212
8214
306274
156170
Glen Ellen formation Continued
Gravel; top 3 feet good gravel,
52269
174
222248257
274278
Well 8/8-19M1. Industrial Manufacturing Co.[Drilled by H. Nutting. Altitude, 105 feet. On hummoeky area at edge of alluvial plain. Casing per
forated between depths of 35 and 50 and 100 and 260 feet. Gravel packed. Pumping test: static level, 10 feet; pumping level 80 feet after 3 days pumping 280 gpm]
Glen Ellen formation: Fine soil _____________
Yellow sand and fine gravel. ..
Yellow sandy clay _______
22510 8
2025OK
2737 456590
115
Glen Ellen formation Continued
Fine gravel and brown sand _
153025 203020
5
130160185205235255260
Well 8/S-20Q1. H. Faught[Drilled by N. F. Keyt. Altitude, 145 feet. On alluvial plain. Casing perforated between depths of
56 and 66, 94 and 115, 133 and 182, 210 and 233, and 252 and 310 feet. Gravel packed. Pumping test: static level, 20 feet; pumping level, 30 feet at 300 gpm]
Younger alluvium:10
10102
10
20122
Glen Ellen formation Continued11558134
237295308312
Well 8/8-29C1. Mr. Waggoner[Drilled by Crislip Drilling Co. Altitude, 135 feet. On alluvial plain. Casing perforated between depths
of 44 and 68 feet. Bailer test: static level, 30 feet; bailing level, 40 feet at 20 gpm]
Younger alluvium and Glen Ellen formation:
Soil.. .. .. ..... 218
5
22025
Younger alluvium and Glen Ellen forma tion C ontinued
358
60 8
Well8/8-29Dl. C. B. Hurst[Drilled by Crislip Drilling Co. Altitude, 125 feet. On alluvial plain. Casing perforated between depths
of 45 and 57 feet. Bailer test: static level, 8 feet; bailing level, 24 feet at 30 gpm]
Younger alluvium and Glen Ellen formation:
2426
2460
Younger alluvium and Glen Ellen formation C ontinued
61
5657

TABLES OF BASIC DATA 245
TABLE 22. Drillers' logs of wells in the Santa Rosa Valley area, California Con.
Thick-ness(feet)
Depth(feet)
Thickness(feet)
Depth(feet)
Well 8/8-30G1. C. Wulf[Drilled by Crislip Drilling Co. Altitude, 115 feet. At edge of alluvial plain. Casing perforated between
depths of 40 and 60 and 80 and 120 feet. Pumping test: static level, 15 feet; pumping level, 80 feet after 4 hours pumping at 40 gpm]
Younger alluvium and Glen Ellenformation:
Old well.. ____________ 848
18
8492
110
Younger alluvium and Glen Ellenformat ion C ontinued
57
18
115122140
Well 8/S-30L1. Sonoma County Airport[Drilled by N. F. Keyt. Altitude, 120 feet. On rolling plain. Casing perforated between depths of 90
and 112,117 and 145,160 and 188, 204 and 245, 260 and 280, 300 and 320, 350 and 370, 410 and 436, and 442 and 462 feet. Yield, 600 gpm]
Glen Ellen formation: Soil.... ______ - __ 3
142647171711
1043
3174390
107124135
145188
Glen Ellen formation Continued1641
231740155
3088
204245
2682853253403453754fi3
Weil8/8-30Nl. L. Nagy[Drilled by N. F. Keyt. Altitude, 120 feet. On rolling plain. Casing perforated between depths of 60
and 98,119 and 223, 231 and 239, and 253 and 350 feet. Gravel packed cable tool. Yield, 480 gpm]
Glen Ellen formation:Soil 2
172
1920353
1746
60
2192140609598
115119125185
Glen Ellen formotion Continued
Clay and gravel ...............
3888
14772055
5405
223231239253330350405410450455
Well 8/8-30N2. L. Nagy
[Drilled by N. F. Keyt. Altitude, 120 feet. On rolling plain. Casing perforated between depths of 60 and 65, 80 and 85, 100 and 105, 130 and 135, 150 and 155, 175 and 190, 330 and 350, and 375 and 390 feet. Gravel packed (cable tool)]
Glen Ellen formation:Soil.... .
Clay, sandy, blue and gravel..
451
7113
267
701357
45562
175177183190260283340
Glen Ellen formation Continued
Clay, blue ___ . __ . .... ...
8271535
56
1445
15
348375390425430436580585600
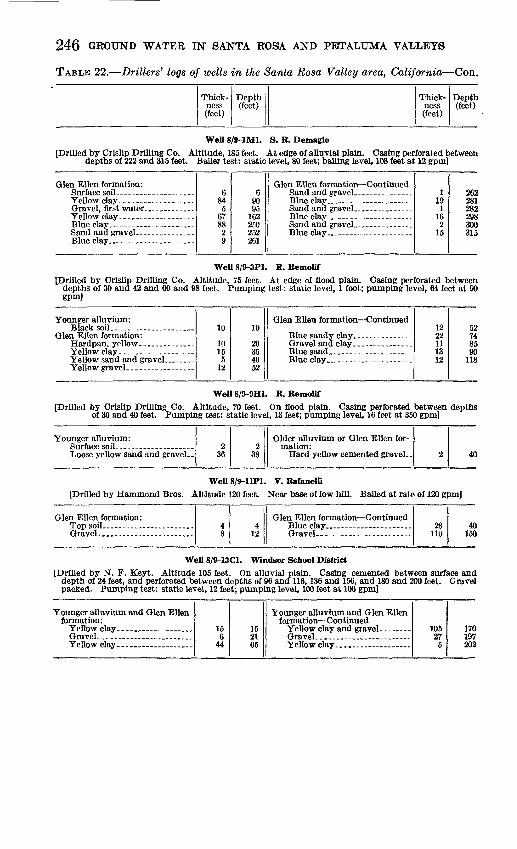
246 GROUND WATER IN SANTA ROSA AND PETALUMA VALLEYS
TABLE 22. Drillers' logs of wells in the Santa Rosa Valley area, California Con.
Thick ness (feet)
Depth (feet)
Thick ness (feet)
Depth (feet)
Well 8/9-1M1. S. R. Demagio
[Drilled by Crislip Drilling Co. Altitude, 185 feet. At edge of alluvial plain. Casing perforated between depths of 222 and 315 feet. Bailer test: static level, 80 feet; bailing level, 108 feet at 12 gpin]
Glen Ellen formation:6
84 5
67 88
2 9
6 90 95
162 250 252 261
Glen Ellen formation Continued1
19 1
16 2
15
262 281 282 298 300 315
Well 8/9-3P1. R. Remolif[Drilled by Crislip Drilling Co. Altitude, 75 feet. At edge of flood plain. Casing perforated between
depths of 30 and 42 and 60 and 98 feet. Pumping test: static level, 1 foot; pumping level, 64 feet at 90 gpm]
Younger alluvium:
Yellow ffr&vel
10
10155
12
10
20354052
Glen Ellen formation Continued1222111312
7485on
118
WeU 8/9-9H1. R. Remolif[Drilled by Crislip Drilling Co. Altitude, 70 feet. On flood plain. Casing perforated between depths
of 30 and 40 feet. Pumping test: static level, 13 feet; pumping level, 16 feet at 350 gpm]
Younger alluvium:
Loose yellow sand and gravel. .2
362
38
Older alluvium or Glen Ellen for-
Hard yellow cemented gravel.. 2 40
Well 8/9-11P1. V. Rafanelli[Drilled by Hammond Bros. Altitude 120 feet. Near base of low hill. Bailed at rate of 120 gpm]
Glen Ellen formation: Top soil _____________ 4
84
12
Glen Ellen formation Continued28
1104C
1ST
WeU 8/9-13C1. Windsor School District[Drilled by N. F. Keyt. Altitude 105 feet. On alluvial plain. Casing cemented between surface and
depth of 24 feet, and perforated between depths of 96 and 116, 136 and 156, and 180 and 200 feet. Gravel packed. Pumping test: static level, 12 feet; pumping level, 100 feet at 100 gpm]
Younger alluvium and Glen Ellen formation:
156
44
152165
Younger alluvium and Glen Ellen formation Continued
10527
5
170197202

TABLES OF BASIC DATA 247
TABLE 22. Drillers' logs of wells in the Santa Rosa Valley area, California Con.
Thickness(feet)
Depth(feet)
Thickness(feet)
Depth(feet)
Well 89-/13N1. A. Botto[Drilled by H. E. Crabtree. Altitude, 90 feet. At edge of alluvial plain. Cased between surface and depth
of 188 feet and perforated between depths of 14 and 40, and 70 and 184 feet]
Glen Ellen formation: Soil. -
Gravel waterClay
687
1930
484
12
61421407074828698
Glen Ellen formation Continued
Clay.
12206
16164
1224
110130136152168172184208
Well 8/9-15D1. C. D. Thompson[Drilled by F. B. Dykes. Altitude, 65 feet. On alluvial plain. Casing perforated between depths of 37
and 47 and 63 and 133 feet. Gravel packed]
Younger alluvium and Glen Ellen(?) formation:
Sand, fine _12988
1115
122129374863
Younger alluvium and Glen Ellen(?) formation Continued
Clay
32133671
6687
120126133134
Well 8/9-23L1. C. Wright[Drilled by Davis and Alcorn Drilling Co. Altitude, 75 feet. At edge of alluvial plain. Cased between
surface and depth of 410 feet. Gravel packed. Pumping test: static level, 36 feet; pumping level, 69 feet after 4 hours pumping at 750 gpm]
Glen Ellen formation:483
1026
5144
1122
41215255156707485
107
Glen Ellen formation Continued64538245
3101227
323
171224306351354364376403406429
Well 8/9-27K1. H. A. Faught[Drilled by McCollum. Altitude, 60 feet. On flood plain of Windsor Creek. Reported yield, 800 gpm
at pumping level of 60 feet]
Younger alluvium: Soil... 6
442
6
5052
Glen Ellen and Merced forma-
25130
303333
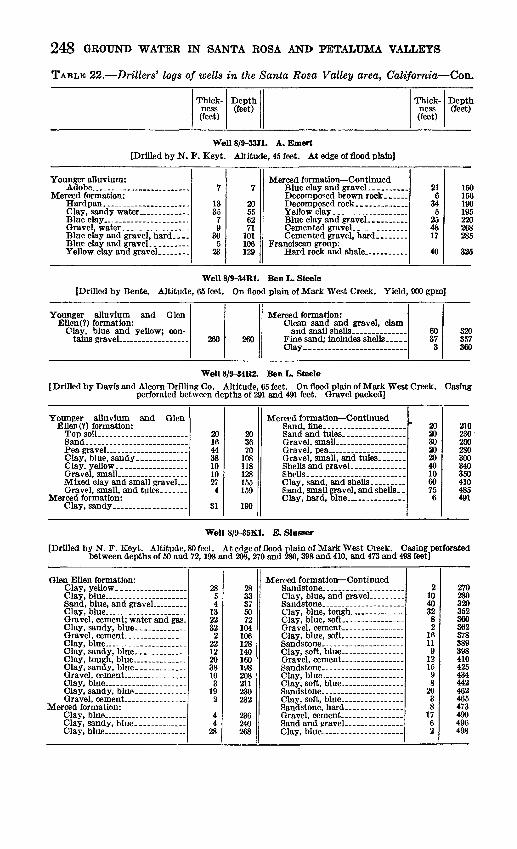
248 GROUND WATER IN SANTA ROSA AND PETALUMA VALLEYS
TABLE 22. Drillers' logs of wells in the Santa Rosa Valley area, California Con.
Thickness(feet)
Depth(feet)
Thickness(feet)
Depth(feet)
Well 8/9-33J1. A. Emert [Drilled by N. F. Keyt. Altitude, 45 feet. At edge of flood plain]
Younger alluvium:7
1335
79
305
23
7
2055
71101106129
Merced formation Continued216
345
254817
40
IK15(19C19,22C26E28£
32£
Well 8/9-34R1. Ben L. Steele[Drilled by Bente. Altitude, 65 feet. On flood plain of Mark West Creek. Yield, 900 gpm]
Younger alluvium and Glen Ellen(?) formation:
Clay, blue and yellow; con-260 260
Merced formation: Clean sand and gravel, clam
Clay..
60 37
3
320 357 360
Well 8/9-34R2. Ben L. Steele[ Drilled by Davis and Alcorn Drilling Co. Altitude, 65 feet. On flood plain of Mark West Creek. Casing
perforated between depths of 291 and 491 feet. Gravel packed]
Younger alluvium and Glen Ellen(?) formation:
Top soil ____________Sand--_-_. _____ . ___ ....
Mixed clay and small gravel _
Merced formation:
20 16 44 38 10 10 27 4
31
20 36 70
108 118 128 155 159
190
Merced formation Continued
Shells....- --- -
Sand, small gravel, and shells. .
20 20 30 20 20 40 10 60 75 6
210 230 260 280 300 340 350 410 485 491
Well 8/9-35K1. E. Slusser
[Drilled by N. F. Keyt. Altitude, 80 feet. At ed ge of flood plain of Mark West Creek. Casing perforated between depths of 50 and 72,198 and 208, 270 and 280, 398 and 410, and 473 and 498 feet]
Glen Ellen formation:28
54
1399
322
99
12203810
192
44
28
OQ
3307
5079
104
f no
140160198
911
23694n268
Merced formation Continued2
10403282
16119
121598
2038
1762
270280320352360362378389398410425434442462465473490496498

TABLES OF BASIC DATA 249
TABLE 22. Drillers' logs of wells in the Santa Rosa Valley area, California Con.
Thickness(feet)
Depth(feet)
Thickness(feet)
Depth(feet)
Well 8/9-36L1. Mrs. M. Talmadge
[Drilled by Bente. Altitude, 95 feet. On flood plain of Mark West Creek. Yield, 450-600 gpm]
Younger alluvium:
Sand __ . __ . ___ . _ .
276
39715
2733
430445
Glen Ellen formation Continued
Gravel
10651530
455520535565,
Well 8/9-36P1. P. W. Bnssman
[Drilled by N. F. Keyt. Altitude, 90 feet. On flood plain of Mark West Creek]
Younger alluvium: Soil,. . ... ... ... ......
Yellow. ....................
941
75
1861
6637
2388
16819283319
9505762
80141147210217455463631650678711730
Merced formation:3539
427153030
84
115
10
523
765804808835850880910
994
1,0051,0101,020
1,0251,048
443616 58 17

TABL
E 23.
Des
crip
tion
of w
ater
wel
ls i
n th
e P
etal
uma
Val
ley
area
, C
alifo
rnia
Wel
l no.
Ow
ner
or u
ser
mpleted *
1 'O q
j P3
S3-
~a sl
53 «
Dep
th
(fee
t)
-a M
Ia 'M
I !L C3 .n
S-3^
H
Wat
er-y
ield
ing
zone
or
zone
s op
en to
wel
l
f
to
o, fi
« CO sS A H
Cha
ract
erG
eolo
gic
form
atio
n
Wat
er le
vel
8 «
g^
Qo O
S O
J llll
|s||
lill
fi
^ fn
o^ 05
| W H
Pum
p
0 ct fe
'O
J |$ o
® S* >,_! H
0)
Ml
Sj-
g1
oS
Q
Res
ults
of
test
s
h t
UO°ao
^* S
*^*^
«&
S«
a 0?
t> 35
fi
Use
1 63 "w a O
T.
3 N
., R
. 5
W.
3/5-
5D
1
6C1
6C2
7A1
C. S
Uv
a.. ..
. .
... .
.do....... .
1950
1947
5 9 9 2±
200 50 165
435
D..
....
.
D8..
...
D8..
_..
D8..
...
QT
m (?).
..
.do
..
...d
o..
...
( 2-
17-5
0\
4- 6
-51
( 2-
17-5
0\
4- 6
-51
33.2
1Jo
. U
u60
.08
I/,
07
1-J2 L
L.W
ind
(>> 8
D,S
Cp.
Cp.
T.
3 N
., R
. 6
W.
3/6-
1L1 1L
21Q
11R
13C
14B
1
4B2
4C1
4D1
4F1
4F2
5A1
. d
o..
.. .
.. .
.d
o...........
C. S
Uv
a..
- .
O. W
hit
e -
KS
FO
. .d
o..
. ..
...
KC
BS
. W
. Q
. W
rig
ht.
.
KS
FO
. do.... .
W.
Q. W
right
1949
1949
1951
1950
1949
1949
1Q4Q
3±
3± 2±
0± 5 0 0 0
-40 0 -.8
0
30 15.5
225 91 94 164
120
105 90 83
Dv
3_
D
v3... .
D7...._
D3^...
Dug
36
-D
v......
Dv...
D8.,.._
D8..
...
Dv......
Dv..
....
Jt4
..._
_
IfiO 80 77
4 6 fi
Qy
al
... d
o
Qy
al
d
o....
.Q
Tm
....
(?).
Qya
l....
... d
o.....
...d
o.....
/ 3-
22-6
01
4- 6
-51
1-25
-60
/ 2-
22-5
01
4- 6
-51
4- 6
-51
6-14
-50
12-1
5-49
0.54
&. \j
y +
.39
+.8
2+
.50
2.17
2.45
C)
}-- }- 64
L,W
ind
LL
, Win
dL
,Win
d
Jl C
437
8 U D,S S D (2) « San
U (2)
T(2)
«Ir
r.S
Cp,
TV
L. Cp,
L.
W.
L.
L.
CpjL
,W
.

11B
1
12E1
18F1
18N
1-6
. 29
C1
29C
2
and
Co.
Cou
nty
Wat
er
Dis
tric
t. d
o.
1Q94
2 0±
15 20 30 30
250
200+
38 45 167
135
D7_.
D2^__.
D8
D....
...
D8
._
D8._
...
... d
o
do-.
-..
KJu
... d
o..
i 1-25
-50
4- 6
-51
2-22
-50
4- 6
-51
1-25
-50
1-25
-50
2.41
! «5
.46
0 '18
'15
820+ 21.2
9
}- fi3
J^ L
15 «H
42
»11
6+
6+
23
D,S S PS
PS U D
Cp.
Cp.
L.
L.
T.
3 N
., R
. 7
W.
V7-
11L1
11L
213
D1
13D
213
D3
13D
413
D5
13D
614
H1
Cou
nty
Wat
er
Dis
tric
t,
do..
..
-d
o..
....
....
...
.. . d
o....... .
...
1949
1949
1Q4Q
1949
1949
75 75 40 40 40 4n 35 40 50
46 30 43 55 48 28
D 1
2..
..D
8__
D10-.
..
DIO
. D
10.
D10..
..D
8-.
.D
IO....
D 6
.
49 4?,
4 fi.... .d
o..
....
... .
..
Qy
al
.
... d
o... .
.
... d
o
... d
o
... d
o..
...
...d
o..
...
... d
o
do
10-1
1-49
10-1
1-49
10-1
1-49
10-1
1-49
10-1
1-49
11-2
2-49
1-25
-50
1-25
-50
'21.
2520
.85
7.44
7.00
6.97
4.12
9.15
5.52
J3
J% P T
$&10
25 25 25 25 7 10
23 23 23 23 13 10
D U PS
PS
PS
PS D D D
L.
L.
L.
L.
L.
L.
T.
4 N
., R
. 6
W.
4/6-
7H
1
7H2
8C1
8L1
8P1
17C
1
17R
121
J121
Q1
21Q
222
N1
. d
o.....
J. G
ilard
i....
,Gil
ardi
...~
. d
o
Q.
V.
Sil
acci
....
d
o.. .
.....
..d
o..
..
F
. F.
Loc
chin
i..
1950
1949
1910
1917
1948
1949
1939
10 5 40 25 20 15 30 80 55 75 50
35 13.5
55 49 200 24 21 184
464
318 21
D 8
.
Dug
60.
.
D 1
2..
..
D
8..
..
D, G
.
Dug
60
-
Dug
48.
.D
8
D 1
0..
..
D
Dug
60.
.
Ifl
21 162 15
10 7
grav
el.
...d
o.....
do
..
QT
m (
?)
Qoa
l (?
).
Qy
al.
QT
m..
.
...d
o..
...
do
..
do.....
10-1
3-49
4- 6
-51
10-1
3-49
4- 6
-51
10-1
3-49
4-6-
51
4-6-
51
10-1
3-49
4- 6
-51
4- 6
-51
10-1
2-49
10-1
2-49
4- 5
-51
10-
?-39
10-1
2-49
4- 5
-51
923.
465.
02
9.72
2.01
92
4.73
12.7
8 9.
27
13.4
15.
97
16.9
063
.06
59 ±
72.4
0 "1
1817
.00
13.8
5
-Jl P
J# LI
LJi
L1
H
L3 L
8 5 3011 8
136 22
D,S
,Dy
S D
D,
PS
(I0)
D,
S
D.S
.Dy
D,
S
A D
L.
W.
Cp,
E.
L.
See
foot
note
s at
end
of
tabl
e.

1 1 1 1| III | 1 S § S Sp ptr< ptr1 P tr1
^oWW EwoM w
s| 1 I s1
O ^ O ^ CO CO
H- M H- °° <° * fcO ts3 H* fcO CO
00 Cn Cn OCn OOCn ȣ O
t-i H* O5 Cn ^ --JCOCO CO W 0*3 0,0,0
o o o tS £o
Si=
rtf Cn
CO
B05
f
1
? ^
-^gi-
3 t^tjO 1
3 tO3 tp«p <
gOiOt < H-« o
jn --~l H1 »K DOCK
I
(H
0 tto c
JO
&§3 3 £,'£
10-12-49
:o
-t0
(
f
1**^
t-
O O O ? V
ft^o (rq o cfl p (ra 73
H CD g B 5p g B p,E° ^CD u t^-j OQ o -I^*
J? £. S OT S1^ag-S ..-P.|
^ ^3 B
>^tp Cnrf^
O O5 "N! hf^ Cn
3 t-tO h-i h-i
Cn CO Cu
i
, =
en
S
CO CO
p! 2iQ.-3 3 |_i
1
I !
o. S 3
CT CO CO
3000n cp O5 o
i
00 COCn 00
Cni^.
Gravel...... -. -.do......- -
11 ? f
"?^?r v ji CJi Oi Oi t^. CT Oi-'Oi-'O 0
:EuP gi
= .O i*'
0 0
I aDQDQ QQGQC^SC^HJ ooCjcjooy
« . P . P P 3 -
T. 4 N., R. 6 W. Continued
p
O
Year completed
Altitude of land-surface datum (feet)
It
Type of well and diameter of casing (inches)
Depth to top (feet)
Thickness (feet)
Otf1
f||
Date measured
Distance above (+ ) or below land-surface datum (feet)
Water-yielding zone or zones open to
well
Water level
Temperature (° F.)
Type and horsepower
Discharge (gpm)
Bailing or pumping rate (gpm)
Drawdown(feet)
a
Results of tests
SOther data available
TABLE 23. Description of water wells in the Petaluma Valley area, California Continued
<us[v vsoamQMIOHO
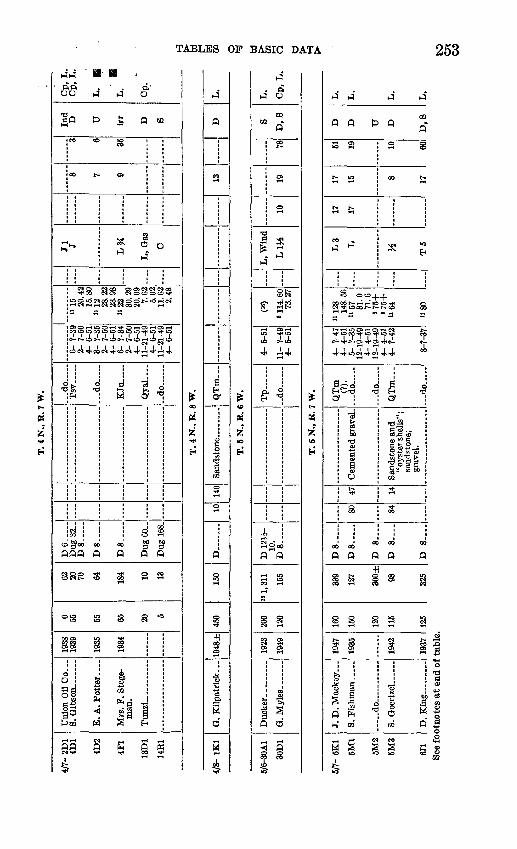
T.
4 N
., R
. 7
W.
4/7-
2D
14D
1
4D2
4F1
13D
1
14R
1
E.
A.
Pott
er. .
..
man
.
1938
1939
1935
1934
0 55 65 65 20 5
62 20 70
64 184 10 13
D6._
D8-
D8
.
D8...._
Dug
60.
.
Dug
168
.
do
d
o.....
KJu
.....
Ov
al
..do..
.
6- ?
-39
2- 7
-50
4- 6
-51
3- ?
-35
2- 7
-50
4- 6
-51
6- ?
-34
2- 7
-50
4- 6
-51
11-2
1-49
4- 6
-51
11-2
1-49
4- 6
-51
» 15 20
.42
15.8
0 11
12 28.2
2 23
.98
1122 30
.29
20.0
9 7.
625.
02
11.6
22.
48
Jl J
L?4 0
8 7 0
3 6 35
Ind
D U irr D S
Cp,
L.
Cp,
L.
L.
T,
"
cp.
v
T.
4 N
., R
. 8
W.
4/8-
1K
1Q
. K
ilpat
rick
...
1948
±45
015
0D
. ..
.10
140
QT
m...
13D
L.
T.
5 N
., R
. 6
W.
5/6-
30A
1
30D
1G
. M
yles
_..
....
1923
1949
200
120
« 1,
311
155
D 1
2J4-
10
. D
8-
-
Tp .
..
..do
4- 5
-51
11-
?-49
4-
5-5
1
(16)
11
4. 6
0 73
.27
....
L, W
ind
im10
1978
S
D,
S
L.
Cp,
L.
T.
5 N
., R
. 7
W.
5/7-
5K
1
5M1
5M2
5M3
6J1
See
fo
J. D
. Mac
key .
..
....
.do
.. .
.....
S. Q
oertz
el ..
....
otno
tes
at e
nd o
f
1947
1935
1942
1937
tab
le
160
150
120
115
125
339
127
300±
98 325
D8 ..
D8
~..
.
D 8 .
D 8 .
D 8
.
80 84
47 14
Cem
ente
d gr
avel
-
Sand
ston
e an
d "o
yste
r she
lls";
sa
ndst
one;
gr
avel
.
QT
m^?
)' d
o-
... d
o
QT
m..
.
do
_
4- ?
-47
4- 4
-51
5- ?
-35
12-1
9-49
4-
4-5
1 12
-19-
49
4- 4
-51
4- ?
-42
8-?-
37
"128
14
8.56
"5
7
81.0
71
.6
875+
«7
5+
»64
"80
....
L3
L H T5
17
17
17
15 8 17
51
19 10
60
D
D U
D
D,S
L.
L.
L.
L.
to Cn
00

3QO td WW DO fcO*-1 "* IO I-*
H ^ * HS Or/i
5. s3 o 0 5
1 1 ISSSo S 83
utao co tooo oocno >-> ooto
ddI-*
x> to
1 1 5 3
I
0
I-
ooo
5
&l
a dJ OO
i H3 3 3
dX
io
t?trms 1 HO 1 » O
rf^ rf^ en rf^
CncDCO Oi<otooo
J
tr1 «HHa CO
S 8
3X
S
S t^ eS S SO H HW ^d^ti W ^ ^. co fco «->j>; ^ ^ ,_, ^^ [j
^ w o ^^ »* ^t^ ^i"1 >" H P W 2, 03^ g,^ ,g p* Q^ g
1 S 1 1 II 1 li II 1S S Op O OCn ^1 rf^O K-'l-' M O Cn O O OO Cn Cn O Cncn CTI
O -a o to ooK ts IO-] *>.to S
d d dQ 00 50
P° I '
-* h-^ coCO l-> I-1 &*k *^ O
to l-« h-^ CO ^3oocnoo eo o
Clay and gravel..
2,0, 3 O
i
r
Blue sand _ .... Gravel; ce
mented gravel. Gravel ........... _.__ do __.__....__..
^0 £> S'&CsHJ H3 o o CSd B
5?;?5?CO o O> Cn
C) Cn Cn
i i
=H«H tr1 f >-3-°to ts i-« fco
h-i0at
O Cn O
S fe 8
d S
Od d dk-i OOor oo oo O5 1 1
COI-i IO
K-><O tO J Cft Cn
Cemented gravel; clay and gravel. Clay and gravel.. Gravel; clay and gravel; sand.
H3 11 ^K^3 53 C?B
h-* 1 1 * 1
mff TT t4x rf». ti*.rf^
tOtOOd I-1 1-* COCO J- S! h&. 00 00 CO CO
ooo co -<r
i i !
d dd d30 OOOO OO
0
S
flf
i i i 1-3333 3
3
D '
3 ^8SS£5SO Cft Cn
i
M t* M^ t^^ tr1 -j-- fco co
S3 &
»_« l-a |-a tOCO tOoo eft o*a cno -3
' O» ^3 ^3M W t O ^3Oi tOO to
,-Hj^j M HH ^ ^ t? S^ H ^MMH ^" CQ CQ ^* ^ ^CQ CQ CQ
ir'QQ tr< otr<f IT1 t* t* Ft* t* t*r1 Qf f P'
T. 5 N., R. 7 W. Continued
^ &p p
o
s
Year completed
Altitude of land-surface datum (feet)
X-vd
?ss&Type of well and
diameter of casing (inches)
Depth to top (feet)
Thickness (feet)
O
1
«.QS!a DUO
?no
Date measured
Distance above (+) or below land-surface datum (feet)
Water-yielding zone or zones open to
well
Water level
Temperature (° F.)
Type and horsepower
Discharge (gpm)
Bailing or pumping rate (gpm)
Drawdown (feet)
*ti
d
Results of tests
?
Other data available
-
8s
Oo
<IKV vsoa viuvs JMI(LMaoao

8F1
OM
1
10Q
1
14L
1 15
K1
16J1
17C
1
17D
1 17
D2
17E
1 17
R1
19A
1
19G
1
19G
2 19
G3
19H
1 19
N1
19P1
20B
1
20C
1
A. S
onni
chse
n ...
A.
B.
Den
iz
Mrs
. J.
P.
Whi
take
r.
J. M
cC
art
er.
M.
Mal
acre
dL
d
o.
J. J
. C
loug
h ..
...
Mrs
. J.
Han
son.
Obe
rg L
umbe
r C
o.
A. V
. A
ugui
ar..
W.
B.
Kin
g.....
M.
N.
Aza
vedo
.
D. W
all
s .
...
1943
1947
1949
1949
1939
1949
1940
1930
19
48
1945
19
39
1948
1948
1949
1949
19
45
1941
1949
78 110
300
94
0
135
110
115 45 45
120 45 QA 4t
QE 45 95 45 45 40 oe
115
165
462
"1,4
50 106
185
339 60 64
150
240
325
207
91 fi
150
OA
K
180
160
finn
688
Do
Do
D 8
.
T\
in
D.
D 1
2
D 8
-6
D 7
D 1
2
D 8
.....
D 8
D 8
Do
Do
D 6
.
Do
Do
D 8
D 1
2.
D,
Q12
-8.
100
131
190
435 fifi
230 20
130
jm J316 n 20 32
2 43
5
MR
615
14 24 10 27 61 99 40 15
14
0 7 20
7
290 88
78 47 73
sand
ston
e.
sand
. C
emen
ted
grav
el;
clay
and
gra
vel.
Vol
cani
c ro
ck
(tuf
f br
ecci
a).
Fin
e gra
vel
.. .
"wat
er"
sand
.
San
d an
d gr
avel
co
ntai
ning
st
reak
s of
cla
y;
sand
y cl
ay c
on
tain
ing
stre
aks
of s
and
and
grav
el;
con
gl
omer
ate;
San
dy c
lay
San
dy c
lay,
sh
ells
.
and
grav
el.
Gra
vel;
har
d gr
avel
; sa
nd
and
shel
ls.
...d
o.....
Tp
d
o.....
... d
o.....
...d
o..
...
Tp (
?)
d
o_
.._
QT
m(7
).
Tsv
QT
m(?
).Q
Tm
.-_
Qoa
l(?)
QT
m.
QT
m...
... d
o _
.
QT
m...
do.
QT
m(?
).
Qya
l, Q
oal.
QT
m...
d
o.
d
o
.
...d
o....
9-30
-49
4- 5
-51
2-15
-50
4- 4
-51
1-31
-50
11-
?-39
5- 3
-50
4- 4
-51
4- 6
-51
9-30
-49
9-30
-49
12-2
8-49
2-
23-5
0 4-
6-5
1 10
- ?-
452-
14-5
04-
6-5
1 2-
15-5
0
4- 6
-51
2-14
-50
2-15
-50
4- 6
-51
3-30
-51
3- 1
-50
2- 9
-50
4- 6
-51
9-30
-49
10-1
4-49
132.
22
131.
64
170+
299+
200+
"34 22
.20
26.2
7 72
.27
20.8
0«
25. 7
1 20
.66
17.8
3 14
.29
45 4.55
3.50
14
.02
6.09
11
.29
45.6
013
.62
54 1 4.37
7.78
«23.
33
29.3
8
8
fU
- [...
Jl LI
L3
T15
JH L1H
J 2
LIJ
i
L3 L J 2
L3
j m J 1
T 7
}i
TA
f\
20 13 11 16 12
12 40 200 20 17
23 20
"17 13 18 30 650
31
"100 61 '20
108 40 37 28 140
D D,
S
D,
S
Irr
D Dy,
Irr,
8
D ITD
,Dy,
S D D D D D US,
Irr
D.S
,
^ D,
S
Irr,
S
L.
L.
C.C
p,
L.
E.
L.
L.
L. w.
L.
L.
L.
L,
L.
L. c. L,
W.
L,
0
Cp,
W.
Cp.L
,W
.
See
foot
note
s at
end
of t
able
.
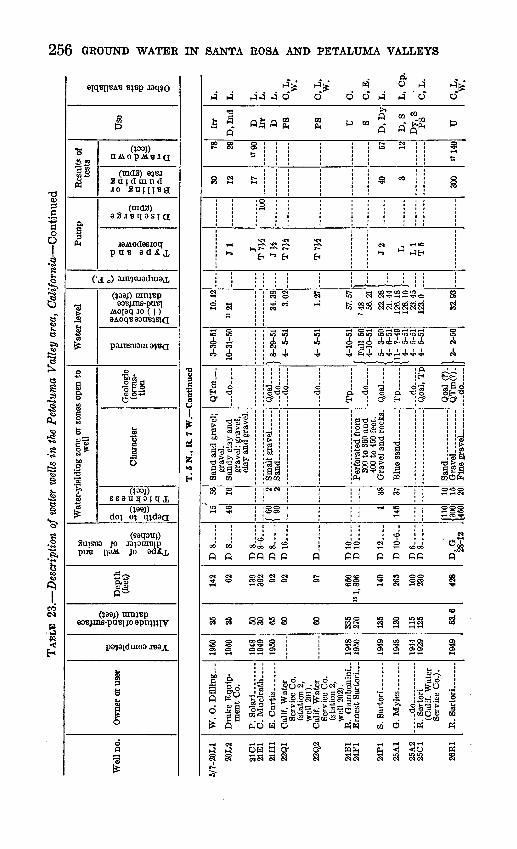
~110 tOtO tO N) kOkO tO (0 tO tOtO W W3 cnen en >£ i£i£ to to i-1 H>H> to o
w »i p p ww o ^ o M p^ d ^
O Q O ' f5* 2 CClB^^^^^O^^i M £* 2. y-s t^ W*^ ^J CO ^. pCTtoO^PH^D^PCO1"! Qr^ u.
>" S" i p* B. " ! ' T3
1 II 1 1 II i i 1 11 1 1H* 1-* Hi H* tO CO
Stoi-i to co -vico ro o? CT> cocn to to en en o en oen o o en oo d enO5
So oo en o og -j to to toco to to
d
SS5IO *- t *So.o
Sand.. ........... Gravel. .......... Fine gravel .......
dd d d dOOO i-i HI H>
o to o
p i
en H>
CO CO
Perforated from 300 to 360 and 400 to 450 feet. Gravel and rocks.
Blue sand ____
T"X -o i '
f tttr rr i
CO to to to to ro to o to co oo oo ro « to o
SO ** "-» i ' **fc bO K
CnO 00 4* 00 H
1
i
i VT~AT~'
0. ^ tO
>~t o» IO --I
*J£.
g
00
-,
d
3
r ?
3JT
d
3i
t
fs
1
£3
^ <r <* * ids
d dS P8
ssto to
Small gravel . Sand-.. _ . .....
> ?t
| 8-29-51 4- 5-51
jj "
g s
dZ
!^ iS M-*
I
d d d X OO 00
£ S
S g
Sand and gravel; gravel. Sandy clay and gravel; gravel, clay and gravel.
P. *3 P B
? r SS g g 2
s sto
!
=H -
I
5 5 g
i s a
m <o &Q 0 f f 0
d
3 0 o tr1 tr1^ f f
T. 5 N., R. 7 W. Continued
§ti p
O
3
Year completed
Altitude of land-surface datum (feet)
Rd
If Ex*
Type of well and diameter of casing (inches)
Depth to top (feet)
Thickness (feet)
O
~,Q SSgBit ' ?r
Date measured
Distance above (+) or below land-surface datum (feet)
Water-yielding zone or zones open to
well
Water level
Temperature (° F.)
Type and horsepower
Discharge (gpm)
Bailing or pumping rate (gpm)
Drawdown (feet)
>t)
d
Results of tests
ag
Other data available
axv VSOHONUIOHO

26R
228
A1
28A
2
28A
3
OS
4 4
ZO
-lx:
r
28G
1
28H
1
28H
2
28H
3
28H
4
28H
5
28N
1
29B
1
Hart
man ...
. .C
alif
. W
ater
Serv
ice
Co.
(s
tati
on 1
,w
ell
114)
.C
alif
. W
ater
Ser
vice
Co.
(sta
tion
1,
wel
l 10
6).
Cal
if.
Wat
erS
ervi
ce C
o.
(sta
tion
1,
wel
l 11
1).
oQi
if
"Wnto
r \j
ali
l,
w d
tcj.
Serv
ice
Co.
(sta
tion
1,
wel
l 10
4).
Cal
if.
Wat
erS
ervi
ce C
o.
(sta
tion
1,
wel
l 11
3).
Cal
if.
Wat
erSe
rvic
e C
o.
(sta
tion
1,
wel
l 11
5).
Cal
if W
ater
Ser
vice
Co.
(sta
tion
1,
wel
l 10
2).
Cal
if.
Wat
erSe
rvic
e C
o.(s
tati
on 1
,w
ell
103)
.C
alif
. W
ater
Ser
vi
ce C
o.
(sta
ti
on 1
, wel
l10
7).
Cal
if.
Wat
erS
ervi
ce C
o.(s
tati
on 1
,w
ell
112)
.
G.
E. P
ark
......
L.
J. P
eter
sen.
.
1946
1941
1931
1944
1947
1949
1948
47.4
35 35 35 35 35 35 35 35 35 35 15 35
35 502 99
280 94 94 483 95 92 83 468 62 95
D 1
2....
D 1
2-10
.
D 1
6-12
.
D14-.
..
D16..
..
D1
2. .
..
D 1
2-10
-
D 1
2....
D1
2. .
..
D16 -
.
D 1
4. ...
D 6
.
DC
f!66
1330 75 22
0
[50
\ 69
(154
J2
50
1 198
265
300
348
QA
74 S
andy
cla
y;
sand
.95
Fin
e gr
avel
; cl
ay
and
gra
vel.
15 S
andy
cla
y an
d gr
avel
; sa
ndy
clay
.40
Cla
y an
d gr
avel
; sa
ndst
one;
gr
avel
.
7 G
rave
l an
d rl
ay..
grav
el.
27 C
emen
ted
grav
eL
186
Cla
y an
dbo
ulde
rs;
clay
an
d gr
avel
.
27 S
ands
tone
; gr
avel
. 11
San
dsto
ne;
clay
an
d gr
avel
.
sand
ston
e.
60 C
lay
and
grav
el;
grav
el;
sand
st
one.
Qyal
.Q
Tm
(?)
Qya
l,Q
oal
d
o. .
QT
m
Qya
l,Q
oal
Qy
al
...d
o
Qoal
....
Q
Tm
-
Qya
l,Q
oal
do..
...
Qya
l,Q
oal.
Qoa
l, Q
Tm
. Q
Tm
...
... d
o.....
d
o
Qyal
_
Tsv
(?)
.
2- 7
-50
1- 4- 5
-51
4- 5
-51
4- 5
-51
4- 5
-51
>
3- 2
-50
4- 4
-51
4-4
-51
4- 6
-51
01 4
0
16.9
9
15.7
9
21.5
0
16.5
7
4.60
4.55
28
.22
26.9
0
T7
*i
2
T7
}i
T5
T7
}i
T1
0
T5
T7J4
T20
Jl
LI
15
44 132
117 62
t? PS
PS
PS
PS PS
PS
PS
PS
PS
PS D
D
w. C, L,
W.
C, L,
W.
0, L,
W.
C, L,
W.
C, L, W.
C, L,
W.
C, L.
See
foot
note
s at
end
of t
able
.

1
Creamery. Poultry Produc
ts
s
8s
U
*
3
^
P«S £d W S N <O CO (O 1 l-> u
d W *d O >* >>
1 1 gf f £ | |3 Og W t3 B p *» 0 p S
Q W 1
§ § j
^ IB ,t* oo »g tfr
g g g S S § S
B.C S Ss« 8 So o o p«o o o
°°s f rE2 o o
£ gS gs oa £>
% B=fl6 o &S » a JT "«S» S g£2-gs B»g.e-S- g^§ ,s e | ' 's ^
i-3 £> "3 ^O
^ B 5* 5* ^ 3 B3 ^ i P
itSltitzii rgBlggggSj-^^ jog
SSSSSSS^oS S2
j 1
C~l «H *^ "^ «H M «H°* CT S
0 i s
* «
SCO <D U o» to o
| u S « 9" o u
tr1 tr1 tri t-t Q
1to
3
S
s
o3»
sand; sand stone; clam shells and sandstone.
'f
?Dl
CO
g
=1
eo
|
t"
1
3
i
o3S
M
i
«'r 60 g.
5
FH*
0
r<
Sg § § & 2 2 g 2w g w > ! * ? > W^ td e^ u
* (JO < * ^
? i ti
» ^ O 1
8 g S S
^ (P O Cw
0 0 O Ox> oo oo oo
0
g
Sand; sand and gravel.
? > > g9
ftgtjrt?tt
toco 03*^16. M W W *-! OS
X tNd OSH^COtocntoie-oo
j
^ "1
~a oo
&3 H* H&Si Cn t*. OS
3 O» O 1
5 U U O
r» f f a5*
H enS!
» -j
^ 1
Continued
iB p
O
8
I
Year completed
Altitude of land-surface datum (feet)
x-O
|| s-rf tr*
Type of well and diameter of casing (inches)
Depth to top (feet)
Thickness (feet)
Q
I S
~s-£ B||
Date measured
Distance above (+) or below land-surface datum (feet)
Water-yielding zone or zones open to
well
Water level
Temperature (° F.)
Type and horsepower
Discharge (gpm)
Bailing or pumping rate (gpm)
Drawdown (feet)
*d
o
Results of tests
§Other data available
SJLHTIVA vwnivxgj ONV vsoa viitvsaunoao

33M
1
33N
1
33N
2
33Q
1
34A
1
34A
234
E1
34E
2
34G
1
35B
1
35G
1
35H
1
35K
136
B1
Lac
e H
ouse
Lau
ndry
.
A.
M.
Bul
lard
(Cal
if.
Wat
er
Serv
ice
Co.
).
Cit
y of
Par
k).
G.
Per
ry (
Cal
if.
Wat
er S
ervi
ce
Co.
).
Ben
B.
Smith
_
Dr.
H.
E.
Cla
rke.
R.
Sart
ori _
__
.
Cal
if. W
ater
(sta
tion
5,
wel
l 50
1).
R.
Sart
ori .......
0.
Pato
cchi
.....
1047
1934
1948
1949
1950
1937
1948
1949
1920
1948
1925
1948
30 35 40 25 25 20 10 10 12 42 25 29.2
18.8
50
132
300
250-
350
205
410
520
464
280
230 28 90 542 78 120
D
8_..
.
D8. .
D... .
D 1
0-8.
.
D 1
0 _ .
D,
G 1
0.D
12-
10.
D8. .
D,
G 1
0.
D12±
__
D 1
0 _ .
D 2
8-12
.
D 1
2..
..D
8-.
.. .
130
fi5 175
180
440
487
5 60 10 30 40
M
Sand
and
gra
vel .
S
ands
tone
.. ..
....
rock
.
Smal
l gr
avel
; fin
e gr
avel
an
d sa
nd;
fine
sand
. C
lay
and
very
sm
all g
rave
l.
QT
m (
?)
JK....._
QyaL
...
QT
m ..
.ik
...
Qya
l,Q
oal
(?),
QT
m.
QT
m (?).
Qya
l,Q
Tm
.
QyaL
...
...d
o.....
QT
m...
do.....
__. d
o..
...
Qyal
....
TP
(?)
..
10-2
5-47
6-23
-34
4- 4
-51
13-24
-60
4- 4
-51
4- 4
-51
2-14
-50
4- 4
-51
11-1
3-49
4- 4
-51
2- 7
-50
4- 4
-51
11-1
3-49
4- 4
-51
6-30
-48
4-30
-49
6-30
-49
11-1
3-49
1117
40
"260 53
.68
19.3
721
.11
12.4
5
9.44
7.24
18
.07
9.22
24
.32
16.3
1 24
.01
12.4
9
'75
'65
'75 26
.81
J5 L T5
T10
T1
5
T7Ji
T20
JJi
L3
T50
T7^
220
180 40 200 5
37 7 55 300
100 8
'6 10
"140 18
5
',"10
0
U D PS
Irr
PS Irr A
D,
Irr,
S Irr U D PS Irr
D,S
L.
L.
O.
L.
O.
C.
L.
L.
O.
O, L
.
C,W
.L
.
T.
5 N
., R
. 8
W.
5/8-
11N
1
13A
1
13B
1
13G
1
See
fo<
Rev
. H
. G
ans .
..
S. P
ozzi
.........
d
o..
.. ..
.. ..
.
>tno
tes
at e
nd o
f
1949
1941
1940
1930
±
tabl
e.
230 65 45 40
271 92 172
150-
250
D__
__ ..
.
D8. .
D8
.
D..
....
.
0 3
271
169
grav
el.
grav
el.
QT
m...
do..
Qya
l,Q
Tm
.
do
....
.
2-15
-50
4- 4
-50
4- 6
-51
8- 7
-40
4- 4
-60
4- 6
-51
4- 4
-50
4-6-
51
111.
19
33.6
031
.10
1112 1.
37
.5(3
)W
L JH L T
17 12 25
-
15 36
D D a
Irr,
U
Op,
L.
L.
L.
to Or
CO

« Abandoned water-w
33 feet.
2 Foundation test bori ' Well flowing; static l * Measured by the Ge « Pumping recently. « Estimated natural flow. ' Reported by owner. 8 Obstruction at depth indic
Pumping.
w well was never developed
ll ingv
d- y.
SSP-SiS SS5SS^ ng^Sowwww^ P S5 S ^"*^ X3 'O X3^l^gle-aaaE Uftl! SPI& BfSffPt^^^ si. ^ &g§"=^ B M O ro a, cp 3.
200 t of dev ater
1 iE. Johnson ...... Leo Vannuccl... A. F. Cerini .....
00 StO
a ss
g S 1-1 to
7?io rfx rfirfx rf^ojcor; o dw w^s;
i p i PS 1 S 1 1tOI-'OO
Ct O Cn O OO OOttn
si is § s § i ^d dd oo oooo
to o
H-< OO01 en
Sand; sand and gravel; sand and shells; sandstone. Sand; sandstone..
P ? 3
*-» i-*
i» StOC
W 00 O®
i i ! ^
en too
Sen Cn Cncn
dd
O t"1^ P ' "
d d oo
o oo
8 1
Sandstone. .... Sand .............
3 3
^38
to to
-1COen
en
s
ddd00 00
0 g
i s
Fine sand and small gravel;
fine sand. Sand; sand and gravel.
__
\ £> a, p, HP B
S8id ddd3 M P°?°
en co
«g
§ B"
tf ^^ t ?? 7=^0 ?en Qt ^ en en (- O -JO I-1
to to rf>.
toco oo to -j to o> t-1
Cn to
to i-» en o
eo to
I CO
Cn
Sandstone ........ Gravp.l
3 g
2-15-50 4-10-51
8
i
Cn
*§
1s°
Q t"1 t"1 t"1 JT^JT1
JT1
^ gB o
O
8 R
Year completed
Altitude of land-surface datum (feet)
«-d It ^-^ tr1
Type of well and diameter of casing (inches)
Depth to top (feet)
Thickness (feet)
Q
"-*
CD et-O CD
gel If T9S"
Date measured
Distance above (+) or below tod-surface datum (feet)
Water-yielding zone or zones open to
well
Water level
Temperature (° F.)
Type and horsepower
Discharge (gpm)
Bailing or pumping rate (gpm)
Drawdown (feet)
>ti
a
Results of tests
?
Other data available
vsoa VXNVS HI aaxvAi (mnoao

TABLES OF BASIC DATA . 261
TABLE 24. Periodic water-level measurements in wells in the Petaluma Valley area,California
Date Water level
Date Water level
Date Water level
WeU 3/6-1Q1
Mrs. H. Clokie. About 11.6 miles southeast of Petaluma, 0.33 milo southeast of State Route 37,450 feet southwest of Reclamation Avenue, 60 feet east of dwelling, 12 feet northwest of tank house. Domestic anfl stock well; diameter, 7 inches; reported depth, 225 feet. Measuring point: top of casing, north side, 1.0 foot above land-surface datum, which is 2 feet above sea level.
Jan. 25,1950 __Feb. 22 ___ -. _ .Mar. 28
1 Near low tide, a Near high tide. 3 Between tides.
+0.39+.37+.74
'+.29».32
July
Oct.
13,1950_ -8 __ 7 ...........
18 ._.........29 ...........
20.62* .7",».86
U.843 +.20
Oct. 16
Apr. 1,
1951. .......
1952...........1955.-... .....
+0.233.98
*+.08U. 01
.07
Well 3/6-4D1
W. Q. Wright. About 8.6 miles southeast of Petaluma, 1.57 miles east of the Northwestern Pacific Rail road at Novato Airport, 430 feet east along levee road from well 3/6-5A1, 525 feet north of levee road, 6 feet west of centerline of north-trending drainage ditch, in field. Unused well; diameter, 8 inches; depth, 120 feet. Measuring point: top of casing, west side, 1.2 feet above land-surface datum, which is 4 feet below sea level (altitude determined by hand level from well 3/6-5A1).
June 14, 1950 . _ ..July 13Aug. 8' _.-..-..-..
1 Near high tide. 3 Between tides. 3 Near low tide.
i 2. 4512.5922.2181.75
Oct. 18,1950- 29 ...........
6, 1951-
81
M1
671743
Oct. 16, 1951 _______
Apr. 1, 1952 ........
»1.35U.1230.84
Well 3/6-5A1
W. Q. Wright. About 8.6 miles southeast of Petaluma, 1.5 miles east of Northwestern Pacific Railroad at Novato Airport, 0.32 mile west along levee road from Radio Station KGBS transmitter, 60 feet north df levee road, 3 feet east of fence. Stock well; diameter, 4 inches; depth, 83 feet. Measuring point: top of cas ing, north side, 1.3 feet above 4- x 4-inch timber casing supports and land-surface datum, which is 0.80 foot below sea level (altitude determined by spirit level).
Dec. 15, 1949 ___ _ .....21 ._ . .29 ..-.. -.
1118 ___ 26 ... 27 __--. ..-
+0.05.03.1600
.13+.17
.25
.13
Feb. 22 ..... Mar. 31
July 13 ...........
.026no
.073 +.09
.33
.45
.66
Sept. 7, 1950 _ ........Oct. 18
A nr fi 1 Q ^1
Apr. 1, 1952-... __ -
SO. 49.75.23.43.73.46.12
i Low incoming tide; well flowing up outside of casing. 3 Near low tide.3 Near low tide; well flowing up outside casing.
, «Near high tide. Between tides.
Well 4/&-21J1
L. Bourke. About 7.7 miles east-southeast of Petaluma, 0.16 mile northeast of New Lakeville Road along old Lakeville Road, 100 feet southeast of old Lakeville Road. Unused well; diameter, 8 inches; depth, 284 feet. Measuring point: notch in south side of casing, 1.1 feet above land-surface datum, which is 80 feet above sea level.
Oct. 12, 1949 Nov. 10 __.._ ._."HAP 7
28 . . ...Jan. 31, 1950-. - ....Feb. 22 _.... ...Mar. 28 ...........
63. D661.8261.4161.1760.2059.6959.17
A nr 98 TQtn
July 13 ...........
Oct. 18 .... _ ....
58.8961.1763.6466 0468.7870.81
Dec. 29, 1950 ____ ....Apr. 6, 1951 __ -
Oct. 16 __ -
Apr. 1,1952
71.2168.6870.4774.7175.2970.02
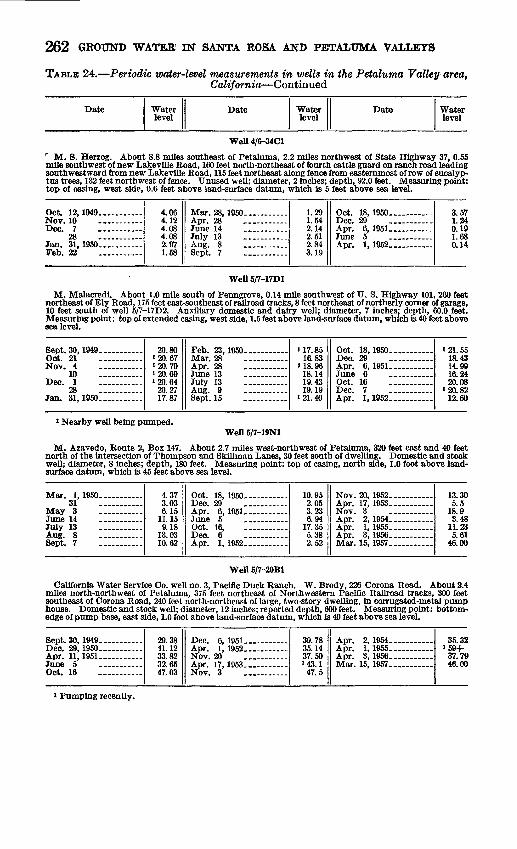
262 GROUND WATER1 JN SANTA ROSA AND PETALUMA VALLEYS
TABLE 24. Periodic water-level measurements in wells in the Petaluma Valley area,California Continued
Date Water level
Date Water level
Date Water level
Well 4/&-34C1
r M. 8. Herzog. About 8.8 miles southeast of Petaluma, 2.2 miles northwest of State Highway 37, 0.55 mile southwest of new Lakeville Road, 160 feet north-northeast of fourth cattle guard on ranch road leading southwestward from new Lakeville Road, 115 feet northeast along fence from easternmost of row of eucalyp tus trees, 132 feet northwest of fence. Unused well; diameter, 2 inches; depth, 92.0 feet. Measuring point: top of casing, west side, 0.6 feet above land-surface datum, which is 5 feet above sea level.
Oct. 12,1949 _Nov. 10Dec. 7
28Jan. 31,1950 _ ........Feb. 22 __ .......
4.064.124.084.082.971.58
Mar. 28, 1950 ___ . _ .Apr. 28 _ -.- ..
Aug. 8 .......Sept. 7 ___ ..
1.291.542.142.512.843.19
Oct. 18,1950 ____ ....Dec. 29Apr. 6, 1951 _ .. __ .
Apr. 1, 1952 ___ . _ ..
3.571.240.191.680.14
Well 5/7-17D1
M. Malacredi. About 1.0 mile south of Penngrove, 0.14 mile southwest of TJ. S. Highway 101, 260 feet northeast of Ely Road, 175 feet east-southeast of railroad tracks, 8 feet northeast of northerly corner of garage, 10 feet south of well 5/7-17D2. Auxiliary domestic and dairy well; diameter, 7 inches; depth, 60.0 feet. Measuring point: top of extended casing, west side, 1.5 feet above land-surface datum, which is 40 feet above sea level.
Sept. 30, 1949 ___ .....Oct. 21 ____ ...Nov. 4 ...........
10 _ . ___ -Dec. 1 ...........
28 __ .......Jan. 31,1950 __ .......
20.80 20.67»20.79 20.69120.64
20.2717.87
Feb. 23,1950 _ - _ ....Mar. 28Apr. 28
July 13
Sept. 15
U7.8516.83
118.9618.1419.4319.19
121.40
Oct. 18,1950 _ ........
Apr. 6, 1951 __ .......
Oct. 16 ___ . _ .Dec. 7 __ ......Apr. 1,1952 __ .... ...
' 21. 5518.4314.9916.2420.08
120.8212.60
1 Nearby well being pumped.Well 5/7-19N1
M. Azavedo, Route 2, Box 147. About 2.7 miles west-northwest of Petaluma, 320 feet east and 40 feet north of the intersection of Thompson and Skillman Lanes, 30 feet south of dwelling. Domestic and stock well; diameter, 8 inches; depth, 180 feet. Measuring point: top of casing, north side, 1.0 foot above land- surface datum, which is 45 feet above sea level.
Mar. 1,1950 ____ ....31 ._ .. .
May 3 __.........
July 13 -.... ...
Sept. 7 ...........
4.373.036.15
11.159.18
13.0310.62
Dec. 29Apr. 6, 1951 _ - _ - _
Oct. 16,Dec. 6 ...........Apr. 1, 1952 __ .......
10.952.053.236.94
17.355.382.52
Nov. 20, 1952 ___ . __ -Apr. 17, 1953 _ ........Nov. 3 ___ ......Apr. 2, 1954 _ ........Apr. 1, 1955 __ . _ ...Apr. 3,1956 __ ........Mar. 15, 1957 __
13.305.5
18.93.48
11.235.61
46.00
Well 5/7-20B1
California Water Service Co. well no. 3, Pacific Duck Ranch. W. Brody, 226 Corona Road. About 2.4 miles north-northwest of Petaluma, 375 feet northeast of Northwestern Pacific Railroad tracks, 300 feet southeast of Corona Road, 240 feet north-northeast of large, two-story dwelling, in corrugated-metal pump house. Domestic and stock well; diameter, 12 inches; reported depth, 600 feet. Measuring point: bottom- edge of pump base, east side, 1.0 foot above land-surface datum, which is 40 feet above sea level.
Sept. 30, 1949 __ .. _ ..Dec. 29,1950. _____ .Apr. 11, 1951 ___ . _ -
Oct. 16 ...........
29.3841.1233.8232.6547.03
Dec. 6, 1951 ___ ......Apr. 1, 1952 _ .. ...
Apr. 17,1953 ___Nov. 3 ___ . _ ..
39.7835.1437.50143.1
47.5
Apr. 2, 1954 __ . ___ .Apr. 1, 1955 __ ........Apr. 3, 1956 __ . ......Mar. 15, 1957 __ .......
35.32159-r-
37.7946.00
»Pumping recently.

TABLES OF BASIC DATA 263
TABLE 24. Periodic water-level measurements in wells in the Petaluma Valley area,California Continued
Date Water level
Date Water level
Date Water level
Well 5/7-20C1
E. Scott. About 2.5 miles northwest of Petaluma, 0.24 mile northwest and 0.16 mile southwest of North western Pacific Railroad crossing of Corona Road, 0.2 mile southwest of railroad, 25 feet west of drainage ditch, in frame pump house. Irrigation well; diameter, 12 inches (reduced to 8 inches); depth, 688 feet. Measuring point: top of access hole in east side of pump base, 1.2 feet above land-surface datum, which is 35 feet above sea level.
Oct. 14,1949 ______21 ______
Nov. 4 .. ___ ...10 .....
8.048.078.047.99
Dec. 1, 1949. ____ -28 ...........
Jan. 31, 1950 ______Feb. 23 ....... .
a 057.966.925.98
Mar. 28, 1950 _____ -May 3 ...........
Oct. 18 .....
5.645.47
^24.9021.40
1 Pumping recently.Well 5/7-26R1
California Water Service Co. station 6. R. Sartori. About 2.6 miles east-northeast of Petaluma, 400 feet northeast and 100 feet southeast of intersection of Ely Road and Casa Grange Avenue, in open field. Unused well; diameter, 12 inches; depth, 428 feet. Measuring point; top of IJi-inch nipple in top of steel casing cover, .3 foot above land-surface datum, which is 53.6 feet above sea level.
Feb. 2, 1950 _____ .15 ___ 22 ..... ...
Mar. 1 ___ ... ...8 _____ -
14 ...........17 ... 28 ______ .
33.2331,3330.6430.2030,2130.2530.2229.51
May 3,1950 _ ... _ ..
July 13 ___ ......
Oct. 18 ...........Dec. 29 _____ .Apr. 4, 1951 ____ ....
29.2530.6231.7032.6734.0334.8230.9023.50
June 7, 1951 _____ .Oct. 16 ..... Dec. 6 ..Apr. 1, 1952 ___ .....Nov. 20 _____ -Apr. 17, 1953... . .......Apr. 2, 1954. _____ .Apr. 1, 1955. __ . _ -
24.6228.8632.7421.1929.4522.0326.7830.67
Well 5/7-26R2
W. Hartman. About 2.5 miles east-northeast of Petaluma, 200 feet southwest, thence 250 feet southeast of the intersection of Ely Road and Casa Grange Avenue. 1 foot southwest of base of old wooden tank tower. Unused well; diameter, 12 inches; depth, 35.5 feet. Measuring point: top of casing, southwest side, 1.0 foot above land-surface datum, which is 47.4 feet above sea level.
Feb. 7, 1950... 15 ___ . __22
Mar. 1 _._._ ..8
14 .-.. 17 ..... .31 ...........
Apr. 28 .... ___ .
21.5923.1924.2624.6324.9724.9725.0024.6724.26
June 14, 1950 ...........July 13
Sept. 15 ___Oct. 18 ___ ..... .
Apr. 4, 1951
Oct. 16 ____
25.5026.2827.1228.5729.8024.011&0219.5325.35
Dec. 6, 1951 _____ .
Nov. 20Apr. 17,1953 ______ .Apr. 2, 1954 ___ .. _ .May 20 ...........Apr. 1, 1955 ______ .Apr. 3, 1956.... __ ..Mar. 15, 1957
26.6213.9124.0716.7321.5126.7825.2622.1030.00
Well 5/7-35K1R. Sartori. About 2.3 miles east of Petaluma, 0.33 mile east of intersection of Lakeville Road and Casa
Orange Avenue, thence 250 feet southwestward along Adobe Creek, 15 feet east of creek in frame pump house. Irrigation well; diameter, 12 inches; reported depth, 78 feet. Measuring point: hole in north side of pump base, at land-surface datum, which is 18.8 feet above sea level.
Oct. 13,1949 Jan. 18, 1950. __
31 .. Feb. 22 .... Mar. 28 ______Apr. 28June 14 .._ July 13 ...........
26.8125.1022.8416.6316.3522.6826.0628.18
Sept. 15, 1950. .. ........Oct. 18 ____ ....
Apr. 4, 1951. __Oct. 16 ...........
Apr. 1, 1952. ____ Nov. 20 ...._ .
132.4328.0019.9017.4830.6320.8711.7325.12
Nov. 3,1953 _ ........Apr. 2, 1954 ____ ...
Apr. 1, 1955 ____ ...Apr. 3, 1956 ____ Mar. 15, 1957 ____
27.3117.4540.0522.1513.6419.63
Probably pumping recently.
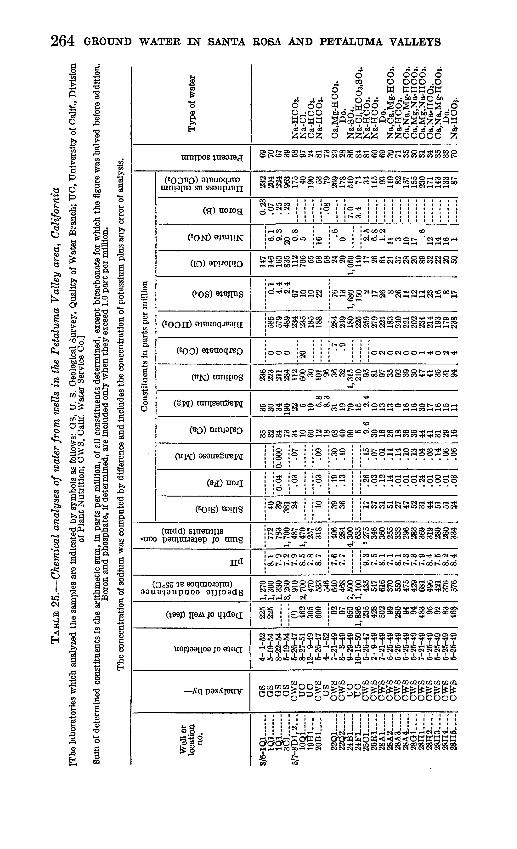
TABL
E 2
5.
Che
mic
al a
naly
ses
of w
ater
from
wel
ls i
n th
e P
etal
uma
Val
ley
area
, C
alifo
rnia
[The
labo
rato
ries
whi
ch a
naly
zed
the
sam
ples
are
ind
icat
ed b
y sy
mbo
ls a
s fo
llow
s: G
S, U
. S.
Geo
logi
cal
Surv
ey,
Qua
lity
of W
ater
Bra
nch;
UC
, Uni
vers
ity o
f Cal
if., D
ivis
ion
of P
lant
Nut
ritio
n; C
WS,
Cal
if. W
ater
Ser
vice
Co.
]
Sum
of d
eter
min
ed c
onst
ituen
ts is
the
ari
thm
etic
sum
, in
par
ts p
er m
illio
n, o
f all
cons
titue
nts
dete
rmin
ed,
exce
pt b
icar
bona
te fo
r w
hich
the
fig
ure
was
hal
ved
befo
re a
dditi
on.
Bor
on a
nd p
hosp
hate
, if d
eter
min
ed, a
re in
clud
ed o
nly
whe
n th
ey e
xcee
d 1.
0 pa
rt p
er m
illio
n.
The
con
cent
ratio
n of
sod
ium
was
com
pute
d by
diff
eren
ce a
nd in
clud
es th
e co
ncen
trat
ion
of p
otas
sium
plu
s an
y er
ror
of a
naly
sis.
Wel
l or
loca
tion
no.
3/6-
1Q1
1Q1 .
.....
1Q
1
6/7
-8D
1.2
...
10
QL
.
19H
1....
20B
1.....
22
Q1
.....
22
Q2
.....
24
B1
..
24F
1 _
. 2
5C
1.....
26
R1
....
28A
2III
II
28
A3
.....
28
A4
-...
28
G1 _ .
28H
1....
28
H3
"II
28H
4....
28H
5,,..
Analyzed
by
GS
GS
GS
GS
OW
S U
C
UO
C
WS
GS
CW
S C
WS
UC uo
cws
cws
cws
cws
cws
cws
cws
cws
cws
cws
cws
cws
Date
of
collection
4- 1
-52
5-19
-54
8-22
-54
5-19
-54
5-26
-47
8-27
-51
12-
9-49
5-
26-4
7 4-
1-5
2 7-
21-4
9 8-
3-4
9 9-
29-4
9 10
-15-
50
5-26
-47
2- 9
-49
7-21
-49
5-25
-49
5-25
-49
5-25
-49
5-25
-49
7-21
-49
5-25
-49
5-25
-49
5-25
-49
5-25
-49
Depth
of
well
(feet)
225
225
0)
462
305
600 92 97
650
1,89
6 23
5 42
8 50
2 99
280 94
94
483 95
92
83
46
8
Specific
conductance (micromh
os at
25°
C)
1,27
0 1,
300
1,33
0 3,
260
910
2,70
0 47
0 53
3 54
664
0 46
8 7,
500
1,10
0 43
5 54
7 61
6 37
0 55
0 47
5 42
9 68
1 49
6 42
1 37
6 57
6
8.1
7.9
7.2
7.9
8.5
7.8
8.7
7.6
7.7
9.3
7.5
8.1
7.1
8.1
7.3
7.3
7.9
8.4
7.5
8.2
8.4
Sum
of
determined con
stituents
(ppm)
772
783
1,70
0 48
7 1,
470
257
318
406
284
4,30
063
522
75
346
360
255
333
296
283
369
319
280
260
334
Con
stitu
ents
in p
arts
per
mill
ion
O S- g a 40
39
381 24 10 39
36 17
37
31 51
27
47
52
31
44
51
51
24
1 0.04 .03
.03
.19
.13
.26
.03
.12
.14
.01
.01
.01
.24
.01
.00
.01
.03
-a a
0.00
0
.07
.09
.30
.10
.15
.07
.01
.11
.14
.10
.13
.04
.03
.14
.06
.06
I
G a o 35
32
34
73
34
10
60
12
18
58
40
90 5 9.6
30
16
26
18
36
36
44
41
31
29
16
"So o>
35
30
34
190 22
5 10 5.8
8.3
31
19
70
15 2.4
10
13
13 9 16
16
30
17
16
15
11
I o CQ 236
223
211
284
112
600 30
10
1 96
36
32
1,31
5 21
0 95
81
97
35
92
39
30
47
41
35
31
94
0
O S 1
0 0 0 0 20
.7
.9 0 2 0 2 0 0 1 4 0 2 4
0
O B 3 0 ft 3 585
579
489
234
235
185
188
284
249
180
225
259
279
224
183
240
221
202
234
214
193
179
238
0 CQ 5 0.1
4.4
2.4
67
10
10
22 76
13
1,68
0 15
0 2 17
26 8 26
11
12
11
23
16 8 17
O o 2 o 3 0 147
146
160
835
112
705 55
58
58 24
20
1,05
0 14
0 17
26
64
21
37
28
20
89
32
22
20
50
0 1 6.1
9.3
20 0.8
5 16
.6
0 2.5
6.8
1.2
11 3 10
17 .6
12
14
16
1
g 0 0.23
.0
7 .2
5 .2
3
.08
7.0
3.4
S-a
3o
3? is H
H
GS
c3
tnu
232
204
224
963
175 40
190 53
79
269
178
510 74
34
11
5 93
119 82
157
155
230
171
143
133 87
Percent
sodium 69
70
67
39
58
97
24
81
73
23
28
85
84
81
60
69
39
71
35
30
31
34
35
33
70
Typ
e of
wat
er
Na-
HC
Os.
N
a-C
l. C
a-H
OO
j. N
a-H
CO
j.
Ca.
Mg-
HC
Os.
D
o.
Na-
SO4.
Na-
Cl,
HC
O3.
SO4.
N
a-H
CO
s.
Na-
HC
Os.
D
o.
Na.
Ca.
Mg-
HC
Oj.
Na-
HC
Os.
C
a,N
a,M
g-H
CO
3.
Ca.
Mg.
Na-
HO
Os.
C
a,M
g,N
a-H
CO
j. C
a.N
a-H
OO
s.
Ca,
Na,
Mg-
HC
Os.
D
o.
Na-
HC
Oa.
Oi
o g

33N
2-...
34
A1
~3
4A
2 .
..
*.
3401.
£
34
G1
-..
§
8401....
£
3SH
1....
1*
35
K1
....
01 f A
dobe
Cre
ek.*
M
ows
cws
ows
uo uo OS
OS
cws
ows
OS
OS
OS
6- 2
-47
6- 4
-49
8-21
-50
8-27
-51
8-27
-51
5-19
-54
8-22
-54
7-21
-49
5-26
-47
5-20
-54
8-22
-54
4- 1
-52
(') 410
520
230
230
K19 78 78
666
909
1,08
01,
130
1,40
01,
570
1,77
054
155
466
459
526
5
7.7
7.9
7.4
8.5
8.1
7.6
8.0
8.4
7.1
7.2
7.7
380
525
609
626
735
855
943
335
337
423
386
32 39 44 37 34 dn 44 67 58
.07
.10
.25
.1 .06
.31
.02
.24
.11
.13
.000
.01
.09
.000
65 30 31 35 60 71 94 29 46 61 50 24
28 20 18 20 40 44 52 14 24 22 24 9.2
24 136
170
170
160
181
176 70 32 39 42 15
2 0 30 25 0 0 4 6 0
249
302
260
210
260
276
287
243
242
288
276
57 20 1 16 17 15 23 14 22 20
51 128
216
255
310
362
425 34 42 47 42 13
0 1 0 i.9 20.6
16 20 9.9
1.1 .64
.63
.66
.09
282
157
150
170
320
358
448
130
214
242
224 98
16 65 71 67 52 52 46 25 26 29 25
Ca,
Mg-
HO
O!.
Na-
HC
Oj,0
1.N
a-C
l,HO
Os.
Do.
Do.
Na-
Ol. Do.
Na-
HC
Os.
Ca,
Mg-
HC
Oj.
Do.
Do.
1 Sam
ple
prob
ably
com
posi
te o
f sam
ples
from
two
wel
ls, 1
00 a
nd 1
25 fe
et d
eep,
loc
ated
3 fe
et a
part
.2 I
nclu
des
1.4
ppm
pho
spha
te (
POO
.*
Rep
orte
d de
pth
250-
350
feet
.«S
ampl
ing
poin
t 15
feet
wes
t of w
ell 5
/7-3
5K1.

266 GROUND WATER IN SANTA ROSA AND PETALUMA VALLEYS
TABLE 26. Partial chemical analyses of water from wells in the Petaluma Valleyarea, California
[Analysed by or under the supervision of A. A. Qarrett. Dissolved solids may be estimated from specificconductance by use of figure 18]
Well or location no.
3/5- 6C1. _______________ ...........7A1____.__.__.._....__.. .............
3/6- 1Q1.....................................3C1.._.. .__..-.....--. -_ _..__-_4C1_._._. __..._._.._._-. .............
» 5A1.. ......................... ..........» 6A1........................... ..........IIBI.-...-.....-....... ...............12E1 ....... ............ ...............
4/6-21Q1..................... ................27N1....................... ...........27R1. 27R1.......................... ...........33R1............... ......................36J1......... ............... . ..........
4/7- 2D1 . . .4D1___.._ _ ..
13D1.. __ . _ .. .. . ____ . ____ ...5/6-30D1.. ....-...-...... .-.........5/7- 7R2 . . ..
10Q1- .. ..20O1....... -..-..-...-.. . . ......25A1... ..................................29L1..... ...................... .......30Q1................... ............
5/8-11N1........ -............. ...........24J1......... ..-.....-..-...-..-.......25E1... .... .. ... .- ...
Date of collec tion
2-17-50 1-25-50 1-25-50 2-17-50 4- 5-51
12- 1-49 12- Inl9 1-25-50 4- 6-51 2-17-50 2-17-50 2-17-50 4-10-51 2-17-50 2-17-50 1-27-50 2- 7-50 4- 4-51 4- 5-51 3- 1-50 2-15-50 8- 9-50 4- 5-51 2-9-50 2- 9-50 2-15-50 2- 9-50 2-14-50
Depth(feet)
50 435 225
(') 164 83
250 200+ 464 222 736
175+ 165 62 70
(') 155 198 462 688 265 65
119 271 98
128
Specific conduct
ance (micro- mhos at
25°C)
1,600 2,350 1,290 1,430 3,410 9,590 9,600 2,090 1,210 1,490
699 819 838
5,460 1,080
10,800 227
1,470 717 578
2,760 988
1,250 960 554 974 476 656
Parts per million
Chloride (01)
328 364 143 255 912
3,560 3,390
400 137 259 101 91
105 1,590
132 3,270
7.8 105 31 54
735 202 135 100 55
130 59 92
Hardness as CaCOs
395 425 180 310 910
1,600 1,550
280 155 155 90
220 205
1,900 350
1,100 75
205 10 15 45
314 320 320 175 125 140 185
1 Shallow dug well.2 Sample taken at start of pumping.3 Sample taken 10-15 minutes after pumping began.4 Drilled well inside dug well. Dug well 10 feet deep; drilled well reported t obe more than 50 feet deep.
TABLE 27. Drillers' logs of water wells in the Petaluma Valley area, California
Thick ness (feet)
Depth (feet)
Thick ness (feet)
Depth (feet)
Well 3/6-4C1. Columbia Broadcasting System, Radio Station KCBS
[ Drilled by Petaluma Pump and Well Co. at sea level. On reclaimed tidal marsh. Casing not perforated;open end]
Younger alluvium:3
6914
379
86
Younger alluvium Continued74
4
160
164
Well 3/7-13D5. J.H.Rose[Drilled by A. Oberto. Altitude, 39 feet. On alluvial plain. Casing perforated between depths of 35
and 55 feet. Bailer test: static level, 17 feet; bailing level, 30 feet at 400 gallons per hour]
Younger alluvium: Soil 1
222
123
Younger alluvium Continued2442
495355
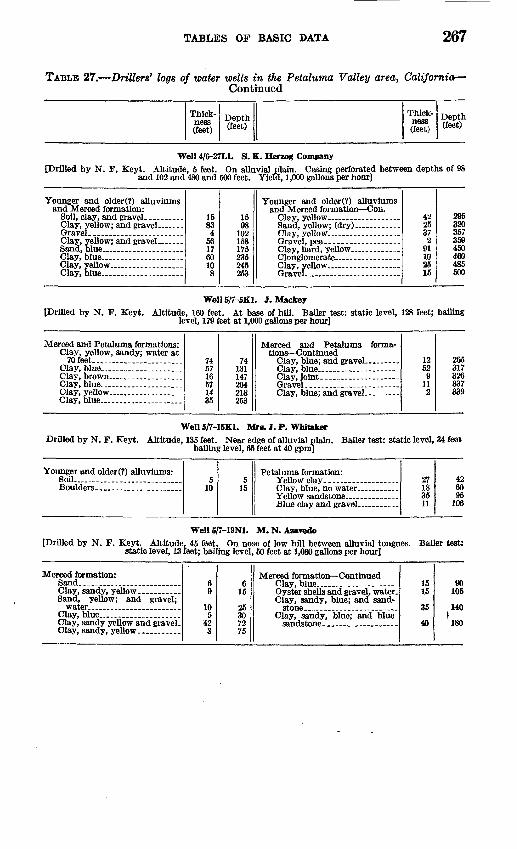
TABLES OF BASIC DATA 267
TABLE 27. Drillers' logs of water wells in the Petaluma Valley area, California- Continued
Thick ness (feet)
Depth(feet)
Thick- ness(feet)
Depth (feet)
Well 4/6-27L1. S. K. Herzog Company[Drilled by N. F. Keyt. Altitude, 5 feet. On alluvial plain. Casing perforated between depths of 98
and 102 and 480 and 500 feet. Yield, 1,000 gallons per hour]
Younger and older(?) alluviums and Merced formation:
Gravel--- ______ . ...
Sand, blue ___________Clay, blue. __________Clay, yellow ...................
15834
561760108
1598
102158175235245253
Younger and older(?) alluviums and Merced formation Con.
422537
291102515
295320357359450460485500
Well 5/7-5K1. J. Mackey[Drilled by N. F. Keyt. Altitude, 160 feet. At base of hill. Bailer test: static level, 128 feet; bailing
level, 179 feet at 1,000 gallons per hour]
Merced and Petaluma formations: Clay, yellow, sandy; water at
70 feet _.___._____
Clay, blue ___________
Clay, blue ___________
745716571435
74131147204218253
Merced and Petaluma forma tions Continued
1252
9112
265317326337339
Well 5/7-15K1. Mrs. J. P. WhitakerDrilled by N. F. Keyt. Altitude, 135 feet. Near edge of alluvial plain. Bailer test: static level, 34 fee*
bailing level, 65 feet at 40 gpm]
Younger and older(?) alluviums: Soil .. . . 5
105
15
Petaluma formation:27183511
426095
106
Well S/7-19N1. M. N. Azaredo[Drilled by N. F. Keyt. Altitude, 45 feet. On nose of low hill between alluvial tongues. Bailer test:
static level, 13 feet; bailing level, 50 feet at 1,080 gallons per hour]
Merced formation: Sand _______________
Sand, yellow; and gravel; water... .....................
Clay, blue .....................Clay, sandy yellow and gravel.
69
105
423
615
25307275
Merced formation Continued
Clay, sandy, blue; and sand-
1515
35
40
90105
140\
180

268 GROUND WATER IN SANTA ROSA AND PETALUMA VALLEYS
TABLE 27. Drillers' logs of water wells in the Petaluma Valley area, California-Continued
Thickness(feet)
Depth(feet)
Thickness(feet)
Depth(feet)
WeI15/7-20Cl. E.Scott
.[Drilled by N. P. Keyt. Altitude, 35 feet. On alluvial plain. Gravel-packed well. Pumping test: drawdown. 140 feet after 108 hours pumping at 650 gpm]
Younger and older (?) alluviums: Clay--.-.-.. ..............
Clay _ .......................
Rock (probably cemented
Rock (probably cemented
204630
106GO
205
73355
20
2066Qfi
202
290310
322355
430
Merced formation Continued
Shelf.
Shelf (probably cemented sand)
FFGG orr&vGlSand and shelf (probably ce-
571
735103720
2374
89
13
435506513548558595615617654658
666675688
Well 5/7-25A1. George Myles
[Drilled by N. P. Keyt. Altitude, 120 feet. On eolluvial slope. Bailer test: static level, 128 feet; bailing level, 140 feet at 200 gallons per hour]
136 9 4
33
136 145 149 182
23 5
31 24
205 210 241 265
Well S/7-25C1. R. Sartori (California Water Service Co., well 2)
[Drilled by H. Nutting. Altitude, 125 feet. At edge of alluvial plain]
Older alluvium: Soil.. ...... ...............Clay, yellow.. _________Boulders with water..
4 21 10
4 25 35
Petaluma formation:30 10
125 25 10
65 75
200 225 235
Well 5/7-26R1. California Water Service Co.
[Drilled by C. H. Chamberlain. Altitude, 53.6 feet. On alluvial plain. Casing perforated between depths of 140 and of 240, 300 and 390, and 440 and 500 feet. Gravel-packed. Cement plug set at 428 feet]
Younger and older alluviums: Clay, adobe, yellow __ . ___Sandy, coarse, and gravel __ Clay, gray, sandy _______
Clay, yellow, sandy; and wood. Clay, yellow, sandy ______Clay, gray, sandy .............Wood _________ . ........
Merced(?) formation: Clay, rusty, sandy _______Clay, gray, sandy _______Bentonite ___________Shale, gray, sandy .............Clay gray
20 55 35 10 40 20 20 10
10 10 10 30 10
20 75
110 120 160 180 200 210
220 230 240 270 280
Merced (?) formation Con.
Clay, gray, and hard gray rock.
Petaluma (?) formation:
Franciscan group:
20 15
125 10 20
2040 70 80
120
35
300 315 440 450 470
490 530 600 680 800
835

TABLES OF BASIC DATA 269
TABLE 27. Drillers' logs of water wells in the Petaluma Valley area, California Continued
Thickness(feet)
Depth(feet)
Thick-ness(feet)
Depth(feet)
Well 5/7W-28A3. California Water Service Co.
[Drilled by Trojan Engineering Corp. Altitude. 35 feet. On alluvial plain. Casing perforated between depths of 78 and 90 and 220 and 260 feet]
Younger and older alluviums:7
685
1035
2338
77580
90125
148186
Merced formation Continued34837
12120
220228231238
239260280
Well 5/7-28H1. California Water Service Co.
[Drilled by N. F. Keyt. Altitude, 35 feet. On alluvial plain. Casing perforated between depths of 154and 315 and 323 and 483 feet]
Younger and older alluviums:
Yellow sand and fine gravel...
73821945
283
39
74566757984
112115 154
Merced formation (?):276924
18623
181250274460483
Well 5/7-28H5. California Water Service Co.
[ Drilled by Trojan Engineering Corp. Altitude, 35 feet. On alluvial plain. Casing perforated between depths of 198 and 225, 264 and 286, and 300 and 397 feet]
Younger and older alluviums:
Merced formation:
612
750
317356810
54
535
511
163
14
6182575
7895
130198208213217220
225260265
277283286300
Merced formation Continued
terial is probably couglom-
41321
1513
210
255
26262
27
33
304317319320335348350360
385390
392398400406dflR435
468

270 GROUND WATER IN SANTA ROSA AND PETALUMA VALLEYS
TABLE 27. Drillers' logs of wells in the Petaluma Valley area, California Con.
Thickness(feet)
Depth(feet)
Thickness(feet)
Depth(feet)
Well 5/7-32R1. Petaluma High School
[Drilled by N. F. Keyt. Altitude, 60 feet. On hillside. Bailer test: static level, 24 feet; bailing level,116 feet at 110 gpm]
Sonoma volcanics:
Rock, decomposed, yellow __
278274
280
107111
Franciscan group:197017
130200217
Well 5/7-33M1. Lace House Laundry
[Drilled by A. J. Oberto. Altitude, 30 feet. Near foot of hill. BaDer test: bailing level 40 feet at 25 gpm]
Merced formation: No record .....................
Clay, blue ___________
21??
40
21215090
Sonoma volcanics:42 132
Well 5/7-33Q1. City of Petaluma
[Drilled by A. J. Oberto. Altitude, 25 feet. On alluvial plain. Casing perforated between depths of 30 and 40,70 and 120,130 and 145, and 160 and 205 feet. Pumping test: pumping level, 140 feet at 55 gpm]
Younger alluvium:30
5on
6010
OA3565
125135
Franciscan group:10555
105
1020
145150155160170175185205
Well 5/7-35H1. California Water Service Co.
[Drilled by N. F. Keyt. Altitude, 35 feet. On alluvial plain. Casing perforated betweeu depths of 180 and 290 and 440 and 512 feet. Gravel packed]
Younger and older (?) alluviums:
bottomed in yellow clay __
Clay, blue __ . ________
Clay, blue ___________
5
10 155
51020
101020
10401010
5
15 3035
405070
80oft
110
120160170180
Merced fonnation(?) :
Gravel, small; shell fossils. .
Clay, blue; some very small
Petaluma formation:
1010
1080
150
2020
725
17112
190200
210290440
460480487512
529540542
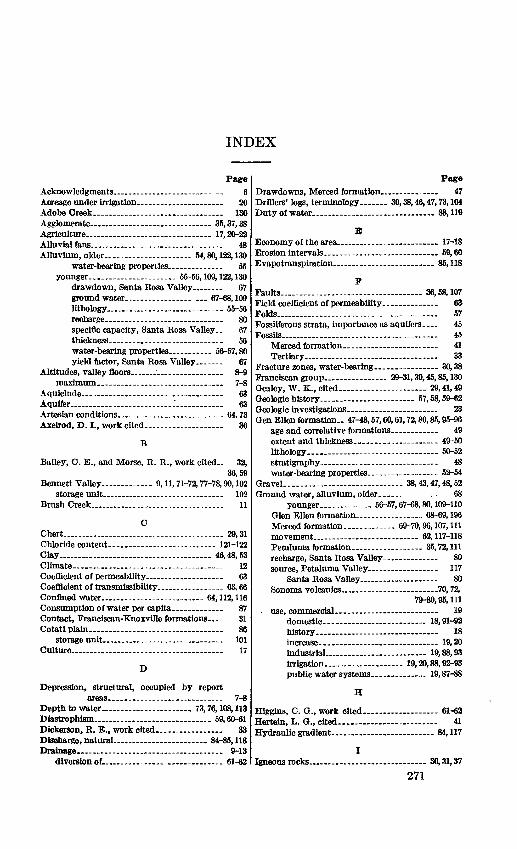
INDEX
PageAcknowledgments_____________ 6 Acreage under irrigation.. -, . 20 Adobe Creek__________________ 130 Agglomerate 35,37,38 Agriculture ....__... __.. .. 17,20-22Alluvial fans._.___........__.......... 48Alluvium, older_................... 64,80,122,130
water-bearing properties. ____ __ 55 younger....... ............ 55-56,109,122,130
drawdown, Santa Rosa Valley....__ 67ground water_________ _ 67-68,109 lithotogy ........__ ..... . 55-56recharge . 80 specific capacity, Santa Rosa Valley.. 67 thickness...............__ __. 56water-bearing properties... ... 56-57,80yield factor, Santa Rosa Valley___ 67
Altitudes, valley floors___._____. __ 8-9msuetmnm , _____. __________ 7-8
Aquiclude_ ___________ _______ 63 Aquifer______.________."____._ 63 Artesian conditions ______._____ 64,73 Axelrod, D. I., work cited.______. ___ 36
Bailey, C. E., and Morse, R. R., work cited.. 32,36,59
Bennett Valley. 9,11,71-72,77-78,90,102storage unit... ...____.__..__ 102
Brush Creek....._....................__ 11
Chert 29,31Chloride content___. ..-... ........ 121-122Clay. . .... .............. ... 46,48,53Climate________......___._. .. 12Coefficient of permeability.______ ___ 63 Coefficient of transmissibility.__ _ ____ 63,66 Confined water . -.. .-__...... 64,112,116Consumption of water per capita.___ ... 87 Contact, Franciscan-Knoxville formations.... 31Cotati plain_____.. .... .._........ 86
storage unit ......_______.. .. 101Culture-___........___....__........ 17
D
Depression, structural, occupied by report.............. . .. 7-8
Depth to water_________. __ 73,76,108,113 Diastrophism________________ 59,60-61 Dickerson, R. E., work cited... .. _.... 33 Discharge, natural..._ .__ 84-85,118 Drainage _. _ .. .. 9-13
diversion of ____ - __. _______ 61-62
PageDrawdowns, Merced formation.. . 47 Drillers' logs, terminology.. ... 30,38,46,47,73,104 Duty of water___.________ 88,119
EEconomy of the area____ 17-18 Erosion intervals- . .. 59,60 Evapotranspiration 85,118
F Faults.. . 36,58,107Field coefficient of permeability 63 Folds... . 57Fossilferous strata, importance as aquifers..-- 45Fossils ..__ 45
Merced formation 41Tertiary __.._ .... ......... 33
Fracture zones, water-bearing 30,38 Franciscan group_________ 29-31,39,45,85,130 Gealey, W. K., cited.. 29,41,49Geologic history . ...... . 57,58,59-62Geologic investigations 23Gen Ellen formation.. 47-48,57,60,61,72,80,85,95-96
age and correlative formations 49extent and thickness..-.- ... 49-50lithotogy..-.. 50-52stratigraphy . - 48water-bearing properties 52-54
Gravel 38,43,47,48,52Ground water, alluvium, older. 68
younger 56-57,67-68,80,109-110Glen Ellen formation_....... 68-69,1%Merced formation__-___. 69-70,96,107, 111 movement_________-_ 62,117-118 Petaluma formation .... 35,72,111recharge, Santa Rosa Valley 80source, Petaluma Valley 117
Santa Rosa Valley.. - - 80Sonoma volcanics 70,72,
79-80,95,111use, commercial 19
domestic______ - 18,91-92 history . 18increase__....... . 19,20industrial 19,88,93irrigation 19,20,88,92-93 public water systems 19,87-88
H
Higgins, C. G., work cited . 61-62 Hertein, L. G., cited__ - 41 Hydraulic gradient . 84,117
Igneous rocks.. ......... .... ..... 30,31,37
271
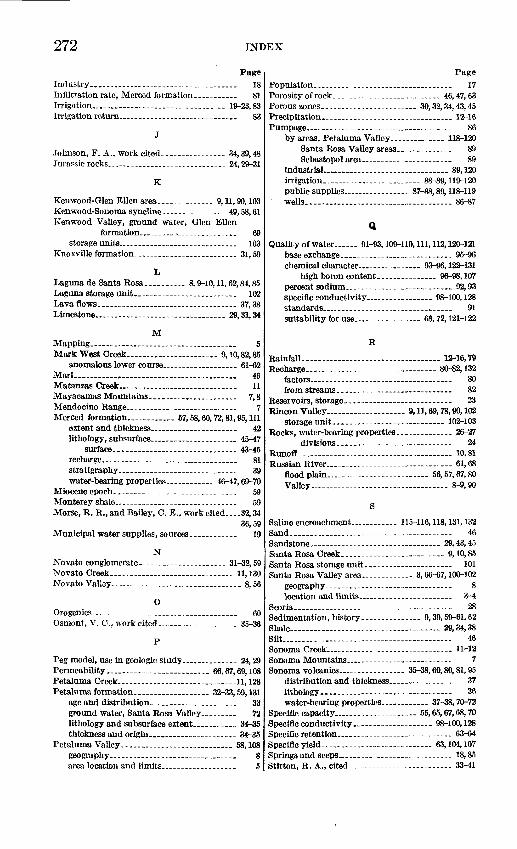
272 INDEX
Page Industry.__..._____.....______ 18Infiltration rate, Merced formation..__.__ 81 Irrigation...._. __... _ 19-23,83 Irrigation return ...___.________ 83
Johnson, F. A., work cited.__.____ 34,39,48 Jurassic rocks_-..._____......___ 24,29-31
Kenwood-Glen Ellen area....--__-... 9,11,90,103Kenwood-Sonoma syncline..-._____. 49,58,61 Kenwood Valley, ground water, Glen Ellen
formation___. ,________ 69 storage units ......_________ 103
Knoxville formation_. ____________ 31,59
LLaguna de Santa Eosa._._.. 8,9-10,11,62,84,85 Laguna storage unit...____________ 102 Lava flows___________________ 37,38 Limestone . . _....._ 29,31,34
MMapping. ....._______._______ 5Mark West Creek_.___.__....__ 9,10,82,85
anomalous lower course_. __. ____ 61-62Marl . . ...______________ 46Matanzas Creek..__.____________ 11Mayacamas Mountains____________ 7,8Mendocino Range_____ ___. __. __ 7Merced formation...._.__ 57,58,60,72,81,95,111
extent and thickness___________ 42lithology, subsurface___________ 45-47
surface..._____-_____.___ 43-45recharge__________._______ 81stratigraphy...-.----._..____.__ 39water-bearing properties______ 46-47,69-70
Miocene epoch-..._____ __._____ 59Monterey shale. ___-____.___ 59Morse, R. R., and Bailey, C. E., work cited.--.32,34
36,59 Municipal water supplies, so urces ___ _... 19
NNovato conglomerate.--_______- 31-32,59 Novato Creek__...______________ 11,130 Novato Valley--_____.___________ 8,56
OOrogenies....._________________ 60 Osmont, V. C., work cited..__-____-__ 35-36
Peg model, use in geologic study_______ 24,29 Permeability.._........__.__... 66,67,69,108Petaluma Creek.__.....__..____......11,128Petaluma formation__________ 32-33,59,131
age and distribution_______. ___ 33 ground water, Santa Rosa Valley__. __ 72 lithology and subsurface extent...... . __ 34-35thickness and origin..._.________ 34-35
Petaluma Valley.- . ................... 58,108geography_ .____._________ 8 area location and limits__._....___ 5
PagePopulation..--..--. .... ______._... 17 Porosity of rock.....___________ 46,47,63 Porous zones............._........ 30,32,34,43,45Precipitation__________________ 12-16 Pumpage.._________________.- 86
, Petaluma Valley . .. .... 118-120Santa Rosa Valley areas.. . . 89
industrial_____........_.....___ 89,120irrigation_.-....-.-.....__.... 88-89,119-120public supplies. ...--_. 87-88,89,118-119 wells.....__._.....- .... .....- 86-87
Quality of water...... 91-93,109-110, 111, 112,120-121base exchange-_ _ 95-96 chemical character .--...... 93-96,122-131
high boron content-.-------- - 96-98,107percent sodium_____... _______ 92,93 specific conductivity- .......... _.. 98-100,128standards__..--.---.-......____ 91suitability for use 68,72,121-122
R
Rainfall 12-16,79Recharge 80-82,132
factors 80from streams .. 82
Reservoirs, storage... 23Rincon Valley -- 9,11,69,78,90,102
storage unit..---------------- - 102-103Rocks, water-bearing properties.... 26-27
divisions..... . 24Runoff________________-_____ 10,81 Russian River 61,68
flood plain 56,57,67,80Valley 8-9,90
S
Saline encroachment -- 115-116,118,131,132 Sand. _ 46Sandstone__________________ 29,43,45 Santa Rosa Creek _- ... 9,10,85 Santa Rosa storage unit. - 101 Santa Rosa Valley area.------- --- 3,66-67,100-102
geography 8location and limits 3-4
Scoria 28Sedimentation, history 9,39,59-61,62Shale 29,34,38Silt. -- - 46Sonoma Creek ........ ..-. 11-12Sonoma Mountains - 7 Sonoma volcanics ...... 35-38,60,80,81,95
distribution and thickness 37 lithology - . - 36water-bearing properties_._ 37-38,70-72
Specific capacity__-_..-. 55,65,67,68,70 Specific conductivity __ 98-100,128Specific retention_ __ -____ _ 63-64 Specific yield- 63,104,107Springs and seeps...... 18,85Stirton, R. A.,, cited 33-41

INDEX 273
Storage capacity. _._. 100-103,130-131 estimated ...__. . . 106-107 estimation of __. ___ ..._ 103-105 units, Petaluma Valley- - .. 131
Santa Rosa Valley area. 101-103 usability..-_ __. 10&-107
Stratigraphic sections 34,50,51,52
TTaliaferro, N. L., cited_..__.. . 30 Terrace(s)........_ _.__ _ 38,54Terrace deposits, Santa Rosa Valley..--.- 61,68 Tidal stages _ . 114Tolay fault...._ ___ 58Tolay volcanics of Morse and Bailey.....__ 32,60Transmissibility..-. ....___________ 46,66Tuff.. 38
VVegetation...... - . .. 81,85,121Volcanic rocks___ ...___.______ 36,37-38
permeability contrasts.-__________ 71Volcanic sediments______ ______ 35,37,38Volcanism_____________ __.___ 36,60
WWashoe anticline________._______ 35,57 Water body, Novato Valley.--._-__------ 116
principal, Petaluma Valley____..__ 122 Santa Rosa Valley. -- 72-79
Page
Water bodies, minor, Petaluma Valley. 116Water levels, contours.- 84,86,117
decline..__ - "*fluctuations.. ... . 73,74,80,
Water-bearing properties of rocks, Jurassic andCretaceous.._._________ 30-31'
Petaluma formation _ 35seasonal_ ___ 74,75-78,114long-term... _...... 74,78-79,114-116
Water table___.__ ...___... 64Weaver, C. E., work cited___________ 32,54Wells, depth, Petaluma Valley_- . ... 108
development methods__... 46-47,108drilled .-. - 18dug. .. _ . . 18failure of________________ - __ 46 irrigation._........_____ . 19-20,56location numbers. . .- -- 6-7 Petaluma Valley.. 108,120,131yield, factors in..--- . 64
Merced formation____ . 47 Petaluma Valley__. ___ _ 132 younger alluvium....__ 66,67
Windsor-Fulton storage unit._. ----- 53,103Windsor syncline__ -_________-___ 49,57
Yield factor .. ..-_. 65,66,68-69
o