Gendered pathways into the post-secondary study of science · table 2) and disappears at the later...
34
Gendered pathways into the post-secondary study of science Joanna Sikora AUSTRALIAN NATIONAL UNIVERSITY NCVER Building Researcher Capacity Fellowship Program 2012 participant NATIONAL VOCATIONAL EDUCATION AND TRAINING RESEARCH PROGRAM OCCASIONAL PAPER
Transcript of Gendered pathways into the post-secondary study of science · table 2) and disappears at the later...
Gendered pathways into the post-secondary study of science
Joanna Sikora
AUSTRALIAN NATIONAL UNIVERSITY
NCVER Building Researcher Capacity Fellowship Program 2012 participant
NATIONAL VOCATIONAL EDUCATION AND TRAINING RESEARCH PROGRAM
OCCASIONAL PAPER

Gendered pathways into the post-secondary study of science
Joanna Sikora Australian National University
Participant in the NCVER Building Research Capacity Fellowship Program 2012
NATIONAL VOCATIONAL EDUCATION AND TRAINING RESEARCH PROGRAM
OCCASIONAL PAPER
The views and opinions expressed in this document are those of the author/
project team and do not necessarily reflect the views of the Australian Government,
state and territory governments or NCVER.
Any interpretation of data is the responsibility of the author/project team.

As part of the National Centre for Vocational Education Research (NCVER) Building Researcher
Capacity Scheme, a fellowship program has been created to encourage researchers to use NCVER
datasets to improve our understanding of tertiary education. The fellowships also provide
participants with an opportunity to have their research peer-reviewed and published by NCVER.
For more information see:
<http://www.ncver.edu.au/wps/poc?urile=wcm:path:/wps/wcm/connect/NCVER_Content/NCVER/
Research/Funding+rounds_Opportunities+for+researchers/funding-opportunities>.
© Commonwealth of Australia, 2014
With the exception of the Commonwealth Coat of Arms, the Department’s logo, any material protected
by a trade mark and where otherwise noted all material presented in this document is provided under a
Creative Commons Attribution 3.0 Australia <http://creativecommons.org/licenses/by/3.0/au> licence.
The details of the relevant licence conditions are available on the Creative Commons website
(accessible using the links provided) as is the full legal code for the CC BY 3.0 AU licence
<http://creativecommons.org/licenses/by/3.0/legalcode>.
The Creative Commons licence conditions do not apply to all logos, graphic design, artwork and
photographs. Requests and enquiries concerning other reproduction and rights should be directed to the
National Centre for Vocational Education Research.
This document should be attributed as Sikora, J 2014, Gendered pathways into the post-secondary study
of science, NCVER, Adelaide.
ISBN 978 1 922056 81 8
TD/TNC 115.08
Published by NCVER, ABN 87 007 967 311
Level 11, 33 King William Street, Adelaide SA 5000
PO Box 8288 Station Arcade, Adelaide SA 5000, Australia
P +61 8 8230 8400 F +61 8 8212 3436 E [email protected] W <www.ncver.edu.au>
About the research Gendered pathways into the post-secondary study of science
Joanna Sikora, Australian National University
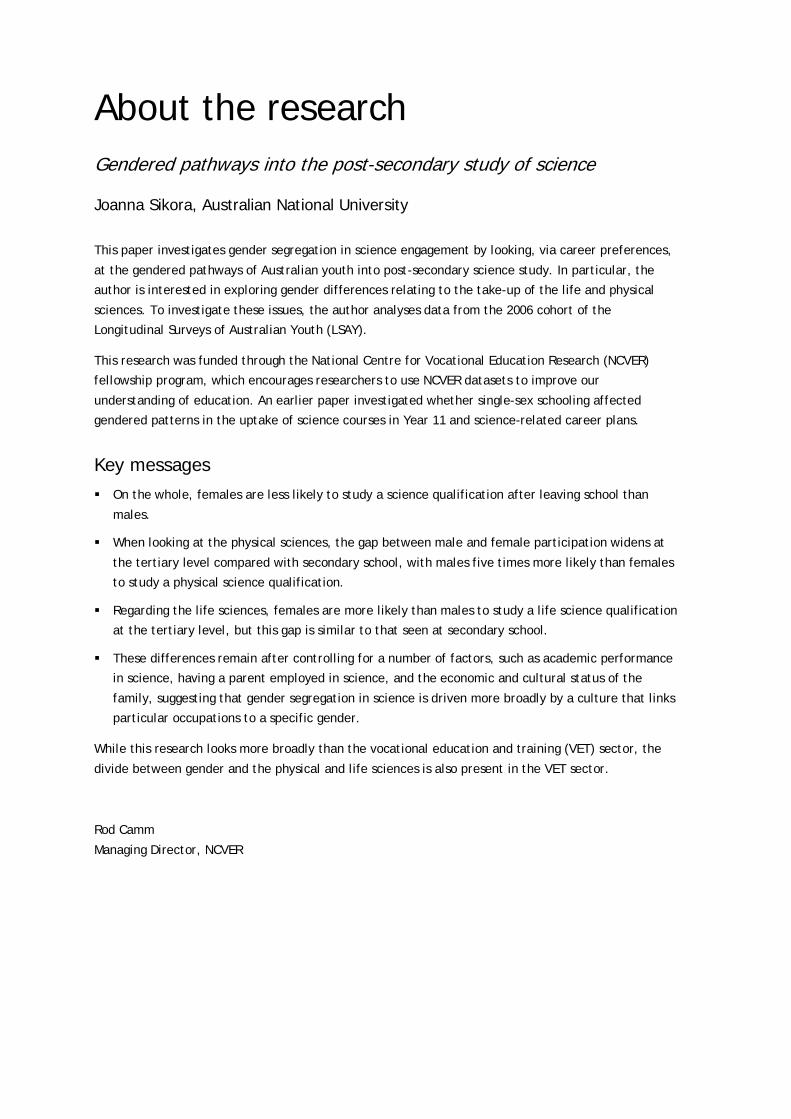
This paper investigates gender segregation in science engagement by looking, via career preferences,
at the gendered pathways of Australian youth into post-secondary science study. In particular, the
author is interested in exploring gender differences relating to the take-up of the life and physical
sciences. To investigate these issues, the author analyses data from the 2006 cohort of the
Longitudinal Surveys of Australian Youth (LSAY).
This research was funded through the National Centre for Vocational Education Research (NCVER)
fellowship program, which encourages researchers to use NCVER datasets to improve our
understanding of education. An earlier paper investigated whether single-sex schooling affected
gendered patterns in the uptake of science courses in Year 11 and science-related career plans.
Key messages On the whole, females are less likely to study a science qualification after leaving school than
males.
When looking at the physical sciences, the gap between male and female participation widens at
the tertiary level compared with secondary school, with males five times more likely than females
to study a physical science qualification.
Regarding the life sciences, females are more likely than males to study a life science qualification
at the tertiary level, but this gap is similar to that seen at secondary school.
These differences remain after controlling for a number of factors, such as academic performance
in science, having a parent employed in science, and the economic and cultural status of the
family, suggesting that gender segregation in science is driven more broadly by a culture that links
particular occupations to a specific gender.
While this research looks more broadly than the vocational education and training (VET) sector, the
divide between gender and the physical and life sciences is also present in the VET sector.
Rod Camm
Managing Director, NCVER

NCVER 5
Contents Tables and figures 6
Introduction 7 Why is gender segregation in science important? 7 ‘Leaky pipeline’ or ‘bi-directional flows’? 8
Data, methods and measurement 10 Data and methods 10 Measurement 11 Analysis design 12
Results 13
Conclusions 21
References 22
Appendices 24 A: Details of methodology and measurement 24 B: Coding of occupations, subjects and fields of study 27
Building researcher capacity initiative 30
6 Gendered pathways into the post-secondary study of science
Tables and figures Tables 1 Year-level composition of the Y06 cohort: 2006 to 2009 11
2 Study of science, life science and physical science in Year 12:
coefficients from two-level random intercept models 17
3 Study of science, life science and physical science at tertiary level:
coefficients from two-level random intercept models 19
A1 Summary of imputations performed on independent variables 24
Figures 1 Conceptual model of multivariate analyses 12
2 Science-related career expectations and Year 12 subjects by gender:
1999—2009 14
3 Enrolment in science-related tertiary qualifications by gender 15
NCVER 7
Introduction While concerns about declining interest in science education and employment often appear in
educational literature (Ainley & Ainley 2011; Anlezark et al. 2008), less attention is usually devoted to
the gender segregation of science engagement.1 To shed more light on this issue, this paper explores
gendered patterns in the uptake of science school subjects and in adolescent career preferences.
Such gendered patterns may have serious consequences, because strong concentrations of men and
women in particular niches of science can adversely affect not only optimal talent utilisation but also
human creativity and productivity. Moreover, if science participation continues to be differentiated
by gender, young people who value gender egalitarianism may turn away from prospective science
careers. Therefore, an examination of why young men and women choose different fields of science is
important for achieving a better understanding of the trends in overall science participation.
Arguably, the last two decades have seen more interest among policy-makers and social scientists in
the horizontal (that is, field-related) segregation by gender that affects the education and labour
market choices made by young people (Barone 2011; Charles & Bradley 2009; Gerber & Cheung 2008).
Recent comparative and country-specific literature reports that women are concentrated in biology,
medicine, environmental studies and similar fields, while men continue to dominate the mathematical
and physical sciences as well as computing and engineering (Gerber & Cheung 2008; Hill, Corbett &
Rose 2010; OECD 2006; Xie & Shauman 2003). This has also been the case in Australia, where Fullarton
and Ainley (2000) singled out gender as the strongest predictor of science subject choices among
Year 12 students.
Why is gender segregation in science important?
In Australia, as in other Western developed countries, horizontal segregation by gender within science
is rarely highlighted as a key concern for educational policy, which is often more interested in
students’ socioeconomic status and its impact on educational outcomes, as well as gender differences
in access to education and in educational attainment (Bell 2008). Far from being construed as a
problem, the field-of-study choices of men and women are mostly seen as the execution of equal but
different individual tastes and preferences (Charles & Bradley 2009).
What motivates this perception is the apparent growth in parity between girls and boys in science
performance across countries (Bell 2008; OECD 2006, 2007b). Other reasons include the widespread
appeal of modernisation arguments, which posit that, since discrimination is economically inefficient,
the demand for human creativity in knowledge economies is bound to eradicate any lingering
remnants of gender inequalities (Jackson 1998).
In stark contrast to these views, recent cross-national research delivers ample evidence that
segregative trends are not only persistent but are also becoming stronger in advanced post-industrial
societies such as Australia (Charles & Bradley 2009; Sikora & Pokropek 2012a), where democratic
traditions foster progressive equity policies and related educational cultures. Such cultures are
founded on celebrating students’ autonomy of choice and the stimulation of personal interests. The
comprehensive education systems and labour markets with large service sectors typical of advanced
1 In this paper ‘science engagement’ denotes voluntary participation in science courses and commitment to science
careers.
8 Gendered pathways into the post-secondary study of science
industrialised economies enable young men and women to pursue gender-stereotyped vocational goals
without the burden of tangible material disincentives (Charles & Bradley 2009). In fact, international
literature suggests that most young people in advanced industrialised countries ‘indulge their
gendered selves’ (Charles & Bradley 2009) in their educational and vocational choices.
However, most empirical studies supporting these conjectures rely on cross-sectional data. Therefore,
it is actually not clear whether these patterns of apparent gender segregation in Organisation for
Economic Co-operation and Development (OECD) countries obscure more complex individual pathways
through subsequent stages of education. In other words, if we know that 30% of adolescent girls are
interested in science occupations and later that 30% of girls study science in Year 12, are these the
same girls? And what are the corresponding patterns for boys?
‘Leaky pipeline’ or ‘bi-directional flows’?
To understand the processes that might sustain gender segregation in science education it is necessary
to consider the educational trajectories of individual students. The examination of educational
transitions has to be thus integrated with the study of segregation patterns. The Longitudinal Surveys
of Australian Youth (LSAY) 2006 cohort (Y06), which began with the OECD’s Programme for
International Student Assessment (PISA) 2006 and focused on science, is particularly well suited for
this purpose.
The existing research on educational transitions in science falls within two broad traditions. The first
is known under the label of ‘leaky pipeline’ (Xie & Shauman 2003). It suggests that in comprehensive
education systems, such as that in Australia, students are able to and frequently do opt out of science
subjects in upper secondary school. This prevents their re-entry into science education, even if they
develop a relevant vocational interest at a later stage. To the extent to which science education ‘leaks’
girls more than boys or vice versa, leaky pipeline processes can have strongly gendered contours.
The ‘bi-directional flows’ argument stands in opposition to the ‘leaky pipeline’ hypothesis and
proposes that students of both genders enter and exit science education at different stages more
often than is usually recognised and appreciated (Xie & Shauman 2003).The key focus of both
arguments is on the moves of students in and out of science but without paying attention to the fields
in which students of each sex concentrate. In contrast, this paper considers the ‘leaky pipeline’ and
‘bi-directional flows’ arguments as they apply to the transitions of boys and girls in and out of the life
and physical sciences. If the ‘bi-directional flows’ pattern prevails among recent cohorts of young
Australians, horizontal segregation by gender in science cannot be construed as a serious problem
with the potential to curb the long-term opportunities of young men and women. However, if the
‘leaky pipeline’ pattern prevails, early segregation by gender within science should be seen as having
serious consequences for both young men and women. Thus gendered patterns in such potential leaks
and their impact on subsequent field-of-science choices are the key interests of this analysis.
More precisely the paper addresses the following research questions:
Are the science-related occupational expectations of students segregated more by gender than
science course participation at upper-secondary and tertiary levels?
Are factors that foster engagement with science in general also conducive to gender segregation in
science participation?
NCVER 9
What is the role of parental cultural capital, understood as the impact of factors associated with
parental employment in science-related occupations, in facilitating the science participation of
young people as well as its segregation by gender?
To what extent are the concepts of ‘leaky pipeline’ and ‘bi-directional flows’ useful for the
understanding of gender segregation in Australian science education?

10 Gendered pathways into the post-secondary study of science
Data, methods and measurement Data and methods
The LSAY surveys follow several cohorts of adolescents until they are about 25 years of age, collecting
rich data on their attitudes as well as their educational and work experiences. Since the launch of the
Programme for International Student Assessment in 2000, subsequent LSAY cohorts have become
longitudinal extensions of Australian PISA samples.
This paper is based on the Y06 surveys, which commenced with the Australian PISA 2006 survey
devoted to the science literacy of 15-year-old students across the OECD (OECD 2007b). Over 10 000
students who participated in PISA 2006 were included in Y06 and were contacted in 2007, 2008, 2009,
2010 and 2011 to provide information on their educational and work history (NCVER 2012). These
annual surveys are referred to as the Y06 waves. PISA 2006 was conducted in Australia on a two-stage
stratified representative sample of students generated by sampling first schools and then students
within schools. Schools were stratified by sector and state or territory. To obtain correct estimates of
interest in this study, hierarchical models which account for the stratified nature of the original
sample have been used. Full details of the methodology employed have been provided in appendix A.
Because PISA samples are based on age rather than year level, any analysis that uses information on
subject uptake among students must pool data from different Y06 waves. This poses challenges
related to the appropriate weighting. The details of the weighting applied in this paper are in
appendix A and in principle they follow the recommendations of Lim (2011) to include sector and
state, and information about Aboriginal students as control variables in all multivariate models. PISA
student weights and the OECD-recommended treatment of plausible values have also been applied in
all analyses reported in this paper, as per appendix A.
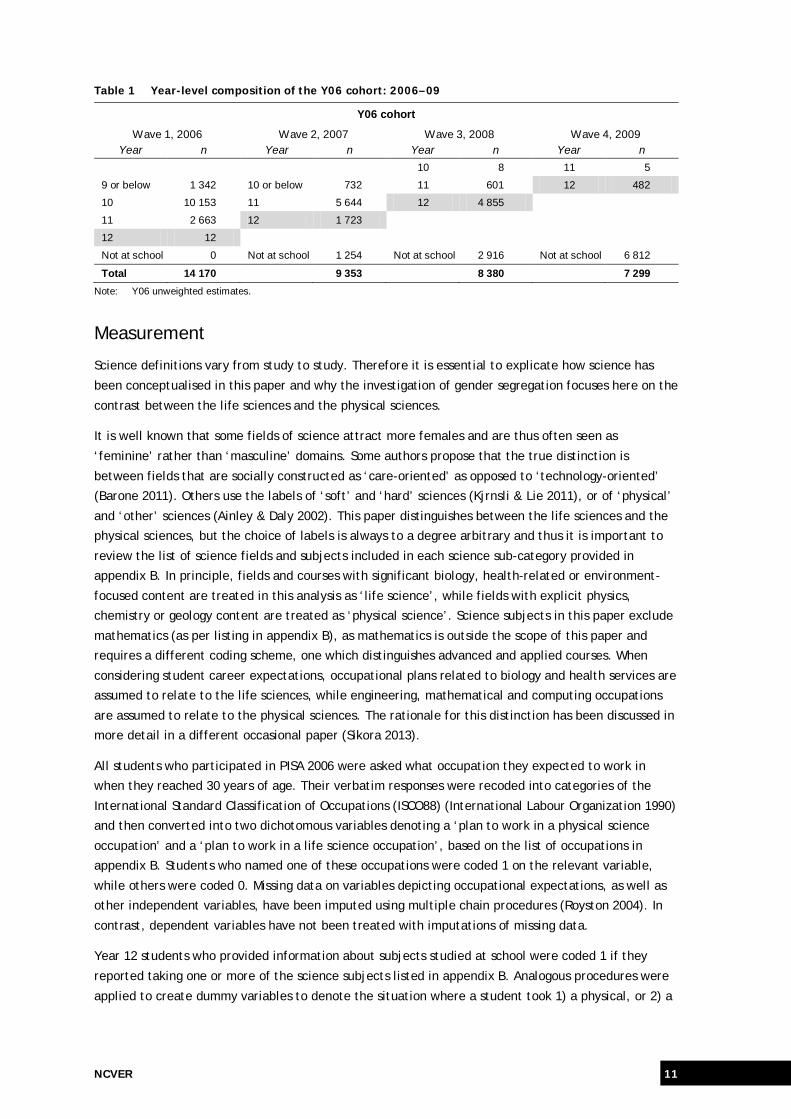
Table 1 lists the details of Year 12 student distribution across four waves of Y06, to which students
provided information about their subject choices. The information from students in the shaded rows
of table 1 has been used to furnish estimates of science subject uptake and its gender segregation.
Twelve students provided this information in Wave 1, 1723 students answered questions about Year 12
subjects in Wave 2, 4855 students did so in Wave 3, while 482 students answered this question in
Wave 4. Attrition over time is shown across the rows of table 1; for example, while there were 2663
Year 11 students in Wave 1, only 1723 of them provided Year 12 subject information in Wave 2. The
information on choices of tertiary fields of study has been pooled from six Y06 waves collected
between 2006 and 2011 and refers to enrolment in but not to completion of a science course.
NCVER 11
Table 1 Year-level composition of the Y06 cohort: 2006–09
Y06 cohort
Wave 1, 2006 Wave 2, 2007 Wave 3, 2008 Wave 4, 2009 Year n Year n Year n Year n
10 8 11 5
9 or below 1 342 10 or below 732 11 601 12 482
10 10 153 11 5 644 12 4 855
11 2 663 12 1 723
12 12
Not at school 0 Not at school 1 254 Not at school 2 916 Not at school 6 812
Total 14 170 9 353 8 380 7 299 Note: Y06 unweighted estimates.
Measurement
Science definitions vary from study to study. Therefore it is essential to explicate how science has
been conceptualised in this paper and why the investigation of gender segregation focuses here on the
contrast between the life sciences and the physical sciences.
It is well known that some fields of science attract more females and are thus often seen as
‘feminine’ rather than ‘masculine’ domains. Some authors propose that the true distinction is
between fields that are socially constructed as ‘care-oriented’ as opposed to ‘technology-oriented’
(Barone 2011). Others use the labels of ‘soft’ and ‘hard’ sciences (Kjrnsli & Lie 2011), or of ‘physical’
and ‘other’ sciences (Ainley & Daly 2002). This paper distinguishes between the life sciences and the
physical sciences, but the choice of labels is always to a degree arbitrary and thus it is important to
review the list of science fields and subjects included in each science sub-category provided in
appendix B. In principle, fields and courses with significant biology, health-related or environment-
focused content are treated in this analysis as ‘life science’, while fields with explicit physics,
chemistry or geology content are treated as ‘physical science’. Science subjects in this paper exclude
mathematics (as per listing in appendix B), as mathematics is outside the scope of this paper and
requires a different coding scheme, one which distinguishes advanced and applied courses. When
considering student career expectations, occupational plans related to biology and health services are
assumed to relate to the life sciences, while engineering, mathematical and computing occupations
are assumed to relate to the physical sciences. The rationale for this distinction has been discussed in
more detail in a different occasional paper (Sikora 2013).
All students who participated in PISA 2006 were asked what occupation they expected to work in
when they reached 30 years of age. Their verbatim responses were recoded into categories of the
International Standard Classification of Occupations (ISCO88) (International Labour Organization 1990)
and then converted into two dichotomous variables denoting a ‘plan to work in a physical science
occupation’ and a ‘plan to work in a life science occupation’, based on the list of occupations in
appendix B. Students who named one of these occupations were coded 1 on the relevant variable,
while others were coded 0. Missing data on variables depicting occupational expectations, as well as
other independent variables, have been imputed using multiple chain procedures (Royston 2004). In
contrast, dependent variables have not been treated with imputations of missing data.
Year 12 students who provided information about subjects studied at school were coded 1 if they
reported taking one or more of the science subjects listed in appendix B. Analogous procedures were
applied to create dummy variables to denote the situation where a student took 1) a physical, or 2) a

12 Gendered pathways into the post-secondary study of science
life science subject. In effect all students with information on subjects studied in Year 12 were
included in the analyses.
A dummy variable, created from the codes for fields of study detailed in the Australian Standard
Classification of Education (ASCED; Australian Bureau of Statistics [ABS] 2001), was used to denote
enrolment in science at tertiary level at any time between finishing Year 12 and 2011. Appendix B
lists the ASCED codes used to create, in parallel to career expectations and subject uptake, a pair of
dummy variables denoting enrolment in a life or a physical science qualification at tertiary level.
Analysis design
The analysis in this paper combines a classical design of educational pathways studies (Anlezark et al.
2008) with insights into the segregative tendencies depicted by simple descriptive statistics. Beginning
from an examination of the segregation patterns in students’ career plans related to science and their
school subject uptake over the decade between 1999 and 2009, the paper next turns to hierarchical
models to analyse the educational transitions of youth in the Y06 cohort. In this analysis, the impact
of students’ science-related career plans on science subject uptake in high school is first examined,
followed by the impact of both of these variables on the likelihood of science-related enrolment at
tertiary level. The focus is on gender differences in these pathways (figure 1). The gender differences
are captured by comparisons between regression coefficients in models predicting overall science
engagement and coefficients from models predicting engagement in the life and in the physical
sciences, respectively (figure 1).
Figure 1 Conceptual model of multivariate analyses
More precisely, the goal is first to discern gender differences in overall science engagement,
identifying their main determinants, and then to contrast these patterns with patterns specific to the
life and physical sciences. If the progression pathways are as indicated by the solid lines in figure 1,
gender segregation within science should be seen as a process which starts early and reproduces itself
at subsequent levels of education. However, if there is much switching between the physical and life
sciences, as indicated by the dotted lines, the apparent gender segregation within science education
may be seen as transitory and relatively inconsequential.
Expected life science
occupation at 15 years of age
Expected science occupation at 15
years of age
Science subject (one or more)
in Year 12
Enrolment in tertiary qualification in a
science field
Expected physical science
occupation at 15 years of age
Physical science subject (one or
more) in Year 12
Life science subject (one or
more) in Year 12
Enrolment in tertiary qualification in a
physical science field
Enrolment in tertiary qualification in a life
science field

NCVER 13
Results The historical trend in all OECD countries has been for younger cohorts to show less interest in science
and to decrease their participation in science education when given the choice to undertake other
interest-driven specialisations (OECD 2006; Osborne & Dillon 2008). Nevertheless, in Australia the
decade between 1999 and 2009 saw relatively steady rates of adolescent participation in school
biology, chemistry, psychology, geology, physics and related sciences (Ainley, Kos & Nicholas 2008,
p.18). When school subjects only are considered and when information technology and mathematics
are combined with science subjects, the trend in Australia between the late 1990s and the first years
of the twenty-first century revealed a pronounced decrease in science participation (Anlezark et al.
2008). This paper, however, focuses on school subjects related to biology, chemistry, psychology,
geology, physics and related sciences, enrolments in which, over that time period, remained at
comparable levels (Ainley, Kos & Nicholas 2008).
Simple descriptive statistics that report the proportions of students in upper secondary school who
had expectations of science careers and of students who took science subjects in Year 12 are given in
figure 2. The picture that emerges is one of a persisting gender divide between the types of science
courses and occupations which appeal to adolescents of each sex.
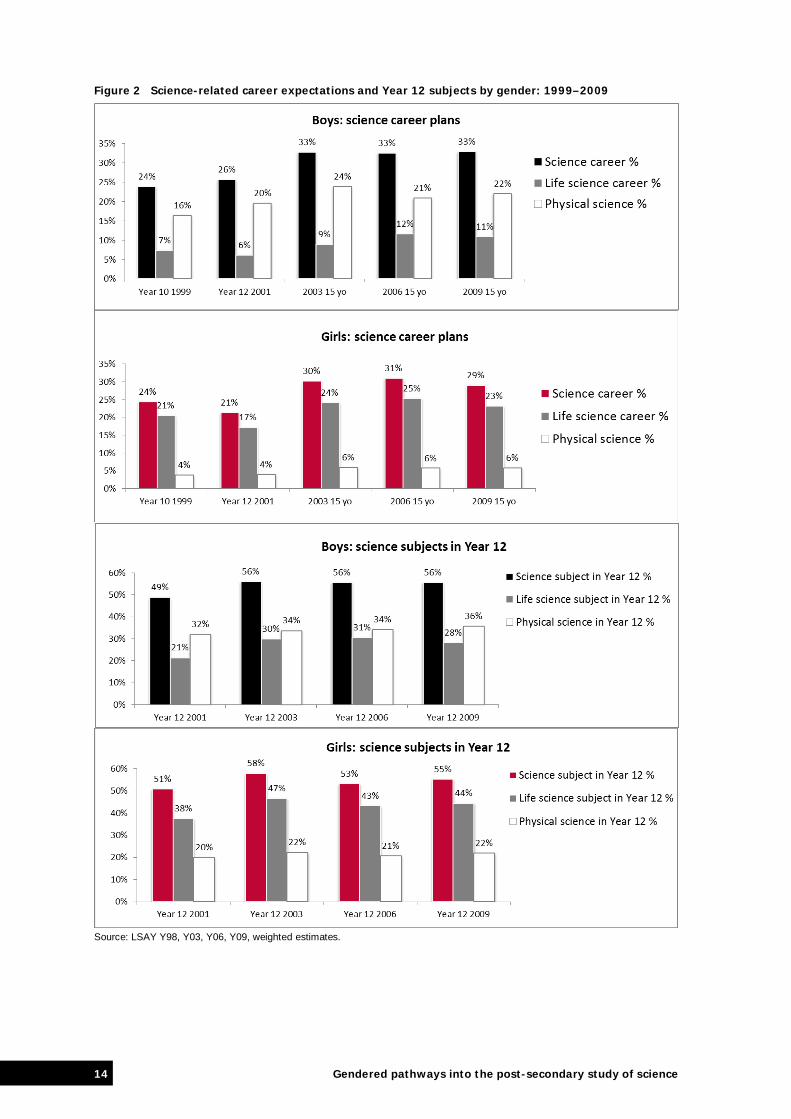
The two top panels of figure 2 report students’ occupational expectations related to science, and
although there are five clusters of bars they summarise information from four cohorts of students. The
first two clusters in the top two panels illustrate the changes in science-related occupational plans
between Years 10 and 12 in the LSAY 1998 cohort (Y98).
The level of interest in science-related occupations remained stable over that decade. In fact,
student interest levels tended to rise in the latter part of the decade, although this apparent growth
may be an artefact of the measurement properties of pre- and post-PISA LSAY surveys. In the last ten
years approximately 30% of girls and 33% of boys were interested in a science-related occupation.
However, the types of science occupations that appealed to boys and girls were quite different. Boys
strongly preferred physical science occupations, with 20% to 24% of boys nominating one of them as
their future career aspiration between 2001 and 2009. In contrast, only 4% to 6% of girls were
interested in these occupations in the same time period; boys therefore were approximately four
times more likely than girls to feel enthused about occupations related to physics, mathematics,
computing and engineering. The reverse pattern occurs in vocational aspirations involving the life
sciences, which appealed to twice as many girls as boys. Over time, however, the interest in these
occupations among boys seems to have grown slightly, from around 6% to 11%, which is the only sign
of convergence (figure 2).
14 Gendered pathways into the post-secondary study of science
Figure 2 Science-related career expectations and Year 12 subjects by gender: 1999–2009
Source: LSAY Y98, Y03, Y06, Y09, weighted estimates.

NCVER 15
The choices of science subjects in Year 12, presented in the two lower panels of figure 2, are similarly
segregated by gender, except that the gender ratios are smaller than those that relate to
occupational expectations. In 2006 girls were 1.4 times more likely than boys to elect a life science
subject at school, while boys were 1.6 times more likely than girls to elect a physical science subject.
These smaller ratios indicate that school science participation is less differentiated by gender than
students’ vocational ambitions.
Overall, in response to the first research question posed in this paper, this analysis indicates that
school science participation is considerably less segregated by gender than students’ vocational
orientations related to science. Given that students’ career plans are relatively less differentiated by
gender than labour force participation (Sikora & Saha 2011), it is plausible to assume that school
science participation reflects rather than drives the gender gap in science employment.
The key feature of figure 2 is the temporal stability of gender segregation in science. This corresponds
with the international literature, which argues that, although women have made great inroads into
science, this type of horizontal segregation persists, regardless of the overall rates of men’s and
women’s participation in post-compulsory education (Barone 2011). While figure 2 reports data for
one decade only, it is reasonable to concede that these tendencies are more than a decade old.
By comparison with the uptake of Year 12 science subjects, specialisation in science at the tertiary
level tends to be more strongly segregated by gender in the physical but not in the life sciences
(figure 3). Young men are five times more likely than women to specialise in the physical sciences. In
contrast, young women are only 1.7 times more likely than young men to select the life sciences,
which is similar to the segregation evident in school subject choices. So with respect to the first
research question, the conclusion is that not only are occupational plans more segregated than school
science participation but also the gender gap in the uptake of the physical sciences is widest at the
tertiary level. By contrast, the gender gap in the life sciences is less pronounced at this stage of
education. It may be that women prefer life science qualifications, which lead to lower-status
occupations, than the qualifications preferred by men. To attain a full picture of gender differences,
future analyses should account for both the horizontal and vertical dimensions of gender segregation.
Here, the horizontal dimension is related to the fields of study and employment, while the vertical
dimension refers to the level of education and status of employment, including pay and authority.
Figure 3 Enrolment in science-related tertiary qualifications by gender
Source: LSAY Y06, weighted estimates.

16 Gendered pathways into the post-secondary study of science
Overall, in the first decade of the twenty-first century enrolments in high school courses related to
the physical and life sciences continued to be segregated by gender, even though the overall
participation in science was comparable among males and females. Just over 30% of students planned
a science-related career at 15 years of age and just over 50% studied science in Year 12. By the time
students entered post-secondary study, fewer women remained in science, just as predicted by the
traditional ‘leaky pipeline’ argument. This trend comprised a strong tendency for women to exit the
physical sciences, while the life sciences remained segregated by gender to the degree comparable
with high school patterns.
Can these patterns of segregation be attributed to the differences between boys and girls in terms of
their family backgrounds, school science performance, science self-concept (that is, self-confidence),
or early vocational orientations?
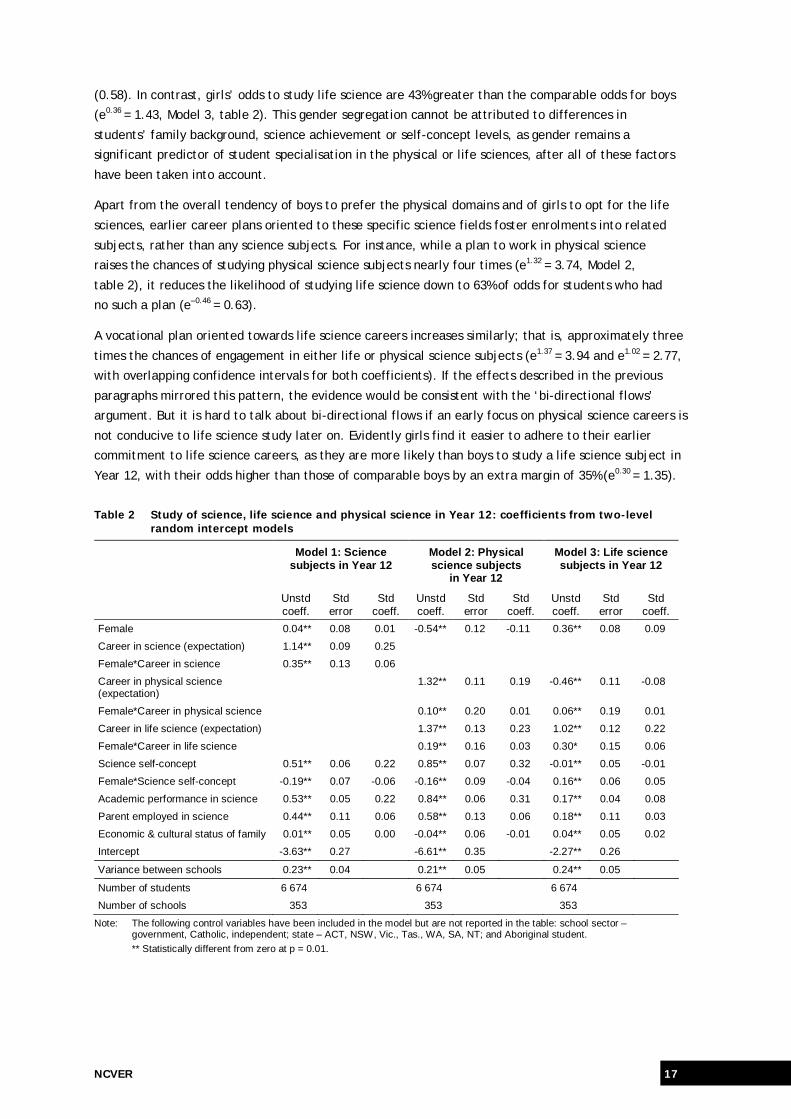
Table 2 presents an analysis of the factors that facilitate the uptake of science subjects in Year 12,
while table 3 extends this analysis to the factors that facilitate the choice of science as a field of
study at post-secondary level. Tables 2 and 3 report unstandardised and standardised logit
coefficients. The former can be easily converted into odds ratios2 but cannot always be directly
compared with other predictors to decide which of them are most important. In contrast,
standardised coefficients are directly comparable, regardless of variable metrics. Each unstandardised
coefficient, once exponentiated, becomes an odds ratio. For instance, the first statistically significant
coefficient of —0.54** for females in Model 2 of table 2 means that girls’ odds of taking a physical
science subject are equal to only 0.58 of the odds for boys. This is because raising the base of natural
logarithm,3 known as e, to the power of —0.54 returns 0.58.
There are no gender differences in the likelihood of studying science in Year 12 (as shown by the
insignificant 0.04, Model 1, table 2). An early plan to pursue a career in science not only triples the
chances of electing science subjects for all students (e1.14 = 3.13, Model 1, table 2), but also boosts
girls’ odds by an extra 42% (as e0.35 = 1.42, Model 1, table 2). An enhanced science self-concept helps
all students to enrol in science in Year 12 (e0.51 = 1.67); however, girls who perform on a par with boys
in science often have a lower science-self-concept than that suggested by their performance levels.
Therefore, they are less likely to enrol in science. (The odds ratio for girls is e–0.19, which is 83% of the
odds for boys.) Unsurprisingly, strong science performance encourages continuation of the study of
science in Year 12 (e0.53 = 1.70), which means that, given the coding of this variable, each gain in
performance equal to one standard deviation enhances the chances of later science uptake by about
70%). Moreover, the children of two parents employed in science-related occupations have odds of
studying science in Year 12 greater by 55% relative to the odds of students with neither parent in
science (e0.44 = 1.55). This is above and beyond the impact of success in school science or of science-
related career plans. This extra boost, discussed in more detail below, is of moderate importance.
Standardised coefficients reveal that it is the vocational orientation towards science (0.25 in Model 1,
table 2), high self-concept (0.22) and academic success in science (0.22) that most effectively raise
the chances of studying science in Year 12.
Field-specific analyses in Models 2 and 3 of table 2 reveal a more complex picture with regard to
gender differences. Firstly, when physical and life science subjects are considered separately, the
gender divide is not only evident but also non-trivial, just as it was in figures 2 and 3. As mentioned
before, the odds for girls to study physical science are only a little more than half of the odds for boys
2 For dichotomous variables an odds ratio is equal to one, if two groups that are compared have an equal chance of
some outcome. 3 Logit models utilise the value e, which equals 2.71828182845904 and is the base of the natural logarithm.
NCVER 17
(0.58). In contrast, girls’ odds to study life science are 43% greater than the comparable odds for boys
(e0.36 = 1.43, Model 3, table 2). This gender segregation cannot be attributed to differences in
students’ family background, science achievement or self-concept levels, as gender remains a
significant predictor of student specialisation in the physical or life sciences, after all of these factors
have been taken into account.
Apart from the overall tendency of boys to prefer the physical domains and of girls to opt for the life
sciences, earlier career plans oriented to these specific science fields foster enrolments into related
subjects, rather than any science subjects. For instance, while a plan to work in physical science
raises the chances of studying physical science subjects nearly four times (e1.32 = 3.74, Model 2,
table 2), it reduces the likelihood of studying life science down to 63% of odds for students who had
no such a plan (e–0.46 = 0.63).
A vocational plan oriented towards life science careers increases similarly; that is, approximately three
times the chances of engagement in either life or physical science subjects (e1.37 = 3.94 and e1.02 = 2.77,
with overlapping confidence intervals for both coefficients). If the effects described in the previous
paragraphs mirrored this pattern, the evidence would be consistent with the ‘bi-directional flows’
argument. But it is hard to talk about bi-directional flows if an early focus on physical science careers is
not conducive to life science study later on. Evidently girls find it easier to adhere to their earlier
commitment to life science careers, as they are more likely than boys to study a life science subject in
Year 12, with their odds higher than those of comparable boys by an extra margin of 35% (e0.30 = 1.35).
Table 2 Study of science, life science and physical science in Year 12: coefficients from two-level random intercept models
Model 1: Science subjects in Year 12
Model 2: Physical science subjects
in Year 12
Model 3: Life science subjects in Year 12
Unstd coeff.
Std error
Std coeff.
Unstd coeff.
Std error
Std coeff.
Unstd coeff.
Std error
Std coeff.
Female 0.04** 0.08 0.01 -0.54** 0.12 -0.11 0.36** 0.08 0.09
Career in science (expectation) 1.14** 0.09 0.25
Female*Career in science 0.35** 0.13 0.06
Career in physical science (expectation)
1.32** 0.11 0.19 -0.46** 0.11 -0.08
Female*Career in physical science 0.10** 0.20 0.01 0.06** 0.19 0.01
Career in life science (expectation) 1.37** 0.13 0.23 1.02** 0.12 0.22
Female*Career in life science 0.19** 0.16 0.03 0.30* 0.15 0.06
Science self-concept 0.51** 0.06 0.22 0.85** 0.07 0.32 -0.01** 0.05 -0.01
Female*Science self-concept -0.19** 0.07 -0.06 -0.16** 0.09 -0.04 0.16** 0.06 0.05
Academic performance in science 0.53** 0.05 0.22 0.84** 0.06 0.31 0.17** 0.04 0.08
Parent employed in science 0.44** 0.11 0.06 0.58** 0.13 0.06 0.18** 0.11 0.03
Economic & cultural status of family 0.01** 0.05 0.00 -0.04** 0.06 -0.01 0.04** 0.05 0.02
Intercept -3.63** 0.27 -6.61** 0.35 -2.27** 0.26
Variance between schools 0.23** 0.04 0.21** 0.05 0.24** 0.05
Number of students 6 674 6 674 6 674
Number of schools 353 353 353
Note: The following control variables have been included in the model but are not reported in the table: school sector – government, Catholic, independent; state – ACT, NSW, Vic., Tas., WA, SA, NT; and Aboriginal student. ** Statistically different from zero at p = 0.01.
18 Gendered pathways into the post-secondary study of science
The standardised coefficients reported for Models 1, 2 and 3 in table 2 depict the relative importance
of particular factors that are conducive to the study of science in Year 12. An early vocational plan
focused on science, a high science self-concept and academic success are the three most important
predictors. Similar clusters of factors enhance the chances of studying physical and life science
subjects, except that academic performance and self-concept in science are very strong determinants
of physical science uptake, while participation in life science subjects appears to be less strongly tied
to these two factors.
Parental employment in science is a significant predictor of students’ science study in Year 12,
although by comparison with other variables in the model it is by no means the strongest determinant.
It is worth noting that science socialisation within the family is gender-specific in the sense that
Australian teenagers have relatively few mothers pursuing careers in the physical sciences,
engineering or computing (2% as reported by Sikora & Pokropek 2012b). Australia is one of the
countries in which the science-related career plans of same-sex children are associated with parental
science employment. This means that, while fathers’ employment in engineering inspires daughters to
think of a similar career, the chances that it will inspire sons are higher. By analogy, the preferences
for life science employment are more likely to be transferred between mothers and daughters than
between mothers and sons (Sikora & Pokropek 2012b). The analysis in this paper does not distinguish
between sex-specific and cross-sex transfers of preferences for science occupations between
Australian parents and children. Nevertheless, it shows that parental employment in science raises
student interest at least until the end of secondary school and bestows an additional advantage above
and beyond students’ own performance, self-concept and career plans. However, this net effect of
parental employment in science is moderate (for example, standardised coefficient 0.06 in Model 1,
table 2) and disappears at the later stages of education, that is, when young people undertake study
towards tertiary qualifications (insignificant standardised coefficient 0.03, table 3).
Table 3 contains information about the correlates of science study at post-secondary level and shows,
as did the descriptive statistics in figure 3, the pattern of ‘leaking’ women from science education.
All else being equal, women’s odds of enrolling into tertiary science courses are only 57% of men’s
odds (e–0.57 = 0.57, Model 1, table 3). Notwithstanding that, young women and men continue to
concentrate in the life and physical sciences to different degrees, above and beyond all the other
factors considered in the analysis (Models 2 and 3, table 3). Women’s odds of studying physical
science are only 24% of men’s odds (e–1.42), while their odds of studying life science are one and a half
that of men’s odds (e0.43). The relationship between an earlier science career plan and entry into a
science-related tertiary qualification is positive for all respondents, but somewhat weaker for women
(e–0.28 = 0.75). Evidently young people specialise early in either the life or physical sciences; that is,
the chances of tertiary study in the physical sciences are enhanced by an earlier commitment to a
physical science career but diminished by an earlier plan to work in life science, and vice versa. These
relationships are similar for men and women, except that the few women who study physical science
at tertiary level were significantly more likely than comparable men to have studied physical science
in Year 12 (e0.59 = 1.8, Model 2, table 3).

NCVER 19
Table 3 Study of science, life science and physical science at tertiary level: coefficients from two-level random intercept models
Model 1: Tertiary study in science
Model 2: Tertiary study in physical science
Model 3: Tertiary study in life science
Unstd coeff.
Std error
Std coeff.
Unstd coeff.
Std error
Std coeff.
Unstd coeff.
Std error
Std coeff.
Female -0.57** 0.15 -0.13 -1.42** 0.17 -0.31 0.43** 0.17 0.10
Career in science (expectation) 1.20** 0.11 0.28
Female*Career in science -0.28** 0.14 -0.06
Studied science in Year 12 0.97** 0.12 0.22
Female*Science in Year 12 0.42** 0.16 0.09
Career in physical science (expectation)
1.26** 0.12 0.21 -0.51** 0.18 -0.09
Female*Career in physical science -0.44** 0.26 -0.04 0.53** 0.29 0.05
Career in life science (expectation) -0.39** 0.20 -0.08 1.26** 0.16 0.27
Female*Career in life science 0.21** 0.33 0.04 -0.40** 0.19 -0.08
Studied physical science in Year 12 0.95** 0.13 0.20 0.64** 0.17 0.15
Female* Physical science in Year 12 0.59** 0.22 0.09 0.02** 0.21 0.00
Studied life science in Year 12 -0.57** 0.14 -0.12 1.04** 0.14 0.25
Female*Life science in Year 12 -0.40** 0.25 -0.08 0.08** 0.18 0.02
Science self-concept 0.16** 0.06 0.07 0.10** 0.06 0.04 -0.03** 0.08 -0.01
Female*Science self-concept 0.01** 0.08 0.00 0.03** 0.11 0.01 0.02** 0.09 0.01
Academic performance in science 0.10** 0.05 0.04 -0.03** 0.07 -0.01 0.07** 0.06 0.03
Parent employed in science 0.20** 0.11 0.03 0.11** 0.16 0.01 0.03** 0.12 0.00
Economic & cultural status of family -0.06** 0.05 -0.02 -0.09** 0.07 -0.03 -0.02** 0.06 -0.01
Intercept -1.92** 0.29 -1.41** 0.40 -2.96** 0.35
Variance between schools 0.04 0.03 0.01 0.05 0.001 0.001
Number of students 4 409 4 409 4 409
Number of schools 350 350 350
Note: The following control variables have been included in the model but are not reported in the table: school sector – government, Catholic, independent; state – ACT, NSW, Vic., Tas., WA, SA, NT; and Aboriginal student. ** Statistically different from zero at p = 0.01.
In some contrast to the prevalent tendency to specialise early in either the life or physical sciences,
taking physical science in school is conducive to later engagement with either the life or physical
sciences (e0.95 = 2.6 and e0.64 = 1.9 in table 3, Models 2 and 3). It is possible that a number of students
use physical science courses to prepare for entry into tertiary education in the life sciences. This
could be conceived as a factor which weakens segregative tendencies, in line with the ‘bi-directional
flows’ argument. However, the opposite tendency is not evident: prior engagement in the life
sciences reduces the chances of studying the physical sciences at tertiary level (e–0.57 =0.6). Thus, the
evidence of bi-directional flows is rather limited, if not altogether absent.
Are factors that foster overall engagement with science also conducive to gender segregation within
it? This analysis suggests that the gender gap in science is largely unrelated to levels of science
participation and thus it is erroneous to assume that involving more students in science will
necessarily reduce gender segregation. More likely, the segregative tendencies evident in the choices
of young men and women will persist, regardless of young people’s histories of academic success in
science, parental employment in science, science self-concept or the socioeconomic status of the
family of origin. All of these factors can matter but their impact becomes negligible if they do not
align with powerful and widely shared gender stereotypes. The contrast in the segregation patterns
affecting student career plans, school subjects and fields of tertiary study suggests that gender
20 Gendered pathways into the post-secondary study of science
segregation of school science is sustained by the reproduction of broader cultures outside school
settings. Such broader cultures are deeply entrenched and link the imagery associated with particular
occupations and fields of activity with essentialist beliefs about the ‘natural’ proclivities and
strengths of men and women.
NCVER 21
Conclusions This paper has examined the gender segregation of science engagement in the LSAY Y06 cohort,
considering pathways from early career preferences, through Year 12 subject choices, and to
enrolment in post-secondary courses. The focus was on research questions investigating the
relationship between the science-related occupational expectations of students and science
participation in secondary and tertiary studies, the role of parental cultural capital, understood as the
impact of factors associated with parental employment in science, and the concepts of ‘leaky
pipeline’ and ‘bi-directional flows’.
Although the overall interest in science careers among boys and girls appears similar, as does the level
of engagement in school science, in reality boys and girls concentrate in very different areas of
science, which determines, at least partly, their later pathways into science-related tertiary study.
Year 12 science participation is considerably less segregated by gender than students’ vocational
orientations related to science. However, once students leave secondary school, young women are
less likely than young men to pursue science qualifications, as suggested by the ‘leaky pipeline’
arguments. This lower likelihood comprises two opposite trends. The first is that women are actually
somewhat more likely than men to pursue life science qualifications. The second is that their chances
of specialising in the physical sciences decrease dramatically: men are five times more likely than
women to study physical science courses at post-secondary levels.
Overall, in the first decade of the twenty-first century high school science continued to be segregated
by gender, even though the overall engagement in science was comparable between boys and girls. In
secondary school just over 30% of students planned a science-related career at 15 years of age and
just over 50% studied science in Year 12. The patterns of gender segregation in science indicate that
there are no significant bi-directional flows occurring at the subsequent stages of education. Rather,
the gender gap evident in occupational aspirations is largely reproduced in the choice of science
subjects in Year 12 and then it is not only reproduced but even enhanced in the choices of post-
secondary fields of study. Most likely, school science is less segregated by gender because a number
of students use physical science courses to prepare for entry into tertiary education in the life
sciences. The opposite, however, is not the case.
Interestingly, the science-related cultural capital of parents is conducive to both engagement and
gender segregation in science (Sikora & Pokropek 2012b). Nevertheless, its effect cannot be
considered to be strong when compared with students’ own success in school science, their science
self-concept or their career plans. To put this in context, it must be noted that parental cultural
capital operates partly through facilitating students’ success in school science, since from an early
stage science-savvy parents can effectively support their children’s science education. In other words,
parental capital has indirect as well as direct benefits (Sikora & Pokropek 2012b).
This analysis cannot provide definitive answers to questions about the gender differentials in the labour
market returns from science qualifications that may sustain the persistent gender segregation evident
in science education. However, it strongly suggests that analyses of educational pathways that fail to
account for gender differences in students’ early vocational aspirations related to science miss an
important element of the story. Therefore, more attention to the differences in the fields of science
taken up by men and women is needed in future studies devoted to gender and science education.

22 Gendered pathways into the post-secondary study of science
References ABS (Australian Bureau of Statistics) 2001, Australian Standard Classification of Education (ASCED),
cat.no.1272, ABS, Canberra.
Ainley, M & Ainley, J 2011, ‘A cultural perspective on the structure of student interest in science’, International Journal of Science Education, vol.33, no.1, pp.51—71.
Ainley, J & Daly, P 2002, ‘Participation in science courses in the final year of high school in Australia: the influences of single-sex and coeducational schools’, in Gender in policy and practice: perspectives on single-sex and coeducational schooling, eds A Datnow & L Hubbard, Routledge Falmer, New York & London, pp.243—61.
Ainley, J, Kos, J & Nicholas, M 2008, Participation in science, mathematics and technology in Australian education, ACER research monograph no.63, Australian Council for Educational Research, Melbourne.
Anlezark, A, Lim, P, Semo, R & Nguyen, N 2008, From STEM to leaf: where are Australia’s science, mathematics, engineering and technology (STEM) students heading?, NCVER, Adelaide.
Asparouhov, T 2004, ‘Weighting for unequal probability of selection in multilevel modeling’, in Mplus Web Notes, no.8, viewed 15 February 2013, <http://www.statmodel.com>.
Barone, C 2011, ‘Some things never change: gender segregation in higher education across eight nations and three decades’, Sociology of Education, vol.84, no.2, pp.157—76.
Bell, S 2008, ‘Women in science: lessons from Australia’, International Journal of Gender, Science of Technology , vol.2, pp.437—52.
Charles, M & Bradley, K 2009, ‘Indulging our gendered selves? Sex segregation by field of study in 44 countries’, American Journal of Sociology, vol.114, no.4, pp.924—76.
Fullarton, S & Ainley, J 2000, Subject choice by students in Year 12 in Australian secondary schools, LSAY research report no.15, Australian Council for Educational Research, Melbourne.
Gerber, T & Cheung, SY 2008, ‘Horizontal stratification in post-secondary education: forms, explanations and implications’, Annual Review of Sociology, vol.34, pp.299—318.
Hill, C, Corbett, C & Rose, AS 2010, Why so few? Women in science, technology, engineering, and mathematics, American Association of University Women, Washington.
International Labour Organization, 1990, International Standard Classification of Occupations: ISCO—88, ILO, Geneva.
Jackson, RM 1998, Destined for equality: the inevitable rise of women’s status, Harvard University Press, Cambridge, MA.
Kjrnsli, M & Lie, S 2011, ‘Students’ preference for science careers: international comparisons based on PISA 2006’, International Journal of Science Education, vol.33, pp.121—44.
Lim, P 2011, Weighting the LSAY Programme of International Student Assessment cohorts, NCVER, Adelaide.
Little, RJA & Rubin, DB 1987, Statistical analysis with missing data, Wiley, New York.
Mislevy, RJ, Beaton, AE, Kaplan, B & Sheehan, KM 1992, ‘Estimating population characteristics from sparse matrix samples of item responses’, Journal of Educational Measurement, vol.29, no.2, pp.133—61.
NCVER (National Centre for Vocational Education Research) 2012, Longitudinal Surveys of Australian Youth (LSAY) 2006 cohort user guide, Technical paper no.55, NCVER, Adelaide.
OECD (Organisation for Economic Co-operation and Development) 2006, Women in scientific careers: unleashing the potential, OECD, Paris.
——2007a, PISA 2006 technical report, OECD, Paris, viewed 13 May 2013, <http://www.oecd.org/dataoecd/0/47/42025182.pdf>.
——2007b, PISA 2006 science competencies for tomorrow’s world, viewed 11 May 2013, <http://www.oecd.org/dataoecd/59/32/39730315.pdf>.
——2009, PISA 2006 data analysis manual — SPSS version, OECD, Paris.
——2012, PISA 2009 technical report, OECD, Paris, viewed 13 May 2013, <http://www.oecd.org/pisa/pisaproducts/pisa2009/50036771.pdf>.
Osborne, J & Dillon, J 2008, Science education in Europe: critical reflections, Nuffield Foundation, London.
Raudenbush, SW & Bryk, AS 2002, Hierarchical linear models: applications and data analysis methods, Sage Publications, Thousand Oaks, CA.
Royston, P 2004, ‘Multiple imputation of missing values’, Stata Journal, vol.4, no.3, pp.227—41.
Sikora, J 2013, Single-sex schools and science engagement, NCVER, Adelaide.
NCVER 23
Sikora, J & Pokropek, A 2011, Gendered career expectations of students: perspectives from PISA 2006, OECD education working papers no.57, OECD, Paris, viewed 2 February 2014, <http://dx.doi.org/10.1787/5kghw6891gms-en>.
——2012a, ‘Gender segregation of adolescent science career plans in 50 countries’, Science Education, vol.96, no.2, pp.234—64.
——2012b, ‘Intergenerational transfers of preferences for science careers in comparative perspective’, International Journal of Science Education, vol.34, no.16, pp.2501—27.
Sikora, J & Saha, LJ 2011, Lost talent? The occupational expectations and attainments of young Australians, NCVER, Adelaide.
Wu, M 2005, ‘The role of plausible values in large-scale surveys’, Studies in Educational Evaluation, vol.31, no.2—3, pp.114—28.
Xie, Y & Shauman, KA 2003, Women in science — career processes and outcomes, Harvard University Press, Cambridge, MA.

24 Gendered pathways into the post-secondary study of science
Appendices Appendix A: Details of methodology and measurement
Methods of estimation
PISA 2006, which is the first wave of Y06, uses plausible value methodologies to measure student
achievement. It also uses an incomplete balanced matrix design, which means that students answer a
sample of, rather than all, test questions. This is why the descriptive estimates of student
achievement in science in this paper are based on five plausible values for each student and
computed with the OECD-recommended analytical techniques, including balanced repeated replicate
weights with Fay adjustments (OECD 2009). All analyses have been performed on the data, in which
missing values have been replaced with the estimates from a multiple chained imputation procedure
available in Stata 12 (Royston 2004). The imputation model included as predictors all variables from
the analyses in this paper, except for dependent variables (as per table 4). Values for missing
dependent variables have not been imputed. Therefore students with missing information on science
subjects were excluded from all analyses, leaving 6674 cases. In this group, students with missing
data on tertiary fields of study were excluded from the analysis in table 3, leaving 4409 cases.
Table A1 Summary of imputations performed on independent variables
Complete observations
Imputed observations
Total n
Female 6 674 0 6 674
Career in science (expectation) 5 669 1 005 6 674
Career in physical science (expectation) 5 669 1 005 6 674
Career in life science (expectation) 5 669 1 005 6 674
Science self-concept 5 768 906 6 674
Academic performance in science 6 674 0 6 674
Parent employed in science 6 620 54 6 674
Economic and cultural status of family 6 662 12 6 674
Because of the use of imputations and plausible values (Mislevy et al. 1992), all estimates in
multivariate analyses have been obtained using multiple imputation methodology. This involves fitting
five sets of models, each with one plausible value, and then combining these values using the Rubin
rule (Little & Rubin 1987), as per OECD recommendations (OECD 2007a). For estimations of multilevel
(random intercept) models, MPlus version 7 was used because of its ability to handle weights in
hierarchical estimations.
The PISA 2006 sample is representative of 15-year-olds, not of students in any particular year level,
which requires careful decision-making when analyses of year-specific subject choices are
undertaken. In terms of weightings, in this analysis only student-level weights were used, as per OECD
recommendations (OECD 2012). This is justified, as PISA data have been collected with a sampling
mechanism that is invariant across sample clusters, so school-level weights are not necessary
(Asparouhov 2004).
The multivariate analyses in this paper are two-level hierarchical logit models with school-level and
student-level covariates (OECD 2012; Raudenbush & Bryk 2002). Logit models are suitable for
predictions involving binary outcome variables. Here dependent variables denote the chances of
NCVER 25
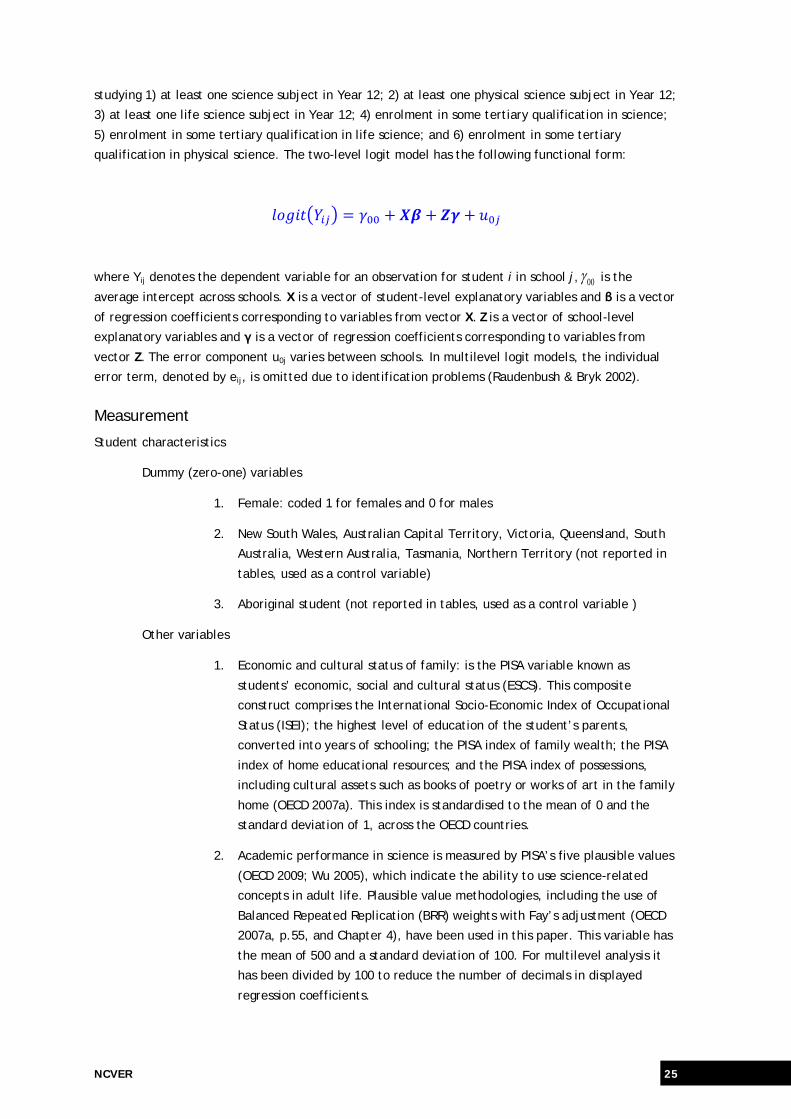
studying 1) at least one science subject in Year 12; 2) at least one physical science subject in Year 12;
3) at least one life science subject in Year 12; 4) enrolment in some tertiary qualification in science;
5) enrolment in some tertiary qualification in life science; and 6) enrolment in some tertiary
qualification in physical science. The two-level logit model has the following functional form:
𝑙𝑜𝑔𝑖𝑡�𝑌𝑖𝑗� = 𝛾00 + 𝑿𝜷 + 𝒁𝜸 + 𝑢0𝑗
where Yij denotes the dependent variable for an observation for student i in school j, 00γ is the
average intercept across schools. X is a vector of student-level explanatory variables and β is a vector
of regression coefficients corresponding to variables from vector X. Z is a vector of school-level
explanatory variables and γ is a vector of regression coefficients corresponding to variables from
vector Z. The error component u0j varies between schools. In multilevel logit models, the individual
error term, denoted by eij, is omitted due to identification problems (Raudenbush & Bryk 2002).
Measurement
Student characteristics
Dummy (zero-one) variables
1. Female: coded 1 for females and 0 for males
2. New South Wales, Australian Capital Territory, Victoria, Queensland, South
Australia, Western Australia, Tasmania, Northern Territory (not reported in
tables, used as a control variable)
3. Aboriginal student (not reported in tables, used as a control variable )
Other variables
1. Economic and cultural status of family: is the PISA variable known as
students’ economic, social and cultural status (ESCS). This composite
construct comprises the International Socio-Economic Index of Occupational
Status (ISEI); the highest level of education of the student’s parents,
converted into years of schooling; the PISA index of family wealth; the PISA
index of home educational resources; and the PISA index of possessions,
including cultural assets such as books of poetry or works of art in the family
home (OECD 2007a). This index is standardised to the mean of 0 and the
standard deviation of 1, across the OECD countries.
2. Academic performance in science is measured by PISA’s five plausible values
(OECD 2009; Wu 2005), which indicate the ability to use science-related
concepts in adult life. Plausible value methodologies, including the use of
Balanced Repeated Replication (BRR) weights with Fay’s adjustment (OECD
2007a, p.55, and Chapter 4), have been used in this paper. This variable has
the mean of 500 and a standard deviation of 100. For multilevel analysis it
has been divided by 100 to reduce the number of decimals in displayed
regression coefficients.
26 Gendered pathways into the post-secondary study of science
3. Self-confidence in science skills was measured by a PISA scale, with well-
established properties, including known reliability estimates (OECD 2007a,
p.324). The scale comprised students’ self-evaluation provided in response
to the following statements: ‘Learning advanced science topics would be
easy for me’; ‘I can usually give good answers to test questions on school
science topics’; ‘I learn science topics quickly’; ‘Science topics are easy for
me’; ‘When I am being taught science I can understand the concepts very
well’; and ‘I can easily understand new ideas in science’. The scale has been
standardised to the mean of 0 and the standard deviation of 1 on the pooled
data for the OECD countries.
School characteristics
1. Government school, independent school, Catholic school (not reported in tables,
used as a control variable)

NCVER 27
Appendix B: Coding of occupations, subjects and fields of study
Life science subjects
Coded based on curriculum content, not name of the subject (numerical codes are specific to the Y06
data file)
1 Agricultural science 2 Biology 4 Contemporary issues and science 8 Environmental science 11 Human biology 12 Life sciences 13 Marine and aquatic practices 14 Marine studies 15 Multi-strand studies 19 Psychology 20 Science life skills 21 Science of natural resources 23 Senior science
Physical science subjects
Coded based on curriculum content, not name of the subject (numerical codes are specific to the Y06
data file)
3 Chemistry 5 Cosmology 6 Earth and environmental science 7 Earth science 10 Geology 16 Physical science 17 Physics 18 Physics (including electronics) 22 Science of the physical world
Physical science occupations ISCO 88 (ILO 1990)
Note: these occupations are related to computing, engineering, mathematics or physical sciences.
‘Physical science’ is used as a short label for this entire group of occupations
1222 Production managers in manufacturing including factory managers 1223 Production managers in construction 1236 Computing services department managers 1237 Research and development department managers 2100 Physical, mathematical and engineering science professionals 2110 Physicists, chemists and related professionals 2111 Physicists and astronomers 2112 Meteorologists 2113 Chemists 2114 Geologists and geophysicists including geodesists 2120 Mathematicians and statisticians 2121 Mathematicians and associated professionals 2122 Statisticians including actuaries 2130 Computing professionals

28 Gendered pathways into the post-secondary study of science
2131 Computer systems designers and analysts including software engineers 2132 Computer programmers 2139 Computing professionals not elsewhere classified 2140 Architects, engineers and related professionals 2141 Architects, town and traffic planners including landscape architects 2142 Civil engineers including construction engineers 2143 Electrical engineers 2144 Electronics and telecommunications engineers 2145 Mechanical engineers 2146 Chemical engineers 2147 Mining engineers, metallurgists and related professionals 2148 Cartographers and surveyors 2149 Architects engineers and related professionals not elsewhere classified 3000 Technicians and associate professionals 3100 Physical and engineering science associate professionals 3110 Physical and engineering science technicians 3111 Chemical and physical science technicians 3112 Civil engineering technicians 3113 Electrical engineering technicians 3114 Electronics and telecommunications engineering technicians 3115 Mechanical engineering technicians 3116 Chemical engineering technicians 3117 Mining and metallurgical technicians 3118 Draughtspersons including technical illustrators 3119 Physical and engineering science technicians not elsewhere classified 3130 Optical and electronic equipment operators 3131 Photographers and electronic equipment operators 3132 Broadcasting and telecommunications equipment operators 3133 Medical equipment operators including x-ray technicians 3139 Optical and electronic equipment operators not elsewhere classified 3140 Ship and aircraft controllers and technicians 3141 Ships engineers 3142 Ships deck officers and pilots including river boat captains 3143 Aircraft pilots and related associate professionals 3144 Air traffic controllers 3145 Air traffic safety technicians 3434 Statistical, mathematical etc. associate professionals
Life science occupations ISCO88 (ILO 1990)
Note: these occupations are related to biology, agriculture and health or life sciences. ‘Life science’
is used as a short label for this entire group of occupations
1221 Production managers in agriculture and fishing 2200 Life science and health professionals 2210 Life science professionals 2211 Biologists, botanists, zoologists 2212 Pharmacologists, pathologists, biochemists 2213 Agronomists 2220 Health professionals (except nursing) 2221 Medical doctors 2222 Dentists 2223 Veterinarians 2224 Pharmacists 2229 Health professionals except nursing not elsewhere classified
NCVER 29
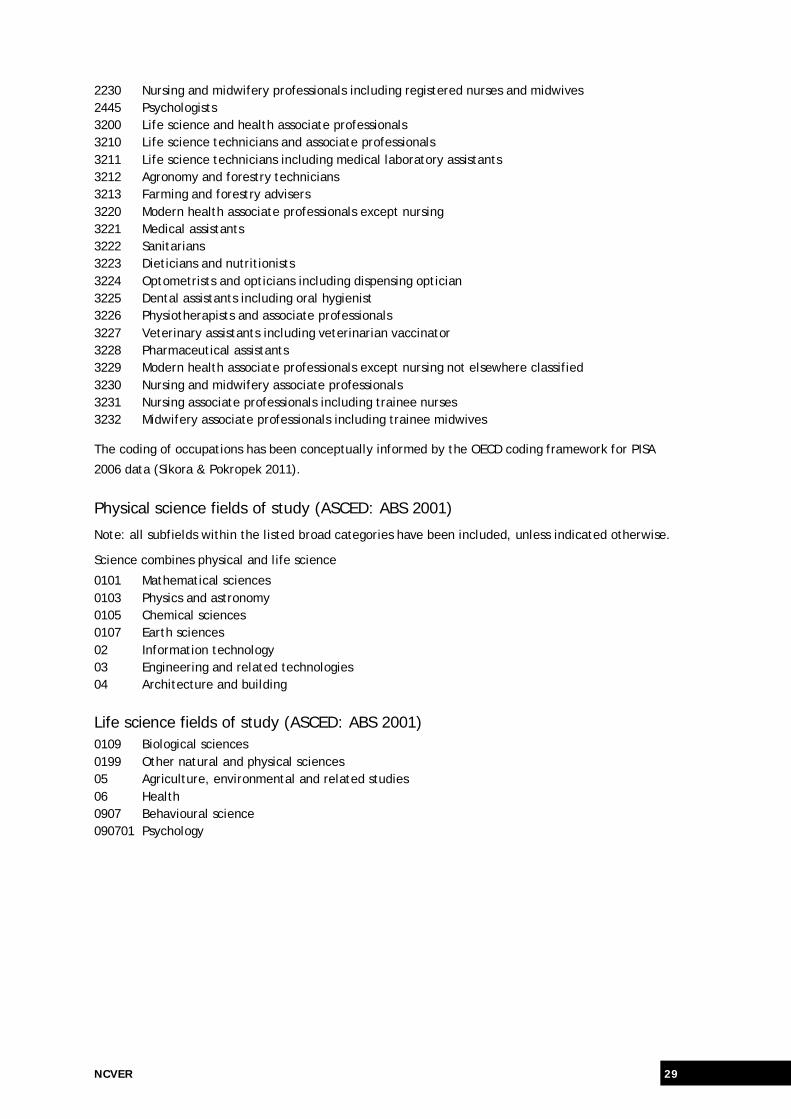
2230 Nursing and midwifery professionals including registered nurses and midwives 2445 Psychologists 3200 Life science and health associate professionals 3210 Life science technicians and associate professionals 3211 Life science technicians including medical laboratory assistants 3212 Agronomy and forestry technicians 3213 Farming and forestry advisers 3220 Modern health associate professionals except nursing 3221 Medical assistants 3222 Sanitarians 3223 Dieticians and nutritionists 3224 Optometrists and opticians including dispensing optician 3225 Dental assistants including oral hygienist 3226 Physiotherapists and associate professionals 3227 Veterinary assistants including veterinarian vaccinator 3228 Pharmaceutical assistants 3229 Modern health associate professionals except nursing not elsewhere classified 3230 Nursing and midwifery associate professionals 3231 Nursing associate professionals including trainee nurses 3232 Midwifery associate professionals including trainee midwives
The coding of occupations has been conceptually informed by the OECD coding framework for PISA
2006 data (Sikora & Pokropek 2011).
Physical science fields of study (ASCED: ABS 2001)
Note: all subfields within the listed broad categories have been included, unless indicated otherwise.
Science combines physical and life science
0101 Mathematical sciences 0103 Physics and astronomy 0105 Chemical sciences 0107 Earth sciences 02 Information technology 03 Engineering and related technologies 04 Architecture and building
Life science fields of study (ASCED: ABS 2001) 0109 Biological sciences 0199 Other natural and physical sciences 05 Agriculture, environmental and related studies 06 Health 0907 Behavioural science 090701 Psychology

30 Gendered pathways into the post-secondary study of science
Building researcher capacity initiative This paper is produced as part of NCVER’s building researcher capacity initiative, which is funded
under the National Vocational Education and Training Research (NVETR) Program. The NVETR Program
is coordinated and managed by NCVER on behalf of the Australian Government and state and territory
governments. Funding is provided through the Department of Industry.
The aims of the building researcher capacity initiative are to attract experienced researchers from
outside the sector, encourage early career researchers and support people in the sector to undertake
research.
The building researcher capacity initiative includes the following programs: NCVER fellowships, PhD
top-up scholarships, postgraduate research papers and community of practice scholarships for VET
practitioners. These grants are awarded to individuals through a selection process and are subject to
NCVER’s quality assurance process, including peer review.


National Centre for Vocational Education Research Ltd
Level 11, 33 King William Street, Adelaide, South Australia
PO Box 8288, Station Arcade, SA 5000 Australia
Telephone +61 8 8230 8400 Facsimile +61 8 8212 3436
Web www.ncver.edu.au Email [email protected]