Fort Worth to Laredo High-Speed Transportation Study
51
Fort Worth to Laredo High-Speed Transportation Study Task 2 Technology Review and Design Criteria April 2020 FINAL
Transcript of Fort Worth to Laredo High-Speed Transportation Study

Fort Worth to Laredo High-Speed Transportation Study
Task 2
Technology Review and Design Criteria
April 2020 FINAL


This page intentionally blank.

Fort Worth to Laredo High-Speed Transportation Study
FINAL 1 April 2020
Contents
1. Fort Worth to Laredo High-Speed Transportation Study Overview ............................................................................................... 3
1.1. Background ...................................................................................................................................................................................................... 3
1.2. Purpose of the Technology Review and Design Criteria Memorandum ........................................................................ 3
2. Technical Readiness/Maturity Assessment Methodology .................................................................................................................. 3
3. Guaranteed Transit .................................................................................................................................................................................................... 5
3.1. State of the Technology ........................................................................................................................................................................... 5
3.2. Operational Characteristics .................................................................................................................................................................... 5
3.3. Design and Engineering Characteristics ......................................................................................................................................... 7
3.4. Conclusions and Relevance to the Study ....................................................................................................................................... 8
4. Conventional Passenger Rail Technology .................................................................................................................................................... 8
4.1. State of the technology ............................................................................................................................................................................. 8
4.2. Operational Characteristics .................................................................................................................................................................... 9
4.3. Design and Engineering Characteristics ...................................................................................................................................... 12
4.4. Conclusions and Relevance to the Study .................................................................................................................................... 18
5. High-Speed and Higher-Speed Rail Technology ................................................................................................................................... 18
5.1. State of the Technology ........................................................................................................................................................................ 18
5.2. Operational Characteristics ................................................................................................................................................................. 19
5.3. Design and Engineering Characteristics ...................................................................................................................................... 22
5.4. Conclusions and Relevance to the Study .................................................................................................................................... 26
6. Magnetic Levitation (Maglev) Train ................................................................................................................................................................ 26
6.1. State of the Technology ........................................................................................................................................................................ 26
6.2. Operational Characteristics ................................................................................................................................................................. 27
6.3. Design and Engineering Characteristics ...................................................................................................................................... 29
6.4. Conclusions and Relevance to the Study .................................................................................................................................... 33
7. Hyperloop (Next Generation Magnetic Levitation) ................................................................................................................................ 34
7.1. State of the technology .......................................................................................................................................................................... 34
7.2. Operational Characteristics ................................................................................................................................................................. 36
7.3. Design and Engineering Characteristics ...................................................................................................................................... 38
7.4. Conclusions and Relevance to the Study .................................................................................................................................... 44
Appendix A: Technology Review and Design Criteria Summary Table ................................................................................................. 45
Appendix B: Technology Review and Operational Characteristics Summary Table ..................................................................... 48

Fort Worth to Laredo High-Speed Transportation Study
FINAL 2 April 2020
List of Tables Table 1: Technology Readiness Level Definitions ............................................................................................................................ 4 Table 2: Guaranteed Transit Technology Readiness Level ......................................................................................................... 5 Table 3: Conventional Passenger Rail Technology Readiness Level .................................................................................... 9 Table 4: Conventional Commuter Rail Service in Texas ............................................................................................................. 10 Table 5: Conventional Commuter Rail Service Operating Budgets in Texas ................................................................. 17 Table 6: HrSR and HSR Technology Readiness Levels .............................................................................................................. 19 Table 7: Typical Trainset Capacities ...................................................................................................................................................... 19 Table 8: Minimum Curve Radii .................................................................................................................................................................... 23 Table 9: HrSR and HSR Project Capital Costs per Mile (adjusted 2019 USD) ................................................................ 26 Table 10: Maglev Technology Readiness Level .............................................................................................................................. 27 Table 11: Hyperloop Studies ...................................................................................................................................................................... 35 Table 12: Test Tracks in Development/Early Deployment ........................................................................................................ 35 Table 13: Hyperloop Company Technology Readiness Level ................................................................................................ 36
List of Figures Figure 1: Vonlane Seating Arrangement ................................................................................................................................................ 6 Figure 2: Vonlane Passenger Amenities ................................................................................................................................................. 6 Figure 3: Texas Amtrak Routes .................................................................................................................................................................... 9 Figure 4: TEXRail DMU Vehicle Interior ................................................................................................................................................. 11 Figure 5: Rail Platform for both Conventional Passenger Rail and Light Rail .................................................................. 12 Figure 6: Conventional Passenger Rail Typical Section Images ............................................................................................ 13 Figure 7: Trinity Railway Express Diesel Electric Vehicle ............................................................................................................ 14 Figure 8: Trinity Metro’s DMU Vehicle ................................................................................................................................................... 15 Figure 9: Amtrak Acela Express Electric Rail Vehicle ................................................................................................................... 16 Figure 10: Shinkansen N700 Interior ..................................................................................................................................................... 20 Figure 11: Typical HSR Right-of-Way Section ................................................................................................................................. 22 Figure 12: Virgin Brightline Train ............................................................................................................................................................... 24 Figure 13: JR Shinkansen N700 with Overhead Contact System ........................................................................................ 24 Figure 14: Incheon Airport Maglev .......................................................................................................................................................... 28 Figure 15: Shanghai Maglev Interior ....................................................................................................................................................... 28 Figure 16: Comparison of Electromagnetic (Left) and Electrodynamic Suspensions (Right) ............................... 30 Figure 17: Inductive Power Diagram Used for the Baltimore-Washington SCMaglev Project............................. 30 Figure 18: Baltimore-Washington Superconducting Maglev Typical Section ............................................................... 31 Figure 19: Shanghai Maglev in Station ................................................................................................................................................. 32 Figure 20: Conceptual Layout of Maintenance Facilities ........................................................................................................... 33 Figure 21: Virgin Hyperloop One Pod Interior Mock-up ............................................................................................................. 37 Figure 22: TransPod Prototype Guideway on Piers Cross-section ..................................................................................... 40 Figure 23: Hyperloop Transportation Technology’s Quintero One ..................................................................................... 42 Figure 24: Conceptual Hyperloop On/Off Ramp Tubes .............................................................................................................. 43

Fort Worth to Laredo High-Speed Transportation Study
FINAL 3 April 2020
1. Fort Worth to Laredo High-Speed Transportation Study Overview 1.1. Background The purpose of the Fort Worth to Laredo High-Speed Transportation Study is to study high-speed transportation options to connect six metropolitan areas in Texas: Fort Worth, Waco, Killeen/Temple, Austin, San Antonio, and Laredo. The study evaluates technology options and assesses potential corridors and stations locations for a future National Environmental Policy Act (NEPA) process.
The analysis is being led by the North Central Texas Council of Governments (NCTCOG) in partnership with the Waco Metropolitan Planning Organization (MPO), Killeen-Temple MPO, Capital Area MPO, Alamo Area MPO, and the Laredo MPO.
1.2. Purpose of the Technology Review and Design Criteria Memorandum The Task 2 Technology Review and Design Criteria Memorandum conducted a review of technology literature, design and operational characteristics of existing transportation systems. The Task 2 Memorandum provides a foundational level of quantitative and qualitative information to be utilized in the later Task 4 Alternatives Analysis Memorandum. The review includes a brief history of the technology, key design criteria, potential infrastructure integration solutions, and potential regulatory and financing feasibility. Additionally, Appendix A and Appendix B include summary tables of design criteria and operational characteristics.
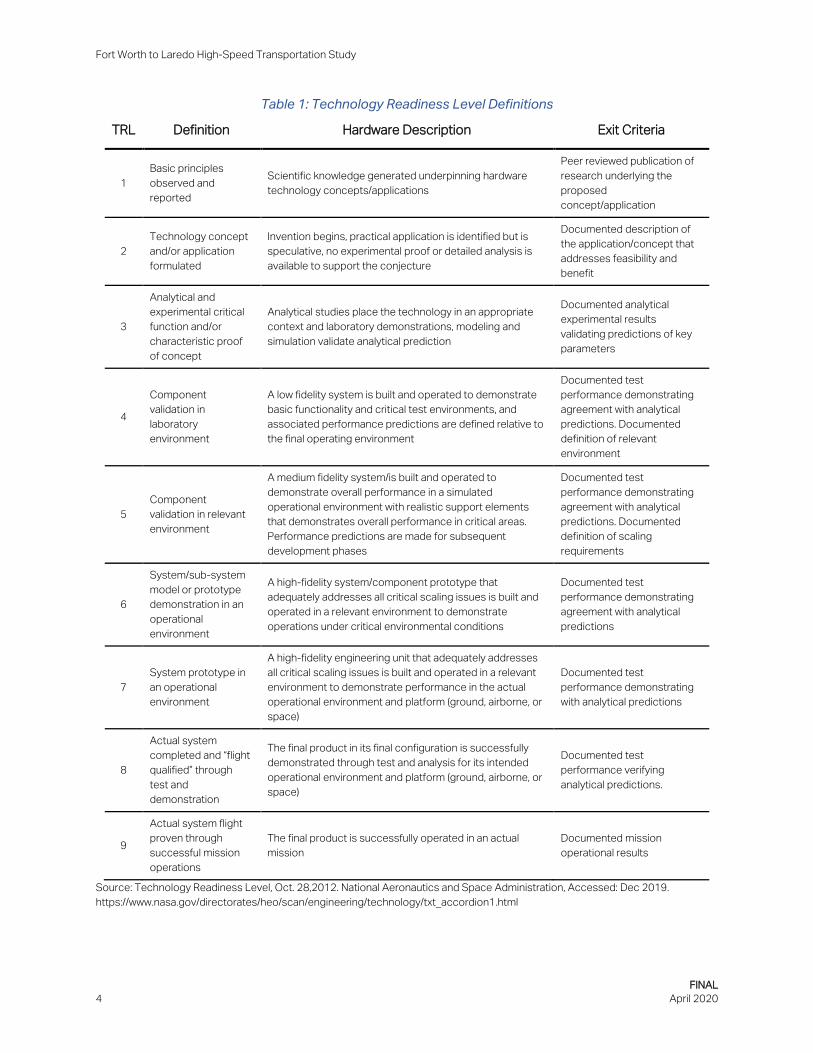
2. Technical Readiness/Maturity Assessment Methodology For each reviewed technology, an assessment of readiness and/or maturity was conducted adopted from the Technology Readiness Levels (TRL) assessment developed by the National Aeronautics and Space Administration in 1989. The TRLs describe the state of a technology based on its current state of research, development, implementation, and/or regular use. Each technology was evaluated against parameters set by the TRL assessment then assigned a rating based on the progression of the technology. Table 1 displays the TRL ratings and screening criteria.
Fort Worth to Laredo High-Speed Transportation Study
FINAL 4 April 2020
Table 1: Technology Readiness Level Definitions
TRL Definition Hardware Description Exit Criteria
1 Basic principles observed and reported
Scientific knowledge generated underpinning hardware technology concepts/applications
Peer reviewed publication of research underlying the proposed concept/application
2 Technology concept and/or application formulated
Invention begins, practical application is identified but is speculative, no experimental proof or detailed analysis is available to support the conjecture
Documented description of the application/concept that addresses feasibility and benefit
3
Analytical and experimental critical function and/or characteristic proof of concept
Analytical studies place the technology in an appropriate context and laboratory demonstrations, modeling and simulation validate analytical prediction
Documented analytical experimental results validating predictions of key parameters
4
Component validation in laboratory environment
A low fidelity system is built and operated to demonstrate basic functionality and critical test environments, and associated performance predictions are defined relative to the final operating environment
Documented test performance demonstrating agreement with analytical predictions. Documented definition of relevant environment
5 Component validation in relevant environment
A medium fidelity system/is built and operated to demonstrate overall performance in a simulated operational environment with realistic support elements that demonstrates overall performance in critical areas. Performance predictions are made for subsequent development phases
Documented test performance demonstrating agreement with analytical predictions. Documented definition of scaling requirements
6
System/sub-system model or prototype demonstration in an operational environment
A high-fidelity system/component prototype that adequately addresses all critical scaling issues is built and operated in a relevant environment to demonstrate operations under critical environmental conditions
Documented test performance demonstrating agreement with analytical predictions
7 System prototype in an operational environment
A high-fidelity engineering unit that adequately addresses all critical scaling issues is built and operated in a relevant environment to demonstrate performance in the actual operational environment and platform (ground, airborne, or space)
Documented test performance demonstrating with analytical predictions
8
Actual system completed and “flight qualified” through test and demonstration
The final product in its final configuration is successfully demonstrated through test and analysis for its intended operational environment and platform (ground, airborne, or space)
Documented test performance verifying analytical predictions.
9
Actual system flight proven through successful mission operations
The final product is successfully operated in an actual mission
Documented mission operational results
Source: Technology Readiness Level, Oct. 28,2012. National Aeronautics and Space Administration, Accessed: Dec 2019. https://www.nasa.gov/directorates/heo/scan/engineering/technology/txt_accordion1.html

Fort Worth to Laredo High-Speed Transportation Study
FINAL 5 April 2020
3. Guaranteed Transit 3.1. State of the Technology Guaranteed transit is an operational concept using transit buses in managed lanes or dedicated right-of-way for intercity travel. The concept would “guarantee” trips would be on-time within set parameters. By operating in managed lanes, delays related to traffic, roadway construction, or vehicle accidents could be mitigated, allowing buses to operate at optimal speeds during trips. As technology in automated and connected vehicles and electrified vehicles become more mature, guaranteed transit vehicles could adopt those technologies. Additionally, the service could offer enhanced passenger amenities for travelers such as, food and beverage service, restrooms, and wireless internet.
The concept is not yet widely deployed; however, notable implementation concepts exist in the Dallas-Fort Worth region. NCTCOG is working with regional transit providers, Dallas Area Rapid Transit (DART), Denton County Transit Authority, and Trinity Metro, to develop pilot projects on I-635, I-30, and I-35W. Each pilot project utilizes a stretch of highway with a managed lane system to be utilized for guaranteed transit buses. Responsibility for operating and maintaining guaranteed transit service are still undetermined. Regional transit providers are working to implement pilot programs along three different managed lane corridors:
• Trinity Metro/Denton County Transportation Authority: Utilizing I-35W, connecting downtown Fort Worth to Downtown Denton via Alliance Airport. The portion of this corridor from downtown Fort-Worth to Alliance Airport is currently in an active pilot stage.
• Dallas Area Rapid Transit: Utilizing the I-635 corridor, connecting South Garland Transit Center to Dallas-Fort Worth International Airport
• Dallas Area Rapid Transit / Trinity Metro: Utilizing the I-30 corridor, connecting downtown Dallas and downtown Fort Worth via Grand Prairie and Arlington.
Technology Readiness/Maturity There are three primary components of the guaranteed transit concept which need to be available to the market, or technological mature, for the service to function as intended: managed lanes, dynamic pricing, and modernized transit vehicles. These components are technology ready and exist in the Texas market. Texas Department of Transportation and the various tollroad authority operate managed lanes, some with dynamic pricing. Though guaranteed transit does not require connected and automated vehicle technology, it could enhance the service through more accurate travel time predictions as the technology becomes more mature. Table 2 shows the TRL scores of the components of guaranteed transit.
Table 2: Guaranteed Transit Technology Readiness Level Technology TRL Rating
Managed Lanes 9
Dynamic Pricing 9
Modernized Transit Vehicle 9
Connected and Automated Vehicles
7
Source: AECOM, 2019
3.2. Operational Characteristics This section provides a review of how guaranteed transit could operate. As guaranteed transit currently exists as a concept, there are limitations in information related to specific operational characteristics

Fort Worth to Laredo High-Speed Transportation Study
FINAL 6 April 2020
Operators and Service Characteristics Guaranteed transit as a concept is still in development stages; therefore, many characteristics relating to bus operations, headways and frequencies, and fares are still unknown. However, the concept could operate with headways up to every 15 minutes or more dependent on demand. Standard over-the-road coaches capable of transporting approximately 35 to 50 passengers, depending on the arrangement of seats and availability of amenities, would be used to operate the service. Total rider throughput would be dependent on the number of buses operating in the managed lane at a given time and the hours of operation.
Customers utilizing guaranteed transit could expect a high-quality, on-time timed bus transit experience with additional amenities to increase customer comfort and convenience both in and out of vehicles. Onboard amenities could include restrooms, food and beverage service, enhanced and larger seating areas, wireless internet, and workspace trays and tables. Private bus operators currently serve routes between Fort Worth, Austin, Houston, and San Antonio and provide passenger amenities similar to those described for guaranteed transit, as shown in Figures 1 and 2.
Figure 1: Vonlane Seating Arrangement
Source: Vonlane. Prevost X-Model Seat Layout. https://vonlane.com/index/about#layout. Accessed February 2020.
Figure 2: Vonlane Passenger Amenities
Source: Vonlane. Photo Gallery. https://vonlane.com/index/gallery#photos. Accessed February 2020.

Fort Worth to Laredo High-Speed Transportation Study
FINAL 7 April 2020
Private bus services typically charge fares ranging between $30 to $100, depending on amenities, bus type, and length of trip. Vehicles operate in general purpose vehicle lanes and can be subject to traffic congestion and delay.
Station Areas and Connectivity Operational aspects of guaranteed transit stations are currently unknown. Park-and-rides could act as stations for commuters travelling into central business districts or major employment centers. Both urban and suburban stations should be interconnected into local transportation services and support multi-modal connectivity.
Environmental Considerations Potential environmental impacts would depend on the implementation of guaranteed transit and primarily the existence or lack of a managed lane highway system. In areas where managed lanes exist, the primary environmental impact would be from the emissions of the vehicle. However, in locations where a managed lane system does not exist, a full NEPA process could be required for the design and construction of managed lanes. This could require new right-of-way, or repurposing of right-of-way, to accommodate guaranteed transit service.
3.3. Design and Engineering Characteristics This section provides details regarding requirements necessary for the design and implementation of the transportation technology.
Guideway A guaranteed transit system would generally operate in a dedicated right-of-way or managed lane systems that serve intercity and regional vehicle and commuter traffic. In Texas, managed lanes have primarily developed within the major urban centers of Dallas, Fort Worth, Austin, San Antonio, and Houston to provide high level of service through dynamic tolling. Level of service is maintained by increasing or decreasing tolling price for use of the managed lane system. A managed lane system is fully closed with dedicated on and off-ramps. The systems often feature one or two travel lanes in each direction separated by a concrete barrier; some systems utilize a single travel lane that is reversible for peak hour travel.
As managed lane systems are designed to TxDOT standards, guaranteed transit vehicles would operate within at least a 12-foot lane width, typically found at freeway speeds. The lane could be reduced to 11 feet in areas with more limited right-of-way.
Vehicles Guaranteed transit would use standard or high-end over-the-road coaches. Capacities for vehicles range from 35 to 50 passengers with varying amenities. Propulsion technology would vary, depending on the stage of guaranteed transit maturity. At the current stage, vehicles would utilize typical engines found in commuter buses. As vehicle technology matures, future guaranteed transit vehicles could be fully electric and/or connected and automated.
Stations Station footprint, siting, and access for guaranteed transit are evolving concepts. Managed lane systems are complex transportation infrastructure integrated into large highway systems with limited right-of-way, and therefore, integrating a station location accommodating vehicles, passengers, and the necessities for ticketing boarding and alighting would be design challenges. A guaranteed transit service could locate stations adjacent or nearby highways and access points. Other station concepts envision potential center of the median stations; direct and dedicated access for ingress or egress could be introduced via slip ramps. However, the cost and impact of building center median stations and dedicated ramps are high and may involve modifying overpasses and constructing new bridges for station access.
Comparatively, highways adjacent stations would require fewer infrastructure improvements. and could resemble existing transit park-and-ride stations. In these locations multi-modal connectivity would be essential.
Ancillary Facilities Ancillary facilities for guaranteed transit would be similar to existing bus transit facilities such as maintenance and administrative facilities already in operation for a typical transit agency. A review of urban maintenance facilities for

Fort Worth to Laredo High-Speed Transportation Study
FINAL 8 April 2020
Greyhound buses in Downtown Dallas and Dallas Area Rapid Transit’s (DART) smallest maintenance facility in East Dallas, are both approximately five and seven acres, respectively. Therefore, as reference, approximately five acres would be needed for a fleet size of approximately 40 vehicles.
Cost/Funding Guaranteed transit relies on the existence of a managed lane highway system with dynamic pricing systems. Managed lane systems are known to cost between $115 to $150 million per mile. In cases where managed lanes already exist, the primary remaining cost is for vehicles. Vehicle costs based on industry standards, and depending on upgrades to on-board ride experience, are approximately $700,000 to $1,000,000 per vehicle.
Infrastructure utilized by guaranteed transit would be managed lanes constructed by either a state department of transportation or in conjunction with a tolling authority. Implementation of guaranteed transit would likely require an existing managed lane system. Transit agencies would incur direct costs in the form of vehicles purchasing and development of technological upgrades to the system. Additionally, fare prices would likely vary depending on the transit agency.
3.4. Conclusions and Relevance to the Study Guaranteed transit is the only non-rail technology evaluated in this document and study. It is a developing concept that can leverage advanced technology but is not necessarily a “high-speed” transportation option that can achieve the same high speeds as other technologies. What it does provide is the potential to move a higher volume of passengers at speeds comparable to commuter and higher-speed rail but for fractions of the cost. Additionally, much of the infrastructure necessary to deploy guaranteed transit is already in place or could be easily to put in place.
The primary drawback of guaranteed transit in the context of this specific study is that it does not provide the same level of benefit that all other technologies study provides in terms of speed and time savings, which is one of the primary drivers and justifications for a statewide system. This technology works most effectively between cities that are closer together and as the distance increases, benefits becomes less apparent. In the context of the Fort Worth to Laredo High-Speed Transportation Study, guaranteed transit makes the most sense in city pairs such as Austin and San Antonio but loses effectiveness when considering extending the service to Laredo.
4. Conventional Passenger Rail Technology 4.1. State of the Technology The first transcontinental railroad across the U.S. opened in the late 1860s and gave Americans the opportunity to travel from coast to coast using a modern transportation mode. During the 19th century, with the industrialization of the national economy and the westward expansion of the U.S., the railroad industry became a key element in accelerating population growth and transporting people and commerce.
In the 20th century passenger rail service declined sharply. The number of passenger trains in the U.S. decreased 85 percent between 1929 and 1965. The decline in rail ridership coincided with the rise of automobile ownership following World War II. The development of the Interstate Highway System and airports supplanted travel and transport by rail, resulting in railroad companies exiting the passenger rail industry. To stem the decline in passenger rail service, the Rail Passenger Service Act in 1970 established the National Railroad Passenger Corporation, or Amtrak, to assume control of passenger rail service from private operators. The legislation gave Amtrak priority access to private railroad tracks.
Today, conventional passenger rail service operated by regional government entities is typically paired with Amtrak corridors. Amtrak currently operates in 46 states and, in some regions, it functions as an operator for other transit, or transportation, agencies providing commuter rail services. The financial capacity of Amtrak depends on federal grants and Congressional appropriations. These funding mechanisms are paired with strong regulatory oversight from the Federal Railroad Administration (FRA). Within FRA, the Passenger Rail Division advises commuter and passenger railroads on safety systems programs, design criteria, operations, and procurement of rolling stock.

Fort Worth to Laredo High-Speed Transportation Study
FINAL 9 April 2020
Technology Readiness/Maturity Conventional passenger rail technology readiness was evaluated, as shown in Table 3. As conventional rail is widely adopted and in operation throughout the globe, the technology ranks highest in the TRL ranking.
Table 3: Conventional Passenger Rail Technology Readiness Level
Technology TRL Rating
Diesel and Diesel Electrical Locomotives 9
Electric Locomotive Technology 9
Source: AECOM, 2020
4.2. Operational Characteristics This section provides a review of operators and characteristics of relevant existing conventional passenger rail systems.
Operators and Service Characteristics In the U.S., Amtrak is the primary provider of conventional passenger rail services. The agency operates routes across 46 states with varying speeds, capacities, fares, and service hours. Figure 3 shows a map of the existing Amtrak routes in the Texas. Amtrak routes in Texas typically operate on tracks shared with freight rail that limit service hours and routes. Amtrak operates one north/south route between Fort Worth and San Antonio.
Figure 3: Texas Amtrak Routes
Source: TxDOT. 2016 Texas Rail Plan Update. Executive Summary.

Fort Worth to Laredo High-Speed Transportation Study
FINAL 10 April 2020
Additional passenger rail service in Texas is operated by regional transportation agencies. These agencies offer conventional passenger rail service that provides intercity commuter travel. Table 4 provides a summary of passenger rail services offered. This table does not cover local or light-rail transportation services.
Table 4: Conventional Commuter Rail Service in Texas
Operating Agency Passenger Rail Service
Propulsion Technology Service Area
Capital Metropolitan Transportation Authority, Austin TX
MetroRail, Red Line
Diesel-Multiple Unit
9 stations along 32 miles of track between Leander and downtown Austin Top speed: 60 miles per hour (mph) Average weekday ridership: 2,800
Dallas Area Rapid Transit (DART) and Trinity Metro
Trinity Railway Express
Diesel-electric
Locomotive
10 stations along 34 miles of track between Fort Worth and Dallas Top speed: 79 mph Average weekday ridership: 7,200
Denton County Transportation Authority (DCTA), Denton County, TX
A-train Diesel-
Multiple Unit
5 Denton County Transit Authority stations + 1 Dallas Area Rapid Transit station 21 miles connecting Denton and Dallas Counties Top speed: 60 mph Average weekday ridership: 1,400
Trinity Metro, Tarrant County, Texas
TEXRail Diesel-Multiple Unit
9 stations along 27 miles of track between downtown Fort Worth and DFW International Airport Top speed: 60 mph Average weekday ridership: 1,850
Source: AECOM, 2020
Conventional passenger rail services offered by Amtrak and regional transit agencies operate at varying frequencies depending on peak travel times. Trains typically operate headways ranging from 10 to 30 minutes during peak times and 60 to 120 minutes off-peak. Headways are often influenced by speed, the number of tracks, and temporal separation. Operating speeds are regulated by the FRA by classes of track up to 90 miles per hour. However, a variety of factors can limit speeds even further based on track condition, shared-freight corridors, at-grade crossings, nearby land uses, and station distances.
Conventional passenger train configurations vary considerably across the U.S. A typical trainset operates with four to twelve passenger coaches. A typical single-level rail car can carry around 80 to 95 passengers seated and a bi-level rail car can carry around 115 to 145 passengers seated. Depending on the trainset configuration and headways, conventional passenger rail service has a capacity of 1,000 to 10,000 passengers per hour in one direction. Actual passenger capacity varies between operators based on several factors including, the trainset configuration, frequency of service along the line, and the number of tracks and/or sidings allowing the service to operate in both directions.
Passenger amenities can include a variety of cars for sleeping, dining, and meeting spaces. Trains can be fully fitted for wireless internet with table trays for working and overhead storage for luggage. Amtrak trains include restrooms in each car or in every other car. Locally in Texas, the Trinity Railway Express and TEXRail provide restrooms, while the Denton County Transit Authority A-train and Capital Metro MetroRail do not provide restrooms. Figure 4 shows an interior view of the TEXrail diesel-multiple unit (DMU) trains. Vehicles are designed to meet all requirements outlined in the Americans with Disabilities Act. Ride quality systems include equipment within vehicles and track and are designed and matched to trainset performance to ensure ride comfort and smooth running of vehicles through curves.

Fort Worth to Laredo High-Speed Transportation Study
FINAL 11 April 2020
Figure 4: TEXRail DMU Vehicle Interior
Source: TEXRail, Metro Magazine. Fort Worth ‘FLIRTs’ with New Train Tech for Airport Link. February 2018. Accessed, March 2020: https://www.metro-magazine.com/rail/article/728418/fort-worth-flirts-with-new-train-tech-for-airport-link
Fares for Amtrak vary considerably depending on the origin and destination, as well as the class of ticket purchased. Fares can be as low as $1.50 and can cost over $500 for premium service. According to the Bureau of Transportation Statistics, the average passenger fare for intercity rail / Amtrak in 2018 was approximately $70. The average fare for a one-way trip is approximately $2.50 for the four agencies listed in Table 4.
Amtrak offers express shipping service for small package and commercial deliveries between more than 100 U.S. cities. Many major U.S. stations can handle individual pallets or shipments weighing up to 500 pounds. Bicycles can also be shipped along Amtrak. Typical trainsets will include a vehicle capable of transporting cargo.
Station Areas and Connectivity Conventional passenger rail is a broad term that can include interregional services typically provided by Amtrak or intercity rail service typically provided by local agencies like (Dallas Area Rapid Transit, Trinity Metro, and Denton County Transit Authority). The former generally have station spacing at longer intervals, while latter are more typical in denser corridors with numerous high population destinations.
Interregional conventional passenger rail typically provides service for medium to long distance destinations. These passenger rail stations can link outer lying communities with job rich, high density areas, or key regional attractions. The Amtrak’s Texas Eagle is the longest route operated by the agency, at over 2,700 miles from Chicago, Illinois, to San Antonio and then continuing west to Los Angeles. Within the I-35 corridor, stations are on average approximately 40 miles apart, with some stations ranging approximately 75 miles from its previous stop. Overall the Texas Eagle route serves approximately 295 miles within the I-35 study area from Fort Worth to San Antonio.
Intercity conventional passenger rail, in Texas, is operated through collaborative efforts of local transit agencies. This type of rail service typically serves commuters accessing employment centers and returning home. TEXRail and the Trinity Railway Express operate on corridors that are 27 and 37 miles long, respectively. Each service operates 9 to10

Fort Worth to Laredo High-Speed Transportation Study
FINAL 12 April 2020
stations in those corridors. Stations typically include park and ride options for commuters, as well as, connectivity to local bus routes and bicycle storage facilities. Stations are located in areas that provide passengers connection to key intercity locations, including urban and suburban areas in the corridors. The more frequent station spacing of intercity conventional passenger rail can be used with skip stop service so that end-to-end journey times do not suffer from frequent stops. Skip stop service require passing sidings or double-tracking.
As shown in Figure 5, stations in dense areas, such as downtown transit stations, serve as multi-modal hubs providing conventional passenger rail riders with connections to other high-capacity transit options, such as high-, or higher-speed rail, bus rapid transit, light rail, or additional transportation options from local bus to ride-hailing services, such as Uber or Lyft. These urban stations will also typically support bicyclists and provide multiple pedestrian access points.
Figure 5: Rail Platform for both Conventional Passenger Rail and Light Rail
Source: TxDOT. 2019 Texas Rail Plan. DRAFT. October 2019.
Smaller stations located by park-and-ride lots or suburban town centers may not provide the same level of multi-modal connectivity as the urban commuter rail stations. These stations may be limited to a select number of feeder bus or shuttle routes, ride-hailing services, or drop-off locations for automobiles. Stations may not provide any multi-modal connections, other than connecting passengers to their parked vehicle or a space to picked-up or dropped-off.
4.3. Design and Engineering Characteristics Guideways Typical conventional passenger rail locomotives meet FRA crash safety standards and are authorized to operate in shared right-of-way with freight without waivers. This allows conventional passenger rail to work in most places where existing freight rail operates. Right-of-way requirements vary greatly by technology type, topography, soil, groundwater levels, drainage, operating speeds, construction methods, security requirements, and maintenance responsibilities along with a host of other considerations. Typical right-of-way widths for single track are approximately 55 feet and 100 feet for double tracking. Figure 6 shows a typical double track conventional passenger rail section.

Fort Worth to Laredo High-Speed Transportation Study
FINAL 13 April 2020
Figure 6: Conventional Passenger Rail Typical Section Images
Horizontal clearance specifies the required distances needed to provide safe passage for a moving passenger rail vehicle operating in a shared corridor with freight trains and other rail transit vehicles. Horizontal clearance is also specified between the train and fixed barriers (e.g., walls, fencing) and adjacent paths such as bikes and pedestrian trails. Horizontal clearances, as measured from the centerline of the nearest track, vary based on structure type. Horizontal clearances on shared corridors would normally be dictated by the track owner (typically freight railroad or local transit agency), but generally would be no less than 15 feet from centerline of track.
Vehicles Conventional passenger rail vehicles include:
• Diesel and Diesel-Electric Locomotives • Electric Locomotive Technology
Diesel-electric locomotives for propulsion are in widespread operation throughout North America. Diesel only locomotives are less common in modern trainsets. As push-pull locomotives, the locomotives can be located either in the front or rear of the trainset to facilitate train turnaround. Figure 7 shows the Trinity Railway Express diesel electric locomotive.

Fort Worth to Laredo High-Speed Transportation Study
FINAL 14 April 2020
Figure 7: Trinity Railway Express Diesel Electric Vehicle
Source: Michael Barera, CC BY-SA 4.0, https://commons.wikimedia.org/w/index.php?curid=49439990
DMUs are self-propelled vehicles that can operate on existing commuter rail and freight corridors utilizing standard-gauge tracks. The DMU is a self-contained vehicle with an on-board diesel engine and motors for power generation and propulsion. Two or three DMU vehicles can be connected together to assemble a trainset, as shown in Figure 8.
Compared to diesel locomotives, DMUs are more cost effective in terms of capital and operating costs. Each DMU vehicle is capable of providing its own power without the need for a dedicated locomotive or overhead contact system. DMU trainsets are lighter and more efficient compared to a heavy diesel locomotive. As a result, DMU vehicles are cheaper to purchase and operate than conventional locomotives; accelerate / decelerate quicker, generate less noise, and are more economical to operate on short-distance routes. Also, DMU vehicles emit fewer emissions on short-distance routes than diesel push-pull engines; however, electric multiple units are quieter than DMUs and emit no emissions, which allows rail service to operate at later hours and more frequently, especially near populated areas.

Fort Worth to Laredo High-Speed Transportation Study
FINAL 15 April 2020
Figure 8: Trinity Metro’s DMU Vehicle
Source: Mass Transit. TEXRail Tests Stadler Trains at Dallas/Fort Worth International Airport. October 19, 2018.
Diesel-electric vehicles are often a cost-effective solution for newer or smaller transit agencies. This is due to the additional capital costs necessary to operate electric trainsets. Electric propulsion is more efficient and offers the higher acceleration / deceleration performance over diesel and diesel-electric locomotives. The electric engine type has the least impact to the environment. The primary disadvantage is the high capital cost upfront needed to electrify the rail corridor. Electric vehicles are also cheaper to maintain, but the cost savings is offset by additional maintenance of electrification infrastructure.
Electric locomotives used in commuter rail service operate in a similar manner to diesel and /or diesel electric locomotives. The primary distinction is the additional electrification infrastructure needed to deliver energy to the vehicle. Figure 9 shows the overhead contact system needed for electrification in the background. However, compared to diesel counterparts, electric locomotives offer a range of benefits including quick acceleration, a regenerative braking system, improved frequency due to acceleration efficiency, service frequency, and more station stops. However, in the U.S. train systems using electric locomotives typically have shorter routes to serve urbanized areas. The primary disadvantage of electric locomotives is the substantial capital cost needed to electrify an existing rail corridor. Major infrastructure investment is needed to construct overhead contact wires, power substations, and other ancillary structures.

Fort Worth to Laredo High-Speed Transportation Study
FINAL 16 April 2020
Figure 9: Amtrak Acela Express Electric Rail Vehicle
Source: Amtrak Acela Express. August 4, 2018. Accessed, March 2020: https://www.flickr.com/photos/schonnorris/30100923928.
Stations Depending on the (urban, suburban, rural) context of the station area, stations may be designed for full-service capabilities similar to an airport with ticketing and baggage areas, dining options, and restrooms. Some stations may only require electronic ticketing machines and platforms, and do not have employees located on-site.
Conventional passenger rail station design standards and specifications are generally governed by local building codes, and by trainset length, number of platforms, and the variety of on-board service amenities (first class, business class, etc.). These standards specify typical platform sections (length and boarding height), signage, accessibility, parking, passenger amenities, and traveler information.
An in-line or “local” conventional rail station with passing tracks would typically consist of a siding track with side platform for stopping trains with express tracks located in the middle. Dwell time at the station would typically be approximately three minutes. Conventional rail stations typically provide connections to other transit routes and transportation providers and may or may not contain parking facilities. Conventional rail stations located in areas serving park-and-ride communities, may need to develop surface or garage parking lots to induce ridership. Conventional rail stations can be the cause of induced development and designed to be attractions.
Ancillary Facilities Facilities necessary for conventional passenger rail depend on vehicle type. For all vehicles, a train maintenance facility would be necessary. The most recent conventional passenger rail project in Texas, TEXRail, uses a 27-acre site for its equipment maintenance facility. This site houses and provides all maintenance services for eight trainsets.
For electrified train systems, ancillary facilities could include sub power stations along routes to energize the overhead contact system. Communications facilities and maintenance of way facilities could also be necessary.

Fort Worth to Laredo High-Speed Transportation Study
FINAL 17 April 2020
Costs/Funding The large inventory of past, current, and future conventional passenger rail projects throughout the country have provided an extensive amount of costing data. Table 5 provides a summary of annual operating costs for agencies that operate conventional rail service in Texas. Capital costs for a dedicated right-of-way can be expensive, potentially requiring a long process of private property acquisition. Other capital costs include new track infrastructure, maintenance yards, supporting facilities and wayside equipment, bridging and / or tunneling costs, as well as the cost for new train vehicles.
Table 5: Conventional Commuter Rail Service Annual Operating Budgets in Texas Operating Agency Conventional Passenger Rail
Service Estimated Annual Operating Costs
Capital Metropolitan Transportation Authority, Austin TX MetroRail Red Line Approx. 800,000
Dallas Area Rapid Transit and Trinity Metro Trinity Railway Express Approx. 3.2 million
Denton County Transportation Authority, Denton County TX A-Line Approx. 400,000
Trinity Metro TEXRail Approx. 13 million
Source: Capital Metro Transit Agency, Trinity Metro, Denton County Transportation Authority, Fiscal Year 2020 Budgets. Accessed, March 2020: https://capmetro.org/uploadedFiles/New2016/About_Capital_Metro/Financial_Transparency/Annual_Budgets/Proposed-FY2020-Operating-and-Capital-Budget.pdf https://ridetrinitymetro.org/wp-content/uploads/2020/02/FY20-Business-Plan-Annual-Budget.pdf https://www.dcta.net/sites/default/files/Finance/FY20/DCTA%20Adopted%20FY%202020%20Budget_0.pdf
Most commuter rail in the U.S. operate on existing freight corridors. Even after the required cooperation of railroad companies and FRA waivers to operate multiple unit trains, the capital cost of upgrading an existing rail corridor for commuter rail services is still substantial, with infrastructure improvements, such as new maintenance facilities, right-of-way upgrades, sidings to allow trains to pass, new stations, and boarding platforms.
The Federal Transit Administration (FTA) provides competitive grants through the New Starts and Core Capacity and Small Starts programs to help fund capital investments. The processes for administering the FTA grant programs are extensive. To obtain a fully funded grant agreement for construction, an agency must complete a comprehensive environmental review process that includes studies to evaluate alternatives, selection of a locally preferred alternative, and conceptual engineering design.
Grant funding provided by FTA covers only a portion of the total capital investment. The remaining portion is the responsibility of the local project sponsor(s). In fiscal year 2016, federal capital investment grants totaling $1.62 billion was allocated to five commuter rail projects – at an average cost of $18.3 million per mile. Including other federal funds, the total federal share of project capital funding was 54 percent. State and local sources of funding are needed to cover the remaining share of capital costs. Acceptance and buy-in of elected officials and the community are needed to approve new taxes and / or bonds to raise revenue.
Agencies can receive waivers for non-FRA compliant DMUs by operating vehicles on dedicated right-of-way separate from freight. Agencies can also temporally separate passenger rail service by only operating DMUs at specific times of the day when freight operations cease. Alternatively, the FRA can issue waivers for DMUs that meet alternative safety standards. Examples of commuter rail service that operate DMUs under waiver by the FRA includes Metro Rail operated by Capital Metro in Austin and the A-train operated by the Denton County Transportation Authority in the Dallas-Fort Worth region.
Environmental Considerations Noise and Vibration Noise and vibration sources for conventional passenger rail include the mechanical noise (wheel/rail interface), propulsion noise, and aerodynamic noises (from train nose, wheel region, and pantograph). Typical levels of noise and

Fort Worth to Laredo High-Speed Transportation Study
FINAL 18 April 2020
vibration for conventional passenger rail range between 100 to 60 decibels. Noise and vibration levels for varying classes of railway systems are regulated by the U.S. Department of Transportation.
4.4. Conclusions and Relevance to the Study Currently, a network of intercity and regional conventional passenger rail serves few major corridors in Texas. Regional passenger rail service provided by Amtrak operates a route, primarily along the I-35 corridor, connecting San Antonio and Austin to Fort Worth. However, conventional passenger rail is limited both in coverage (number of routes), but also frequencies and travel time. Historically, service deficiencies are typically a result of shared railway tracks between passenger and freight rail operators leading to on-time performance inconsistencies. Service deficiencies reduce the overall attractiveness of conventional passenger rail especially when compared against other technologies analyzed for the Fort Worth to Laredo High-Speed Transportation Study. As a solution to high-speed transportation issues within the I-35 corridor, conventional passenger rail should be considered as well as significant upgrades to rail infrastructure through passing sidings, improved stations, and operational efficiencies.
5. High-Speed and Higher-Speed Rail Technology 5.1. State of the Technology Around the start of the 20th century, Germany built and tested rail systems capable of reaching 130 mph, and in 1933, trains reaching nearly 100 mph provided service between Hamburg and Berlin. Meanwhile in the U.S., the Zephyr reached speeds of 77 mph (with speeds of 114 mph possible), the Italian ElectroTrenoRapido-200 reached 99 mph (with speeds of 126 mph possible), and the Mallard achieved 125 mph in Great Britain.
In 1964, Japan National Railways began operating the first electrified, intercity high-speed rail (HSR) system in the world, the Tokaido Shinkansen between Tokyo and Osaka. Speeds for the 0-Series Shinkansen achieved 130 mph. The train was introduced not just as a new locomotive, but as a new transportation system incorporating the latest electric motors, automatic train control and centralized traffic control technologies. The success of the Shinkansen HSR system has spurred progressive technological innovation in both Japan and Europe that is proven to be a robust, safe, reliable, and environmentally sustainable system of rolling stock infrastructure.
In the U.S., the Department of Transportation, through the FRA, has described speed characteristics that define higher-speed rail (HrSR) as passenger rail service up to 125 miles per hour and high-speed rail (HSR) as passenger service over 125 mph. As of 2020, no HSR systems operate over 125 mph in the U.S. However, there are both public and private projects being undertaken in California and Texas to operate HSR technology in the country.
Technology Readiness/Maturity Higher- and high-speed rail technologies are deployed and in daily use throughout the world. The technologies have been operating since the early 20th century. In the Northeast Corridor, Amtrak operates the Acela Express capable of 125 mph service, and in Florida, the Virgin Brightline trains operate with HrSR capabilities. Additionally, the technologies are proven safe. The Japan Railway Group has been operating the Shinkansen HSR system for over 50 years with no fatal accidents reported. Therefore, HSR and HrSR technologies received the highest TRL, as described Table 6.

Fort Worth to Laredo High-Speed Transportation Study
FINAL 19 April 2020
Table 6: HrSR and HSR Technology Readiness Levels
Technology TRL Rating
Higher-Speed Rail (Operating Speed up to 150 mph) 9
High-Speed Rail (Operating Speed over 150 mph) 9
Source: AECOM, 2020
5.2. Operational Characteristics Operators and Service Characteristics High-speed and HrSR passenger rail services are developing in both the public and the private sectors in the U.S. Higher-speed rail services are provided primarily by Amtrak in the Northeast Corridor. The Virgin Brightline train is currently the only privately owned, operated, and maintained passenger rail system in the U.S.
Currently there are no HSR services operating in the U.S. Therefore, international examples were reviewed for this memorandum. The operational team reviewed operational characteristics of the following agencies:
• Japanese Rail Group • The French National Railway Company • China Railway Group Company • Deutche Bahn (Intercity Express)
For HSR, most agencies operate rolling stock that achieve speeds between 105 to 175 miles per hour. Based on reviewed existing and planned HSR systems, practical maximum operating speed would be approximately 220 mph. Newer HSR systems were designed to support 205 mph such as the Spanish HSR and Chinese networks; however, operations are generally limited to 186 mph to reduce maintenance requirements and energy consumption.
Like conventional passenger rail systems, headway and frequencies can vary greatly depending on system demand. In dense cities, such as Tokyo, the Shinkansen HSR system has a train arriving and departing every three minutes. Comparatively, the planned Texas Central Railroad HSR system would operate an initial service between Dallas and Houston at 30-minute headways, or a frequency of two trains per hour. As the system matures or demand increases, headways could be increased through operational changes.
HSR systems in Europe and Asia are typically configured for high passenger capacity. Table 7 provides an overview of typical trainset capacities for HSR in Europe and Asia.
Table 7: Typical Trainset Capacities
Trainset Country Typical Trainset Passenger Capacity
Train à Grande Vitesse (TGV) -EuroDuplex
France 500
Eurostar – e320 United Kingdom -
Netherlands 900
Central Japan Railway Company - Shinkansen N700
Japan 1,300
Source: AECOM, 2020

Fort Worth to Laredo High-Speed Transportation Study
FINAL 20 April 2020
Actual passenger capacity varies depending on several factors including, trainset configuration (number of cars and locomotives), frequency of service, and number of tracks and/or passing siding allowing the service to operate in both directions. These factors for HSR operations vary considerably throughout the world.
Passengers riding HSR around the world can expect smooth and efficient rides with ample passenger amenities. Ride quality is controlled by a variety of factors, including high quality suspension systems, high tolerance track geometry and maintenance requirements, and low axle loads that do not deform the track surface. Large radius curves and superelevation of the rails are also carefully designed and matched to trainset performance characteristics to ensure ride comfort and smooth running of vehicles through curves.
Passenger amenities typically include food and beverage services, wireless internet, and sleeping and working space where passengers are free to move around the train car. Trainsets have restrooms, wide doors and aisles (see Figure 10), and platforms are elevated for level boarding and persons with disability compliance, making travel convenient for those with special needs and those with luggage. Some HSR systems include different passenger experiences, such as different classes of comfort based on car, dining cars, sleeping cars, vending machines, meeting spaces on trains, video screens (in seats or in cars), quiet cars, bar cars, and standing areas. Higher-speed trainsets offer similar level of amenities.
Figure 10: Shinkansen N700 Interior
Source: Texas Central. Media Center. Accessed February 2020: https://www.texascentral.com/media-center/.
Passenger fare costs among HSR operators vary by city, region, demand, transportation alternatives, and a myriad of economic factors. However, HSR service generally throughout Asia and Europe range from $0.25 cents to $0.40 cents per mile. Therefore, HSR fares are set to compete with air travel. In some cases where no direct flights are available but train service, costs are even lower. A review of fares found that most range from approximately $40 to less than $150.

Fort Worth to Laredo High-Speed Transportation Study
FINAL 21 April 2020
HSR systems typically carry only passengers; however, some European operators, such as TGV in France, provided postal services until 2015. Additionally, in Japan, the Japanese Railway Group has experimented with carrying food from different parts of the country.
Station Areas and Connectivity Stations should be considered as destinations, and in many cases, a high percentage of users of the stations never board a train. Major train stations are typically developed to include retail, restaurants, newsstands, bars, and other amenities. Typical HSR or HrSR stations can stimulate development in adjacent parcels. Adequate parking facilities with accommodations for overnight and extended parking would be required for intercity services by HSR or HrSR.
Stations adjacent to or within central business districts are more typical in the reviewed HSR systems. However, urban stations often have the most challenges and physical constraints. Any station location decision is a multi-criteria decision and requires a balancing of criterion including future potential economic growth to the region, transit-oriented development, existing transportation network, real estate cost and availability, and station connectivity to activity centers. Alternatively, suburban, or rural typically act as collectors, or park and rides, for commuters to city centers.
Station spacing vary based upon the corridor characteristics, the urban form, and service planning. In a dense corridor with numerous high population cities, such as the Amtrak Northeast Corridor, more frequent station spacing can be used with skip stop service so that end-to-end journey times do not suffer from frequent stops. In general, HSR stations have been observed to be approximately 30 to 50 miles apart in Japan. HrSR stations using the Acela Express in the Northeast corridor as an example are typically 20 to 40 miles apart.
Multi-modal connectivity at stations for HSR and HrSR stations is essential. Stations should be designed to connect with existing local transit networks and provide transportation options to arriving passengers. Adequate pick up and drop off space is required for connections to local transit, ride-hailing services, and personal automobile connections.
Environmental Considerations Noise and Vibration HrSR technology noise and vibration concerns are well known and understood from comparable systems, such as commuter rail. Noise sources for HrSR and HSR include the mechanical noise (wheel/rail interface), propulsion noise, and aerodynamic noises (from train nose, wheel region, and pantograph). With regards to HrSR, with speeds up to approximately 125 miles per hour, aerodynamic noise is often insignificant. Typical noise levels for everyday urban ambient noise is often in the range of 60 to 70 decibels A-weighted (dBA). Vibration generated from HrSR are typically within the 80 to 90 range, which is perceptible but also notably less than heavy construction equipment.
HSR trains generally operate at quieter levels than conventional passenger and freight rail services because of the high technology design attention to aerodynamic performance. Moreover, because of higher operating speeds, the duration of noise impact at any location is shorter when compared to other modes. Because HSR vehicles are electric, the noise levels generated are significantly less than more common diesel locomotives. HSR are also fully grade separated, so auditory warning systems (horns, whistles, and bells) are not required at crossings.
Energy and Emissions Since the inception of HSR, energy efficiency has continuously been improved by building lighter vehicles, streamlining trains, increasing passenger capacity, advancements in engine efficiencies, using regenerative systems, and improving ancillary systems (air conditioning, lighting, etc.). An International Union of Railways study, completed in 2010, on HSR in France and China concluded that the carbon footprint of HSR can be up to 14 times less carbon intensive than car travel and up to 15 times less than aviation travel, even when measured over the full life cycles of planning, construction and operation of the different transport modes.
Many HSR systems produce energy that feeds back into the HSR system and electrical grids. The French TGV HSR system produces its own electricity, with up to eight megawatts of power feedback into the grid. This efficiency can be utilized to increase their share of renewable energy such that carbon dioxide emissions are eliminated.
Fort Worth to Laredo High-Speed Transportation Study
FINAL 22 April 2020
5.3. Design and Engineering Characteristics This section provides a discussion regarding technical aspects of higher and high-speed rail systems. The subsections describe vehicle systems, guideway criteria and track specifications, programmatic elements, and operational characteristics.
Guideway Guideway for HSR and HrSR systems require, right-of-way, security infrastructure, track, and bridges, embankments, or cuts. Due to the operational speed of HSR, the guideway must be a closed system with full grade separation from other transportation networks. Closed systems typically use go over, or under road, railroad, or geographic feature crossings. Extensive use of viaduct or tunneling increase system cost; therefore, ideal geographical conditions for HSR and HrSR are generally flat and straight, or with shallow curves. Comparatively, HrSR can operate at reduced speeds with at-grade conventional rail crossings and often share track with freight rail. The Shinkansen N700 system vehicle operates on 1,435 mm (4 ft 8.5 in.) standard gauge, continuous welded, track. Both ballasted and slab track are used. The HSR system is not interoperable with other transportation technologies.
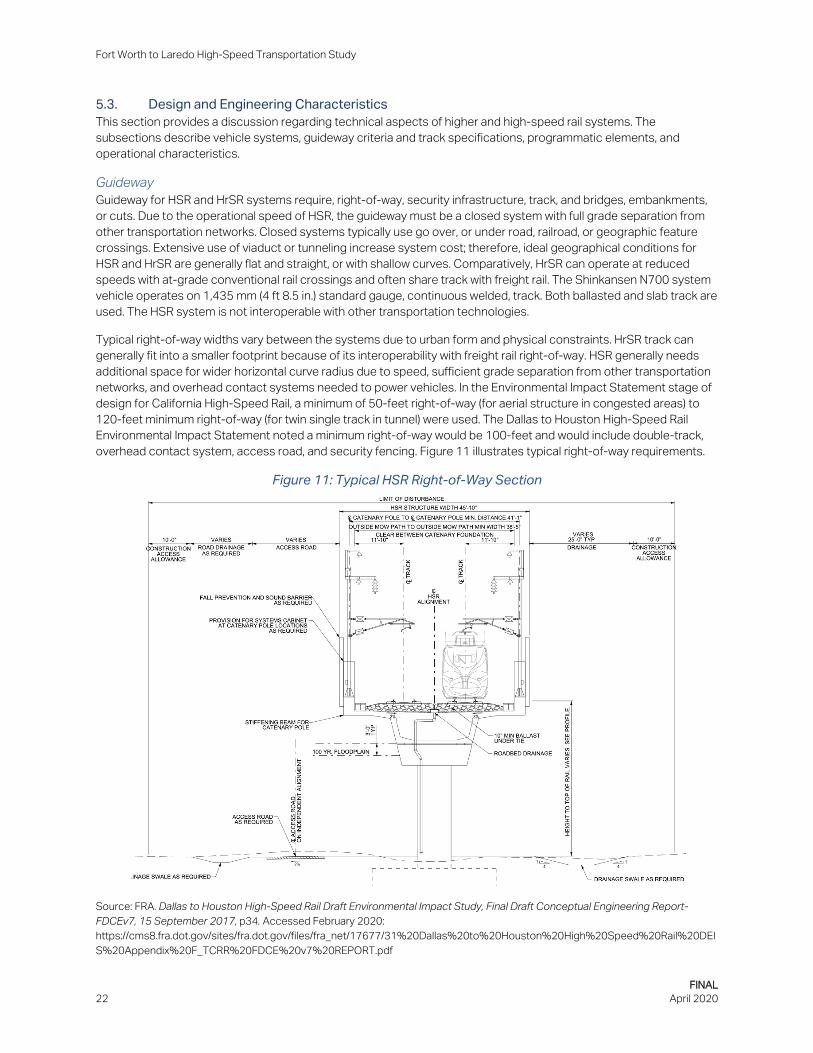
Typical right-of-way widths vary between the systems due to urban form and physical constraints. HrSR track can generally fit into a smaller footprint because of its interoperability with freight rail right-of-way. HSR generally needs additional space for wider horizontal curve radius due to speed, sufficient grade separation from other transportation networks, and overhead contact systems needed to power vehicles. In the Environmental Impact Statement stage of design for California High-Speed Rail, a minimum of 50-feet right-of-way (for aerial structure in congested areas) to 120-feet minimum right-of-way (for twin single track in tunnel) were used. The Dallas to Houston High-Speed Rail Environmental Impact Statement noted a minimum right-of-way would be 100-feet and would include double-track, overhead contact system, access road, and security fencing. Figure 11 illustrates typical right-of-way requirements.
Figure 11: Typical HSR Right-of-Way Section
Source: FRA. Dallas to Houston High-Speed Rail Draft Environmental Impact Study, Final Draft Conceptual Engineering Report-FDCEv7, 15 September 2017, p34. Accessed February 2020: https://cms8.fra.dot.gov/sites/fra.dot.gov/files/fra_net/17677/31%20Dallas%20to%20Houston%20High%20Speed%20Rail%20DEIS%20Appendix%20F_TCRR%20FDCE%20v7%20REPORT.pdf

Fort Worth to Laredo High-Speed Transportation Study
FINAL 23 April 2020
As operational speed increases, HSR and HrSR systems increase radius curves to improve passenger comfort. Larger radius curves allow for HrSR operations which require spiral transition curves to limit the rate of change of lateral acceleration experienced by the passenger. Rail within curves is also superelevated where the outside rail is elevated relative to the inside-rail (banked) allowing for increased speeds and vehicle stability. Table 7 shows maximum super elevation for HrSR and HSR
Tilt train technology is used extensively to achieve higher operating speeds through developed areas where curvature modification is not practicable. Tilt technology adjusts the traincar body towards the inside of the curve to maintain passenger comfort based on passive or active means. Table 8 shows horizontal curve radii by design speed and superelevation limits.
Table 8: Minimum Curve Radii
Design Speed Minimum Radii Based on Superelevation Limits
Desirable Minimum Exceptional miles per
hour km/h feet meters (rounded) feet meters
(rounded) feet meters (rounded)
250 400 45,000 13,700 28,000 8,500 25,000 7,600 220 355 35,000 10,700 22,000 6,700 19,500 6,000 200 320 30,000 9,200 18,000 5,500 16,000 4,900 186 300 25,000 7,600 16,600 4,700 14,000 4,250
<186 <300 25,000 7,600 16,600 4,700 12,600 3,850 175 280 22,000 6,700 14,000 4,200 11,200 3,400 150 240 16,000 4,900 10,000 3,100 8,200 2,500 125 200 10,500 3,200 7,000 2,100 5,700 1,750
Source: California High-Speed Rail Authority. Alignment Design Standards for High-Speed Train Operations TM 2.1.2., April 2009. Accessed February 2020: https://www.hsr.ca.gov/docs/programs/eir_memos/Proj_Guidelines_TM2_1_2R00.pdf
Guideways represent the footprint of HSR and HrSR transportation systems. Therefore, the guideway must be clear of adjacent structures that could obstruct the train as it travels along the tracks. Horizontal clearances are regulated by the FRA with in put from Amtrak for passenger rail. This guidance would apply to HrSR systems with at-grade crossings. Typical horizontal clearances must be minimum 9 foot and 25 foot where track is curved. For HSR systems, right-of-way is typically enclosed in by security fencing to prevent intrusion. Typical clearances used for the Dallas to Houston High-Speed Rail are approximately 12 feet from overhead contact system poles up to 25-foot where right of way is available.
Minimum vertical clearance for both HrSR and HSR, as measured from the outside top of rail, is about 25 feet for systems with an overhead contact system. For HrSR and HSR crossing over interstates a minimum of 18.5 feet is required. Vertical clearance varies based on site-specific conditions.
Vehicles Higher-speed rail trainsets for intercity service are typically locomotive hauled and generally use diesel-electric locomotives where the diesel engine powers an electric motor for tractive effort. As many higher-speed rail systems operate on shared corridors or are developed incrementally from existing services, diesel-electric vehicles are the most cost-effective way to improve service and operate within the constraints of a shared corridor. Ideally, an overhead contact system would be constructed to utilize fully electric trainsets that are faster, lighter, and more efficient; however, overhead wiring often conflicts with freight operations and adds to overall cost. The Virgin Brightline Train is a diesel-electric locomotive operating in a shared corridor with planned speeds of 125 mph between Orlando and Miami, as shown in Figure 12.

Fort Worth to Laredo High-Speed Transportation Study
FINAL 24 April 2020
Figure 12: Virgin Brightline Train
Source: Youtube, User: Coasteran2105, uploaded July 25,2019. Accessed March 2020: https://i.ytimg.com/vi/fQMAfJEUwuU/maxresdefault.jpg
High-speed trainsets are electric vehicles powered by an overhead contact system. Electric vehicles offer greater acceleration, speed, and lighter vehicles for agencies. The overhead contact system is an aerially supported electrical conductor system, that supplies energy from traction power supply facilities to the trainset, through roof-mounted pantographs (see Figure 13). Electrical current flows through the train propulsion system to provide traction to the wheels. The overhead contact system is grounded for safety and protected from lightning. Electric vehicles are often distributed power trainsets, meaning that both passenger coaches and locomotives push and pull the vehicles providing a smoother ride for passengers.
Figure 13: JR Shinkansen N700 with Overhead Contact System
Source: JRRailPass.com, Kyodo New Photographers. Accessed March 2020: https://www.jrailpass.com/blog/shinkasen-n700s

Fort Worth to Laredo High-Speed Transportation Study
FINAL 25 April 2020
Safety of trainsets is an essential part of the vehicle and track infrastructure. In the U.S., FRA standards for crash worthiness have been a barrier to implementation of European or Japanese style HSR systems. The Amtrak Acela trainset complies with FRA Tier II standards for trains operating above 125 mph in mixed train traffic. Until November 2018, the FRA did not have standards for HSR equipment such as that in use worldwide, namely lighter high-performance equipment. With the adoption of the new FRA Tier III standards, the door is now open to more rapid deployment of true HSR systems.
In Japan, the Shinkansen HSR system has been in operation for over 50 years threat of earthquake, hurricane, heat and more, and throughout that time it has only one derailment and no passenger fatalities related to crashes.
Stations HSR station design standards and specifications are influenced by local building codes, on train service amenities, and trainset length. Urban stations are typically larger footprint to accommodate multi-modal connectivity and a larger number of passengers. Suburban and rural stations can have smaller footprints with larger parking areas to provide riders park and ride service. Additionally, stations could use passing tracks adjacent to platforms allowing trains to skip stations for express service. Stations consist of the same basic components for all rail transportation systems. These components include:
• Train platforms • Ticketing areas • Passenger terminals, waiting areas, and amenities (retail, food and beverage, restrooms, security, etc.) • Automobile parking and multi-modal connections
Train platform length vary dependent on trainset configuration, but typically assume a standard eight-car trainset platform approximately 700 to 800 feet long.
Terminals can be large facilities depending on service volumes and operating plans. Multiple tracks would be required for turning of trains and the required cleaning, testing, and commissary stocking that may be required. Additional tracks may also be required for staging of trains. A typical terminal could utilize four to eight tracks with minimum of 30-foot wide island platforms.
Ancillary Facilities Ancillary facilities for high-speed train systems vary dependent on vehicle technology. For HrSR diesel-electric vehicles, any ancillary facilities would be similar to conventional passenger rail. Comparatively, for transportation systems utilizing electric vehicles, additional support systems are required for safe operation. These additional systems include: traction power substations, maintenance-of-way facilities, and communications and signaling facilities.
Traction power substations are located along right-of-way of the track to convert and supply electrical energy to the overhead contact system and on to the trainset. For the Dallas to Houston High-Speed Rail using the Shinkansen N700, traction power substations will be required approximately ever 28 miles.
Maintenance-of-way facilities are locations along the tracks for storing, servicing equipment and for maintenance of the system. Size for these facilities can vary depending on available right-of-way; however, for the Dallas to Houston High-Speed Rail project, most were approximately five acres to service an eight-car trainset that can operate in both directions without turning around.
Communications and signaling facilities would be located at specific intervals adjacent to the right-of-way. Typically, these systems are flexible enough to be integrated into other facilities such as the traction power substations.
Costs/Funding Capital costs vary significantly based project constraints such as geography, level of development, materials and labor costs. A review of costs for several HSR and HrSR projects illustrate the range of costs, as shown in Table 9. Based on publicly available information, it is unclear if observed capital costs include cost of vehicles.

Fort Worth to Laredo High-Speed Transportation Study
FINAL 26 April 2020
Table 9: HrSR and HSR Project Capital Costs per Mile (adjusted 2019 USD)
Project Project Status Cost Per Mile
California High-Speed Rail Phases under construction
~$177 million
High-Speed Two (United Kingdom HSR) Under construction ~$212 million
High-Speed One (United Kingdom HSR) Completed $129 million
Virgin Brightline (All Aboard Florida HrSR) Completed ~$11 million*
Dallas to Houston High-Speed Rail (Texas Central Railroad)
Planning phase ~$64-75 million
Source: AECOM, 2020 *Costs were for upgrading existing freight rail infrastructure for higher-speed rail operations.
HSR and HrSR infrastructure in the U.S. would be large capital projects that would require significant funding sources. The Dallas to Houston High-Speed Rail project has shown the potential for privately funded projects to progress through environmental processes. However, most transportation projects would need to be subsidized through government grants or through public/private partnerships. Recognizing the mounting congestion and environmental costs of highway and aviation systems, the FRA developed the High-Speed Rail Strategic Plan in 2009 to ensure safe and efficient transportation choices, build a foundation for economic competitiveness, promote energy efficiency and environmental quality, and support interconnected, livable communities. This plan along with the American Recovery and Reinvestment Act, Passenger Rail Investment and Improvement Act of 2008, and American Recovery and Reinvestment Act of 2009, encouraged states to invest in and apply for grants for intercity rail travel, including HSR and HrSR. In March 2019, the U.S. Department of Transportation formed a council to support emerging transportation technologies and initiatives dubbed the Non-Traditional and Emerging Transportation Technology Council (NETT Council). The purpose of the council is to help create new regulations to help guide companies seeking to deploy high-speed technologies in the U.S. through the regulatory process. Comparatively, in most counties, there are existing regulatory standards and policies in place for HSR and HrSR.
In the European Union, Railteam, a consortium of European railway operators, coordinates and promotes cross-border HSR travel. A goal of the European Union is to develop and provide trans-Europe high-speed rail and therefore provides government funding to achieve that goal. Similarly, the Chinese government funds HSR development throughout the country.
5.4. Conclusions and Relevance to the Study HSR and HrSR are common place in Europe and Southeast Asia, where the technology has reliably moved a high volume of passengers at high speeds for decades. Public awareness of the technology is also high and does not typically induce the same level of concern that other newer technologies receive. Despite the success of those systems, the technology has still not made its way to the U.S. for a myriad of reasons, such as the difficulty in securing right-of- way, funding, and regulatory reasons. HSR is a proven technology that should be further studied as a potential high-speed transportation solution for the Fort Worth to Laredo corridor.
6. Magnetic Levitation (Maglev) Train 6.1. State of the Technology Magnetic levitation (maglev) is a modern high-speed train system using electromagnetism to guide and propel vehicle and passenger coaches along specialized guideways. propulsion is achieved using two sets of magnets, one to levitate the train off the track and the other to propel the train along the track. The technology has been tested at travel speeds over 400 mph. However, operational speeds would typically be lower.

Fort Worth to Laredo High-Speed Transportation Study
FINAL 27 April 2020
Maglev technology was discovered in 1750; however, it was not until 1966 when the first maglev patent was issued in the U.S. to James Powell and Gordon Danby. In the early 1970s, U.S. maglev development lagged due to the U.S. Department of Transportation placing primary focus on automobiles, trucks, and airplanes. In 1998, the U.S. Transportation Equity Act for the 21st Century stood up the Maglev Development Program intending to demonstrate maglev technology as feasibile alternative transportation mode, and for the U.S. to contend with other countries who were advancing similar high-speed transportation technologies. In compliance with the 1998 legislation, the FRA held a competition for maglev technology demonstration to the American public. In1999, seven states or state-designated authorities were selected to receive funds for pre-construction planning of maglev alternatives. As of 2020, there are no operating maglev systems in the U.S.
Technology Readiness/Maturity Maglev technologies have been in development for decades, and while there are no systems in operation within the U.S., notable maglev systems have been in operation in Germany, Japan, China, and South Korea. One of the earliest examples of operational Maglev is the German Transrapid monorail test facility completed in 1987. The German technology was later implemented as the Shanghai Maglev in China. The Tokyo to Nagoya Chūō Shinkansen Project is currently under construction, and a Baltimore-Washington Superconducting Maglev Project is currently undergoing environmental review. Technology necessary for safe operation of a maglev system is proven and mature, as shown in Table 10.
Table 10: Maglev Technology Readiness Level
Technology TRL Rating
Electromagnetic suspension 8
Electrodynamic suspension 9
Inductrack/magneto-dynamic suspension 9
Source: AECOM, 2020
6.2. Operational Characteristics Operators and Service Characteristics Maglev systems of varying types and lengths are currently in operation in South Korea, China, and Japan. These systems are operated by the Incheon Transit Corporation, Shanghai Maglev Transportation Development Co., Ltd., and the Central Japan Railway Company, respectively. The following provides an overview of the varying characteristics of operational and planned maglev systems.
The Incheon Transit Corporation maglev is a 3.8-mile line serving the the Incheon International Airport in South Korea (see Figure 14). The train operates with two tracks with 15-minute headways and an operating sped of approximately 68 mph. Notably, the Incheon Airport Maglev operates unmanned service. The train primarily serves passengers traveling to and within the airport area. Vehicles for the system utilize electromagnetic suspension and linear induction motors.

Fort Worth to Laredo High-Speed Transportation Study
FINAL 28 April 2020
Figure 14: Incheon Airport Maglev
Source: Minseong Kim. Incheon Airport Maglev. Accessed, March 2020: https://upload.wikimedia.org/wikipedia/commons/thumb/6/6c/Incheon_Airport_Maglev_1-04.jpg/800px-Incheon_Airport_Maglev_1-04.jpg
The Shanghai Maglev line is approximately 19 miles operating at speeds up to 268 mph. The service began providing passenger service from Longyang to Shanghai Pudong International Airport in 2004. The train operates with 15 to 20-minute headways and has a capacity of up 575 passengers. Train car interior are typical of intercity passenger rail service, as shown in Figure 15.
Figure 15: Shanghai Maglev Interior
Source: Visitourchina.com. Maglev Train. 2006. Accessed, March 2020: https://www.visitourchina.com/fileupload/FileUpload/111010150648633.jpg

Fort Worth to Laredo High-Speed Transportation Study
FINAL 29 April 2020
The Chūō Shinkansen superconducting maglev currently under construction from Tokyo to Nagoya, with planned expansion to Osaka will operate with speed anticipated to reach 311 mph. Operations of the line would be similar to the Central Japan Railway Shinkansen HSR system with headways as little as three minutes and high-end passenger amenities. The Chūō Shinkansen train could operate autonomously through ground-based control systems; however, crew members would be aboard for passenger service and emergency response.
In the U.S. maglev trains would classify as FRA Tier IV equipment in a sealed corridor and therefore would not be interoperable with other transportation systems. Additionally, no plans have been identified for freight use on any of the reviewed maglev systems.
Station Areas and Connectivity With speeds up to 300 mph, maglev is capable of filling regional travel gap, making it competitive with highway and air travel in certain corridors between 150 to 500 miles. According to a report by the FRA and the National Maglev Initiative, high-population city pairs between 250 to 500 miles apart and have sufficient commercial and passenger travel volume can warrant the construction costs and receive the most benefits from maglev implementation. Regionally, high opportunity areas for maglev implementation include airports, inland and sea ports, and major dense urban areas such as major transit-oriented development or central business districts.
Maglev could likely have stations that terminate at the outskirts of the major city and thus require additional travel time for travelers to reach their final destination. Downtown and central business districts provide access to more passengers and provide greater time savings for riders, but likely require higher costs associated with land acquisition and other institutional barriers related to building in areas of high population density.
Environmental Considerations Noise and Vibration Maglev technology can reduce noise and vibration levels for passengers due to a lack of contact to the guideway. Vibration from the trains could be lower than HSR technology; however, residents near the Shanghai Maglev and the Japanese test maglev train have often experienced considerable vibrations and noise levels. At moderate speeds, such as those generated in denser developed areas, maglev is significantly less noisy than wheeled systems like rail vehicles or buses. However, at higher speeds (greater than 155 mph), the amount of air passing against maglev vehicles can generate noise levels up to 90 decibels at 100 feet.
Energy Usage and Emissions Maglev systems are low energy consumers because it does not experience energy losses due to mechanical friction. By using electricity, maglev systems eliminate emissions of harmful gases and pollutants. Due to the high energy efficiency, the carbon dioxide emissions from maglev is significantly lower than those from automobiles and airplanes. Maglev trains utilize electricity and therefore do not directly contribute to emissions through their operation, as those emissions would be accounted for during energy production and transmission. Maglev trains are also often elevated above grade, minimizing land disturbance.
Magnetic Field In systems where superconducting magnets and wide air gaps are used, like in the Japanese SC Maglev system, considerable efforts are required to shield passengers from the strong magnetic field. Even though induction values within SC maglev vehicles are four to six times higher than those inside the vehicle, the levels still remain well below the human health protection guidelines.
6.3. Design and Engineering Characteristics Guideway Maglev guideways are specialized infrastructure necessary to levitate and propel vehicles along the routes. Currently, there are three levitation technologies used for levitating maglev systems: electromagnetic suspension, electrodynamic suspension (see Figure 16), and inductrack/magneto-dynamic suspension.

Fort Worth to Laredo High-Speed Transportation Study
FINAL 30 April 2020
Figure 16: Comparison of Electromagnetic (Left) and Electrodynamic Suspensions (Right)
Source: Baltimore-Washington Superconducting Maglev Project. What is SCMaglev?. Accessed, March 2020: https://www.bwmaglev.info/index.php/overview/what-is-scmaglev
Electromagnetic suspension uses attractive forces for levitation. The magnets on the maglev vehicle are attracted to the conductors on the underside of the guideway, allowing the maglev vehicle to levitate off the track. Electromagnetic suspension is the older of the three main levitation technologies and is not used in most current systems. This is because its electromagnets can only conduct electricity when there is a power supply available and vehicles using this system levitate about half-inch above the guideway.
Most common maglev systems use some form of electrodynamic suspension mainly because this technology allows maglev vehicles to levitate about four inches which is much higher than an electromagnetic suspension system. The increase in height above the guideway allows the technology to be more stable and suitable for high-speed operation compared to electromagnetic systems. Electrodynamic suspension uses magnets to create repulsive forces that overcome gravitational forces, which is counter to the way an electromagnetic suspension system works. Another difference between electromagnetic suspension and electrodynamic suspension maglev systems is that electrodynamic suspension systems involve the use of super-cooled superconducting electromagnets which can continue to conduct electricity after the power supply has shut down.
To induce enough currents for levitation, the electrodynamic suspension system must maintain a speed of 62 mph or greater. Therefore, maglev vehicles must roll on rubber tires until it reaches a speed of 62 mph. Although wheels are needed, operationally, this feature could double as a safety feature in the event of a power outage. The superconducting maglev is a Japan Railway Group proprietary maglev system that uses electrodynamic suspension. Acceleration and deceleration of the SCMaglev are computer controlled. This system is proposed in the Baltimore-Washington SCMaglev Project, as shown in Figure 17.
Figure 17: Inductive Power Diagram Used for the Baltimore-Washington SCMaglev Project
Source: Central Japan railway Company, About SCMaglev. Accessed, March 2020: https://scmaglev.jr-central-global.com/about/

Fort Worth to Laredo High-Speed Transportation Study
FINAL 31 April 2020
The inductrack system is a newer type of electrodynamic suspension system that uses permanent room-temperature magnets. Inductrack addresses the problem of permanent magnets inability to create enough levitating force by arranging the magnets in a specific arrangement called a Halbach array. The Halbach arrangement intensifies the magnetic field and ultimately levitates the maglev vehicle higher than other methods of magnetic levitation.
Right-of-Way Requirements Maglev systems operate in fully closed guideways; therefore, full grade separation through viaduct or tunneling is required. Typical right-of-way widths range for 72 feet to 100 feet. Figure 18 shows a typical section from the Baltimore-Washing Superconducting Maglev Project.
Figure 18: Baltimore-Washington Superconducting Maglev Typical Section
Source: FRA. Baltimore-Washington Superconducting Maglev Project Final Alternatives Report Nov 2018, p84. Accessed, February 2020: https://www.bwmaglev.info/images/document_library/reports/alternatives_report/SCMAGLEV_Alts_Report_Body-Append-A-B-C_Nov2018.pdf

Fort Worth to Laredo High-Speed Transportation Study
FINAL 32 April 2020
Due to their high operating speeds, maglev require greater horizontal curvature. The top speed of the fastest commercial bullet train (Shanghai Maglev) is 268 mph and requires a banked curve with a radius of 2.7 miles with superelevation to ensure the comfort of passengers. However, a desired horizontal curve radius could be as large as 10 miles (52,800 feet) as stated in the Baltimore-Washington Superconducting Maglev Project Environmental Impact Statement.
Vertical grade and clearances would be similar to HSR. The minimum vertical clearance is 18 feet and minimum 20 feet clearance for areas with pedestrians. The maximum grade for maglev technology is four percent.
Vehicles Maglev vehicles can be propelled by two different types of motors, linear induction or linear synchronous.
A linear induction motor has the same two main parts as a rotary motor: a stator and a rotor; however, the rotor does not rotate but instead moves in a straight line along the length of the stator. For maglev linear induction motor systems, magnetic fields are generated by the stator across an air gap, generating electromotive forces which thrust the vehicle forward.
The linear synchronous motor is similar to the linear induction motor except the synchronous motor has a magnetic source within itself. The thrust force is created by the interaction between the magnetic field and the currents. The speed of the maglev vehicle is controlled by the frequency of the controller. The linear synchronous motor system is preferred for maglev vehicles because it has a higher efficiency and power factor than the linear induction motor.
Stations Station design requirements typically include an information counter, efficient access and circulation of large volumes of passengers horizontally and vertically (escalators, elevators, or other types of people mover system), support connections to other modes of transportation (including light rail, bus, shuttle, and ride-hailing), a ticketing lobby or kiosk(s), passenger waiting areas, maintenance vehicle access, passenger and commercial drop off/pick up, and parking/car rental areas. Additionally, maglev stations may also serve as destinations for purposes other than rail passenger stations. Large train stations can also contain functions such as commercial and retail space, and in some cases the local community may use the station more for other purposes than rail travel. For the Chūō Shinkansen maglev system, Central Japan Rail Group is preparing a new ticket selling system based on the premise of only offering reserved seating. Station amenities would be anticipated to be similar to other Shinkansen stations in Japan. Figure 19 shows the Shanghai Maglev station terminal area.
Figure 19: Shanghai Maglev in Station
Source: ChinaDiscovery.com. Accessed, March 2020: https://www.chinadiscovery.com/assets/images/shanghai/transport/shanghai-maglev-train-station.jpg

Fort Worth to Laredo High-Speed Transportation Study
FINAL 33 April 2020
Ancillary Facilities Ancillary facilities for Maglev would include typical train maintenance facilities, ventilation structures (for use in tunnels and for emergency egress), and traction power substations, similar to HSR trainsets. Figure 20 illustrates a conceptual layout of maintenance facilities necessary for the Baltimore–Washington Superconducting Maglev. A site composed of all supporting facilities in one location would require approximately 124 acres. The maintenance-of-way facility would require approximately 7.4 acres of the total acreage.
Figure 20: Conceptual Layout of Maintenance Facilities
Source: FRA. Baltimore-Washington Superconducting Maglev Project. Final Alternatives Report. November 2018.
Costs/Funding Planning level Information found regarding superconducting maglev projects include Baltimore-Washington and Chūō Shinkansen, both projects include significant amount of tunnelling and right-of-way costs due to their locations. Therefore, capital costs could vary greatly for this technology. Estimated capital costs are anticipated to be approximately $265 million per mile (adjusted 2019 USD).
Federal initiatives have supported many efforts to develop maglev technology in America. Since 1998, the total federal funding obligated to American maglev technology development for transportation purposes has amounted to approximately $30 million. However, funding has been limited since then and FRA has generally not pursued the maglev concept. One of the few U.S. maglev projects currently receiving federal funding is the Baltimore–Washington SC Maglev Project.
In the U.S., maglev implementation suffers from high capital costs, lack of interoperability with existing rail infrastructure, and modest travel time and cost savings versus commercial air service and high-speed rail. To date, technical and commercial viability has been proven in overseas deployments. The most ambitious project, the Japan Central Railroad Tokyo-Osaka route, is set to open in 2027.
6.4. Conclusions and Relevance to the Study Maglev is a well understood and respected technology that has been pushing the boundary of high-speed transportation for decades in places outside of the U.S. The operational system in China, and developing systems in Japan and Europe, have shown the technology is feasible and safe. Maglev provides high-speed performance, electrification, and mature safety systems and operations in a package that is recognizable and easily understood by regulators and the public. However, despite its success in international markets, the technology has not yet been adopted or deployed in the U.S. and thus has struggled to overcome implementation barriers. Like most of the other technologies studied in this effort, issues arise in the ability for local, state, federal, and private entities to secure the appropriate land and financing to fully execute the projects.

Fort Worth to Laredo High-Speed Transportation Study
FINAL 34 April 2020
7. Hyperloop (Next Generation Magnetic Levitation) 7.1. State of the Technology While the concept of vacuum-based transportation has existed for decades, the modern interpretation of hyperloop technology was popularized by the “Hyperloop Alpha” white paper written by Elon Musk and SpaceX in 2013. It advances and builds upon previous technologies such as the Vactrain, conceived in 1909, and evacuated tube transportation technologies. Hyperloop technology is often described as an on-demand and direct-from-origin-to-destination mode of transportation that propels cargo or passenger capsules through a low-pressure and sealed tube at airline speeds. The overall concept involves electrically powered capsules or “pods” that operate autonomously through a series of tubes that are kept at a near-vacuum environment, through a series of air pumps, to replicate the low-pressure environment of the upper atmosphere in which traditional airliners operate. This low-pressure environment allows these capsules to accelerate efficiently on a maglev system and essentially “fly” through the tubes in a low-drag environment, moving both passengers and cargo at speeds upwards of 600 miles per hour.
When SpaceX released the white paper, the company was not yet committed to developing and commercializing the technology, and because of such, open-sourced the design and engineering concepts to the broader public. As a result, multiple technology startups have emerged, developing variations of the technology with aims to commercialize a fully functional system between 2021 and 2030.
In the ensuing six years since the release of the Hyperloop Alpha white paper, the emerging Hyperloop industry has made notable progress in technology development, including SpaceX and Boring Company, which eventually began development of the technology soon after the publication of Hyperloop Alpha. In May of 2017, Virgin Hyperloop One, one of the earliest startups, completed construction of the first full-scale hyperloop test track in the world on a site north of Las Vegas, Nevada. The test track, known as the DevLoop, is a 500-meter test track in which their propriety capsule, the XP-1 Pod, has been publicly demonstrated operating at speeds greater than 200 mph. In early 2019, another startup, Hyperloop Transportation Technologies, announced that construction of their own full-scale hyperloop test track was underway in France.
The only constructed hyperloop facility exists at the DevLoop test track in Nevada; however, several other test tracks are either in design or construction phases, in addition to suitability and planning studies occurring throughout the world. In 2015, Virgin Hyperloop One hosted a global competition where 10 winning routes across the globe were selected as priority corridors to build hyperloop networks, including the following: U.S.: Chicago to Columbus to Pittsburgh, Dallas to Laredo to Houston, Cheyenne to Denver to Pueblo, Miami to Orlando, India: Bengaluru to Chennai, Mumbai to Chennai, United Kingdom: Edinburgh to London, Glasgow to Liverpool, Mexico: Mexico City to Guadalajara, and Canada: Toronto to Montreal. These competitions set the area of emphasis for future hyperloop investment.
In addition to this, several feasibility studies and test tracks are either in the works or have been developed. Studies and agencies are described in Tables 11 and 12. Among the many companies involved in hyperloop technology development, the more established and well-known companies include:
California based, Hyperloop Transportation Technologies formed in 2013, as a crowd-funded collaboration that assembled a team of community members, engineers, and specialists to engineer and deploy hyperloop technology. By February 2015, the company had grown to nearly 200 people and announced it would hold an initial public offering that year to raise $100 million. Hyperloop Transportation Technologies has announced that its full-scale test track will be conducting full-scale passenger trails in 2020.
SpaceX is a private American aerospace manufacturer and space transportation services company head-quartered in Hawthorne, California. It was founded in 2002 by Elon Musk and is often associated as the modern founder of hyperloop technology through the publication of its 2013 white paper, Hyperloop Alpha. Soon after the publication of the white paper, Musk created a new company, the Boring Company, which works extensively with SpaceX to develop hyperloop technology concepts focused on underground tunnels instead of elevated tubes.
TransPod is a Canadian hyperloop company founded in 2015. The company has several partnerships with various aeronautical technology companies and has raised $15 million as of late 2016.

Fort Worth to Laredo High-Speed Transportation Study
FINAL 35 April 2020
Virgin Hyperloop One, formerly known as Hyperloop One, is a private Californian hyperloop technology company that was formed in 2014. The company has raised $295 million as of December 2017 and built the first full scale hyperloop system in the world called the DevLoop.
Table 11: Hyperloop Studies Study Year Completed
Helsinki to Stockholm Feasibility Study 2017 Midwest Mid-Ohio Regional Planning Commission Feasibility Study 2019
Colorado Department of Transportation / Virgin Hyperloop One Feasibility Study 2017
Mumbai-Pune Project (IDP World/Virgin Hyperloop One Cargospeed)
Feasibility Study for Phase 1 Demonstration, began 2017
Washington State-Ultra High-Speed Ground Transportation Study 2017
Port of Los Angeles Hyperloop Feasibility Study 2017 Missouri Hyperloop Feasibility Study 2017 Cleveland-to Chicago Hyperloop Feasibility Study (Public-private-partnership between Northeast Ohio Areawide Coordinating Agency and Hyperloop Transportation Technologies)
2019
Amaravati and Vijaywada, India - Hyperloop Feasibility Study Began 2018 Source: AECOM, 2020.
Table 12: Test Tracks in Development/Early Deployment Agency Status
Virgin Hyperloop One Test Track, Las Vegas Operational
The Boring Company Hyperloop Tunnel, Los Angeles In progress - construction phase
Las Vegas Convention Center Hyperloop Tunnel Pilot In progress - construction phase
Los Angeles, Hyperloop Transportation Technologies In progress - construction phase
Tongren, China, 10-Kilometer Hyperloop Track In progress - planning phase
TransPod 1.9 mile Hyperloop Track in Droux, France In progress - planning phase
Hyperloop Transportation Technologies Ukraine Commercial Hyperloop System In progress - planning phase
Source: AECOM, 2020
Technology Readiness/Maturity Each of the hyperloop companies have developed their technologies at varying rates, from some having full-size capsule prototypes to others engaging in feasibility studies around the globe. Table 13 displays the TRL scores for the differing hyperloop technologies and companies evaluated in this study.

Fort Worth to Laredo High-Speed Transportation Study
FINAL 36 April 2020
Table 13: Hyperloop Company Technology Readiness Level
Technology TRL Rating
Virgin Hyperloop One 6
Hyperloop Transportation Technologies 5
TransPod 3
The Boring Company 5
Source: AECOM, 2020
7.2. Operational Characteristics Operators and Service Characteristics Hyperloop is still a maturing technology with few test tracks and no operational passenger service; therefore, many operational characteristics such as frequencies, headways, and typical fares are theoretical.
Maximum operating speeds specified from the major hyperloop vendors range from 620 mph to 760 mph with a proposed average speed of 600 mph over distances between 300 to 500 miles.
The Hyperloop Alpha white paper predicted hyperloop departures could occur every two minutes on average and every 30 seconds during peak periods, with the assumption that supply and demand are evenly balanced through dynamic pricing strategies (i.e., passengers arrive at a rate equal to the availability of pods). The technology is envisioned to operate on-demand and would not have regular schedules, similar to requesting a smart elevator.
To match the transit capabilities of rail, a competing hyperloop line would need to operate 30 pods per hour, which fits within the above two-minute timeframe. TransPod envisions passenger capacity between to be 28 to 40 passengers per pod, departing every one to two minutes. Hyperloop capsules traveling up to 760 miles per hour will have a maximum deceleration of 0.5 gravitational force (g), which is equivalent to 10.9 mph per second. At that rate of braking, it would take 68.4 seconds for pods to come to a full stop. Because the minimum headway between vehicles should be equal to the distance required for the vehicle to stop safely, the minimum separation of pods is likely to be 80 seconds, which safely allows 45 departures per hour.
Additionally, Space X proposal suggests average capacity would be 840 passengers per hour with pods holding 28 people departing every two minutes. The maximum hourly capacity for hyperloop would be between 1,260 (28 people per pod) and 1,800 (40 people per pod).
The overall passenger experience of riding hyperloop would be similar to the experience of typical airline travel or coach buses. The interior of the capsule is often modeled and illustrated in a manner that strongly reflects inspiration from airline travel, as shown in Figure 21. The experience of boarding the hyperloop is also expected to reflect those of traditional commuter rail or high-speed rail in Europe. There may be a small security or screening gate, but once the passenger arrives to the platform they are free to enter their capsule to begin their journey.
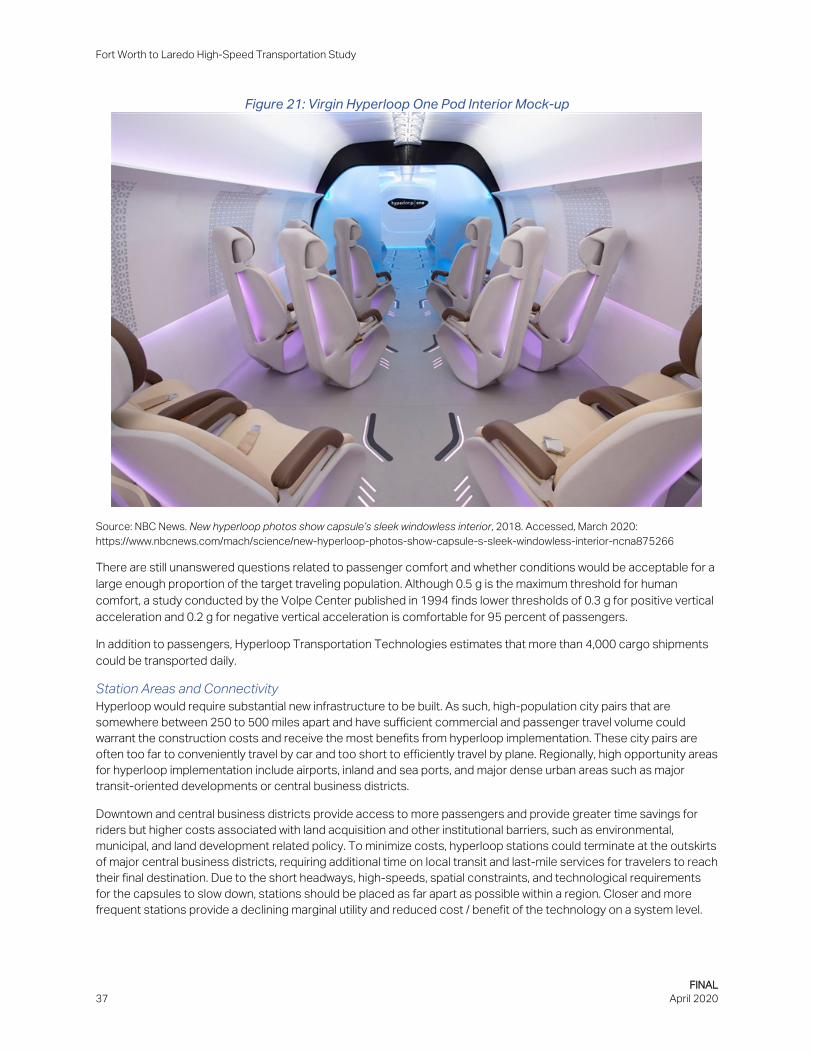
Fort Worth to Laredo High-Speed Transportation Study
FINAL 37 April 2020
Figure 21: Virgin Hyperloop One Pod Interior Mock-up
Source: NBC News. New hyperloop photos show capsule’s sleek windowless interior, 2018. Accessed, March 2020: https://www.nbcnews.com/mach/science/new-hyperloop-photos-show-capsule-s-sleek-windowless-interior-ncna875266
There are still unanswered questions related to passenger comfort and whether conditions would be acceptable for a large enough proportion of the target traveling population. Although 0.5 g is the maximum threshold for human comfort, a study conducted by the Volpe Center published in 1994 finds lower thresholds of 0.3 g for positive vertical acceleration and 0.2 g for negative vertical acceleration is comfortable for 95 percent of passengers.
In addition to passengers, Hyperloop Transportation Technologies estimates that more than 4,000 cargo shipments could be transported daily.
Station Areas and Connectivity Hyperloop would require substantial new infrastructure to be built. As such, high-population city pairs that are somewhere between 250 to 500 miles apart and have sufficient commercial and passenger travel volume could warrant the construction costs and receive the most benefits from hyperloop implementation. These city pairs are often too far to conveniently travel by car and too short to efficiently travel by plane. Regionally, high opportunity areas for hyperloop implementation include airports, inland and sea ports, and major dense urban areas such as major transit-oriented developments or central business districts.
Downtown and central business districts provide access to more passengers and provide greater time savings for riders but higher costs associated with land acquisition and other institutional barriers, such as environmental, municipal, and land development related policy. To minimize costs, hyperloop stations could terminate at the outskirts of major central business districts, requiring additional time on local transit and last-mile services for travelers to reach their final destination. Due to the short headways, high-speeds, spatial constraints, and technological requirements for the capsules to slow down, stations should be placed as far apart as possible within a region. Closer and more frequent stations provide a declining marginal utility and reduced cost / benefit of the technology on a system level.

Fort Worth to Laredo High-Speed Transportation Study
FINAL 38 April 2020
Hyperloop would operate in a unique environment with unique operational constraints; therefore, interoperability with other high-speed transportation modes could be challenging. Changing or transferring between capsules and trains on a shared platform at a multi-modal hub or station would likely be the ideal scenario, minimizing friction for the passenger. However, Virgin Hyperloop One has shared early concepts where small automated vehicles could potentially load themselves directly into the hyperloop capsule in the future, thereby streamlining last mile connectivity with the long-range benefits of the hyperloop network. Other hyperloop companies have mentioned similar concepts, but feasibility and timing remain unknown.
While hyperloop has the ability to use specialized pods to carry freight, a type of mixed-system combining passenger and freight transport has not been tested. It is not yet known if passenger pods could be connected with freight pods.
Environmental Considerations Noise and Vibration At the speeds proposed for hyperloop, there are limited studies on the vibratory and noise. However, potential high noise levels could result from air being compressed and ducted around the pods at near-sonic speeds. This air compression could also cause vibration and jostling for passengers and cargo. However, it is expected that the overall experience is not unlike traditional air travel. From outside the tube, it is expected that, because the capsules are operating in a controlled and sealed environment, noise and vibrations would be minimized compared to that of traditional train systems.
Energy Usage and Emissions According to Musk and SpaceX, the hyperloop system could consume relatively little energy due to rapid acceleration which enables the pods to glide as a passive maglev in a near vacuum. About 10 percent of the route could consume energy and the system is estimated to require 50 megajoules per passenger (rail is over 800 megajoules per passenger and air over 1000 megajoules per passenger). Also, by covering the upper surface of the hyperloop tubes with solar cells, this system is projected to supply about 57 megawatts of electrical power on average, while the hyperloop is expected to consume an approximate average of only 21 megawatts.
Full life-cycle emissions generated during manufacturing of the equipment and construction of the guideway needs to be evaluated to determine the total emissions impacts to compare across alternative transportation modes.
7.3. Design and Engineering Characteristics Guideway Hyperlooop guideways, like maglev, would be specialized infrastructure with no interoperability between transportation technologies. Components of the guideway may include the tube, pylons, vacuum pumps, and emergency egress structures.
Tube footprints are intended to be small, with a set of tubes only requiring approximately 30 to 40 feet of guideway width. However, many unknowns remain about the design and construction of the tube guideways. As hyperloop technologies progress through iteration, many different materials other than the original steel tubing are being experimented with such as concrete and composite materials. Virgin Hyperloop One notes that the design and construction of their tubes are specified to handle 100 pascals of pressure, changes in air pressure, and to safely tolerate small leaks, holes, and even breaches without suffering from reduced structural integrity, tubes will have ability to sectioned off and re-pressurize in the case of a significant emergency.
Additional guideway design elements include:
Steel bracing would be provided to reinforce the tube integrity as vehicles travel inside the tube and to maintain the shape of the tube over time.
Standard galvanized framing would be used to install solar panels on the tube to obtain an overall system energy positive. Solar panels will be positioned according to the optimum angle towards the sun or affixed to a rotating structure to respond to changing sun angles.
A standard catwalk would be built for maintenance activities.

Fort Worth to Laredo High-Speed Transportation Study
FINAL 39 April 2020
For guideway component infrastructure, TransPod has developed a preliminary basis of design that prototypes a guideway on piers and supplemental elements (see Figure 22).
Right-of-way widths are anticipated to be 40 to 100 feet. Theoretically, an elevated hyperloop system on pylons could minimize land acquisition costs through the use of highway medians and other public right-of-way relative to other high-speed transportation technologies. However, operating speeds for hyperloop would necessitate large horizontal curve radii, similar to other high-speed transportation technologies. As no hyperloop has yet to reach full speed on test tracks, necessary estimated curves are still theoretical. Virgin Hyperloop One estimates at 600 mph their horizontal curve radius would require 1.6 miles (8,448 feet). A recently completed feasibility study for hyperloop in the Great Lakes region anticipated that curves must keep gravitational forces felt by passengers to less than 0.28. Vertical clearances would be similar to HSR and maglev, approximately 20-foot clearance.
Virgin Hyperloop One has proposed that, due to the nature of the tube design, noise, vibrations, and other potential concerns, are significantly reduced and controlled, thus allowing for smaller required buffers along the tube itself. Should that potential be realized, hyperloop technology could fit into right-of-way that other modes would find difficult, such as being elevated on highway medians through cities.
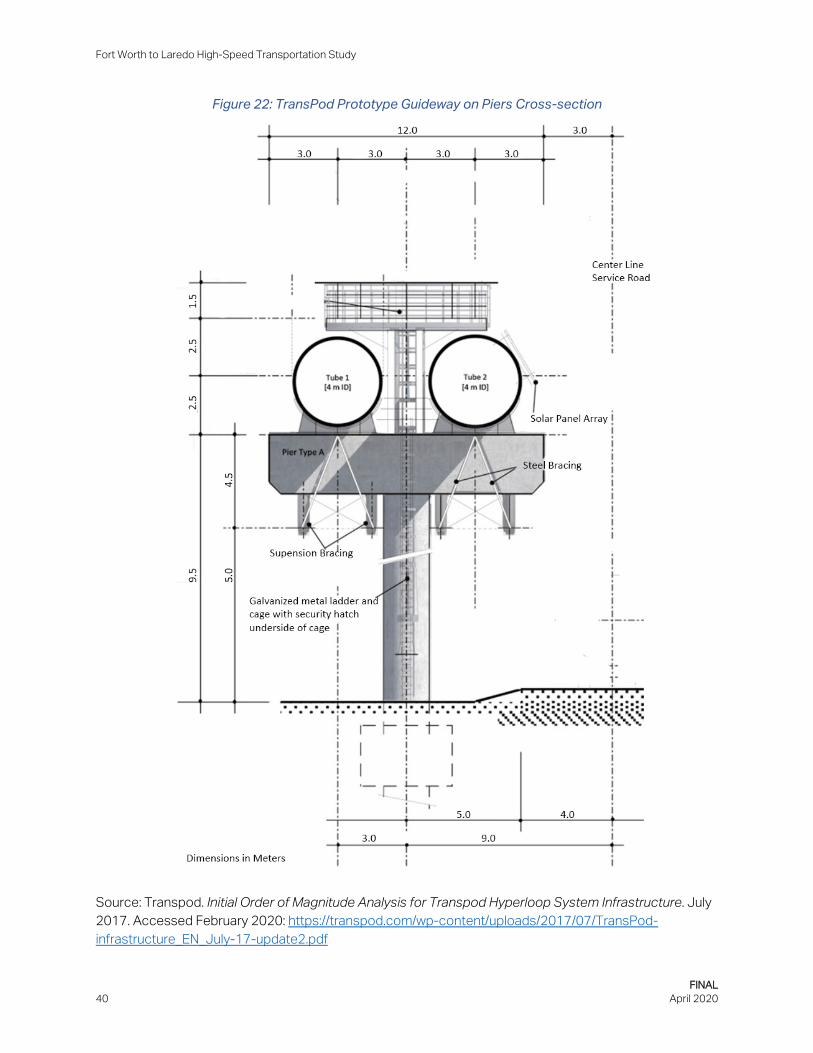
Fort Worth to Laredo High-Speed Transportation Study
FINAL 40 April 2020
Figure 22: TransPod Prototype Guideway on Piers Cross-section
Source: Transpod. Initial Order of Magnitude Analysis for Transpod Hyperloop System Infrastructure. July 2017. Accessed February 2020: https://transpod.com/wp-content/uploads/2017/07/TransPod-infrastructure_EN_July-17-update2.pdf

Fort Worth to Laredo High-Speed Transportation Study
FINAL 41 April 2020
Hyperloop is anticipated to primarily use an elevated viaduct (pylons) for tubes. In addition to serving as the structural backbone of the system and the tubes, the pylon could be fitted with structural health monitoring, seismic isolation bearings, and potential energy storage to support the overall energy framework of the system.
To maintain a low-pressure environment within the tubes, vacuum pumps would be located along the tube system at five-mile intervals. Specific details regarding the intervals, power consumption, and design of the vacuum pumps are yet to be determined.
Specific design clearances are currently being developed by the various hyperloop companies. While each company has different specific design standards, many are relatively similar because the underlying technology is the same. Additionally, comparisons to similar technologies such as maglev and high-speed rail are helpful in understanding the relative differences between these high-speed technologies.
Vehicle Almost all of the hyperloop companies use some form of a linear induction motor technology as the primary propulsion system that propels the capsules through the tube system. Relying solely on electric power, linear induction motors located along the capsule would accelerate and decelerate the capsule to the appropriate speed as necessary. With rolling resistance eliminated and air resistance greatly reduced, the capsules can glide for the bulk of the journey, minimizing energy usage.
A linear electric motor has the same two main parts as a rotary motor: a stator (the part that stays still) and a rotor (the part that moves or rotates), however, the rotor does not rotate but instead moves in a straight line along the length of the stator. In the linear induction system, the stators are mounted to the tube, the rotor is mounted to the pod, and the pod straddles the stators as it accelerates down the tube.
Virgin Hyperloop One, Hyperloop Transportation Technologies, and TransPod systems would use a passive magnetic levitation system called inductrack or magneto-dynamic suspension. Vehicles would include permanent room-temperature magnets that are attached to the pod to levitate it over passive coils on the track. Similar to the system used on permanent magnet maglev. The levitating force between the track and pod is achieved through the arrangement of magnets on the track and forward movement of the pod.
However, in the original Hyperloop Alpha concept, an electrically driven inlet fan and air compressor would be placed at the nose of the capsule to “actively transfer high-pressure air from the front to the rear of the vessel,” resolving the problem of air pressure building in front of the vehicle, slowing it down. A fraction of the air is shunted to the skis for additional pressure, augmenting that gain passively from lift due to their shape. However, this inlet fan is removed in many modern hyperloop concepts.
Various vendors and organizations have developed prototypes for hyperloop capsules / pods. Since 2015, SpaceX has hosted their annual Hyperloop Pod Competition to expedite the process of pod development and research. In 2019, 21 teams were invited to participate in the competition. Hyperloop Transportation Technologies and Virgin Hyperloop One have manufactured the most refined prototypes, to date.
• Virgin Hyperloop One (XP-1): The XP-1 pod is designed to accommodate approximately 20 passengers per capsule and is the only constructed capsule to have gone through testing in a vacuum test track. Every pod will have emergency exits, but the expectation is that pods will glide safely to the next portal (station) or egress point in the event of an emergency. Sensors will be built throughout the system to notify the system of any leaks or breaches.

Fort Worth to Laredo High-Speed Transportation Study
FINAL 42 April 2020
• Hyperloop Transportation Technologies (Quintero One Hyperloop Passenger Capsule): The Hyperloop Transportation Technologies capsule is designed to carry 20 to 40 passengers per capsule. The capsule length is 105 feet, with an inner cabin length of 50 feet. The capsule weighs approximately five tons. (Figure 23)
• TransPod (M2A): M2A is an unbuilt, proof-of-concept technology. It includes an electrically-driven axial compressor in front of the vehicle to divert air from the front of the vehicle, reducing air resistance.
Figure 23: Hyperloop Transportation Technology’s Quintero One
Source: Wikipedia user Ryn88668. HTT’s Quintero One. July 2019. Accessed, March 2020: https://en.wikipedia.org/wiki/Hyperloop_Transportation_Technologies#/media/File:HTT_Full_Capsule.jpg
Stations (Portals) Hyperloop station designs are continuously evolving with the technology. Much of the station design could depend on operational characteristics. Hyperloop is anticipated to be an on-demand, point to point service; therefore, stations would need to be flexible to adapt to peak and off-peak demand from rapidly arriving and departing passenger pods with a high number of platforms. Station footprints would be dependent on the urban form of the site. Physical constraints would determine the size of terminals, passenger areas, parking, and vehicle platforms. Early station concepts emphasize the use of mainline tubes and on/off ramp tubes.
Mainline tubes are the primary arterial of the system. These could be analogous to the main lanes of a busy interstate. Conversely, on/off ramp tubes would provide pod access to stations while not impeding pods that may be skipping a station for express service. Figure 24 shows a preliminary example of on/off ramp tubes.

Fort Worth to Laredo High-Speed Transportation Study
FINAL 43 April 2020
Figure 24: Conceptual Hyperloop On/Off Ramp Tubes
Source: AECOM, 2020
Ancillary Facilities Hyperloop systems would require typical maintenance facilities prevalent in other high-speed transportation systems. However, these maintenance facilities would be specialized for the repair and servicing of passenger pods and guideway tubes. Also, as many hyperloop concepts are integrating the use of solar paneling for energy capture, energy storage, or transmission facilities could be required.
Costs/Funding Though speculative, the most detailed construction information comes from the SpaceX white paper which provided an estimate of $17 million per mile. Subsequent to the white paper, Virgin Hyperloop One gave a presentation citing $25 to $27 million per mile for the technology, excluding land acquisition. For an almost entirely underwater track, specifically from Helsinki to Stockholm, Virgin Hyperloop One estimates a cost of $64 million per mile, including the cost of capsules. Considering all the various cost estimates provided so far, the average construction cost of hyperloop is thought to be approximately $73 million per mile. Even if construction and land acquisition costs are at the upper end of these projections, placing the cost of hyperloop at approximately $120 million per mile.
Fort Worth to Laredo High-Speed Transportation Study
FINAL 44 April 2020
Hyperloop will likely need a similar funding framework that is present in other similar forms of high-speed transportation. In the U.S., federal funding comes with many stipulations about how it can be used, required environmental documentation, federal and state design review and approval, and also including the Davis-Bacon Act (prevailing wages) and the Buy America Provision. Because of the challenges that come with government funding, especially in the U.S., various hyperloop companies appear to be focusing on foreign markets for near-term implementation.
Regulatory Considerations The adoption of hyperloop is likely to run into similar barriers to implementation that other existing high-speed transportation systems face in the U.S. That includes land acquisition concerns, environmental review, and technology certification for safety and operations. However, in March of 2019, the U.S. Department of Transportation formed a council to support emerging transportation technologies and initiatives dubbed the Non-Traditional and Emerging Transportation Technology Council. It aims streamline the deployment process for new technologies such as hyperloop in the U.S.
There were some key gaps in information on the risks of the system. Small headways between pods, which causes safety concerns if the system fails, would require a full system shutdown should an emergency stop be triggered by a single pod. This issue highlights the current single point failure within the proposed hyperloop systems, requiring further analysis into the practicalities of operation and maintenance.
7.4. Conclusions and Relevance to the Study Hyperloop is the most unknown of the technologies studied in this effort. Its stated performance benefits, design criteria, safety and environmental benefits, and other major considerations are all subject to rapid change at this time due to the relative immaturity of the hyperloop industry. However, despite that uncertainty, the technology is developing at a rapid pace and the stated performance benefits of the technology are vast, even compared to those of maglev of high-speed rail.
Specifically, hyperloop was designed from the ground-up to mitigate or alleviate many of the major concerns of the other technologies and brings older concepts into the age of electrification and automation. Hyperloop shares many of the same foundational concepts of maglev but introduces many concepts from the aviation industry, such as the low-pressure vacuum tube. Depending on how the technology develops over the next decade, it has the capability to move the highest amount of people, in addition to freight, at the highest speeds along the study corridor while also being fully automated and electrified.

Fort Worth to Laredo High-Speed Transportation Study
FINAL 45 April 2020
Appendix A: Technology Review and Design Criteria Summary Table The following table provides a summary version of design criteria outlined within the Task 2 Technology Review and Design Criteria Memorandum.
Guaranteed Transit Conventional Passenger Rail (Class 3-5)
Higher-Speed Rail (Class 6-7) High-Speed Rail Maglev Hyperloop
Operating Speed
50-70 mph (Managed lane design speed) 1
Up to 90 mph2
Between 60 – 110 mph (125 mph planned) 3
130-140 mph4
Amtrak Acela: 110-150 mph
186-205 mph5 2206 - 311 mph 7 Up to 670 mph8
Horizontal Curve Radius (Radius at approx. operational speed)
1,050 – 3,750 ft
Up to 2,500 ft (depending on design speed)9
Min. ¼ mile (1,320 ft)10
At 90 mph radius approx.
5,900 ft
Min. 15,840 ft11
At 150 mph radius approx. 16,400 ft
Min Top Speed: 17,100 ft12
Desired: 10 mi (52,800 ft)
Min Top Speed: 5 mi (26,400 ft)13
At 600 mph 1.6 miles (8,448 ft) according to
VHO
Studies assume similar to HSR (no greater than .028
gravitational force)14
Horizontal Clearances
3.75 – 6 ft 15 Min. 10 ft 16
Recommended 16 ft Min. 9 ft17
Min. 25 ft for tangent track
where track is curved or maintenance roadway
exists.18
Recommended 16 ft Min. 9 ft 19
Min. 25 ft for tangent track
where track is curved or maintenance roadway
exists.20
Approx. 12 ft from catenary pole to 25 ft
depending on available right-of-way 21
23-36 ft can vary depending on available right-of-way22
Approx. 13 ft according to preliminary design
drawings
Technology Specific Vertical Clearances*
Min. 18.5 ft23
24 ft-3 in for Overhead bridges and other
structures in electrified territory24
24 ft-3 in for Overhead bridges and other structures
in electrified territory25
For HSR crossing over 14.5 ft (private roads) to 18.5 ft (for interstates) 26
For HSR crossing under a
min. 21 ft – 2 in27
Min. under-clearance 18 ft28
Min. 20 ft for areas with
pedestrians 29
Similar to HSR and Maglev
Maximum Super elevation (angle of cant)
0.06 ft/ft (7.2 in/ft) Depending on curve radii
30
Desired max with shared freight and regional rail – 2
in
Max Eu: (Balanced): 9 in
Max Ee: (Underbalance): 5.5 in31
Max 7 in
for Track Class 3- 532
Max 7 in for Track Class 3- 533
Max Eu: (Balanced):
9 in Max Ee: (Underbalance): 5.5
in34
Absolute Max - 7 7/8 in35 10 degrees36
Assumed 12 degrees (7 in, similar to California
HSR) 37 38
Maximum Grade (Main Line)
6%39 1.5 % (or 2.5%
compensated on horizontal curve) 40
1.5 % (or 2.5% compensated on horizontal curve) 41
Max - 1.8 % < 1.5 miles Max - 2% < 0.6 miles42
Up to 3.5%43
4%44 ≤10% (theoretical) 45
Center-to-Center Spacing Guideways
16 -22 ft with varying right-of-way availability
and median width46
16-20 ft47 Min. 13 ft in yard48
Min. 14 ft < 80 mph
15 ft < 125 mph 16 ft < mph49
Min. 14 ft < 80 mph 15 ft < 125 mph
16 ft < mph50
Approx. 14ft-9in51 19 ft52 Min. 19.6 ft depending on
configuration53
Typical Right-of-Way Widths
Minimum 12 ft per lane (varies with managed
lane system)
Varies on number of tracks, approx. 55-100 ft
Approx. 100 ft 54 (can vary within existing
freight rail ROWs) Approx. 100 ft55 Approx. 72 ft - 100ft56
Approx. 40 –100 ft (Tube and guideways can
have varying configuration)57
Energy Type Electric Bus Diesel / Natural Gas
Electric Diesel
Diesel-Electric
Electric Diesel
Diesel-Electric Electric Electric Electric
Grade Separation
Yes / Enclosed system with exit ramps
Can operate without full grade separation
Can operate without full grade separation
Speeds > 125 mph, Closed
System
Yes / Closed System Yes / Closed System Yes / Closed System
Capital Cost/Mile (in $ Millions; adjusted to 2019 dollars)
Approx. $16858 for the construction of a
managed lane highway system.
If managed lane highway
system exists, Guaranteed transit
capital costs would only include buses, therefore: approx. $400,000 to $1.5
million per bus59
Approx. $38 - $4760 61
Cost of improvements to existing rail line. Approx.
$1162
Costs would more likely be similar to conventional
passenger rail costs for new lines approx. $38-47
Approx. $64 - 7563
Approx. $26564 65 Planning level Information
found regarding superconducting maglev
projects include Baltimore-Washington and Chuo
Shinkansen, both projects include significant amount of tunnelling and right of
way costs due to their locations. Therefore, capital costs could vary greatly for
this technology.
Approx. $50 - $7566 67 Up to $12068
Estimates vary
Fort Worth to Laredo High-Speed Transportation Study
FINAL 46 April 2020
1 Texas Transportation Institute and Texas Department of Transportation. Guidance for Planning, Operating, and Designing Managed Lane Facilities in Texas. August 2001, p.109. Accessed February 2020: https://rosap.ntl.bts.gov/view/dot/41764/dot_41764_DS1.pdf? 2 49 CFR § 213.9 – Classes of track: operating speed limits. Accessed March 2020: https://www.law.cornell.edu/cfr/text/49/213.9 3 FRA. All Aboard Florida Intercity Passenger Rail Project Final Environmental Impact Statement and Section 4(f) Determination, August 2015. Accessed February 2020: https://railroads.dot.gov/completed-environmental-reviews/all-aboard-florida/all-aboard-florida-miami-orlando-passenger-0 4 AMTRAK. A Vision for High-Speed Rail in the Northeast Corridor, September 2010. Accessed February 2020: https://nec.amtrak.com/wp-content/uploads/2017/08/A-Vision-for-High-Speed-Rail-in-the-Northeast-Corridor.pdf 5 FRA. Dallas to Houston High-Speed Rail Draft Environmental Impact Study, Final Draft Conceptual Engineering Report-FDCEv7, 15 September 2017, p27. Accessed February 2020: https://cms8.fra.dot.gov/sites/fra.dot.gov/files/fra_net/17677/31%20Dallas%20to%20Houston%20High%20Speed%20Rail%20DEIS%20Appendix%20F_TCRR%20FDCE%20v7%20REPORT.pdf 6 FRA. Baltimore-Washington Superconducting Maglev Project Final Alternatives Report Nov 2018, p84. Accessed, February 2020: https://www.bwmaglev.info/images/document_library/reports/alternatives_report/SCMAGLEV_Alts_Report_Body-Append-A-B-C_Nov2018.pdf 7 Central Japan Railway Company. About the Chuo Shinkansen Project. Accessed February 2020: https://scmaglev.jr-central-global.com/faq/ 8 Virgin Hyperloop One. How It Works. Accessed February 2020: https://hyperloop-one.com/facts-frequently-asked-questions 9 Texas Transportation Institute and Texas Department of Transportation. Guidance for Planning, Operating, and Designing Managed Lane Facilities in Texas. August 2001. p.105 Accessed February 2020: https://rosap.ntl.bts.gov/view/dot/41764/dot_41764_DS1.pdf? 10 AMTRAK. A Vision for High-Speed Rail in the Northeast Corridor, September 2010. Accessed February 2020: https://nec.amtrak.com/wp-content/uploads/2017/08/A-Vision-for-High-Speed-Rail-in-the-Northeast-Corridor.pdf 11 AMTRAK. A Vision for High-Speed Rail in the Northeast Corridor, September 2010. Accessed February 2020: https://nec.amtrak.com/wp-content/uploads/2017/08/A-Vision-for-High-Speed-Rail-in-the-Northeast-Corridor.pdf 12 FRA. Dallas to Houston High-Speed Rail Draft Environmental Impact Study, Final Draft Conceptual Engineering Report-FDCEv7, 15 September 2017, p34. Accessed February 2020: https://cms8.fra.dot.gov/sites/fra.dot.gov/files/fra_net/17677/31%20Dallas%20to%20Houston%20High%20Speed%20Rail%20DEIS%20Appendix%20F_TCRR%20FDCE%20v7%20REPORT.pdf 13 FRA. Baltimore-Washington Superconducting Maglev Project Final Alternatives Report Nov 2018, p84. Accessed, February 2020: https://www.bwmaglev.info/images/document_library/reports/alternatives_report/SCMAGLEV_Alts_Report_Body-Append-A-B-C_Nov2018.pdf 14 Northeast Ohio Areawide Coordinating Agency. Draft Final Great Lakes Hyperloop Feasibility Study, December 2019. Accessed February 2020: https://8508ab36-da5a-4138-b6f6-8384719812eb.filesusr.com/ugd/c9f49b_93809c4776b74bf6952050ea7fe0e08f.pdf 15 Texas Transportation Institute and Texas Department of Transportation. Guidance for Planning, Operating, and Designing Managed Lane Facilities in Texas. August 2001, p.14. Accessed February 2020: https://rosap.ntl.bts.gov/view/dot/41764/dot_41764_DS1.pdf? 16Texas Department of Transportation. Roadway Design Manual, April 2018. Accessed February 2020: http://onlinemanuals.txdot.gov/txdotmanuals/rdw/thfn.htm 17 Amtrak. Standard Track Plan Minimum Roadway Clearances. August 2016. 18 AREMA. Manual for Railway Engineering, Part 1 Clearance Diagrams – Fixed Obstructions, 2018. 19 Union Pacific Railroad-BNSF Railway. Guidelines for Railroad Grade Separation Projects, January 2016. Accessed February 2020: https://www.up.com/cs/groups/public/documents/document/pdf_rr_grade_sep_projects.pdf 20 AREMA. Manual for Railway Engineering, Part 1 Clearance Diagrams – Fixed Obstructions, 2018. 21 FRA. Dallas to Houston High-Speed Rail Draft Environmental Impact Study, Final Draft Conceptual Engineering Report-FDCEv7, 15 September 2017, p34. Accessed February 2020: https://cms8.fra.dot.gov/sites/fra.dot.gov/files/fra_net/17677/31%20Dallas%20to%20Houston%20High%20Speed%20Rail%20DEIS%20Appendix%20F_TCRR%20FDCE%20v7%20REPORT.pdf 22FRA. Baltimore-Washington Superconducting Maglev Project Final Alternatives Report Nov 2018, p84. Accessed, February 2020: https://www.bwmaglev.info/images/document_library/reports/alternatives_report/SCMAGLEV_Alts_Report_Body-Append-A-B-C_Nov2018.pdf 23Texas Department of Transportation. Roadway Design Manual, April 2018. Accessed February 2020: http://onlinemanuals.txdot.gov/txdotmanuals/rdw/thfn.htm 24 Amtrak. Standard Track Plan Minimum Roadway Clearances. August 2016. 25 Amtrak. Standard Track Plan Minimum Roadway Clearances. August 2016. 26 FRA. Dallas to Houston High-Speed Rail Draft Environmental Impact Study, Final Draft Conceptual Engineering Report-FDCEv7, 15 September 2017, p37. Accessed February 2020: https://cms8.fra.dot.gov/sites/fra.dot.gov/files/fra_net/17677/31%20Dallas%20to%20Houston%20High%20Speed%20Rail%20DEIS%20Appendix%20F_TCRR%20FDCE%20v7%20REPORT.pdf 27 FRA. Dallas to Houston High-Speed Rail Draft Environmental Impact Study, Final Draft Conceptual Engineering Report-FDCEv7, 15 September 2017, p37. Accessed February 2020: https://cms8.fra.dot.gov/sites/fra.dot.gov/files/fra_net/17677/31%20Dallas%20to%20Houston%20High%20Speed%20Rail%20DEIS%20Appendix%20F_TCRR%20FDCE%20v7%20REPORT.pdf 28 FRA. Baltimore-Washington Superconducting Maglev Project Final Alternatives Report Nov 2018, p84. Accessed, February 2020: https://www.bwmaglev.info/images/document_library/reports/alternatives_report/SCMAGLEV_Alts_Report_Body-Append-A-B-C_Nov2018.pdf 29 FRA. Baltimore-Washington Superconducting Maglev Project Final Alternatives Report Nov 2018, p84. Accessed, February 2020: https://www.bwmaglev.info/images/document_library/reports/alternatives_report/SCMAGLEV_Alts_Report_Body-Append-A-B-C_Nov2018.pdf 30 Texas Transportation Institute and Texas Department of Transportation. Guidance for Planning, Operating, and Designing Managed Lane Facilities in Texas. August 2001, p.107. Accessed February 2020: https://rosap.ntl.bts.gov/view/dot/41764/dot_41764_DS1.pdf? 31 Amtrak. Track Design Specification, Spec No. 63. April 1, 2003 revised June 1, 2015. 32 49 CFR § 213.57 - Curves; elevation and speed limitations. Accessed February 2020: https://www.law.cornell.edu/cfr/text/49/213.57 33 49 CFR § 213.57 - Curves; elevation and speed limitations. Accessed February 2020: https://www.law.cornell.edu/cfr/text/49/213.57 34 Amtrak. Track Design Specification, Spec No. 63. April 1, 2003 revised June 1, 2015. 35 FRA. Dallas to Houston High-Speed Rail Draft Environmental Impact Study, Final Draft Conceptual Engineering Report-FDCEv7, 15 September 2017, p34. Accessed February 2020: https://cms8.fra.dot.gov/sites/fra.dot.gov/files/fra_net/17677/31%20Dallas%20to%20Houston%20High%20Speed%20Rail%20DEIS%20Appendix%20F_TCRR%20FDCE%20v7%20REPORT.pdf 36 FRA. Baltimore-Washington Superconducting Maglev Project Final Alternatives Report Nov 2018, p84. Accessed, February 2020: https://www.bwmaglev.info/images/document_library/reports/alternatives_report/SCMAGLEV_Alts_Report_Body-Append-A-B-C_Nov2018.pdf 37 Northeast Ohio Areawide Coordinating Agency. Draft Final Great Lakes Hyperloop Feasibility Study, December 2019. Accessed February 2020: 38 California High-Speed Rail Authority. Alignment Design Standards for High-Speed Train Operations TM 2.1.2., April 2009. Accessed February 2020: https://www.hsr.ca.gov/docs/programs/eir_memos/Proj_Guidelines_TM2_1_2R00.pdf 39 Texas Transportation Institute and Texas Department of Transportation. Guidance for Planning, Operating, and Designing Managed Lane Facilities in Texas. August 2001, p.108. Accessed February 2020: https://rosap.ntl.bts.gov/view/dot/41764/dot_41764_DS1.pdf? 40 Amtrak. Track Design Specification, Spec No. 63. April 1, 2003 revised June 1, 2015. 41 Amtrak. Track Design Specification, Spec No. 63. April 1, 2003 revised June 1, 2015. 42 FRA. Dallas to Houston High-Speed Rail Draft Environmental Impact Study, Final Draft Conceptual Engineering Report-FDCEv7, 15 September 2017, p34. Accessed February 2020: https://cms8.fra.dot.gov/sites/fra.dot.gov/files/fra_net/17677/31%20Dallas%20to%20Houston%20High%20Speed%20Rail%20DEIS%20Appendix%20F_TCRR%20FDCE%20v7%20REPORT.pdf 43 California High-Speed Rail Authority. Alignment Design Standards for High-Speed Train Operations TM 2.1.2., April 2009. Accessed February 2020: https://www.hsr.ca.gov/docs/programs/eir_memos/Proj_Guidelines_TM2_1_2R00.pdf

Fort Worth to Laredo High-Speed Transportation Study
FINAL 47 April 2020
44 FRA. Baltimore-Washington Superconducting Maglev Project Final Alternatives Report Nov 2018, p84. Accessed, February 2020: https://www.bwmaglev.info/images/document_library/reports/alternatives_report/SCMAGLEV_Alts_Report_Body-Append-A-B-C_Nov2018.pdf 45 Alderton, M. (2020). Hyperloop Technology Can Transform Transportation—Within the Decade. [online] Redshift EN. Available at: https://www.autodesk.com/redshift/hyperloop-transportation/ 46 Texas Transportation Institute and Texas Department of Transportation. Guidance for Planning, Operating, and Designing Managed Lane Facilities in Texas. August 2001, p.112. Accessed February 2020: https://rosap.ntl.bts.gov/view/dot/41764/dot_41764_DS1.pdf? 47 Dallas Area Rapid Transit. Cotton Belt Regional Rail DRAFT Design Criteria Manual Volume 1 Infrastructure Design Criteria, Jan 2011. Accessed February 2020: https://www.dart.org/ShareRoot/about/expansion/cottonbelt/aecr/AppendixD/5%20-%20Design-Criteria-Manual-V1.pdf 48 FRA and Virginia Department of Rail and Public Transportation. DC to Richmond Southeast High Speed Rail Basis of Design Technical Criteria for Concept & Preliminary Engineering, February 2015. Accessed February 2020: https://dc2rvarail.com/files/1314/5012/4677/DC2RVA_SEHSR_Final_Basis_of_Design_02-24-2015.pdf 49 Amtrak. Track Design Specification, Spec No. 63. April 1, 2003 revised June 1, 2015. 50 Amtrak. Track Design Specification, Spec No. 63. April 1, 2003 revised June 1, 2015. 51 FRA. Dallas to Houston High-Speed Rail Draft Environmental Impact Study, Final Draft Conceptual Engineering Plans and Details, 15 September 2017, p34. Accessed February 2020: https://cms8.fra.dot.gov/sites/fra.dot.gov/files/fra_net/17679/33%20Dallas%20to%20Houston%20High%20Speed%20Rail%20DEIS%20Appendix%20G_TCRR%20FDCE%20v7%20DWGS%20VOLUME%201.pdf 52 FRA. Baltimore-Washington Superconducting Maglev Project Final Alternatives Report Nov 2018, p84. Accessed, February 2020: https://www.bwmaglev.info/images/document_library/reports/alternatives_report/SCMAGLEV_Alts_Report_Body-Append-A-B-C_Nov2018.pdf 53 Transpod. Initial Order of Magnitude Analysis for Transpod Hyperloop System Infrastructure. July 2017. Accessed February 2020: https://transpod.com/wp-content/uploads/2017/07/TransPod-infrastructure_EN_July-17-update2.pdf 54 FRA. All Aboard Florida Intercity Passenger Rail Project Final Environmental Impact Statement and Section 4(f) Determination, August 2015. Accessed February 2020: https://railroads.dot.gov/completed-environmental-reviews/all-aboard-florida/all-aboard-florida-miami-orlando-passenger-0 55 Texas Central Railroad. Low Impact Design Facts Sheet, 2018. Accessed February 2020: http://www.texascentral.com/wp-content/uploads/2018/03/TC_Low-impact_design_2018.pdf 56 FRA. Baltimore-Washington Superconducting Maglev Project Final Alternatives Report Nov 2018, p84. Accessed, February 2020: https://www.bwmaglev.info/images/document_library/reports/alternatives_report/SCMAGLEV_Alts_Report_Body-Append-A-B-C_Nov2018.pdf 57 Transpod. Initial Order of Magnitude Analysis for Transpod Hyperloop System Infrastructure. July 2017. Accessed February 2020: https://transpod.com/wp-content/uploads/2017/07/TransPod-infrastructure_EN_July-17-update2.pdf 58 LBJ TEXPRESS. LBJ Express FAQs. Accessed February 2020: https://www.lbjtexpress.com/about-us/lbj-express-project 59 Austin Monitor. Capital Metro talks batteries over electric bus contract, August 27, 2019. Accessed February 2020: https://www.austinmonitor.com/stories/2019/08/capital-metro-talks-batteries-over-electric-bus-contract/ 60 FTA. TEXRail Fort Worth, Texas New Starts Engineering, May 2015. Accessed February 2020: https://www.transit.dot.gov/sites/fta.dot.gov/files/docs/TX_Ft_Worth_TEX_Rail_Profile-FINAL.pdf 61 Dallas Area Rapid Transit. DART Silverline Project City of Dallas Questions & Answers, May 2019. Accessed February 2020: https://www.dart.org/ShareRoot/about/expansion/cottonbelt/cottonbeltqa/silverlinecityofdallasqanda.pdf 62 Institute of Transportation Engineers. South Florida’s Brightline: The Public Costs of Private Rail, September 2018. Accessed February 2020: http://cdsi.fau.edu/surp/wp-content/uploads/sites/2/application/pdf/Saginor-Feature.pdf 63 FRA. Dallas to Houston High-Speed Rail Draft Environmental Impact Study Executive Summary. December 2017. Accessed February 2020: https://cms8.fra.dot.gov/sites/fra.dot.gov/files/fra_net/17954/1%20Dallas%20to%20Houston%20High%20Speed%20Rail%20DEIS_MAIN%20TEXT%20I.pdf 64 FRA. Baltimore-Washington Superconducting Maglev Project FAQ. Accessed February 2020: https://www.bwmaglev.info/index.php/faqs 65 Central Japan Railway Company. About the Chuo Shinkansen Project. Accessed February 2020: https://scmaglev.jr-central-global.com/faq/ 66 Northeast Ohio Areawide Coordinating Agency. Draft Final Great Lakes Hyperloop Feasibility Study, December 2019. Accessed February 2020: 67 Virgin Hyperloop One. How It Works. Accessed February 2020: https://hyperloop-one.com/facts-frequently-asked-questions 68 The Verge. A hyperloop in Missouri? A new study stays it’s feasible, but not necessarily affordable, Oct 17,2018. Accessed February 2020: https://www.theverge.com/2018/10/17/17989504/virgin-hyperloop-one-missouri-feasibility-study *Denotes: Vertical Clearances indicated are technology specific. Should there be a need to cross another railway, road, or utility, vertical clearances would need to comply with the design requirements of the intersecting facility.

Fort Worth to Laredo High-Speed Transportation Study
FINAL 48 April 2020
Appendix B: Technology Review and Operational Characteristics Summary Table The following table provides a summary version of technology operational characteristics outlined within the Task 2 Technology Review and Design Criteria Memorandum.
Guaranteed Transit Conventional Passenger Rail Higher-Speed Rail High-Speed Rail Maglev Hyperloop
Operating Speed
50-70 mph (Managed lane design speed) 69 45-79 mph70
(125 planned) 110 (FRA regulation)
- 60 mph 130-140 mph71
186-20572 22073 - 31174 mph Up to 670 mph75
Typical Station Distances
N/A 1 to 40 miles 5 to 100 miles76 20 to 100 miles, up to 250 miles77
10 to 100 miles; up to 180 miles 78
Undetermined; range from 10 to 250 miles up
to 500 miles.
Vehicle Capacity or Capacity Per Trainset
Approx. 40 passengers per bus.
Varies for system frequency.
Varies depended on system configuration and number of track.
Up to 450 per passenger per single
DMU trainset79
Approx. 250 (2 locomotives + 4
passenger coaches)
400-1300 passengers depending on trainset
configuration80 81
400-1300 passengers depending on trainset
configuration82
Estimated 28-40 per pod
Headway Undetermined. Could follow typical intercity bus
Typical services range from 15 minutes to 1 hour depending on
demand.
Typical 30 minutes to 1 hour depending on
demand.
Shinkansen System As low as every 3 minutes. Dallas to Houston HSR
will run every 30 minutes during peak times and 1
hour in off-peak
Typical 15-20 minutes Anticipated ever 1-3 minutes
Typical Fare $30 to $100
depending on length of route and service
Varies considerably between transit
agencies across the U.S. depending on route length and
passenger demand. Can range from $1.50
to over $500 for premium service.
Acela Express fares range from $49 to $135 per seat
Approximately $0.25 – $0.40 per mile in Europe
and Asia.
Intended to compete with short haul air travel
Typical fare for the Shanghai Maglev ranges
from $10 to $30
Unknown; anticipated to compete with air
travel
Freight Service N/A Limited N/A Limited8384 Unknown Yes
69 Texas Transportation Institute and Texas Department of Transportation. Guidance for Planning, Operating, and Designing Managed Lane Facilities in Texas. August 2001, p.109. Accessed February 2020: https://rosap.ntl.bts.gov/view/dot/41764/dot_41764_DS1.pdf? 70 Dallas Area Rapid Transit. Cotton Belt Corridor Regional Rail Project Final Environmental Impact Statement, Appendix B Technical Memoranda and Reports, B-18 Operations Simulation Methodology and Results Report, February 2018. Accessed February 2020: https://www.dart.org/ShareRoot/about/expansion/cottonbelt/cottonbeltfeis/appendix_b/B_18OperationsSimulation.pdf 71 AMTRAK. A Vision for High-Speed Rail in the Northeast Corridor, September 2010. Accessed February 2020: https://nec.amtrak.com/wp-content/uploads/2017/08/A-Vision-for-High-Speed-Rail-in-the-Northeast-Corridor.pdf 72 FRA. Dallas to Houston High-Speed Rail Draft Environmental Impact Study, Final Draft Conceptual Engineering Report-FDCEv7, 15 September 2017, p27. Accessed February 2020: https://cms8.fra.dot.gov/sites/fra.dot.gov/files/fra_net/17677/31%20Dallas%20to%20Houston%20High%20Speed%20Rail%20DEIS%20Appendix%20F_TCRR%20FDCE%20v7%20REPORT.pdf 73 FRA. Baltimore-Washington Superconducting Maglev Project Final Alternatives Report Nov 2018, p84. Accessed, February 2020: https://www.bwmaglev.info/images/document_library/reports/alternatives_report/SCMAGLEV_Alts_Report_Body-Append-A-B-C_Nov2018.pdf 74 Central Japan Railway Company. About the Chuo Shinkansen Project. Accessed February 2020: https://scmaglev.jr-central-global.com/faq/ 75 Virgin Hyperloop One. How It Works. Accessed February 2020: https://hyperloop-one.com/facts-frequently-asked-questions 76 FRA. All Aboard Florida Intercity Passenger Rail Project Final Environmental Impact Statement and Section 4(f) Determination, August 2015. Accessed February 2020: https://railroads.dot.gov/completed-environmental-reviews/all-aboard-florida/all-aboard-florida-miami-orlando-passenger-0 77 77 FRA. Dallas to Houston High-Speed Rail Draft Environmental Impact Study, Final Draft Conceptual Engineering Report-FDCEv7, 15 September 2017, p27. Accessed February 2020: https://cms8.fra.dot.gov/sites/fra.dot.gov/files/fra_net/17677/31%20Dallas%20to%20Houston%20High%20Speed%20Rail%20DEIS%20Appendix%20F_TCRR%20FDCE%20v7%20REPORT.pdf 78 Central Japan Railway Company. About the Chuo Shinkansen Project. Accessed February 2020: https://scmaglev.jr-central-global.com/faq/ 79 Dallas Area Rapid Transit. Cotton Belt Corridor Regional Rail Project Final Environmental Impact Statement, Appendix B Technical Memoranda and Reports, B-18 Operations Simulation Methodology and Results Report, February 2018. Accessed February 2020: https://www.dart.org/ShareRoot/about/expansion/cottonbelt/cottonbeltfeis/appendix_b/B_18OperationsSimulation.pdf 80 FRA. Dallas to Houston High-Speed Rail Draft Environmental Impact Study, Final Draft Conceptual Engineering Report-FDCEv7, 15 September 2017, p17. Accessed February 2020: https://cms8.fra.dot.gov/sites/fra.dot.gov/files/fra_net/17677/31%20Dallas%20to%20Houston%20High%20Speed%20Rail%20DEIS%20Appendix%20F_TCRR%20FDCE%20v7%20REPORT.pdf 81 Central Japan Railway Company. About the Shinkansen, Accessed February 2020: https://global.jr-central.co.jp/en/company/about_shinkansen/ 82 Central Japan Railway Company. About the Chuo Shinkansen Project. Accessed February 2020: https://scmaglev.jr-central-global.com/faq/ 83 TGV Mail Service https://www.railjournal.com/freight/last-post-for-french-high-speed-freight-as-postal-tgvs-bow-out/ 84 Shinkansen food https://www.railjournal.com/freight/last-post-for-french-high-speed-freight-as-postal-tgvs-bow-out/