Dallas Fort Worth International Airport Comprehensive ... · PDF fileDallas Fort Worth...
121
The Finance Department P.O. Box 619428 DFW Airport, Texas 75261-9428 Dallas Fort Worth International Airport Comprehensive Annual Financial Report FOR THE FISCAL YEAR ENDED SEPTEMBER 30, 2015
Transcript of Dallas Fort Worth International Airport Comprehensive ... · PDF fileDallas Fort Worth...
The Finance Department P.O. Box 619428
DFW Airport, Texas 75261-9428
Dallas Fort Worth International Airport Comprehensive Annual Financial Report FOR THE FISCAL YEAR ENDED SEPTEMBER 30, 2015
Dallas/Fort Worth International Airport, Texas
COMPREHENSIVE
ANNUAL FINANCIAL REPORT
FOR THE FISCAL YEAR ENDED
SEPTEMBER 30, 2015
(With Independent Auditors’ Report Thereon)
Prepared by Department of Finance
Christopher A. Poinsatte
Executive Vice President and Chief Financial Officer
Dallas/Fort Worth International Airport Comprehensive Annual Financial Report
For the Fiscal Year Ended September 30, 2015
Table of Contents
Introductory Section Page
Transmittal Letter i Airport Board of Directors/Airport Officials v Airport Organizational Chart vi Government Finance Officers Association Certificate of Achievement for Excellence in Financial Reporting vii
Financial Section
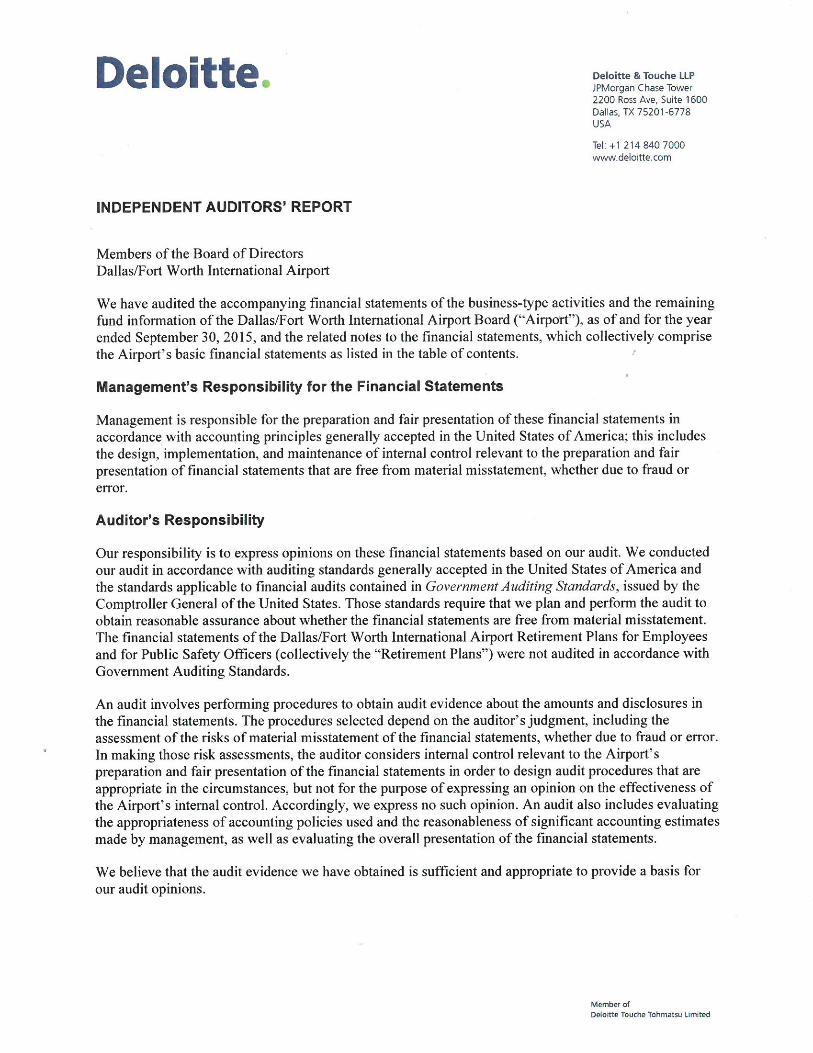
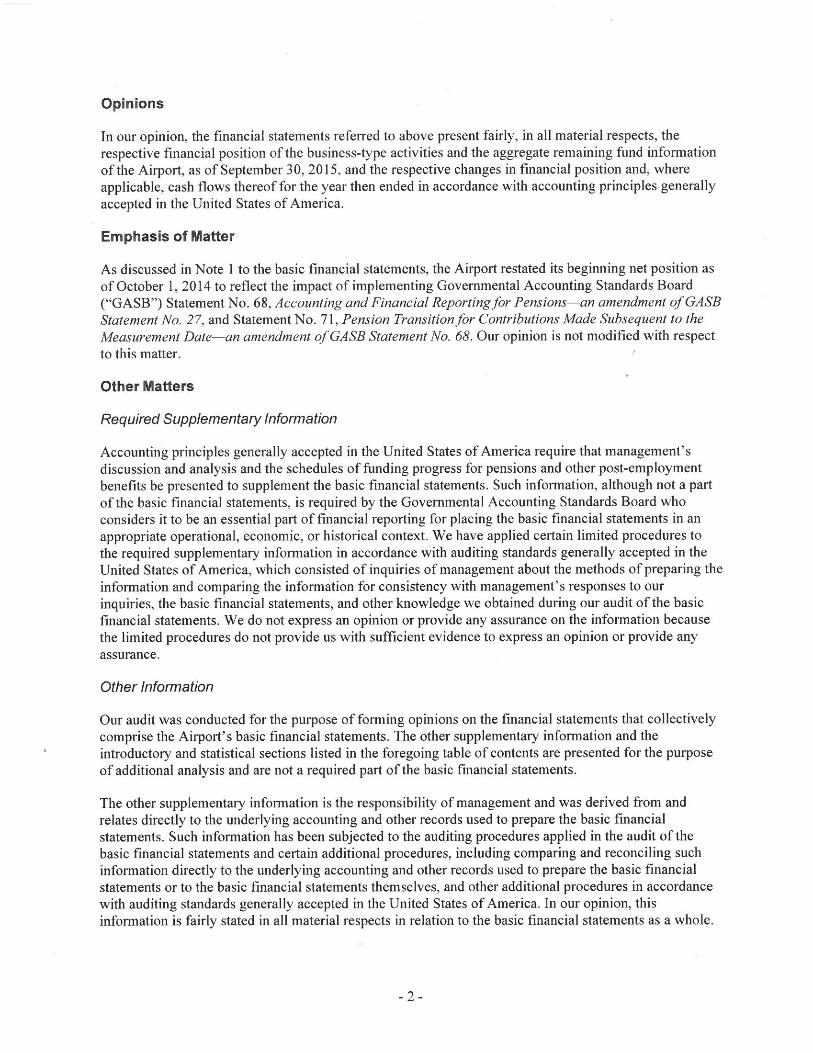
Independent Auditors’ Report 1 Management’s Discussion and Analysis 4
Basic Financial Statements
Statement of Net Position 20 Statement of Revenues, Expenses, and Changes in Net Position 21 Statement of Cash Flows 22 Statement of Fiduciary Net Position 23 Statement of Changes in Fiduciary Net Position 24 Notes to the Basic Financial Statements 25
Required Supplementary Information
Schedule of Changes in the Net Pension Liability and Related Ratios 66 Schedule of Contributions 69 Schedule of Funding Progress – Other Post-Employment Benefits 71 Other Supplementary Information
Combining Statements of Fiduciary Net Position 72 Combining Statements of Changes in Fiduciary Net Position 73 Grand Hyatt Hotel – Financial Position and Revenue and Expenses 74
Statistical Section Financial Trends Information Net Position by Component – Last Ten Fiscal Years 75
Changes in Net Position – Last Ten Fiscal Years 76 DFW Cost Center Net Revenues – Last Five Fiscal Years 77 Revenue Capacity Information Operating Revenues by Source – Last Ten Fiscal Years 78 Landing Fee and Terminal Rental, Airline Cost and Cost per Enplanement – Last Nine Fiscal Years 79 Key Parking Financial and Operational Information – Last Ten Fiscal Years 80 Key Terminal Concessions Financial and Operational Information – Last Ten Fiscal Years 81 Key Rental Cars and Operational Information - Last Ten Fiscal Years 82 Key Commercial Development Financial and Operational Information – Last Ten Fiscal Years 83 Key Natural Gas Financial and Operational Information – Last Nine Fiscal Years 84
Dallas/Fort Worth International Airport Comprehensive Annual Financial Report
For the Fiscal Year Ended September 30, 2015
Table of Contents Debt Capacity Information Debt and Debt Service Ratios – Last Ten Fiscal Years 85 Debt Service Coverage – Last Five Fiscal Years 86 Economic Information Top Ten Customers - Revenues – Last Ten Fiscal Years 87 Dallas-Fort Worth-Arlington Metropolitan Statistical Area (MSA) Demographic and Economic Information – Ten Calendar Years 88 Operating Information Activity Statistics – Last Ten Fiscal Years 89 Aircraft Operations – Last Ten Fiscal Years 90 Enplaned Passengers by Airline – Last Ten Fiscal Years 91 Enplanement Statistics – Last Ten Fiscal Years 92 Landed Weights and Cargo Tonnage - Last Ten Fiscal Years 93
Enplaned Passengers by Month – Last Ten Fiscal Years 94 Landed Weights by Airline – Last Ten Fiscal Years 95 Employee Force – End of Year – Last Ten Fiscal Years 96 Capital Assets as a Function of Operations 97 Schedule of Insurance in Force – September 30, 2015 98

INTRODUCTORY SECTION
v
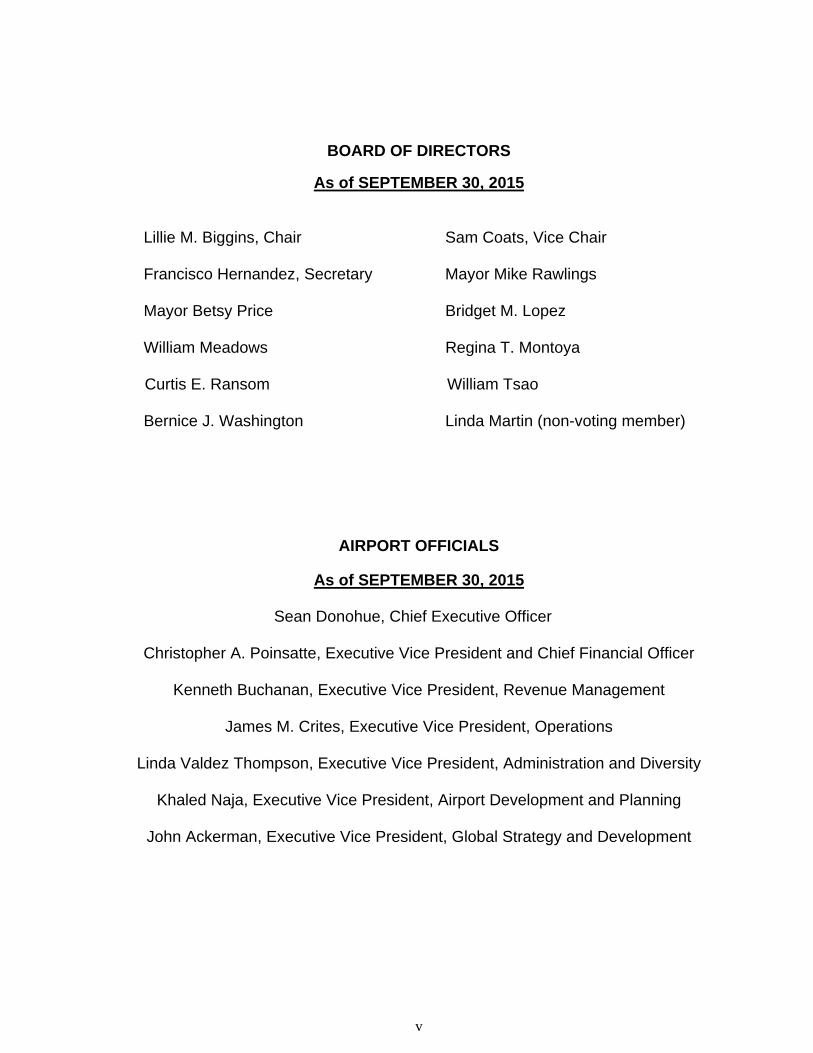
BOARD OF DIRECTORS
As of SEPTEMBER 30, 2015
Lillie M. Biggins, Chair Sam Coats, Vice Chair
Francisco Hernandez, Secretary Mayor Mike Rawlings
Mayor Betsy Price Bridget M. Lopez William Meadows Regina T. Montoya
Curtis E. Ransom William Tsao
Bernice J. Washington Linda Martin (non-voting member)
AIRPORT OFFICIALS
As of SEPTEMBER 30, 2015
Sean Donohue, Chief Executive Officer
Christopher A. Poinsatte, Executive Vice President and Chief Financial Officer
Kenneth Buchanan, Executive Vice President, Revenue Management
James M. Crites, Executive Vice President, Operations
Linda Valdez Thompson, Executive Vice President, Administration and Diversity
Khaled Naja, Executive Vice President, Airport Development and Planning
John Ackerman, Executive Vice President, Global Strategy and Development
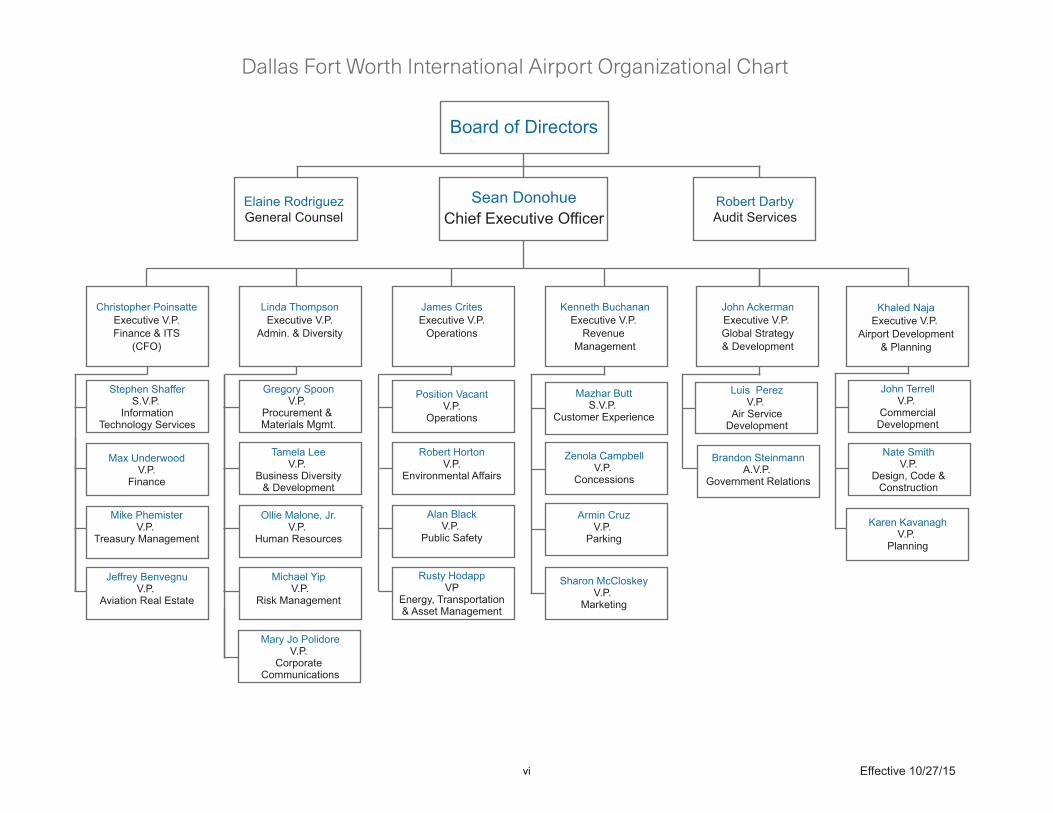
Dallas Fort Worth International Airport Organizational Chart
Sharon McCloskeyV.P.
Marketing
Mazhar ButtS.V.P.
Customer Experience
Sean DonohueChief Executive Officer
Board of Directors
Robert DarbyAudit Services
Elaine RodriguezGeneral Counsel
Christopher PoinsatteExecutive V.P.Finance & ITS
(CFO)
Linda ThompsonExecutive V.P.
Admin. & Diversity
Gregory SpoonV.P.
Procurement & Materials Mgmt.
Tamela LeeV.P.
Business Diversity& Development
Ollie Malone, Jr.
V.P. Human Resources
Michael Yip V.P.
Risk Management
Position VacantV.P.
Operations
Robert HortonV.P.
Environmental Affairs
John TerrellV.P.
CommercialDevelopment
Zenola CampbellV.P.
Concessions
Armin CruzV.P.
Parking
Alan BlackV.P.
Public Safety
Rusty HodappVP
Energy, Transportation& Asset Management
Karen KavanaghV.P.
Planning
Luis PerezV.P.
Air ServiceDevelopment
Jeffrey BenvegnuV.P.
Aviation Real Estate
Mary Jo PolidoreV.P.
Corporate Communications
Nate SmithV.P.
Design, Code &Construction
James CritesExecutive V.P.
Operations
Kenneth BuchananExecutive V.P.
Revenue Management
John AckermanExecutive V.P. Global Strategy& Development
Stephen ShafferS.V.P.
InformationTechnology Services
Mike PhemisterV.P.
Treasury Management
Max UnderwoodV.P.
Finance
Brandon SteinmannA.V.P.
Government Relations
Khaled NajaExecutive V.P.
Airport Development& Planning
Effective 10/27/15vi
vii

FINANCIAL SECTION
4 DFW International Airport
MANAGEMENT’S DISCUSSION AND ANALYSIS
The following discussion and analysis of the financial performance and activity of the Dallas/Fort Worth International Airport (“DFW” or “the Airport”) provides an introduction and understanding of DFW’s Basic Financial Statements for the fiscal year ended September 30, 2015. Also included are statements for DFW’s fiduciary funds which have a December 31, 2014 year end. The Airport is a business-type activity. DFW’s Basic Financial Statements consist of Management’s Discussion and Analysis (“MD&A”); Statement of Net Position; Statement of Revenues, Expenses, and Changes in Net Position; and Statement of Cash Flows. Also included are Statement of Fiduciary Net Position; Statement of Changes in Fiduciary Net Position; and Notes to the Basic Financial Statements. DFW’s Required Supplementary Information (RSI) includes the following fiduciary fund information: Schedule of Changes in the Net Position Liability and Related Ratios; Schedule of Contributions; as well as the Schedule of Funding Progress.
The MD&A has been prepared by management and should be read in conjunction with the Basic Financial Statements and the attached notes.
DFW’s Controlling Documents DFW was created by a Contract and Agreement between the Cities of Dallas and Fort Worth (“the Cities”), dated April 15, 1968, for the purpose of developing and operating an airport as a joint venture between the Cities. The 1968 Concurrent Bond Ordinance and the 30th Supplemental Bond Ordinance were amended and restated by the Master Bond Ordinance, and approved by the Cities of Fort Worth and Dallas on September 21, 2010 and September 22, 2010, respectively. The Master Bond Ordinance became effective on July 5, 2013 after the required approval of bondholders was obtained. Bonds are issued under provisions of the Master Bond Ordinance, Supplemental Bond Ordinances, as approved by the Cities of Fort Worth and Dallas, and Applicable Laws, including Chapter 22 of the Texas Transportation Code, Chapter 1371 of the Texas Government Code, as amended. DFW is in compliance with all bond covenants. The Lease and Use Agreements (“Use Agreement”) with the signatory airlines define DFW’s rate setting methodology and business relationships with the airlines. DFW’s current ten-year Use Agreement became effective October 1, 2010. Collectively, the abovementioned documents are referred to as the “Controlling Documents.”
Each year, management prepares an Annual Budget (approved by the DFW Board and the Cities) of projected expenses for the Operating Revenue and Expense Fund (commonly referred to as the “102 Operating Fund”). Management also prepares an annual Schedule of Charges which is the basis for charging the airlines, tenants, and other airport users for DFW services during the fiscal year.
The Use Agreement created three primary cost centers: “Airfield”, “Terminal”, and “DFW.” The airfield and terminal cost centers are “residual” in nature. Per Federal Aviation Administration (“FAA”) regulations, DFW can only charge the airlines for the net cost to operate these cost centers (including debt service and coverage) primarily through landing fees and terminal rentals. The Use Agreement also requires certain cash transfers from capital accounts to the 102 Fund each year through FY 2017.
DFW can generate net revenues or profits in the DFW cost center which includes non-airline business units such as concessions, parking, rental car, commercial development, and transportation (e.g. employee busing). If DFW generates net revenues in excess of the “upper threshold” ($64.9 million in FY 2015), 75% of the excess is to be used to reduce landing fees. If the DFW cost center generates revenues below the lower threshold ($43.4 million), landing fees are increased so that the DFW cost center will achieve the lower threshold. If net revenues from the DFW Cost Center are budgeted above the upper threshold, airline landing rates are reduced at the beginning of the fiscal year. Conversely, if net revenues are budgeted below the lower threshold, then the airlines are assessed incremental landing fee rates to achieve the lower “threshold” amount in the current fiscal year by adjusting rates at the beginning of the fiscal year. The “upper threshold” and “lower threshold” amounts are adjusted annually

5 DFW International Airport
for inflation. At the end of each fiscal year, the airport computes a “true-up” for the airfield and terminal cost centers and applies any overcharge or undercharge to the following years’ landing fee rate and/or terminal rental rate, respectively.
DFW’s Capital Improvement Fund has three accounts: joint capital account, DFW capital account and rolling coverage capital account. The joint capital account generally requires approval from both DFW and the airlines prior to any expenditure of funds, while the DFW capital account may be used at the DFW’s sole discretion for any legal purpose. The joint capital account is funded primarily from natural gas royalties, the sale of land, and interest income. The DFW capital account is funded primarily from DFW Cost Center net revenues, subject to upper threshold limits discussed previously. Both accounts can be supplemented with the issuance of debt.
The rolling coverage account was initially funded from the Capital Improvement Account when the lease agreement was signed. The rolling coverage balance is transferred or “rolled” into the 102 Fund each year to fund debt service coverage requirements. It is then transferred back into the rolling coverage account at the end of the fiscal year. If additional coverage is required in any year, it is added to rates and charges and is collected during the fiscal year.
Although DFW uses the word “fund” to designate the source and prospective use of proceeds, DFW is an enterprise fund and does not utilize traditional “fund accounting” commonly used by government organizations. The following table summarizes the primary funds used by DFW and whether the related assets and liabilities are restricted or not restricted:
Fund Number Fund Description Primary UseRestricted (R),
Not Restricted (NR)
101 Net Investment in Capital Assets Capital Assets, Bonds R
102 Operating Revenues and Expenses Operations NR
105, 152-176 Department of Public Safety Seized Funds R
252 Passenger Facility Charges Collections, Debt Service R
301-320 Joint Capital (non-JRB) Capital Projects NR
321-9, 332-3 Joint Capital (JRB) Bond Proceeds R
330-331 Joint Capital (JRB) Construction R
340 DFW (non-JRB) Capital Projects NR
341-344 DFW (JRB) Bond Proceeds, Construction R
350 Rolling Coverage Rate Covenant NR
500s Debt Service Sinking Principal and Interest R
600s Debt Service Reserve Reserve Requirements R
907 PFIC - Rent-A-Car Center Facilities NR
Transportation R
910 PFIC - Grand Hyatt Hotel Operations, Capital NR
Working Capital, FFE R
914 PFIC - Hyatt Place Hotel Construction R
FFE - Furniture, Fixtures and Equipment
PFIC - Public Facility Improvement Corporation
JRB - Joint Revenue Bond
6 DFW International Airport
The basic financial statements include all of DFW’s funds. DFW manages its day-to-day airport operations primarily through the 102 Operating Fund in accordance with the Controlling Documents. The Airport’s financial statements include all of the transactions of the Public Facility Improvement Corporation (“PFIC”), which operates the Grand Hyatt Hotel, collects customer facility charges and customer transaction charges from the Rental Car companies, and is currently constructing a Hyatt Place Hotel near the south entrance of the airport. Although the PFIC is a legally separate entity, the financial transactions of the PFIC have been combined into the Airport’s Enterprise Fund due to their nature and significance to the Airport. The PFIC is considered a blended component unit because the component units’ governing bodies are substantively the same as DFW’s, the primary government.
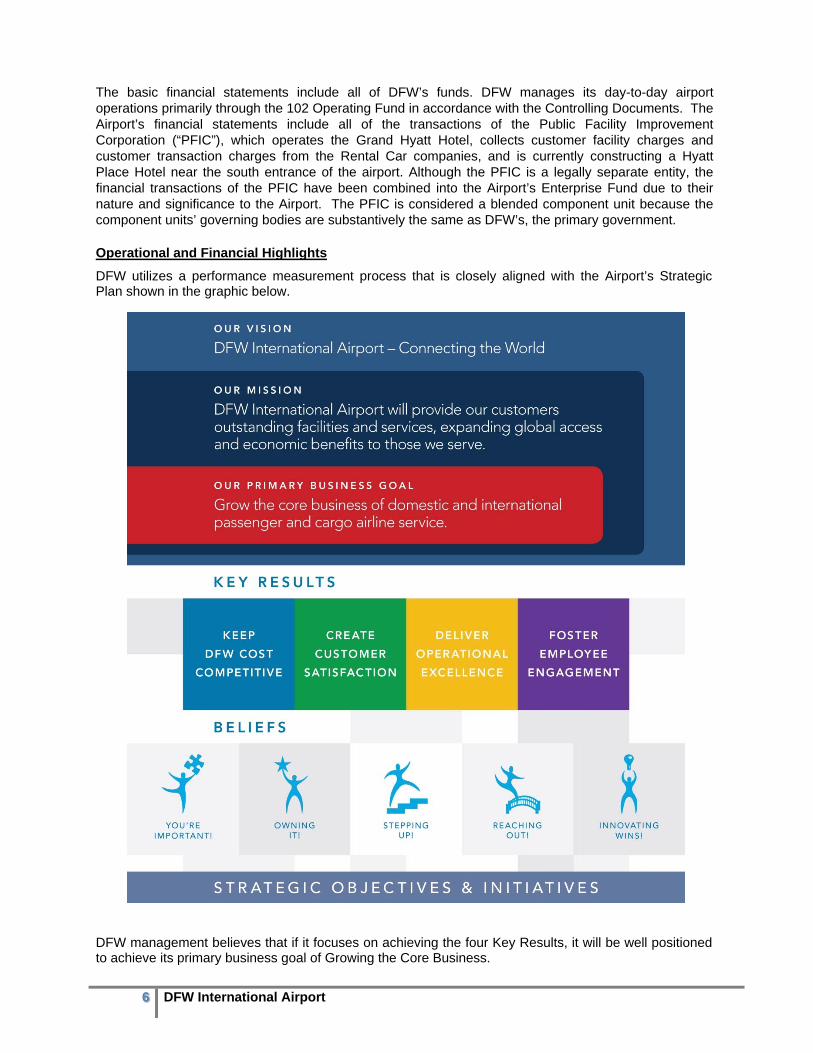
Operational and Financial Highlights
DFW utilizes a performance measurement process that is closely aligned with the Airport’s Strategic Plan shown in the graphic below.
DFW management believes that if it focuses on achieving the four Key Results, it will be well positioned to achieve its primary business goal of Growing the Core Business.
7 DFW International Airport
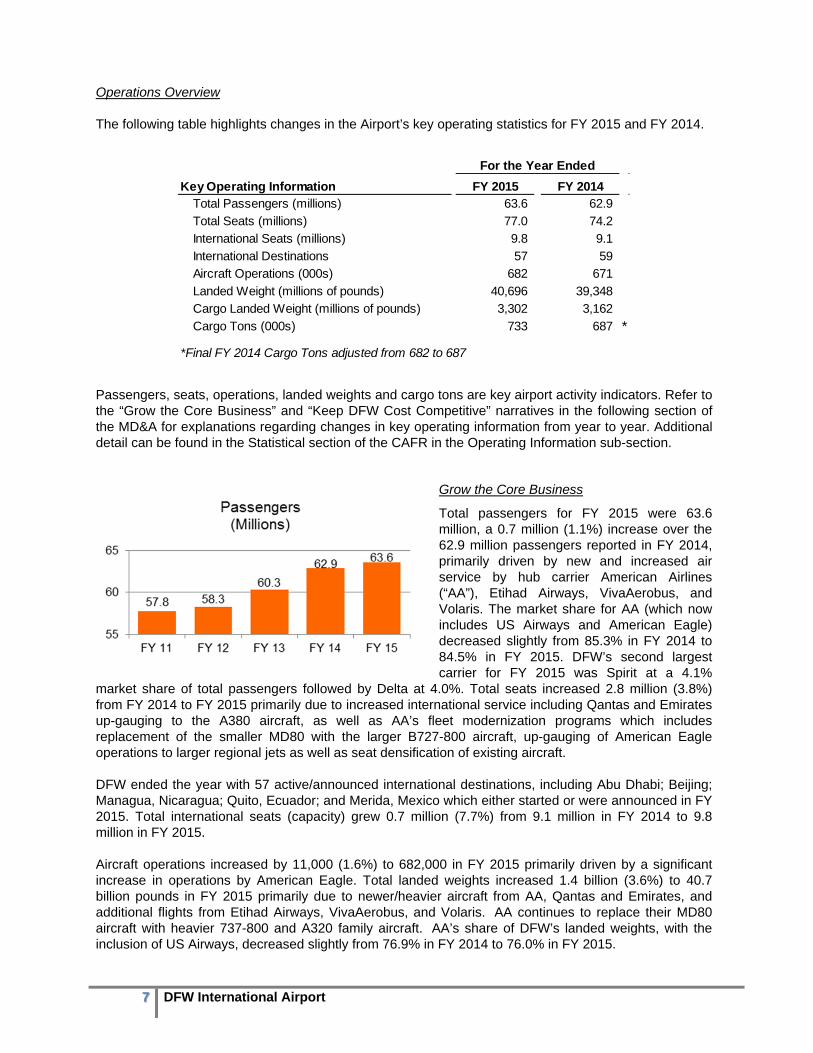
Operations Overview The following table highlights changes in the Airport’s key operating statistics for FY 2015 and FY 2014.
Passengers, seats, operations, landed weights and cargo tons are key airport activity indicators. Refer to the “Grow the Core Business” and “Keep DFW Cost Competitive” narratives in the following section of the MD&A for explanations regarding changes in key operating information from year to year. Additional detail can be found in the Statistical section of the CAFR in the Operating Information sub-section.
Grow the Core Business
Total passengers for FY 2015 were 63.6 million, a 0.7 million (1.1%) increase over the 62.9 million passengers reported in FY 2014, primarily driven by new and increased air service by hub carrier American Airlines (“AA”), Etihad Airways, VivaAerobus, and Volaris. The market share for AA (which now includes US Airways and American Eagle) decreased slightly from 85.3% in FY 2014 to 84.5% in FY 2015. DFW’s second largest carrier for FY 2015 was Spirit at a 4.1%
market share of total passengers followed by Delta at 4.0%. Total seats increased 2.8 million (3.8%) from FY 2014 to FY 2015 primarily due to increased international service including Qantas and Emirates up-gauging to the A380 aircraft, as well as AA’s fleet modernization programs which includes replacement of the smaller MD80 with the larger B727-800 aircraft, up-gauging of American Eagle operations to larger regional jets as well as seat densification of existing aircraft. DFW ended the year with 57 active/announced international destinations, including Abu Dhabi; Beijing; Managua, Nicaragua; Quito, Ecuador; and Merida, Mexico which either started or were announced in FY 2015. Total international seats (capacity) grew 0.7 million (7.7%) from 9.1 million in FY 2014 to 9.8 million in FY 2015. Aircraft operations increased by 11,000 (1.6%) to 682,000 in FY 2015 primarily driven by a significant increase in operations by American Eagle. Total landed weights increased 1.4 billion (3.6%) to 40.7 billion pounds in FY 2015 primarily due to newer/heavier aircraft from AA, Qantas and Emirates, and additional flights from Etihad Airways, VivaAerobus, and Volaris. AA continues to replace their MD80 aircraft with heavier 737-800 and A320 family aircraft. AA’s share of DFW’s landed weights, with the inclusion of US Airways, decreased slightly from 76.9% in FY 2014 to 76.0% in FY 2015.
Key Operating Information FY 2015 FY 2014Total Passengers (millions) 63.6 62.9
Total Seats (millions) 77.0 74.2
International Seats (millions) 9.8 9.1
International Destinations 57 59
Aircraft Operations (000s) 682 671
Landed Weight (millions of pounds) 40,696 39,348
Cargo Landed Weight (millions of pounds) 3,302 3,162
Cargo Tons (000s) 733 687 *
*Final FY 2014 Cargo Tons adjusted from 682 to 687
For the Year Ended

8 DFW International Airport
Cargo tons increased 46,000 (6.7%) from 687,000 in FY 2014 to 733,000 in FY 2015 primarily due to increased capacity in AA’s belly cargo and west coast ocean port congestion issues during the first half of 2014 which shifted cargo from ships to planes.
Keep DFW Cost Competitive
Two industry metrics for cost competitiveness are airline cost and passenger airline cost per enplanement (“CPE”). Airline cost represents the fees paid by the airlines primarily for landing fees and terminal rentals. Both of these metrics will increase in the future as DFW issues bonds to finance its Terminal Renewal and Improvement Program (“TRIP”). The airlines agreed to pay these higher costs when they approved the capital program as part of the Use Agreement. Airline cost was $298.2 million in FY 2015, a $41.6 million (16.2%) increase over FY 2014, and CPE increased from $7.53 in FY 2014 to $8.75 in FY 2015 primarily due to increased debt service and operating costs. Despite these
increases, DFW is competitively positioned, being one of the lowest cost large hub airports in North America, especially when considering other factors like delay and taxiing costs and fuel taxes which are not recorded on DFW’s books.
To help keep airline costs low and maximize discretionary capital funds, DFW works to increase the net revenues, or profit, from its non-airline business units (i.e., parking, concessions, rental car and commercial development). In FY 2015, these four business units generated $278.6 million in
revenues, a $10.4 million (3.9%) improvement over the prior year primarily due to higher parking rates, new and improved concessions options, and increased passenger traffic. DFW Cost Center net revenues were $116.0 million, $13.3 million (13.0%) better than FY 2014 and $51.1 million higher than the “Upper Threshold” of $64.9 million. This allowed DFW to share $38.3 million, 75% of the excess amount, with the airlines to reduce landing fees. The remaining $77.7 million was transferred to the DFW Capital Account at the end of the fiscal year.
Create Customer Satisfaction DFW measures customer satisfaction through an internally developed customer survey to obtain a deeper perspective of the customer experience. DFW’s customer service score was 4.41 (on a 5 point scale) in FY 2015, a 27 basis point increase from 4.14 in FY 2014 due primarily to the extensive renovation of three terminals (A, B and E) and the Terminal A parking garage. Management is focused on improving the customer experience and expects this trend to continue in FY 2016 as terminal renovation is completed and becomes less impactful on the customer; and from the implementation of other initiatives. During FY 2015, DFW established a cross-functional effort called “Sunny Service Days” to create a "command center" to answer customers' needs during the busiest days of Spring Break and throughout the summer. The team provided dedicated customer assistance in-person via Twitter, email, and phone. Live Twitter chat sessions with the CEO and EVPs throughout the program increased engagement among a wider population of airport stakeholders. Employees were able to assist our customers on their journey by interacting with them throughout the terminals delivering “sunny service.”
DFW increased social media engagement and followers averaging 49% across major channels, including Facebook, Twitter, Instagram, and YouTube. DFW now ranks 4th in total social audience for international airports behind Dubai, Chicago O’Hare, and Los Angeles.
9 DFW International Airport
Finally, DFW’s management team continued to work closely with the airlines and improved its very important relationship with American Airlines. During FY 2015 the team gained Majority-in-Interest (MII) approval of all 13 capital projects submitted, totaling $126.0 million.
Deliver Operational Excellence
Operational Excellence reflects the effectiveness and efficiency of DFW’s key processes. The Airport has hundreds of operational excellence metrics, most of which are monitored at the department level. Highlights and significant accomplishments in FY 2015 include the following:
Baggage system availability – Achieved 99.6% Terminal E baggage system availability during FY 2015. This was a high priority given the challenges of replacing the old highly unreliable system during TRIP, while still operating in the terminal at the same time.
TRIP - Managed design and construction of Terminals A, B, and E and related parking garages to keep TRIP on schedule and on budget as compared to the re-baseline budget established in 2014.
ITS Disaster Recovery – Completed phase 1 of the ITS disaster recovery program which includes the opening of a second data center, the award of a contract to provide “cloud” back-up capability, and the completion of detailed disaster recovery plans for ITS’s most critical systems. DFW will continue with the second phase in FY 2016.
MBE/DBE/ACDBE goals - Significantly exceeded the airport’s aspirational goals for procurement and concessions.
New Headquarters - Completed construction and opened DFW’s new administrative headquarters building in January 2015 to consolidate employees from multiple facilities into one to enhance collaboration and innovation.
NextGen - Developed NextGen and Noise Community Engagement Strategy. Ensured that the FAA NextGen Metroplex Plan was favorably endorsed by all surrounding communities while simultaneously achieving FAA and Air Carrier Industry Goals. DFW was also recognized by FAA for its Community Engagement Program.
Sustainability - Became the first airport in North America to achieve ACI Europe’s Airport Carbon Accreditation Level 3. Reduced carbon emissions intensity per passenger by 22.7% which equates to an annual reduction of 4.5%. Thirty percent (30.0%) of the airport’s total energy usage is now green power which ranks DFW 6th of the top 30 local governments. It also qualifies DFW for EPA’s Green Power Leadership Club because the airport significantly exceeds EPA minimum requirements.
Innovation - Achieved DFW’s first patent for the development of interactive touch-screen wayfinding monitors that are used to enhance the customer experience.
Foster Employee Engagement
DFW measures employee engagement through an independently managed and confidential survey. Engagement measures the likelihood that an employee is motivated to give the extra effort it takes to perform their job and support DFW’s mission. DFW’s engagement score for FY 2015 was 79% which is significantly better than the US norm of 64%. DFW also focuses on wellness as part of employee engagement. DFW had a 96% participation rate in its wellness programs and was recognized as one of the “100 Healthiest Places to Work in America” by Healthiest Employees, a technological firm focused on population health.
10 DFW International Airport
Capital Programs and Airport Development Plan Update The Terminal Renewal and Improvement Program (“TRIP”) is the largest component of DFW’s capital program with a budget of $2.7 billion. TRIP provides renovation and renewal of the Airport’s four oldest domestic terminals (A, B, C, and E) that were constructed between 35 and 40 years ago. Approximately two-thirds of the TRIP budget is being used for the replacement of original end-of-life building systems such as electrical, plumbing, heating and cooling, security, fire safety, conveyances, telecommunications, lighting, information technology systems, and jet-bridges in Terminals A and C. The majority of the remaining budget will be used to upgrade ticket halls, TSA security areas, certain baggage systems, and concessions villages. TRIP also includes improvements to the terminal exteriors, entrances, and certain parking structures not being replaced.
Terminals A, B, and E are currently under construction and have a combined budget of $1.9 billion. As of September 30, 2015, DFW has spent approximately 66.2% of this budget with an additional 15.1% under contract for a total of 81.3% spent and committed. The final scheduled opening dates are October 2016 for Terminal A, August 2017 for Terminal B, and July 2017 for Terminal E. Management projects that these terminals will be completed within or at budget. Terminal C has a budget of $817.0 million, with $65.0 million spent as of September 30, 2015. Construction of this terminal cannot begin until Terminal A is complete. The design of Terminal C has been temporarily put on hold pending a review of DFW’s future capital plans.
Excluding TRIP as of September 30, 2015, DFW had 212 approved capital projects in process for a total estimated cost of $1.3 billion through completion. As of September 30, 2015, $804.7 million of this total had been expended and an additional $255.7 million was under contract and committed; leaving approximately $244.3 million remaining to be committed and spent. The more significant projects include Terminal E Enhanced Parking Garage and Roadway ($161.1 million), reconstruction of Taxiway “L” ($51.1 million), Terminal “F” ramp expansion ($51.0 million), Airfield Snow and Ice Removal Equipment ($31.0 million), DPS Headquarters Facility Reconstruction ($21.8 million), and Taxiway “Y” Bridge Reinforcement ($14.5 million). During FY 2015, the airlines approved $99.3 million of new projects to be funded through the issuance of debt.
For a comprehensive review of DFW’s capital programs and funding plan, please see a copy of the DFW Financial Plan, available on DFW’s web page under the Investors/financials tab at www.dfwairport.com.
11 DFW International Airport
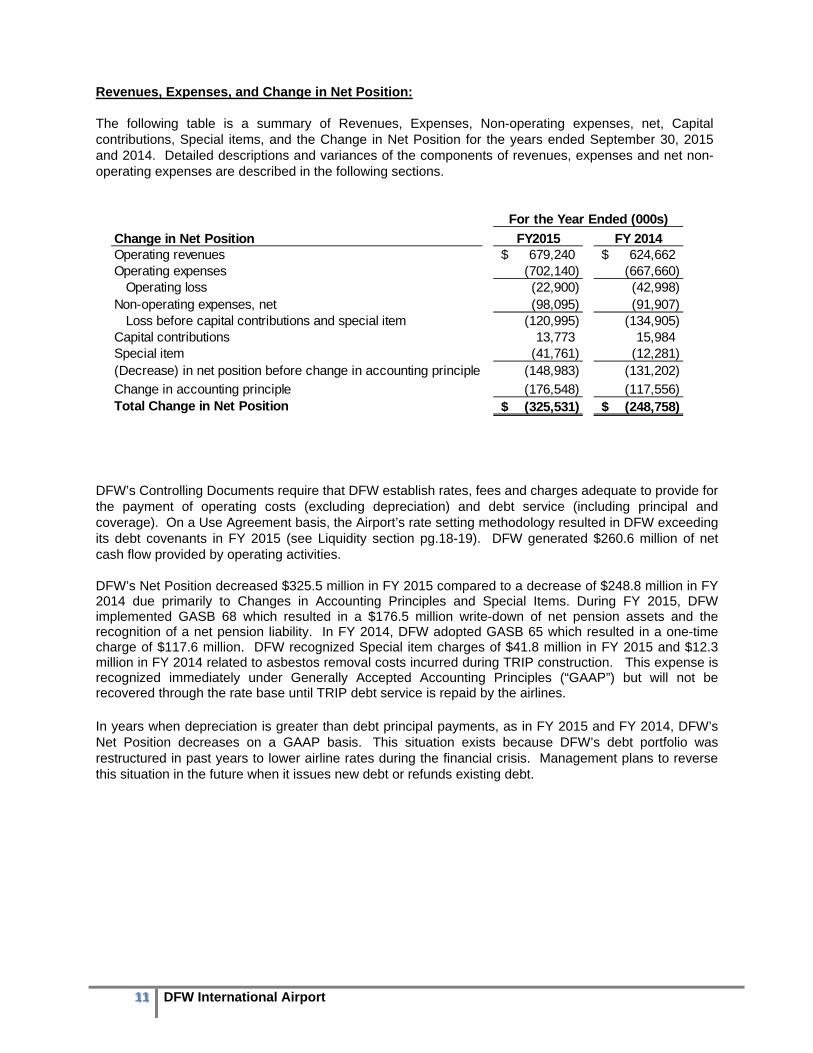
Revenues, Expenses, and Change in Net Position: The following table is a summary of Revenues, Expenses, Non-operating expenses, net, Capital contributions, Special items, and the Change in Net Position for the years ended September 30, 2015 and 2014. Detailed descriptions and variances of the components of revenues, expenses and net non-operating expenses are described in the following sections.
DFW’s Controlling Documents require that DFW establish rates, fees and charges adequate to provide for the payment of operating costs (excluding depreciation) and debt service (including principal and coverage). On a Use Agreement basis, the Airport’s rate setting methodology resulted in DFW exceeding its debt covenants in FY 2015 (see Liquidity section pg.18-19). DFW generated $260.6 million of net cash flow provided by operating activities.
DFW’s Net Position decreased $325.5 million in FY 2015 compared to a decrease of $248.8 million in FY 2014 due primarily to Changes in Accounting Principles and Special Items. During FY 2015, DFW implemented GASB 68 which resulted in a $176.5 million write-down of net pension assets and the recognition of a net pension liability. In FY 2014, DFW adopted GASB 65 which resulted in a one-time charge of $117.6 million. DFW recognized Special item charges of $41.8 million in FY 2015 and $12.3 million in FY 2014 related to asbestos removal costs incurred during TRIP construction. This expense is recognized immediately under Generally Accepted Accounting Principles (“GAAP”) but will not be recovered through the rate base until TRIP debt service is repaid by the airlines. In years when depreciation is greater than debt principal payments, as in FY 2015 and FY 2014, DFW’s Net Position decreases on a GAAP basis. This situation exists because DFW’s debt portfolio was restructured in past years to lower airline rates during the financial crisis. Management plans to reverse this situation in the future when it issues new debt or refunds existing debt.
Change in Net Position FY2015 FY 2014Operating revenues 679,240$ 624,662$ Operating expenses (702,140) (667,660) Operating loss (22,900) (42,998)Non-operating expenses, net (98,095) (91,907) Loss before capital contributions and special item (120,995) (134,905)Capital contributions 13,773 15,984Special item (41,761) (12,281)(Decrease) in net position before change in accounting principle (148,983) (131,202)
Change in accounting principle (176,548) (117,556)Total Change in Net Position (325,531)$ (248,758)$
For the Year Ended (000s)
12 DFW International Airport
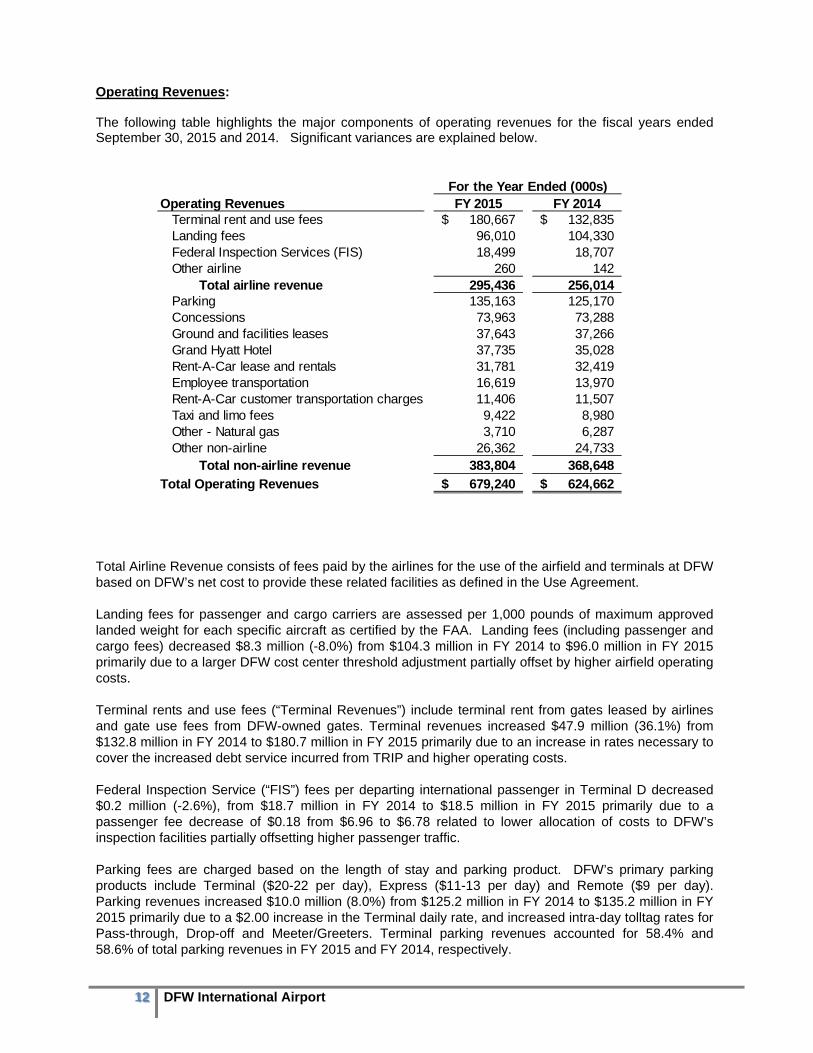
Operating Revenues: The following table highlights the major components of operating revenues for the fiscal years ended September 30, 2015 and 2014. Significant variances are explained below. Total Airline Revenue consists of fees paid by the airlines for the use of the airfield and terminals at DFW based on DFW’s net cost to provide these related facilities as defined in the Use Agreement. Landing fees for passenger and cargo carriers are assessed per 1,000 pounds of maximum approved landed weight for each specific aircraft as certified by the FAA. Landing fees (including passenger and cargo fees) decreased $8.3 million (-8.0%) from $104.3 million in FY 2014 to $96.0 million in FY 2015 primarily due to a larger DFW cost center threshold adjustment partially offset by higher airfield operating costs. Terminal rents and use fees (“Terminal Revenues”) include terminal rent from gates leased by airlines and gate use fees from DFW-owned gates. Terminal revenues increased $47.9 million (36.1%) from $132.8 million in FY 2014 to $180.7 million in FY 2015 primarily due to an increase in rates necessary to cover the increased debt service incurred from TRIP and higher operating costs. Federal Inspection Service (“FIS”) fees per departing international passenger in Terminal D decreased $0.2 million (-2.6%), from $18.7 million in FY 2014 to $18.5 million in FY 2015 primarily due to a passenger fee decrease of $0.18 from $6.96 to $6.78 related to lower allocation of costs to DFW’s inspection facilities partially offsetting higher passenger traffic. Parking fees are charged based on the length of stay and parking product. DFW’s primary parking products include Terminal ($20-22 per day), Express ($11-13 per day) and Remote ($9 per day). Parking revenues increased $10.0 million (8.0%) from $125.2 million in FY 2014 to $135.2 million in FY 2015 primarily due to a $2.00 increase in the Terminal daily rate, and increased intra-day tolltag rates for Pass-through, Drop-off and Meeter/Greeters. Terminal parking revenues accounted for 58.4% and 58.6% of total parking revenues in FY 2015 and FY 2014, respectively.
Operating Revenues FY 2015 FY 2014 Terminal rent and use fees 180,667$ 132,835$ Landing fees 96,010 104,330 Federal Inspection Services (FIS) 18,499 18,707 Other airline 260 142 Total airline revenue 295,436 256,014 Parking 135,163 125,170 Concessions 73,963 73,288 Ground and facilities leases 37,643 37,266 Grand Hyatt Hotel 37,735 35,028 Rent-A-Car lease and rentals 31,781 32,419 Employee transportation 16,619 13,970 Rent-A-Car customer transportation charges 11,406 11,507 Taxi and limo fees 9,422 8,980 Other - Natural gas 3,710 6,287 Other non-airline 26,362 24,733 Total non-airline revenue 383,804 368,648
Total Operating Revenues 679,240$ 624,662$
For the Year Ended (000s)
13 DFW International Airport
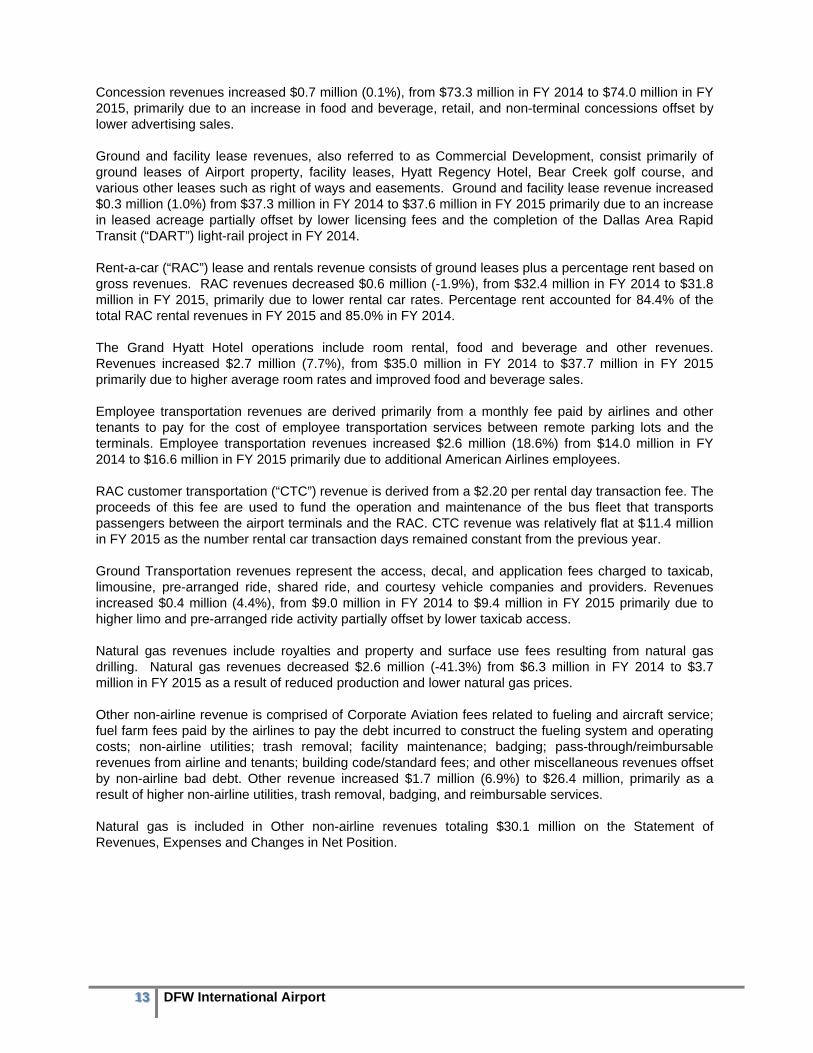
Concession revenues increased $0.7 million (0.1%), from $73.3 million in FY 2014 to $74.0 million in FY 2015, primarily due to an increase in food and beverage, retail, and non-terminal concessions offset by lower advertising sales. Ground and facility lease revenues, also referred to as Commercial Development, consist primarily of ground leases of Airport property, facility leases, Hyatt Regency Hotel, Bear Creek golf course, and various other leases such as right of ways and easements. Ground and facility lease revenue increased $0.3 million (1.0%) from $37.3 million in FY 2014 to $37.6 million in FY 2015 primarily due to an increase in leased acreage partially offset by lower licensing fees and the completion of the Dallas Area Rapid Transit (“DART”) light-rail project in FY 2014. Rent-a-car (“RAC”) lease and rentals revenue consists of ground leases plus a percentage rent based on gross revenues. RAC revenues decreased $0.6 million (-1.9%), from $32.4 million in FY 2014 to $31.8 million in FY 2015, primarily due to lower rental car rates. Percentage rent accounted for 84.4% of the total RAC rental revenues in FY 2015 and 85.0% in FY 2014. The Grand Hyatt Hotel operations include room rental, food and beverage and other revenues. Revenues increased $2.7 million (7.7%), from $35.0 million in FY 2014 to $37.7 million in FY 2015 primarily due to higher average room rates and improved food and beverage sales. Employee transportation revenues are derived primarily from a monthly fee paid by airlines and other tenants to pay for the cost of employee transportation services between remote parking lots and the terminals. Employee transportation revenues increased $2.6 million (18.6%) from $14.0 million in FY 2014 to $16.6 million in FY 2015 primarily due to additional American Airlines employees. RAC customer transportation (“CTC”) revenue is derived from a $2.20 per rental day transaction fee. The proceeds of this fee are used to fund the operation and maintenance of the bus fleet that transports passengers between the airport terminals and the RAC. CTC revenue was relatively flat at $11.4 million in FY 2015 as the number rental car transaction days remained constant from the previous year. Ground Transportation revenues represent the access, decal, and application fees charged to taxicab, limousine, pre-arranged ride, shared ride, and courtesy vehicle companies and providers. Revenues increased $0.4 million (4.4%), from $9.0 million in FY 2014 to $9.4 million in FY 2015 primarily due to higher limo and pre-arranged ride activity partially offset by lower taxicab access. Natural gas revenues include royalties and property and surface use fees resulting from natural gas drilling. Natural gas revenues decreased $2.6 million (-41.3%) from $6.3 million in FY 2014 to $3.7 million in FY 2015 as a result of reduced production and lower natural gas prices. Other non-airline revenue is comprised of Corporate Aviation fees related to fueling and aircraft service; fuel farm fees paid by the airlines to pay the debt incurred to construct the fueling system and operating costs; non-airline utilities; trash removal; facility maintenance; badging; pass-through/reimbursable revenues from airline and tenants; building code/standard fees; and other miscellaneous revenues offset by non-airline bad debt. Other revenue increased $1.7 million (6.9%) to $26.4 million, primarily as a result of higher non-airline utilities, trash removal, badging, and reimbursable services. Natural gas is included in Other non-airline revenues totaling $30.1 million on the Statement of Revenues, Expenses and Changes in Net Position.
14 DFW International Airport
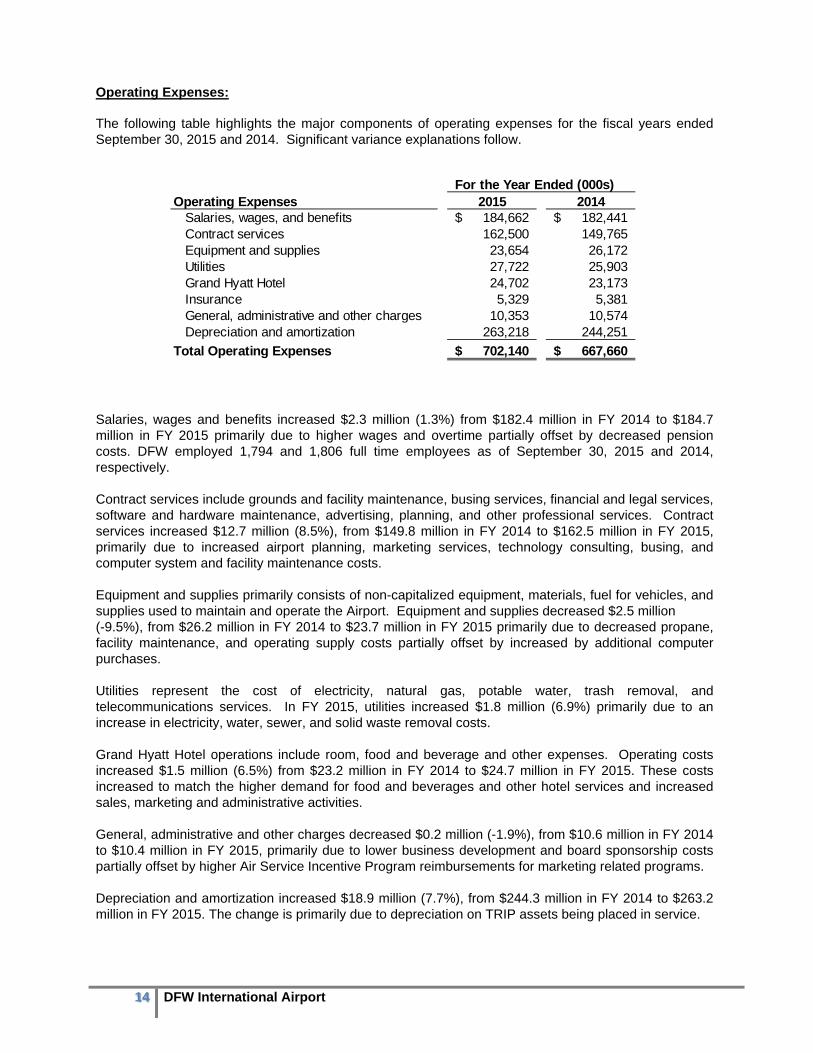
Operating Expenses: The following table highlights the major components of operating expenses for the fiscal years ended September 30, 2015 and 2014. Significant variance explanations follow. Salaries, wages and benefits increased $2.3 million (1.3%) from $182.4 million in FY 2014 to $184.7 million in FY 2015 primarily due to higher wages and overtime partially offset by decreased pension costs. DFW employed 1,794 and 1,806 full time employees as of September 30, 2015 and 2014, respectively. Contract services include grounds and facility maintenance, busing services, financial and legal services, software and hardware maintenance, advertising, planning, and other professional services. Contract services increased $12.7 million (8.5%), from $149.8 million in FY 2014 to $162.5 million in FY 2015, primarily due to increased airport planning, marketing services, technology consulting, busing, and computer system and facility maintenance costs. Equipment and supplies primarily consists of non-capitalized equipment, materials, fuel for vehicles, and supplies used to maintain and operate the Airport. Equipment and supplies decreased $2.5 million (-9.5%), from $26.2 million in FY 2014 to $23.7 million in FY 2015 primarily due to decreased propane, facility maintenance, and operating supply costs partially offset by increased by additional computer purchases. Utilities represent the cost of electricity, natural gas, potable water, trash removal, and telecommunications services. In FY 2015, utilities increased $1.8 million (6.9%) primarily due to an increase in electricity, water, sewer, and solid waste removal costs. Grand Hyatt Hotel operations include room, food and beverage and other expenses. Operating costs increased $1.5 million (6.5%) from $23.2 million in FY 2014 to $24.7 million in FY 2015. These costs increased to match the higher demand for food and beverages and other hotel services and increased sales, marketing and administrative activities. General, administrative and other charges decreased $0.2 million (-1.9%), from $10.6 million in FY 2014 to $10.4 million in FY 2015, primarily due to lower business development and board sponsorship costs partially offset by higher Air Service Incentive Program reimbursements for marketing related programs. Depreciation and amortization increased $18.9 million (7.7%), from $244.3 million in FY 2014 to $263.2 million in FY 2015. The change is primarily due to depreciation on TRIP assets being placed in service.
For the Year Ended (000s)Operating Expenses 2015 2014
Salaries, wages, and benefits 184,662$ 182,441$ Contract services 162,500 149,765 Equipment and supplies 23,654 26,172 Utilities 27,722 25,903 Grand Hyatt Hotel 24,702 23,173 Insurance 5,329 5,381 General, administrative and other charges 10,353 10,574 Depreciation and amortization 263,218 244,251
Total Operating Expenses 702,140$ 667,660$
15 DFW International Airport
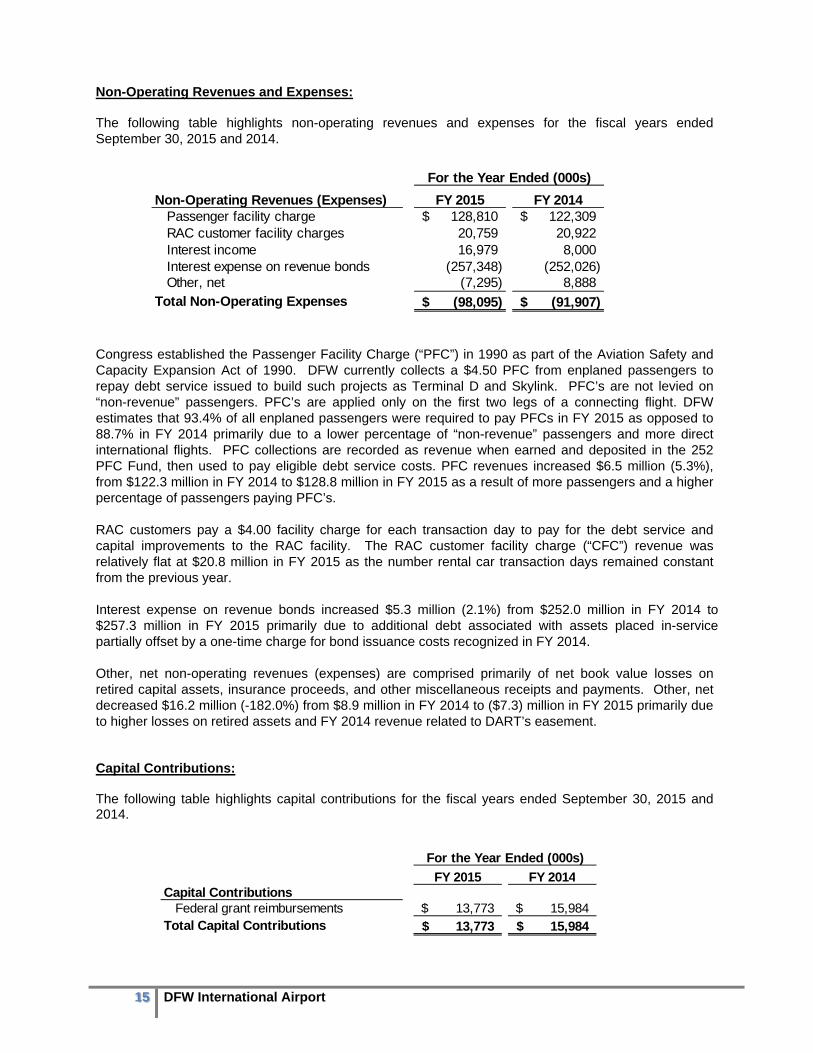
Non-Operating Revenues and Expenses: The following table highlights non-operating revenues and expenses for the fiscal years ended September 30, 2015 and 2014. Congress established the Passenger Facility Charge (“PFC”) in 1990 as part of the Aviation Safety and Capacity Expansion Act of 1990. DFW currently collects a $4.50 PFC from enplaned passengers to repay debt service issued to build such projects as Terminal D and Skylink. PFC’s are not levied on “non-revenue” passengers. PFC’s are applied only on the first two legs of a connecting flight. DFW estimates that 93.4% of all enplaned passengers were required to pay PFCs in FY 2015 as opposed to 88.7% in FY 2014 primarily due to a lower percentage of “non-revenue” passengers and more direct international flights. PFC collections are recorded as revenue when earned and deposited in the 252 PFC Fund, then used to pay eligible debt service costs. PFC revenues increased $6.5 million (5.3%), from $122.3 million in FY 2014 to $128.8 million in FY 2015 as a result of more passengers and a higher percentage of passengers paying PFC’s. RAC customers pay a $4.00 facility charge for each transaction day to pay for the debt service and capital improvements to the RAC facility. The RAC customer facility charge (“CFC”) revenue was relatively flat at $20.8 million in FY 2015 as the number rental car transaction days remained constant from the previous year. Interest expense on revenue bonds increased $5.3 million (2.1%) from $252.0 million in FY 2014 to $257.3 million in FY 2015 primarily due to additional debt associated with assets placed in-service partially offset by a one-time charge for bond issuance costs recognized in FY 2014. Other, net non-operating revenues (expenses) are comprised primarily of net book value losses on retired capital assets, insurance proceeds, and other miscellaneous receipts and payments. Other, net decreased $16.2 million (-182.0%) from $8.9 million in FY 2014 to ($7.3) million in FY 2015 primarily due to higher losses on retired assets and FY 2014 revenue related to DART’s easement. Capital Contributions: The following table highlights capital contributions for the fiscal years ended September 30, 2015 and 2014.
Non-Operating Revenues (Expenses) FY 2015 FY 2014Passenger facility charge 128,810$ 122,309$ RAC customer facility charges 20,759 20,922 Interest income 16,979 8,000 Interest expense on revenue bonds (257,348) (252,026)Other, net (7,295) 8,888
Total Non-Operating Expenses (98,095)$ (91,907)$
For the Year Ended (000s)
FY 2015 FY 2014Capital Contributions
Federal grant reimbursements 13,773$ 15,984$ Total Capital Contributions 13,773$ 15,984$
For the Year Ended (000s)

16 DFW International Airport
DFW receives Airport Improvement Program (“AIP”) and other grants through the Federal Aviation Administration and other Federal and State agencies. Airport grant reimbursements decreased $2.2 million (13.8%) from $16.0 million in FY 2014 to $13.8 million in FY 2015 due to smaller program drawdowns resulting from lower available government discretionary funding. Special Item: In FY 2015, DFW recorded $41.8 million in asbestos removal costs incurred in conjunction with TRIP. This was a $29.5 million (239.8%) increase from the $12.3 million recorded in FY 2014 primarily due to increased renovation activity in three Terminal phases: Terminal A Section C, Terminal B Section A and Terminal E Section B during FY 2015, and an increased presence of asbestos containing materials in Section A of Terminal B and Section B of Terminal E above previous phases. These costs were immediately recognized for GAAP purposes but are being financed as part of TRIP. Change in Accounting Principle: During the year ended September 30, 2015, DFW adopted GASB Statement No. 68, “Accounting and Financial Reporting for Pensions.” Statement No. 68 requires governments providing defined benefit pensions to recognize their long-term obligation for pension benefits as a liability, and to more comprehensively and comparably measure the annual costs of pension benefits. As a result, DFW restated its beginning net position for fiscal year 2015 in the amount of $176.5 million, writing down $52.6 million in net pension assets and recognizing a net pension liability of $123.9 million. This change also resulted in the reporting of a deferred outflow of resources of $11.0 million, recognizing the difference between projected and actual pension plan investments. In addition, a deferred inflow of resources for $3.6 million was reported, recognizing the difference between the expected and actual experience in measurement of the total pension liability. During the year ended September 30, 2014, DFW adopted GASB Statement: No. 65, Items Previously Reported as Assets and Liabilities. GASB Statement No. 65 specifies the items that were previously reported as assets and liabilities that should now be reported as deferred outflows of resources, deferred inflows of resources, outflows of resources, or inflows of resources. As a result, DFW restated its beginning net position for fiscal year 2014 in the amount of $117.6 million to write off unamortized bond issuance costs.
17 DFW International Airport
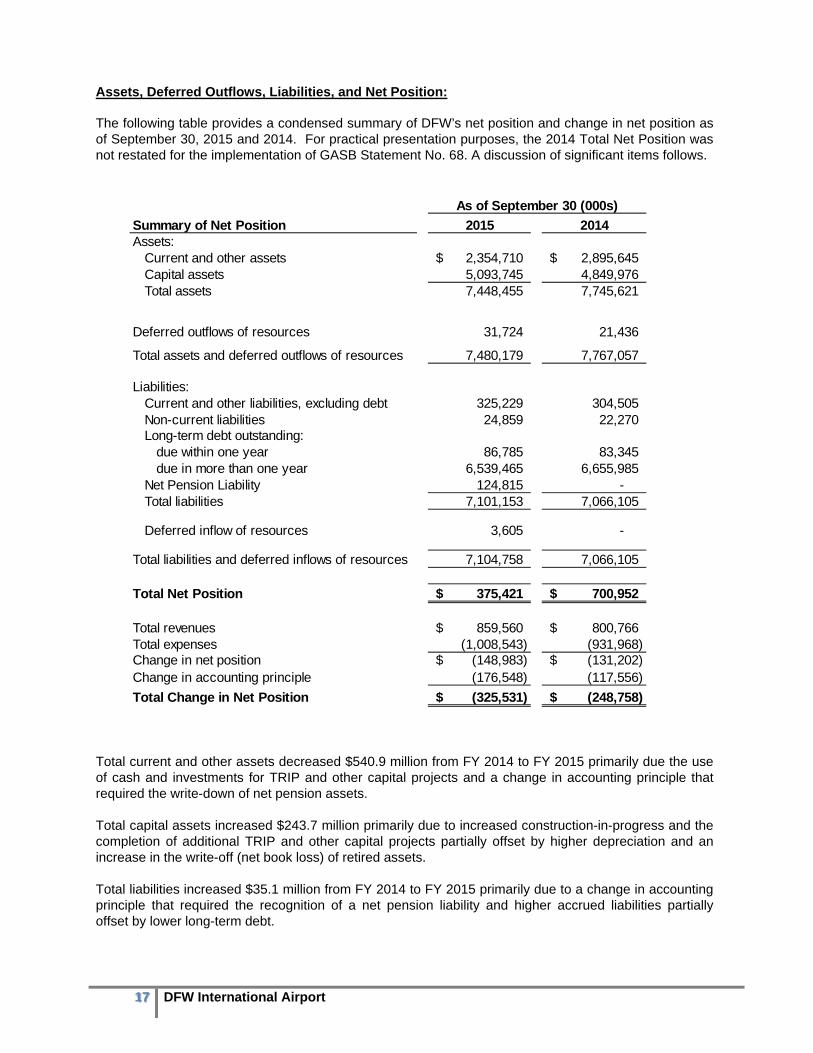
Assets, Deferred Outflows, Liabilities, and Net Position: The following table provides a condensed summary of DFW’s net position and change in net position as of September 30, 2015 and 2014. For practical presentation purposes, the 2014 Total Net Position was not restated for the implementation of GASB Statement No. 68. A discussion of significant items follows.
Total current and other assets decreased $540.9 million from FY 2014 to FY 2015 primarily due the use of cash and investments for TRIP and other capital projects and a change in accounting principle that required the write-down of net pension assets. Total capital assets increased $243.7 million primarily due to increased construction-in-progress and the completion of additional TRIP and other capital projects partially offset by higher depreciation and an increase in the write-off (net book loss) of retired assets. Total liabilities increased $35.1 million from FY 2014 to FY 2015 primarily due to a change in accounting principle that required the recognition of a net pension liability and higher accrued liabilities partially offset by lower long-term debt.
Summary of Net Position 2015 2014Assets: Current and other assets 2,354,710$ 2,895,645$ Capital assets 5,093,745 4,849,976 Total assets 7,448,455 7,745,621
Deferred outflows of resources 31,724 21,436
Total assets and deferred outflows of resources 7,480,179 7,767,057
Liabilities: Current and other liabilities, excluding debt 325,229 304,505 Non-current liabilities 24,859 22,270 Long-term debt outstanding: due within one year 86,785 83,345 due in more than one year 6,539,465 6,655,985 Net Pension Liability 124,815 - Total liabilities 7,101,153 7,066,105
Deferred inflow of resources 3,605 -
Total liabilities and deferred inflows of resources 7,104,758 7,066,105
Total Net Position 375,421$ 700,952$
Total revenues 859,560$ 800,766$ Total expenses (1,008,543) (931,968) Change in net position (148,983)$ (131,202)$ Change in accounting principle (176,548) (117,556)
Total Change in Net Position (325,531)$ (248,758)$
As of September 30 (000s)
18 DFW International Airport
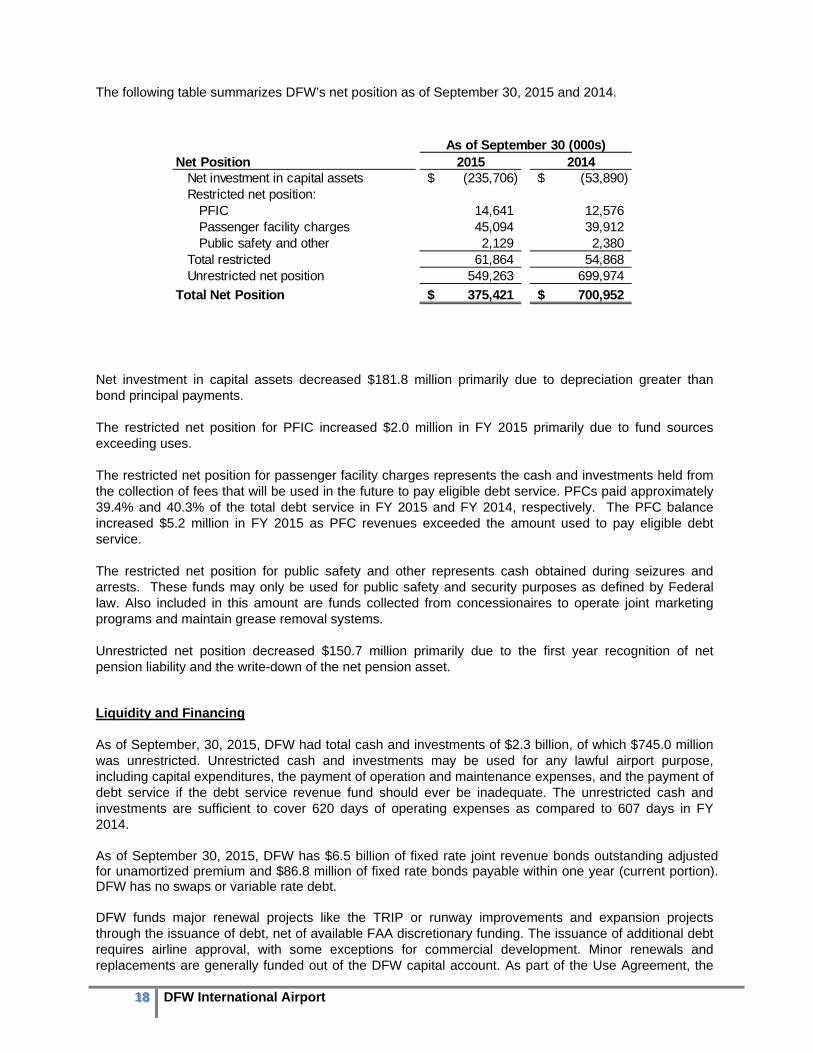
The following table summarizes DFW’s net position as of September 30, 2015 and 2014. Net investment in capital assets decreased $181.8 million primarily due to depreciation greater than bond principal payments. The restricted net position for PFIC increased $2.0 million in FY 2015 primarily due to fund sources exceeding uses. The restricted net position for passenger facility charges represents the cash and investments held from the collection of fees that will be used in the future to pay eligible debt service. PFCs paid approximately 39.4% and 40.3% of the total debt service in FY 2015 and FY 2014, respectively. The PFC balance increased $5.2 million in FY 2015 as PFC revenues exceeded the amount used to pay eligible debt service. The restricted net position for public safety and other represents cash obtained during seizures and arrests. These funds may only be used for public safety and security purposes as defined by Federal law. Also included in this amount are funds collected from concessionaires to operate joint marketing programs and maintain grease removal systems. Unrestricted net position decreased $150.7 million primarily due to the first year recognition of net pension liability and the write-down of the net pension asset. Liquidity and Financing As of September, 30, 2015, DFW had total cash and investments of $2.3 billion, of which $745.0 million was unrestricted. Unrestricted cash and investments may be used for any lawful airport purpose, including capital expenditures, the payment of operation and maintenance expenses, and the payment of debt service if the debt service revenue fund should ever be inadequate. The unrestricted cash and investments are sufficient to cover 620 days of operating expenses as compared to 607 days in FY 2014. As of September 30, 2015, DFW has $6.5 billion of fixed rate joint revenue bonds outstanding adjusted for unamortized premium and $86.8 million of fixed rate bonds payable within one year (current portion). DFW has no swaps or variable rate debt. DFW funds major renewal projects like the TRIP or runway improvements and expansion projects through the issuance of debt, net of available FAA discretionary funding. The issuance of additional debt requires airline approval, with some exceptions for commercial development. Minor renewals and replacements are generally funded out of the DFW capital account. As part of the Use Agreement, the
Net Position 2015 2014Net investment in capital assets (235,706)$ (53,890)$ Restricted net position:
PFIC 14,641 12,576 Passenger facility charges 45,094 39,912 Public safety and other 2,129 2,380
Total restricted 61,864 54,868 Unrestricted net position 549,263 699,974
Total Net Position 375,421$ 700,952$
As of September 30 (000s)
19 DFW International Airport
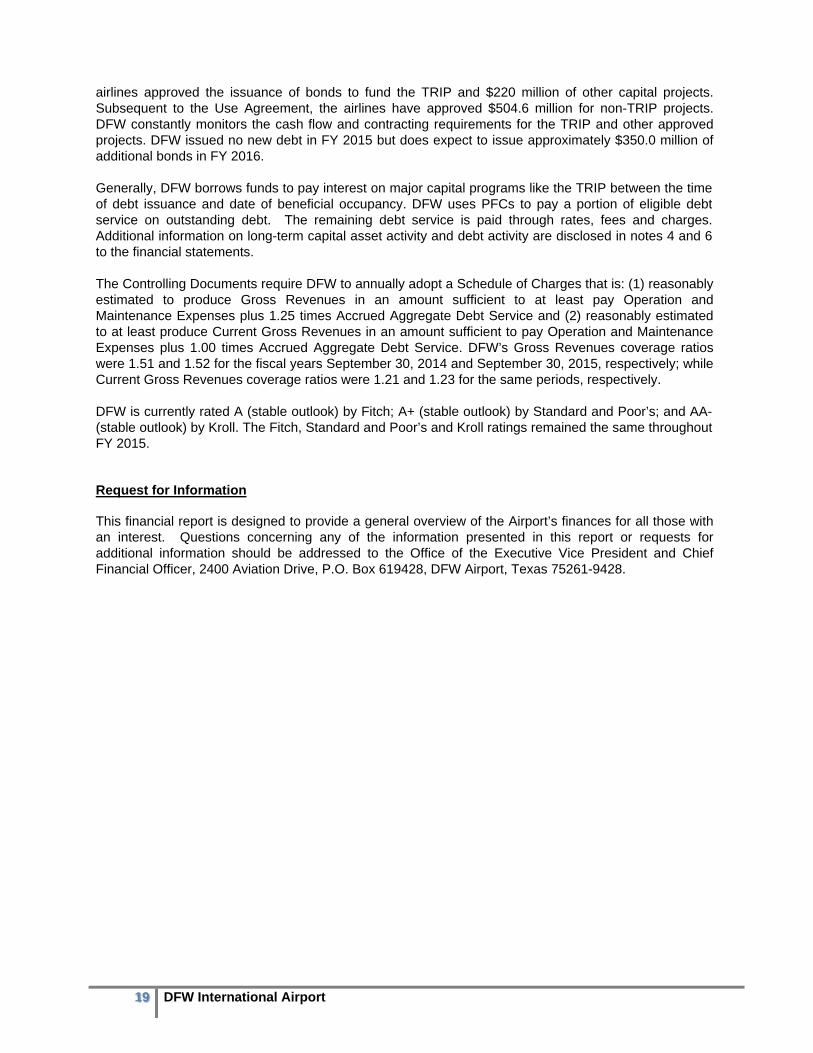
airlines approved the issuance of bonds to fund the TRIP and $220 million of other capital projects. Subsequent to the Use Agreement, the airlines have approved $504.6 million for non-TRIP projects. DFW constantly monitors the cash flow and contracting requirements for the TRIP and other approved projects. DFW issued no new debt in FY 2015 but does expect to issue approximately $350.0 million of additional bonds in FY 2016. Generally, DFW borrows funds to pay interest on major capital programs like the TRIP between the time of debt issuance and date of beneficial occupancy. DFW uses PFCs to pay a portion of eligible debt service on outstanding debt. The remaining debt service is paid through rates, fees and charges. Additional information on long-term capital asset activity and debt activity are disclosed in notes 4 and 6 to the financial statements. The Controlling Documents require DFW to annually adopt a Schedule of Charges that is: (1) reasonably estimated to produce Gross Revenues in an amount sufficient to at least pay Operation and Maintenance Expenses plus 1.25 times Accrued Aggregate Debt Service and (2) reasonably estimated to at least produce Current Gross Revenues in an amount sufficient to pay Operation and Maintenance Expenses plus 1.00 times Accrued Aggregate Debt Service. DFW’s Gross Revenues coverage ratios were 1.51 and 1.52 for the fiscal years September 30, 2014 and September 30, 2015, respectively; while Current Gross Revenues coverage ratios were 1.21 and 1.23 for the same periods, respectively. DFW is currently rated A (stable outlook) by Fitch; A+ (stable outlook) by Standard and Poor’s; and AA- (stable outlook) by Kroll. The Fitch, Standard and Poor’s and Kroll ratings remained the same throughout FY 2015.
Request for Information This financial report is designed to provide a general overview of the Airport’s finances for all those with an interest. Questions concerning any of the information presented in this report or requests for additional information should be addressed to the Office of the Executive Vice President and Chief Financial Officer, 2400 Aviation Drive, P.O. Box 619428, DFW Airport, Texas 75261-9428.
Dallas/Fort Worth International Airport
Statement of Net Position As of September 30, 2015 (Amounts in Thousands)
20 DFW International Airport
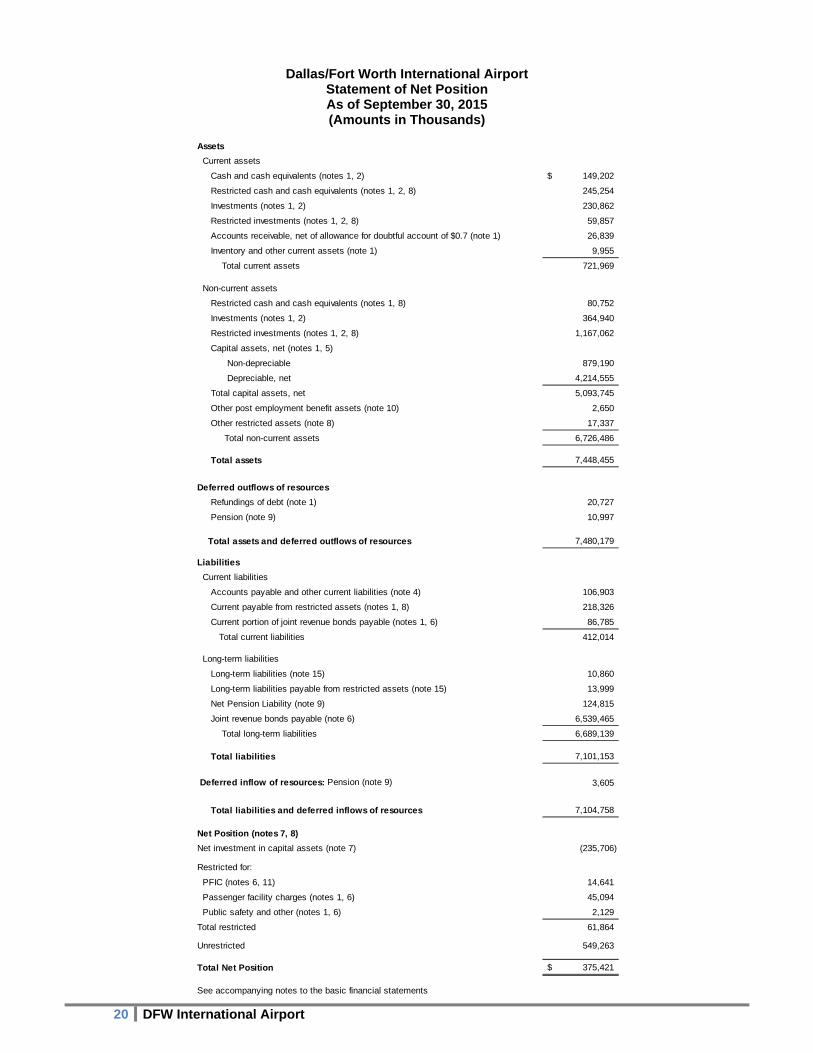
Assets
Current assets
Cash and cash equivalents (notes 1, 2) 149,202$
Restricted cash and cash equivalents (notes 1, 2, 8) 245,254
Investments (notes 1, 2) 230,862
Restricted investments (notes 1, 2, 8) 59,857
Accounts receivable, net of allowance for doubtful account of $0.7 (note 1) 26,839
Inventory and other current assets (note 1) 9,955
Total current assets 721,969
Non-current assets
Restricted cash and cash equivalents (notes 1, 8) 80,752
Investments (notes 1, 2) 364,940
Restricted investments (notes 1, 2, 8) 1,167,062
Capital assets, net (notes 1, 5)
Non-depreciable 879,190
Depreciable, net 4,214,555
Total capital assets, net 5,093,745
Other post employment benefit assets (note 10) 2,650
Other restricted assets (note 8) 17,337
Total non-current assets 6,726,486
Total assets 7,448,455
Deferred outflows of resources
Refundings of debt (note 1) 20,727
Pension (note 9) 10,997
Total assets and deferred outflows of resources 7,480,179
Liabilities
Current liabilities
Accounts payable and other current liabilities (note 4) 106,903
Current payable from restricted assets (notes 1, 8) 218,326
Current portion of joint revenue bonds payable (notes 1, 6) 86,785
Total current liabilities 412,014
Long-term liabilities
Long-term liabilities (note 15) 10,860
Long-term liabilities payable from restricted assets (note 15) 13,999
Net Pension Liability (note 9) 124,815
Joint revenue bonds payable (note 6) 6,539,465
Total long-term liabilities 6,689,139
Total liabilities 7,101,153
Deferred inflow of resources: Pension (note 9) 3,605
Total liabilities and deferred inflows of resources 7,104,758
Net Position (notes 7, 8)
Net investment in capital assets (note 7) (235,706)
Restricted for:
PFIC (notes 6, 11) 14,641
Passenger facility charges (notes 1, 6) 45,094
Public safety and other (notes 1, 6) 2,129
Total restricted 61,864
Unrestricted 549,263
Total Net Position 375,421$
See accompanying notes to the basic financial statements
Dallas/Fort Worth International Airport
Statement of Revenues, Expenses and Changes in Net Position For The Year Ended September 30, 2015
(Amounts in Thousands)
21 DFW International Airport
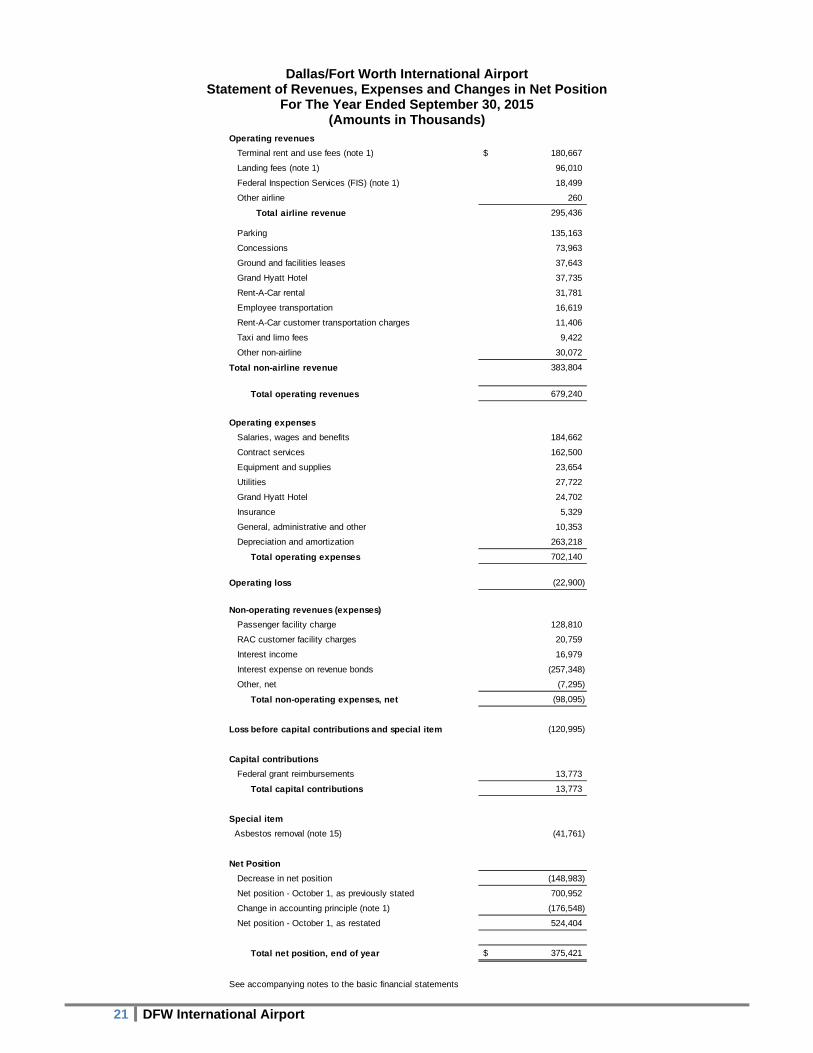
Operating revenues
Terminal rent and use fees (note 1) 180,667$
Landing fees (note 1) 96,010
Federal Inspection Services (FIS) (note 1) 18,499
Other airline 260
Total airline revenue 295,436
Parking 135,163
Concessions 73,963
Ground and facilities leases 37,643
Grand Hyatt Hotel 37,735
Rent-A-Car rental 31,781
Employee transportation 16,619
Rent-A-Car customer transportation charges 11,406
Taxi and limo fees 9,422
Other non-airline 30,072
Total non-airline revenue 383,804
Total operating revenues 679,240
Operating expenses
Salaries, wages and benefits 184,662
Contract services 162,500
Equipment and supplies 23,654
Utilities 27,722
Grand Hyatt Hotel 24,702
Insurance 5,329
General, administrative and other 10,353
Depreciation and amortization 263,218
Total operating expenses 702,140
Operating loss (22,900)
Non-operating revenues (expenses)
Passenger facility charge 128,810
RAC customer facility charges 20,759
Interest income 16,979
Interest expense on revenue bonds (257,348)
Other, net (7,295)
Total non-operating expenses, net (98,095)
Loss before capital contributions and special item (120,995)
Capital contributions
Federal grant reimbursements 13,773
Total capital contributions 13,773
Special item
Asbestos removal (note 15) (41,761)
Net Position
Decrease in net position (148,983)
Net position - October 1, as previously stated 700,952
Change in accounting principle (note 1) (176,548)
Net position - October 1, as restated 524,404
Total net position, end of year 375,421$
See accompanying notes to the basic financial statements
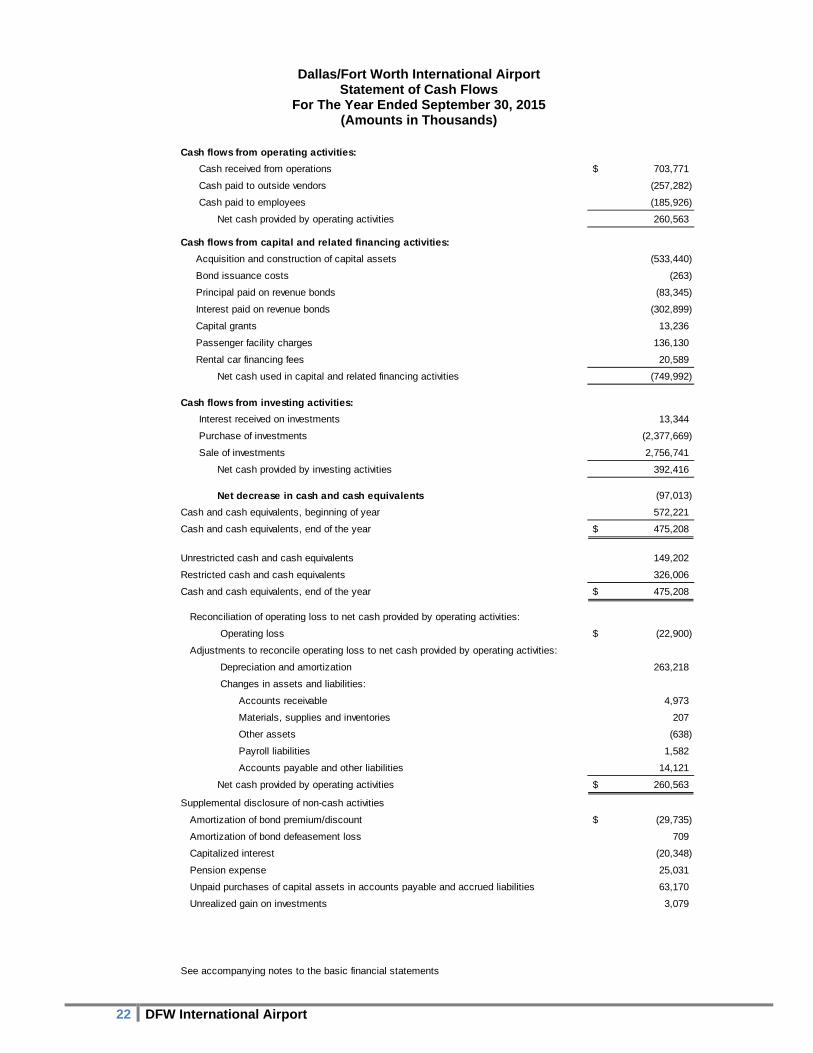
Dallas/Fort Worth International Airport
Statement of Cash Flows For The Year Ended September 30, 2015
(Amounts in Thousands)
22 DFW International Airport
Cash flows from operating activities:
Cash received from operations 703,771$
Cash paid to outside vendors (257,282)
Cash paid to employees (185,926)
Net cash provided by operating activities 260,563
Cash flows from capital and related financing activities:
Acquisition and construction of capital assets (533,440)
Bond issuance costs (263)
Principal paid on revenue bonds (83,345)
Interest paid on revenue bonds (302,899)
Capital grants 13,236
Passenger facility charges 136,130
Rental car financing fees 20,589
Net cash used in capital and related financing activities (749,992)
Cash flows from investing activities:
Interest received on investments 13,344
Purchase of investments (2,377,669)
Sale of investments 2,756,741
Net cash provided by investing activities 392,416
Net decrease in cash and cash equivalents (97,013)
Cash and cash equivalents, beginning of year 572,221
Cash and cash equivalents, end of the year 475,208$
Unrestricted cash and cash equivalents 149,202
Restricted cash and cash equivalents 326,006
Cash and cash equivalents, end of the year 475,208$
Reconciliation of operating loss to net cash provided by operating activities:
Operating loss (22,900)$
Adjustments to reconcile operating loss to net cash provided by operating activities:
Depreciation and amortization 263,218
Changes in assets and liabilities:
Accounts receivable 4,973
Materials, supplies and inventories 207
Other assets (638)
Payroll liabilities 1,582
Accounts payable and other liabilities 14,121
Net cash provided by operating activities 260,563$
Supplemental disclosure of non-cash activities
Amortization of bond premium/discount (29,735)$
Amortization of bond defeasement loss 709
Capitalized interest (20,348)
Pension expense 25,031
Unpaid purchases of capital assets in accounts payable and accrued liabilities 63,170
Unrealized gain on investments 3,079
See accompanying notes to the basic financial statements
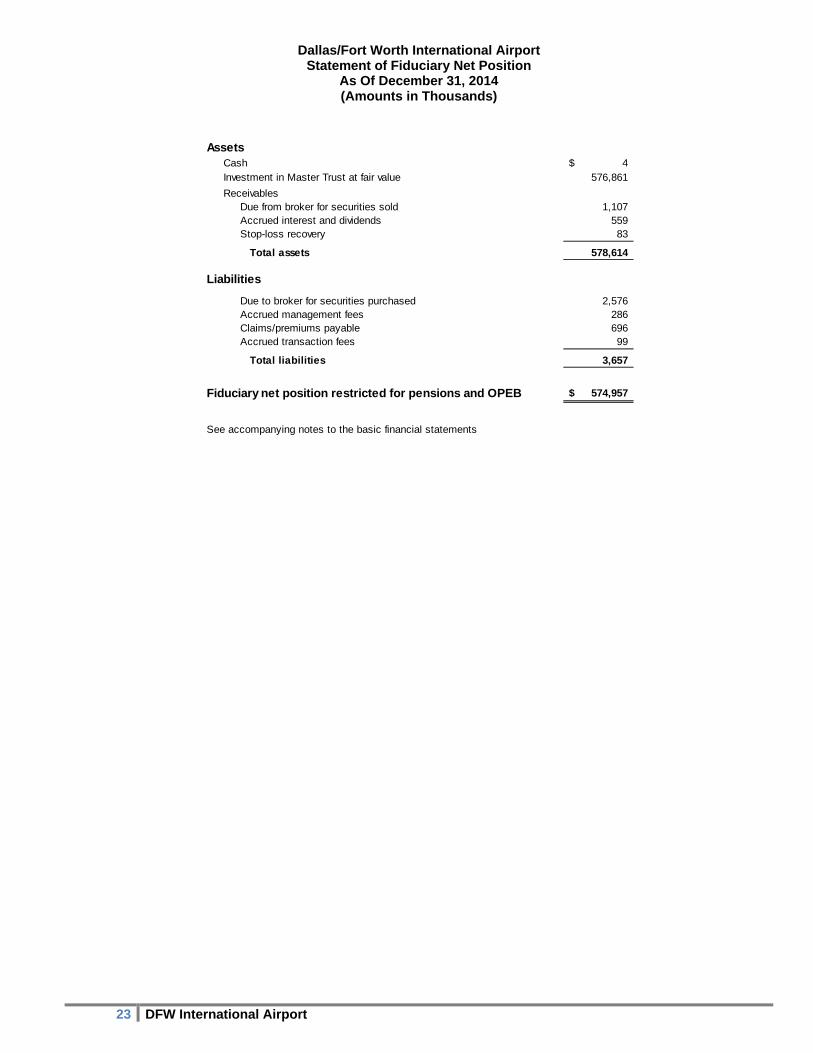
Dallas/Fort Worth International Airport
Statement of Fiduciary Net Position As Of December 31, 2014 (Amounts in Thousands)
23 DFW International Airport
AssetsCash 4$ Investment in Master Trust at fair value 576,861
ReceivablesDue from broker for securities sold 1,107 Accrued interest and dividends 559 Stop-loss recovery 83
Total assets 578,614
Liabilities
Due to broker for securities purchased 2,576 Accrued management fees 286 Claims/premiums payable 696 Accrued transaction fees 99
Total liabilities 3,657
Fiduciary net position restricted for pensions and OPEB 574,957$
See accompanying notes to the basic financial statements
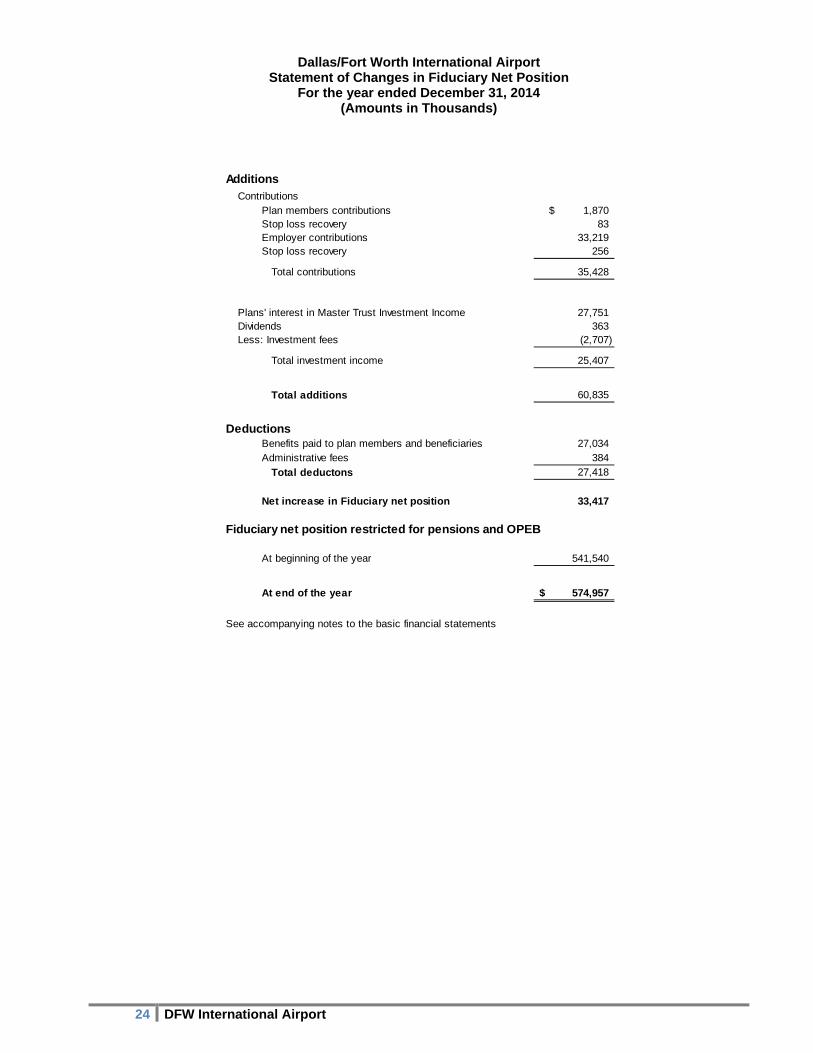
Dallas/Fort Worth International Airport
Statement of Changes in Fiduciary Net Position For the year ended December 31, 2014
(Amounts in Thousands)
24 DFW International Airport
AdditionsContributions
Plan members contributions 1,870$ Stop loss recovery 83 Employer contributions 33,219 Stop loss recovery 256
Total contributions 35,428
Plans' interest in Master Trust Investment Income 27,751 Dividends 363 Less: Investment fees (2,707)
Total investment income 25,407
Total additions 60,835
DeductionsBenefits paid to plan members and beneficiaries 27,034 Administrative fees 384
Total deductons 27,418
Net increase in Fiduciary net position 33,417
Fiduciary net position restricted for pensions and OPEB
At beginning of the year 541,540
At end of the year 574,957$
See accompanying notes to the basic financial statements
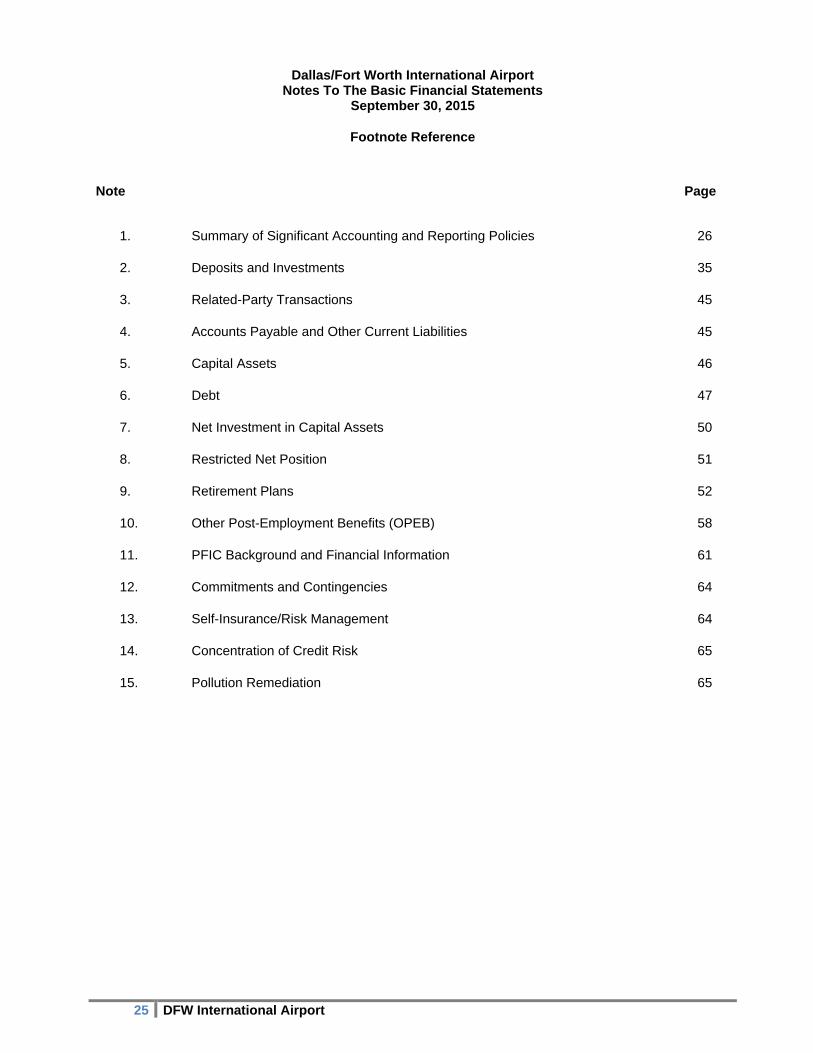
Dallas/Fort Worth International Airport Notes To The Basic Financial Statements
September 30, 2015
25 DFW International Airport
Footnote Reference
Note Page
1. Summary of Significant Accounting and Reporting Policies 26
2. Deposits and Investments 35
3. Related-Party Transactions 45
4. Accounts Payable and Other Current Liabilities 45
5. Capital Assets 46
6. Debt 47
7. Net Investment in Capital Assets 50
8. Restricted Net Position 51
9. Retirement Plans 52
10. Other Post-Employment Benefits (OPEB) 58
11. PFIC Background and Financial Information 61
12. Commitments and Contingencies 64
13. Self-Insurance/Risk Management 64
14. Concentration of Credit Risk 65
15. Pollution Remediation 65
Dallas/Fort Worth International Airport Notes To The Basic Financial Statements
September 30, 2015
26 DFW International Airport
(1) SUMMARY OF SIGNIFICANT ACCOUNTING AND REPORTING POLICIES
(a) Reporting Entity
The Dallas/Fort Worth International Airport (“DFW” or “the Airport”) was created by the Contract and Agreement between the City of Dallas, Texas, and the City of Fort Worth, Texas, effective April 15, 1968 (“Contract and Agreement”), for the purpose of developing and operating an airport as a joint venture of the Cities of Dallas and Fort Worth (“the Cities”) in accordance with the Contract and Agreement. The initial capital was contributed by the Cities. The Cities approve DFW’s annual budget and all bond sales, but have no responsibility for the DFW’s debt service requirements. The DFW Airport Board of Directors (“the Board”) is composed of twelve members, eleven of whom are voting members (seven of which are appointed by Dallas and four by Fort Worth) in accordance with each city’s ownership interest in the Airport. The 12th position rotates between the Airport’s host cities of Irving, Grapevine, Euless or Coppell and is non-voting. The Board is a semi-autonomous body charged with governing the Airport and may enter into contracts without approval of the City Councils. The Board appoints the Chief Executive Officer, who is charged with the day-to-day operations of the Airport. The Chief Executive Officer hires a management team to assist in that responsibility. DFW’s financial statements include all of the transactions of the Dallas/Fort Worth Airport Public Facility Improvement Corporation (“PFIC”). The PFIC operates the Grand Hyatt Hotel and the Rent-a-car facility (“RAC”) and is currently constructing a new Hyatt Place hotel. Grand Hyatt net proceeds are primarily derived from room rentals and the sale of related hotel goods and services. The RAC collects customer facility and customer transportation charges from rental car customers and oversees facility improvements and transportation services. Although the PFIC is a legally separate entity, the financial transactions of PFIC have been included in the Airport’s Enterprise Fund due to their nature and significance to the Airport and to comply with Governmental Accounting Standards Board (“GASB”): Statement No. 14, “The Financial Reporting Entity” as amended by Statement No. 39, “Determining whether Certain Organizations are Component Units”, and Statement No. 61, “The Financial Reporting Entity.” The PFIC is considered a blended component unit because the component unit’s governing body consists of members of the Airport staff, appointed by the Airport Board. The Airport as the primary government, exercises substantial control over the PFIC. In addition, the component unit provides direct benefits exclusively or almost exclusively to the Airport, through the transfer of funds necessary to pay Airport debt. DFW’s Facility Improvement Corporation (“FIC”) is also a legally separate entity, formed for the primary purpose of issuing conduit debt and has no assets or liabilities as September 30, 2015. If there were any financial transactions for the FIC, these would have been included into the Airport’s Enterprise Fund due to their nature and significance to the Airport and to comply with GASB Statement No. 14, “The Financial Reporting Entity” as amended by Statement No. 39, “Determining whether Certain Organizations are Component Units”, and Statement No. 61, “The Financial Reporting Entity.” The FIC is considered a blended component unit because the component unit’s governing body consists of members of the Airport staff, appointed by the Airport Board. The Airport as the primary government, exercises substantial control over the FIC. See footnotes 6(b) and 11 for a further discussion of the FIC and PFIC.
Dallas/Fort Worth International Airport Notes To The Basic Financial Statements
September 30, 2015
27 DFW International Airport
The Fiduciary activities represent two fiduciary pension plans covering substantially all DFW employees with the plans’ year ended December 31, 2014: the Retirement Plans for Employees (“Employee Plan”) and for DPS (“Department of Public Safety”) Covered Employees (“DPS Plan”) of the Dallas/Fort Worth International Airport Board (“Retirement Plans”, collectively). DFW offers a deferred compensation plan 401(a) for employees hired on or after January 1, 2010 (excludes Department of Public Safety employees). The Fiduciary activities also include a single-employer defined Other Post Employment Benefit Plan (“OPEB”) providing retiree health care for qualified retired employees ages 65 or younger with the plan year ended December 31, 2014. \
(b) Basis of Accounting
The accounts of the Airport are organized into an Enterprise Fund which represents the business-type activities; and two Pension Trust Funds and one OPEB Trust Fund which represent the fiduciary activities. The Airport uses a separate set of self-balancing accounts for each fund including: assets, deferred outflows of resources, liabilities, deferred inflows of resources, net position, revenues, and expenses. The Airport includes its fiduciary pension plans, as separate schedules, in its financial statements section. The Basic Financial Statements and Required Supplementary Information (“RSI”) of the Airport consist of Management’s Discussion and Analysis; Statement of Net Position; Statement of Revenues, Expenses, and Changes in Net Position; Statement of Cash Flows; Statement of Fiduciary Net Position; Statement of Changes in Fiduciary Net Position; Notes to the Basic Financial Statements; and for the pension trust funds: Schedule of Changes in the Net Position Liability and Related Ratios; and Schedule of Contributions; as well as the Schedule of Funding Progress for the Other Post-Employment Benefit trust fund. The two generic fund types are categorized as follows: Enterprise Fund – The financial statements of the Enterprise Fund use the economic resource measurement focus and are presented on the accrual basis of accounting. Revenues are recorded when earned. DFW’s operating revenues are derived from fees paid by airlines, tenants, concessionaires, patrons who park at DFW, natural gas royalties, hotel transactions, and others. The fees are based on usage rates established by DFW and/or methodologies established in the Use Agreement. Expenses are recognized when incurred. The Airport constructs facilities to provide services to others, which are financed in part by the issuance of its revenue bonds. Airline users generally contract to pay amounts equal to the Airport’s operating and maintenance expenses (excluding depreciation), debt service and coverage requirements, and any other obligations payable from the revenues of the Airport. Fiduciary Funds – The financial statements of the Fiduciary Funds use the economic resource measurement focus and are presented on the accrual basis of accounting. The Fiduciary Funds are maintained to account for assets held by the Airport in a trustee capacity for active and retired employees. Contributions are recognized in the period in which the contributions are due. Benefits, refunds, claims and premiums are recognized when due and payable in accordance with the terms of each plan. The Fiduciary Funds’ fiscal year end is December 31 of each year. The amounts presented in these financial statements are as of and for the year ended December 31, 2014.
Dallas/Fort Worth International Airport Notes To The Basic Financial Statements
September 30, 2015
28 DFW International Airport
(c) Basis of Presentation
Adoption of Current GASB Statements The GASB issued Statement No. 67, “Financial Reporting for Pension Plans; an amendment of GASB Statement No. 25.” This Statement replaces the requirements of Statements No. 25, “Financial Reporting for Defined Benefit Pension Plans and Note Disclosures for Defined Contribution Plans”, and GASB Statement No. 50, “Pension Disclosures”, related to pension plans that are administered through trusts or equivalent arrangements. In the 2014 plan year, the Plans adopted GASB Statement No. 67. This Statement replaces many of the requirements of Statements No. 25 and No. 50 as they relate to pension plans that are administered through trusts or similar arrangements meeting certain criteria. This Statement builds upon the existing framework for financial reports of defined benefit pension plans, which includes a statement of fiduciary net position (the amount held in a trust for paying retirement benefits) and a statement of changes in fiduciary net position. Statement No. 67 enhances note disclosures and required supplementary information for both defined benefit and defined contribution pension plans. Statement No. 67 also required the presentation of new information about annual money-weighted rates of return in the notes to the financial statements and in the 10-year historical RSI schedules. The adoption of Statement No. 67 resulted in no material impact to the 2014 fiduciary net position restricted for pensions. GASB issued Statement No. 68, “Accounting and Financial Reporting for Pensions.” This Statement replaces the requirements of Statement No. 27, “Accounting for Pensions by State and Local Governmental Employers” and Statement No. 50, “Pension Disclosures”, as they relate to governments that provide pensions through pension plans administered as trusts or similar arrangements that meet certain criteria. Statement No. 68 requires governments providing defined benefit pensions to recognize their long-term obligation for pension benefits as a liability for the first time, and to more comprehensively and comparably measure the annual costs of pension benefits. This Statement also enhances accountability and transparency through revised and new note disclosures and required supplementary information. The adoption of Statement No. 68 resulted in the following changes on October 1, 2014:
1. Recognition of $3.6 million in deferred outflow of resources related to the additional contribution under GASB Statement No. 71 (see below)
2. Elimination of DFW’s net pension asset for $56.2 million 3. Recognition of a net pension liability for $123.9 million
The change in accounting principle reduced net position by a total of $176.5 million on the date of adoption. DFW also recognized deferred outflows of resources of $13.8 million for the difference between projected and actual earnings on pension plan investments, and deferred inflows of resources of $4.7 million for the difference between expected and actual experience in the measurement of the total pension liability. The GASB has issued Statement No. 69, “Government Combinations and Disposals of Government Operations.” Effective for financial statements for fiscal years beginning after December 15, 2013, this statement establishes accounting and financial reporting standards related to government combinations and disposals of government operations. The adoption of this pronouncement did not impact the Airport’s financial statements.
Dallas/Fort Worth International Airport Notes To The Basic Financial Statements
September 30, 2015
29 DFW International Airport
The GASB has issued Statement No. 71, “Pension Transition for Contributions Made Subsequent to the Measurement Date.” Effective for financial statements for fiscal years beginning after June 15, 2014, this statement amends Statement No. 68 to require that, at transition, a beginning deferred outflow of resources is recognized for its pension contributions made subsequent to its measurement date of the beginning net pension liability. DFW deferred the full $3.6 million additional contribution made in FY 2014. In FY 2015, the additional contribution was recognized in the current fiscal year’s net pension liability and associated pension expense. Future GASB Statements The GASB has issued Statement No. 72, “Fair Value Measurement and Application.” Effective for financial statements for fiscal years beginning after June 15, 2015, this statement addresses accounting and financial reporting issues related to fair value measurements. This Statement requires a government to use valuation techniques that are appropriate under the circumstances and for which sufficient data are available to measure fair value. This Statement establishes a hierarchy of inputs to valuation techniques used to measure fair value. This Statement also requires disclosures to be made about fair value measurements, the level of fair value hierarchy, and valuation techniques. DFW is evaluating the effect that Statement No. 72 will have on its financial statements. The GASB has issued Statement No. 73, “Accounting and Financial Reporting for Pensions and Related Assets That Are Not within the Scope of GASB Statement 68, and Amendments to Certain Provisions of GASB Statements No. 67 and 68.” The provisions in Statement No. 73 are effective for fiscal years beginning after June 15, 2015, except those provisions that address employers and governmental nonemployer contributing entities for pensions that are not within the scope of Statement No. 68, which are effective for fiscal years beginning after June 15, 2016. DFW is evaluating the effect that Statement No. 73 will have on its financial statements. The GASB has issued Statement No. 74, “Financial Reporting for Postemployment Benefit Plans Other Than Pension Plans.” This statement replaces Statement No. 43, “Financial Reporting for Postemployment Benefit Plans Other Than Pension Plans,” as amended, and Statement No. 57, “OPEB Measurements by Agent Employers and Agent Multiple-Employer Plans.” It also includes requirements for defined contribution OPEB plans that replace the requirements for those OPEB plans in Statement No. 25, “Financial Reporting for Defined Benefit Pension Plans and Note Disclosures for Defined Contribution Plans,” as amended, Statement No. 43, and Statement No. 50, “Pension Disclosures.” Effective for financial statements for fiscal years beginning after June 15, 2016, this statement establishes new accounting and financial reporting requirements for governments whose employees are provided with OPEB, as well as for certain nonemployer governments that have a legal obligation to provide financial support for OPEB provided to the employees of other entities. DFW is evaluating the effect that Statement No. 74 will have on its financial statements. The GASB has issued Statement No. 75, “Accounting and Financial Reporting for Postemployment Benefits Other Than Pensions.” This statement replaces Statement No. 45, “Accounting and Financial Reporting by Employers for Postemployment Benefits Other Than Pensions,” as amended, and Statement No. 57, “OPEB Measurements by Agent Employers and Agent Multiple-Employer Plans.” Effective for financial statements for fiscal years beginning after June 15, 2017, Statement No. 75 addresses accounting and financial reporting for OPEB that is provided to the employees of state and local governmental employers. This statement also establishes the standard for recognizing and measuring liabilities, deferred outflows of resources, deferred inflows of resources, and expense/expenditures. DFW is evaluating the effect that Statement No. 75 will have on its financial statements.
Dallas/Fort Worth International Airport Notes To The Basic Financial Statements
September 30, 2015
30 DFW International Airport
The GASB has issued Statement No. 76, “The Hierarchy of Generally Accepted Accounting Principles for State and Local Governments.” This Statement supersedes Statement No. 55, “The Hierarchy of Generally Accepted Accounting Principles for State and Local Governments.” The requirements of Statement No. 76 are effective for financial statements for periods beginning after June 15, 2015, and should be applied retroactively. DFW is evaluating the effect that Statement No. 76 will have on its financial statements. The GASB has issued Statement No. 77, “Tax Abatement Disclosures.” Effective for financial statements for fiscal years beginning after December 15, 2015, this statement requires governments that enter into tax abatement agreements to disclose the information about the agreements. DFW is evaluating the effect that Statement No. 77 will have on its financial statements. The GASB has issued Statement No. 78, “Pensions Provided through Certain Multiple-Employer Defined Benefit Pension Plans.” Effective for financial statements for fiscal years beginning after December 15, 2015, Statement No. 78 amends the scope and applicability of Statement No. 68 to exclude certain cost-sharing multiple-employer defined benefit pension plans. DFW will not be impacted by Statement No. 78. The GASB has issued Statement No. 79, “Certain External Investment Pools and Pool Participants.” This statement is effective for financial statements for fiscal years beginning after June 15, 2015, except for certain provision on portfolio quality, custodial credit risk, and shadow pricing. Those provisions are effective for fiscal years beginning after December 15, 2015. Statement No. 79 establishes criteria for an external investment pool to qualify for making the election to measure all of its investments at amortized cost. DFW is evaluating the effect that Statement No. 79 will have on its financial statements. Operating and Non-Operating Revenues The Airport distinguishes between operating revenues and non-operating revenues based on the nature of revenues and expenses. In general, revenues and related expenses resulting from providing services such as aircraft landing, parking, hotel transactions, terminal rental, ground rental and natural gas leases are considered operating. These revenues result from exchange transactions in which each party receives and gives up essentially equal values. Revenues are reported net of Air Service Incentive Program (“ASIP”) costs of $9.9 million (Landing Fees $4.0 million, Turn Fees $2.3 million and Federal Inspection Service $3.6 million.) Non-operating revenues, such as interest income, passenger facilities charges and customer facility charges, result from non-exchange transactions or ancillary activities. Non-operating expenses primarily consist of the interest expense on joint revenue bonds. Capital grants are recorded as capital contributions.
(d) Cash, Cash Equivalents, and Investments
Cash and cash equivalents For purposes of the statements of cash flows, the Airport considers cash on hand, money market funds, and investments with an original maturity of three months or less, when originally purchased, to be cash equivalents, whether unrestricted or restricted. All bank balances are moved to collateralized overnight sweep accounts.
Dallas/Fort Worth International Airport Notes To The Basic Financial Statements
September 30, 2015
31 DFW International Airport
Investments All investments held at fiscal year-end with maturities of more than one year from the date of purchase are stated at fair value. Investments with a maturity of one year or less from the date of purchase are reported at amortized cost. The Airport may invest in obligations of the United States or its agencies, obligations of the State of Texas or its agencies, and certificates of deposits; municipal obligations and repurchase agreements having a rating not less than A; and certain bankers’ acceptances, commercial paper, Securities Exchange Commission (“SEC”) regulated money market mutual funds, local government investment pools, and guaranteed investment contracts. Under the current investment policy, the fiduciary funds invest in money market funds, domestic equities, international equities, private equity funds and fixed income instruments.
(e) Accounts Receivable
Receivables are reported at their gross value when earned. The Airport’s collection terms are 20 days. The allowance for uncollectible accounts is based on a weighted aging calculation. As a customer’s balance is deemed uncollectible, the receivable is cleared and the amount is written off. If the balance is subsequently collected, such payments are applied to the allowance account. The allowance for doubtful accounts was $0.7 million as of September 30, 2015. This allowance is netted against the Accounts Receivable balance.
(f) Materials and Supplies Inventories
Inventories are valued at the lower of average cost or market and consist primarily of expendable parts and supplies held for consumption within the next year.
(g) Capital Assets
All capital assets are stated at historical cost or, if donated, at the fair value on the date donated. The capitalization threshold for real property is $50,000 and $15,000 for personal property with a useful life greater than one year. Depreciation is calculated on the straight-line method over the following estimated useful lives:
Repairs and maintenance are charged to operations as incurred unless they have the effect of improving or extending the life of the asset, in which case they are capitalized as part of the cost of the asset. Construction-in-progress is composed of costs attributable to construction of taxiways, roads, terminal improvements, systems installation and conversion, and various other projects.
Buildings 10 - 50 yearsImprovements other than buildings 10 - 50 yearsVehicles 2 - 20 yearsOther machinery and equipment 3 - 30 years
Dallas/Fort Worth International Airport Notes To The Basic Financial Statements
September 30, 2015
32 DFW International Airport
(h) Capitalized Interest
Interest is capitalized on assets during construction. The total capitalized interest was $20.3 million in FY 2015.
(i) Grants and Federal Reimbursements
Grants and Federal reimbursements are recorded as revenue in the accounting period in which eligibility requirements have been met on projects.
(j) Passenger Facilities Charge (“PFC”)
The PFC program is authorized by federal legislation and allows an airport to impose a fee for use of its facilities up to $4.50 on revenue enplaning passengers. PFC’s may only be used for FAA approved projects. DFW collects PFC’s at the $4.50 level allowed by regulations. PFC’s are collected by the air carriers when the ticket is purchased and remitted to the airport on a monthly basis. As of September 30, 2015, the FAA has approved ten applications for the Airport for a total collection authority of $5.7 billion through October 2038. The remaining collection authority is $3.6 billion. DFW is currently collecting and expending PFC’s under PFC Application 10; applications 1 – 9 are closed.
(k) Deferred Compensation Plans
The Airport offers a deferred compensation plan, created in accordance with Internal Revenue Code “(IRC”) Section 457, to all Airport employees to allow them to defer a portion of their salaries up to IRC limits. The deferred compensation is not available to employees until termination, retirement, death, or an unforeseeable emergency. Amounts are held in trust for the benefit of the Airport’s employees and are not subject to claims of the Airport’s general creditors. The Airport is not the trustee of the Deferred Compensation Plan. The 457 Deferred Compensation Plan (the “457 Plan”) balances totaling $66.0 million for 2015 are not reported in the assets or liabilities of the Airport in accordance with GASB Statement No. 32, “Accounting and Financial Reporting for Internal Revenue Code Section 457 Deferred Compensation Plans.” Beginning January 2010, DFW requires employees, excluding Public Safety Officers, hired after January 1, 2010 to participate in a deferred compensation plan, created in accordance with Internal Revenue Code Section 401(a), in which employees are required to defer 1% to 3% of their salaries, based on tenure. All new employees are also eligible to participate in the 457 Plan for employees hired after January 1, 2010. DFW will match up to 7% of employee contributions to both the 401(a) and 457 plans. The deferred compensation is not available to employees until termination, retirement, death, or an unforeseeable emergency. Amounts are held in trust for the benefit of the Airport’s employee and are not subject to claims of the Airport’s general creditors. The Airport is not the trustee of the Plan. The 401(a) Deferred Compensation Plan balances totaling $5.2 million for 2015 are not reported in the assets or liabilities of the Airport in accordance with GASB Statement No. 32, “Accounting and Financial Reporting for Internal Revenue Code Section 457 Deferred Compensation Plans.”
Dallas/Fort Worth International Airport Notes To The Basic Financial Statements
September 30, 2015
33 DFW International Airport
(l) Retirement Plans
It is the policy of the Airport to fund the pension costs of its two retirement plans annually. Pension costs are comprised of normal cost and amortization, unfunded actuarial accrued liability, and unfunded prior service cost. GASB Statement No. 68 eliminated the previously reported Net Pension Asset resulting in a write-down of $52.6 million. DFW made contributions of $27.9 million in FY 2015. In prior years, DFW funded its pension plans in excess of the actuarial requirements because it currently has an unfunded actuarial accrued liability. In the 2014 plan year, the Plans adopted GASB Statement No. 67, “Financial Reporting for Pension Plans.” This Statement replaces many of the requirements of Statement No. 25, “Financial Reporting for Defined Benefit Pension Plans and Note Disclosures for Defined Contribution Plans”, and Statement No. 50 as they relate to pension plans that are administered through trusts or similar arrangements meeting certain criteria. This Statement builds upon the existing framework for financial reports of defined benefit pension plans, which includes a statement of fiduciary net position (the amount held in a trust for paying retirement benefits) and a statement of changes in fiduciary net position. Statement No. 67 enhances note disclosures and required supplementary information for both defined benefit and defined contribution pension plans. Statement No. 67 also requires the presentation of new information about annual money-weighted rates of return in the notes to the financial statements and in the 10-year historical RSI schedules. The adoption of Statement No. 67 resulted in no material impact to the 2014 fiduciary net position restricted for pensions. Investments are stated at fair value. Fair value of a financial instrument is the amount that would be received to sell an asset or paid to transfer a liability in an orderly transaction between market participants at the measurement date. Purchases and sales of securities are recorded on a trade-date basis. Interest income is recorded on the accrual basis. Dividends are recorded on the ex-dividend date. Net appreciation includes the Plans’ gains and losses on investments bought and sold as well as held during the year. Investments are valued at fair value based on quoted market values when available.
(m) Other Post-Employment Benefits (“OPEB”) Plan
It is the policy of the Airport to fund the OPEB cost annually. OPEB costs are comprised of normal cost and amortization of the unfunded actuarial accrued liability. The Airport currently carries a Net OPEB Asset of $2.6 million as of September 30, 2015, which is the cumulative difference between the annual OPEB costs and contribution made to the OPEB Plan. DFW made a contribution of $1.7 million in FY 2015. The OPEB plan is accounted for in accordance with GASB Statement No. 43, “Financial Reporting for Post-employment Benefit Plans Other than Pension Plans” and GASB Statement No. 45, “Accounting and Financial Reporting by Employers for Post-Employment Benefits Other than Pensions.” Claims and premiums are recognized when due and payable. Investments are stated at fair value.
(n) Restricted Assets and Liabilities
Restricted assets consist of cash, investments, and other resources that are legally restricted by third parties to certain uses. Capital funds are restricted to pay the costs of certain capital projects as defined in various supplemental bond ordinances. PFC program funds are restricted to pay the cost of FAA approved capital projects and any debt incurred to finance those projects. Debt service funds are restricted to make payments for principal and interest as
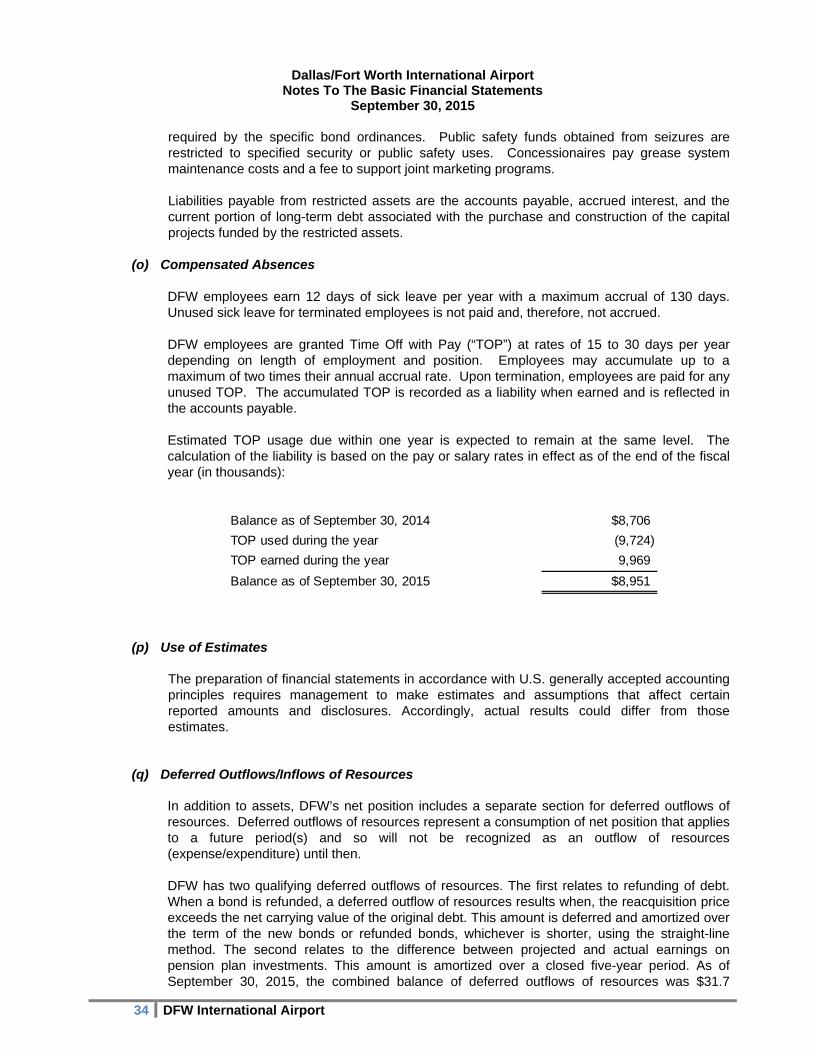
Dallas/Fort Worth International Airport Notes To The Basic Financial Statements
September 30, 2015
34 DFW International Airport
required by the specific bond ordinances. Public safety funds obtained from seizures are restricted to specified security or public safety uses. Concessionaires pay grease system maintenance costs and a fee to support joint marketing programs. Liabilities payable from restricted assets are the accounts payable, accrued interest, and the current portion of long-term debt associated with the purchase and construction of the capital projects funded by the restricted assets.
(o) Compensated Absences
DFW employees earn 12 days of sick leave per year with a maximum accrual of 130 days. Unused sick leave for terminated employees is not paid and, therefore, not accrued. DFW employees are granted Time Off with Pay (“TOP”) at rates of 15 to 30 days per year depending on length of employment and position. Employees may accumulate up to a maximum of two times their annual accrual rate. Upon termination, employees are paid for any unused TOP. The accumulated TOP is recorded as a liability when earned and is reflected in the accounts payable. Estimated TOP usage due within one year is expected to remain at the same level. The calculation of the liability is based on the pay or salary rates in effect as of the end of the fiscal year (in thousands):
(p) Use of Estimates
The preparation of financial statements in accordance with U.S. generally accepted accounting principles requires management to make estimates and assumptions that affect certain reported amounts and disclosures. Accordingly, actual results could differ from those estimates.
(q) Deferred Outflows/Inflows of Resources
In addition to assets, DFW’s net position includes a separate section for deferred outflows of resources. Deferred outflows of resources represent a consumption of net position that applies to a future period(s) and so will not be recognized as an outflow of resources (expense/expenditure) until then. DFW has two qualifying deferred outflows of resources. The first relates to refunding of debt. When a bond is refunded, a deferred outflow of resources results when, the reacquisition price exceeds the net carrying value of the original debt. This amount is deferred and amortized over the term of the new bonds or refunded bonds, whichever is shorter, using the straight-line method. The second relates to the difference between projected and actual earnings on pension plan investments. This amount is amortized over a closed five-year period. As of September 30, 2015, the combined balance of deferred outflows of resources was $31.7
Balance as of September 30, 2014 $8,706
TOP used during the year (9,724)
TOP earned during the year 9,969
Balance as of September 30, 2015 $8,951
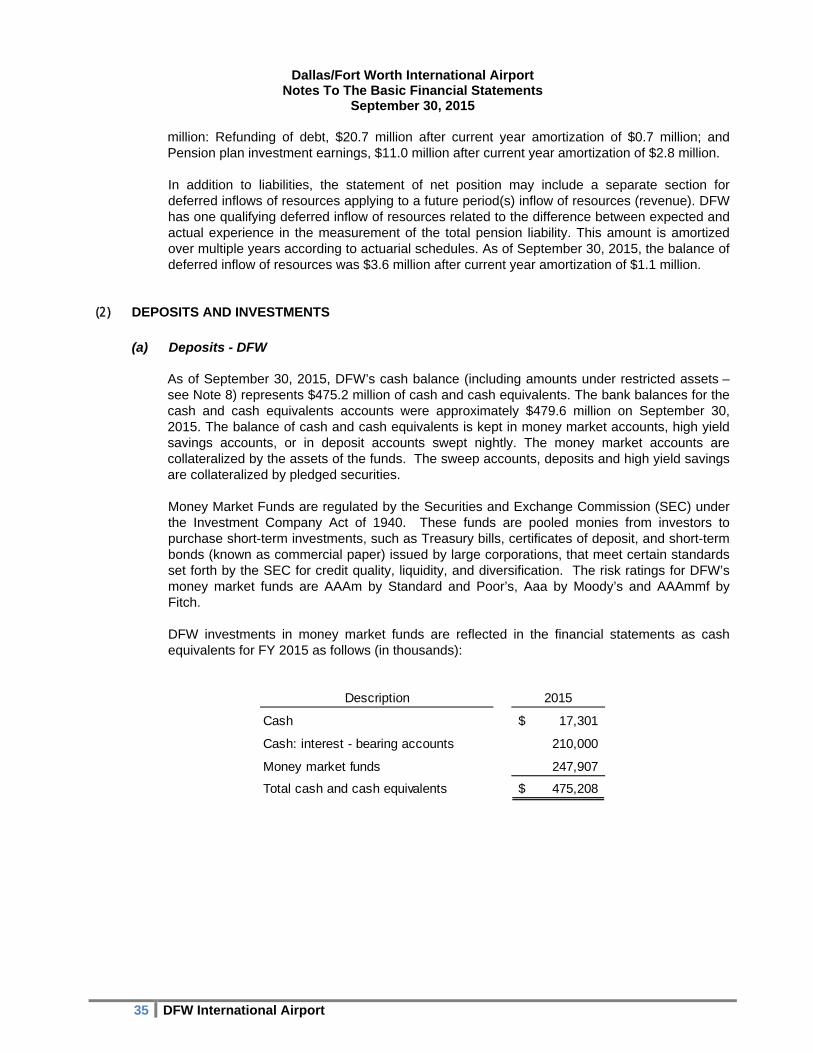
Dallas/Fort Worth International Airport Notes To The Basic Financial Statements
September 30, 2015
35 DFW International Airport
Description 2015
Cash 17,301$
Cash: interest - bearing accounts 210,000
Money market funds 247,907
Total cash and cash equivalents 475,208$
million: Refunding of debt, $20.7 million after current year amortization of $0.7 million; and Pension plan investment earnings, $11.0 million after current year amortization of $2.8 million.
In addition to liabilities, the statement of net position may include a separate section for deferred inflows of resources applying to a future period(s) inflow of resources (revenue). DFW has one qualifying deferred inflow of resources related to the difference between expected and actual experience in the measurement of the total pension liability. This amount is amortized over multiple years according to actuarial schedules. As of September 30, 2015, the balance of deferred inflow of resources was $3.6 million after current year amortization of $1.1 million.
(2) DEPOSITS AND INVESTMENTS
(a) Deposits - DFW
As of September 30, 2015, DFW’s cash balance (including amounts under restricted assets – see Note 8) represents $475.2 million of cash and cash equivalents. The bank balances for the cash and cash equivalents accounts were approximately $479.6 million on September 30, 2015. The balance of cash and cash equivalents is kept in money market accounts, high yield savings accounts, or in deposit accounts swept nightly. The money market accounts are collateralized by the assets of the funds. The sweep accounts, deposits and high yield savings are collateralized by pledged securities. Money Market Funds are regulated by the Securities and Exchange Commission (SEC) under the Investment Company Act of 1940. These funds are pooled monies from investors to purchase short-term investments, such as Treasury bills, certificates of deposit, and short-term bonds (known as commercial paper) issued by large corporations, that meet certain standards set forth by the SEC for credit quality, liquidity, and diversification. The risk ratings for DFW’s money market funds are AAAm by Standard and Poor’s, Aaa by Moody’s and AAAmmf by Fitch. DFW investments in money market funds are reflected in the financial statements as cash equivalents for FY 2015 as follows (in thousands):
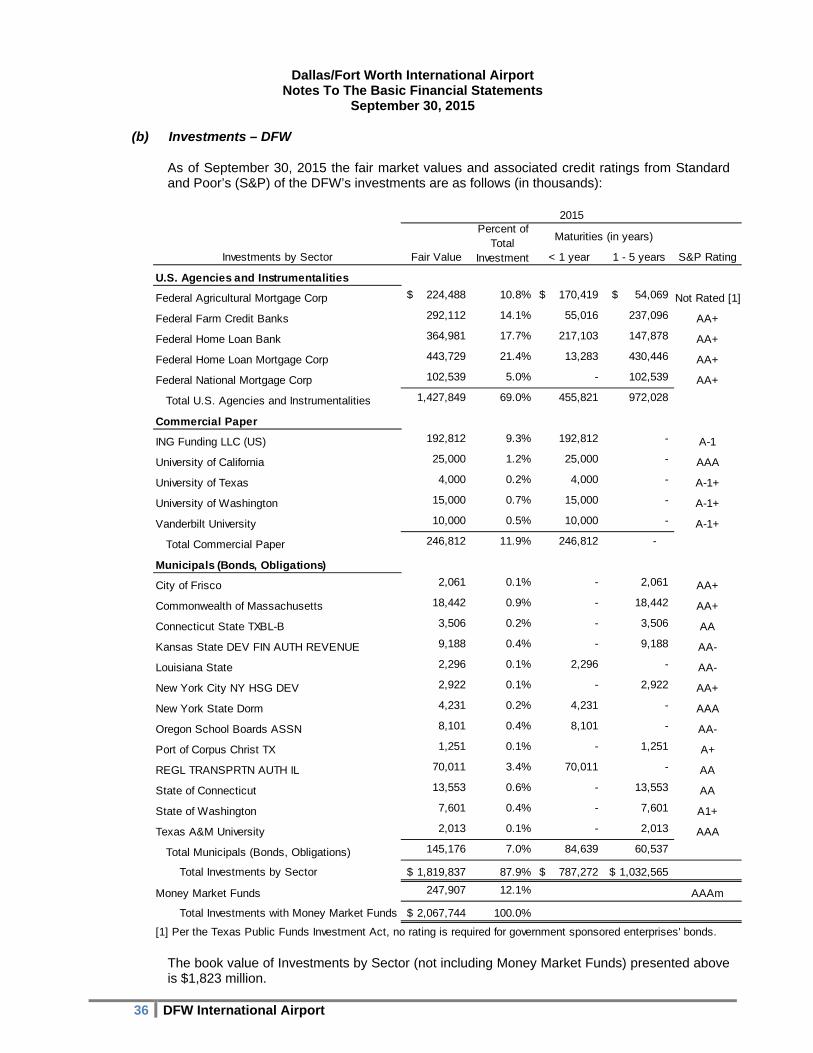
Dallas/Fort Worth International Airport Notes To The Basic Financial Statements
September 30, 2015
36 DFW International Airport
Investments by Sector Fair Value < 1 year 1 - 5 years S&P Rating
U.S. Agencies and Instrumentalities
Federal Agricultural Mortgage Corp 224,488$ 10.8% 170,419$ 54,069$ Not Rated [1]
Federal Farm Credit Banks 292,112 14.1% 55,016 237,096 AA+
Federal Home Loan Bank 364,981 17.7% 217,103 147,878 AA+
Federal Home Loan Mortgage Corp 443,729 21.4% 13,283 430,446 AA+
Federal National Mortgage Corp 102,539 5.0% - 102,539 AA+
Total U.S. Agencies and Instrumentalities 1,427,849 69.0% 455,821 972,028
Commercial Paper
ING Funding LLC (US) 192,812 9.3% 192,812 - A-1
University of California 25,000 1.2% 25,000 - AAA
University of Texas 4,000 0.2% 4,000 - A-1+
University of Washington 15,000 0.7% 15,000 - A-1+
Vanderbilt University 10,000 0.5% 10,000 - A-1+
Total Commercial Paper 246,812 11.9% 246,812 -
Municipals (Bonds, Obligations)
City of Frisco 2,061 0.1% - 2,061 AA+
Commonwealth of Massachusetts 18,442 0.9% - 18,442 AA+
Connecticut State TXBL-B 3,506 0.2% - 3,506 AA
Kansas State DEV FIN AUTH REVENUE 9,188 0.4% - 9,188 AA-
Louisiana State 2,296 0.1% 2,296 - AA-
New York City NY HSG DEV 2,922 0.1% - 2,922 AA+
New York State Dorm 4,231 0.2% 4,231 - AAA
Oregon School Boards ASSN 8,101 0.4% 8,101 - AA-
Port of Corpus Christ TX 1,251 0.1% - 1,251 A+
REGL TRANSPRTN AUTH IL 70,011 3.4% 70,011 - AA
State of Connecticut 13,553 0.6% - 13,553 AA
State of Washington 7,601 0.4% - 7,601 A1+
Texas A&M University 2,013 0.1% - 2,013 AAA
Total Municipals (Bonds, Obligations) 145,176 7.0% 84,639 60,537
Total Investments by Sector 1,819,837$ 87.9% 787,272$ 1,032,565$
Money Market Funds 247,907 12.1% AAAm
Total Investments with Money Market Funds 2,067,744$ 100.0%
[1] Per the Texas Public Funds Investment Act, no rating is required for government sponsored enterprises' bonds.
2015
Maturities (in years)Percent of
Total Investment
(b) Investments – DFW
As of September 30, 2015 the fair market values and associated credit ratings from Standard and Poor’s (S&P) of the DFW’s investments are as follows (in thousands):
The book value of Investments by Sector (not including Money Market Funds) presented above is $1,823 million.

Dallas/Fort Worth International Airport Notes To The Basic Financial Statements
September 30, 2015
37 DFW International Airport
Purpose Maturity
Hotel Operating and FFE 1 year
Interest and Sinking 1 year
Operating 1 year
Passenger Facility Charges 1 year
RAC Funds-CTC 1 year
RAC Funds-CFC $25 million - 5 years and Remainder - 2 years
Bond Funds 3 years
DFW Capital 3 years
Hotel Capital 3 years
Joint Capital 5 years
Debt Service Reserve 75%-5 years and 25%-10 years
Operating Reserve 75%-5 years and 25%-10 years
Rolling Coverage 75%-5 years and 25%-10 years
2015
2015
Maturity % of Investment
Less than one year 43%
One to five years 57%
(c) Interest Rate Risk – DFW
Investment portfolios are designed with the objectives of preserving capital while attaining the best possible rate of return commensurate with DFW’s investment risk constraints and the cash flow characteristics of each portfolio. Return on investment, although important, is subordinate to the safety and liquidity objectives. In accordance with DFW’s investment policy, two strategies are employed when market conditions vary. In markets where time risk is rewarded, investments are for longer terms. In markets where time risk is not rewarded, investments are for shorter terms and allow for flexibility to reinvest funds when markets improve. DFW has identified various purposes for the use of investments and has established maximum maturities for each of these purposes. The following table summarizes by purpose the maximum investment maturities.
The following table summarizes the DFW total investments as a percentage of maturities.
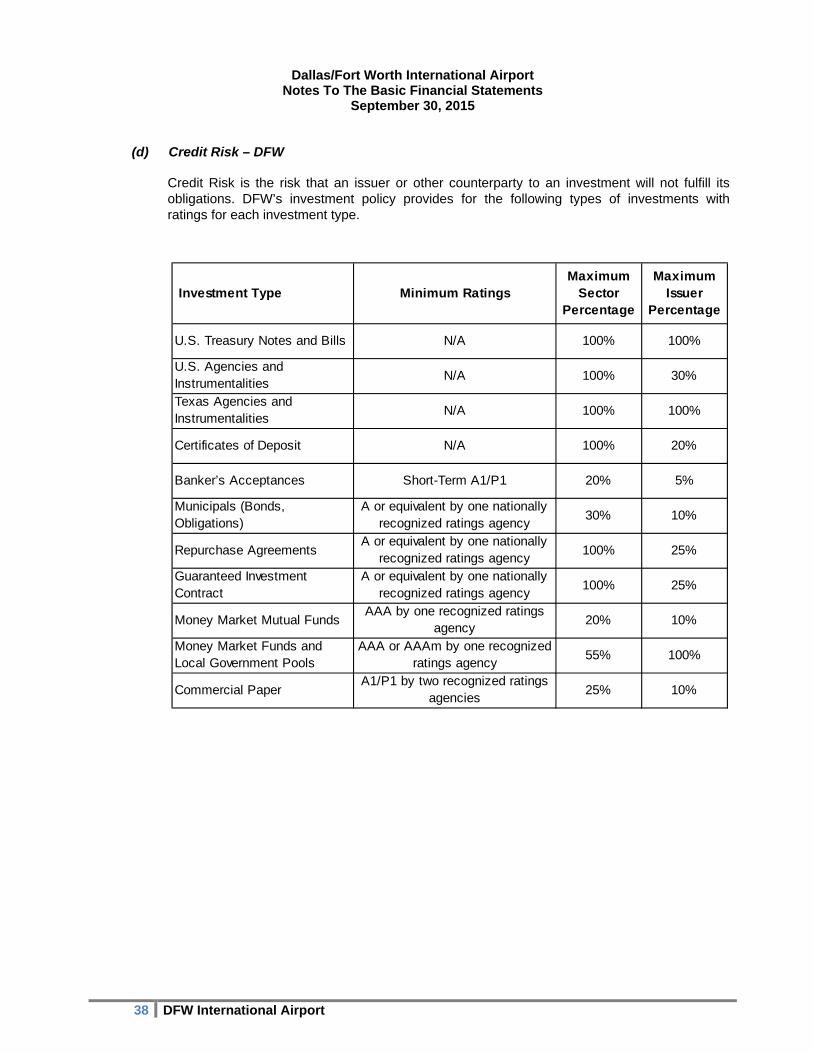
Dallas/Fort Worth International Airport Notes To The Basic Financial Statements
September 30, 2015
38 DFW International Airport
Investment Type Minimum RatingsMaximum
Sector Percentage
Maximum Issuer
Percentage
U.S. Treasury Notes and Bills N/A 100% 100%
U.S. Agencies and Instrumentalities
N/A 100% 30%
Texas Agencies and Instrumentalities
N/A 100% 100%
Certificates of Deposit N/A 100% 20%
Banker’s Acceptances Short-Term A1/P1 20% 5%
Municipals (Bonds, Obligations)
A or equivalent by one nationally recognized ratings agency
30% 10%
Repurchase AgreementsA or equivalent by one nationally
recognized ratings agency100% 25%
Guaranteed Investment Contract
A or equivalent by one nationally recognized ratings agency
100% 25%
Money Market Mutual Funds AAA by one recognized ratings
agency20% 10%
Money Market Funds and Local Government Pools
AAA or AAAm by one recognized ratings agency
55% 100%
Commercial PaperA1/P1 by two recognized ratings
agencies25% 10%
(d) Credit Risk – DFW
Credit Risk is the risk that an issuer or other counterparty to an investment will not fulfill its obligations. DFW’s investment policy provides for the following types of investments with ratings for each investment type.
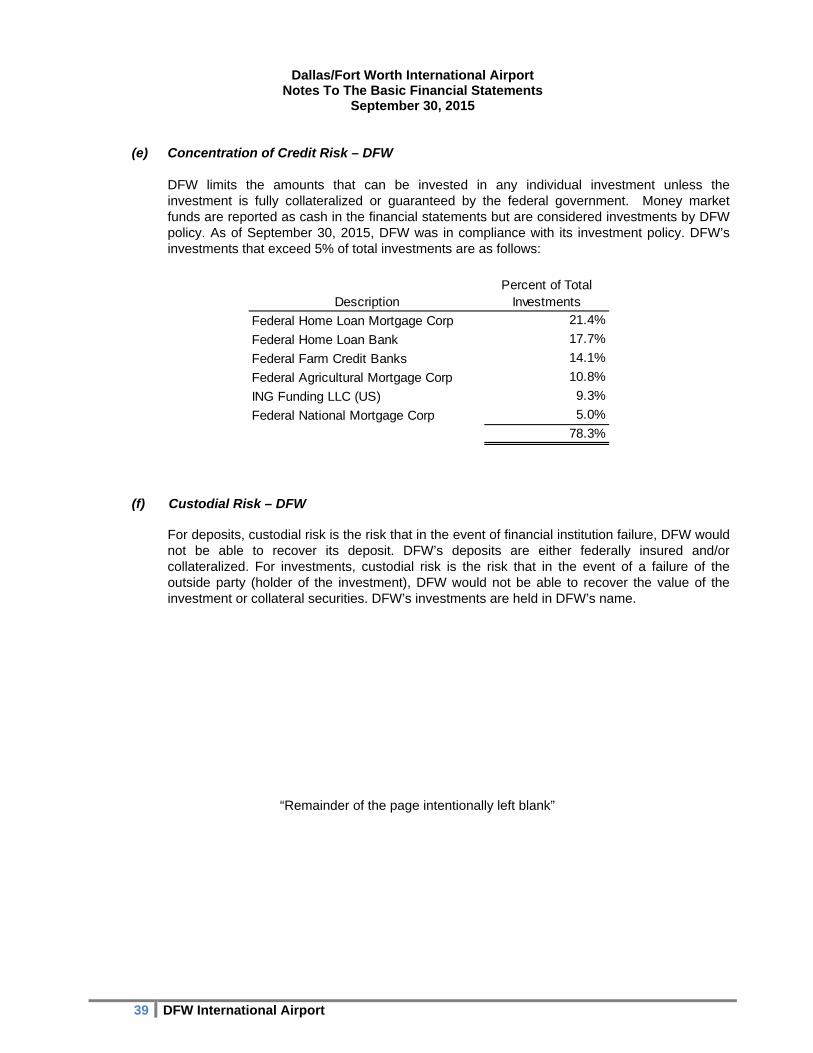
Dallas/Fort Worth International Airport Notes To The Basic Financial Statements
September 30, 2015
39 DFW International Airport
DescriptionPercent of Total
Investments
Federal Home Loan Mortgage Corp 21.4%
Federal Home Loan Bank 17.7%
Federal Farm Credit Banks 14.1%
Federal Agricultural Mortgage Corp 10.8%
ING Funding LLC (US) 9.3%
Federal National Mortgage Corp 5.0%
78.3%
(e) Concentration of Credit Risk – DFW
DFW limits the amounts that can be invested in any individual investment unless the investment is fully collateralized or guaranteed by the federal government. Money market funds are reported as cash in the financial statements but are considered investments by DFW policy. As of September 30, 2015, DFW was in compliance with its investment policy. DFW’s investments that exceed 5% of total investments are as follows:
(f) Custodial Risk – DFW For deposits, custodial risk is the risk that in the event of financial institution failure, DFW would not be able to recover its deposit. DFW’s deposits are either federally insured and/or collateralized. For investments, custodial risk is the risk that in the event of a failure of the outside party (holder of the investment), DFW would not be able to recover the value of the investment or collateral securities. DFW’s investments are held in DFW’s name.
“Remainder of the page intentionally left blank”
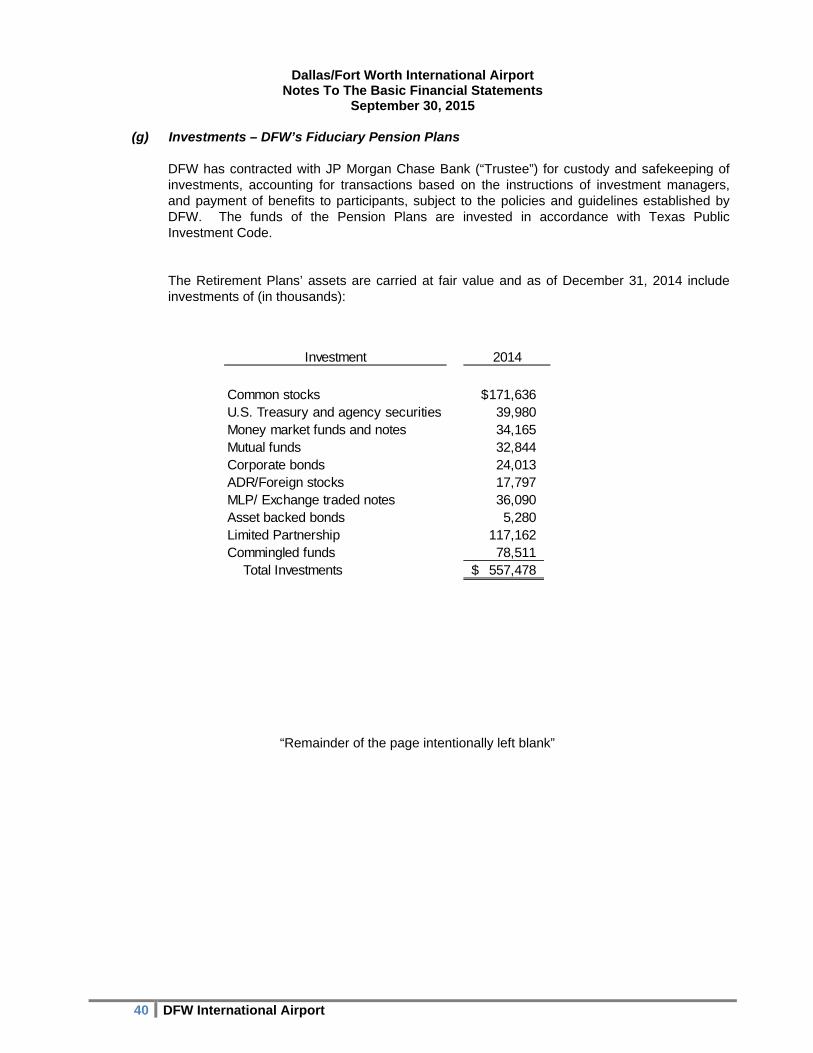
Dallas/Fort Worth International Airport Notes To The Basic Financial Statements
September 30, 2015
40 DFW International Airport
Investment
Common stocks 171,636$ U.S. Treasury and agency securities 39,980 Money market funds and notes 34,165 Mutual funds 32,844 Corporate bonds 24,013 ADR/Foreign stocks 17,797 MLP/ Exchange traded notes 36,090 Asset backed bonds 5,280 Limited Partnership 117,162 Commingled funds 78,511 Total Investments 557,478$
2014
(g) Investments – DFW’s Fiduciary Pension Plans
DFW has contracted with JP Morgan Chase Bank (“Trustee”) for custody and safekeeping of investments, accounting for transactions based on the instructions of investment managers, and payment of benefits to participants, subject to the policies and guidelines established by DFW. The funds of the Pension Plans are invested in accordance with Texas Public Investment Code. The Retirement Plans’ assets are carried at fair value and as of December 31, 2014 include investments of (in thousands):
“Remainder of the page intentionally left blank”
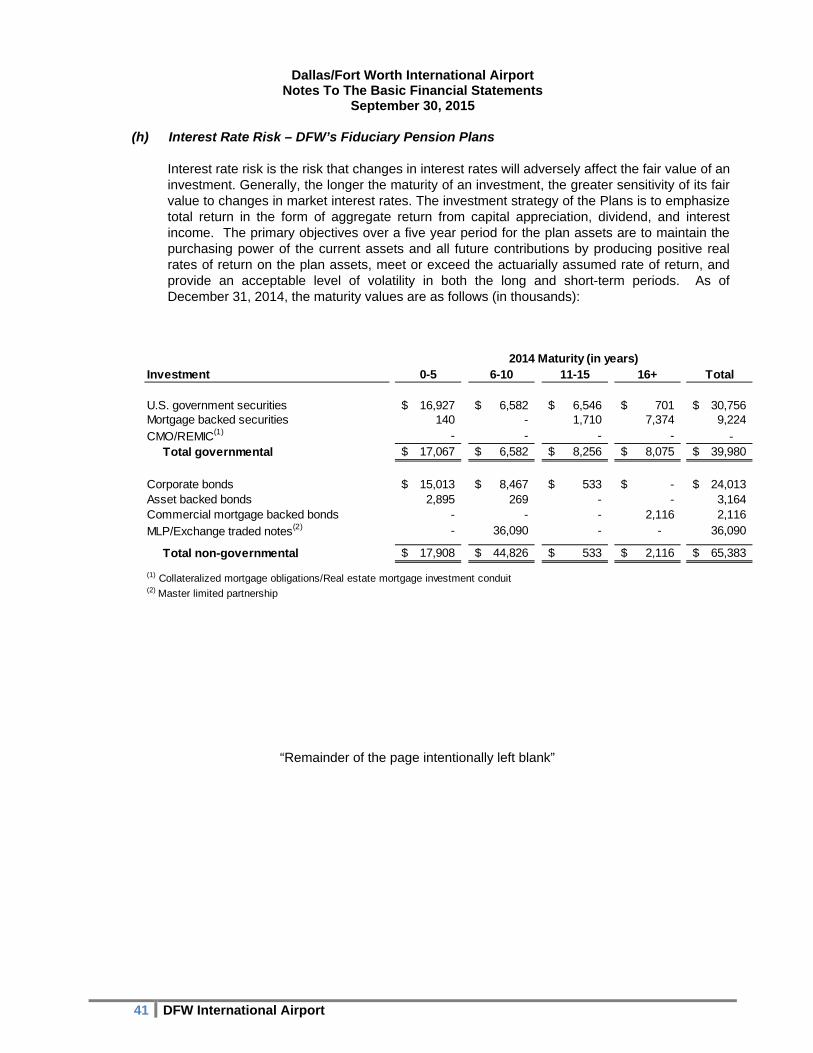
Dallas/Fort Worth International Airport Notes To The Basic Financial Statements
September 30, 2015
41 DFW International Airport
(h) Interest Rate Risk – DFW’s Fiduciary Pension Plans
Interest rate risk is the risk that changes in interest rates will adversely affect the fair value of an investment. Generally, the longer the maturity of an investment, the greater sensitivity of its fair value to changes in market interest rates. The investment strategy of the Plans is to emphasize total return in the form of aggregate return from capital appreciation, dividend, and interest income. The primary objectives over a five year period for the plan assets are to maintain the purchasing power of the current assets and all future contributions by producing positive real rates of return on the plan assets, meet or exceed the actuarially assumed rate of return, and provide an acceptable level of volatility in both the long and short-term periods. As of December 31, 2014, the maturity values are as follows (in thousands):
“Remainder of the page intentionally left blank”
Investment 0-5 6-10 11-15 16+ Total
U.S. government securities 16,927$ 6,582$ 6,546$ 701$ 30,756$ Mortgage backed securities 140 - 1,710 7,374 9,224
CMO/REMIC(1) - - - - - Total governmental 17,067$ 6,582$ 8,256$ 8,075$ 39,980$
Corporate bonds 15,013$ 8,467$ 533$ -$ 24,013$ Asset backed bonds 2,895 269 - - 3,164 Commercial mortgage backed bonds - - - 2,116 2,116
MLP/Exchange traded notes(2) - 36,090 - - 36,090
Total non-governmental 17,908$ 44,826$ 533$ 2,116$ 65,383$
(1) Collateralized mortgage obligations/Real estate mortgage investment conduit(2) Master limited partnership
2014 Maturity (in years)

Dallas/Fort Worth International Airport Notes To The Basic Financial Statements
September 30, 2015
42 DFW International Airport
Rating
AAA/ AA/ A+/ BBB+/ BBB-/ BB/ No Rating/
Long Term Bond Investments AA+ AA- A/A- BBB BB+ BB- Matured Bond Total
U.S. government securities 30,756$ -$ -$ -$ -$ -$ -$ 30,756$
Mortgage backed securities - - - - - - 9,224 9,224
CMO/REMIC(1) - - - - - - - -
Total governmental 30,756$ -$ -$ -$ -$ -$ 9,224$ 39,980$
Corporate bonds 283$ 783$ 8,895$ 10,615$ 2,964$ 193$ 280$ 24,013$
Asset backed bonds 2,751 162 251 - - - - 3,164
Commercial mortgage backed bonds 2,116 - - - - - - 2,116
MLP/Exchange traded notes (2) - - - - - - 36,090 36,090
Total non-governmental 5,150$ 945$ 9,146$ 10,615$ 2,964$ 193$ 36,370$ 65,383$
Other Investments
Common stocks -$ -$ -$ -$ -$ -$ 171,636$ 171,636$
Money market funds and notes - - - - - - 34,165 34,165
Mutual funds - - - - - - 32,844 32,844
ADR/Foreign stocks - - - - - - 17,797 17,797
Limited Partnerships - - - - - - 117,162 117,162
Commingled funds - - - - - - 78,511 78,511
Total non-governmental -$ -$ -$ -$ -$ -$ 452,115$ 452,115$
Total Investments 35,906$ 945$ 9,146$ 10,615$ 2,964$ 193$ 497,709$ 557,478$
(1) Collateralized mortgage obligations/Real estate mortgage investment conduit
(2) Master limited partnership
(i) Credit Risk – DFW’s Fiduciary Pension Plans
Credit Risk is the risk that an issuer or other counterparty to an investment will not fulfill its obligations. This risk is measured by the assignment of rating by nationally recognized rating agencies such as S&P and Moody’s. The following tables show the rating of the Plans’ investments as of December 31, 2014 (in thousands):
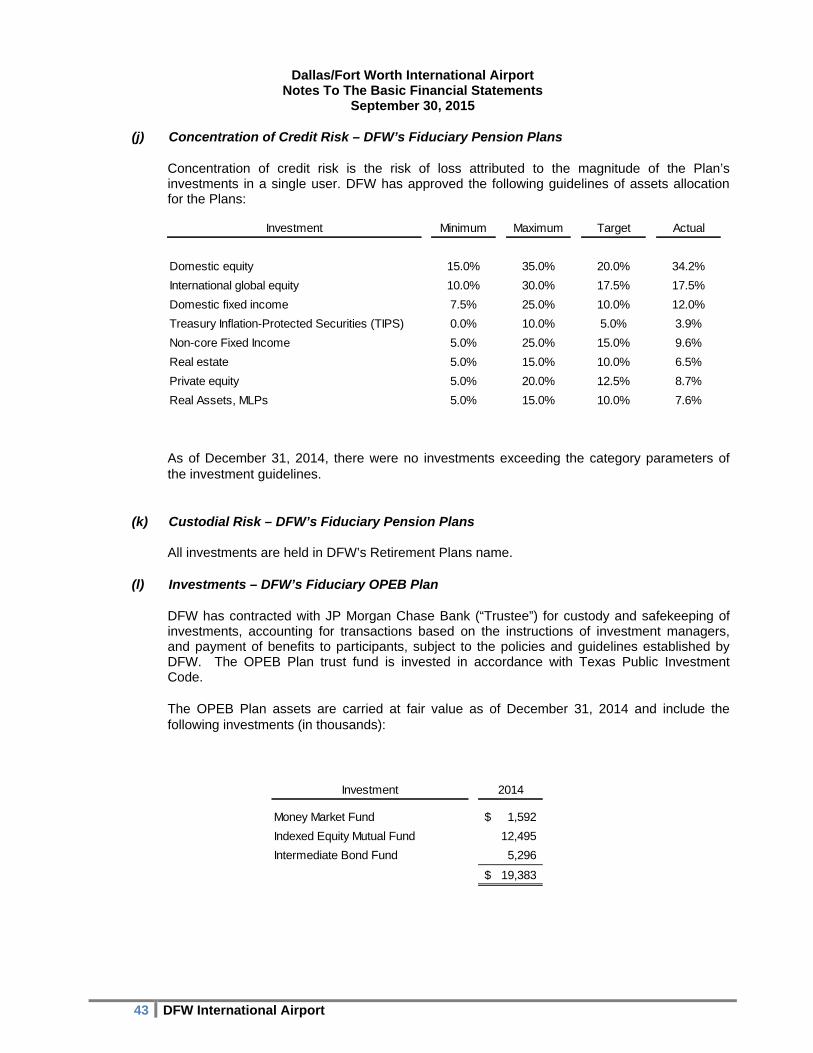
Dallas/Fort Worth International Airport Notes To The Basic Financial Statements
September 30, 2015
43 DFW International Airport
Investment Minimum Maximum Target Actual
Domestic equity 15.0% 35.0% 20.0% 34.2%
International global equity 10.0% 30.0% 17.5% 17.5%
Domestic fixed income 7.5% 25.0% 10.0% 12.0%
Treasury Inflation-Protected Securities (TIPS) 0.0% 10.0% 5.0% 3.9%
Non-core Fixed Income 5.0% 25.0% 15.0% 9.6%
Real estate 5.0% 15.0% 10.0% 6.5%
Private equity 5.0% 20.0% 12.5% 8.7%
Real Assets, MLPs 5.0% 15.0% 10.0% 7.6%
Investment 2014
Money Market Fund 1,592$
Indexed Equity Mutual Fund 12,495
Intermediate Bond Fund 5,296
19,383$
(j) Concentration of Credit Risk – DFW’s Fiduciary Pension Plans Concentration of credit risk is the risk of loss attributed to the magnitude of the Plan’s investments in a single user. DFW has approved the following guidelines of assets allocation for the Plans:
As of December 31, 2014, there were no investments exceeding the category parameters of the investment guidelines.
(k) Custodial Risk – DFW’s Fiduciary Pension Plans All investments are held in DFW’s Retirement Plans name.
(l) Investments – DFW’s Fiduciary OPEB Plan
DFW has contracted with JP Morgan Chase Bank (“Trustee”) for custody and safekeeping of investments, accounting for transactions based on the instructions of investment managers, and payment of benefits to participants, subject to the policies and guidelines established by DFW. The OPEB Plan trust fund is invested in accordance with Texas Public Investment Code. The OPEB Plan assets are carried at fair value as of December 31, 2014 and include the following investments (in thousands):
Dallas/Fort Worth International Airport Notes To The Basic Financial Statements
September 30, 2015
44 DFW International Airport
Investment Minimum Maximum Target Actual
Indexed Equity Mutual Fund 40.0% 60.0% 50.0% 70.0%
Intermediate Bond Fund 40.0% 60.0% 50.0% 30.0%
(m) Interest Rate Risk – DFW’s Fiduciary OPEB Plan
Interest rate risk is the risk that changes in interest rates will adversely affect the fair value of an investment. Generally, the longer the maturity of an investment, the greater sensitivity of its fair value to changes in market interest rates. The investment strategy of the OPEB Plan is to emphasize total return in the form of aggregate return from capital appreciation, dividend, and interest income. The primary objectives over a five year period for the plan assets are to maintain the purchasing power of the current assets and all future contributions by producing positive real rates of return on the plan assets, meet or exceed the actuarially assumed rate of return, and provide an acceptable level of volatility in both the long and short-term periods. As of December 31, 2014, the OPEB Plan had no investments that are exposed to interest rate risk.
(n) Credit Risk – DFW’s Fiduciary OPEB Plan
Credit Risk is the risk that an issuer or other counterparty to an investment will not fulfill its obligations. This risk is measured by the assignment of rating by nationally recognized rating agencies such as S&P and Moody’s. As of December 31, 2014, the OPEB Plan had no investments that are exposed to credit risk.
(o) Concentration of Credit Risk – DFW’s Fiduciary OPEB Plan Concentration of credit risk is the risk of loss attributed to the magnitude of the Plan’s investments in a single user. DFW has approved the following guidelines of assets allocation for the OPEB Plan: DFW has determined that currently all securities purchased for the OPEB Plan have readily ascertainable market values and are readily marketable. In 2014, $1.6 million was invested in a money market fund and the remaining amount of $17.8 million was invested into Vanguard Total Bond Index (30.0%) and Vanguard Institutional Index (70.0%) funds through the Trustee.
(p) Custodial Risk – DFW’s Fiduciary OPEB Plan All investments are held in the OPEB Plan’s name.
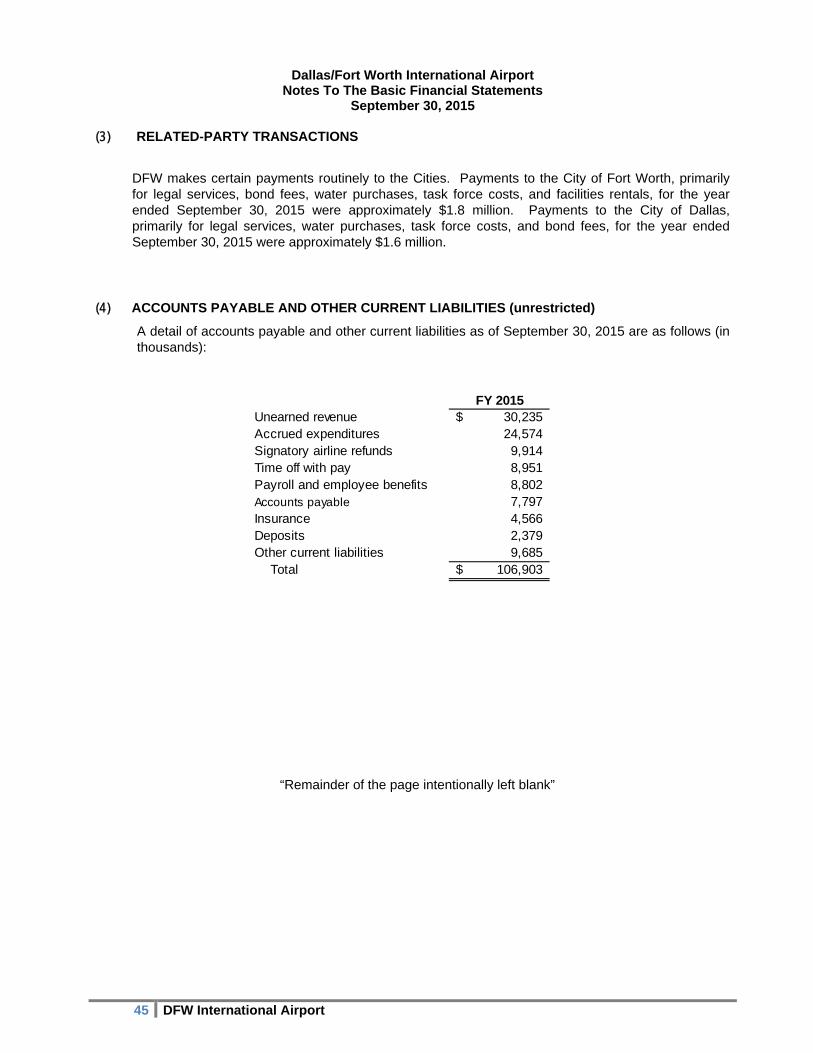
Dallas/Fort Worth International Airport Notes To The Basic Financial Statements
September 30, 2015
45 DFW International Airport
(3) RELATED-PARTY TRANSACTIONS
DFW makes certain payments routinely to the Cities. Payments to the City of Fort Worth, primarily for legal services, bond fees, water purchases, task force costs, and facilities rentals, for the year ended September 30, 2015 were approximately $1.8 million. Payments to the City of Dallas, primarily for legal services, water purchases, task force costs, and bond fees, for the year ended September 30, 2015 were approximately $1.6 million.
(4) ACCOUNTS PAYABLE AND OTHER CURRENT LIABILITIES (unrestricted)
A detail of accounts payable and other current liabilities as of September 30, 2015 are as follows (in thousands):
“Remainder of the page intentionally left blank”
FY 2015Unearned revenue 30,235$ Accrued expenditures 24,574 Signatory airline refunds 9,914 Time off with pay 8,951 Payroll and employee benefits 8,802 Accounts payable 7,797 Insurance 4,566 Deposits 2,379 Other current liabilities 9,685 Total 106,903$
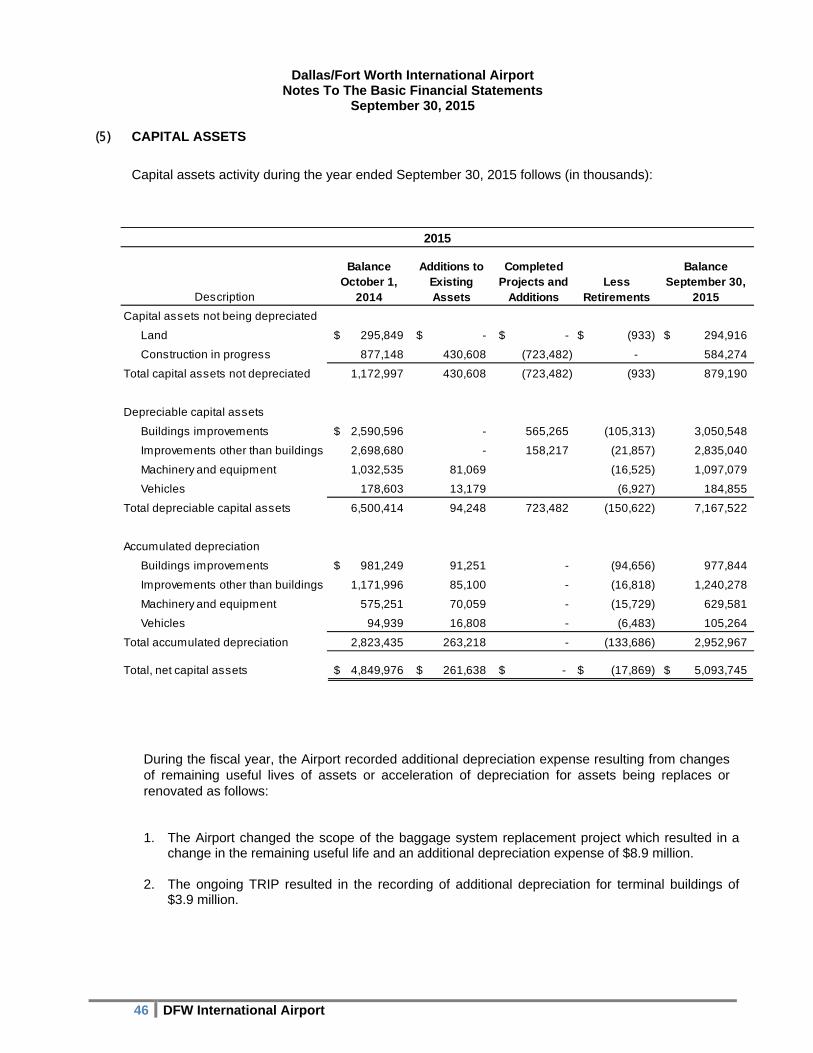
Dallas/Fort Worth International Airport Notes To The Basic Financial Statements
September 30, 2015
46 DFW International Airport
(5) CAPITAL ASSETS
Capital assets activity during the year ended September 30, 2015 follows (in thousands):
During the fiscal year, the Airport recorded additional depreciation expense resulting from changes of remaining useful lives of assets or acceleration of depreciation for assets being replaces or renovated as follows:
1. The Airport changed the scope of the baggage system replacement project which resulted in a change in the remaining useful life and an additional depreciation expense of $8.9 million.
2. The ongoing TRIP resulted in the recording of additional depreciation for terminal buildings of $3.9 million.
Balance October 1, Less
Balance September 30,
2014 Retirements 2015
Capital assets not being depreciated
Land 295,849$ -$ -$ (933)$ 294,916$
Construction in progress 877,148 430,608 (723,482) - 584,274
Total capital assets not depreciated 1,172,997 430,608 (723,482) (933) 879,190
Depreciable capital assets
Buildings improvements 2,590,596$ - 565,265 (105,313) 3,050,548
Improvements other than buildings 2,698,680 - 158,217 (21,857) 2,835,040
Machinery and equipment 1,032,535 81,069 (16,525) 1,097,079
Vehicles 178,603 13,179 (6,927) 184,855
Total depreciable capital assets 6,500,414 94,248 723,482 (150,622) 7,167,522
Accumulated depreciation
Buildings improvements 981,249$ 91,251 - (94,656) 977,844
Improvements other than buildings 1,171,996 85,100 - (16,818) 1,240,278
Machinery and equipment 575,251 70,059 - (15,729) 629,581
Vehicles 94,939 16,808 - (6,483) 105,264
Total accumulated depreciation 2,823,435 263,218 - (133,686) 2,952,967
Total, net capital assets 4,849,976$ 261,638$ -$ (17,869)$ 5,093,745$
2015
Additions to Existing Assets
Completed Projects and
AdditionsDescription
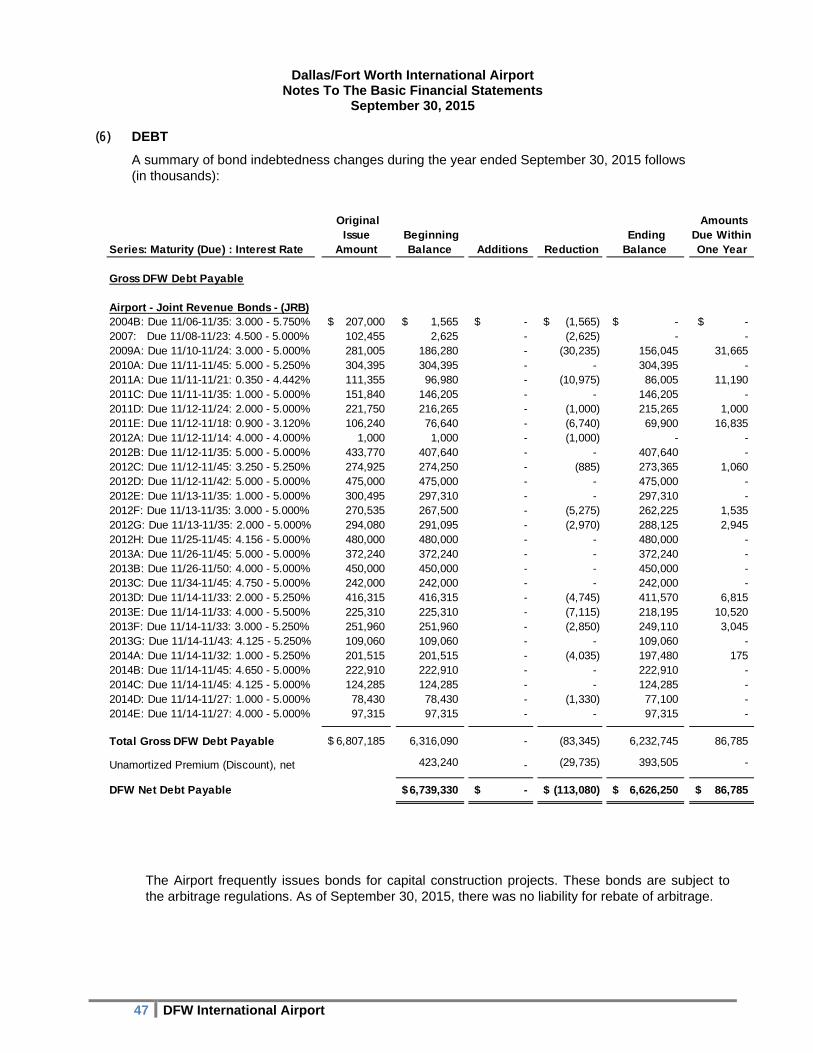
Dallas/Fort Worth International Airport Notes To The Basic Financial Statements
September 30, 2015
47 DFW International Airport
(6) DEBT
A summary of bond indebtedness changes during the year ended September 30, 2015 follows (in thousands):
The Airport frequently issues bonds for capital construction projects. These bonds are subject to the arbitrage regulations. As of September 30, 2015, there was no liability for rebate of arbitrage.
Series: Maturity (Due) : Interest Rate
Original Issue
Amount Beginning
Balance Additions Reduction Ending Balance
Amounts Due Within One Year
Gross DFW Debt Payable
Airport - Joint Revenue Bonds - (JRB)2004B: Due 11/06-11/35: 3.000 - 5.750% 207,000$ 1,565$ -$ (1,565)$ -$ -$ 2007: Due 11/08-11/23: 4.500 - 5.000% 102,455 2,625 - (2,625) - - 2009A: Due 11/10-11/24: 3.000 - 5.000% 281,005 186,280 - (30,235) 156,045 31,665 2010A: Due 11/11-11/45: 5.000 - 5.250% 304,395 304,395 - - 304,395 - 2011A: Due 11/11-11/21: 0.350 - 4.442% 111,355 96,980 - (10,975) 86,005 11,190 2011C: Due 11/11-11/35: 1.000 - 5.000% 151,840 146,205 - - 146,205 - 2011D: Due 11/12-11/24: 2.000 - 5.000% 221,750 216,265 - (1,000) 215,265 1,000 2011E: Due 11/12-11/18: 0.900 - 3.120% 106,240 76,640 - (6,740) 69,900 16,835 2012A: Due 11/12-11/14: 4.000 - 4.000% 1,000 1,000 - (1,000) - - 2012B: Due 11/12-11/35: 5.000 - 5.000% 433,770 407,640 - - 407,640 - 2012C: Due 11/12-11/45: 3.250 - 5.250% 274,925 274,250 - (885) 273,365 1,060 2012D: Due 11/12-11/42: 5.000 - 5.000% 475,000 475,000 - - 475,000 - 2012E: Due 11/13-11/35: 1.000 - 5.000% 300,495 297,310 - - 297,310 - 2012F: Due 11/13-11/35: 3.000 - 5.000% 270,535 267,500 - (5,275) 262,225 1,535 2012G: Due 11/13-11/35: 2.000 - 5.000% 294,080 291,095 - (2,970) 288,125 2,945 2012H: Due 11/25-11/45: 4.156 - 5.000% 480,000 480,000 - - 480,000 - 2013A: Due 11/26-11/45: 5.000 - 5.000% 372,240 372,240 - - 372,240 - 2013B: Due 11/26-11/50: 4.000 - 5.000% 450,000 450,000 - - 450,000 - 2013C: Due 11/34-11/45: 4.750 - 5.000% 242,000 242,000 - - 242,000 - 2013D: Due 11/14-11/33: 2.000 - 5.250% 416,315 416,315 - (4,745) 411,570 6,815 2013E: Due 11/14-11/33: 4.000 - 5.500% 225,310 225,310 - (7,115) 218,195 10,520 2013F: Due 11/14-11/33: 3.000 - 5.250% 251,960 251,960 - (2,850) 249,110 3,045 2013G: Due 11/14-11/43: 4.125 - 5.250% 109,060 109,060 - - 109,060 - 2014A: Due 11/14-11/32: 1.000 - 5.250% 201,515 201,515 - (4,035) 197,480 175 2014B: Due 11/14-11/45: 4.650 - 5.000% 222,910 222,910 - - 222,910 - 2014C: Due 11/14-11/45: 4.125 - 5.000% 124,285 124,285 - - 124,285 - 2014D: Due 11/14-11/27: 1.000 - 5.000% 78,430 78,430 - (1,330) 77,100 - 2014E: Due 11/14-11/27: 4.000 - 5.000% 97,315 97,315 - - 97,315 -
Total Gross DFW Debt Payable 6,807,185$ 6,316,090 - (83,345) 6,232,745 86,785
Unamortized Premium (Discount), net 423,240 - (29,735) 393,505 -
DFW Net Debt Payable 6,739,330$ -$ (113,080)$ 6,626,250$ 86,785$
Dallas/Fort Worth International Airport Notes To The Basic Financial Statements
September 30, 2015
48 DFW International Airport
(a) Joint Revenue Bonds
DFW was created by a Contract and Agreement between the Cities of Dallas and Fort Worth (“the Cities”), dated April 15, 1968, for the purpose of developing and operating an airport as a joint venture between the Cities. The 1968 Concurrent Bond Ordinance and the 30th Supplemental Bond Ordinance were amended and restated by the Master Bond Ordinance, and approved by the Cities of Fort Worth and Dallas on September 21, 2010 and September 22, 2010, respectively. The Master Bond Ordinance became effective on July 5, 2013 after the required approval of bondholders was obtained. Bonds are issued under provisions of the Master Bond Ordinance, Supplemental Bond Ordinances, as approved by the Cities of Fort Worth and Dallas, and Applicable Laws, including Chapter 22 of the Texas Transportation Code, and Chapter 1371 of the Texas Government Code, as amended. DFW is in compliance with all bond covenants. The Lease and Use Agreements (“Use Agreement”) with the signatory airlines define DFW’s rate setting methodology and business relationships. DFW’s current ten-year Use Agreement became effective October 1, 2010. Collectively, the abovementioned documents are referred to as the “Controlling Documents.”
Revenues derived from the ownership and operations of the Airport are pledged to meet debt service requirements of the bonds issued pursuant to the Controlling Ordinances. The Controlling Documents require DFW to annually adopt a Schedule of Charges that is: (1) reasonably estimated to produce Gross Revenues in an amount at least sufficient to pay Operation and Maintenance Expenses plus 1.25 times Accrued Aggregate Debt Service and (2) reasonably estimated to at least produce Current Gross Revenues in an amount at least sufficient to pay Operation and Maintenance Expenses plus 1.00 times Accrued Aggregate Debt Service. The Use Agreement provides for certain transfers of cash from DFW Capital Improvement Fund to the Operating Fund through FY 2017. These annual transfers are considered part of Gross Revenues, but not Current Gross Revenues. At the end of each fiscal year, any excess funds in the 102 Operating Fund are transferred to the Capital Improvement Fund. Funds transferred to the Capital Improvement Fund are allocated among three accounts, as provided in the 2010 Use Agreement. The Joint Capital Account generally requires approval from both DFW and the airlines prior to any expenditure of funds. The DFW Capital Account may be used at the discretion of the Airport. Rolling Coverage is funded by excess revenues from the Rolling Coverage sub-cost center, which unless used during the fiscal year is equal to the amount transferred at the beginning of the fiscal year, plus any incremental coverage collected during the fiscal year to ensure that rolling coverage is equal to 1.25 times Accrued Aggregate Debt Service. Effective July 1, 2011, PFC Application 11-10-C-00-DFW authorized the collection and use of $4.2 billion for the purpose of paying debt service on 14 approved PFC projects. PFC collections are approved at the $4.50 level. PFC’s remitted to the Airport by the airlines are deposited into a separate fund, and to the extent available, transferred monthly to the Operating Fund in an amount sufficient to pay eligible debt service. These transferred funds are considered Gross Revenues of the Airport for the purpose of meeting its rate covenants. However, PFC’s may only be used for the purpose of paying eligible debt service on approved PFC projects. All outstanding DFW bonds are senior lien parity bonds. As such, they are supported by a pledge of Gross Revenues, which includes PFC’s. Failure to collect PFC revenues in an amount sufficient to pay eligible debt service on PFC approved projects may lead to increases in other costs at DFW, which would be recovered by the Airport in the form of higher landing fees and terminal rents.

Dallas/Fort Worth International Airport Notes To The Basic Financial Statements
September 30, 2015
49 DFW International Airport
In addition, PFC revenue is pledged to pay debt service to the extent that debt service is eligible and funds are available. Total principal and interest remaining to be paid on the bonds is $11.6 billion, with annual requirements over the next five years ranging from $391.6 million to $423.8 million. Revenue bond principal is due annually on November 1st, while interest is due semi-annually on November 1st and May 1st.
(b) Facility Improvement Corporation Revenue Bonds – conduit financing
The Facility Improvement Corporation (“FIC”) is a duly incorporated nonprofit public instrumentality of the State of Texas, created by the Airport’s owner cities, pursuant to Chapter 22 of the Texas Transportation Code for the purpose of providing tax exempt conduit financing for airlines and other qualified tenants within the boundaries of the Airport. Bonds are issued by the FIC on behalf of the beneficial party, and pursuant to a facility agreement are payable solely by the beneficial party. Neither DFW nor the FIC has any obligation for the repayment of these bonds. As of September 30, 2015, the outstanding balance of conduit bonds was $144.2 million. On January 31, 2016, Lear Jet Inc. was scheduled to pay the remainder of its $84.0 million outstanding conduit debt. This payment reduces DFW’s outstanding balance to $60.2 million.
(c) Fiscal Year 2015 Debt Issuance
DFW issued no new debt in FY 2015.
(d) Debt Service Requirement
Annual debt service requirements to maturity for bonds are as follows (in thousands):
As of September 30, 2015, the Airport held approximately $532.9 million in reserve funds and interest and sinking funds for use in payment of the above debt service requirements. Certain amounts of the joint revenue bonds may be redeemed at a premium at various dates at the option of the Cities.
Year ending
September 30 Principal Interest Total
2016 86,785$ 304,793$ 391,578$
2017 102,920 300,949 403,869
2018 115,085 296,220 411,305
2019 130,775 290,721 421,496
2020 139,405 284,377 423,782
2021 - 2025 821,175 1,307,447 2,128,622
2026 - 2030 961,420 1,084,680 2,046,100
2031 - 2035 1,312,055 801,893 2,113,948
2036 - 2040 1,076,715 487,954 1,564,669
2041 - 2045 1,200,735 218,729 1,419,464
2046 - 2050 280,675 9,701 290,376
2051 5,000 103 5,103
TOTAL 6,232,745$ 5,387,567$ 11,620,312$
Joint Revenue Bonds (JRB)
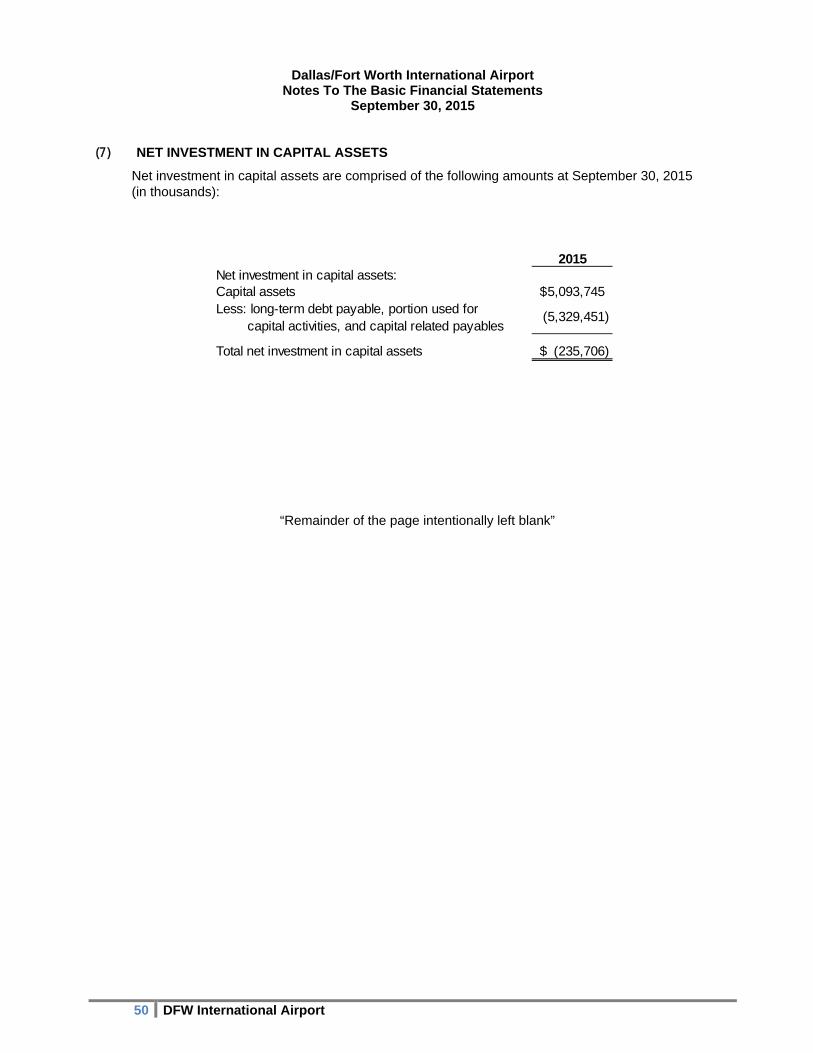
Dallas/Fort Worth International Airport Notes To The Basic Financial Statements
September 30, 2015
50 DFW International Airport
2015Net investment in capital assets:Capital assets 5,093,745$ Less: long-term debt payable, portion used for
capital activities, and capital related payables
Total net investment in capital assets (235,706)$
(5,329,451)
(7) NET INVESTMENT IN CAPITAL ASSETS
Net investment in capital assets are comprised of the following amounts at September 30, 2015 (in thousands):
“Remainder of the page intentionally left blank”
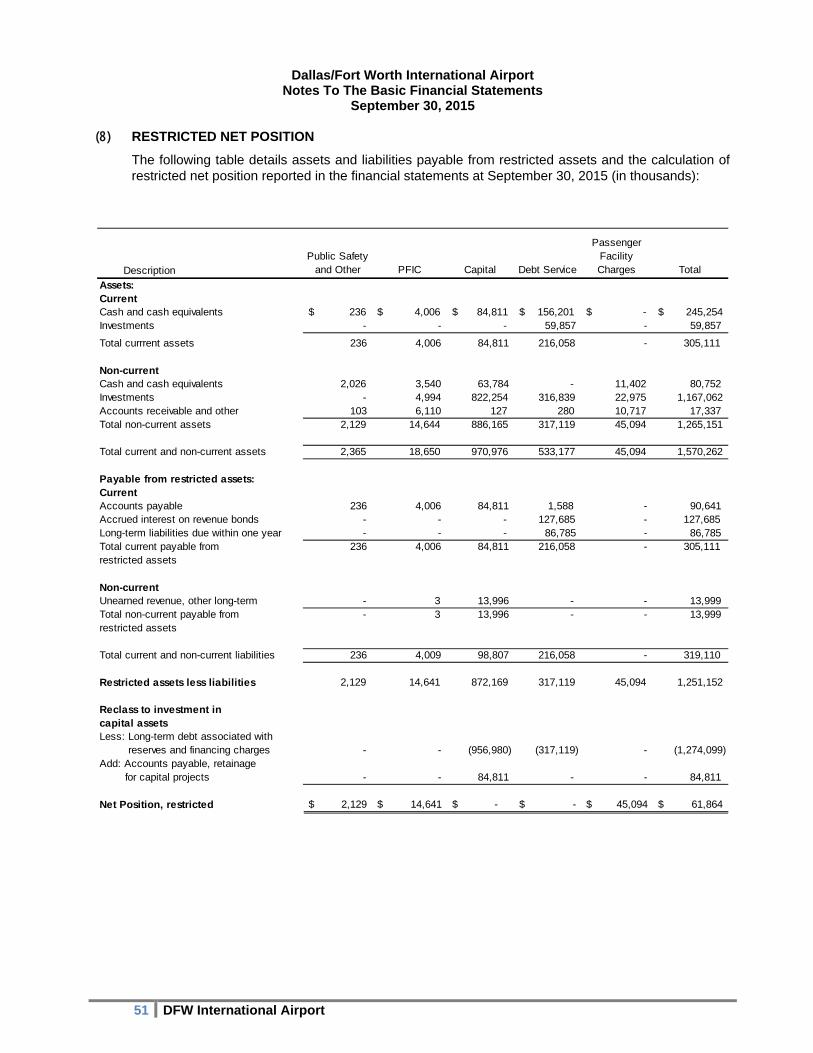
Dallas/Fort Worth International Airport Notes To The Basic Financial Statements
September 30, 2015
51 DFW International Airport
DescriptionPublic Safety
and Other PFIC Capital Debt Service
Passenger Facility Charges Total
Assets:Current Cash and cash equivalents $ 236 $ 4,006 $ 84,811 $ 156,201 $ - $ 245,254 Investments - - - 59,857 - 59,857
Total currrent assets 236 4,006 84,811 216,058 - 305,111
Non-current Cash and cash equivalents 2,026 3,540 63,784 - 11,402 80,752 Investments - 4,994 822,254 316,839 22,975 1,167,062 Accounts receivable and other 103 6,110 127 280 10,717 17,337 Total non-current assets 2,129 14,644 886,165 317,119 45,094 1,265,151
Total current and non-current assets 2,365 18,650 970,976 533,177 45,094 1,570,262
Payable from restricted assets:Current Accounts payable 236 4,006 84,811 1,588 - 90,641 Accrued interest on revenue bonds - - - 127,685 - 127,685 Long-term liabilities due within one year - - - 86,785 - 86,785 Total current payable from 236 4,006 84,811 216,058 - 305,111 restricted assets
Non-current Unearned revenue, other long-term - 3 13,996 - - 13,999 Total non-current payable from - 3 13,996 - - 13,999 restricted assets
Total current and non-current liabilities 236 4,009 98,807 216,058 - 319,110
Restricted assets less liabilities 2,129 14,641 872,169 317,119 45,094 1,251,152
Reclass to investment in capital assetsLess: Long-term debt associated with reserves and financing charges - - (956,980) (317,119) - (1,274,099)Add: Accounts payable, retainage for capital projects - - 84,811 - - 84,811
Net Position, restricted 2,129$ 14,641$ -$ -$ 45,094$ 61,864$
(8) RESTRICTED NET POSITION
The following table details assets and liabilities payable from restricted assets and the calculation of restricted net position reported in the financial statements at September 30, 2015 (in thousands):
Dallas/Fort Worth International Airport Notes To The Basic Financial Statements
September 30, 2015
52 DFW International Airport
(9) RETIREMENT PLANS
(a) Plan Descriptions
DFW has two fiduciary defined-benefit pension plans covering substantially all DFW employees: the employees of Dallas/Fort Worth International Airport Retirement Plan (“Employee Plan”) and the Department of Public Safety Retirement Plan (“DPS Plan”) that were established by Board resolution. Both plans (“Retirement Plans”, collectively) are single-employer public employee retirement system plans in which the assets are held in an investment trust. Employees vest after five years of service and are eligible for early retirement at ages 55-61 and full retirement benefits at age 62 and after. Pension benefits increase by a cost of living adjustment each January 1. The board has the authority to establish and amend the Plans’ benefits terms and contribution requirements. The Executive Vice President of Administration and Diversity and the Vice President of Human Resources serve as the “Plan Administrators”. The management of the assets of the Plans is the responsibility of the DFW Board’s Retirement/Investment Committee, the Executive Vice President/CFO and the Vice President of Treasury Management. The fiscal year-end for the Retirement Plans is December 31. Copies of the Retirement Plans’ annual report may be obtained by writing to the Finance Department, DFW Airport, Post Office Drawer 619428, DFW Airport, Texas 75261-9428. Employee Plan - All regular employees, other than DPS officers, are covered by the Employee Plan. Benefits vest after five years of service. DFW employees who retire are entitled to an annual retirement benefit, payable monthly for life in an amount equal to a percentage of final average monthly compensation times credited service (number of years) plus an annual cost of living adjustment (as defined by the Employee Plan). Employees can also elect a limited lump-sum distribution. The Employee Plan also provides early retirement, death, and disability benefits. As of January 1, 2010, the Employee Plan was closed to new employees. DPS Plan - The DPS Plan was established effective October 1, 1999, when the assets and liabilities accrued by public safety officers eligible for the DPS Plan prior to October 1, 1999 were transferred from the Employee Plan to the DPS Plan in compliance with the requirements of IRS Code Section 414(1). The public safety officers who retired or terminated employment prior to October 1, 1999, were not eligible for the DPS Plan and will continue to receive their benefits, if any, from the Employee Plan. The DPS Plan permits early retirement at ages 55 to 61, or upon satisfaction of the “Rule of 80” or the “25 and out” rule. The “Rule of 80” is the attainment of age 50 and the completion of the number of years of benefit service that when added to the participant’s age equals the sum of 80. The “25 and out” rule is the attainment of twenty-five (25) years of benefit service in a DPS covered position. DPS covered employees receive pension benefits in the form of a qualified joint and survivor annuity; however, an employee may request optional forms of pension benefit payments upon written request to the Plan Administrator. Other forms of payment of accumulated plan benefits include lump-sum distribution upon retirement or termination or equal monthly payments for life.
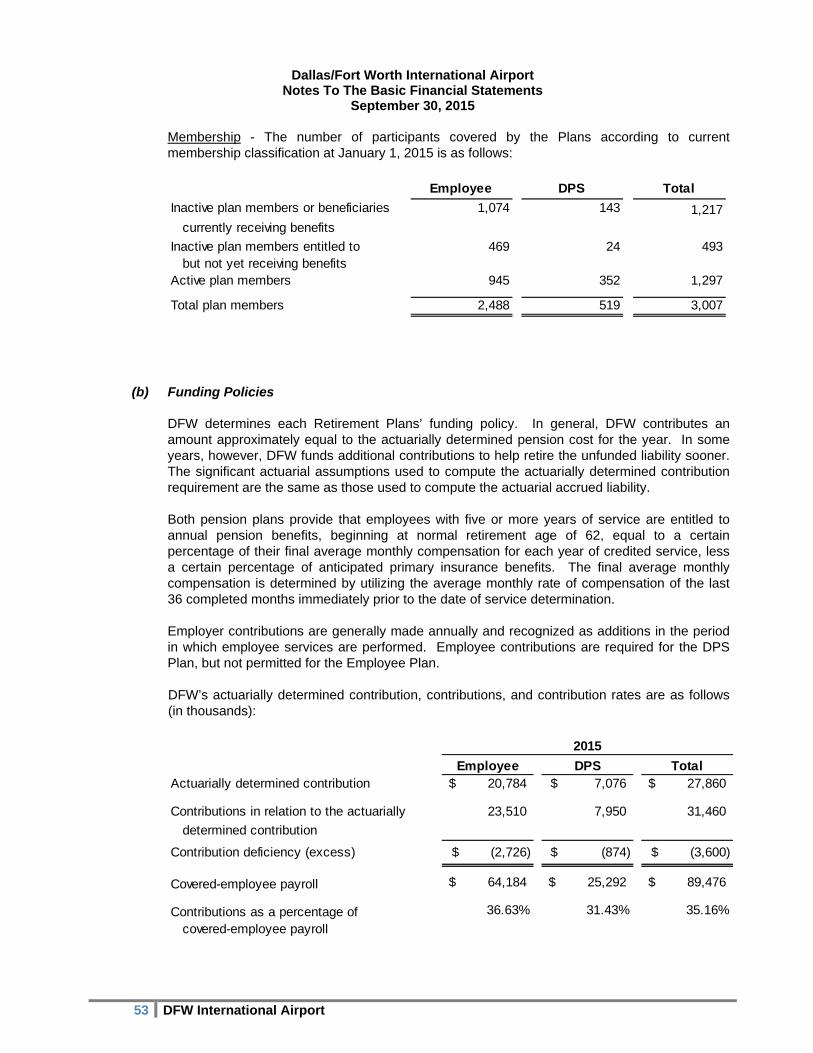
Dallas/Fort Worth International Airport Notes To The Basic Financial Statements
September 30, 2015
53 DFW International Airport
Employee DPS TotalActuarially determined contribution 20,784$ 7,076$ 27,860$
Contributions in relation to the actuarially 23,510 7,950 31,460
determined contribution
Contribution deficiency (excess) (2,726)$ (874)$ (3,600)$
Covered-employee payroll 64,184$ 25,292$ 89,476$
Contributions as a percentage of 36.63% 31.43% 35.16%
covered-employee payroll
2015
Employee DPS Total
Inactive plan members or beneficiaries 1,074 143 1,217 currently receiving benefits
Inactive plan members entitled to 469 24 493 but not yet receiving benefitsActive plan members 945 352 1,297
Total plan members 2,488 519 3,007
Membership - The number of participants covered by the Plans according to current membership classification at January 1, 2015 is as follows:
(b) Funding Policies
DFW determines each Retirement Plans’ funding policy. In general, DFW contributes an amount approximately equal to the actuarially determined pension cost for the year. In some years, however, DFW funds additional contributions to help retire the unfunded liability sooner. The significant actuarial assumptions used to compute the actuarially determined contribution requirement are the same as those used to compute the actuarial accrued liability. Both pension plans provide that employees with five or more years of service are entitled to annual pension benefits, beginning at normal retirement age of 62, equal to a certain percentage of their final average monthly compensation for each year of credited service, less a certain percentage of anticipated primary insurance benefits. The final average monthly compensation is determined by utilizing the average monthly rate of compensation of the last 36 completed months immediately prior to the date of service determination. Employer contributions are generally made annually and recognized as additions in the period in which employee services are performed. Employee contributions are required for the DPS Plan, but not permitted for the Employee Plan. DFW’s actuarially determined contribution, contributions, and contribution rates are as follows (in thousands):
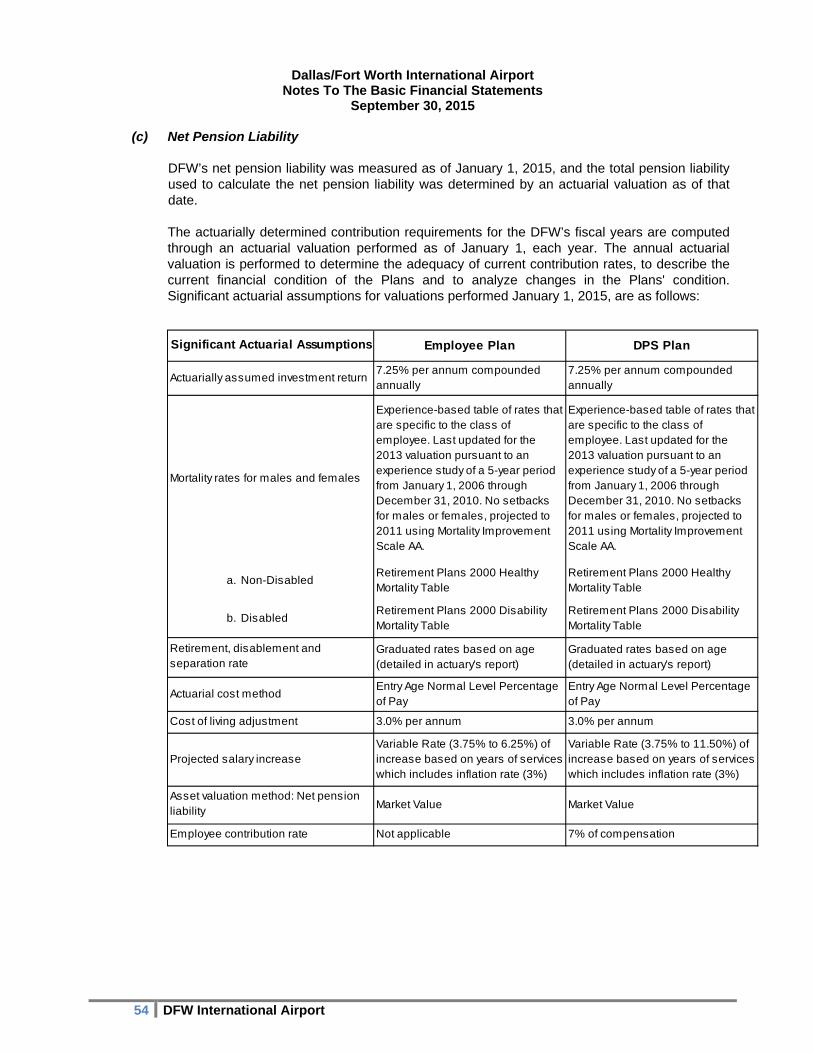
Dallas/Fort Worth International Airport Notes To The Basic Financial Statements
September 30, 2015
54 DFW International Airport
Employee Plan DPS Plan
Actuarially assumed investment return7.25% per annum compounded annually
7.25% per annum compounded annually
Mortality rates for males and females
Experience-based table of rates that are specific to the class of employee. Last updated for the 2013 valuation pursuant to an experience study of a 5-year period from January 1, 2006 through December 31, 2010. No setbacks for males or females, projected to 2011 using Mortality Improvement Scale AA.
Experience-based table of rates that are specific to the class of employee. Last updated for the 2013 valuation pursuant to an experience study of a 5-year period from January 1, 2006 through December 31, 2010. No setbacks for males or females, projected to 2011 using Mortality Improvement Scale AA.
a. Non-DisabledRetirement Plans 2000 Healthy Mortality Table
Retirement Plans 2000 Healthy Mortality Table
b. DisabledRetirement Plans 2000 Disability Mortality Table
Retirement Plans 2000 Disability Mortality Table
Graduated rates based on age (detailed in actuary's report)
Graduated rates based on age (detailed in actuary's report)
Actuarial cost methodEntry Age Normal Level Percentage of Pay
Entry Age Normal Level Percentage of Pay
Cost of living adjustment 3.0% per annum 3.0% per annum
Projected salary increaseVariable Rate (3.75% to 6.25%) of increase based on years of services which includes inflation rate (3%)
Variable Rate (3.75% to 11.50%) of increase based on years of services which includes inflation rate (3%)
Market Value Market Value
Employee contribution rate Not applicable 7% of compensation
Significant Actuarial Assumptions
Retirement, disablement and separation rate
Asset valuation method: Net pension liability
(c) Net Pension Liability
DFW’s net pension liability was measured as of January 1, 2015, and the total pension liability used to calculate the net pension liability was determined by an actuarial valuation as of that date. The actuarially determined contribution requirements for the DFW’s fiscal years are computed through an actuarial valuation performed as of January 1, each year. The annual actuarial valuation is performed to determine the adequacy of current contribution rates, to describe the current financial condition of the Plans and to analyze changes in the Plans' condition. Significant actuarial assumptions for valuations performed January 1, 2015, are as follows:
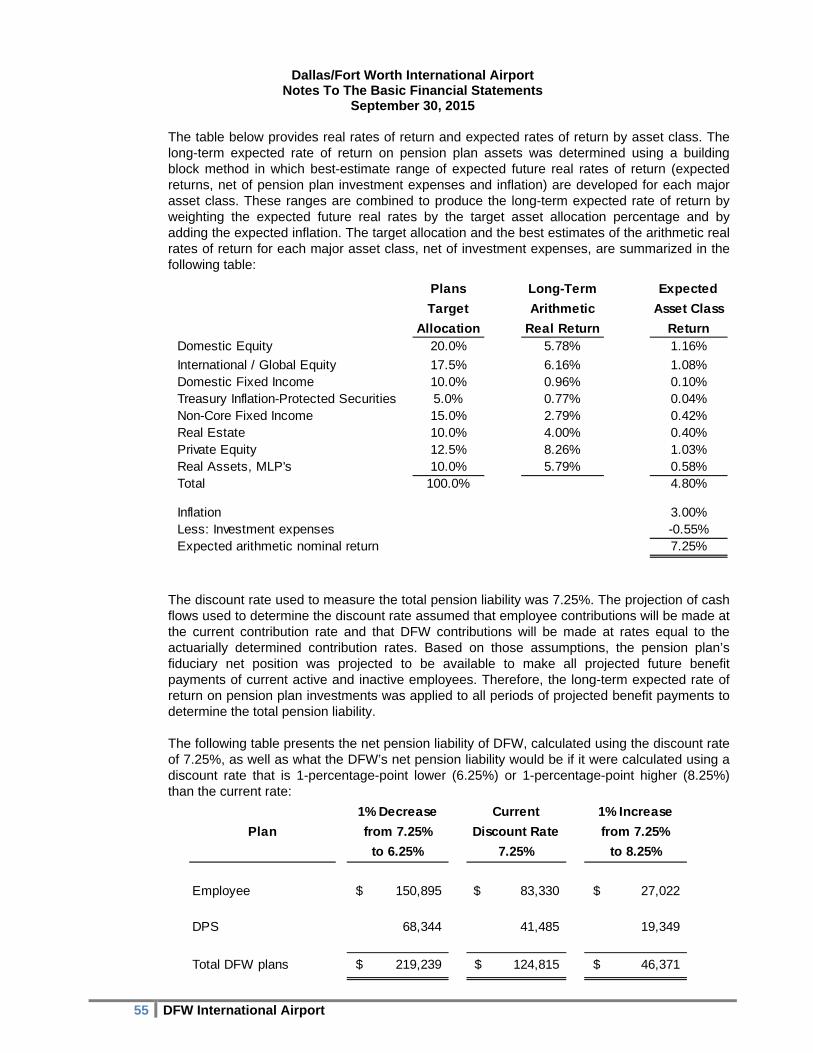
Dallas/Fort Worth International Airport Notes To The Basic Financial Statements
September 30, 2015
55 DFW International Airport
Plans Long-Term Expected
Target Arithmetic Asset Class
Allocation Real Return ReturnDomestic Equity 20.0% 5.78% 1.16%
International / Global Equity 17.5% 6.16% 1.08%Domestic Fixed Income 10.0% 0.96% 0.10%Treasury Inflation-Protected Securities 5.0% 0.77% 0.04%Non-Core Fixed Income 15.0% 2.79% 0.42%Real Estate 10.0% 4.00% 0.40%Private Equity 12.5% 8.26% 1.03%Real Assets, MLP's 10.0% 5.79% 0.58%Total 100.0% 4.80%
Inflation 3.00%Less: Investment expenses -0.55%Expected arithmetic nominal return 7.25%
1% Decrease Current 1% Increase
from 7.25% Discount Rate from 7.25%
to 6.25% 7.25% to 8.25%
Employee 150,895$ 83,330$ 27,022$
DPS 68,344 41,485 19,349
Total DFW plans 219,239$ 124,815$ 46,371$
Plan
The table below provides real rates of return and expected rates of return by asset class. The long-term expected rate of return on pension plan assets was determined using a building block method in which best-estimate range of expected future real rates of return (expected returns, net of pension plan investment expenses and inflation) are developed for each major asset class. These ranges are combined to produce the long-term expected rate of return by weighting the expected future real rates by the target asset allocation percentage and by adding the expected inflation. The target allocation and the best estimates of the arithmetic real rates of return for each major asset class, net of investment expenses, are summarized in the following table: The discount rate used to measure the total pension liability was 7.25%. The projection of cash flows used to determine the discount rate assumed that employee contributions will be made at the current contribution rate and that DFW contributions will be made at rates equal to the actuarially determined contribution rates. Based on those assumptions, the pension plan’s fiduciary net position was projected to be available to make all projected future benefit payments of current active and inactive employees. Therefore, the long-term expected rate of return on pension plan investments was applied to all periods of projected benefit payments to determine the total pension liability. The following table presents the net pension liability of DFW, calculated using the discount rate of 7.25%, as well as what the DFW’s net pension liability would be if it were calculated using a discount rate that is 1-percentage-point lower (6.25%) or 1-percentage-point higher (8.25%) than the current rate:
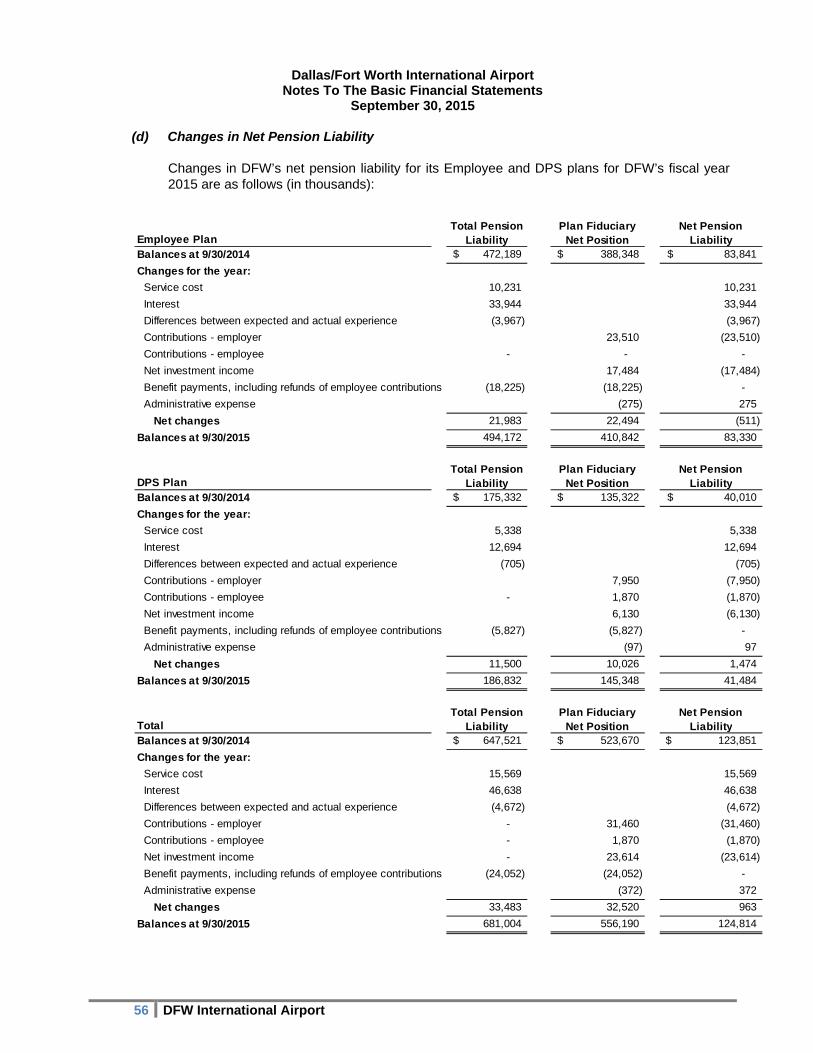
Dallas/Fort Worth International Airport Notes To The Basic Financial Statements
September 30, 2015
56 DFW International Airport
Employee PlanTotal Pension
LiabilityPlan Fiduciary
Net PositionNet Pension
LiabilityBalances at 9/30/2014 472,189$ 388,348$ 83,841$
Changes for the year:
Service cost 10,231 10,231
Interest 33,944 33,944
Differences between expected and actual experience (3,967) (3,967)
Contributions - employer 23,510 (23,510)
Contributions - employee - - -
Net investment income 17,484 (17,484)
Benefit payments, including refunds of employee contributions (18,225) (18,225) -
Administrative expense (275) 275
Net changes 21,983 22,494 (511)
Balances at 9/30/2015 494,172 410,842 83,330
DPS PlanTotal Pension
LiabilityPlan Fiduciary
Net PositionNet Pension
LiabilityBalances at 9/30/2014 175,332$ 135,322$ 40,010$
Changes for the year:
Service cost 5,338 5,338
Interest 12,694 12,694
Differences between expected and actual experience (705) (705)
Contributions - employer 7,950 (7,950)
Contributions - employee - 1,870 (1,870)
Net investment income 6,130 (6,130)
Benefit payments, including refunds of employee contributions (5,827) (5,827) -
Administrative expense (97) 97
Net changes 11,500 10,026 1,474
Balances at 9/30/2015 186,832 145,348 41,484
TotalTotal Pension
LiabilityPlan Fiduciary
Net PositionNet Pension
LiabilityBalances at 9/30/2014 647,521$ 523,670$ 123,851$
Changes for the year:
Service cost 15,569 15,569
Interest 46,638 46,638
Differences between expected and actual experience (4,672) (4,672)
Contributions - employer - 31,460 (31,460)
Contributions - employee - 1,870 (1,870)
Net investment income - 23,614 (23,614)
Benefit payments, including refunds of employee contributions (24,052) (24,052) -
Administrative expense (372) 372
Net changes 33,483 32,520 963
Balances at 9/30/2015 681,004 556,190 124,814
(d) Changes in Net Pension Liability
Changes in DFW’s net pension liability for its Employee and DPS plans for DFW’s fiscal year 2015 are as follows (in thousands):
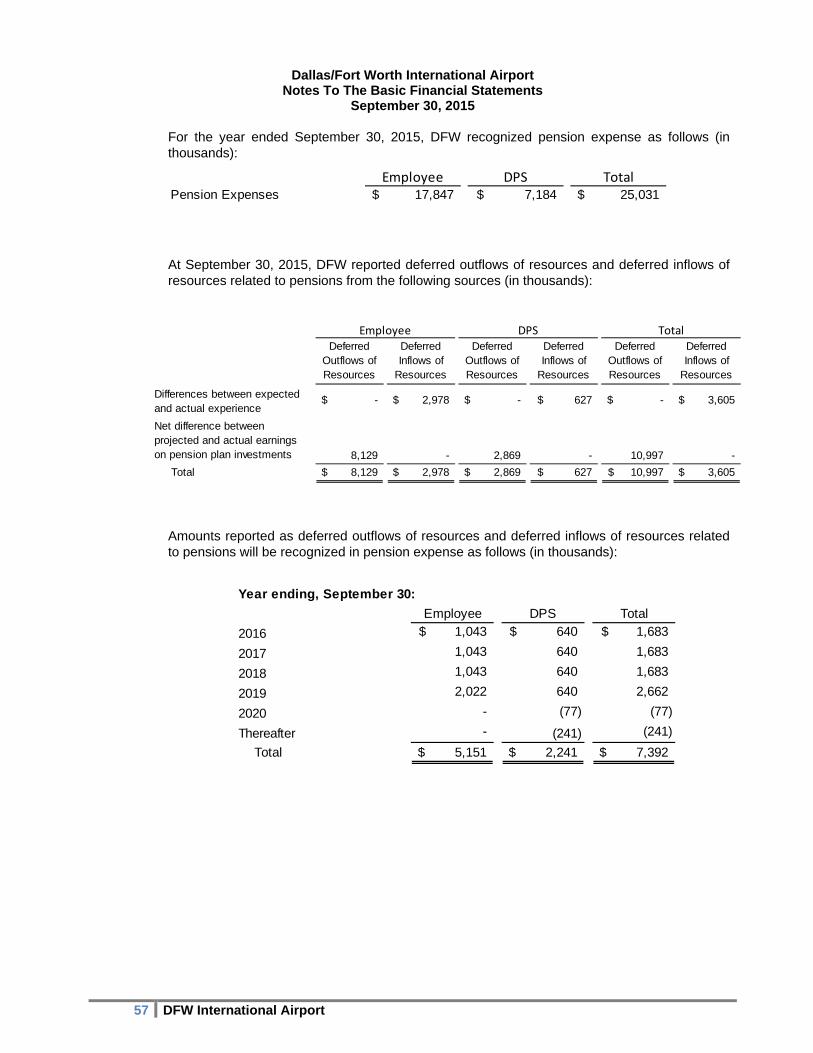
Dallas/Fort Worth International Airport Notes To The Basic Financial Statements
September 30, 2015
57 DFW International Airport
Employee DPS TotalPension Expenses 17,847$ 7,184$ 25,031$
Deferred Outflows of Resources
Deferred Inflows of
Resources
Deferred Outflows of Resources
Deferred Inflows of
Resources
Deferred Outflows of Resources
Deferred Inflows of
Resources
Differences between expected and actual experience
-$ 2,978$ -$ 627$ -$ 3,605$
Net difference between projected and actual earnings on pension plan investments 8,129 - 2,869 - 10,997 -
Total 8,129$ 2,978$ 2,869$ 627$ 10,997$ 3,605$
Employee DPS Total
Year ending, September 30:
Employee DPS Total
2016 1,043$ 640$ 1,683$
2017 1,043 640 1,683
2018 1,043 640 1,683
2019 2,022 640 2,662
2020 - (77) (77)
Thereafter - (241) (241)
Total 5,151$ 2,241$ 7,392$
For the year ended September 30, 2015, DFW recognized pension expense as follows (in thousands): At September 30, 2015, DFW reported deferred outflows of resources and deferred inflows of resources related to pensions from the following sources (in thousands): Amounts reported as deferred outflows of resources and deferred inflows of resources related to pensions will be recognized in pension expense as follows (in thousands):
Dallas/Fort Worth International Airport Notes To The Basic Financial Statements
September 30, 2015
58 DFW International Airport
(10) OTHER POST-EMPLOYMENT BENEFITS (OPEB)
(a) Plan Descriptions
General The DFW OPEB Plan is a single-employer defined benefit other than pension plan covering qualified retirees of DFW. The OPEB Plan was established and derives its authority from a DFW resolution effective September 2007. The OPEB Plan is administered by the DFW Board with the Executive Vice President of Administration and Diversity and the Vice President of Human Resources serving as the “Plan Administrators.” The management of the assets and any amendments of the OPEB Plan are the responsibility of the DFW Board’s Retirement Committee, the Executive Vice President - CFO and the Vice President of Treasury Management. The fiscal year-end for the OPEB Plan is December 31. Copies of the OPEB annual report may be obtained by writing to the Finance Department, DFW Airport, Post Office Drawer 619428, DFW Airport, Texas 75261-9428. OPEB Plan Eligibility The OPEB Plan provides retiree health care for qualified retired employees ages 65 or younger and their eligible dependents when required criteria are met. To be eligible as a retiree, an employee must be enrolled in one of DFW’s medical plans, be eligible for retirement under one of DFW’s pension plans, and begin drawing pension benefits immediately upon retirement. Failure to immediately draw pension benefits will result in loss of eligibility for medical coverage. Unlike the Employee Plan, the OPEB Plan remains open to all qualified employees as noted above.
To be eligible as a retiree’s dependent, dependent(s) must be either a legal spouse; unmarried children and under age 25 who are dependent on the retiree for at least 50% of their support and claimed on the retiree’s income tax return; unmarried grandchildren under age 25 who are dependent on the retiree for at least 50% of their support, reside in the retiree’s household, and claimed on the retiree’s income tax return; or unmarried children at any age if mentally or physically incapable of self-support. Normal retirement benefits for general employees and DPS employees begin when they complete five years of service and reach the age 62.
Health Care Benefit
The health care coverage offered to active employees is available to retirees under age 65 and their eligible dependents. The benefit includes medical, prescription drug, and vision coverage. Medical plans offered include Aetna Select and Aetna Choice POS II.
Retiree Medical Subsidy As of January 1, 2003, DFW provides a subsidy to eligible employees who retire to purchase medical coverage prior to Medicare eligibility. The subsidy is for pre-65 OPEB medical benefits only, and offers a credit of $20 per month of completed years of service up to a maximum benefit of $400 per month. These credits have no cash value and can only be used toward purchasing medical coverage from DFW. Retirees pay the total amount charged to DFW, less the retiree’s subsidy, if applicable. To be eligible for the subsidy, retirees must have retired after January 1, 2003, have 10 or more years of service, have been enrolled continuously in a DFW medical plan, and immediately draw retirement benefits.
Dallas/Fort Worth International Airport Notes To The Basic Financial Statements
September 30, 2015
59 DFW International Airport
Medicare Supplement Plan DFW offers a PPO Medicare Supplement Plan for retirees and/or their spouses age 65 or older. The retiree and/or spouse must transfer to the Medicare Supplement Plan by the first of the month following their 65th birthday if they choose to remain on the DFW Plan. Retirees pay the total amount charged to DFW. Effective January 1, 2010, Medicare eligible retirees are no longer eligible for prescription drug coverage under the DFW Retiree Medical Plan. To be eligible for the Medicare Supplement Plan, a retiree or spouse must be 65 years of age and currently enrolled in a DFW medical plan, have applied for the Medicare Supplement Plan two months prior to turning age 65, and transition to a Medicare Supplement Plan the first of the month following their 65th birthday.
(b) Funding Policies
DFW determines the OPEB Plan funding policy. In general, DFW contributes an amount approximately equal to the actuarially determined OPEB Annual Required Contribution (“ARC”) for the year. In some years, however, DFW funds additional contributions to help retire the unfunded liability sooner. The significant actuarial assumptions used to compute the actuarially determined contribution requirement are the same as those used to compute the actuarial accrued liability. Employer contributions are generally made annually and recognized as additions in the period in which employee services are performed. Employee contributions are not permitted. The actuarially determined contribution requirements for the DFW’s fiscal years are computed through an annual actuarial valuation performed as of January 1. The annual actuarial valuation is performed to determine the adequacy of current contribution rates, to describe the current financial condition of OPEB Plan, and to analyze changes in condition. Actuarial valuations involve estimates of the value of reported amounts and assumptions about the probability of events in the future. Amounts determined regarding the funded status of the plan and the annual required contributions of the employer are subject to continual revision as actual results are compared to past expectations and new estimates are made about the future. The required schedule of funding progress presented as required supplementary information provides multiyear trend information that shows whether the actuarial value of plan assets is increasing or decreasing over time relative to the actuarial accrued liability for benefits. Projections of benefits are based on the plan and include the types of benefits in force at the valuation date and the pattern of sharing benefit costs between DFW and the plan members to that point. Actuarial calculations reflect a long-term perspective and employ methods and assumptions that are designed to reduce short-term volatility in actuarial accrued liabilities and the actuarial value of assets.
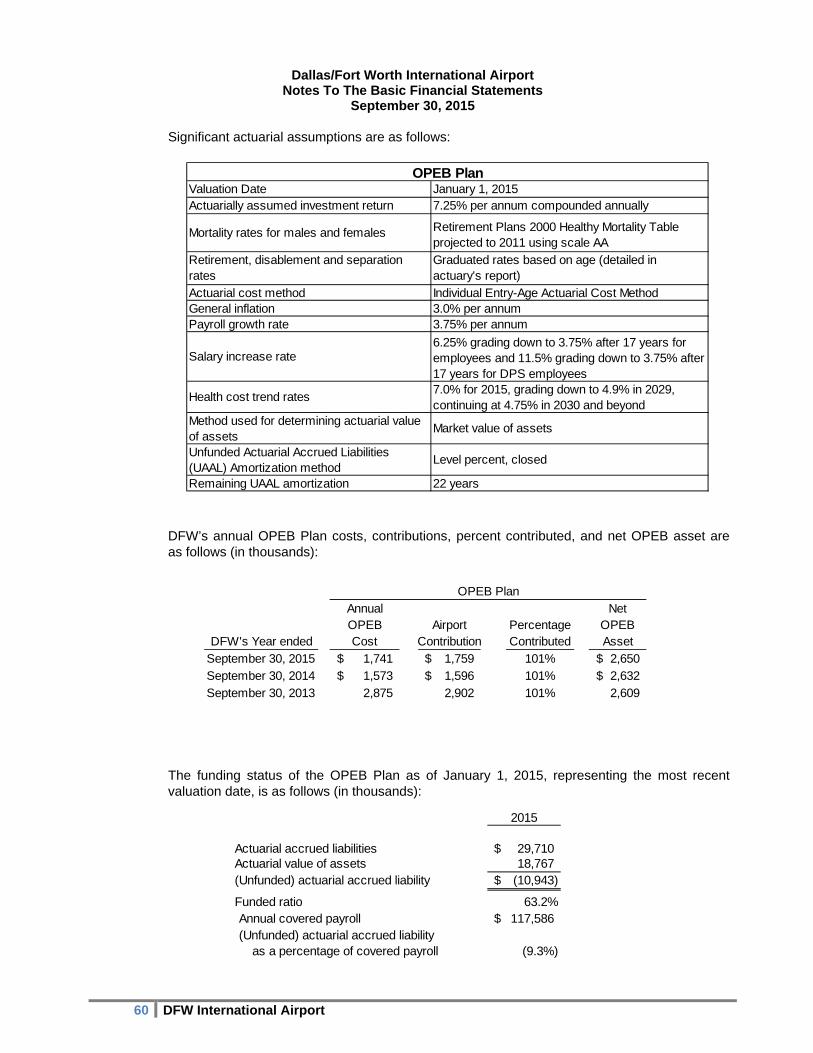
Dallas/Fort Worth International Airport Notes To The Basic Financial Statements
September 30, 2015
60 DFW International Airport
Valuation Date January 1, 2015Actuarially assumed investment return 7.25% per annum compounded annually
Mortality rates for males and females Retirement Plans 2000 Healthy Mortality Table projected to 2011 using scale AA
Actuarial cost method Individual Entry-Age Actuarial Cost MethodGeneral inflation 3.0% per annumPayroll growth rate 3.75% per annum
Remaining UAAL amortization 22 years
Unfunded Actuarial Accrued Liabilities (UAAL) Amortization method
Level percent, closed
Health cost trend rates
Retirement, disablement and separation rates
Market value of assets
OPEB Plan
Graduated rates based on age (detailed in actuary's report)
7.0% for 2015, grading down to 4.9% in 2029, continuing at 4.75% in 2030 and beyond
Method used for determining actuarial value of assets
Salary increase rate6.25% grading down to 3.75% after 17 years for employees and 11.5% grading down to 3.75% after 17 years for DPS employees
OPEB PlanAnnual NetOPEB Airport Percentage OPEB
DFW's Year ended Cost Contribution Contributed Asset
September 30, 2015 1,741$ 1,759$ 101% 2,650$ September 30, 2014 1,573$ 1,596$ 101% 2,632$
September 30, 2013 2,875 2,902 101% 2,609
2015
Actuarial accrued liabilities 29,710$ Actuarial value of assets 18,767 (Unfunded) actuarial accrued liability (10,943)$
Funded ratio 63.2%Annual covered payroll 117,586$ (Unfunded) actuarial accrued liability as a percentage of covered payroll (9.3%)
Significant actuarial assumptions are as follows: DFW’s annual OPEB Plan costs, contributions, percent contributed, and net OPEB asset are as follows (in thousands): The funding status of the OPEB Plan as of January 1, 2015, representing the most recent valuation date, is as follows (in thousands):

Dallas/Fort Worth International Airport Notes To The Basic Financial Statements
September 30, 2015
61 DFW International Airport
2015
Annual required contribution 1,759$
Interest on net OPEB asset (191)
Adjustment to annual required contribution 173Annual OPEB cost 1,741Employer contributions 1,759Increase in net OPEB (asset) (18)Net OPEB (asset), beginning of year (2,632)Net OPEB (asset), end of year (2,650)$
(c) Net OPEB Assets
DFW’s net OPEB assets for DFW’s fiscal year 2015 are as follows (in thousands):
(11) PFIC BACKGROUND AND FINANCIAL INFORMATION
The Public Facility Improvement Corporation (“PFIC”) is a duly incorporated public instrumentality of the State of Texas, created on December 14, 2000 by the Airport’s owner cities. The PFIC was created pursuant to Chapter 22 of the Texas Transportation Code for the purpose of financing, equipping and operating one or more public facilities within the boundaries of the Airport. The PFIC currently operates the Grand Hyatt Hotel, collects and manages the funds of the DFW Rent-A-Car (“RAC”) Facility and is currently constructing a new Hyatt Place Hotel. Any additional projects require approval of the Owner Cities. Grand Hyatt Hotel The Grand Hyatt Hotel opened in 2005. The Hotel has 298 rooms and is located within International Terminal D. The Hotel is managed by the Hyatt International Corporation under the terms of a fixed fee management agreement between Hyatt and the PFIC. In 2001, the PFIC issued approximately $75 million of Hotel Revenue Bonds for the construction of the Hotel. The Hotel was constructed by the Airport under the terms of a Hotel Development Agreement, entered into between the Airport and the PFIC. All hotel revenues are remitted to the PFIC. The PFIC reimburses the Hyatt for all operating expenses of the Hotel. Under the terms of 2012 Facility Agreement between the PFIC and the Airport, the PFIC transfers monthly to the Airport the amount of accrued debt service and coverage relating to bonds, issued by the Airport in 2012, which retired the 2001 PFIC Hotel Revenue Bonds. In addition, the PFIC makes a monthly contribution to a Furniture, Fixtures and Equipment (“FF&E”) Account and to a Capital Account for the continual renewal and improvement of the hotel. Any excess funds are held by the PFIC and may be used for improvements to the Hotel or for other projects, as approved by the Owner Cities. Consolidated Rent-A-Car Facility In 1998 and 1999, the FIC issued approximately $160 million of bonds for construction of a consolidated rental car facility. These bonds were secured by a facility agreement between the FIC and the Rent-A-Car companies, which provided that the RAC companies would collect and remit to a trustee a Customer Facility Charge (“CFC”) for each rent-a-car transaction day. In FY 2011, DFW issued 2011A Joint Revenue Bonds for the purpose of retiring all of the outstanding Rent-A-Car bonds issued by the FIC. In 2012, the Owner Cities approved the RAC Facility as an authorized
Dallas/Fort Worth International Airport Notes To The Basic Financial Statements
September 30, 2015
62 DFW International Airport
PFIC Project and approved the transfer of all RAC assets, liabilities, and responsibilities from the FIC to the PFIC. The RAC companies, under the terms of the 2008 Bus Funding Agreement, agreed to continue collecting the CFC after the FIC bonds were refunded. In conjunction with the issuance of 2011A Bonds, the PFIC transfers to the Airport the monthly amount of accrued aggregate debt service plus any incremental coverage on the 2011A Bonds from the CFC revenues. The CFC was $4.00 per transaction day during FY 2015. The PFIC Board has the authority to change the CFC rate at any time. Additionally, the RAC companies collect a Customer Transportation Charge (“CTC”), which is remitted directly to the PFIC to pay for the costs of operating and maintaining the bus fleet, which transports customers to and from the terminals and the RAC facility. The CTC was $2.20 per transaction day during FY 2015.
Hyatt Place Hotel A Hyatt Place Hotel is currently under construction in the Southgate Development, at the south entrance to the Airport, near the RAC Facility. The Hyatt Place construction is being funded with PFIC cash. The Hyatt Place will be a limited service hotel with 137 rooms and is expected to open during the first half of Calendar Year 2016. The hotel was financed by the PFIC and is being constructed by Woodbine Development Corporation. The hotel will be owned by the Airport Board and leased to the PFIC, who will manage the hotel on behalf of the Airport Board. The PFIC will enter into a fixed fee management agreement with Hyatt Corporation. After paying operating expenses and making a contribution to an FF&E Replacement Account, any excess funds are held by the PFIC and may be used for improvements to the hotel or other projects, as approved by the Owner Cities.
“Remainder of the page intentionally left blank”
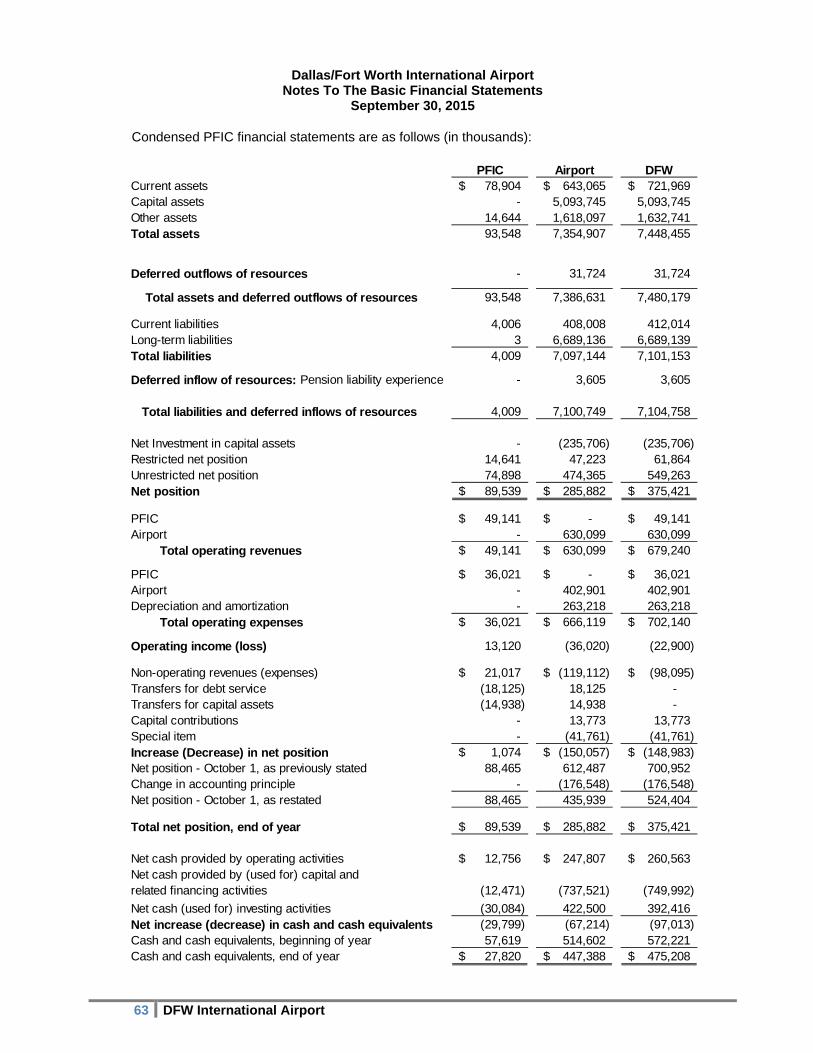
Dallas/Fort Worth International Airport Notes To The Basic Financial Statements
September 30, 2015
63 DFW International Airport
PFIC Airport DFWCurrent assets 78,904$ 643,065$ 721,969$ Capital assets - 5,093,745 5,093,745 Other assets 14,644 1,618,097 1,632,741 Total assets 93,548 7,354,907 7,448,455
Deferred outflows of resources - 31,724 31,724
Total assets and deferred outflows of resources 93,548 7,386,631 7,480,179
Current liabilities 4,006 408,008 412,014 Long-term liabilities 3 6,689,136 6,689,139 Total liabilities 4,009 7,097,144 7,101,153
Deferred inflow of resources: Pension liability experience - 3,605 3,605
Total liabilities and deferred inflows of resources 4,009 7,100,749 7,104,758
Net Investment in capital assets - (235,706) (235,706) Restricted net position 14,641 47,223 61,864 Unrestricted net position 74,898 474,365 549,263 Net position 89,539$ 285,882$ 375,421$
PFIC 49,141$ -$ 49,141$ Airport - 630,099 630,099 Total operating revenues 49,141$ 630,099$ 679,240$
PFIC 36,021$ -$ 36,021$ Airport - 402,901 402,901 Depreciation and amortization - 263,218 263,218 Total operating expenses 36,021$ 666,119$ 702,140$
Operating income (loss) 13,120 (36,020) (22,900)
Non-operating revenues (expenses) 21,017$ (119,112)$ (98,095)$ Transfers for debt service (18,125) 18,125 - Transfers for capital assets (14,938) 14,938 - Capital contributions - 13,773 13,773Special item - (41,761) (41,761)Increase (Decrease) in net position 1,074$ (150,057)$ (148,983)$ Net position - October 1, as previously stated 88,465 612,487 700,952Change in accounting principle - (176,548) (176,548)Net position - October 1, as restated 88,465 435,939 524,404
Total net position, end of year 89,539$ 285,882$ 375,421$
Net cash provided by operating activities 12,756$ 247,807$ 260,563$ Net cash provided by (used for) capital andrelated financing activities (12,471) (737,521) (749,992)
Net cash (used for) investing activities (30,084) 422,500 392,416Net increase (decrease) in cash and cash equivalents (29,799) (67,214) (97,013) Cash and cash equivalents, beginning of year 57,619 514,602 572,221Cash and cash equivalents, end of year 27,820$ 447,388$ 475,208$
Condensed PFIC financial statements are as follows (in thousands):
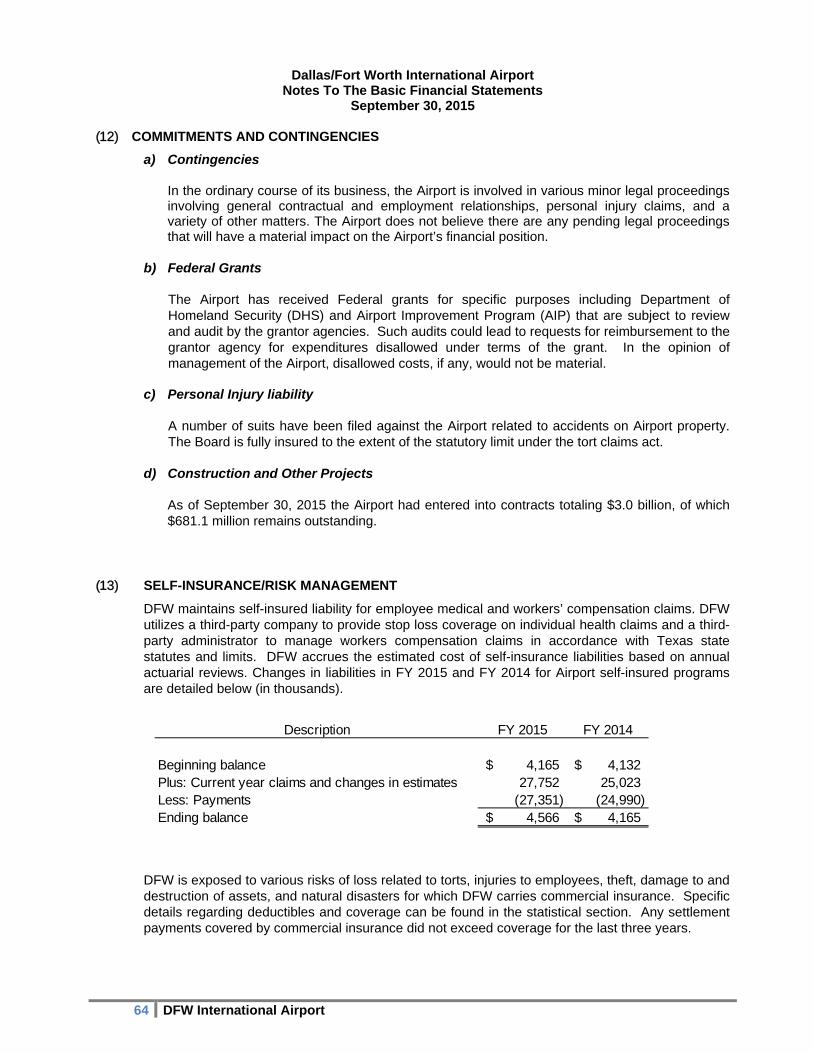
Dallas/Fort Worth International Airport Notes To The Basic Financial Statements
September 30, 2015
64 DFW International Airport
Description FY 2015 FY 2014
Beginning balance 4,165$ 4,132$ Plus: Current year claims and changes in estimates 27,752 25,023 Less: Payments (27,351) (24,990)Ending balance 4,566$ 4,165$
(12) COMMITMENTS AND CONTINGENCIES
a) Contingencies
In the ordinary course of its business, the Airport is involved in various minor legal proceedings involving general contractual and employment relationships, personal injury claims, and a variety of other matters. The Airport does not believe there are any pending legal proceedings that will have a material impact on the Airport’s financial position.
b) Federal Grants
The Airport has received Federal grants for specific purposes including Department of Homeland Security (DHS) and Airport Improvement Program (AIP) that are subject to review and audit by the grantor agencies. Such audits could lead to requests for reimbursement to the grantor agency for expenditures disallowed under terms of the grant. In the opinion of management of the Airport, disallowed costs, if any, would not be material.
c) Personal Injury liability
A number of suits have been filed against the Airport related to accidents on Airport property. The Board is fully insured to the extent of the statutory limit under the tort claims act.
d) Construction and Other Projects
As of September 30, 2015 the Airport had entered into contracts totaling $3.0 billion, of which $681.1 million remains outstanding.
(13) SELF-INSURANCE/RISK MANAGEMENT
DFW maintains self-insured liability for employee medical and workers’ compensation claims. DFW utilizes a third-party company to provide stop loss coverage on individual health claims and a third-party administrator to manage workers compensation claims in accordance with Texas state statutes and limits. DFW accrues the estimated cost of self-insurance liabilities based on annual actuarial reviews. Changes in liabilities in FY 2015 and FY 2014 for Airport self-insured programs are detailed below (in thousands).
DFW is exposed to various risks of loss related to torts, injuries to employees, theft, damage to and destruction of assets, and natural disasters for which DFW carries commercial insurance. Specific details regarding deductibles and coverage can be found in the statistical section. Any settlement payments covered by commercial insurance did not exceed coverage for the last three years.
Dallas/Fort Worth International Airport Notes To The Basic Financial Statements
September 30, 2015
65 DFW International Airport
(14) CONCENTRATION OF CREDIT RISK
DFW’s customers are principally concentrated within the airline industry. DFW periodically evaluates the financial condition of its customers and typically does not require collateral. DFW received approximately $271.3 million (39.9%) of its revenues during fiscal year 2015 from American Airlines Group (including American, American Eagle and US Airways). In FY 2015, American Airlines Group comprised 84.5% of all passengers and 76.0% of total landed weights at DFW.
(15) POLLUTION REMEDIATION
The Central Terminal Area (“CTA”) at DFW is currently under an Agreed Order by the Texas Commission on Environmental Quality (“TCEQ”) for remediation of a jet fuel leak in the underground pipelines. This Agreed Order (“AO”) was issued in 1999 and an Affected Property Assessment Report (APAR) dated September 2002, identified the primary areas of concern (“AOCs”) as Terminals B, C, and to a lesser extent, A. A comprehensive Response Action Plan (“RAP”) dated December 2002 was developed recommending remedial actions for each AOC including engineered remediation systems at Terminals B & C and Mobile Dual Phase Extraction (“MDPE”) at the remaining areas within the CTA. Mitigation continues in Terminal A with possible additional mitigation needed in Terminal B. As these efforts are on-going, the estimated liability as of September 30, 2015 is $1.5 million DFW’s Northwest Cargo Voluntary Cleanup Program (“VCP”) is an area encompassing approximately 418.485 acres including multiple AOCs representing chlorinated solvent groundwater and soil as well as jet fuel contamination. To date, approximately 230.61 acres have been granted a Conditional Certificate of Completion by TCEQ. The RAP outlining the remediation strategies for the remaining 187.875 acres dated December 5, 2011, was approved by TCEQ. The Response Action strategies included in the approved RAP are currently being re-evaluated in conjunction with future development plans within the Northwest Cargo areas to identify the most cost-effective and efficient approaches to achieve regulatory closure. As of September 30, 2015, the total liability of $10.0 million remains a reasonable estimate but will be reviewed and updated as new information becomes available. Environmental liabilities include an accrual for asbestos removal incurred in conjunction with the TRIP. The majority of the Asbestos Containing Material (“ACM”) is in the form of fire proofing materials originally sprayed onto the ceiling of the terminal roofs for fire proofing purposes, which is governed by Federal law. As part of the 1970 Federal Clean Air Act (“CAA”), the U.S. Environmental Protection Agency (“EPA”) set standards known as National Emissions Standards for Hazardous Air Pollutants (“NESHAP”) which require the mitigation of this risk. The extent and cost has been estimated through facility testing by DFW Airport’s Environmental Affairs Department (“EAD”) in conjunction with DFW’s Airport Development & Engineering (“ADE”) and TRIP team. The estimates and assumptions used for these forecasts were based on a number of factors including actual asbestos findings and removal costs from terminal sections recently completed, e.g., Terminal A – section A, testing on future areas within the scope of the TRIP program, design calculations of scheduled areas in the TRIP terminals yet to be mitigated and applying the historical cost of remediation per square foot. In FY 2015, DFW estimated and recorded an additional liability and a special item of $41.8 million. This liability was recognized in accordance with GASB 49, upon occurrence of an obligating event defined as the commencement of the respective sections of the Terminal renovations on that specific area undergoing renovation which is when the ACM becomes friable and represents a health risk subject to NESHAP mitigation. Actual remediation expenditures were $39.2 million in FY 2015. As of September 30, 2015, the asbestos remediation liability was $14.0 million.

REQUIRED SUPPLEMENTARY INFORMATION

Dallas/Fort Worth International Airport Schedule of Changes in the Net Pension Liability and Related Ratios
December 31, 2014 (Amounts in Thousands)
(Unaudited)
66 DFW International Airport
Employees and DPS 2014
Total Pension Liability
Service cost 15,569$
Interest on the Total Pension Liability 46,638
Difference between expected and actual experience (4,672)
of the Total Pension Liability
Benefit payments and refunds (24,052)
Net change in Total Pension Liability 33,483
Total Pension Liability - beginning 647,521
Total Pension Liability - ending 681,004$
Plan Fiduciary Net Position
Contributions - employer 31,460$
Contributions - member 1,870
Net investment income 23,614
Benefit payments, including member refunds (24,052)
Administrative expense (372)
Net change in Plan Fiduciary Net Position 32,520
Plan Fiduciary Net Position - beginning 523,670
Plan Fiduciary Net Position - ending 556,190$
Net Pension Liability - ending 124,814
Plan Fiduciary Net Position as a percentage of 81.67%
the total pension liability
Covered-employee payroll 89,476$
Net pension liability as a percentage of 139.49%
covered-employee payroll
Notes to Schedule:
One year history based on data availability.
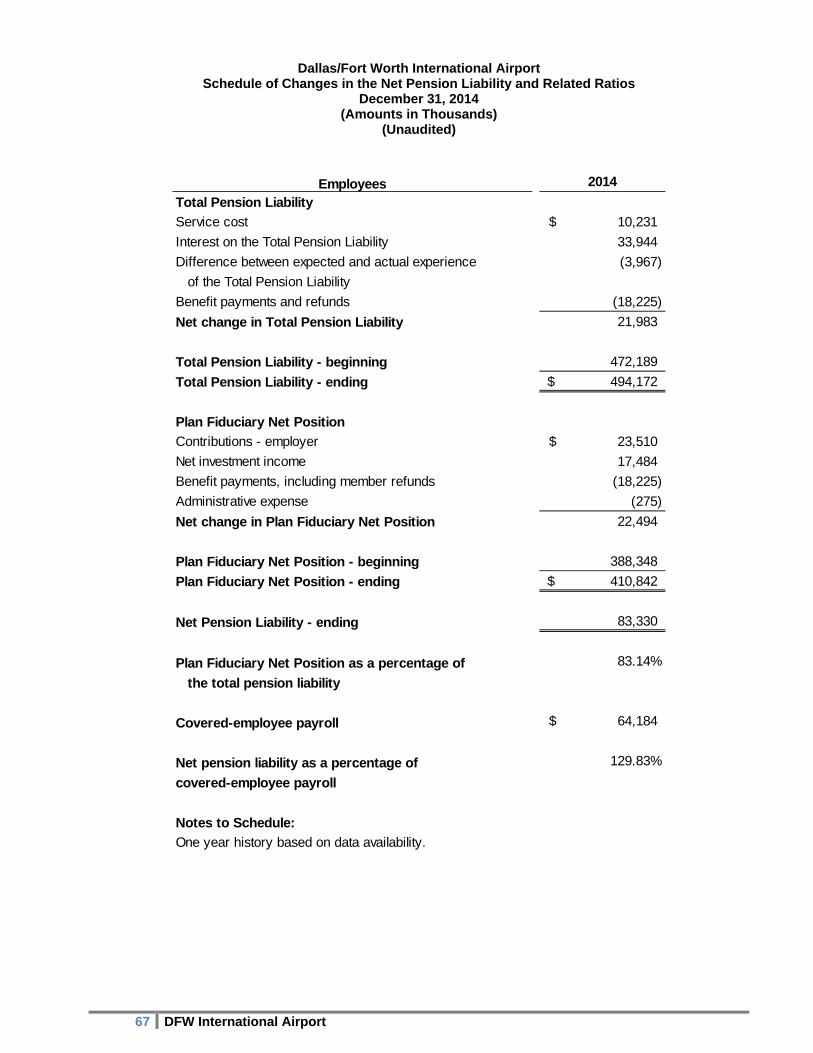
Dallas/Fort Worth International Airport Schedule of Changes in the Net Pension Liability and Related Ratios
December 31, 2014 (Amounts in Thousands)
(Unaudited)
67 DFW International Airport
Employees 2014
Total Pension Liability
Service cost 10,231$
Interest on the Total Pension Liability 33,944
Difference between expected and actual experience (3,967)
of the Total Pension Liability
Benefit payments and refunds (18,225)
Net change in Total Pension Liability 21,983
Total Pension Liability - beginning 472,189
Total Pension Liability - ending 494,172$
Plan Fiduciary Net Position
Contributions - employer 23,510$
Net investment income 17,484
Benefit payments, including member refunds (18,225)
Administrative expense (275)
Net change in Plan Fiduciary Net Position 22,494
Plan Fiduciary Net Position - beginning 388,348
Plan Fiduciary Net Position - ending 410,842$
Net Pension Liability - ending 83,330
Plan Fiduciary Net Position as a percentage of 83.14%
the total pension liability
Covered-employee payroll 64,184$
Net pension liability as a percentage of 129.83%
covered-employee payroll
Notes to Schedule:
One year history based on data availability.
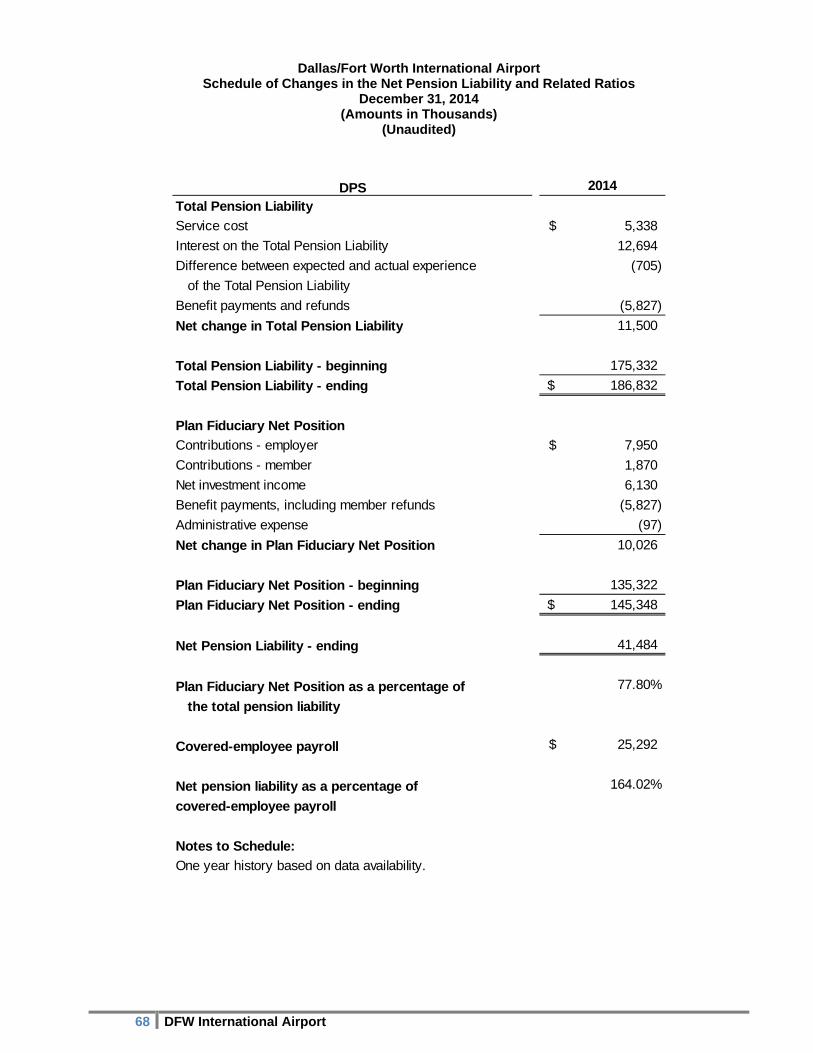
Dallas/Fort Worth International Airport Schedule of Changes in the Net Pension Liability and Related Ratios
December 31, 2014 (Amounts in Thousands)
(Unaudited)
68 DFW International Airport
DPS 2014
Total Pension Liability
Service cost 5,338$
Interest on the Total Pension Liability 12,694
Difference between expected and actual experience (705)
of the Total Pension Liability
Benefit payments and refunds (5,827)
Net change in Total Pension Liability 11,500
Total Pension Liability - beginning 175,332
Total Pension Liability - ending 186,832$
Plan Fiduciary Net Position
Contributions - employer 7,950$
Contributions - member 1,870
Net investment income 6,130
Benefit payments, including member refunds (5,827)
Administrative expense (97)
Net change in Plan Fiduciary Net Position 10,026
Plan Fiduciary Net Position - beginning 135,322
Plan Fiduciary Net Position - ending 145,348$
Net Pension Liability - ending 41,484
Plan Fiduciary Net Position as a percentage of 77.80%
the total pension liability
Covered-employee payroll 25,292$
Net pension liability as a percentage of 164.02%
covered-employee payroll
Notes to Schedule:
One year history based on data availability.
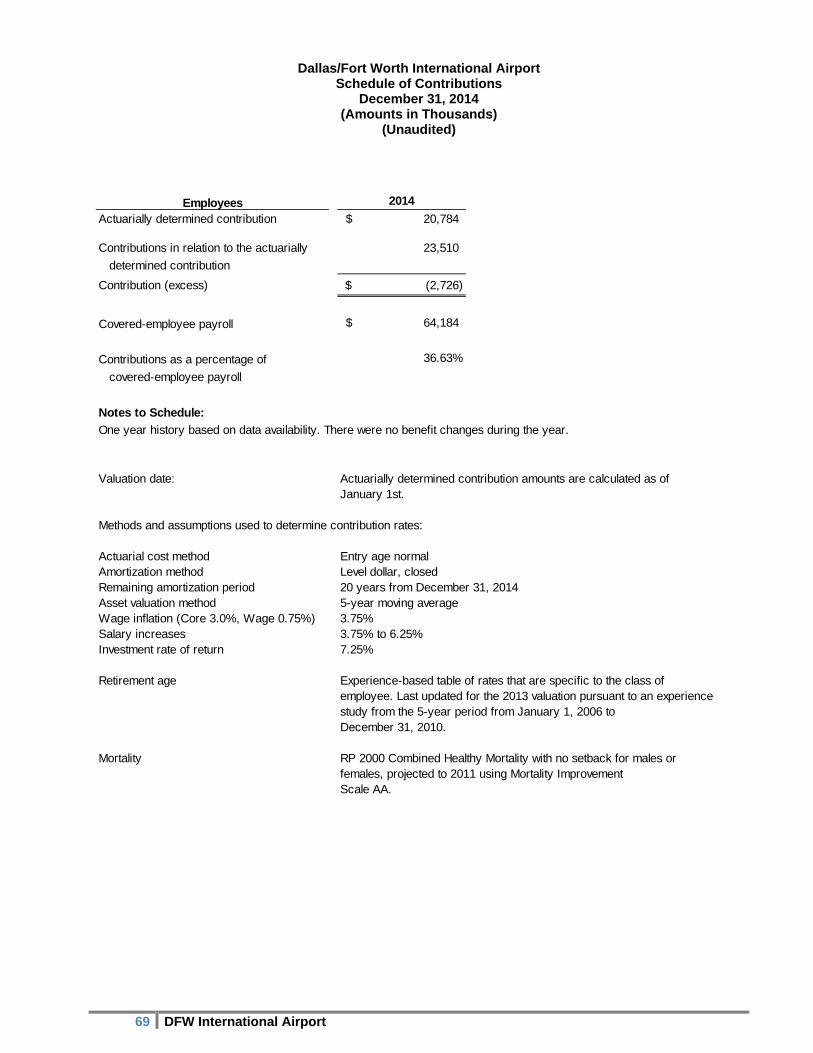
Dallas/Fort Worth International Airport Schedule of Contributions
December 31, 2014 (Amounts in Thousands)
(Unaudited)
69 DFW International Airport
Employees 2014
Actuarially determined contribution 20,784$
Contributions in relation to the actuarially 23,510
determined contribution
Contribution (excess) (2,726)$
Covered-employee payroll 64,184$
Contributions as a percentage of 36.63%
covered-employee payroll
Notes to Schedule:
One year history based on data availability. There were no benefit changes during the year.
Valuation date: Actuarially determined contribution amounts are calculated as ofJanuary 1st.
Methods and assumptions used to determine contribution rates:
Actuarial cost method Entry age normalAmortization method Level dollar, closedRemaining amortization period 20 years from December 31, 2014Asset valuation method 5-year moving averageWage inflation (Core 3.0%, Wage 0.75%) 3.75%Salary increases 3.75% to 6.25%Investment rate of return 7.25%
Retirement age Experience-based table of rates that are specific to the class ofemployee. Last updated for the 2013 valuation pursuant to an experiencestudy from the 5-year period from January 1, 2006 toDecember 31, 2010.
Mortality RP 2000 Combined Healthy Mortality with no setback for males or females, projected to 2011 using Mortality ImprovementScale AA.
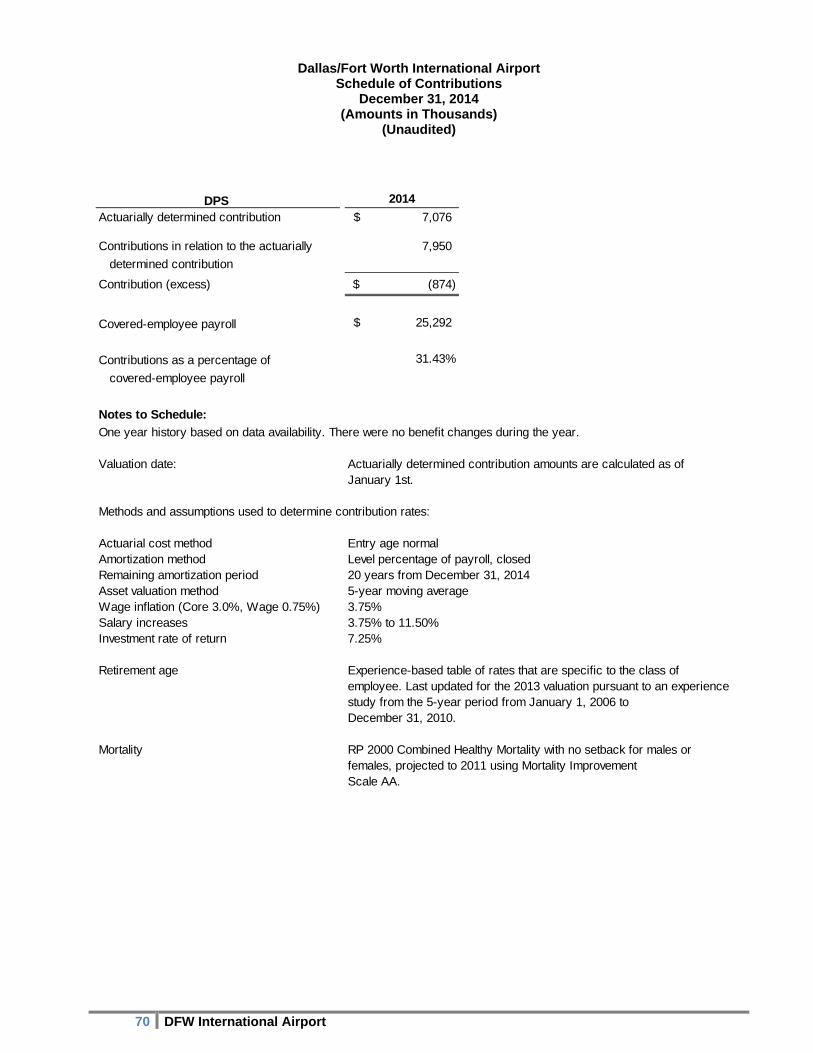
Dallas/Fort Worth International Airport Schedule of Contributions
December 31, 2014 (Amounts in Thousands)
(Unaudited)
70 DFW International Airport
DPS 2014
Actuarially determined contribution 7,076$
Contributions in relation to the actuarially 7,950
determined contribution
Contribution (excess) (874)$
Covered-employee payroll 25,292$
Contributions as a percentage of 31.43%
covered-employee payroll
Notes to Schedule:
One year history based on data availability. There were no benefit changes during the year.
Valuation date: Actuarially determined contribution amounts are calculated as ofJanuary 1st.
Methods and assumptions used to determine contribution rates:
Actuarial cost method Entry age normalAmortization method Level percentage of payroll, closedRemaining amortization period 20 years from December 31, 2014Asset valuation method 5-year moving averageWage inflation (Core 3.0%, Wage 0.75%) 3.75%Salary increases 3.75% to 11.50%Investment rate of return 7.25%
Retirement age Experience-based table of rates that are specific to the class ofemployee. Last updated for the 2013 valuation pursuant to an experiencestudy from the 5-year period from January 1, 2006 toDecember 31, 2010.
Mortality RP 2000 Combined Healthy Mortality with no setback for males or females, projected to 2011 using Mortality ImprovementScale AA.
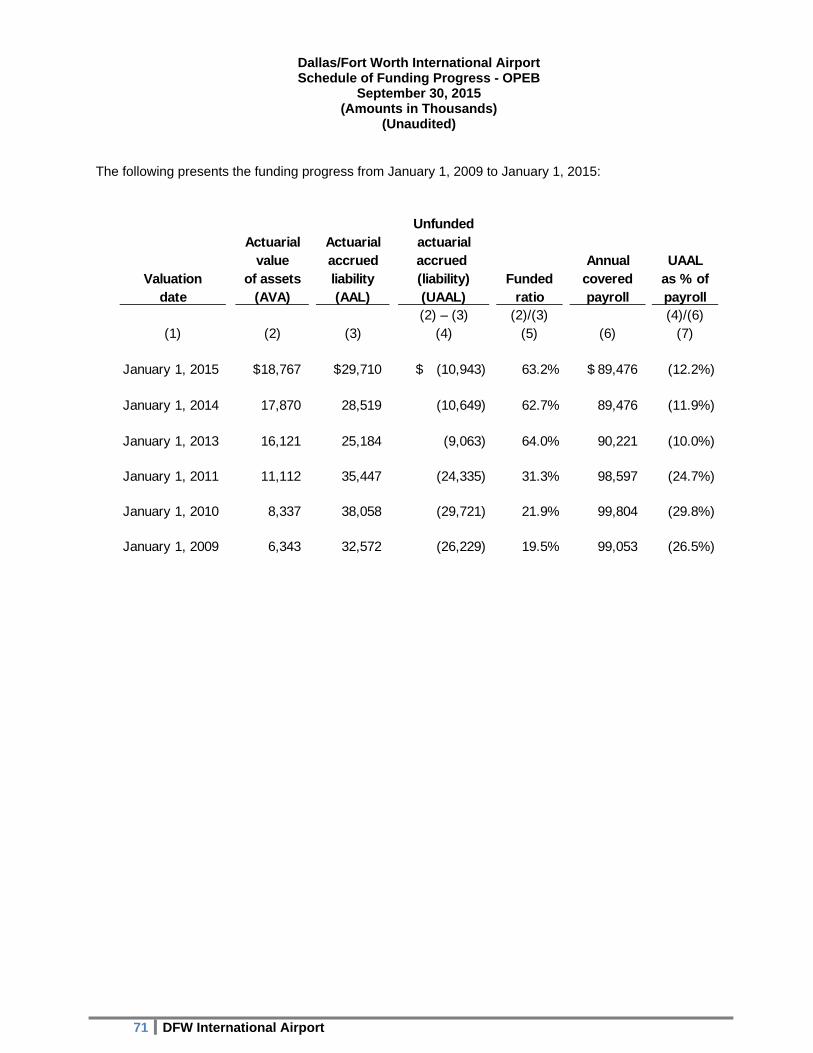
Dallas/Fort Worth International Airport Schedule of Funding Progress - OPEB
September 30, 2015 (Amounts in Thousands)
(Unaudited)
71 DFW International Airport
UnfundedActuarial Actuarial actuarial
value accrued accrued Annual UAALValuation of assets liability (liability) Funded covered as % of
date (AVA) (AAL) (UAAL) ratio payroll payroll(2) – (3) (2)/(3) (4)/(6)
(1) (2) (3) (4) (5) (6) (7)
January 1, 2015 18,767$ 29,710$ (10,943)$ 63.2% 89,476$ (12.2%)
January 1, 2014 17,870 28,519 (10,649) 62.7% 89,476 (11.9%)
January 1, 2013 16,121 25,184 (9,063) 64.0% 90,221 (10.0%)
January 1, 2011 11,112 35,447 (24,335) 31.3% 98,597 (24.7%)
January 1, 2010 8,337 38,058 (29,721) 21.9% 99,804 (29.8%)
January 1, 2009 6,343 32,572 (26,229) 19.5% 99,053 (26.5%)
The following presents the funding progress from January 1, 2009 to January 1, 2015:

SUPPLEMENTARY INFORMATION
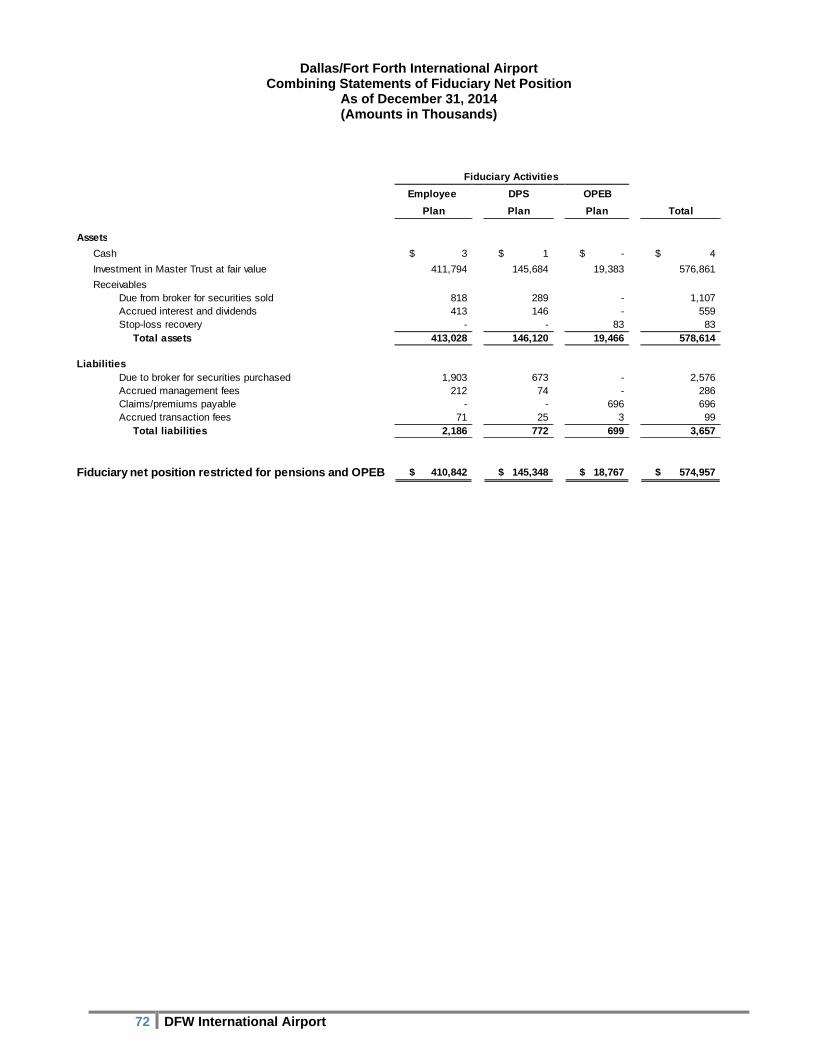
Dallas/Fort Forth International Airport Combining Statements of Fiduciary Net Position
As of December 31, 2014 (Amounts in Thousands)
72 DFW International Airport
Employee DPS OPEB
Plan Plan Plan Total
Assets
Cash 3$ 1$ -$ 4$
Investment in Master Trust at fair value 411,794 145,684 19,383 576,861
ReceivablesDue from broker for securities sold 818 289 - 1,107 Accrued interest and dividends 413 146 - 559 Stop-loss recovery - - 83 83
Total assets 413,028 146,120 19,466 578,614
LiabilitiesDue to broker for securities purchased 1,903 673 - 2,576 Accrued management fees 212 74 - 286 Claims/premiums payable - - 696 696 Accrued transaction fees 71 25 3 99
Total liabilities 2,186 772 699 3,657
Fiduciary net position restricted for pensions and OPEB 410,842$ 145,348$ 18,767$ 574,957$
Fiduciary Activities
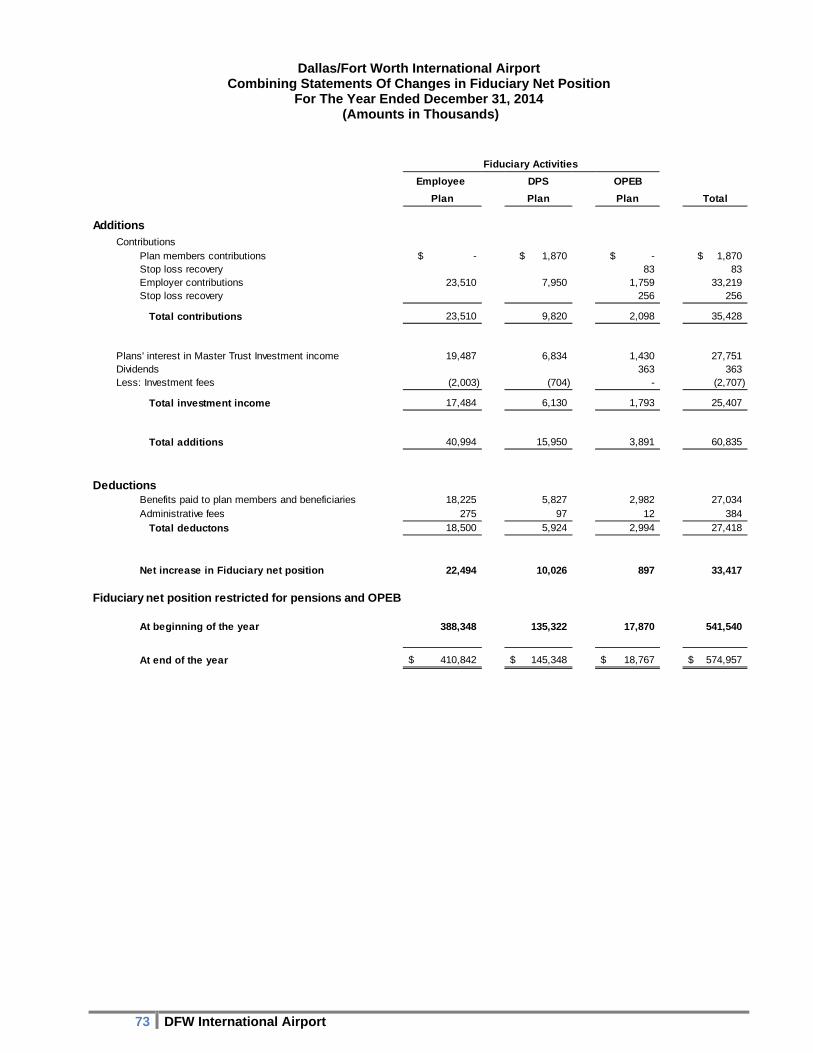
Dallas/Fort Worth International Airport Combining Statements Of Changes in Fiduciary Net Position
For The Year Ended December 31, 2014 (Amounts in Thousands)
73 DFW International Airport
Employee DPS OPEB
Plan Plan Plan Total
AdditionsContributions
Plan members contributions -$ 1,870$ -$ 1,870$ Stop loss recovery 83 83 Employer contributions 23,510 7,950 1,759 33,219 Stop loss recovery 256 256
Total contributions 23,510 9,820 2,098 35,428
Plans' interest in Master Trust Investment income 19,487 6,834 1,430 27,751 Dividends 363 363 Less: Investment fees (2,003) (704) - (2,707)
Total investment income 17,484 6,130 1,793 25,407
Total additions 40,994 15,950 3,891 60,835
DeductionsBenefits paid to plan members and beneficiaries 18,225 5,827 2,982 27,034 Administrative fees 275 97 12 384
Total deductons 18,500 5,924 2,994 27,418
Net increase in Fiduciary net position 22,494 10,026 897 33,417
Fiduciary net position restricted for pensions and OPEB
At beginning of the year 388,348 135,322 17,870 541,540
At end of the year 410,842$ 145,348$ 18,767$ 574,957$
Fiduciary Activities
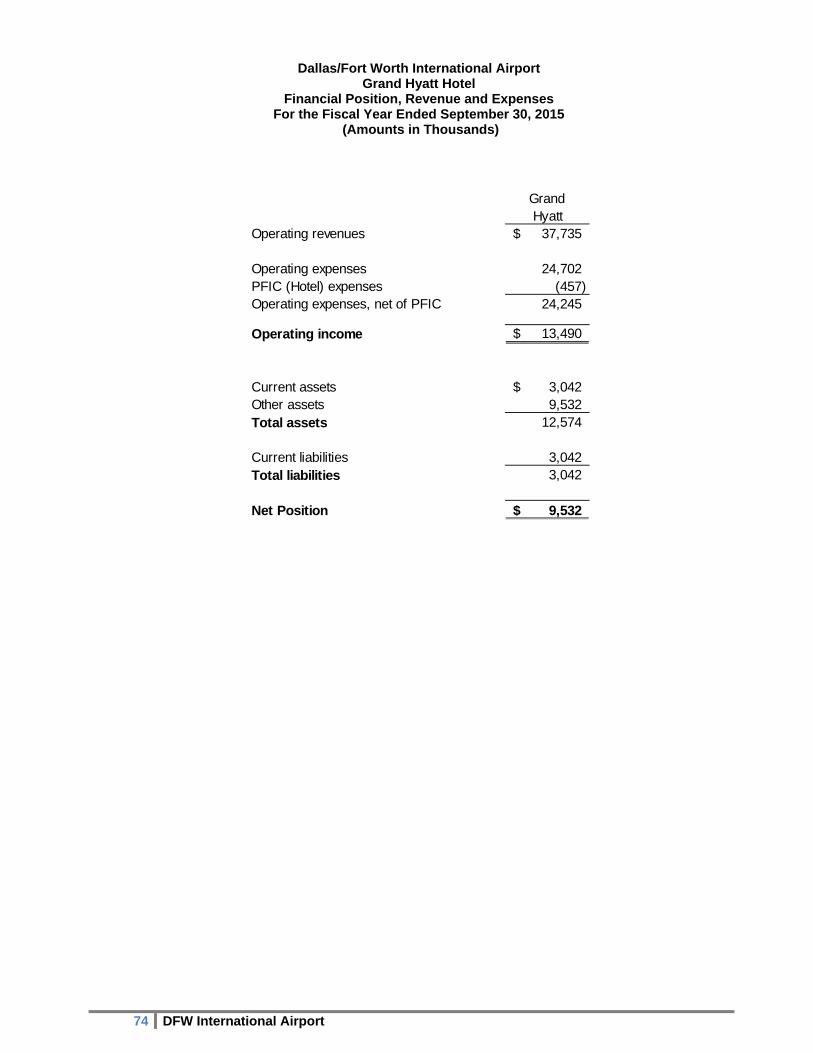
Dallas/Fort Worth International Airport Grand Hyatt Hotel
Financial Position, Revenue and Expenses For the Fiscal Year Ended September 30, 2015
(Amounts in Thousands)
74 DFW International Airport
GrandHyatt
Operating revenues 37,735$
Operating expenses 24,702 PFIC (Hotel) expenses (457) Operating expenses, net of PFIC 24,245
Operating income 13,490$
Current assets 3,042$ Other assets 9,532 Total assets 12,574
Current liabilities 3,042 Total liabilities 3,042
Net Position 9,532$

STATISTICAL SECTION
STATISTICAL SECTION
This section of DFW’s comprehensive and annual financial report presents detailed information for the purpose of supporting the reader’s understanding of DFW’s financial statements and note disclosures.
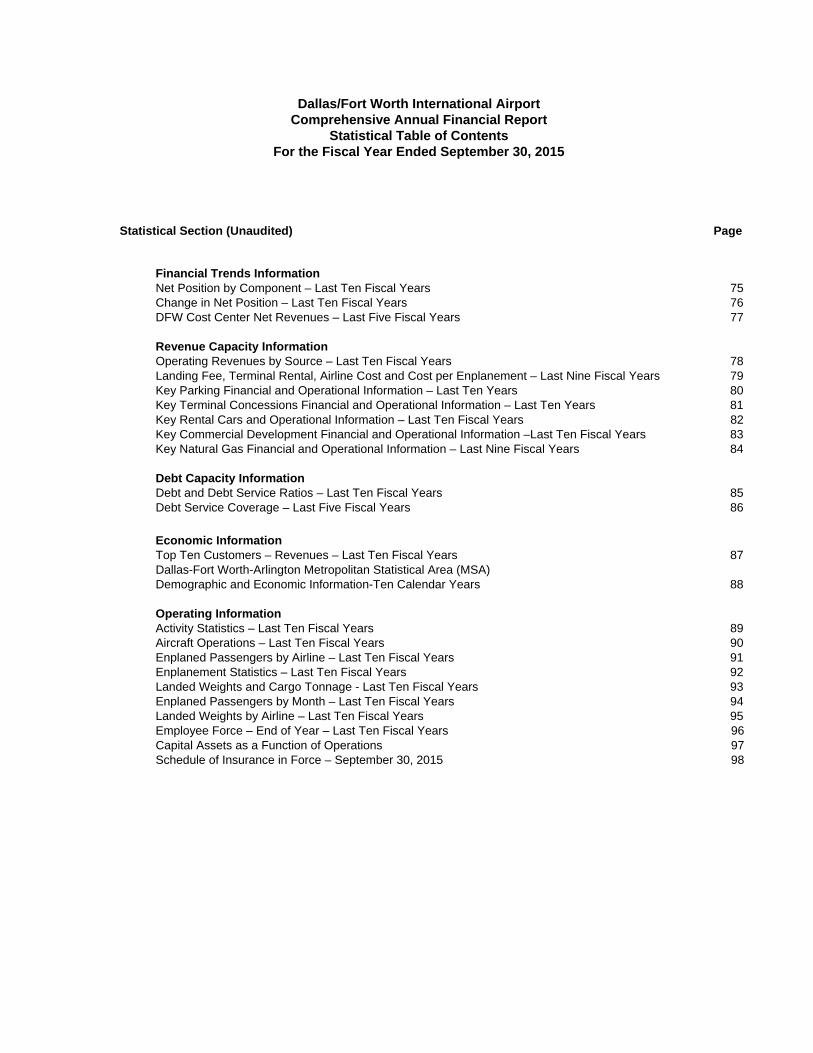
Dallas/Fort Worth International Airport Comprehensive Annual Financial Report
Statistical Table of Contents For the Fiscal Year Ended September 30, 2015
Statistical Section (Unaudited) Page
Financial Trends Information Net Position by Component – Last Ten Fiscal Years 75 Change in Net Position – Last Ten Fiscal Years 76 DFW Cost Center Net Revenues – Last Five Fiscal Years 77 Revenue Capacity Information Operating Revenues by Source – Last Ten Fiscal Years 78 Landing Fee, Terminal Rental, Airline Cost and Cost per Enplanement – Last Nine Fiscal Years 79 Key Parking Financial and Operational Information – Last Ten Years 80 Key Terminal Concessions Financial and Operational Information – Last Ten Years 81 Key Rental Cars and Operational Information – Last Ten Fiscal Years 82 Key Commercial Development Financial and Operational Information –Last Ten Fiscal Years 83 Key Natural Gas Financial and Operational Information – Last Nine Fiscal Years 84 Debt Capacity Information Debt and Debt Service Ratios – Last Ten Fiscal Years 85 Debt Service Coverage – Last Five Fiscal Years 86
Economic Information Top Ten Customers – Revenues – Last Ten Fiscal Years 87 Dallas-Fort Worth-Arlington Metropolitan Statistical Area (MSA) Demographic and Economic Information-Ten Calendar Years 88 Operating Information Activity Statistics – Last Ten Fiscal Years 89 Aircraft Operations – Last Ten Fiscal Years 90 Enplaned Passengers by Airline – Last Ten Fiscal Years 91 Enplanement Statistics – Last Ten Fiscal Years 92 Landed Weights and Cargo Tonnage - Last Ten Fiscal Years 93 Enplaned Passengers by Month – Last Ten Fiscal Years 94 Landed Weights by Airline – Last Ten Fiscal Years 95 Employee Force – End of Year – Last Ten Fiscal Years 96 Capital Assets as a Function of Operations 97 Schedule of Insurance in Force – September 30, 2015 98

FINANCIAL TRENDS INFORMATION
The following tables are designed to assist the reader in gaining a greater understanding of how DFW’s financial performance has changed over time.
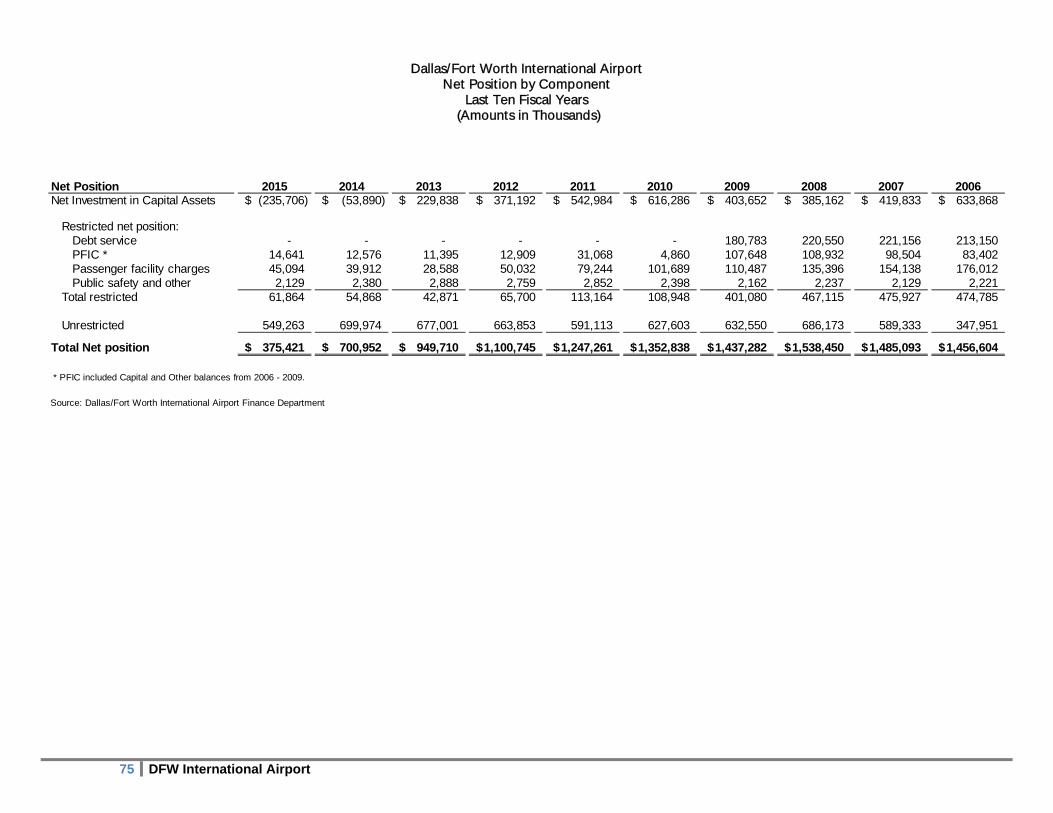
Dallas/Fort Worth International Airport Net Position by Component
Last Ten Fiscal Years (Amounts in Thousands)
75 DFW International Airport
Net Position 2015 2014 2013 2012 2011 2010 2009 2008 2007 2006Net Investment in Capital Assets (235,706)$ (53,890)$ 229,838$ 371,192$ 542,984$ 616,286$ 403,652$ 385,162$ 419,833$ 633,868$
Restricted net position:Debt service - - - - - - 180,783 220,550 221,156 213,150 PFIC * 14,641 12,576 11,395 12,909 31,068 4,860 107,648 108,932 98,504 83,402 Passenger facility charges 45,094 39,912 28,588 50,032 79,244 101,689 110,487 135,396 154,138 176,012 Public safety and other 2,129 2,380 2,888 2,759 2,852 2,398 2,162 2,237 2,129 2,221
Total restricted 61,864 54,868 42,871 65,700 113,164 108,948 401,080 467,115 475,927 474,785
Unrestricted 549,263 699,974 677,001 663,853 591,113 627,603 632,550 686,173 589,333 347,951
Total Net position 375,421$ 700,952$ 949,710$ 1,100,745$ 1,247,261$ 1,352,838$ 1,437,282$ 1,538,450$ 1,485,093$ 1,456,604$
* PFIC included Capital and Other balances from 2006 - 2009.
Source: Dallas/Fort Worth International Airport Finance Department

Dallas/Fort Worth International Airport
Changes in Net Position Last Ten Fiscal Years
(Amounts in Thousands)
76 DFW International Airport
2015 2014 2013 2012 (2) 2011 2010 2009 2008 2007 2006
Operating revenues
Terminal rent and use fees(1) 180,667$ 132,835$ 109,722$ 83,520$ 78,408$ 18,719$ 26,248$ 25,455$ 30,014$ 33,466$
Landing fees(1) 96,010 104,330 100,610 108,682 105,136 162,998 164,428 164,452 155,136 193,344
Federal Inspection Services (FIS) 18,499 18,707 21,805 19,007 14,979 10,557 9,938 10,632 10,539 10,289 Other airline 260 142 320 (216) 827 10,729 13,701 12,210 17,603 14,399
Total airline revenue (2) 295,436 256,014 232,457 210,993 199,350 203,003 214,315 212,748 213,293 251,499 Parking 135,163 125,170 116,092 110,841 107,178 97,329 92,728 103,875 106,572 90,703 Concessions 73,963 73,288 68,229 65,702 57,537 51,170 48,758 52,350 46,753 40,778 Ground and facilities leases 37,643 37,266 34,297 33,508 33,218 28,001 26,111 27,201 22,201 21,123 Grand Hyatt Hotel 37,735 35,028 31,032 28,775 25,504 25,692 25,290 28,234 26,853 22,178 Rent-A-Car rental 31,781 32,419 31,425 27,746 27,699 25,714 25,697 28,057 28,423 27,174 Employee transportation 16,619 13,970 12,345 10,200 8,119 7,747 8,383 8,358 7,647 7,573 Rent-A-Car customer transportation charges 11,406 11,507 11,106 11,683 10,338 9,242 8,430 7,224 - - Taxi and limo fees 9,422 8,980 8,133 8,217 7,703 7,167 5,825 6,695 6,838 5,579 Natural gas 3,710 6,287 8,498 8,709 20,082 25,521 26,255 131,886 92,608 - Other non-airline 26,362 24,733 23,867 23,653 17,872 20,367 21,728 24,589 23,047 24,503
Total non-airline revenue 383,804 368,648 345,024 329,034 315,250 297,950 289,203 418,469 360,941 239,612
Total operating revenues 679,240 624,662 577,481 540,027 514,600 500,953 503,519 631,217 574,234 491,110
Operating Expenses
Salaries, wages, and benefits 184,662 182,441 169,635 177,367 167,334 157,810 153,531 152,896 145,864 139,320 Contract services 162,500 149,765 147,854 130,206 128,982 121,950 138,958 130,208 111,922 105,933 Equipment and supplies(2) 23,654 26,172 21,918 28,152 25,993 20,842 16,329 23,432 20,351 23,276 Utilities 27,722 25,903 26,103 27,487 28,274 30,328 34,659 37,664 38,198 42,314 Grand Hyatt Hotel 24,702 23,173 21,914 20,146 18,320 18,716 17,366 17,780 15,790 14,408 Insurance 5,329 5,381 5,177 4,307 4,118 4,590 4,321 4,327 4,730 5,258 General, administrative and other 10,353 10,574 7,177 6,507 6,172 5,058 4,448 6,132 5,330 4,430 Depreciation and amortization 263,218 244,251 237,768 255,344 232,277 192,958 192,105 189,873 196,100 202,736
Total operating expenses 702,140 667,660 637,545 649,516 611,470 552,252 561,717 562,312 538,285 537,674
Operating income (loss) (22,900) (42,998) (60,065) (109,489) (96,870) (51,299) (58,199) 68,905 35,949 (46,564)
Non-Operating revenues (expenses)
Passenger facility charges 128,810 122,309 115,565 109,133 108,482 105,890 104,903 107,443 111,906 112,510 RAC customer facility charge 20,759 20,922 20,191 19,713 19,242 16,712 16,510 19,765 23,620 18,202 Interest income 16,979 8,000 4,804 6,027 7,766 7,999 26,859 45,659 61,815 45,795 Interest expense on revenue bonds (257,348) (252,026) (225,445) (200,565) (215,484) (190,162) (217,696) (218,295) (216,350) (229,383)
Repayment to owner cities - - - - - - - - (19,736) -
Other, net (7,295) 8,888 5,238 3,765 8,573 (3,493) (15,644) (3,689) (2,151) (18,610)Total non-operating expenses, net (98,095) (91,907) (79,647) (61,927) (71,421) (63,053) (85,068) (49,117) (40,896) (71,487)
Income (Loss) before capital contributions and special item (120,995) (134,905) (139,712) (171,416) (168,291) (114,352) (143,267) 19,788 (4,947) (118,051)
Capital contributions
Federal and State grant reimbursements 13,773 15,984 20,960 24,900 23,552 29,907 42,098 33,568 33,436 38,362
Total capital contributions 13,773 15,984 20,960 24,900 23,552 29,907 42,098 33,568 33,436 38,362
Special items (41,761) (12,281) (32,283) - 39,162 - - - - -
Net Position
Increase (decrease) in net position (148,983) (131,202) (151,035) (146,516) (105,577) (84,444) (101,168) 53,357 28,489 (79,688)
Total net position, beginning of year 700,952 949,710 1,100,745 1,247,261 1,352,838 1,437,282 1,538,450 1,485,093 1,456,604 1,536,292
Change in accounting principle (3) (176,548) (117,556) - - - - - - - -
Total net position, end of year 375,421$ 700,952$ 949,710$ 1,100,745$ 1,247,261$ 1,352,838$ 1,437,282$ 1,538,450$ 1,485,093$ 1,456,604$
Source: Statement of Revenues, Expenses and Change in Net assets
(1) Per the new use agreement
(2) The cost of ASIP was moved from Equipment and supplies to contra airline revenue for comparison purposes.
(3) Due to a change in accounting principle, the net position on October 1st, 2013 was restated as $832,154
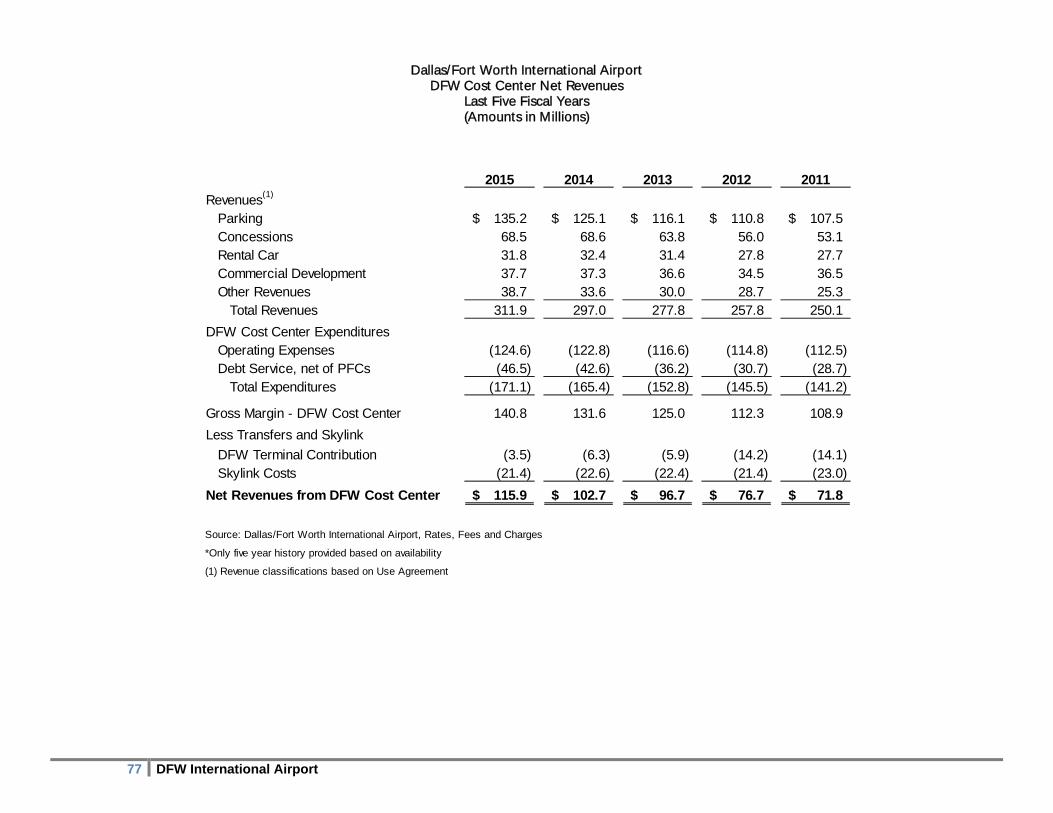
Dallas/Fort Worth International Airport DFW Cost Center Net Revenues
Last Five Fiscal Years (Amounts in Millions)
77 DFW International Airport
2015 2014 2013 2012 2011
Revenues(1)
Parking 135.2$ 125.1$ 116.1$ 110.8$ 107.5$ Concessions 68.5 68.6 63.8 56.0 53.1 Rental Car 31.8 32.4 31.4 27.8 27.7 Commercial Development 37.7 37.3 36.6 34.5 36.5 Other Revenues 38.7 33.6 30.0 28.7 25.3
Total Revenues 311.9 297.0 277.8 257.8 250.1
DFW Cost Center ExpendituresOperating Expenses (124.6) (122.8) (116.6) (114.8) (112.5) Debt Service, net of PFCs (46.5) (42.6) (36.2) (30.7) (28.7)
Total Expenditures (171.1) (165.4) (152.8) (145.5) (141.2)
Gross Margin - DFW Cost Center 140.8 131.6 125.0 112.3 108.9
Less Transfers and Skylink
DFW Terminal Contribution (3.5) (6.3) (5.9) (14.2) (14.1) Skylink Costs (21.4) (22.6) (22.4) (21.4) (23.0)
Net Revenues from DFW Cost Center 115.9$ 102.7$ 96.7$ 76.7$ 71.8$
Source: Dallas/Fort Worth International Airport, Rates, Fees and Charges
*Only five year history provided based on availability
(1) Revenue classifications based on Use Agreement
REVENUE CAPACITY INFORMATION
The following tables are designed to assist the reader in gaining a greater understanding of the
underlying factors affecting key DFW revenue trends.
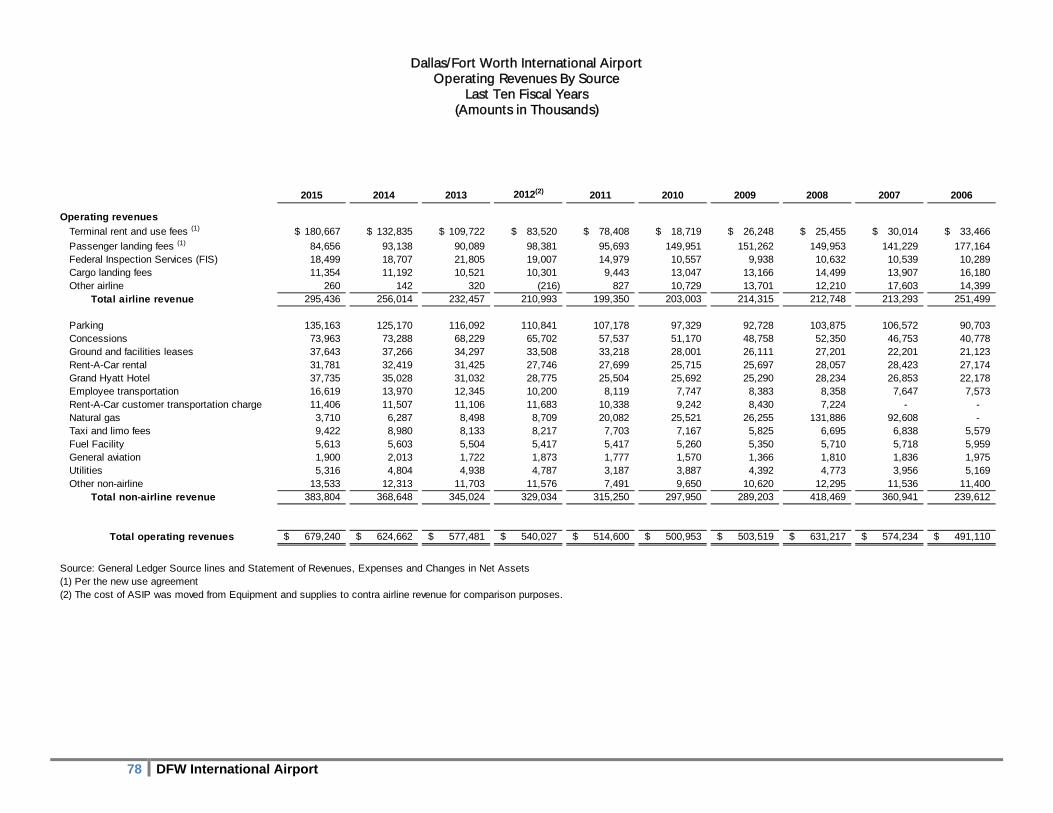
Dallas/Fort Worth International Airport Operating Revenues By Source
Last Ten Fiscal Years (Amounts in Thousands)
78 DFW International Airport
2015 2014 2013 2012(2) 2011 2010 2009 2008 2007 2006
Operating revenues
Terminal rent and use fees (1) 180,667$ 132,835$ 109,722$ 83,520$ 78,408$ 18,719$ 26,248$ 25,455$ 30,014$ 33,466$
Passenger landing fees (1) 84,656 93,138 90,089 98,381 95,693 149,951 151,262 149,953 141,229 177,164 Federal Inspection Services (FIS) 18,499 18,707 21,805 19,007 14,979 10,557 9,938 10,632 10,539 10,289 Cargo landing fees 11,354 11,192 10,521 10,301 9,443 13,047 13,166 14,499 13,907 16,180 Other airline 260 142 320 (216) 827 10,729 13,701 12,210 17,603 14,399 Total airline revenue 295,436 256,014 232,457 210,993 199,350 203,003 214,315 212,748 213,293 251,499
Parking 135,163 125,170 116,092 110,841 107,178 97,329 92,728 103,875 106,572 90,703 Concessions 73,963 73,288 68,229 65,702 57,537 51,170 48,758 52,350 46,753 40,778 Ground and facilities leases 37,643 37,266 34,297 33,508 33,218 28,001 26,111 27,201 22,201 21,123 Rent-A-Car rental 31,781 32,419 31,425 27,746 27,699 25,715 25,697 28,057 28,423 27,174 Grand Hyatt Hotel 37,735 35,028 31,032 28,775 25,504 25,692 25,290 28,234 26,853 22,178 Employee transportation 16,619 13,970 12,345 10,200 8,119 7,747 8,383 8,358 7,647 7,573 Rent-A-Car customer transportation charge 11,406 11,507 11,106 11,683 10,338 9,242 8,430 7,224 - - Natural gas 3,710 6,287 8,498 8,709 20,082 25,521 26,255 131,886 92,608 - Taxi and limo fees 9,422 8,980 8,133 8,217 7,703 7,167 5,825 6,695 6,838 5,579 Fuel Facility 5,613 5,603 5,504 5,417 5,417 5,260 5,350 5,710 5,718 5,959 General aviation 1,900 2,013 1,722 1,873 1,777 1,570 1,366 1,810 1,836 1,975 Utilities 5,316 4,804 4,938 4,787 3,187 3,887 4,392 4,773 3,956 5,169 Other non-airline 13,533 12,313 11,703 11,576 7,491 9,650 10,620 12,295 11,536 11,400 Total non-airline revenue 383,804 368,648 345,024 329,034 315,250 297,950 289,203 418,469 360,941 239,612
Total operating revenues 679,240$ 624,662$ 577,481$ 540,027$ 514,600$ 500,953$ 503,519$ 631,217$ 574,234$ 491,110$
Source: General Ledger Source lines and Statement of Revenues, Expenses and Changes in Net Assets (1) Per the new use agreement(2) The cost of ASIP was moved from Equipment and supplies to contra airline revenue for comparison purposes.
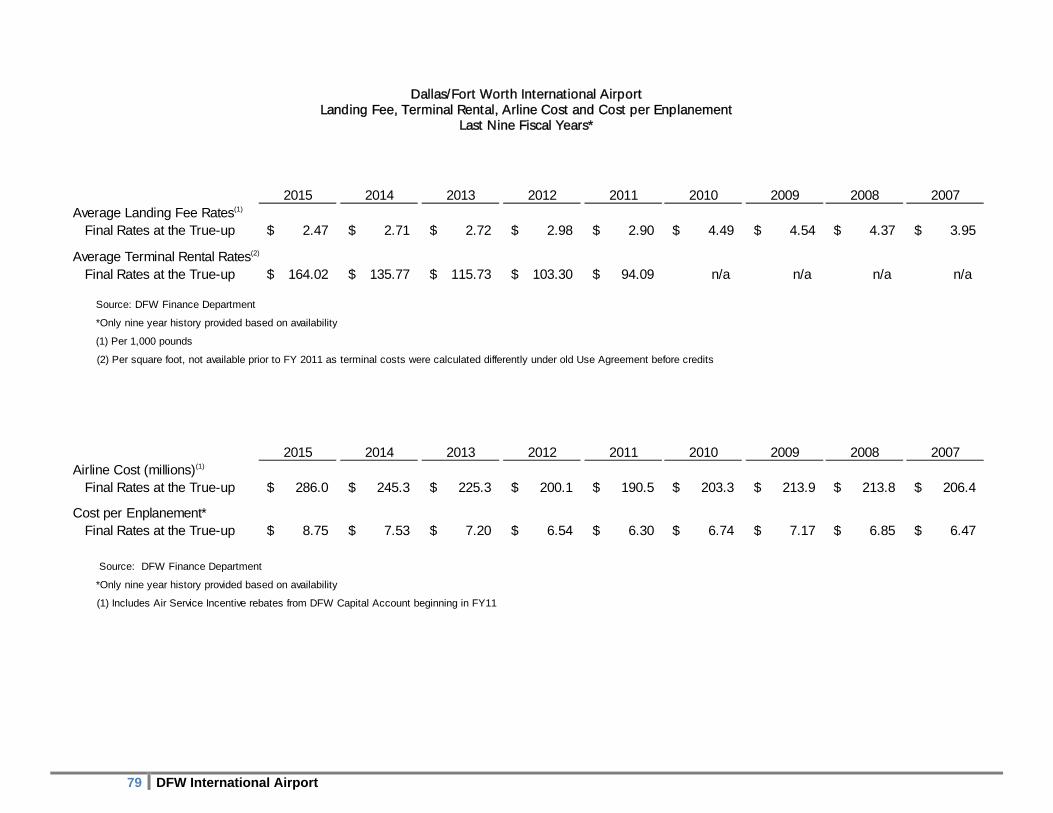
Dallas/Fort Worth International Airport Landing Fee, Terminal Rental, Arline Cost and Cost per Enplanement
Last Nine Fiscal Years*
79 DFW International Airport
2015 2014 2013 2012 2011 2010 2009 2008 2007Average Landing Fee Rates(1)
Final Rates at the True-up 2.47$ 2.71$ 2.72$ 2.98$ 2.90$ 4.49$ 4.54$ 4.37$ 3.95$
Average Terminal Rental Rates(2)
Final Rates at the True-up 164.02$ 135.77$ 115.73$ 103.30$ 94.09$ n/a n/a n/a n/a
Source: DFW Finance Department
*Only nine year history provided based on availability
(1) Per 1,000 pounds
(2) Per square foot, not available prior to FY 2011 as terminal costs were calculated differently under old Use Agreement before credits
2015 2014 2013 2012 2011 2010 2009 2008 2007Airline Cost (millions)(1)
Final Rates at the True-up 286.0$ 245.3$ 225.3$ 200.1$ 190.5$ 203.3$ 213.9$ 213.8$ 206.4$
Cost per Enplanement*Final Rates at the True-up 8.75$ 7.53$ 7.20$ 6.54$ 6.30$ 6.74$ 7.17$ 6.85$ 6.47$
Source: DFW Finance Department
*Only nine year history provided based on availability
(1) Includes Air Service Incentive rebates from DFW Capital Account beginning in FY11
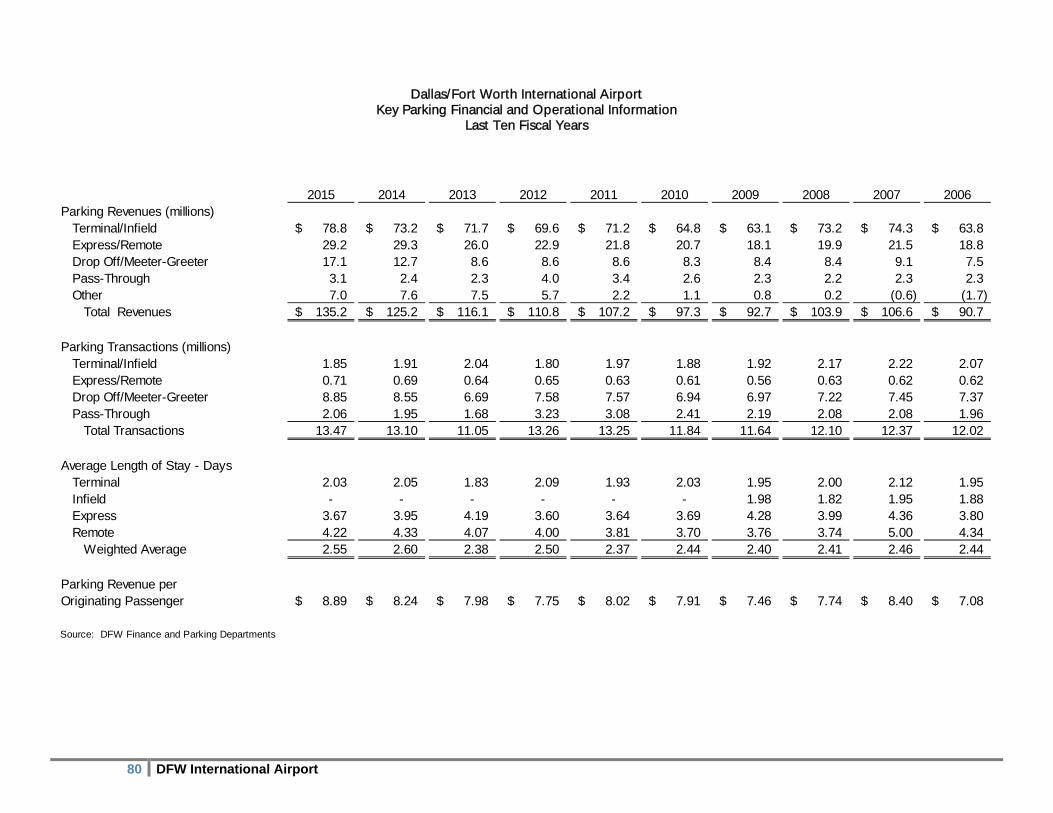
Dallas/Fort Worth International Airport Key Parking Financial and Operational Information
Last Ten Fiscal Years
80 DFW International Airport
2015 2014 2013 2012 2011 2010 2009 2008 2007 2006Parking Revenues (millions)
Terminal/Infield 78.8$ 73.2$ 71.7$ 69.6$ 71.2$ 64.8$ 63.1$ 73.2$ 74.3$ 63.8$ Express/Remote 29.2 29.3 26.0 22.9 21.8 20.7 18.1 19.9 21.5 18.8 Drop Off/Meeter-Greeter 17.1 12.7 8.6 8.6 8.6 8.3 8.4 8.4 9.1 7.5 Pass-Through 3.1 2.4 2.3 4.0 3.4 2.6 2.3 2.2 2.3 2.3 Other 7.0 7.6 7.5 5.7 2.2 1.1 0.8 0.2 (0.6) (1.7)
Total Revenues 135.2$ 125.2$ 116.1$ 110.8$ 107.2$ 97.3$ 92.7$ 103.9$ 106.6$ 90.7$
Parking Transactions (millions)Terminal/Infield 1.85 1.91 2.04 1.80 1.97 1.88 1.92 2.17 2.22 2.07Express/Remote 0.71 0.69 0.64 0.65 0.63 0.61 0.56 0.63 0.62 0.62Drop Off/Meeter-Greeter 8.85 8.55 6.69 7.58 7.57 6.94 6.97 7.22 7.45 7.37Pass-Through 2.06 1.95 1.68 3.23 3.08 2.41 2.19 2.08 2.08 1.96
Total Transactions 13.47 13.10 11.05 13.26 13.25 11.84 11.64 12.10 12.37 12.02
Average Length of Stay - DaysTerminal 2.03 2.05 1.83 2.09 1.93 2.03 1.95 2.00 2.12 1.95 Infield - - - - - - 1.98 1.82 1.95 1.88 Express 3.67 3.95 4.19 3.60 3.64 3.69 4.28 3.99 4.36 3.80 Remote 4.22 4.33 4.07 4.00 3.81 3.70 3.76 3.74 5.00 4.34
Weighted Average 2.55 2.60 2.38 2.50 2.37 2.44 2.40 2.41 2.46 2.44
Parking Revenue perOriginating Passenger 8.89$ 8.24$ 7.98$ 7.75$ 8.02$ 7.91$ 7.46$ 7.74$ 8.40$ 7.08$
Source: DFW Finance and Parking Departments
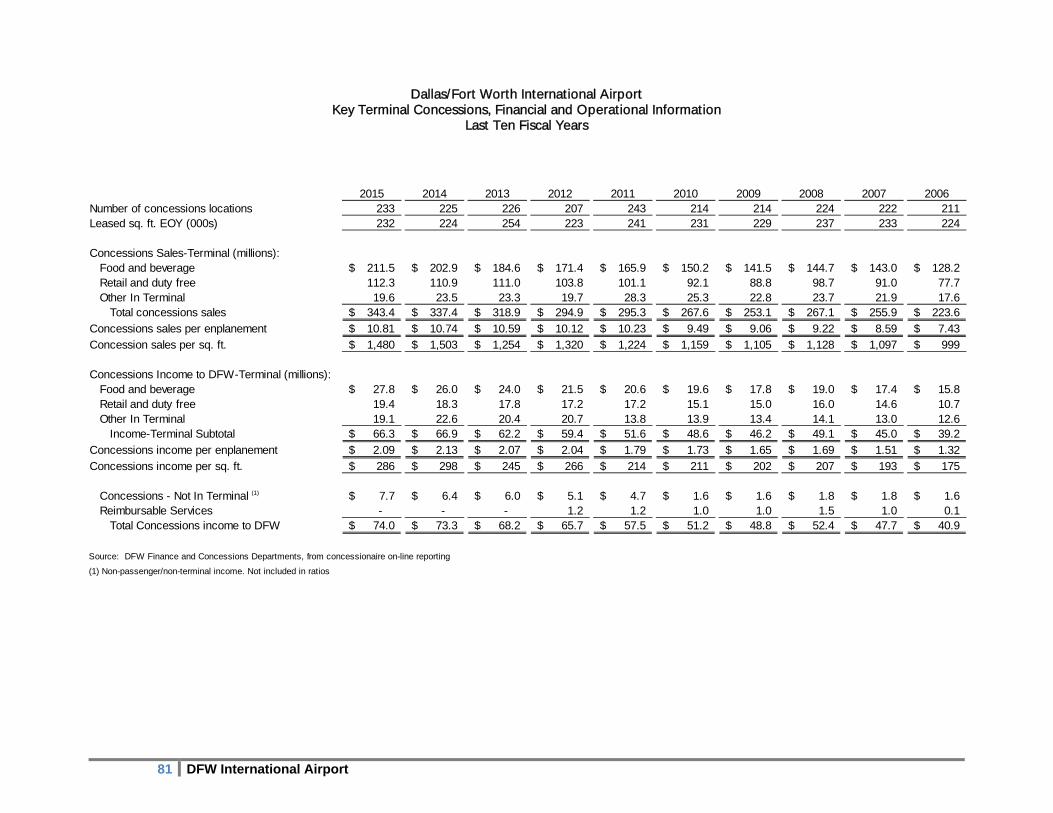
Dallas/Fort Worth International Airport Key Terminal Concessions, Financial and Operational Information
Last Ten Fiscal Years
81 DFW International Airport
2015 2014 2013 2012 2011 2010 2009 2008 2007 2006Number of concessions locations 233 225 226 207 243 214 214 224 222 211 Leased sq. ft. EOY (000s) 232 224 254 223 241 231 229 237 233 224
Concessions Sales-Terminal (millions): Food and beverage 211.5$ 202.9$ 184.6$ 171.4$ 165.9$ 150.2$ 141.5$ 144.7$ 143.0$ 128.2$ Retail and duty free 112.3 110.9 111.0 103.8 101.1 92.1 88.8 98.7 91.0 77.7 Other In Terminal 19.6 23.5 23.3 19.7 28.3 25.3 22.8 23.7 21.9 17.6
Total concessions sales 343.4$ 337.4$ 318.9$ 294.9$ 295.3$ 267.6$ 253.1$ 267.1$ 255.9$ 223.6$
Concessions sales per enplanement 10.81$ 10.74$ 10.59$ 10.12$ 10.23$ 9.49$ 9.06$ 9.22$ 8.59$ 7.43$
Concession sales per sq. ft. 1,480$ 1,503$ 1,254$ 1,320$ 1,224$ 1,159$ 1,105$ 1,128$ 1,097$ 999$
Concessions Income to DFW-Terminal (millions): Food and beverage 27.8$ 26.0$ 24.0$ 21.5$ 20.6$ 19.6$ 17.8$ 19.0$ 17.4$ 15.8$ Retail and duty free 19.4 18.3 17.8 17.2 17.2 15.1 15.0 16.0 14.6 10.7 Other In Terminal 19.1 22.6 20.4 20.7 13.8 13.9 13.4 14.1 13.0 12.6
Income-Terminal Subtotal 66.3$ 66.9$ 62.2$ 59.4$ 51.6$ 48.6$ 46.2$ 49.1$ 45.0$ 39.2$
Concessions income per enplanement 2.09$ 2.13$ 2.07$ 2.04$ 1.79$ 1.73$ 1.65$ 1.69$ 1.51$ 1.32$
Concessions income per sq. ft. 286$ 298$ 245$ 266$ 214$ 211$ 202$ 207$ 193$ 175$
Concessions - Not In Terminal (1) 7.7$ 6.4$ 6.0$ 5.1$ 4.7$ 1.6$ 1.6$ 1.8$ 1.8$ 1.6$ Reimbursable Services - - - 1.2 1.2 1.0 1.0 1.5 1.0 0.1
Total Concessions income to DFW 74.0$ 73.3$ 68.2$ 65.7$ 57.5$ 51.2$ 48.8$ 52.4$ 47.7$ 40.9$
Source: DFW Finance and Concessions Departments, from concessionaire on-line reporting
(1) Non-passenger/non-terminal income. Not included in ratios
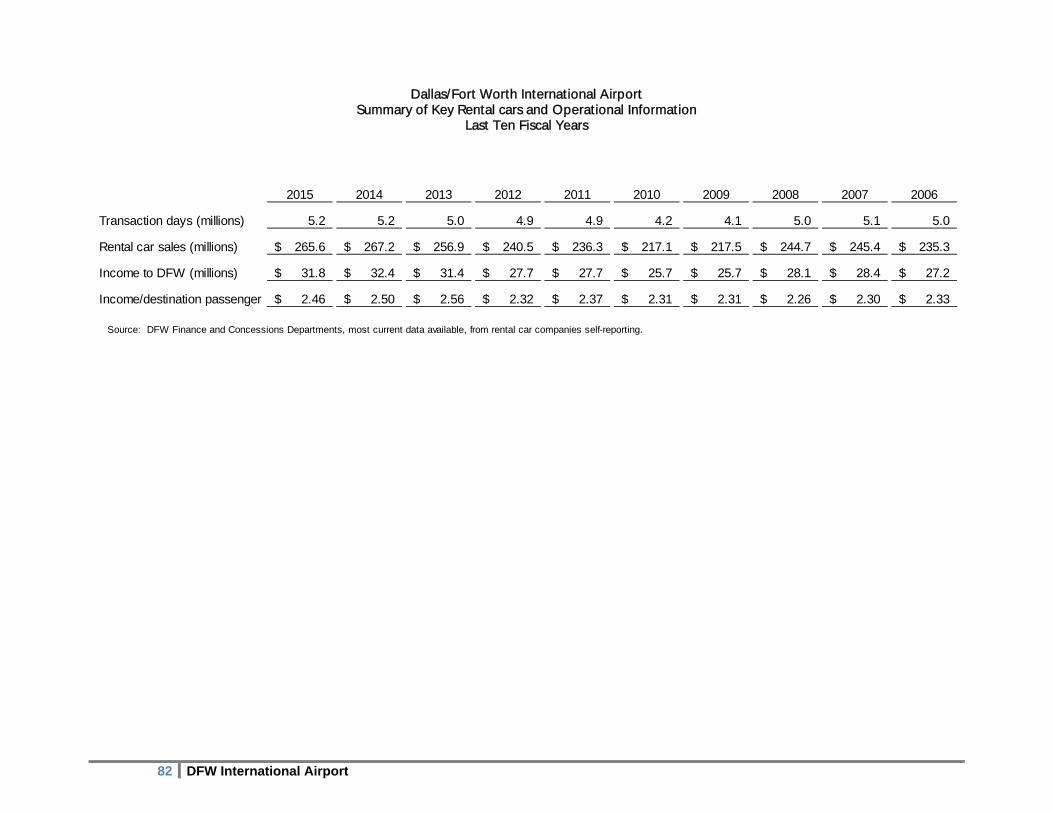
Dallas/Fort Worth International Airport Summary of Key Rental cars and Operational Information
Last Ten Fiscal Years
82 DFW International Airport
2015 2014 2013 2012 2011 2010 2009 2008 2007 2006
Transaction days (millions) 5.2 5.2 5.0 4.9 4.9 4.2 4.1 5.0 5.1 5.0
Rental car sales (millions) 265.6$ 267.2$ 256.9$ 240.5$ 236.3$ 217.1$ 217.5$ 244.7$ 245.4$ 235.3$
Income to DFW (millions) 31.8$ 32.4$ 31.4$ 27.7$ 27.7$ 25.7$ 25.7$ 28.1$ 28.4$ 27.2$
Income/destination passenger 2.46$ 2.50$ 2.56$ 2.32$ 2.37$ 2.31$ 2.31$ 2.26$ 2.30$ 2.33$
Source: DFW Finance and Concessions Departments, most current data available, from rental car companies self-reporting.
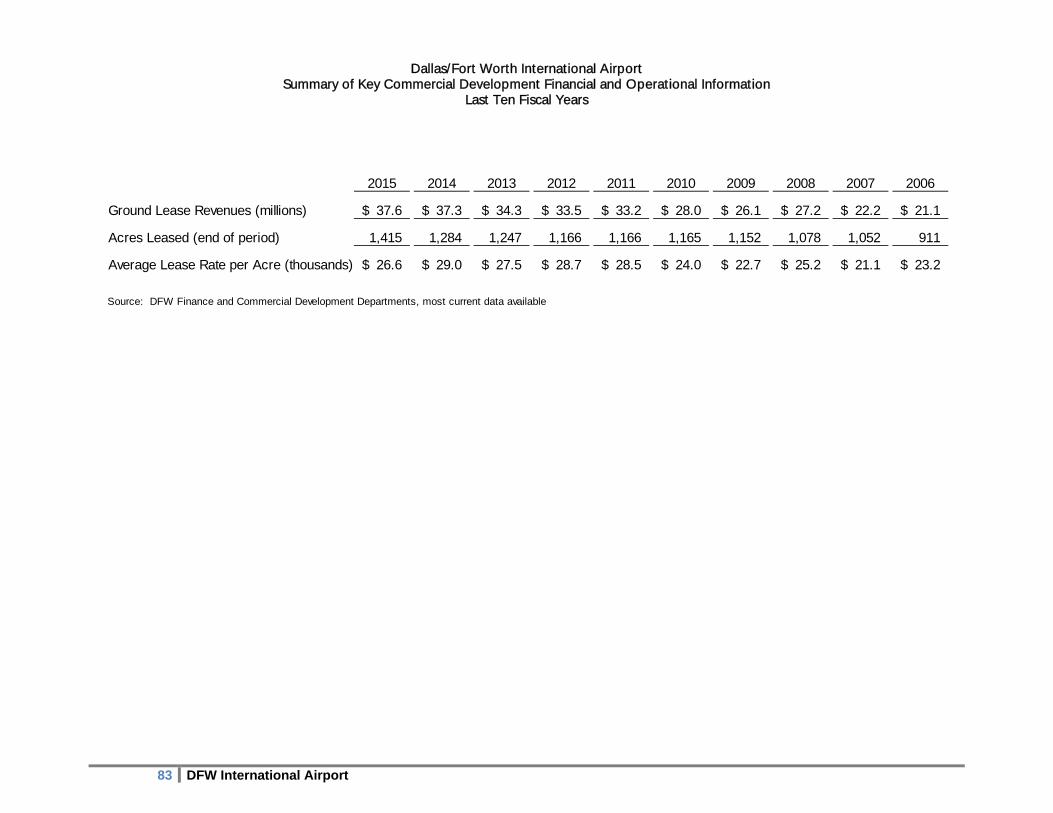
Dallas/Fort Worth International Airport Summary of Key Commercial Development Financial and Operational Information
Last Ten Fiscal Years
83 DFW International Airport
2015 2014 2013 2012 2011 2010 2009 2008 2007 2006
Ground Lease Revenues (millions) 37.6$ 37.3$ 34.3$ 33.5$ 33.2$ 28.0$ 26.1$ 27.2$ 22.2$ 21.1$
Acres Leased (end of period) 1,415 1,284 1,247 1,166 1,166 1,165 1,152 1,078 1,052 911
Average Lease Rate per Acre (thousands) 26.6$ 29.0$ 27.5$ 28.7$ 28.5$ 24.0$ 22.7$ 25.2$ 21.1$ 23.2$
Source: DFW Finance and Commercial Development Departments, most current data available
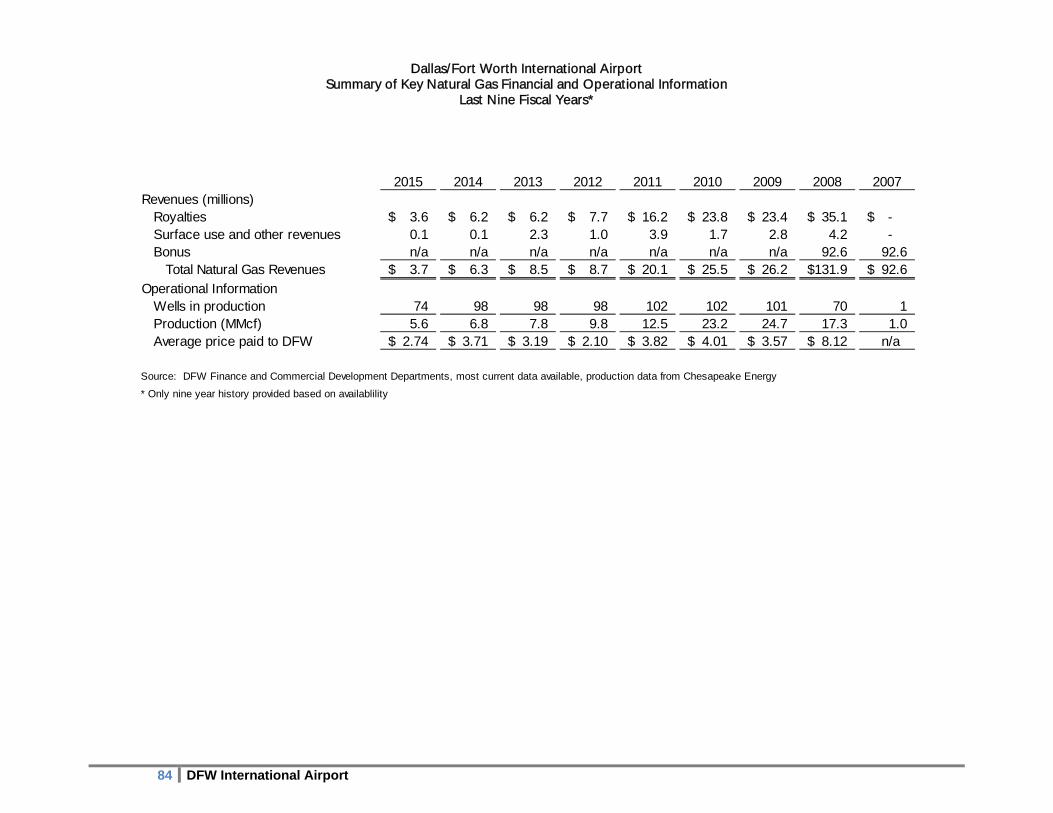
Dallas/Fort Worth International Airport Summary of Key Natural Gas Financial and Operational Information
Last Nine Fiscal Years*
84 DFW International Airport
2015 2014 2013 2012 2011 2010 2009 2008 2007Revenues (millions)
Royalties 3.6$ 6.2$ 6.2$ 7.7$ 16.2$ 23.8$ 23.4$ 35.1$ -$ Surface use and other revenues 0.1 0.1 2.3 1.0 3.9 1.7 2.8 4.2 - Bonus n/a n/a n/a n/a n/a n/a n/a 92.6 92.6
Total Natural Gas Revenues 3.7$ 6.3$ 8.5$ 8.7$ 20.1$ 25.5$ 26.2$ 131.9$ 92.6$
Operational InformationWells in production 74 98 98 98 102 102 101 70 1 Production (MMcf) 5.6 6.8 7.8 9.8 12.5 23.2 24.7 17.3 1.0 Average price paid to DFW 2.74$ 3.71$ 3.19$ 2.10$ 3.82$ 4.01$ 3.57$ 8.12$ n/a
Source: DFW Finance and Commercial Development Departments, most current data available, production data from Chesapeake Energy
* Only nine year history provided based on availablility
DEBT CAPACITY INFORMATION
The following tables are designed to assist the reader in gaining a greater understanding of DFW’s current outstanding debt, debt history and DFW’s ability to issue additional debt in the future.
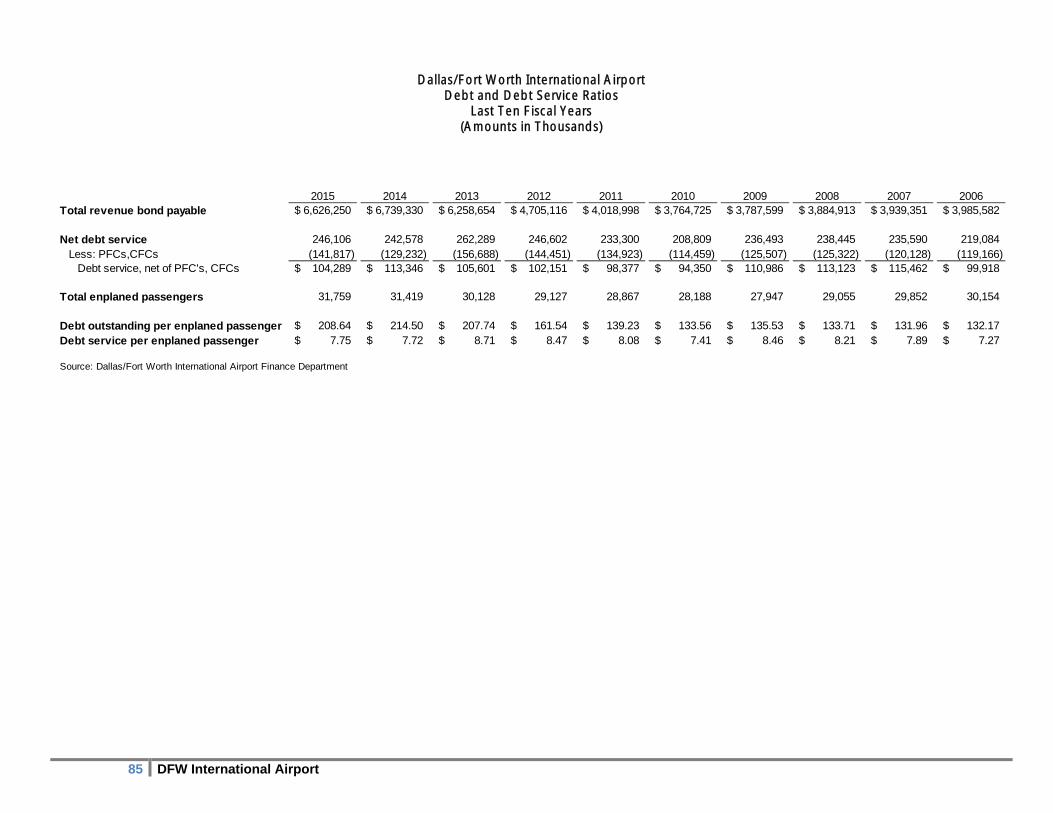
Dallas/Fort Worth International Airport Debt and Debt Service Ratios
Last Ten Fiscal Years (Amounts in Thousands)
85 DFW International Airport
2015 2014 2013 2012 2011 2010 2009 2008 2007 2006Total revenue bond payable 6,626,250$ 6,739,330$ 6,258,654$ 4,705,116$ 4,018,998$ 3,764,725$ 3,787,599$ 3,884,913$ 3,939,351$ 3,985,582$
Net debt service 246,106 242,578 262,289 246,602 233,300 208,809 236,493 238,445 235,590 219,084 Less: PFCs,CFCs (141,817) (129,232) (156,688) (144,451) (134,923) (114,459) (125,507) (125,322) (120,128) (119,166) Debt service, net of PFC's, CFCs 104,289$ 113,346$ 105,601$ 102,151$ 98,377$ 94,350$ 110,986$ 113,123$ 115,462$ 99,918$
Total enplaned passengers 31,759 31,419 30,128 29,127 28,867 28,188 27,947 29,055 29,852 30,154
Debt outstanding per enplaned passenger 208.64$ 214.50$ 207.74$ 161.54$ 139.23$ 133.56$ 135.53$ 133.71$ 131.96$ 132.17$ Debt service per enplaned passenger 7.75$ 7.72$ 8.71$ 8.47$ 8.08$ 7.41$ 8.46$ 8.21$ 7.89$ 7.27$
Source: Dallas/Fort Worth International Airport Finance Department
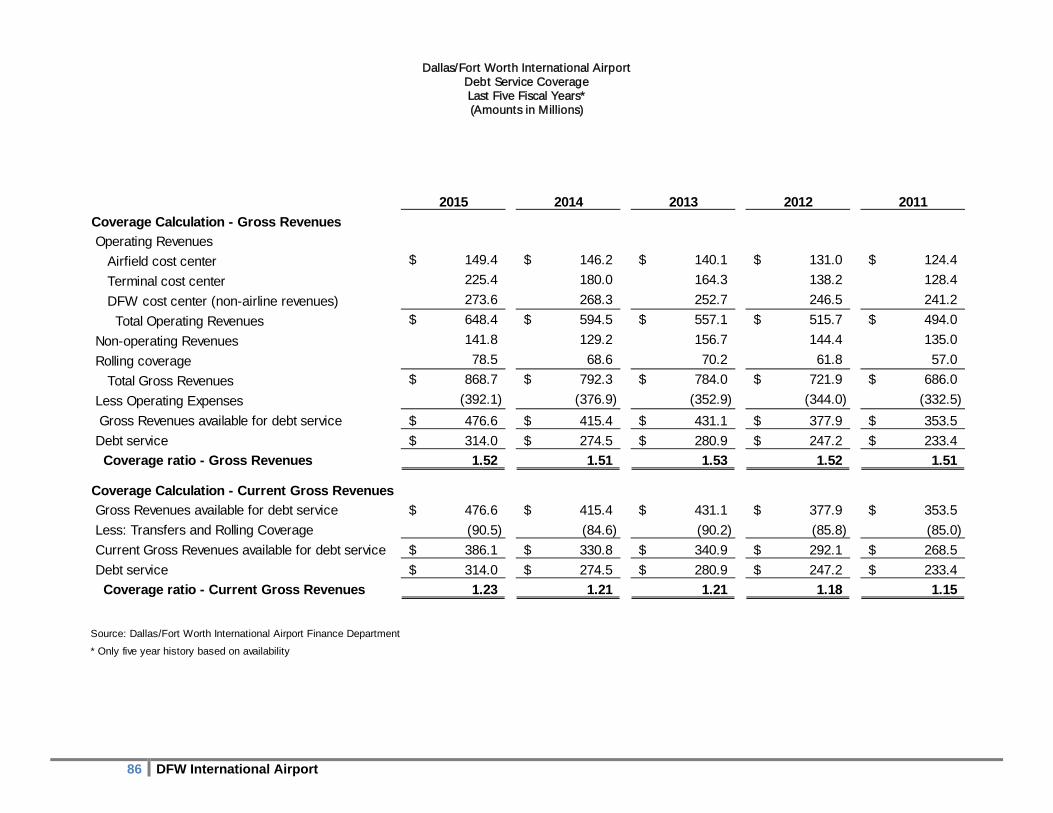
Dallas/Fort Worth International Airport Debt Service Coverage Last Five Fiscal Years* (Amounts in Millions)
86 DFW International Airport
2015 2014 2013 2012 2011
Coverage Calculation - Gross Revenues
Operating Revenues
Airfield cost center 149.4$ 146.2$ 140.1$ 131.0$ 124.4$
Terminal cost center 225.4 180.0 164.3 138.2 128.4
DFW cost center (non-airline revenues) 273.6 268.3 252.7 246.5 241.2
Total Operating Revenues 648.4$ 594.5$ 557.1$ 515.7$ 494.0$
Non-operating Revenues 141.8 129.2 156.7 144.4 135.0
Rolling coverage 78.5 68.6 70.2 61.8 57.0
Total Gross Revenues 868.7$ 792.3$ 784.0$ 721.9$ 686.0$
Less Operating Expenses (392.1) (376.9) (352.9) (344.0) (332.5)
Gross Revenues available for debt service 476.6$ 415.4$ 431.1$ 377.9$ 353.5$
Debt service 314.0$ 274.5$ 280.9$ 247.2$ 233.4$
Coverage ratio - Gross Revenues 1.52 1.51 1.53 1.52 1.51
Coverage Calculation - Current Gross Revenues
Gross Revenues available for debt service 476.6$ 415.4$ 431.1$ 377.9$ 353.5$
Less: Transfers and Rolling Coverage (90.5) (84.6) (90.2) (85.8) (85.0)
Current Gross Revenues available for debt service 386.1$ 330.8$ 340.9$ 292.1$ 268.5$
Debt service 314.0$ 274.5$ 280.9$ 247.2$ 233.4$
Coverage ratio - Current Gross Revenues 1.23 1.21 1.21 1.18 1.15
Source: Dallas/Fort Worth International Airport Finance Department
* Only five year history based on availability
DEMOGRAPHIC & ECONOMIC INFORMATION
The following tables represent demographic and economic information for the purpose of increasing the reader’s understanding of the business environment in which DFW operates.
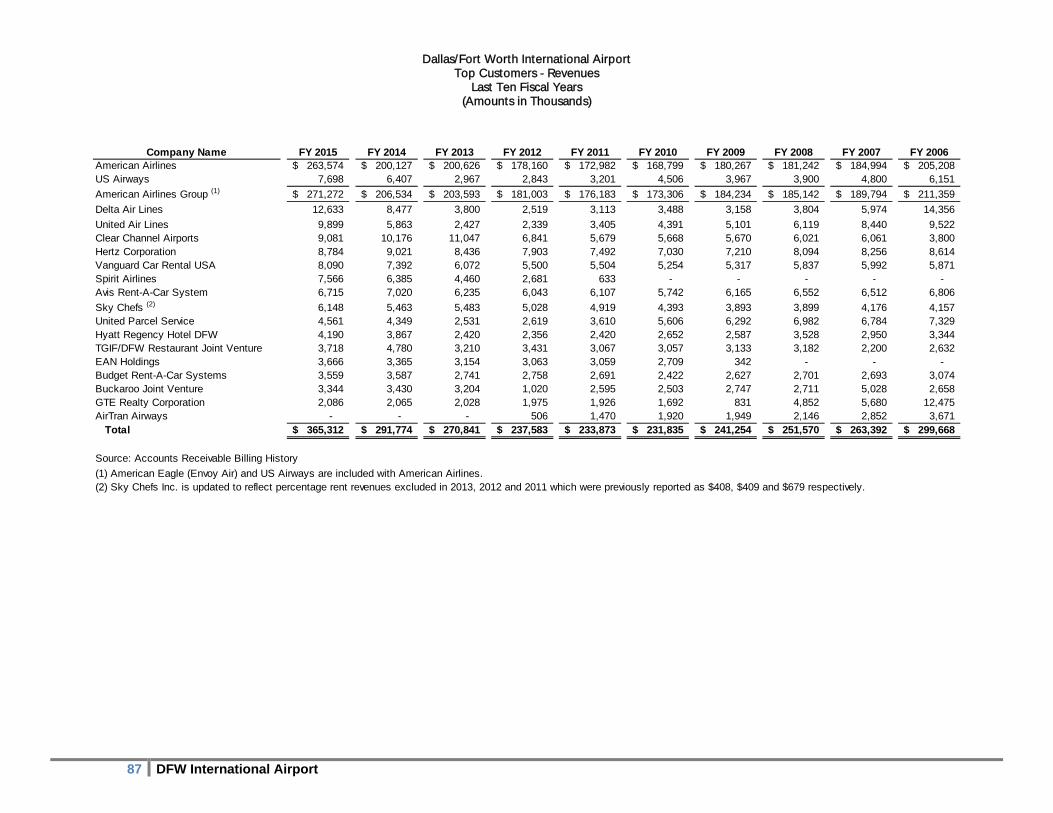
Dallas/Fort Worth International Airport Top Customers - Revenues
Last Ten Fiscal Years (Amounts in Thousands)
87 DFW International Airport
Company Name FY 2015 FY 2014 FY 2013 FY 2012 FY 2011 FY 2010 FY 2009 FY 2008 FY 2007 FY 2006American Airlines 263,574$ 200,127$ 200,626$ 178,160$ 172,982$ 168,799$ 180,267$ 181,242$ 184,994$ 205,208$ US Airways 7,698 6,407 2,967 2,843 3,201 4,506 3,967 3,900 4,800 6,151
American Airlines Group (1) 271,272$ 206,534$ 203,593$ 181,003$ 176,183$ 173,306$ 184,234$ 185,142$ 189,794$ 211,359$
Delta Air Lines 12,633 8,477 3,800 2,519 3,113 3,488 3,158 3,804 5,974 14,356
United Air Lines 9,899 5,863 2,427 2,339 3,405 4,391 5,101 6,119 8,440 9,522Clear Channel Airports 9,081 10,176 11,047 6,841 5,679 5,668 5,670 6,021 6,061 3,800Hertz Corporation 8,784 9,021 8,436 7,903 7,492 7,030 7,210 8,094 8,256 8,614Vanguard Car Rental USA 8,090 7,392 6,072 5,500 5,504 5,254 5,317 5,837 5,992 5,871Spirit Airlines 7,566 6,385 4,460 2,681 633 - - - - - Avis Rent-A-Car System 6,715 7,020 6,235 6,043 6,107 5,742 6,165 6,552 6,512 6,806
Sky Chefs (2) 6,148 5,463 5,483 5,028 4,919 4,393 3,893 3,899 4,176 4,157United Parcel Service 4,561 4,349 2,531 2,619 3,610 5,606 6,292 6,982 6,784 7,329Hyatt Regency Hotel DFW 4,190 3,867 2,420 2,356 2,420 2,652 2,587 3,528 2,950 3,344TGIF/DFW Restaurant Joint Venture 3,718 4,780 3,210 3,431 3,067 3,057 3,133 3,182 2,200 2,632EAN Holdings 3,666 3,365 3,154 3,063 3,059 2,709 342 - - - Budget Rent-A-Car Systems 3,559 3,587 2,741 2,758 2,691 2,422 2,627 2,701 2,693 3,074Buckaroo Joint Venture 3,344 3,430 3,204 1,020 2,595 2,503 2,747 2,711 5,028 2,658GTE Realty Corporation 2,086 2,065 2,028 1,975 1,926 1,692 831 4,852 5,680 12,475AirTran Airways - - - 506 1,470 1,920 1,949 2,146 2,852 3,671 Total 365,312$ 291,774$ 270,841$ 237,583$ 233,873$ 231,835$ 241,254$ 251,570$ 263,392$ 299,668$
Source: Accounts Receivable Billing History
(1) American Eagle (Envoy Air) and US Airways are included with American Airlines.(2) Sky Chefs Inc. is updated to reflect percentage rent revenues excluded in 2013, 2012 and 2011 which were previously reported as $408, $409 and $679 respectively.
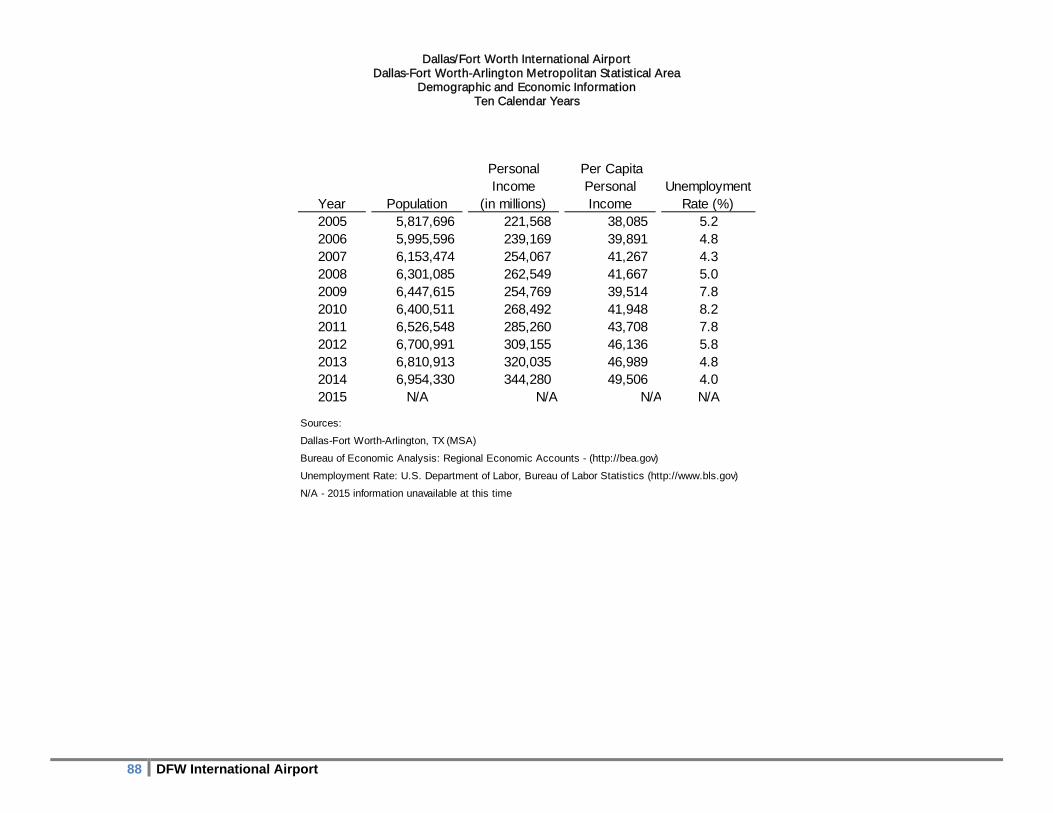
Dallas/Fort Worth International Airport Dallas-Fort Worth-Arlington Metropolitan Statistical Area
Demographic and Economic Information Ten Calendar Years
88 DFW International Airport
Year Population
Personal Income
(in millions)
Per Capita Personal Income
Unemployment Rate (%)
2005 5,817,696 221,568 38,085 5.22006 5,995,596 239,169 39,891 4.82007 6,153,474 254,067 41,267 4.32008 6,301,085 262,549 41,667 5.02009 6,447,615 254,769 39,514 7.82010 6,400,511 268,492 41,948 8.22011 6,526,548 285,260 43,708 7.82012 6,700,991 309,155 46,136 5.82013 6,810,913 320,035 46,989 4.82014 6,954,330 344,280 49,506 4.02015 N/A N/A N/A N/A
Sources:
Dallas-Fort Worth-Arlington, TX (MSA)
Bureau of Economic Analysis: Regional Economic Accounts - (http://bea.gov)
Unemployment Rate: U.S. Department of Labor, Bureau of Labor Statistics (http://www.bls.gov)
N/A - 2015 information unavailable at this time

OPERATING INFORMATION
The following tables are designed to assist the reader in gaining a greater understanding of underlying factors affecting DFW’s ability to generate revenue, highlighting trends in operations, activities and resources.
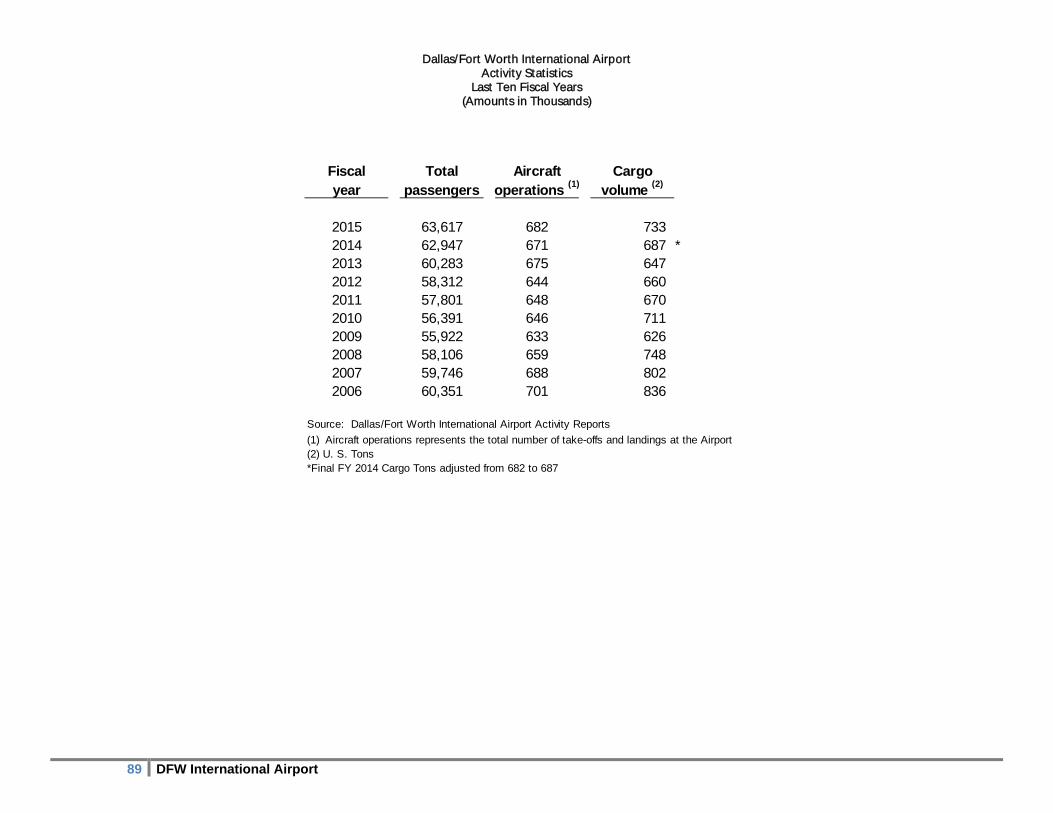
Dallas/Fort Worth International Airport Activity Statistics
Last Ten Fiscal Years (Amounts in Thousands)
89 DFW International Airport
Fiscal Total Aircraft Cargoyear passengers operations
(1)volume
(2)
2015 63,617 682 7332014 62,947 671 687 *2013 60,283 675 6472012 58,312 644 6602011 57,801 648 6702010 56,391 646 7112009 55,922 633 6262008 58,106 659 7482007 59,746 688 8022006 60,351 701 836
Source: Dallas/Fort Worth International Airport Activity Reports
(1) Aircraft operations represents the total number of take-offs and landings at the Airport(2) U. S. Tons*Final FY 2014 Cargo Tons adjusted from 682 to 687
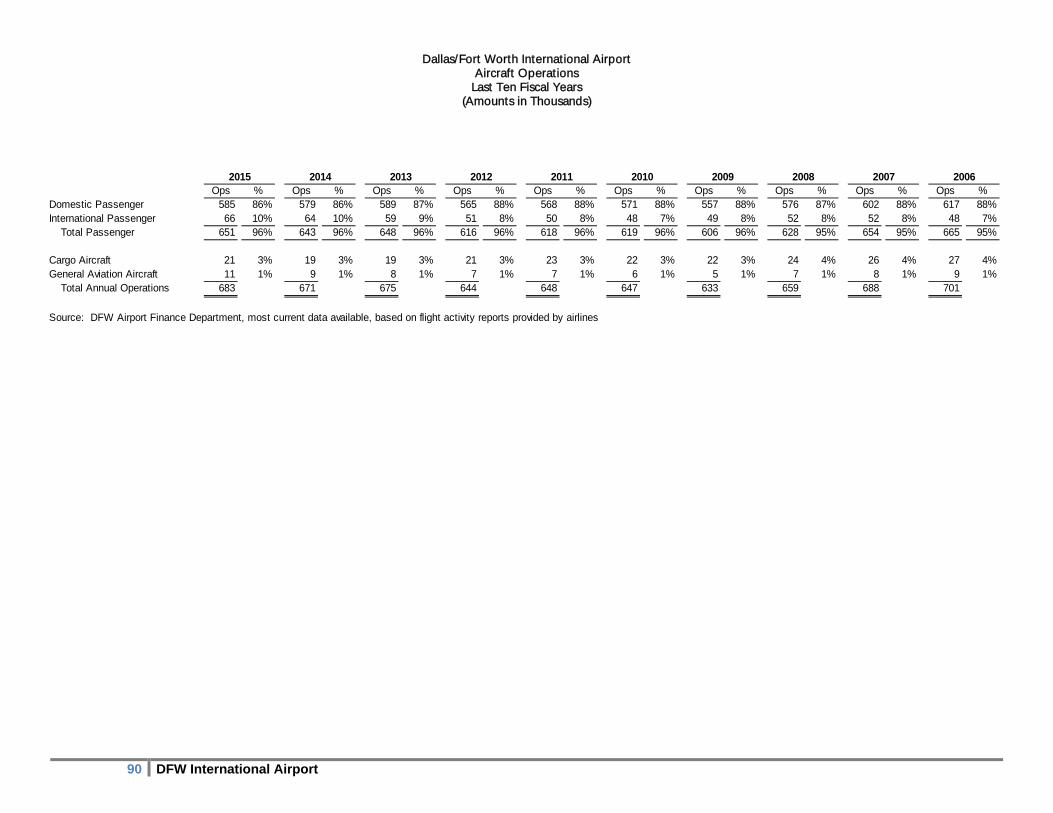
Dallas/Fort Worth International Airport Aircraft Operations
Last Ten Fiscal Years (Amounts in Thousands)
90 DFW International Airport
Ops % Ops % Ops % Ops % Ops % Ops % Ops % Ops % Ops % Ops %Domestic Passenger 585 86% 579 86% 589 87% 565 88% 568 88% 571 88% 557 88% 576 87% 602 88% 617 88%International Passenger 66 10% 64 10% 59 9% 51 8% 50 8% 48 7% 49 8% 52 8% 52 8% 48 7%
Total Passenger 651 96% 643 96% 648 96% 616 96% 618 96% 619 96% 606 96% 628 95% 654 95% 665 95%
Cargo Aircraft 21 3% 19 3% 19 3% 21 3% 23 3% 22 3% 22 3% 24 4% 26 4% 27 4%General Aviation Aircraft 11 1% 9 1% 8 1% 7 1% 7 1% 6 1% 5 1% 7 1% 8 1% 9 1%
Total Annual Operations 683 671 675 644 648 647 633 659 688 701
Source: DFW Airport Finance Department, most current data available, based on flight activity reports provided by airlines
20142015 2011 2010 2009 2008 2007 200620122013
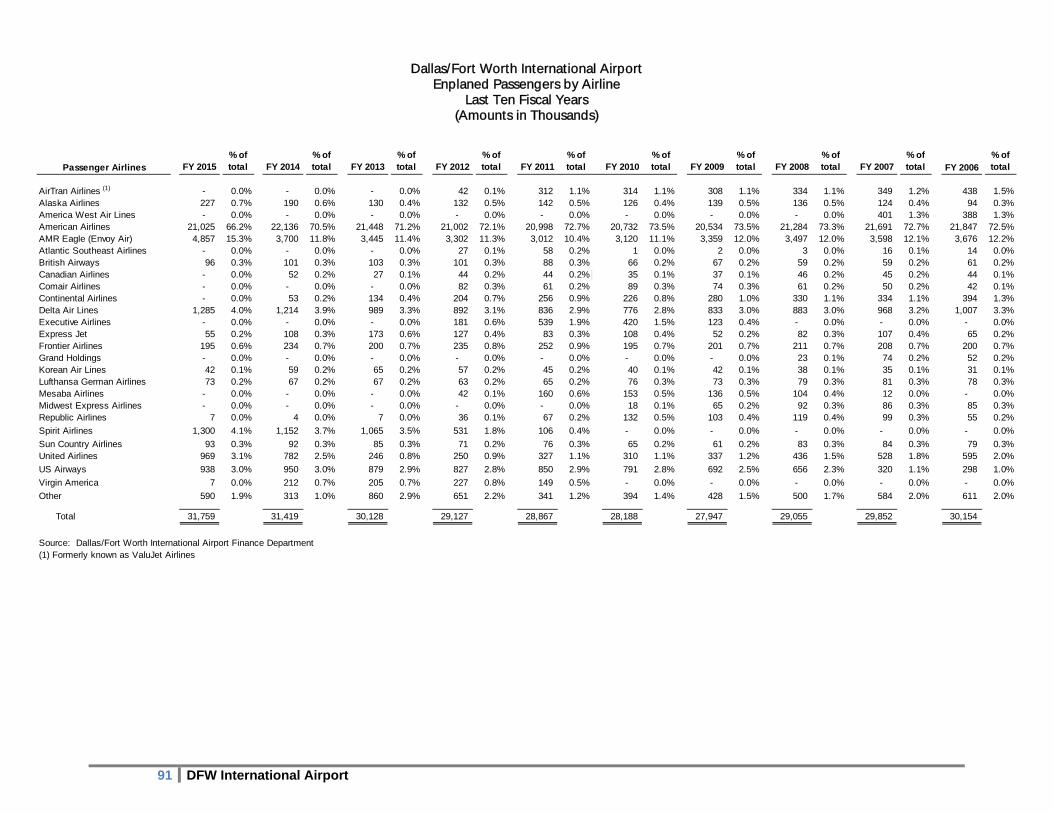
Dallas/Fort Worth International Airport Enplaned Passengers by Airline
Last Ten Fiscal Years (Amounts in Thousands)
91 DFW International Airport
FY 2015% of total FY 2014
% of total FY 2013
% of total FY 2012
% of total FY 2011
% of total FY 2010
% of total FY 2009
% of total FY 2008
% of total FY 2007
% of total FY 2006
% of total
AirTran Airlines (1) - 0.0% - 0.0% - 0.0% 42 0.1% 312 1.1% 314 1.1% 308 1.1% 334 1.1% 349 1.2% 438 1.5%Alaska Airlines 227 0.7% 190 0.6% 130 0.4% 132 0.5% 142 0.5% 126 0.4% 139 0.5% 136 0.5% 124 0.4% 94 0.3%America West Air Lines - 0.0% - 0.0% - 0.0% - 0.0% - 0.0% - 0.0% - 0.0% - 0.0% 401 1.3% 388 1.3%American Airlines 21,025 66.2% 22,136 70.5% 21,448 71.2% 21,002 72.1% 20,998 72.7% 20,732 73.5% 20,534 73.5% 21,284 73.3% 21,691 72.7% 21,847 72.5%AMR Eagle (Envoy Air) 4,857 15.3% 3,700 11.8% 3,445 11.4% 3,302 11.3% 3,012 10.4% 3,120 11.1% 3,359 12.0% 3,497 12.0% 3,598 12.1% 3,676 12.2%Atlantic Southeast Airlines - 0.0% - 0.0% - 0.0% 27 0.1% 58 0.2% 1 0.0% 2 0.0% 3 0.0% 16 0.1% 14 0.0%British Airways 96 0.3% 101 0.3% 103 0.3% 101 0.3% 88 0.3% 66 0.2% 67 0.2% 59 0.2% 59 0.2% 61 0.2%Canadian Airlines - 0.0% 52 0.2% 27 0.1% 44 0.2% 44 0.2% 35 0.1% 37 0.1% 46 0.2% 45 0.2% 44 0.1%Comair Airlines - 0.0% - 0.0% - 0.0% 82 0.3% 61 0.2% 89 0.3% 74 0.3% 61 0.2% 50 0.2% 42 0.1%Continental Airlines - 0.0% 53 0.2% 134 0.4% 204 0.7% 256 0.9% 226 0.8% 280 1.0% 330 1.1% 334 1.1% 394 1.3%Delta Air Lines 1,285 4.0% 1,214 3.9% 989 3.3% 892 3.1% 836 2.9% 776 2.8% 833 3.0% 883 3.0% 968 3.2% 1,007 3.3%Executive Airlines - 0.0% - 0.0% - 0.0% 181 0.6% 539 1.9% 420 1.5% 123 0.4% - 0.0% - 0.0% - 0.0%Express Jet 55 0.2% 108 0.3% 173 0.6% 127 0.4% 83 0.3% 108 0.4% 52 0.2% 82 0.3% 107 0.4% 65 0.2%Frontier Airlines 195 0.6% 234 0.7% 200 0.7% 235 0.8% 252 0.9% 195 0.7% 201 0.7% 211 0.7% 208 0.7% 200 0.7%Grand Holdings - 0.0% - 0.0% - 0.0% - 0.0% - 0.0% - 0.0% - 0.0% 23 0.1% 74 0.2% 52 0.2%Korean Air Lines 42 0.1% 59 0.2% 65 0.2% 57 0.2% 45 0.2% 40 0.1% 42 0.1% 38 0.1% 35 0.1% 31 0.1%Lufthansa German Airlines 73 0.2% 67 0.2% 67 0.2% 63 0.2% 65 0.2% 76 0.3% 73 0.3% 79 0.3% 81 0.3% 78 0.3%Mesaba Airlines - 0.0% - 0.0% - 0.0% 42 0.1% 160 0.6% 153 0.5% 136 0.5% 104 0.4% 12 0.0% - 0.0%Midwest Express Airlines - 0.0% - 0.0% - 0.0% - 0.0% - 0.0% 18 0.1% 65 0.2% 92 0.3% 86 0.3% 85 0.3%Republic Airlines 7 0.0% 4 0.0% 7 0.0% 36 0.1% 67 0.2% 132 0.5% 103 0.4% 119 0.4% 99 0.3% 55 0.2%
Spirit Airlines 1,300 4.1% 1,152 3.7% 1,065 3.5% 531 1.8% 106 0.4% - 0.0% - 0.0% - 0.0% - 0.0% - 0.0%
Sun Country Airlines 93 0.3% 92 0.3% 85 0.3% 71 0.2% 76 0.3% 65 0.2% 61 0.2% 83 0.3% 84 0.3% 79 0.3%United Airlines 969 3.1% 782 2.5% 246 0.8% 250 0.9% 327 1.1% 310 1.1% 337 1.2% 436 1.5% 528 1.8% 595 2.0%
US Airways 938 3.0% 950 3.0% 879 2.9% 827 2.8% 850 2.9% 791 2.8% 692 2.5% 656 2.3% 320 1.1% 298 1.0%
Virgin America 7 0.0% 212 0.7% 205 0.7% 227 0.8% 149 0.5% - 0.0% - 0.0% - 0.0% - 0.0% - 0.0%
Other 590 1.9% 313 1.0% 860 2.9% 651 2.2% 341 1.2% 394 1.4% 428 1.5% 500 1.7% 584 2.0% 611 2.0%
Total 31,759 31,419 30,128 29,127 28,867 28,188 27,947 29,055 29,852 30,154
Source: Dallas/Fort Worth International Airport Finance Department(1) Formerly known as ValuJet Airlines
Passenger Airlines
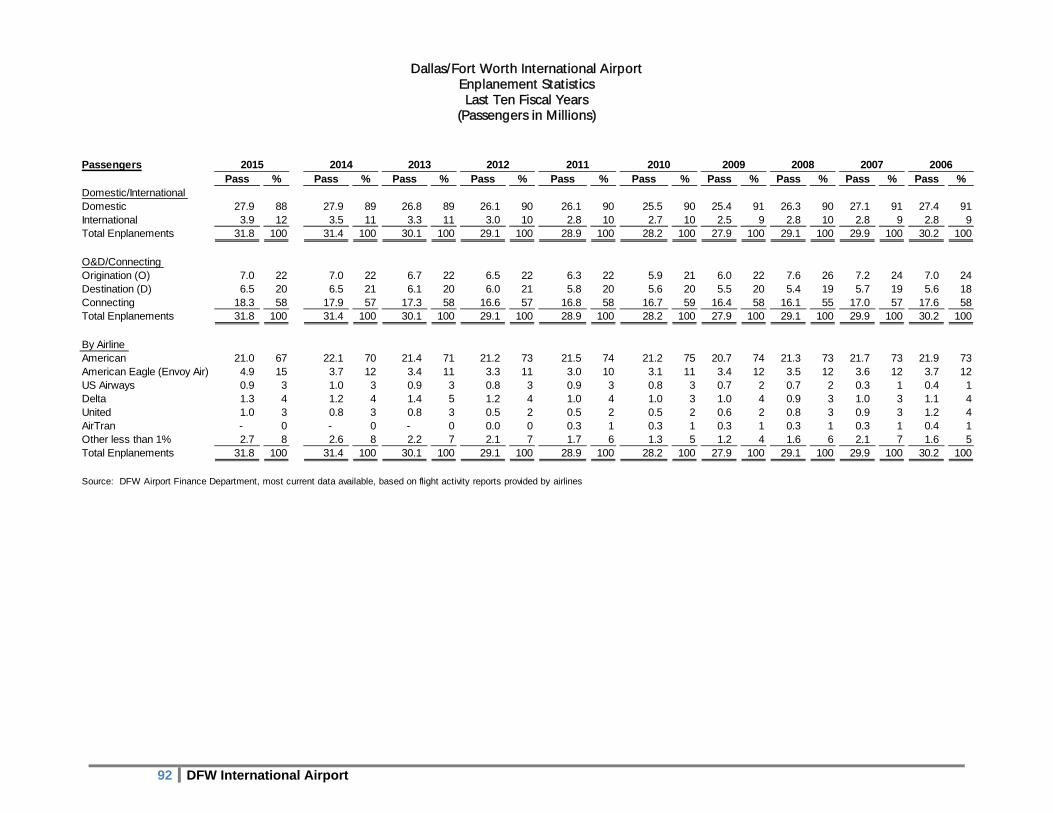
Dallas/Fort Worth International Airport Enplanement Statistics Last Ten Fiscal Years
(Passengers in Millions)
92 DFW International Airport
PassengersPass % Pass % Pass % Pass % Pass % Pass % Pass % Pass % Pass % Pass %
Domestic/International Domestic 27.9 88 27.9 89 26.8 89 26.1 90 26.1 90 25.5 90 25.4 91 26.3 90 27.1 91 27.4 91International 3.9 12 3.5 11 3.3 11 3.0 10 2.8 10 2.7 10 2.5 9 2.8 10 2.8 9 2.8 9Total Enplanements 31.8 100 31.4 100 30.1 100 29.1 100 28.9 100 28.2 100 27.9 100 29.1 100 29.9 100 30.2 100
O&D/Connecting Origination (O) 7.0 22 7.0 22 6.7 22 6.5 22 6.3 22 5.9 21 6.0 22 7.6 26 7.2 24 7.0 24Destination (D) 6.5 20 6.5 21 6.1 20 6.0 21 5.8 20 5.6 20 5.5 20 5.4 19 5.7 19 5.6 18Connecting 18.3 58 17.9 57 17.3 58 16.6 57 16.8 58 16.7 59 16.4 58 16.1 55 17.0 57 17.6 58Total Enplanements 31.8 100 31.4 100 30.1 100 29.1 100 28.9 100 28.2 100 27.9 100 29.1 100 29.9 100 30.2 100
By AirlineAmerican 21.0 67 22.1 70 21.4 71 21.2 73 21.5 74 21.2 75 20.7 74 21.3 73 21.7 73 21.9 73American Eagle (Envoy Air) 4.9 15 3.7 12 3.4 11 3.3 11 3.0 10 3.1 11 3.4 12 3.5 12 3.6 12 3.7 12US Airways 0.9 3 1.0 3 0.9 3 0.8 3 0.9 3 0.8 3 0.7 2 0.7 2 0.3 1 0.4 1Delta 1.3 4 1.2 4 1.4 5 1.2 4 1.0 4 1.0 3 1.0 4 0.9 3 1.0 3 1.1 4United 1.0 3 0.8 3 0.8 3 0.5 2 0.5 2 0.5 2 0.6 2 0.8 3 0.9 3 1.2 4AirTran - 0 - 0 - 0 0.0 0 0.3 1 0.3 1 0.3 1 0.3 1 0.3 1 0.4 1Other less than 1% 2.7 8 2.6 8 2.2 7 2.1 7 1.7 6 1.3 5 1.2 4 1.6 6 2.1 7 1.6 5Total Enplanements 31.8 100 31.4 100 30.1 100 29.1 100 28.9 100 28.2 100 27.9 100 29.1 100 29.9 100 30.2 100
Source: DFW Airport Finance Department, most current data available, based on flight activity reports provided by airlines
2015 20062011 20102012 2009 2008 200720132014
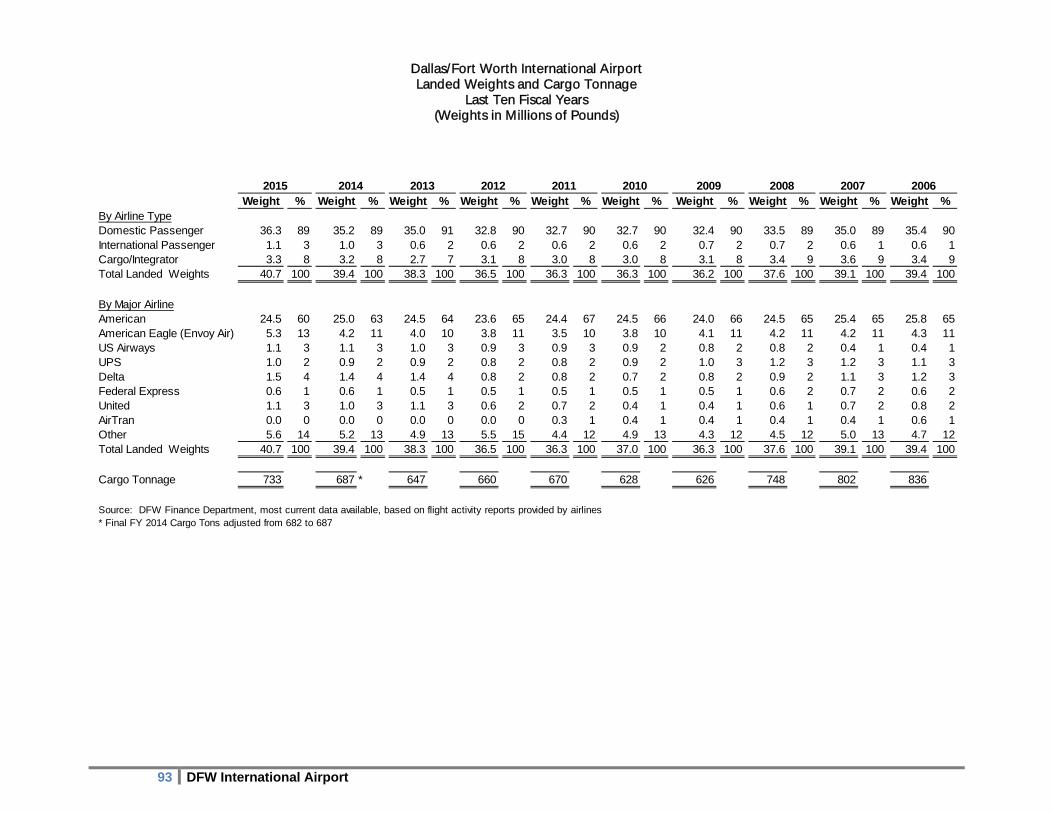
Dallas/Fort Worth International Airport Landed Weights and Cargo Tonnage
Last Ten Fiscal Years (Weights in Millions of Pounds)
93 DFW International Airport
Weight % Weight % Weight % Weight % Weight % Weight % Weight % Weight % Weight % Weight %By Airline TypeDomestic Passenger 36.3 89 35.2 89 35.0 91 32.8 90 32.7 90 32.7 90 32.4 90 33.5 89 35.0 89 35.4 90International Passenger 1.1 3 1.0 3 0.6 2 0.6 2 0.6 2 0.6 2 0.7 2 0.7 2 0.6 1 0.6 1Cargo/Integrator 3.3 8 3.2 8 2.7 7 3.1 8 3.0 8 3.0 8 3.1 8 3.4 9 3.6 9 3.4 9Total Landed Weights 40.7 100 39.4 100 38.3 100 36.5 100 36.3 100 36.3 100 36.2 100 37.6 100 39.1 100 39.4 100
By Major AirlineAmerican 24.5 60 25.0 63 24.5 64 23.6 65 24.4 67 24.5 66 24.0 66 24.5 65 25.4 65 25.8 65American Eagle (Envoy Air) 5.3 13 4.2 11 4.0 10 3.8 11 3.5 10 3.8 10 4.1 11 4.2 11 4.2 11 4.3 11US Airways 1.1 3 1.1 3 1.0 3 0.9 3 0.9 3 0.9 2 0.8 2 0.8 2 0.4 1 0.4 1UPS 1.0 2 0.9 2 0.9 2 0.8 2 0.8 2 0.9 2 1.0 3 1.2 3 1.2 3 1.1 3Delta 1.5 4 1.4 4 1.4 4 0.8 2 0.8 2 0.7 2 0.8 2 0.9 2 1.1 3 1.2 3Federal Express 0.6 1 0.6 1 0.5 1 0.5 1 0.5 1 0.5 1 0.5 1 0.6 2 0.7 2 0.6 2United 1.1 3 1.0 3 1.1 3 0.6 2 0.7 2 0.4 1 0.4 1 0.6 1 0.7 2 0.8 2AirTran 0.0 0 0.0 0 0.0 0 0.0 0 0.3 1 0.4 1 0.4 1 0.4 1 0.4 1 0.6 1Other 5.6 14 5.2 13 4.9 13 5.5 15 4.4 12 4.9 13 4.3 12 4.5 12 5.0 13 4.7 12Total Landed Weights 40.7 100 39.4 100 38.3 100 36.5 100 36.3 100 37.0 100 36.3 100 37.6 100 39.1 100 39.4 100
Cargo Tonnage 733 687 * 647 660 670 628 626 748 802 836
Source: DFW Finance Department, most current data available, based on flight activity reports provided by airlines* Final FY 2014 Cargo Tons adjusted from 682 to 687
2015 2012 2010 20092011 2008 2007 200620132014
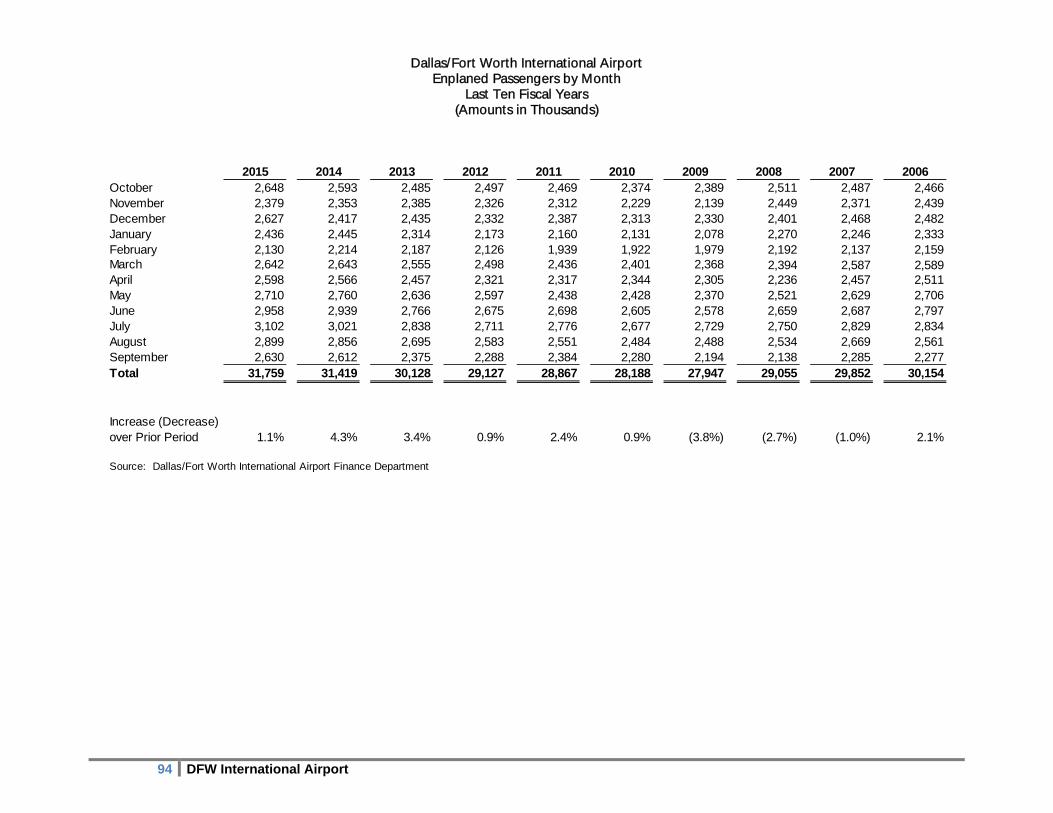
Dallas/Fort Worth International Airport Enplaned Passengers by Month
Last Ten Fiscal Years (Amounts in Thousands)
94 DFW International Airport
2015 2014 2013 2012 2011 2010 2009 2008 2007 2006October 2,648 2,593 2,485 2,497 2,469 2,374 2,389 2,511 2,487 2,466November 2,379 2,353 2,385 2,326 2,312 2,229 2,139 2,449 2,371 2,439December 2,627 2,417 2,435 2,332 2,387 2,313 2,330 2,401 2,468 2,482January 2,436 2,445 2,314 2,173 2,160 2,131 2,078 2,270 2,246 2,333February 2,130 2,214 2,187 2,126 1,939 1,922 1,979 2,192 2,137 2,159March 2,642 2,643 2,555 2,498 2,436 2,401 2,368 2,394 2,587 2,589April 2,598 2,566 2,457 2,321 2,317 2,344 2,305 2,236 2,457 2,511May 2,710 2,760 2,636 2,597 2,438 2,428 2,370 2,521 2,629 2,706June 2,958 2,939 2,766 2,675 2,698 2,605 2,578 2,659 2,687 2,797July 3,102 3,021 2,838 2,711 2,776 2,677 2,729 2,750 2,829 2,834August 2,899 2,856 2,695 2,583 2,551 2,484 2,488 2,534 2,669 2,561September 2,630 2,612 2,375 2,288 2,384 2,280 2,194 2,138 2,285 2,277Total 31,759 31,419 30,128 29,127 28,867 28,188 27,947 29,055 29,852 30,154
Increase (Decrease) over Prior Period 1.1% 4.3% 3.4% 0.9% 2.4% 0.9% (3.8%) (2.7%) (1.0%) 2.1%
Source: Dallas/Fort Worth International Airport Finance Department
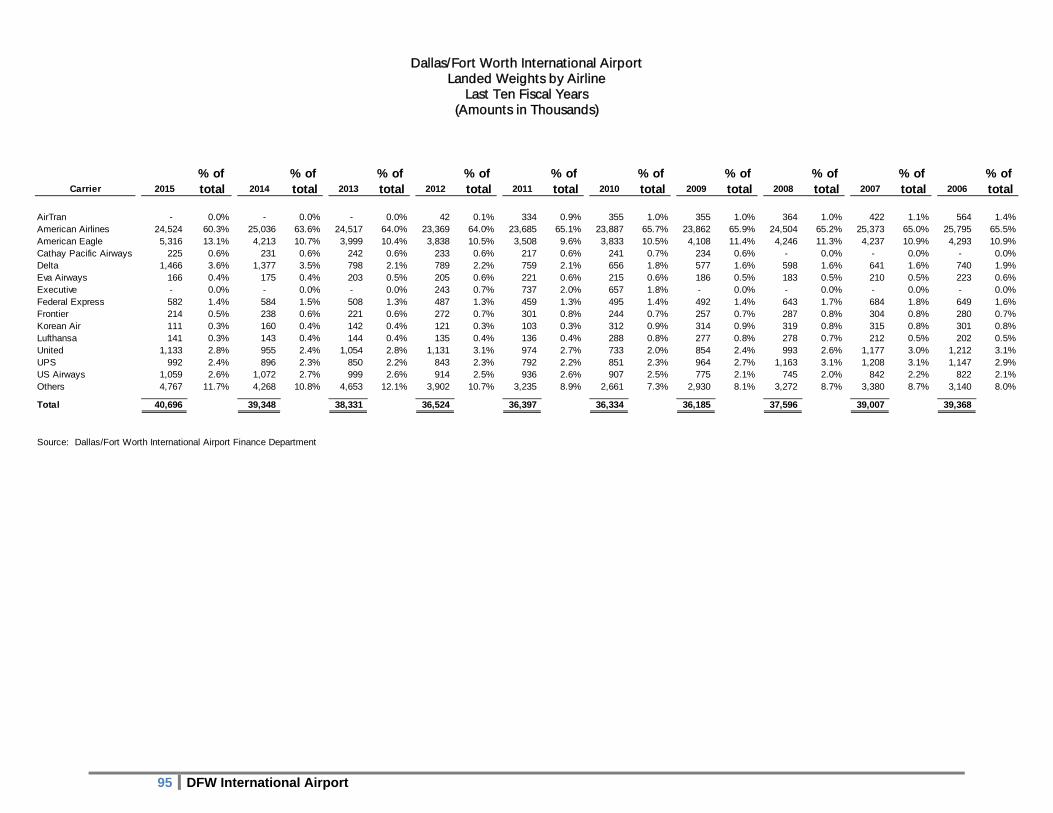
Dallas/Fort Worth International Airport Landed Weights by Airline
Last Ten Fiscal Years (Amounts in Thousands)
95 DFW International Airport
% of % of % of % of % of % of % of % of % of % of Carrier 2015 total 2014 total 2013 total 2012 total 2011 total 2010 total 2009 total 2008 total 2007 total 2006 total
AirTran - 0.0% - 0.0% - 0.0% 42 0.1% 334 0.9% 355 1.0% 355 1.0% 364 1.0% 422 1.1% 564 1.4%American Airlines 24,524 60.3% 25,036 63.6% 24,517 64.0% 23,369 64.0% 23,685 65.1% 23,887 65.7% 23,862 65.9% 24,504 65.2% 25,373 65.0% 25,795 65.5%American Eagle 5,316 13.1% 4,213 10.7% 3,999 10.4% 3,838 10.5% 3,508 9.6% 3,833 10.5% 4,108 11.4% 4,246 11.3% 4,237 10.9% 4,293 10.9%Cathay Pacific Airways 225 0.6% 231 0.6% 242 0.6% 233 0.6% 217 0.6% 241 0.7% 234 0.6% - 0.0% - 0.0% - 0.0%Delta 1,466 3.6% 1,377 3.5% 798 2.1% 789 2.2% 759 2.1% 656 1.8% 577 1.6% 598 1.6% 641 1.6% 740 1.9%Eva Airways 166 0.4% 175 0.4% 203 0.5% 205 0.6% 221 0.6% 215 0.6% 186 0.5% 183 0.5% 210 0.5% 223 0.6%Executive - 0.0% - 0.0% - 0.0% 243 0.7% 737 2.0% 657 1.8% - 0.0% - 0.0% - 0.0% - 0.0%Federal Express 582 1.4% 584 1.5% 508 1.3% 487 1.3% 459 1.3% 495 1.4% 492 1.4% 643 1.7% 684 1.8% 649 1.6%Frontier 214 0.5% 238 0.6% 221 0.6% 272 0.7% 301 0.8% 244 0.7% 257 0.7% 287 0.8% 304 0.8% 280 0.7%Korean Air 111 0.3% 160 0.4% 142 0.4% 121 0.3% 103 0.3% 312 0.9% 314 0.9% 319 0.8% 315 0.8% 301 0.8%Lufthansa 141 0.3% 143 0.4% 144 0.4% 135 0.4% 136 0.4% 288 0.8% 277 0.8% 278 0.7% 212 0.5% 202 0.5%United 1,133 2.8% 955 2.4% 1,054 2.8% 1,131 3.1% 974 2.7% 733 2.0% 854 2.4% 993 2.6% 1,177 3.0% 1,212 3.1%UPS 992 2.4% 896 2.3% 850 2.2% 843 2.3% 792 2.2% 851 2.3% 964 2.7% 1,163 3.1% 1,208 3.1% 1,147 2.9%US Airways 1,059 2.6% 1,072 2.7% 999 2.6% 914 2.5% 936 2.6% 907 2.5% 775 2.1% 745 2.0% 842 2.2% 822 2.1%Others 4,767 11.7% 4,268 10.8% 4,653 12.1% 3,902 10.7% 3,235 8.9% 2,661 7.3% 2,930 8.1% 3,272 8.7% 3,380 8.7% 3,140 8.0%
Total 40,696 39,348 38,331 36,524 36,397 36,334 36,185 37,596 39,007 39,368
Source: Dallas/Fort Worth International Airport Finance Department
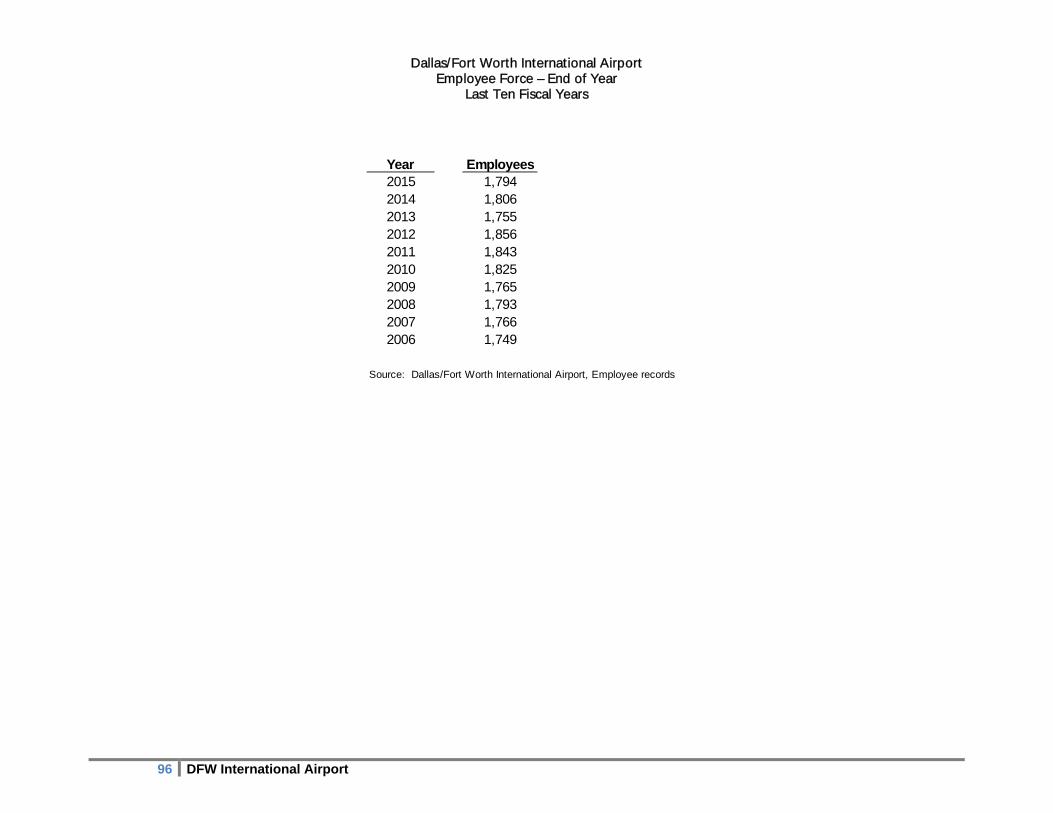
Dallas/Fort Worth International Airport Employee Force – End of Year
Last Ten Fiscal Years
96 DFW International Airport
Year Employees2015 1,7942014 1,8062013 1,7552012 1,8562011 1,8432010 1,8252009 1,7652008 1,7932007 1,7662006 1,749
Source: Dallas/Fort Worth International Airport, Employee records
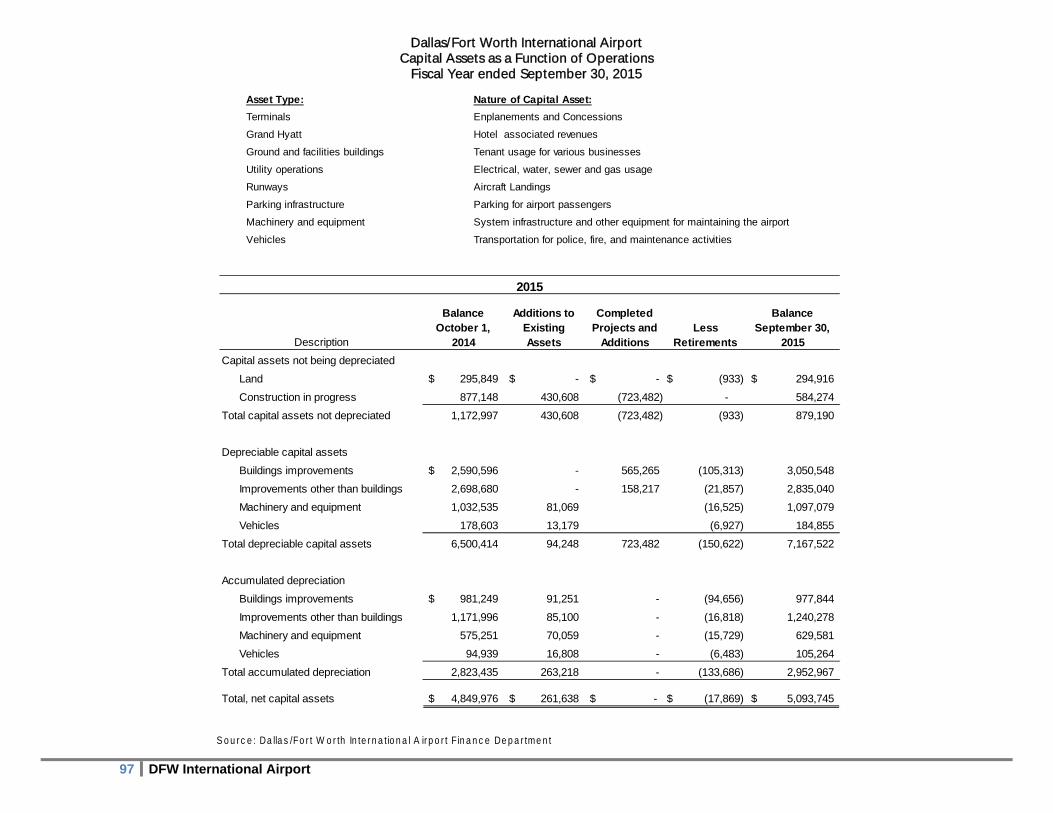
Dallas/Fort Worth International Airport
Capital Assets as a Function of Operations Fiscal Year ended September 30, 2015
97 DFW International Airport
Balance October 1, Less
Balance September 30,
2014 Retirements 2015
Capital assets not being depreciated
Land 295,849$ -$ -$ (933)$ 294,916$
Construction in progress 877,148 430,608 (723,482) - 584,274
Total capital assets not depreciated 1,172,997 430,608 (723,482) (933) 879,190
Depreciable capital assets
Buildings improvements 2,590,596$ - 565,265 (105,313) 3,050,548
Improvements other than buildings 2,698,680 - 158,217 (21,857) 2,835,040
Machinery and equipment 1,032,535 81,069 (16,525) 1,097,079
Vehicles 178,603 13,179 (6,927) 184,855
Total depreciable capital assets 6,500,414 94,248 723,482 (150,622) 7,167,522
Accumulated depreciation
Buildings improvements 981,249$ 91,251 - (94,656) 977,844
Improvements other than buildings 1,171,996 85,100 - (16,818) 1,240,278
Machinery and equipment 575,251 70,059 - (15,729) 629,581
Vehicles 94,939 16,808 - (6,483) 105,264
Total accumulated depreciation 2,823,435 263,218 - (133,686) 2,952,967
Total, net capital assets 4,849,976$ 261,638$ -$ (17,869)$ 5,093,745$
2015
Additions to Existing Assets
Completed Projects and
AdditionsDescription
Asset Type: Nature of Capital Asset:
Terminals Enplanements and Concessions
Grand Hyatt Hotel associated revenues
Ground and facilities buildings Tenant usage for various businesses
Utility operations Electrical, water, sewer and gas usage
Runways Aircraft Landings
Parking infrastructure Parking for airport passengers
Machinery and equipment System infrastructure and other equipment for maintaining the airport
Vehicles Transportation for police, fire, and maintenance activities
S o u r c e : Da lla s /Fo r t W o r th In te r n a tio n a l A ir p o r t F in a n c e De p a r tme n t
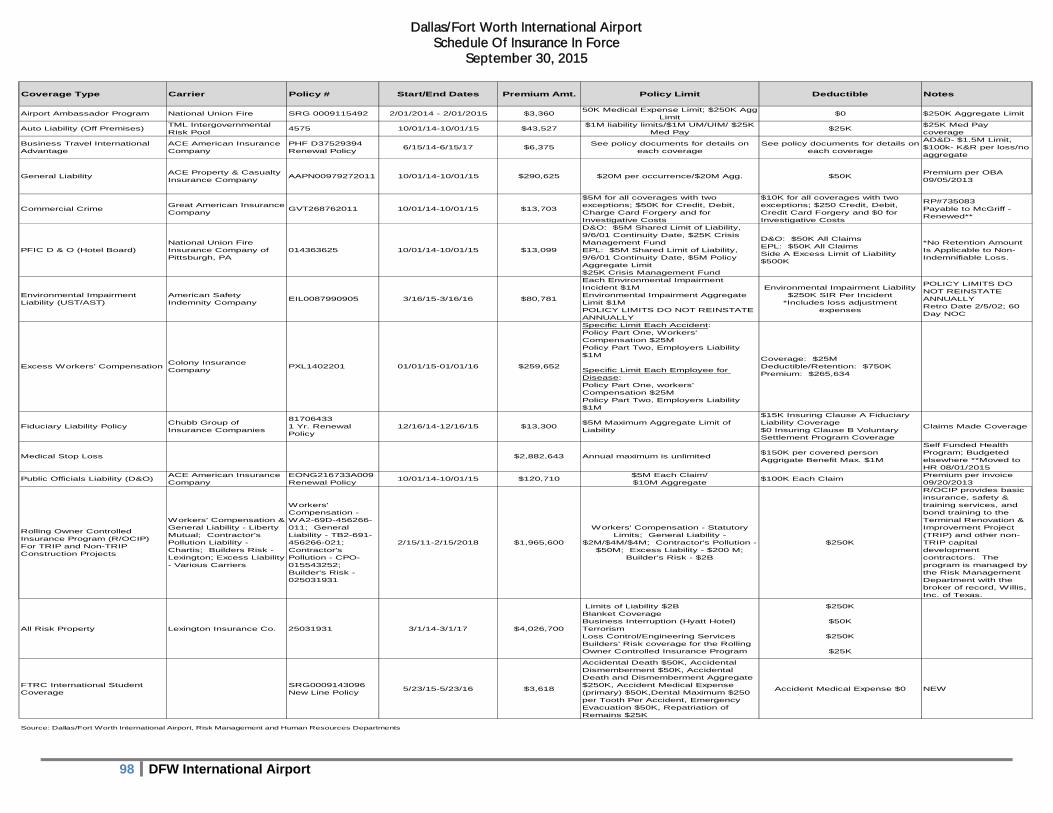
Dallas/Fort Worth International Airport Schedule Of Insurance In Force
September 30, 2015
98 DFW International Airport
Coverage Type Carrier Policy # Start/End Dates Premium Amt. Policy Limit Deductible Notes
Airport Ambassador Program National Union Fire SRG 0009115492 2/01/2014 - 2/01/2015 $3,36050K Medical Expense Limit; $250K Agg
Limit$0 $250K Aggregate Limit
Auto Liability (Off Premises)TML Intergovernmental Risk Pool
4575 10/01/14-10/01/15 $43,527$1M liability limits/$1M UM/UIM/ $25K
Med Pay$25K
$25K Med Pay coverage
Business Travel International Advantage
ACE American Insurance Company
PHF D37529394Renewal Policy
6/15/14-6/15/17 $6,375See policy documents for details on
each coverageSee policy documents for details on
each coverage
AD&D- $1.5M Limit, $100k- K&R per loss/no aggregate
General LiabilityACE Property & Casualty Insurance Company
AAPN00979272011 10/01/14-10/01/15 $290,625 $20M per occurrence/$20M Agg. $50KPremium per OBA 09/05/2013
Commercial CrimeGreat American Insurance Company
GVT268762011 10/01/14-10/01/15 $13,703
$5M for all coverages with two exceptions; $50K for Credit, Debit, Charge Card Forgery and for Investigative Costs
$10K for all coverages with two exceptions; $250 Credit, Debit, Credit Card Forgery and $0 for Investigative Costs
RP#735083Payable to McGriff - Renewed**
PFIC D & O (Hotel Board)National Union Fire Insurance Company of Pittsburgh, PA
014363625 10/01/14-10/01/15 $13,099
D&O: $5M Shared Limit of Liability, 9/6/01 Continuity Date, $25K Crisis Management FundEPL: $5M Shared Limit of Liability, 9/6/01 Continuity Date, $5M Policy Aggregate Limit$25K Crisis Management Fund
D&O: $50K All ClaimsEPL: $50K All ClaimsSide A Excess Limit of Liability $500K
*No Retention Amount Is Applicable to Non-Indemnifiable Loss.
Environmental Impairment Liability (UST/AST)
American Safety Indemnity Company
EIL0087990905 3/16/15-3/16/16 $80,781
Each Environmental Impairment Incident $1MEnvironmental Impairment Aggregate Limit $1MPOLICY LIMITS DO NOT REINSTATE ANNUALLY
Environmental Impairment Liability $250K SIR Per Incident
*Includes loss adjustment expenses
POLICY LIMITS DO NOT REINSTATE ANNUALLYRetro Date 2/5/02; 60 Day NOC
Excess Workers' Compensation Colony Insurance Company
PXL1402201 01/01/15-01/01/16 $259,652
Specific Limit Each Accident:Policy Part One, Workers' Compensation $25MPolicy Part Two, Employers Liability $1M
Specific Limit Each Employee for Disease:Policy Part One, workers' Compensation $25MPolicy Part Two, Employers Liability $1M
Coverage: $25MDeductible/Retention: $750KPremium: $265,634
Fiduciary Liability PolicyChubb Group of Insurance Companies
817064331 Yr. Renewal Policy
12/16/14-12/16/15 $13,300$5M Maximum Aggregate Limit of Liability
$15K Insuring Clause A Fiduciary Liability Coverage$0 Insuring Clause B Voluntary Settlement Program Coverage
Claims Made Coverage
Medical Stop Loss $2,882,643 Annual maximum is unlimited$150K per covered personAggrigate Benefit Max. $1M
Self Funded Health Program; Budgeted elsewhere **Moved to HR 08/01/2015
Public Officials Liability (D&O)ACE American Insurance Company
EONG216733A009Renewal Policy
10/01/14-10/01/15 $120,710$5M Each Claim/$10M Aggregate
$100K Each ClaimPremium per invoice 09/20/2013
Rolling Owner Controlled Insurance Program (R/OCIP) For TRIP and Non-TRIP Construction Projects
Workers' Compensation & General Liability - Liberty Mutual; Contractor's Pollution Liability - Chartis; Builders Risk - Lexington; Excess Liability - Various Carriers
Workers' Compensation - WA2-69D-456266-011; General Liability - TB2-691-456266-021; Contractor's Pollution - CPO-015543252; Builder's Risk - 025031931
2/15/11-2/15/2018 $1,965,600
Workers' Compensation - Statutory Limits; General Liability -
$2M/$4M/$4M; Contractor's Pollution - $50M; Excess Liability - $200 M;
Builder's Risk - $2B
$250K
R/OCIP provides basic insurance, safety & training services, and bond training to the Terminal Renovation & Improvement Project (TRIP) and other non-TRIP capital development contractors. The program is managed by the Risk Management Department with the broker of record, Willis, Inc. of Texas.
All Risk Property Lexington Insurance Co. 25031931 3/1/14-3/1/17 $4,026,700
Limits of Liability $2BBlanket Coverage Business Interruption (Hyatt Hotel)TerrorismLoss Control/Engineering ServicesBuilders' Risk coverage for the Rolling Owner Controlled Insurance Program
$250K
$50K
$250K
$25K
FTRC International Student Coverage
SRG0009143096New Line Policy
5/23/15-5/23/16 $3,618
Accidental Death $50K, Accidental Dismemberment $50K, Accidental Death and Dismemberment Aggregate $250K, Accident Medical Expense (primary) $50K,Dental Maximum $250 per Tooth Per Accident, Emergency Evacuation $50K, Repatriation of Remains $25K
Accident Medical Expense $0 NEW
Source: Dallas/Fort Worth International Airport, Risk Management and Human Resources Departments