
FMEA RISK MANAGEMENT TECHNIQUE FOR QUALITY …ijaerd.com/papers/special_papers/CE18.pdf · ·...
12
National Conference on Recent Research in Engineering and Technology (NCRRET-2015) International Journal of Advance Engineering and Research Development (IJAERD) e-ISSN: 2348 - 4470 , print-ISSN:2348-6406 FMEA RISK MANAGEMENT TECHNIQUE FOR QUALITY CONTROL OF RMC PRODUCTION Prof.Jyoti Trivedi 1st Affiliation (Author) Dr.Chakradhar Iyunni 2nd Affiliation (Author) Faculty of Technology (FOT),M.Tech(CEM) Faculty of L & T, project management institute CEPT University, Vadodara, Gujarat Ahmedabad, Gujarat [email protected] ABSTRACT Concrete is the most extensively used among all the construction material and is frequently considered as the most economical and durable material. For effective quality and productivity impr ove me nt of infrastructure projects, statistical quality control (SQC) application proves to be an important tool which can be used in order to ensure that concrete produced is of desired quality. In order to identify the major failure mode in production of Ready Mixed Concrete (RMC) of different grades (M20,M25,M30) FMEA is used. The Failure Mode Effect Analysis (FMEA) technique is to identify risk factors for the potential failure mode in the production process of concrete and to take the appropriate corrective actions for improvement.The risk priority number results indicate ’s process failure in terms of irregular grading process, material testing prior use in mixing process which were the important factor to be monitored for quality control. Keywords: Statistical quality control(SQC), Ready mix concrete (RMC), Quality Control, Quality Tools,risk priority number(RPN),failure mode effect analysis(FMEA) I. INTRODUCTION Concrete is the most universal of a ll the construction material and is frequently considered as the most economical one and is strong and durable material. As per Indian Standard code of practice (IS 4926 - 2003) Ready Mixed Concrete (RMC) is defined as the concrete delivered in plastic condition and requiring no further treatment before being placed in position in which it is to set and harden. (Naiknavare P; Naiknavare, Deshpande, & Padhye, 2010). In the era of competitive markets and globalization, quality concepts and philosophies have emerged as strategic issues at all organizational levels and in all industries and services including the RMC industry which is the major asset of national economies. The seven basic quality tools have been used by quality professionals to identify procedures, ideas, statistics, cause and effect concerns and other issues relevant to RMC industry.(Mohamed A. 2., 2012) There is an awareness and understanding about importance of risks and its management techniques in European countries. Operation managers on RMC plants in the European countries are likely to work on risk management at production plant and delivery sites. In India, Risk Management at RMC plant is not given enough importance. Information gathered from different RMC plants in India in places like Mumbai, Navi Mumbai, Pune, Bangalore, and Noida, reveals that a regular and proper risk management approach is not practiced in Indian RMC Industry. Unless the risks are addressed properly, the RMC industry in India shall not gain reliability, confidence of customers and
Transcript of FMEA RISK MANAGEMENT TECHNIQUE FOR QUALITY …ijaerd.com/papers/special_papers/CE18.pdf · ·...

National Conference on Recent Research in Engineering and Technology (NCRRET -2015)
International Journal of Advance Engineering and Research Development (IJAERD)
e-ISSN: 2348 - 4470 , print-ISSN:2348-6406
FMEA RISK MANAGEMENT TECHNIQUE FOR QUALITY
CONTROL OF RMC PRODUCTION
Prof.Jyoti Trivedi 1st Affiliation (Author) Dr.Chakradhar Iyunni 2nd Affiliation (Author) Faculty of Technology (FOT),M.Tech(CEM) Faculty of L & T, project management institute CEPT University, Vadodara, Gujarat
Ahmedabad, Gujarat
ABSTRACT
Concrete is the most extensively used among all
the construction material and is frequently
considered as the most economical and durable
material. For effective quality and productivi ty
improvement of infrastructure projects,
statistical quality control (SQC) application
proves to be an important tool which can be
used in order to ensure that concrete produced
is of desired quality. In order to identify the
major failure mode in production of Ready
Mixed Concrete (RMC) of di fferent grades
(M20,M25,M30) FMEA is used. The Failure
Mode Effect Analysis (FMEA) technique is to
identify risk factors for the potential failure
mode in the production process of concrete and
to take the appropriate corrective actions for
improvement.The risk priority number results
indicate’s process failure in terms of irregular
grading process, material testing prior use in
mixing process which were the important factor
to be monitored for quality control.
Keywords: Statistical quality control(SQC), Ready
mix concrete (RMC), Quality Control, Quality
Tools,risk priority number(RPN),failure mode
effect analysis(FMEA)
I. INTRODUCTION
Concrete is the most universal of all the
construction material and is frequently considered
as the most economical one and is strong and
durable material. As per Indian Standard code of
practice (IS 4926 - 2003) Ready Mixed Concrete
(RMC) is defined as the concrete delivered in
plastic condition and requiring no further treatment
before being placed in position in which it is to set
and harden. (Naiknavare P; Naiknavare,
Deshpande, & Padhye, 2010). In the era of
competitive markets and globalization, quality
concepts and philosophies have emerged as
strategic issues at all organizational levels and in all
industries and services including the RMC industry
which is the major asset of national economies. The
seven basic quality tools have been used by quality
professionals to identify procedures, ideas,
statistics, cause and effect concerns and other
issues relevant to RMC industry.(Mohamed A. 2.,
2012)
There is an awareness and understanding about
importance of risks and its management techniques
in European countries. Operation managers on
RMC plants in the European countries are likely to
work on risk management at production plant and
delivery sites. In India, Risk Management at RMC
plant is not given enough importance. Information
gathered from different RMC plants in India in
places like Mumbai, Navi Mumbai, Pune,
Bangalore, and Noida, reveals that a regular and
proper risk management approach is not practiced
in Indian RMC Industry. Unless the risks are
addressed properly, the RMC industry in India shall
not gain reliability, confidence of customers and

will also cause reduction in profit margins.(Valke
& Kabiraj, 2010)
Thus, the aim of the study is to identify the
effective risk factors for the concrete production
process for quality control using failure mode
effect analysis(FMEA) tool, and to propose quality
control model fo r ready mix concrete(RMC). This
model will be a valuable in formation to engineers
for identify ing failures of on process concrete
production.
II. LITERATURE REVIEW
The most realistic and effective tool for monitoring
the quality of ready mix concrete was brought into
existence which is known as risk adjusted
cumulat ive sum(RACUSUM). RACUSUM model
is based on the likelihood ratio scoring method, the
quantification of which involves parameters such as
estimated risk, odds ratio under null hypothesis
odds ratio under alternate hypothesis, and actual
outcome of the sample strength. The log-likelihood
score thus obtained, when added to the
conventional cumulative summat ion(CUSUM)
values and the corresponding graphical plot, is
termed as the RACUSUM plot.(Datta & Sarkar,
2010).
Quality Control o f Ready Mixed Concrete can be
divided into three convenient areas like forward
control, immediate control and retrospective
control. Statistical Quality Control(SQC)
application proves to be an important tool which
can be used effectively for quality and productivity
improvement for infrastructure projects. Statistical
Quality Control can be effect ively applied to RMC
industry for online (during production) and also
offline (before and after production) quality
monitoring and control.(Mohamed A. 2., 2012)
A production of ready mix concrete includes mix
design of RMC, IS codes, mixing process, carrying
of concrete, handling process, quality assurance
and site preparation.(Gupta D. Y., 2008). Ready
mix concrete is an industrial product which is
delivered to consumer in fresh condition after the
production process in RMC plant. The process of
Ready mix concrete(RMC) flows from (design,
production, transportation, pouring, placement and
maintenance).
Failure Mode and Effect Analysis (FMEA) is one
of the risk analysis techniques recommended by
international standards such as MIL-STD-1629A
(U.S. Department of Defense 1980). FMEA is a
technique that is based on identifying potential
failures, analyzing root causes, and examining
failure impacts so that these impacts can be
reduced.
The most common tool used for quality p rocess
improvement in RMC is PDCA cycle (Plan Do
Check Act cycle) is shown in figure 1.

Fig 1: PDCA Cycle
PDCA cycle fo r process improvement is
documented under seven phases i.e. Identify the
opportunities for improvement, investigate the
current process, expand the optimal solution, apply
the changes, study the results, standardize the
solution and plan for future.
Within the context of tradit ional FMEA, the degree
of criticality of an event is measured by calculating
Risk Priority Number (RPN). Risk Priority Number
(RPN) is an index score calcu lated as the product
of the three input terms, Severity (S), Occurrence
(O), and Detection (D). The severity rating (S) is
used to represent the potential effects associated
with the occurrence of failure mode. The
occurrence rating (O) is the probability of
occurrence of a failure (Ayyub, 2003)
Researcher’s has introduced an application of
FMEA to the context of pro ject risk management
by calculating the RPN to find out the most critical
events that require immediate response.(Tippet,
2004),th is calculation is straight-forward and easy
to understand. But, shortcomings within this RPN
calculation have been noted(palaez, 203-213). For
instance, a failure mode with Severity (S),
Occurrence (O), and Detection (D) values as 9, 5,
and 5 respectively results RPN as 225. Whereas, a
failure mode with Severity (S), Occurrence (O),
and Detection (D) values 7, 7, and 5 respectively
results RPN as 245.So, the latter failure mode shall
be considered to establish the response. But, from
Management perspective, the Severity(S) rat ing for
the former mode is higher, which cannot be
neglected.
So, Ayyub (2003) stated that without linking the
value of RPN to linguistic terms describing the
priority to take correct ive actions, the project team
will not be able to recognize the difference between
the closer values of RPN.(Ayyub, 2003)
Failure mode and effect analysis is the technique
which is used to identify the potential failure modes
for the product or a process before the problem
occurs to consider the risk. It might also rank each
failure according to the crit icality of a failure effect
and its likelihood of taking place. FMEA is an
•Analyse and determine the accurate results
•Make the coreective actions and improve the results.
•Decide how to carry out the plan
•what to do and how to accomplish
Plan Do
CheckAct

analytical technique which explores the effect of
failure of indiv idual components in a system.
(Quantified risk assesment techniques part-1
Failure mode and effect analysis FMEA, 2012).
(Lipol & Haq, 2011)
For calculating the risk using FMEA, RPN (Risk
Priority Number) is calculated based on severity,
occurrence and detection. RPN=S*O*D. The scale
of severity(S), occurrence(O) and detection(D) is
range from 1-10 where 1 is lowest and 10 is
highest. (Quantified risk assesment techniques part-
1 Failure mode and effect analysis FMEA, 2012)
(Lipol & Haq, 2011)
A. Benefits of FMEA
Improve the design of product or process after
identifying the risk i.e . better quality, upper
reliability and enlarged safety.
Improve customer satisfaction i.e. cost saving,
decrease warranty cost and decrease waste.
Development of control plans, testing requirements
and reliab ility plans.
B. Limitation of FMEA
FMEA is not used to identify the complex failure
mode in product or process (deals with only single
point failure and cannot deal with multip le failure
mode).
III. RESEARCH SIGNIFICANCE
There is a tremendous growth in use of ready mix
concrete for the construction in developed
countries. In today’s world, the ready mix concrete
is used by almost every construction industries , but
they are lagging behind in considering the quality
of concrete. The quality of concrete is still ignored
or not taken into consider by RMC producers hence
in order to improve the performance of RMC,
proper monitoring and control is required. Hence
there is a need of risk identificat ion. In order to
identify the major failure mode in production of
RMC, FMEA technique is required to study.
IV. DATA COLLECTION AND ANALYSIS
Data collected from RMC plants located in
ahmedabad.The grade of concrete produced from
the plant-1 is of grade M25. The ingredients
considered for concrete mix of M25 grade is 382kg
of cement, 748 kg of sand, 528 kg of 10mm
aggregate, 656 kg of 20mm aggregate, 172 kg of
water and 3.06 of admixture. The compressive
strength test results were obtained for 7 days and
28 days along with slump of concrete. The 28 days
compressive strength was taken into consideration
for risk monitoring and control factor for the
study.The basic capacity details of RMC plant was
total capacity of - 60m3,number of transit mixer- 2
,capacity of transit mixer- 6m3,capacity of cement
silos- 120 tons ,Plant model- Automatic horizontal
hoppercement grade-53 used,concrete produced in
each batch-2.25 m3.The mix design fo r M25 grade
concrete is shown in figure 2.
Fig 2: Mix design of M25 grade concrete
0 382
748537
656
172 3.06 MIX Design of M25 Grade concrete for 1m³ concretecement
sand
10 MM aggregate

The test results for M25 grade concrete is shown in table 1.
Table 1: Test results for M25 grade
Sr.
Name Grade of concrete Date of Casting
7 days compressive
Strength N/mm²
28 days compressive
Strength N/mm²
Slump Value
(mm)
1 M25 02-09-2014 22.28 29.13 91
2 M25 02-09-2014 23.32 27.8 102
V. DATA ANALYSIS
The data analysis is carried out with the help of
data collected from three d ifferent RMC plants
from Ahmedabad. In data analysis, firstly the basic
statistical calculations are carried out from the test
results obtained i.e. mean, standard deviation,
upper control limit (UCL) and lower control limit
(LCL).The mean of 28 days compressive strength
was calculated for the collected number of samples
which was plotted as a center line of control chart.
Before calculat ing standard deviation, variance is
to be calculated and variance is average of the
square of the distance between each point in a total
population (N) and the mean (µ). Standard
deviation is obtained by taking root of variance.
A. Frame-work for Data analysis
The frame work for data analysis is shown in figure
3.
Fig 3: Analysis frame-work
data collected from three RMC plants of ahmedabad
statistical calculation carried out for plotting control chart
(mean, standard deviation,variance, UCL and LCL)
Mean of 28 days compressive strength calculted
Quality control chart plotted using MINITAB software
FMEA technique carried out for the Grade of concrete whose quality is going out of prescribed
limit.
corrctive action taken after conducting FMEA technique to improve quality of RMC production

B. Salient features of functioning of Minitab
Software
Minitab software is statistical software which is
used for generating the schewart control charts to
determine the quality of concrete under the
calculated control limits. Schewart control chart is
the one of the important tool out of seven basic
quality tools to determine the quality of ready mix
concrete from which failure mode and effect
analysis is carried out.
It can be used for learning about statistics as well
as statistical research. Statistical analysis computer
applications have the advantage of being accurate,
reliable, and generally faster than computing
statistics and drawing graphs by hand. Minitab is
relatively easy to use once you know a few
fundamentals.
Minitab starts with two basic windows, i.e . session
window and worksheet window, session window
shows the statistical results and worksheet window
shows the input data. Minitab will accept only
numeric data.Minitab can change data types within
limits. It cannot make a simple switch of people’s
names to numeric values, but if you have a column
of numbers that was accidentally entered as text,
then you can change those numbers to numeric
values.
There are various other graphs like histogram, box plot graph and scatter plot can also be p lotted using Minitab
software.
Fig 4: sample quality control chart
Figure 4.shows the schewart control chart with
number of sample on x-axis and 28 days
compressive strength is mentioned on y axis
respectively. There are two sigma limits in the
chart i.e . upper control limit which is the maximum
value of compressive strength and another is lower
control limit i.e. min imum value of compressive
strength. The sigma limit consider for th is study is
3. This will become the prescribed control limit of
the quality control chart under which chart is
plotted. If it goes beyond this limit, it is considered
as failure.
C. Data calculations
The data is collected from three different RMC
plants in Ahmedabad for the different grades of
concrete based on data analysis frame work. Four
statistical parameters were calcu lated from the data
collected i.e. mean, standard deviation, upper
control limit (UCL) and lower control limit (LCL)
is shown in table 2.
Table 2: Statistical Parameters

SR.NO
RMC PLANT
GRADE OF
CONCRETE
MEAN
STANDARD
DEVIATION
UCL
LCL
1 RMCplant-1 M25 32.6 2.35 39.71 25.61
2 RMCplant-2 M20 24.54 1.16 28.02 21.06
M25 30.18 1.81 35.61 24.75
M30 34.7 2.09 40.97 28.43
3 RMCplant-3 M20 32.2 1.95 38.05 26.35
D. ResultsFrom Minitab
Minitab software is used to plot the quality control
charts in order to predict the production process. In
the present research, Minitab software is used to
plot the control charts for 28 days compressive
strength of ready mix concrete.
Minitab software includes the stepwise procedure
by inputting the data which is shown in the
following snapshots below. The data for control
chart is to be input in the form of sheet as shown in
figure 5 i.e. 28 days compressive strength and M25
grade of concrete.
Fig 5: Minitab Input data sheet
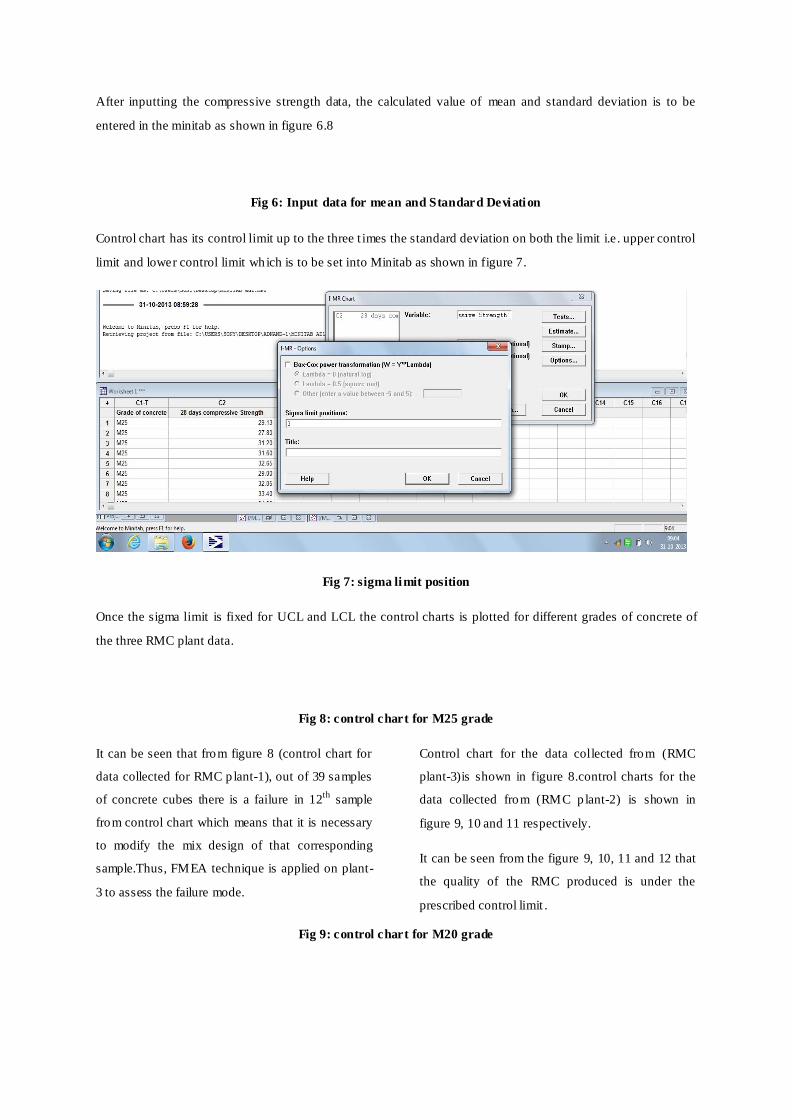
After inputting the compressive strength data, the calculated value of mean and standard deviation is to be
entered in the minitab as shown in figure 6.8
Fig 6: Input data for mean and Standard Deviation
Control chart has its control limit up to the three t imes the standard deviation on both the limit i.e . upper control
limit and lower control limit which is to be set into Minitab as shown in figure 7.
Fig 7: sigma limit position
Once the sigma limit is fixed for UCL and LCL the control charts is plotted for different grades of concrete of
the three RMC plant data.
Fig 8: control chart for M25 grade
It can be seen that from figure 8 (control chart for
data collected for RMC plant-1), out of 39 samples
of concrete cubes there is a failure in 12th
sample
from control chart which means that it is necessary
to modify the mix design of that corresponding
sample.Thus, FMEA technique is applied on plant-
3 to assess the failure mode.
Control chart for the data collected from (RMC
plant-3)is shown in figure 8.control charts for the
data collected from (RMC plant-2) is shown in
figure 9, 10 and 11 respectively.
It can be seen from the figure 9, 10, 11 and 12 that
the quality of the RMC produced is under the
prescribed control limit .
Fig 9: control chart for M20 grade

Fig 10: control chart for M20 grade
Fig 11: control chart for M25 grade
Fig 12: control chart for M30 grade
E. Major issues in RMC plants
The major issues found in the production of Ready
mix concrete through survey during the study were
selection of improper source of material i.e.
(cement, sand, aggregate), non systematic p rocess
of conducting mix design of ready mix concrete
and improper grading and also using equipments
without any maintenance this all factors influence
the quality of ready mix concrete and thus the
compressive strength get decreases.
F. FMEA (Failure mode and effect analysis)
Failure mode and effect analysis is the technique
which is used to identify the potential failure modes
for the product or a process before the problem
occurs to consider the risk. It might also rank each
failure according to the crit icality of a failure effect

and its likelihood of taking place. FMEA is an
analytical technique which explores the effect of
failure of indiv idual components in a system.
In order to calculate risk in FMEA, risk has three
components which are multip lied to produce RPN
(risk priority number). By calculat ing RPN, one
will be able to decide the p riority to select the most
severe factor. There is no threshold value for RPNs.
In other words, there is no value above which it is
mandatory to take a recommended action or below
which the team is automatically excused from an
action .The most common rat ing scale for severity,
occurrence and detection in order to calculate Risk
priority number is shown in table 3. The Failure
mode and effect analysis is a technique which is
carried out for the failed sample in order to identify
the potential failure mode in the RMC production
process. It can be seen from table 4. of FMEA sheet
that the Risk priority number of the process factor
is highest i.e. 48, thus it needs to be corrected
immediately fo r improvement.
Table 3: Rating scale for occurrence, severity and
detection
Table 4: FMEA sheet
1 2 3 4 5 6 7 8
Mode of
Failure
Cause of
Failure
Effect of
Failure
Frequency
of
Occurrence
(1-5)
Degree
of
Severity
(1-5)
Chance
of
Detection
(1-5)
Risk
Priority
(1-125)
[4] x
[5] x
[6]
Design Action
Material Cement,
Aggregate,
Sand
Compressive
strength
3 3 2 18 Test certificate should
be properly checked,
material should be
checked on arrival at
site and properly stored
Process Process of
Mix Design
and Grading
Compressive
strength
3 4 4 48 Grading should be done
properly (Sieve
analysis), material
testing before use in
mix.
1 2 3 4 5
Occurrence remote low moderate high very high
Severity none low moderate high extreme
Detection very high high moderate low very low
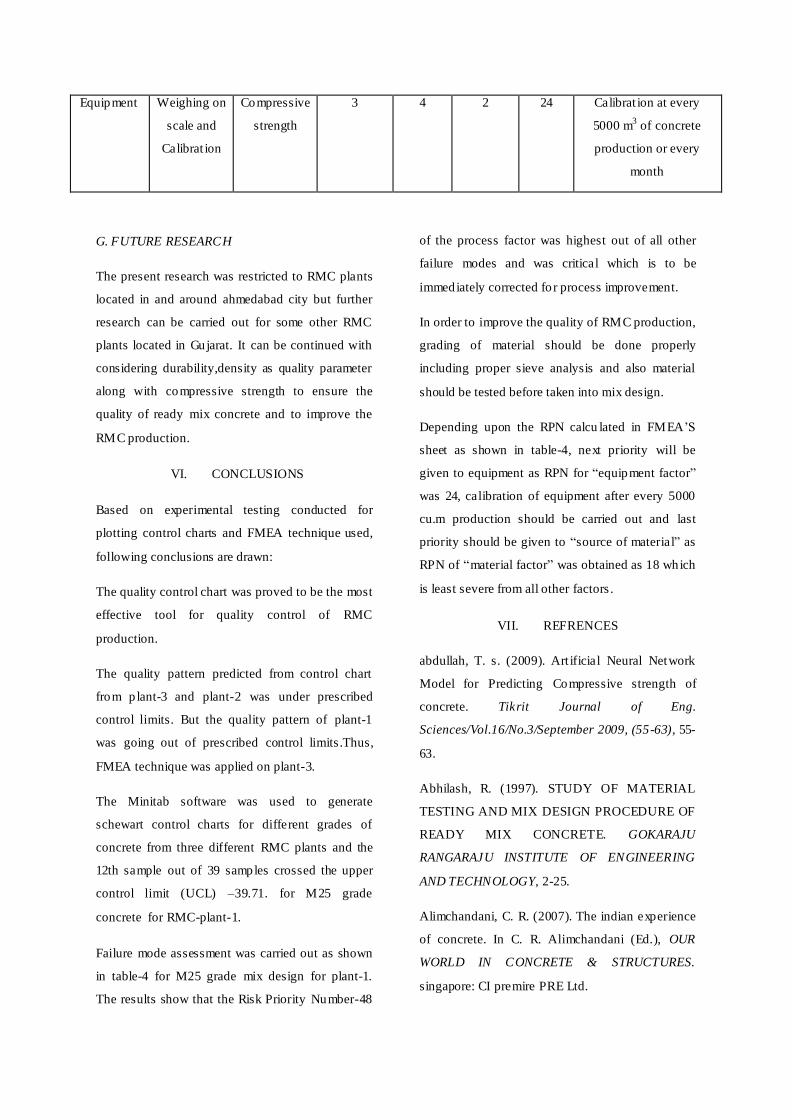
Equipment Weighing on
scale and
Calibrat ion
Compressive
strength
3 4 2 24 Calibrat ion at every
5000 m3 of concrete
production or every
month
G. FUTURE RESEARCH
The present research was restricted to RMC plants
located in and around ahmedabad city but further
research can be carried out for some other RMC
plants located in Gujarat. It can be continued with
considering durability,density as quality parameter
along with compressive strength to ensure the
quality of ready mix concrete and to improve the
RMC production.
VI. CONCLUSIONS
Based on experimental testing conducted for
plotting control charts and FMEA technique used,
following conclusions are drawn:
The quality control chart was proved to be the most
effective tool for quality control of RMC
production.
The quality pattern predicted from control chart
from p lant-3 and plant-2 was under prescribed
control limits. But the quality pattern of plant-1
was going out of prescribed control limits.Thus,
FMEA technique was applied on plant-3.
The Minitab software was used to generate
schewart control charts for different grades of
concrete from three different RMC plants and the
12th sample out of 39 samples crossed the upper
control limit (UCL) –39.71. for M25 grade
concrete for RMC-plant-1.
Failure mode assessment was carried out as shown
in table-4 for M25 grade mix design for plant-1.
The results show that the Risk Priority Number-48
of the process factor was highest out of all other
failure modes and was critical which is to be
immediately corrected fo r process improvement.
In order to improve the quality of RMC production,
grading of material should be done properly
including proper sieve analysis and also material
should be tested before taken into mix design.
Depending upon the RPN calcu lated in FMEA’S
sheet as shown in table-4, next priority will be
given to equipment as RPN for ―equipment factor‖
was 24, calibration of equipment after every 5000
cu.m production should be carried out and last
priority should be given to ―source of material‖ as
RPN of ―material factor‖ was obtained as 18 which
is least severe from all other factors .
VII. REFRENCES
abdullah, T. s. (2009). Art ificial Neural Network
Model for Predicting Compressive strength of
concrete. Tikrit Journal of Eng.
Sciences/Vol.16/No.3/September 2009, (55-63), 55-
63.
Abhilash, R. (1997). STUDY OF MATERIAL
TESTING AND MIX DESIGN PROCEDURE OF
READY MIX CONCRETE. GOKARAJU
RANGARAJU INSTITUTE OF ENGINEERING
AND TECHNOLOGY, 2-25.
Alimchandani, C. R. (2007). The indian experience
of concrete. In C. R. Alimchandani (Ed.), OUR
WORLD IN CONCRETE & STRUCTURES.
singapore: CI premire PRE Ltd.

Ayyub. (2003). Risk Analysis in Engineering and
Economics. International Journal of Project
Management, 589-600.
Badde D, G. A. (n.d.). Cascade and Feed Forward
Back propagation Artificial Neural Network
Models for Prediction of Compressive Strength of
Ready Mix Concrete. IOSR Journal of Mechanical
and Civil Engineering, 1-6.
Datta, & Sarkar. (2010). Design and Application of
Risk Adjusted Cumulative Sum for Strength
Monitoring of Ready Mixed Concrete. JOURNAL
OF CONSTRUCTION ENGINEERING AND
MANAGEMENT © ASCE / JUNE 2010 , 623-631.
GOYAL, N. a. (2011). Pred iction of compressive
strength of concrete using Neural Network.
International journal of emerging trends in
Engineering and Development, 32-43.
Gupta, D. Y. (2008, May). RMC—A Revolution in
Production of Concrete. NBMC .
Gupta, D. Y. (2008, May). RMC—A Revolution in
Production of Concrete. NBMC .
Harja, B. M. (2012). Using neural networks for
prediction of properties of polymer concrete with
fly ash. journals of materials in civil engineering ,
523-528.
J noorzai, M. S. (2008). Application of Artificial
Neural Network to Pred ict Compressive strength of
high strength concrete. In M. S. J noorzai (Ed .),
international conference on construction and
building technology (pp. 68-77). malaysia:
university putra malaysia.
Kasperkiewics J, R. J. (1995). HPC strength
prediction using artificial neural network. journal
of computing in civil engineering, 279-284.
Kim D, L. J. (2005). Applicat ion of probabilistic
neural networks for pred iction of concrete strength.
Journal of material in civil engineering , 353-362.
Kumar, M. (1999). Advancement in concrete
technology. international concrete journal, 69-76.
Lipol, L. S., & Haq, J. (2011). Risk analysis
method: FMEA/FMECA in the organizat ions.
International Journal of Basic & Applied Sciences
IJBAS-IJENS Vol: 11 No: 05, 74-82.
Mohamed, A. 2. (2012). On the use of the basic
quality tools for yhr improvement of the
construction industry. International Journal of civil
and Environmental Engineering , 28-35.
Mohamed, A. (2012). On the use of the basic
quality tools for yhr improvement of the
construction industry. International Journal of civil
and Environmental Engineering , 28-35.