Fiscal Extension to ORANI-IT: a Computable General ... · Fiscal Extension to ORANI-IT: a...
34
Working Papers N° 8 – September 2014 Ministry of Economy and Finance Department of the Treasury Fiscal Extension to ORANI-IT: a Computable General Equilibrium Model for Italy Francesco Felici, Maria Gesualdo ISSN 1972-411X
Transcript of Fiscal Extension to ORANI-IT: a Computable General ... · Fiscal Extension to ORANI-IT: a...

Working Papers
N° 8 – September 2014
Ministry of Economy and Finance
Department of the Treasury
Fiscal Extension to ORANI-IT: a Computable
General Equilibrium Model for Italy
Francesco Felici, Maria Gesualdo
ISSN 1972-411X

Working Papers
The working paper series is aimed at promoting circulation and dissemination of working papers produced in the Department of the Treasury (DT) of the Italian Ministry of Economy and Finance (MEF) or presented by external economists on the occasion of seminars organised by MEF on topics of institutional interest of DT, with the aim of stimulating comments and suggestions. The views expressed in the working papers are those of the authors and do not necessarily reflect those of MEF and DT.
Copyright: ©
2014, Francesco Felici, Maria Gesualdo The document can be downloaded from the Website www.dt.tesoro.it and freely used, providing that its source and author(s) are quoted.
Editorial Board: Lorenzo Codogno, Mauro Marè, Libero Monteforte, Francesco Nucci, Franco Peracchi
Organisational coordination: Michele Petrocelli

Fiscal Extension to ORANI-IT: a Computable General Equilibrium Model for Italy
Francesco Felici1
, Maria Gesualdo2
Abstract
In this paper we expand the national multi-sectoral computable general equilibrium (CGE)
model ORANI-IT, allowing for a number of fiscal tools. The outcome is a computable general
equilibrium tax model of Italy, developed at the Department of Treasury of the Italian Ministry of
the Economy and Finance, in collaboration with the Centre of Policy Studies (CoPS), and
currently managed at Sogei S.p.A. (IT Economia - Modelli di Previsione ed Analisi Statistiche).
The paper demonstrates in considerable detail the methodology to incorporate a fiscal
extension, that mainly consists in including a detailed tax information into existing commodity
and production tax matrices, to the existing national model. In particular, the procedure to
accommodate national data on tax revenues within the model’s database and explicitly model
the full range of indirect taxes within the theoretical structure is reported. Within the fiscal
extension, the model includes a comprehensive model of Value-Added-Tax (VAT), which
accounts for all the typical features of a complex VAT system - such as multi-production,
multiple tax rates, different degrees of exemptions and refundability factors - as well as of EU-
specific matters relating to taxation of intra-EU exports, and to the scope of VAT and
exemptions of public interest. Interestingly, the framework developed in this paper for Italy may
be extendible to other European countries, which fall within the EU VAT legislation. The model
also features a special emphasis on sectors national accounts, with a detailed system of
equations describing government and households budget revenues and expenditures and
transactions with the rest of the world. The output is a powerful tool for acquiring new insights
on the current fiscal system, through the assessment of tailored fiscal reforms, which can
consist of either changes in tax rates and tax bases. Future research may be pursued in the
application of the model for evaluating alternative policies.
JEL Classification: C68, H20, H25 Keywords: Computable general equilibrium (CGE) tax models, Indirect Taxes,
Value-Added-Tax, Sector accounts, Italy
1 Ministero dell’Economia e delle Finanze, Dipartimento del Tesoro. E-mail: [email protected]
2 Sogei S.p.A., IT Economia – Modelli di previsione ed analisi statistiche Unit. E-mail: [email protected]

Contents
1 INTRODUCTION ................................................................................................................................... 1
2 EXTENSIONS OF THE CORE DATABASE ....................................................................................... 2
2.1 Balancing conditions on the tax matrices and on the database as a whole .................................................. 2
2.2 The core model’s database............................................................................................................................. 4
2.3 Creating indirect taxes matrices ................................................................................................................... 6
2.4 The commodity taxes matrix ........................................................................................................................ 7
2.5 The subsidies matrix ....................................................................................................................................10
2.6 The production taxes matrix .......................................................................................................................12
3 THE VALUE-ADDED-TAX (VAT) MATRIX ........................................................................... 14
3.1 The EU VAT legislative framework ............................................................................................................14
3.2 The Value-Added-Tax model ......................................................................................................................16
3.2.1 Legislative rates .............................................................................................................................................. 16
3.2.2 Legal and de-facto exemptions and the scope of VAT.................................................................................... 16
3.2.3 Registration rate .............................................................................................................................................. 17
3.2.4 The VAT treatment of public bodies and exemptions in the public interest ................................................... 18
3.2.5 The VAT refundability factor.......................................................................................................................... 18
3.2.6 Effective VAT rates ........................................................................................................................................ 18
3.2.7 Expected VAT revenues .................................................................................................................................. 20
4 MODELLING NATIONAL INCOME ACCOUNTS ............................................................... 24
4.1 Investment income items, net foreign liabilities and government domestic debts ......................................25
4.2 Direct taxes ..................................................................................................................................................26
4.3 Modifying the core equations to incorporate new information...................................................................26
5 CONCLUSION ................................................................................................................................... 27
REFERENCES .............................................................................................................................................. 28

1
1 Introduction This paper describes the main features of the Italian CGE model, ORANI-IT, with some fiscal extensions.
The model, designed at the Department of Treasury of the Italian Ministry of the Economy and Finance, in
collaboration with the Centre of Policy Studies (CoPS), and currently managed at Sogei S.p.A. (IT Economia
- Modelli di Previsione ed Analisi Statistiche), is intended for policy analysis. A detailed specification of a
full range of direct and indirect taxes is incorporated into the existing national CGE model3. The inclusion of
an extremely detailed indirect commodity taxes matrix by commodity, user, source and tax type and
production taxes matrix by industry and tax type makes the model a suitable tool for fiscal policy analysis. In
dealing with the fiscal extension, this paper aims to provide a roadmap into the complex data-job required to
add new features into an existing database, as it can result challenging by limited data availability and by
model dimensions.
The model also features a comprehensive Value-Added-Tax (VAT) model. The framework for economy-
wide modelling of VAT systems, developed by Giesecke and Tran (2010, 2012) has been further extended in
order to accommodate country-specific features. If issues arising from multiple tax rates, exemptions and
industry-specific refundability factors are shared by many VAT systems, two EU-specific issues stand out
from the EU VAT legislation: the treatment of the VAT for public bodies and activities in the public
interests, and the VAT regime applicable to cross-border transactions.
CGE modelling represents a suitable tool for the assessment of the allocative efficiency effects of tax
policies, thanks to its capability of capturing the distortion of relative prices. On the other side, the solid
theoretical background combined with national accounts data enable estimates of the welfare and revenue
effects of alternative reforms. Focusing on the VAT, the development of a general framework with a detailed
description of institutional features of tax systems combined with an input-output linkages with commodity,
industry and input factors details allow for the computation of the share of tax burden bear by producers,
which represents an essential ingredient when dealing with VAT analysis5.
As part of large-scale models, CGE models rely on a well-structured database, which fits into a theoretical
model. For constructing the database, the first piece of information is represented by Input-Output tables and
national accounts. Then, depending on the nature of the model and on the desired level of detail, additional
data sources can be required. However, when dealing with detailed models extensions, data availability
and/or format can come to represent a shortcoming.
In recent years, several studies6 have been commissioned by the European Commission (EC) for an
assessment of the current EU VAT system, with the aim of identifying weaknesses and problems and setting
out a simpler, more robust and efficient system (European Commission, 2010). Of particular interest to this
paper are those studies dealing with the aforementioned EU-specific rules. The Institute for Fiscal Studies
(2011) identifies these rules as being problematic, as exemptions of public services and limitations to the
scope of VAT seem likely to be extremely damaging in terms of neutrality and competition, and some of the
transactions between member states can incentive non-compliance and can result in an high burden cost. The
IMF (Keen et al. 2012) in the assessment of the delega fiscale7 of the Italian government has called for a
rethinking of the exemptions system, as the resulting unrecovered input VAT is imputed to cause: distortion
3 The model is fully documented in Felici and Gesualdo (2014).
5 See Fullerton, Henderson, and Shoven (1984), McLure (1990, p.38), Fehr, Rosenberg, and Wiegard (1995, pp. 39-40).
6 Refer to http://ec.europa.eu/taxation_customs/common/publications/studies/index_en.htm, for a full list of studies
made for the Commission. 7 Law 11 March 2014, n.23, Delega al Governo recante disposizioni per un sistema fiscale più equo, trasparente e
orientato alla crescita.

2
of real decisions, competitive disadvantage within the EU, and loss of transparency. The European
Commission (2013) has launched a public consultation regarding the lack of neutrality resulting from the
current legislative framework ruling the scope of the VAT. In the CGE literature, two earlier studies build
multi-country CGE models for EU aimed at studying a VAT reform. Fehr et al. (1995) develop a framework
particularly suitable for investigating the welfare and revenue effects of alternative setting for the taxation of
intra-EU trades (destination versus origin-based VAT). Copenhagen Economics (2013) addresses the
controversial rules applicable to the public sector, by means of a multi-regional CGE model of EU27
specifically designed to analyse the economic effects of the admixture of public production and VAT
policies. In this model the non-taxable or tax-exempt sectors are captured by setting zero output VAT rates,
but positive input VAT rates. If this model captures deviations from a "pure" VAT system via the tax rate,
on the contrary, in our framework we carefully reproduce the multiple tax rates, exemption and refundability
factors, the non-taxable public sector, and the differential treatment of exports, via a tailored system of
equations. In such a way, we allow for the assessment of a whole range of potential reforms of the VAT
system dealing with all its features, including potential base-broadening reforms. To the best of the author’s
knowledge there is no national model that accounts for all of the EU VAT features at the same time.
This paper is organized as follows. Section 2 describes the construction of the commodity and production
tax matrices. In section 3, features of the European VAT system are accommodated into an all-embracing
VAT model. Section 4 is devoted to the modelling of the institutional sectors accounts. Section 5 concludes.
2 Extensions of the core database
2.1 Balancing conditions on the tax matrices and on the database as a whole
Since CGE models are built on national accounts data, balancing conditions bound the setting up of the
database. In fact, several constraints have been observed when assembling the tax matrices and the database
as a whole.
In particular, the tax matrices satisfy the following conditions: for each commodity, the total value of net
commodity taxes, summed over sources, users and tax types, equals the values reported in column "Taxes
less subsidies on products" of the supply table; for each industry, the total value of net production taxes,
summed over tax types, equals the values reported in row "Other taxes on production" in the USE table;
revenues of each tax types equal that reported in government revenue statistics (Table 1 and Table 2).
The extended model satisfies the following conditions: industry costs equal industry sales, reflecting the
model’s zero pure profit assumption; the value of the total output of a given commodity equals the value of
the total usage of that commodity, in order to meet the model’s commodity market clearing assumption;
flow matrices do not contain negative numbers, because of the condition that flows of goods, services and
factors cannot be negative. However, this condition does not apply to matrices related to taxes and
inventories (VTAX6 and V6BAS), as by definition these flows can show negative values.
Note that the database for ORANI-IT is calibrated on the Supply and Use tables (SUT) for 2008, released by
ISTAT8. Hence all data discussed in this paper are for the year 2008. In particular, the fiscal addition is based
on tax revenues government data and on national accounts.
8Downloaded at http://www.istat.it/it/archivio/60913.
3
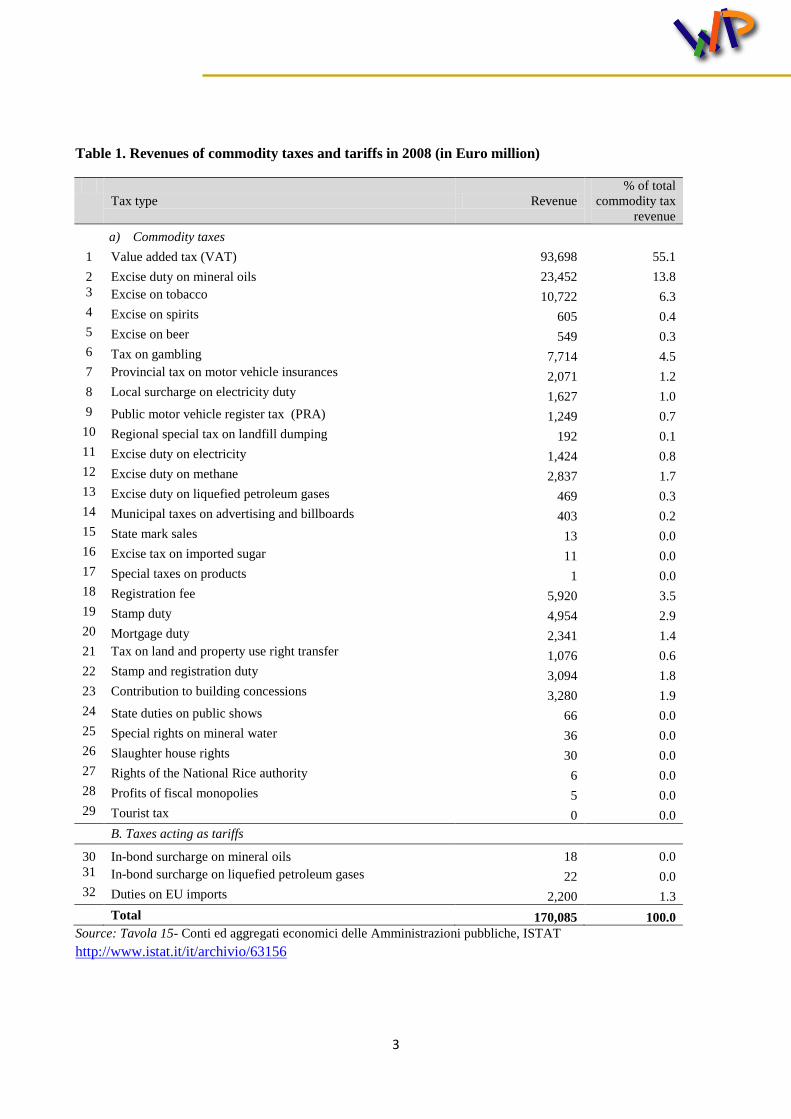
Table 1. Revenues of commodity taxes and tariffs in 2008 (in Euro million)
Tax type Revenue
% of total
commodity tax
revenue
a) Commodity taxes
1 Value added tax (VAT) 93,698 55.1
2 Excise duty on mineral oils 23,452 13.8
3 Excise on tobacco 10,722 6.3
4 Excise on spirits 605 0.4
5 Excise on beer 549 0.3
6 Tax on gambling 7,714 4.5
7 Provincial tax on motor vehicle insurances 2,071 1.2
8 Local surcharge on electricity duty 1,627 1.0
9 Public motor vehicle register tax (PRA) 1,249 0.7
10 Regional special tax on landfill dumping 192 0.1
11 Excise duty on electricity 1,424 0.8
12 Excise duty on methane 2,837 1.7
13 Excise duty on liquefied petroleum gases 469 0.3
14 Municipal taxes on advertising and billboards 403 0.2
15 State mark sales 13 0.0
16 Excise tax on imported sugar 11 0.0
17 Special taxes on products 1 0.0
18 Registration fee 5,920 3.5
19 Stamp duty 4,954 2.9
20 Mortgage duty 2,341 1.4
21 Tax on land and property use right transfer 1,076 0.6
22 Stamp and registration duty 3,094 1.8
23 Contribution to building concessions 3,280 1.9
24 State duties on public shows 66 0.0
25 Special rights on mineral water 36 0.0
26 Slaughter house rights 30 0.0
27 Rights of the National Rice authority 6 0.0
28 Profits of fiscal monopolies 5 0.0
29 Tourist tax 0 0.0
B. Taxes acting as tariffs
30 In-bond surcharge on mineral oils 18 0.0
31 In-bond surcharge on liquefied petroleum gases 22 0.0
32 Duties on EU imports 2,200 1.3
Total 170,085 100.0
Source: Tavola 15- Conti ed aggregati economici delle Amministrazioni pubbliche, ISTAT
http://www.istat.it/it/archivio/63156

4
Table 2. Revenues of production taxes in 2008 (in Euro million)
Tax type
Revenue
(EUR m)
% of total
production taxes
1 Regional tax on productive activities (IRAP) 36,141 71.0
2 Municipal property tax (ICI) 9,105 17.9
3 Franchise tax 1,519 3.0
4 Rights of chambers of commerce 1,413 2.8
5 Other taxes on production 619 1.2
6 Italian television tax 398 0.8
7 Regulatory authority for Electricity and Gas 39 0.1
8 Fees on notarial records 25 0.0
9 Other special revenues from tax on products 17 0.0
10 Provincial tax for environmental protection 269 0.5
11 Motor vehicle duty paid by enterprises 1,339 2.6
12 Taxes on exports -34 -0.1
13 SO2 and NOx pollution tax 25 0.0
14 Rights on provincial tourism 0 0.0
Total 50,875 100
Source: Tavola 15- Conti ed aggregati economici delle Amministrazioni pubbliche, ISTAT
http://www.istat.it/it/archivio/63156
2.2 The core model’s database
A full description of the core model’s database is provided in Felici and Gesualdo (2014). However, for the
reader's convenience, we replicate the basic structure of the model here via a schematic representation of the
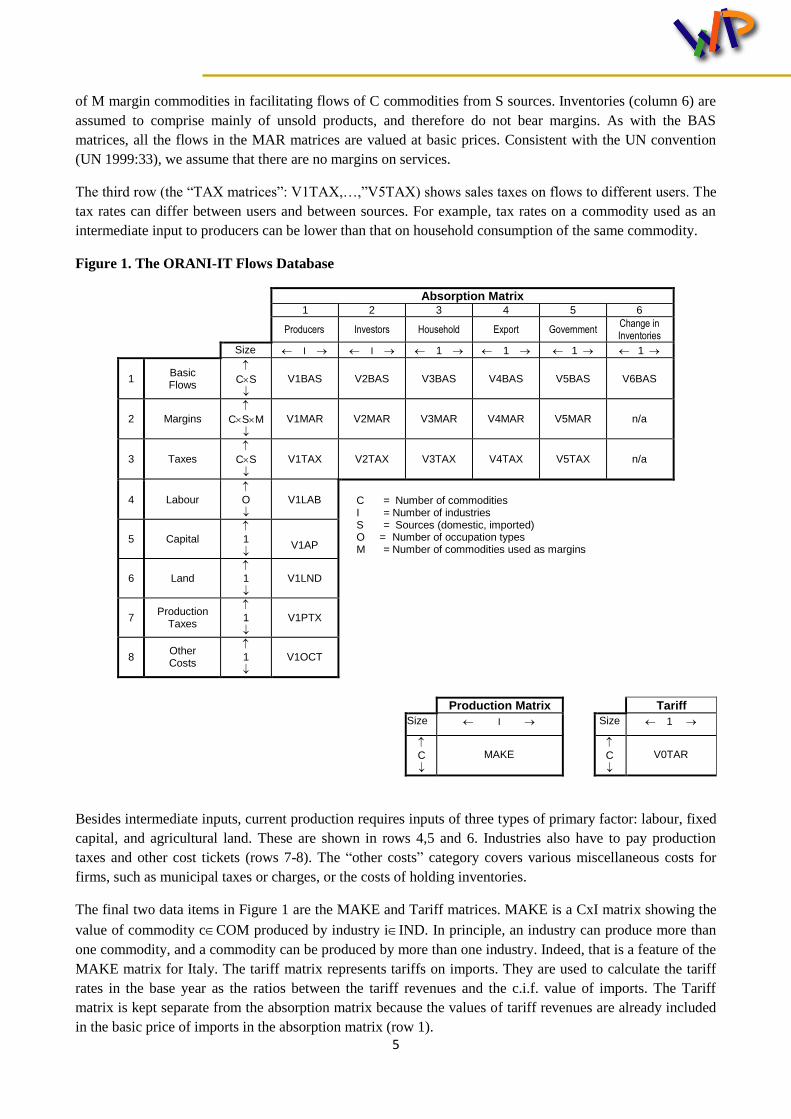
model’s input-output database, as reported in Figure 1.
The column headings in the absorption matrix identify the following demanders: domestic producers
divided into I industries; investors divided into I industries9; a single representative household; an aggregate
foreign purchaser of exports; government demands; and changes in inventories.
The first row in the absorption matrix (the “BAS matrices”: V1BAS,…,V6BAS) shows flows in year t of
commodities to each user. Each of these matrices has CxS rows, one for each of C commodities from S
sources. In ORANI-IT, C is 63 and S is 2 (domestic and imported). The flows are valued at basic prices. The
basic price of a domestically produced good is the price received by the producer (that is, the price paid by
users excluding sales taxes, transport costs and other margin costs). The basic price of an imported good is
the landed-duty-paid price, i.e. the price at the port of entry just after the commodity has cleared customs.
The second row (the “MAR matrices”: V1MAR,…,V5MAR) shows the values of margin services used to
facilitate the flows of commodities identified in the BAS matrices. The commodities used as margins are
domestically produced trade, road transport, rail transport, water transport and air transport services. Imports
are not used as margin services. Each of the margin matrices has CxSxM rows. These correspond to the use
9 According to the ORANI's theoretical framework, in the production of final goods and services industries combine
inputs to current production and inputs to capital formation. In modelling the minimizing cost problem faced by industries, we distinguish between the demands for the aforementioned inputs and use the term "investors" when dealing with the demand for inputs for capital creation. In terms of database, in accordance with the Italian SUT, which feature a structure by 63 commodities and 63 industries, ORANI-IT presents an investment matrix by 63 commodities and 63 investors.
5
of M margin commodities in facilitating flows of C commodities from S sources. Inventories (column 6) are
assumed to comprise mainly of unsold products, and therefore do not bear margins. As with the BAS
matrices, all the flows in the MAR matrices are valued at basic prices. Consistent with the UN convention
(UN 1999:33), we assume that there are no margins on services.
The third row (the “TAX matrices”: V1TAX,…,”V5TAX) shows sales taxes on flows to different users. The
tax rates can differ between users and between sources. For example, tax rates on a commodity used as an
intermediate input to producers can be lower than that on household consumption of the same commodity.
Figure 1. The ORANI-IT Flows Database
Absorption Matrix 1 2 3 4 5 6
Producers Investors Household Export Government
Change in Inventories
Size I I 1 1 1 1
1 Basic Flows
CS
V1BAS V2BAS V3BAS V4BAS V5BAS V6BAS
2 Margins
CSM
V1MAR V2MAR V3MAR V4MAR V5MAR n/a
3 Taxes
CS
V1TAX V2TAX V3TAX V4TAX V5TAX n/a
4 Labour
O
V1LAB C = Number of commodities I = Number of industries S = Sources (domestic, imported) O = Number of occupation types M = Number of commodities used as margins
5 Capital
1
V1AP
6 Land 1
V1LND
7 Production
Taxes
1
V1PTX
8 Other Costs
1
V1OCT
Production Matrix Tariff
Size I Size 1
C
MAKE
C
V0TAR
Besides intermediate inputs, current production requires inputs of three types of primary factor: labour, fixed
capital, and agricultural land. These are shown in rows 4,5 and 6. Industries also have to pay production
taxes and other cost tickets (rows 7-8). The “other costs” category covers various miscellaneous costs for
firms, such as municipal taxes or charges, or the costs of holding inventories.
The final two data items in Figure 1 are the MAKE and Tariff matrices. MAKE is a CxI matrix showing the
value of commodity cCOM produced by industry iIND. In principle, an industry can produce more than
one commodity, and a commodity can be produced by more than one industry. Indeed, that is a feature of the
MAKE matrix for Italy. The tariff matrix represents tariffs on imports. They are used to calculate the tariff
rates in the base year as the ratios between the tariff revenues and the c.i.f. value of imports. The Tariff
matrix is kept separate from the absorption matrix because the values of tariff revenues are already included
in the basic price of imports in the absorption matrix (row 1).

6
2.3 Creating indirect taxes matrices
Following the System of National Accounts (SNA), ORANI-IT presents two tax types, namely: commodity
taxes, which are represented as a matrix of net total tax by commodity and user (matrices V1TAX to
V5TAX) and production taxes, which are represented as a vector of net production tax by industry (matrix
V1PTAX).
If the computation of the latter is straight forward, as it mirrors the vector “Other tax on production” in the
USE table at basic price; the computation of the former is bounded by data availability, as the SUT contains
data on net taxes on products only by commodity. To incorporate the user dimension, we follow a procedure
that computes the commodity taxes matrix in conjunction with the margins matrix (V1MAR to V5MAR), as
it decomposes the difference between the USE table at purchasers price and the USE table at basic prices -
difference that is composed by net taxes plus margins10
. The procedure relies on the assumptions that all
intermediate and final usages of a commodity are taxed at the same rate, and that no taxes are levied on
stocks. However, Italian data on tax revenues by user (as deducted by computing the difference by users
between USE at basic prices and USE at purchasers' prices) show positive values on stocks. Therefore, in
order to reflect the theory and at the same time to meet the total tax revenues as indicated in the SUT, we
reallocate tax revenues on stocks to other users, in proportion to their shares on total tax revenues.
Taking the inherited database from the national CGE model as our starting point, the commodity matrices
V1TAX to V5TAX and the production tax matrix V1PTAX are subject of additional splitting into specific
tax-types. The schematic representation of the extended ORANI-IT is represented in Figure 2.
In the sections below we describe the process by which we create the extended tax matrices using
information from the SUT, as well as additional tax revenues data for detailed commodity and production
taxes and subsidies from government statistics. First of all, data on indirect tax revenues by tax-type and
subsidies by industry, as released by ISTAT in the “Accounts for general government”11
, represent the new
piece of information the fiscal extension is built on. To be consistent with the original tax structure, we label
each of the item as commodity or production tax, by recalling the ISTAT grouping system12
, and by meeting
sub-totals for the two tax types13
. As a result, the model considers: 32 commodity taxes and a commodity
subsidies; and 15 production taxes and a production subsidies. Tables 1 and 2 present revenues of
commodity and production taxes respectively.
Each item has been explicitly modelled, referring to the relevant tax base in the model and to several tax
rates, enabling the model to capture important details of the tax system. For each tax type, an initial estimate
of the expected tax revenue is computed by applying the legislated tax rate to the relevant part of the input-
output table, which forms the tax base14
. The estimated revenue is likely to differ from the actual tax revenue
as reported in government finance statistics for several reasons, such as: various tax reduction and
exemptions, that may not have been captured in the calculation; less than full compliance tax rate; and
possible shortcomings in the input-output representation of the size of the tax base. Hence, the initial tax
matrix by tax type is scaled in order to meet the target, as reported in the aforementioned tables.
10
For a full description of the procedure to derive the tax matrix in the standard ORANI structure refer to Appendix E in Felici and Gesualdo (2014). 11
Conti ed aggregati economici delle Amministrazioni pubbliche: Tavola 15 and Tavola 19. Downloaded http://www.istat.it/it/archivio/63156. 12
Tavola 3.29 - Imposte sulla produzione e le importazioni per tipologia di unità istituzionali che effettuano il prelievo - Anno 2004 (milioni di euro), pag 245, in Metodologia ISTAT. http://www3.istat.it/dati/catalogo/20120207\_00 13
Institutional accounts - Conti istituzionali 2008, ISTAT. 14
The allocation of each tax type to the relative commodity was based on a guideline provided by ISTAT: Ripartizione delle imposte indirette per rami e classi di attività economica. Anni 1951-1965, Supplemento straordinario al bollettino mensile di statistica n.11- novembre 1996.

7
The following sections describe the procedure in creating the commodity and production tax matrices. In
particular, we discuss in detail our procedure to work out the effective tax rates and calculate tax revenues.
This procedure holds for all commodity taxes but the Value-Added-Tax (VAT), whose dedicated model is
presented in section 3.
Figure 2. The Extended ORANI-IT-F Flows Database
Absorption Matrix
1 2 3 4 5 6
Producers
Investors
Household
Export
Government Change in Inventories
Size I I 1 1 1 1
Basic Flows
CS
V1BAS
V2BAS
V3BAS
V4BAS
V5BAS
V6BAS
Margins
CSM
V1MAR
V2MAR
V3MAR
V4MAR
V5MAR
n/a
Taxes
CS CT
V1TAX
V2TAX
V3TAX
V4TAX
V5TAX
n/a
Labour
O
V1LAB
C = Number of Commodities I = Number of Industries
Capital
1
V1CAP
S = 2: Domestic,Imported, O = Number of Occupation Types
Land
1
V1LND
M = Number of Commodities used as Margins CT= Number of commodity tax types PT = Number of production tax types
Production Tax
PT
V1PTX
Other Costs
1
V1OCT
Joint Production Matrix
Import Duty
Size I Size 1
C
MAKE
C
V0TAR
2.4 The commodity taxes matrix
In the Italian fiscal system, commodity taxes can be grouped into four broad areas: taxes on production,
taxes on business, taxes pro-environment, and miscellaneous of government-related taxes.
For each of them, the tax burden is allocated to relevant flows of goods and services by first estimating the
initial relevant tax revenues, based on the values of the tax base and the tax rate. Then, the estimated initial
tax revenues are proportionately scaled to the actual total revenue of the tax, as reported in the government
statistics (Table 1 and 2). Specifically, we use the following formula for calculating the tax revenues from
flows of good c from source s to user u, , ,c s u
tCTAX :

8
∑ ∑ ∑
(1)
Where:
tREV is the total revenue of tax t reported in government statistics (Table 1);
, ,
t
c s uTBASE is the relevant tax base for tax t;
, ,
t
c s uLR is the legal tax rates for t on flow (c,s,u).
For many tax types, there is no clear cut legal rate. In these cases, we assume that the rate is the same for all
(c,s,u), and hence the total tax revenues are allocated to (c,s,u) in proportion to the values of these flows in
total tax base for the relevant tax type. Table 3 reports the tax bases and tax rates for the allocation of non-
VAT commodity taxes.
Table 3. The allocation of non-VAT commodity taxes
Tax type Allocated to
ORANI-IT-F Commodity Source6F
16 Tax payers7F
17 and tax rates
Excise duty on mineral oils and
derivatives
Refined petroleum and coke All All users. Assumed higher rate for households and
Hightax users.
Tobacco tax Foods, beverages and
cigarettes
All Households
Tax on spirits Foods, beverages and
cigarettes
All Households
Tax on beer Foods, beverages and
cigarettes
All Households
Tax on gambling Art, library and betting All Households
Provincial tax on motor vehicle
insurance
Insurance All All users, uniform rate on the assumed proportion
of insurance services used for insuring motor
vehicles.
Provincial surcharge on
electricity tax
Electricity and Gas All All users, assuming higher rate for households and
Postal services.
Public vehicle register (PRA) Motor vehicles, Legal and
accounting services
All All users, uniform rate.
Special tribute on landfill Waste treatment All All users, uniform rate.
Electricity tax Refined petroleum and coke
Electricity and Gas
All All users, assumed higher rate for households.
Tax on natural gas Refined petroleum and coke,
Mining, Electricity and Gas
All All users, assuming higher rate for households.
Tax on non-condensable gases Refined petroleum and coke
All Uniform rates on Mining, Refined petroleum and
coke, and Electricity and Gas industries.
Municipal taxes on advertising
and billboards
Publishing, Media and Film,
Advertising
All All users, except Agriculture, Fishing and
Forestry. Uniform rate on the assumed shares of
the use of publicity that are taxed
State mark sales Foods, beverages and
cigarettes
All All users, uniform rate.
Excise tax on imported sugar Agriculture and Foods,
beverages and cigarettes
Imp Households.
16
In this column, "All" stands for all sources: domestic or imported. "Imp" stands for "Imported". 17
In this table, "All users" and "Industries" exclude the "Domestic services and own-production" sector, because the tax data show that there are no tax collection from this sector.

9
Tax type Allocated to
ORANI-IT-F Commodity Source6F
16 Tax payers7F
17 and tax rates
Special taxes on products Furniture and Other
Manufactures, Health, Other
Personal Services
Imp All users, except households, uniform rate.
Registration fee Legal and Accounting, Real
Estate,
All All users, assuming higher rates for the Hightax
industries.
Stamp duty Legal and Accounting,
Electricity and Gas
All All users, assuming higher rates for some Hightax
industries.
Mortgage duty Real estate, Legal and
accounting, Insurance
services
All All users, uniform rate.
Tax on land and property use
right transfer
Real estate, Legal and
accounting, Mining,
Agriculture and Forestry
All All users, uniform rate.
Stamp and registration duty Legal and accounting,
Insurance, Financial services,
All All users, uniform rate.
Contribution to building
concessions
Construction All All users, uniform rate.
State duties on public shows Art, library and betting,
Sports and Recreation,
Furniture and Other
Manufacturing
All Households, Hotel and Restaurants, Publishing,
Telecommunication, Financial services,
Insurance, Advertising, Other Professional
Services, Travel Services, Art Library and Bets,
Active Membership Organization.
Special rights on mineral water Foods, beverages and
cigarettes
All All users, uniform rate.
Slaughter house rights Foods, beverages and
cigarettes
All All users, uniform rate.
Rights of the National Rice
authority
Agriculture All Households.
Miscellaneous income of the
state monopoly
Foods, beverages and
cigarettes; Paper products,
Chemicals, Electric
Equipment
All All users
Tourist tax Hotels and restaurants; Travel
services
All Households
Tarrifs:
Border surcharge on mineral
oils
Refined petroleum and coke Imported All users. Assumed higher rate for households
Surtax border (excluding
mineral oils)
Foods, beverages and
cigarettes
Imported Households
Duties on EU imports All commodities with positive
net tax in the Supply table
Imported All users, uniform rate.
These tax bases and rates rely on our current understanding of Italian tax legislations and on the tax values
given in the SUT. For example, we initially assume a uniform rate of the Excise duty on mineral oil and
derivatives on the consumption of refined petroleum products by all industries. However, the Supply table
shows zero tax revenues for the industry "Domestic services and own-production". Hence we exclude this
industry from the base of the tax. For the same reason, this industry is excluded in the calculation of all taxes.
Higher rates for some industries are assumed for which the tax data from the USE tables at basic and
purchasers prices show higher average tax rate across all tax types. These include Post, Education, Financial
services, and Health. In Table 3 we call these industries Hightax users.

10
The resulting four-dimensional net commodity taxes matrix must satisfy the following conditions: total net
tax revenue for each commodity, summed over sources, users and tax types, must equal the value of the
column "Net taxes less subsidies on products" in the Supply table; total net tax revenue for each user,
summed over commodity, sources and tax types, must equal the difference between total commodity
consumption by user in the Use table purchasers' prices and those in the Use table at basic prices; the total
value of each tax type or subsidy, summed over commodity, sources and users, must equal government
statistics for the tax type or subsidy.
Keeping the commodity subsidy unchanged, we RAS the initial commodity tax matrix so as to satisfy the
three conditions listed above. We then combine it with the subsidy matrix to arrive at the matrix required for
the extended ORANI-IT database.
2.5 The subsidies matrix
As taxes in the SUT are net of subsidies, data on commodity and production subsidies are required.
Available data on subsidies consist in: revenues for total subsidies by 37 aggregate sectors in the economy18
;
and sub-totals of subsidies on commodity and on production, that correspond respectively to 12,444 euros
millions and 8,584 euros millions. These data come to represent our targets.
The creation of the subsidy matrices on products and on production involves two tasks: splitting total
subsidies by 37 sector into subsidies on 37 commodity, and subsidies on 37 production industries; and then
allocating the resulting subsidies to 63 commodities and 63 industries in ORANI-IT. More in details, we
create initial matrices for subsidies on products and on production for 37 sectors, by using the reported
subsidy data and some assumed shares19
of subsidies by subsidy-type in each sector, as presented in Table 4.
We then use a RAS procedure20
to adjust the initial matrices, so as to ensure they meet the targets described
above.
Finally, we allocate subsidies by 37 sectors to 63 commodity and 63 industry, by multiplying the subsidies
for 37 sectors by the shares of 63 commodities and 63 industries in the corresponding 37 sectors.
18
ISTAT, Conti ed aggregati economici delle Amministrazioni pubbliche: Tavola 19 - Contributi alla produzione erogati dalle amministrazioni pubbliche e dall'Unione Europea per branca di attività economica, anno 2008. Downloaded at http://www.istat.it/it/archivio/63156). 19
We base an initial disaggregation of the total value of each of the 37 subsidies by subsidy-type on initial guesses, made up on the basis of gathered information on the categories of subsidies granted in Italy, as well as on ISTAT data on subsidies by 9 aggregated industries for 2000, found at: Metodologia di stima degli aggregati dei conti nazionali a prezzi correnti. Anno base 2000", Prospetto 3.25 and 3.25 bis, ISTAT. Downloaded at http://www3.istat.it/dati/catalogo/20120207\_00. 20
In preparing data for a CGE model, the need often arises to adjust a matrix so that it sums to given row and column totals. The RAS method, first developed by Stone (1961) on an economic ground, among others, such as the residuals sink and Stone-Champernowne-Meade (SCM) methods, meets this need. The RAS procedure sequentially adjusts rows and columns in a proportional way, by means of a multiplicative scale factors, until both of them add up to given targets. In doing so, the RAS method features two properties bear noting: signs and zero flows are preserved. Generally the procedure converges after a reasonable number of iteration, however in the literature there are examples of non-convergence when the matrix is too sparse.

11
Table 4. Subsidy by 37 aggregate sector (EUR million)
Sector 1.Total
subsidy
Assumed proportion allocated to
2.Products 3.Production
Agriculture, forestry and fishing 4,310 0.2 0.8
Mining and quarrying 8 0 1
Manufacture of food products, beverages and tobacco products 984 0.5 0.5
Manufacture of textiles, wearing apparel and leather products 107 0.87 0.13
Manufacture of wood, paper and publishing 88 0.5 0.5
Manufacture of coke and refined petroleum products 7 0.9 0.1
Chemicals 57 0.8 0.2
Pharmaceuticals 17 0.5 0.5
Rubber and Plastic and other non-metallic mineral products 71 0.8 0.2
Manufacture of basic metals, manufacture of fabricated metal
products, except machinery and equipment
178 0.8 0.2
Manufacture of computer, electronic and optical products 40 0.8 0.2
Manufacture of electrical equipment 34 0.8 0.2
Manufacture of machinery and equipment n.e.c 133 0.4 0.6
Manufacture of transports 162 0.3 0.7
Manufacture of furniture; equipment repair and instalation; other
manufacturing
58 0.8 0.2
Electricity, gas, steam and air conditioning 29 0.85 0.15
Water and waste management 51 0.2 0.8
Construction 11 0.6 0.4
Wholesale and retail trade; repair of motor vehicles and motorcycles 978 0 1
Transportation and storage 10,828 0.9 0.1
Accommodation and food service activities 71 0.6 0.4
Publishing activities and media film 408 1 0
Telecommunications 69 1 0
Computer programming, consultancy and related activities;
information service activities
0 0 1
Financial and insurance activities 0 0 1
Real estate activities 173 1 0
Legal and accounting activities; activities of head offices; management
consultancy activities. Architectural and engineering activities;
technical testing and analysis
1 1 0
Scientific research and development 9 1 0
Advertising and market research 12 1 0
Administrative and support service activities 532 0.5 0.5
Public administration and defence; compulsory social security 0 0.3 0.7
Education 1,525 1 0
Health services 9 1 0
Social work activities 6 1 0
Arts, entertainment and recreation 57 1 0
Other services 1 1 0
Activities of households as employers; household own-production 0 0 1
Total 21,024 0.592 0.408
(Source: ISTAT, Conti ed aggregati economici delle Amministrazioni pubbliche: Tavola 19 - Contributi alla
produzione erogati dalle amministrazioni pubbliche e dall'Unione Europea per branca di attività economica, anno 2008,
http://www.istat.it/it/archivio/63156)
The entire procedure is illustrated in Figure 3. In the figure, highlighted rectangular boxes indicate outputs,
other rectangular boxes indicate inputs, and diamonds indicate calculation procedure.

12
Figure 3. Steps in the creation of subsidy matrices
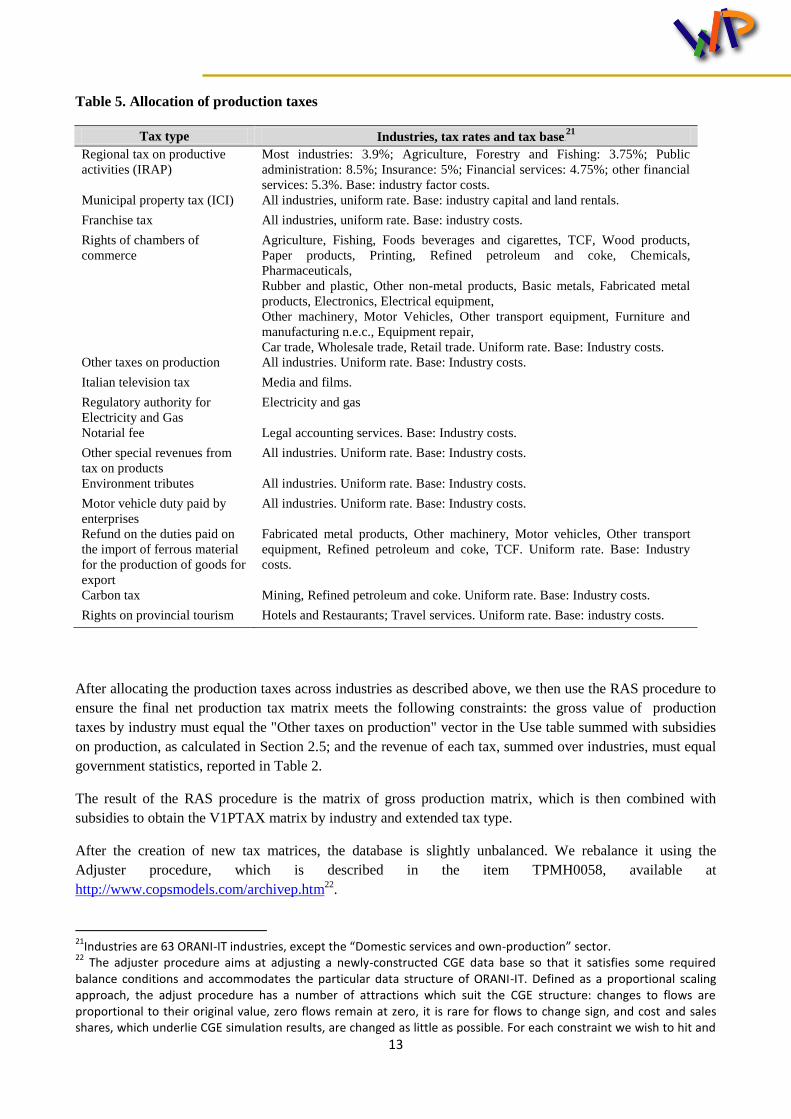
2.6 The production taxes matrix
Production taxes are allocated to different industries based on tax legislation, as reported in Table 5. First,
initial estimates are made for industry-specific production taxes by multiplying the tax rates with the tax
base, which in most cases, are industry value added. The revenue from production tax type levied on industry
I,
is calculated as:
∑
(2)
Where:
ptREV is total revenue from production tax type as reported in government statistics (Table 2);
pt
iTBASE is the tax base on which the tax pt is levied. Typically, it is the total industry pre-
production tax production costs. For some taxes, such as the Regional tax on productive activities,
the tax base is industry factor costs (hereafter value added).
pt
iLR is the legal rate of the tax pt on industry i.
As can be seen from Table 5, for many taxes, the rate is assumed to be uniform across industries.
Subsidies for 37 aggregate sectors
Subsidies for 37 aggregate commodity sectors
Total subsidies on products
Assumed shares of subsidies on products and production in each
of the 37 aggregate sectors
Total subsidies on production pproductionproductionproductio
Subsidies for 37 aggregate production sector
Share of 63 ORANI-IT commodities in 37 commodity sectors
Subsidies for 63 ORANI-IT commodities
Share of 63 ORANI-IT industries in 37
production sectors
Subsidies for 63 ORANI-IT industries
Step 2
RAS
Initial estimate of subsidies for 37 aggregate commodity
sectors
Initial estimate of subsidies for 37 aggregate production sectors
Step 1
13
Table 5. Allocation of production taxes
Tax type Industries, tax rates and tax base 9F
21
Regional tax on productive
activities (IRAP)
Most industries: 3.9%; Agriculture, Forestry and Fishing: 3.75%; Public
administration: 8.5%; Insurance: 5%; Financial services: 4.75%; other financial
services: 5.3%. Base: industry factor costs.
Municipal property tax (ICI) All industries, uniform rate. Base: industry capital and land rentals.
Franchise tax All industries, uniform rate. Base: industry costs.
Rights of chambers of
commerce
Agriculture, Fishing, Foods beverages and cigarettes, TCF, Wood products,
Paper products, Printing, Refined petroleum and coke, Chemicals,
Pharmaceuticals,
Rubber and plastic, Other non-metal products, Basic metals, Fabricated metal
products, Electronics, Electrical equipment,
Other machinery, Motor Vehicles, Other transport equipment, Furniture and
manufacturing n.e.c., Equipment repair,
Car trade, Wholesale trade, Retail trade. Uniform rate. Base: Industry costs.
Other taxes on production All industries. Uniform rate. Base: Industry costs.
Italian television tax Media and films.
Regulatory authority for
Electricity and Gas
Electricity and gas
Notarial fee Legal accounting services. Base: Industry costs.
Other special revenues from
tax on products
All industries. Uniform rate. Base: Industry costs.
Environment tributes All industries. Uniform rate. Base: Industry costs.
Motor vehicle duty paid by
enterprises
All industries. Uniform rate. Base: Industry costs.
Refund on the duties paid on
the import of ferrous material
for the production of goods for
export
Fabricated metal products, Other machinery, Motor vehicles, Other transport
equipment, Refined petroleum and coke, TCF. Uniform rate. Base: Industry
costs.
Carbon tax Mining, Refined petroleum and coke. Uniform rate. Base: Industry costs.
Rights on provincial tourism Hotels and Restaurants; Travel services. Uniform rate. Base: industry costs.
After allocating the production taxes across industries as described above, we then use the RAS procedure to
ensure the final net production tax matrix meets the following constraints: the gross value of production
taxes by industry must equal the "Other taxes on production" vector in the Use table summed with subsidies
on production, as calculated in Section 2.5; and the revenue of each tax, summed over industries, must equal
government statistics, reported in Table 2.
The result of the RAS procedure is the matrix of gross production matrix, which is then combined with
subsidies to obtain the V1PTAX matrix by industry and extended tax type.
After the creation of new tax matrices, the database is slightly unbalanced. We rebalance it using the
Adjuster procedure, which is described in the item TPMH0058, available at
http://www.copsmodels.com/archivep.htm22
.
21
Industries are 63 ORANI-IT industries, except the “Domestic services and own-production” sector. 22
The adjuster procedure aims at adjusting a newly-constructed CGE data base so that it satisfies some required balance conditions and accommodates the particular data structure of ORANI-IT. Defined as a proportional scaling approach, the adjust procedure has a number of attractions which suit the CGE structure: changes to flows are proportional to their original value, zero flows remain at zero, it is rare for flows to change sign, and cost and sales shares, which underlie CGE simulation results, are changed as little as possible. For each constraint we wish to hit and

14
The procedure to create the final production taxes matrix is reported in Figure 4.
Figure 4. Creating final production tax matrix
3 The value-added-tax (VAT) matrix
As shown in table 1, the Value-Added-Tax (VAT) accounts for over half of all revenues from commodity
taxes, and for over forty per cent of all indirect taxes. Given the current and potential weight of VAT in the
government revenues collection, we put a special effort into its modelling, in order to correctly reproduce its
complex structure - made of multiple tax rates, exemptions, refundability factors and compliance rates - that
makes the VAT incidence greatly differ between users and commodities.
3.1 The EU VAT legislative framework
The Italian VAT legislative framework23
incorporates principles stated in the European common VAT
System Directive (2006/112/EC). To picture the legislative framework, we briefly recall key articles of the
EU VAT legislation. Reporting Art. 2(2): “The principle of the common system of VAT entails the
application to goods and services of a general tax on consumption exactly proportional to the price of the
goods and services...”. The tax is designed to be borne ultimately by final consumers. Article 168, in fact,
recognizes “...[the right of deduction] of the amount of VAT directly borne out of the various cost
components of the production and distribution process before final consumption. However, art. 168 applies
only to taxed transactions of taxable subjects. Hence, exemption of certain sectors and of certain goods and
services may prevent firms from deducting the entire amount of VAT paid on inputs. These input taxes cause
the so called “tax cascading effect”, with positive tax rates borne by all producers using exempt goods.
for each balance condition that must be enforced, we include an endogenous or slack variable which adjusts so that the constraint is satisfied. Associate scale factors with each matrix define the transformation to be applied. In terms of comparison, the approach suggested here overcomes a key disadvantage of other RAS and other iterative scaling approaches, by handling a range of different targets. Contrarily to the RAS method, where each scale factor is adjusted so as to meet one constraint only, the Adjuster procedure simultaneously applies all the constraints and determines all the multipliers, taking full account of all interactions. In that sense it is more efficient, although it does require solution of a linear system, of rank similar to the number of constraints. 23
Istituzione e disciplina dell'imposta sul valore aggiunto, DPR 633/72.
V1PTAX(i,t)
(iIND, tPT)
RAS
Initial production tax matrix by industry and tax type
Taxes by industry and tax types
Combine
Government statistics on tax
revenues, by tax type
The net production tax by industry in the Use table
Gross production tax by industry
Production subsidy by industry
+

15
If the refundability issue is spread in other VAT systems, a special framework has been set up for public
bodies within the EU legislation. Article 13(1) of the VAT Directive sets a dispensation to the general
principle that every supply is taxable for VAT: ”...[government authorities and bodies] shall not be regarded
as taxable persons in respect of the activities or transactions in which they engage as public authorities..”.
Closely related is Article 132, which lists exemptions for certain activities in the public interest. Examples
are medical care, education, public broadcasting, etc. It follows that, when an activity carried out by public
bodies falls within the scope of VAT but it is exempt, or when is outside the scope of tax, public producers
cannot claim input VAT, with the result of paying a positive rates on public goods bought from a taxable or
non-exempt seller. This means that in those sectors, which are not state monopolies, but are open to private
service offering (which is taxable), the missing input VAT deduction causes distortions on the input-side,
such as self-supply bias over outsourcing, disincentive to invest, tax cascading. Moreover, on the output-side,
when the public sector sells a public good on the market, unlike the private supplier, it doesn't charge VAT
on the final price, which results in a distortion of a level-playing field.
From the aforementioned articles, it follows that despite VAT is designed as a consumption tax, its burden is
effectively also borne by non-taxable and tax-exempt agents, as well-recognised by the relevant literature24
.
The current VAT arrangements for cross border supplies of goods stand out as being a weakness of the EU
legislation. Under the current EU VAT system, the taxation of trade features a differentiate discipline for
intra-Community and extra-Community trade, with a direct implication in term of VAT currently remitted on
exports at the borders. Exports of goods from the Community to third Countries are zero-rated. The zero-
rated supply results in no residual VAT in the final price, but still allowing firms to deduct the full amount of
VAT paid on inputs. For intra-EU trades, the tax regime for business-to-business trade in goods is regulated
by the destination principle, according to which the VAT payment is due by the taxable person in the
member State where the good arrives. However, with no borders, firms are left responsible for remitting net
VAT on the full value of their output sales, creating issues for compliance. By contrast, intra-EU supplies to
final consumers make the implementation of the destination principle difficult, so that the relative discipline
falls into two broad categories. For cross-border shopping and some sales taxed according to the origin
principle, the regulation equates intra-Community supplies to national supplies, so that exporters ends up
charging the national tax rate on their sells25
. For distance selling, the seller is required to register for VAT in
all member States to which it sells and to account for the destination country rate. However, this requirement
applies only above a certain threshold. Below the threshold the seller can choose whether to register or
whether to account for VAT according to the origin principle. We did not explicitly account for the rules
governing the trade in services. However, at the present the trade of services has increased rapidly, so some
rules has been set up to account for services. In particular, business-to-business trade follows the place of
supply rule, which means the customer's place of establishment. On the contrary, the default place of supply
for business-to-consumers services is the supplier's place of establishment.
The legislative overview has shed light on several weaknesses of the current VAT system, noting that if the
problem related to exemptions is common to many other VAT systems, the non-taxable public sector and the
differentiate taxation of exports are specific of the current European VAT framework.
24
The issue arising from tax-exempt agents was first explored analytically in Gottfried and Wiegard (1991), who found that the VAT was paid by all users, not just by households,. The authors found that in Germany in 1984, 63% of total VAT revenues fell on consumption expenditure, 21% on intermediate products and 16% on inputs to capital formation. Giesecke and Tran (2010) found a similar pattern for Vietnam, where the VAT collections from households, production and investment in 2005 were 63%, 28% and 8% respectively. 25
See VAT on traders, http://ec.europa.eu/taxation\_customs/taxation/vat/traders/intra\_community\_supplies.

16
3.2 The Value-Added-Tax model
In this section an explicit and all-embracing VAT model for Italy is developed. We expand on the
comprehensive and general VAT framework by Giesecke and Tran (2010, 2012), which models multi-
production, multiple VAT rates, multiple VAT exemptions, differential VAT registration rates, undeclared
imports, unclaimed VAT on tourist’s purchases and general and transaction-specific compliance rates.
Departing from the original work, we accommodate features of the Italian VAT system, namely: the no-
taxable public sector, and the differentiate taxation of intra-Community and extra-Community exports.
3.2.1 Legislative rates
The fiscal legislation represents the starting point for the allocation of tax revenues, with information about
tax rates, tax payers and tax bases. Differences in legislated VAT rates across commodities and users are
represented via LRc,u, a matrix of legislated VAT rates on sales of commodity c to user u. The modelled
economy assumes 130 users, comprised of 63 industries, 63 investors and four final users, namely:
households, export, government and stocks26
. Therefore, we evaluate a 63 commodity x 130 users LRc,u
matrix, through careful inspection of information on Italian VAT legislation (Istituzione e disciplina
dell’imposta sul valore aggiunto, DPR 633/72), which sets values for LRc,u at 0, 0.04, 0.1, and 0.2.
Legislated tax rates are specified for commodities at a more disaggregated level than that in our model. For
example, ORANI-IT has one Agriculture commodity, which contains different agricultural products, which
in turn bear different VAT rates. Where the legislated tax rates are more disaggregated than the
disaggregated commodity level in the model, a weighted average tax rate is computed, based on a guessed
share of each commodity component. The resulting average legal VAT rates differ across users, reflecting
differences in the commodity composition of their purchases.
Lastly, published data, even with very high levels of commodity and user detail, aggregate transactions with
different tax and exemption statuses under the legislated VAT code, altering the effective tax rate indicated
by law.
3.2.2 Legal and de-facto exemptions and the scope of VAT
As discussed in section 3.1, Italy allows VAT exemptions for certain services27
. We model the legal
exemptions via LEXc,s,u, a coefficient measuring the share of sales of commodity c from source s to user u
that are VAT exempt by law. For most flows the coefficient is zero. It has a non-zero value where the tax
code exempts from VAT some or all of the sales of commodity c to user u. In particular, partial exemption,
0<LEXc,s,u<1 derives from data aggregation.
Apart from legal exemptions, commodities can be exempt in practice if: the domestic producers of the goods
do not register for VAT; the producer is out of the scope of VAT; and/or the imported goods enter the
country informally, i.e. they are not declared for tax purposes. De facto VAT exemptions for commodities c
from source s (imported or domestic) is denoted as DEXc,s. These de factor exemptions involve several
features of the real economy. We discuss them in some detail below.
The de facto exemptions of informal imports, DEXc,import, is simply the proportion of imports not declared for
tax purposes, IMc.
(3)
26
The modelled users derive from the model's database, whose structure is briefly described in section 2.2. Please note that here “stock” is a different label for inventories. 27
Financial and insurance services, transactions related to the collection of taxes, lotteries, betting and gaming, certain transaction relating to civil dwellings and properties, postal services, cultural services, and certain real estate transaction.

17
The de-facto exemption of domestically produced goods, DEXc,dom, depends on the degree by which
industries producing the good register for VAT.
∑ (4)
Where:
SJc,i is industry i’s share of total output of commodity c;
REGi is the proportion of industry i’s production represented by firms registered for VAT or
within the scope of VAT. The coefficient is further described in the next section.
Taking the maximum value between the legal exemption rate LEXc,s,u and the de facto exemption rate
DEXc,s, the model captures the differential effective exemptions for commodity c from source s to user u,
denoted by the exemption factor EXc,s,u.
(5)
For example, Italy’s VAT law stipulates that lotteries are exempt, i.e. Lotteries,s,uLEX 1 , and via (5)
Lotteries,s,uEX 1 regardless of how many producers of financial services register for VAT (that is, regardless
of the value for Lotteries,domDEX 1 ).
3.2.3 Registration rate
The registration rate is a key coefficient, as it allows for the modelling of the de-facto exemptions and, in the
present framework, also of the scope of the VAT. This latter represents a big concern in the EU legislation
and its modelling represents a main contribution to the original model by Giesecke and Tran (2010, 2012).
(6)
As equation (6) shows, the registration rate depends on:
NRIi, the proportion of industry i’s output produced by businesses which do not register for VAT,
either because operating informally or because of the minimum regime; and
NTPSi, the proportion of industry i’s output produced by public bodies, which are non-taxable.
According to official data on tax revenues "Activities of households as employers; undifferentiated goods
and services producing activities of households for own use" industry records zero payments. The plausible
assumption that this industry does not register for VAT, i.e. operates informally, is made. In model terms this
translates in setting the coefficient NRIi for that industry equal to 1. The same coefficient captures the VAT
registration threshold, that in the Italian case applies to individuals that generate a turnover below 7.000 euro
per year. We set NRIi = 0.1 for that sectors, which tend to have small enterprises, such as agriculture,
forestry and fishing.
Via the inclusion of the new coefficient NTPSi, we allow for the distinction between public and private
producers in the supply of public goods. In such a way, we account for the complex VAT treatment of
public bodies, set up by Article 13 of the European VAT Directive28
.
28
We identify the following public goods: education, waste disposal, water, health, social works, post (for the share of USO services, represented by basic letter post and basic parcel post), broadcasting. We also include cultural services, which are taxable but tax-exempt. We assume NTPSi to be 1 for the public administration industry; NTPSi 0.6 for education, health, social works, post and art, library, betting industries; NTPSi 0.4 for waste treatment and water; and

18
3.2.4 The VAT treatment of public bodies and exemptions in the public interest
We recall that according to Articles 132 and 13 of the VAT Directive activities carried out by public bodies
can be: taxed, within the scope of VAT but exempt, and outside the scope of the tax.
If exemptions in the public interest are captured by the coefficient modelling legal exemptions, LEX; the
treatment of activities carried out outside the scope of the VAT, is captured via the inclusion of the
coefficient NPSIi into the existing formula for the registration rate.
The aim is to accommodate into the existing VAT framework those activities within the scope of VAT but
exempt and services performed outside the scope of the tax. As a result, we provide a comprehensive VAT
model for the EU, enabling the assessment of the taxation of the public sector.
3.2.5 The VAT refundability factor
When producer i buys input c from source s, it pays a VAT rate equivalent to the legislated rate less the
exemption proportion applicable to (c,s) and i. Industry i then reclaims this tax, but only to the extent input
(c,s) is used to produce non-exempt goods, and even then, only to the extent that firms in industry i are
registered for VAT. Industry i's capacity to reclaim VAT paid on inputs is modelled via the refund factor,
REFINDi, defined as the proportion of industry i's VAT payments on inputs to production that is refunded by
the tax authority:
∑ ∑ (8)
On the right-hand side of this formula, first it appears the VAT registration rate, in recognition that only
registered firms can reclaim VAT paid on their inputs, then three dimensions of industry i's sales, as
described below. First, what the industry produces, captured by SOc,u, which computes the share of total
output of industry i represented by output of commodity c. Second, to whom the industry sells, through SSc,u,
which computes the share of total sales of commodity c sold to user u. Third, the extent of non-exempt sale,
via .
The Italian VAT system allows for the refund of VAT paid on inputs into creation of fixed assets. The
following equation defines REFINVc,s,k, as the effective VAT refund rate on inputs of commodity c from
source s into capital formation by industry k:
(9)
Where:
is the legal refund rate for VAT paid on inputs of (c,s) to capital formation by industry k.
Equation (9) recognizes that the effective refund rate for industry k depends not only on the legal refund rate
allowed by the tax authority , but also on industry k's registration rate. This is assumed not to be the
case for the real estate sector, because final consumers cannot claim VAT on their investment. Therefore, no
refund is assumed for this industry.
3.2.6 Effective VAT rates
For producers, the effective VAT rates depend on the legal VAT refundability, and on the exemption rate of
their outputs. In addition, the calculation of these rates is complicated by the multi-production nature of the
economy. In math, the effective VAT rates paid by industry i on intermediate good c can be calculated as the
product of the legal rate and the proportion of good that is not exempt, and by the refundability factor:
NTPSi =0.3 for broadcasting. In assuming these shares we consider the public and private producers' shares of core functions, as formulated by Copenhagen Economics (2013) on the basis of GTAP and Amadeus databases.

19
[ ] (10)
The effective VAT rate on commodity c from source s used in investment in industry k is:
[ ] (11)
3.2.6.1 Effective VAT rate of exports
In modelling the effective rate of exports we deal with the differentiate EU discipline puts in place for the
taxation of trade, as described in section 3.1. In particular, the modelling differs depending on whether: the
trade is intra-EU or extra-EU, the intra-EU trade is towards another producer or a final user, and the intra-EU
trade towards consumer is above or below a certain sales’ threshold. In addition, exports can still be subject
to VAT in case of purchases of domestic goods by tourists or other non-residents.
It follows that the effective tax rate on exports is modelled as the weighted average between the effective tax
rate paid by non-residents inside the country and the tax rate paid on exports, which in turn is a weighted
average of the effective tax rate paid on exports to VAT registered customers and the rate paid on exports to
VAT non-registered customers. Equation (12) expresses this in math:
[ ]
[ ] [ ] (12)
Where:
SHNRESc,s is the share of export sales of commodity (c,s) representing domestic sales to non-
resident agents (such as tourists). Italian SUT for 2008 provide the total value of domestic purchases
by non-residents. We allocate it among goods which are commonly consumed by tourists, such as
foods, beverages and tobacco, clothing and footwear, refined petroleum, pharmaceuticals,
electronics, motor vehicles, transports, hotel and restaurants. The resulting shares is 14 percent;
SHXIc,s and SHXFc,s are the shares of exports to outside of Italy to VAT-registered customers and
VAT non-registered customers respectively. These shares were calculated by using the international
trade data from the GTAP database for 200729
;
EXc,s,hous and EXc,s,exp are the exemption rates on commodity sold to households and to exports
respectively;
REFEXPc is the proportion of VAT paid by non-residents on purchases of commodity c that is
reclaimable under the country's VAT refund scheme. We set the value at 0.9 for all commodities;
and
LRc,s,hous and LRc,s,exp are the legal VAT rates on payable by households and exports respectively.
In summary, we model the VAT collections from exports as comprising of the following three components.
VAT payments by non-residents on their purchases in the Country, at the domestic households' effective
rates. Recognizing that this represents an application of VAT to exports, Italy provides for some refund of
this VAT at the time of the non-resident's departure. Such VAT refund schemes typically only cover a part of
the purchases made by domestic non-residents, and even then, many non-residents may fail to claim their full
VAT refund entitlement. VAT payments on exports to VAT-registered customers within the EU, and to non-
EU countries. These exports are zero-rated. VAT payable on exports to customers in other EU states who are
not registered for VAT. These customers pay the same rates as domestic consumers.
29
Global Trade Analysis Project, Narayana and Warmsley 2008.

20
3.2.7 Expected VAT revenues
Equations 1 to 12 embody the key features of the VAT system. We use them to estimate the expected tax
revenues by multiplying the effective tax rates by the relevant tax base, where the relevant VAT base is the
basic value plus trade and transport margins for each of the flows of commodity c from source s to user u:
(13)
However, the expected VAT revenues can differ from the actual VAT collections, as reported in government
financial statistics, because of a less-than-100% compliance rate. The degree of compliance in the collection
of VAT payable on sales of commodity c from source s to user u is denoted by the transaction-specific
compliance rate CRTc,s,u. Due to lack of data, we assumed an uniform full compliance rate across
commodity, source and users. Consequently, the total expected VAT collections in the economy is:
∑ ∑ (14)
At the moment we only have data on the total VAT collection. The gap between expected and actual VAT
revenues is attributed to the economy-wide overall compliance rate, denoted by a common coefficient CRgen.
We compute it according the following formula:
(15)
The economy-wide compliance rate is then used to adjust all expected VAT flows, so to ensure that the total
values of VAT in our database is the same as that provided in government statistics:
(16)
The VAT model, designed in terms of equations, translates into a commodity by user matrix of VAT
payments, that is consistent with both published input-output data and the tax code. Our calculations show
that in 2008 only 0.6 per cent of VAT collections is from consumption (including private and public
consumption and export), 0.35 per cent from production and the residual from investment. The economy-
wide compliance rate equals 0.58.
Equations are then integrated into the existing core model. By placing the system of equations that computes
the effective tax rates into the model, the following variables are endogenously calculate: effective VAT
rates applying to flows of commodity c to user u; and current production refund factors, given (a)
exogenously specified values for legislated VAT rates; (b) exemption factors ; and (c) capital formation
refund factors.

21
T
ab
le 6
. N
ati
on
al
inco
me
acc
ou
nts
Item
Go
ver
nm
ent
Hou
seh
old
s N
et
pay
men
t to
RoW
Tota
l
econ
om
y1
2F
30
Ho
w t
hey
are
in
clud
ed i
n t
he
mod
el
Res
ou
rces
U
ses
Res
ou
rces
U
ses
(1
) (2
) (3
) (4
) (5
) (6
) (7
)
Gro
ss o
per
atin
g
surp
lus
(GO
S)
27,7
10
0
689
,45
5
0
0
717
,16
6
All
oca
ted
acr
oss
cap
ital
an
d l
and
in
com
e b
y i
nd
ust
ry (
V1
CA
P +
V1
LN
D)
bas
ed o
n g
over
nm
ent
and
pri
vat
e sh
ares
in
th
e in
du
stri
es.
Cu
rren
t ad
op
ted v
alu
es f
or
gover
nm
ent
shar
es a
re:
10
0%
in P
ub
lic
adm
inis
trat
ion,
60%
in E
duca
tion,
Was
te t
reat
men
t an
d W
ater
, an
d 3
0%
in
Ela
stic
ity a
nd g
as,
Lan
d a
nd
Wat
er t
ran
sport
atio
n,
and
Tra
nsp
ort
ser
vic
es.
Com
pen
sati
on
of
emp
loyee
s (C
OE
)
0
0
658
,89
0
0
-848
658
,89
0
V1
LA
B i
n t
he
mod
el
Net
ind
irec
t ta
xes
2
15
,84
2
16,1
07
0
0
201
199
,93
6
Alr
ead
y i
n t
he
mod
el (
taxes
on
pro
duct
s an
d p
rodu
ctio
n)
GD
P
227
,44
5
1
,348
,34
5
-6
48
1,5
75
,14
3
Cal
cula
ted
as
sum
of
GO
S,
CO
E a
nd
net
ind
irec
t ta
xes
.
Inves
tmen
t in
com
e
0
74,6
96
42,0
41
-13
,69
6
18,9
59
In
clu
de
inte
rest
pay
men
t, d
ivid
end
s an
d r
ein
ves
ted
ear
nin
gs.
Mod
elle
d a
s p
aym
ent
on
net
dom
esti
c an
d n
et
fore
ign
lia
bil
itie
s. S
ee d
iscu
ssio
n i
n S
ecti
on 4
.2.
Item
s in
this
row
corr
esp
on
d t
o i
tem
s nu
mb
er 1
0,
11
, 7 a
nd 2
in
Tab
le 1
0).
Insu
ran
ce I
nco
me
0
0
1,1
26
0
-1,1
26
A
ssu
med
to a
ccru
e to
hou
seh
old
s an
d t
o m
ove
wit
h v
alu
e ad
ded
in
th
e in
sura
nce
indu
stry
Ren
ts a
nd p
rop
erty
righ
ts f
rom
dep
osi
ts
3,7
21
41
0
3,6
80
0
L
ink
ed m
ain
ly t
o t
he
gro
ss o
per
atin
g s
urp
lus
(GO
S)
in t
he
min
ing i
ndust
ry (
80
%),
and
als
o t
o t
he
gro
ss
op
erat
ing s
urp
lus
in a
ll o
ther
sec
tors
(2
0%
).
GN
I 1
56
,42
9
1
,401
,52
9
0
1,5
57
,95
7
Fo
r g
ov
ern
men
t an
d h
ou
seh
old
s: c
alcu
late
d a
s G
DP
plu
s n
et i
nves
tmen
t in
com
e, i
nsu
ran
ce i
nco
me
and
ren
t an
d p
rop
erty
rig
hts
fro
m d
eposi
ts.
Fo
r th
e w
hole
eco
nom
y:
calc
ula
ted
as
nat
ional
GD
P p
lus
foll
ow
ing n
et p
aym
ents
to t
he
worl
d:
CO
E,
net
ind
irec
t ta
xes
, in
ves
tmen
t in
com
e, i
nsu
ran
ce i
nco
me,
ren
ts a
nd
pro
per
ty r
igh
ts f
rom
dep
osi
t.
IRP
EF
(P
erso
nal
in
com
e ta
x)
171
,14
7
0
0
171
,14
7
0
M
od
elle
d a
s a
tax o
n t
he
thre
e fo
llo
win
g c
om
pon
ents
of
hou
seh
old
in
com
e: (
1)
lab
ou
r in
com
e af
ter
soci
al
con
trib
uti
on;
(2)
the
mix
ed i
nco
me
par
t of
GO
S;
and
(3
) p
ensi
on
s an
d n
et t
ran
sfer
s.
ISO
S
13,8
13
0
0
12,4
92
-1,3
21
Mod
elle
d a
s a
tax o
n i
nte
rest
an
d d
ivid
end
s re
ceiv
able
by h
ou
seh
old
s. I
nte
rest
is
the
inte
rest
pay
men
t to
hou
seh
old
s fr
om
gover
nm
ent
dom
esti
c d
ebt.
D
ivid
end
s ar
e ca
lcu
late
d
as
net
op
erat
ing
surp
lus
(NO
S)
mu
ltip
lied
wit
h a
div
iden
ds/
NO
S r
atio
.
ICI
(bu
ildin
g
com
pon
ent)
5
80
0
0
580
0
Mod
elle
d a
s a
tax o
n t
he
val
ue
of
buil
din
gs
by a
ll i
ndu
stri
es.
Th
e sh
ares
of
bu
ildin
gs
in i
ndu
stry
cap
ital
sto
ck
are
curr
entl
y a
ssu
med
to r
ange
from
10
% f
or
pri
mar
y i
ndu
stri
es,
30
% f
or
man
ufa
ctu
rin
g a
nd
50
% f
or
serv
ices
.
Th
ese
shar
es c
an b
e ad
just
ed i
f dat
a bec
om
e av
aila
ble
.
IRE
S (
Corp
ora
te
inco
me
tax)
43,5
86
779
0
42,8
07
0
Mod
elle
d a
s a
tax o
n G
OS
. N
ote
th
at t
he
rati
os
of
this
tax
to t
he
val
ue
of
GO
S g
iven
(th
e fi
rst
row
of
this
Tab
le)
are
dif
fere
nt
for
go
ver
nm
ent
and
hou
seh
old
s (a
t 2
.8%
and
6.2
% r
esp
ecti
vel
y).
A
s th
e la
ws
stip
ula
te t
he
sam
e ta
x r
ate
for
all
indu
stri
es,
this
may
mea
n t
hat
th
e p
rop
ort
ion
of
net
acc
ou
nti
ng p
rofi
t in
GO
S i
s lo
wer
for
gov
ern
men
t en
terp
rise
s th
an f
or
pri
vat
e en
terp
rise
s. T
her
efore
, w
e fi
rst
calc
ula
te t
he
sam
e ta
x r
ate
for
all
30C
alcu
late
d f
or
key
ite
ms
on
ly.
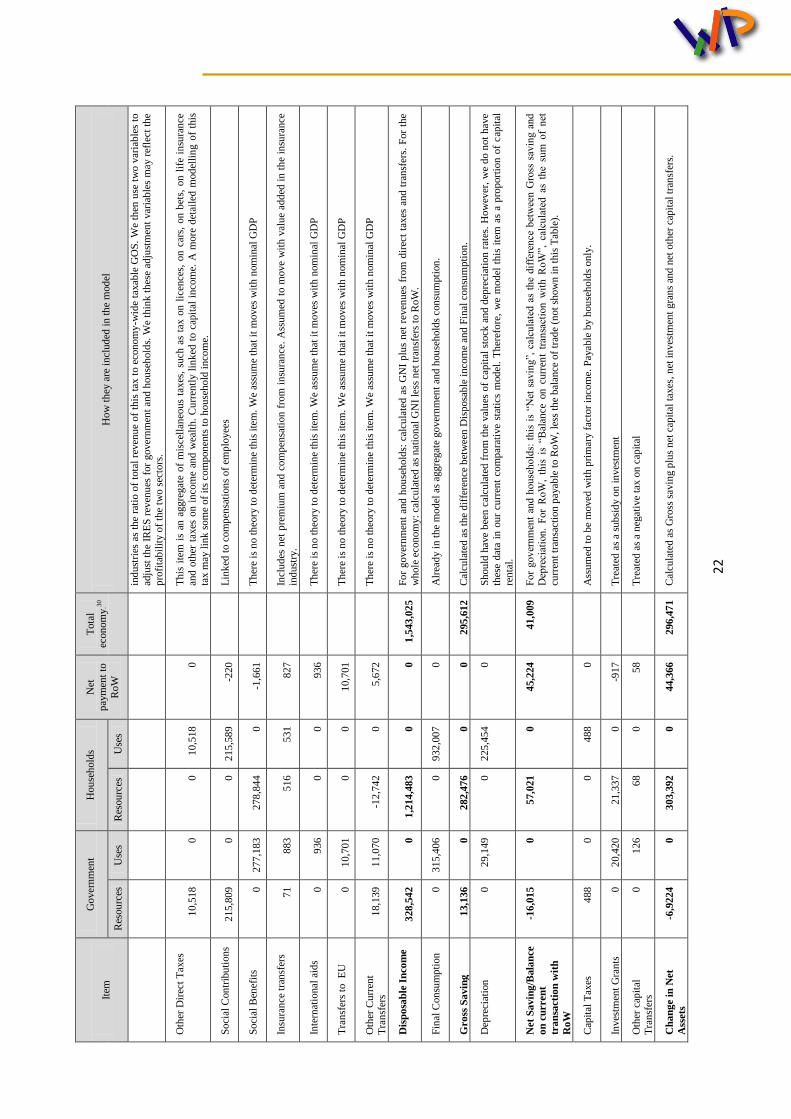
22
Item
Go
ver
nm
ent
Hou
seh
old
s N
et
pay
men
t to
RoW
Tota
l ec
on
om
y1
2F
30
Ho
w t
hey
are
in
clud
ed i
n t
he
mod
el
Res
ou
rces
U
ses
Res
ou
rces
U
ses
ind
ust
ries
as
the
rati
o o
f to
tal
reven
ue
of
this
tax
to e
con
om
y-w
ide
taxab
le G
OS
. W
e th
en u
se t
wo v
aria
ble
s to
adju
st t
he
IRE
S r
even
ues
for
gover
nm
ent
and
hou
seh
old
s. W
e th
ink
th
ese
adju
stm
ent
var
iab
les
may
ref
lect
th
e p
rofi
tab
ilit
y o
f th
e tw
o s
ecto
rs.
Oth
er D
irec
t T
axes
10,5
18
0
0
10,5
18
0
Th
is i
tem
is
an a
ggre
gat
e of
mis
cell
aneo
us
taxes
, su
ch a
s ta
x o
n l
icen
ces,
on
car
s, o
n b
ets,
on
lif
e in
sura
nce
and
oth
er t
axes
on
in
com
e an
d w
ealt
h.
Cu
rren
tly l
ink
ed t
o c
apit
al i
nco
me.
A m
ore
det
aile
d m
od
elli
ng o
f th
is
tax m
ay l
ink
som
e of
its
com
pon
ents
to h
ou
seh
old
inco
me.
Soci
al C
on
trib
uti
on
s 2
15
,80
9
0
0
215
,58
9
-220
L
ink
ed t
o c
om
pen
sati
on
s of
emp
loyee
s
Soci
al B
enef
its
0
277
,18
3
278
,84
4
0
-1,6
61
T
her
e is
no t
heo
ry t
o d
eter
min
e th
is i
tem
. W
e as
sum
e th
at i
t m
oves
wit
h n
om
inal
GD
P
Insu
ran
ce t
ran
sfer
s 7
1
883
516
531
827
In
clu
des
net
pre
miu
m a
nd
com
pen
sati
on
fro
m i
nsu
ran
ce.
Ass
um
ed t
o m
ove
wit
h v
alu
e ad
ded
in
th
e in
sura
nce
in
dust
ry.
Inte
rnat
ional
aid
s
0
936
0
0
936
T
her
e is
no t
heo
ry t
o d
eter
min
e th
is i
tem
. W
e as
sum
e th
at i
t m
oves
wit
h n
om
inal
GD
P
Tra
nsf
ers
to
EU
0
10,7
01
0
0
10,7
01
T
her
e is
no t
heo
ry t
o d
eter
min
e th
is i
tem
. W
e as
sum
e th
at i
t m
oves
wit
h n
om
inal
GD
P
Oth
er C
urr
ent
Tra
nsf
ers
18,1
39
11,0
70
-12
,74
2
0
5,6
72
T
her
e is
no t
heo
ry t
o d
eter
min
e th
is i
tem
. W
e as
sum
e th
at i
t m
oves
wit
h n
om
inal
GD
P
Dis
po
sab
le I
nco
me
328
,54
2
0
1,2
14
,48
3
0
0
1,5
43
,02
5
Fo
r g
ov
ern
men
t an
d h
ou
seh
old
s: c
alcu
late
d a
s G
NI
plu
s n
et r
even
ues
fro
m d
irec
t ta
xes
and
tra
nsf
ers.
For
the
wh
ole
eco
nom
y:
calc
ula
ted
as
nat
ional
GN
I le
ss n
et t
ran
sfer
s to
RoW
.
Fin
al C
on
sum
pti
on
0
315
,40
6
0
932
,00
7
0
A
lrea
dy i
n t
he
mod
el a
s ag
gre
gat
e go
ver
nm
ent
and h
ou
seh
old
s co
nsu
mpti
on
.
Gro
ss S
avin
g
13,1
36
0
282
,47
6
0
0
295
,61
2
Cal
cula
ted
as
the
dif
fere
nce
bet
wee
n D
isp
osa
ble
inco
me
and
Fin
al c
on
sum
pti
on
.
Dep
reci
atio
n
0
29,1
49
0
225
,45
4
0
S
hou
ld h
ave
bee
n c
alcu
late
d f
rom
th
e val
ues
of
cap
ital
sto
ck a
nd
dep
reci
atio
n r
ates
. H
ow
ever
, w
e d
o n
ot
hav
e th
ese
dat
a in
ou
r cu
rren
t co
mp
arat
ive
stat
ics
mod
el.
Th
eref
ore
, w
e m
od
el t
his
ite
m a
s a
pro
port
ion o
f c
apit
al
ren
tal.
Net
Sa
vin
g/B
ala
nce
on
cu
rren
t
tra
nsa
cti
on
wit
h
Ro
W
-16
,01
5
0
57,0
21
0
45,2
24
41,0
09
Fo
r gov
ern
men
t an
d h
ou
seh
old
s: t
his
is
“Net
sav
ing”,
cal
cula
ted a
s th
e dif
fere
nce
bet
wee
n G
ross
sav
ing a
nd
Dep
reci
atio
n.
For
RoW
, th
is i
s “B
alan
ce o
n c
urr
ent
tran
sact
ion w
ith R
oW
”, c
alcu
late
d a
s th
e su
m o
f n
et
curr
ent
tran
sact
ion
pay
able
to R
oW
, le
ss t
he
bal
ance
of
trad
e (n
ot
show
n i
n t
his
Tab
le).
Cap
ital
Tax
es
488
0
0
488
0
A
ssu
med
to b
e m
oved
wit
h p
rim
ary f
acto
r in
com
e. P
ayab
le b
y h
ou
seh
old
s on
ly.
Inves
tmen
t G
ran
ts
0
20,4
20
21,3
37
0
-917
T
reat
ed a
s a
sub
sid
y o
n i
nves
tmen
t
Oth
er c
apit
al
Tra
nsf
ers
0
126
68
0
58
T
reat
ed a
s a
neg
ativ
e ta
x o
n c
apit
al
Ch
an
ge
in N
et
Ass
ets
-6,9
22
4
0
303
,39
2
0
44,3
66
296
,47
1
Cal
cula
ted
as
Gro
ss s
avin
g p
lus
net
cap
ital
tax
es,
net
in
ves
tmen
t gra
ns
and
net
oth
er c
apit
al t
ran
sfer
s.

23
Item
Go
ver
nm
ent
Hou
seh
old
s N
et
pay
men
t to
RoW
Tota
l ec
on
om
y1
2F
30
Ho
w t
hey
are
in
clud
ed i
n t
he
mod
el
Res
ou
rces
U
ses
Res
ou
rces
U
ses
GC
F
0
35,2
25
0
305
,61
1
0
A
lrea
dy i
n t
he
mod
el a
s th
e su
m o
f in
ves
tmen
t an
d c
han
ges
in i
nven
tori
es.
To a
lloca
te t
he
aggre
gat
e G
CF
to
gov
ern
men
t an
d h
ou
seh
old
s, w
e u
se t
he
shar
e of
gover
nm
ent
in e
ach
indu
stry
to c
alcu
late
th
e in
itia
l val
ue
of
gov
ern
men
t in
ves
tmen
t, a
nd
th
en s
cale
th
e dat
a to
mee
t th
e N
A d
ata.
Hou
seh
old
GC
F i
s a
resi
dual
.
Ass
et A
cqu
isit
ion
0
-46
0
1,0
89
1,0
42
T
her
e is
no t
heo
ry t
o d
eter
min
e th
is i
tem
. W
e as
sum
e th
at i
t m
oves
wit
h n
om
inal
GD
P.
Net
Len
din
g/b
orr
ow
ing
req
uir
em
en
t
-42
,10
1
0
-3,3
07
0
45,4
08
-45
,40
8
Cal
cula
ted
as
the
dif
fere
nce
bet
wee
n C
han
ge
in N
et A
sset
s an
d (
net
GC
F +
net
ass
et a
cqu
isit
ion
). F
or
the
wh
ole
eco
nom
y,
the
chan
ge
in n
et b
orr
ow
ing r
equ
irem
ent
wit
h t
he
Wo
rld
in
th
e ch
ange
in t
he
econ
om
y's
net
fo
reig
n l
iab
ilit
ies.

24
4 Modelling national income accounts
The next step consists in deriving the national income accounts for the institutional agents, by referring to the
economic sectors accounts, released by ISTAT for 200831
. Table 6 reports the national income accounts as
implemented in the model, which differ from the published ISTAT data in four main aspects.
First, because the ORANI-IT model recognises only two NA sectors, namely government and households,
we group together the data for households, NPHIS, financial and non-financial institutions under the
“households” category. Values for this new households account are netted out to account for the internal
flows between households and industries.
Second, we disaggregate the item “taxes on income” into more detailed direct taxes. Data on direct tax
revenues are provided by ISTAT in "Accounts for general government"32
. Starting from the published data,
direct taxes have been aggregated following a legal schema, according to which households pay IRPEF and
ISOS, and industries pay IRPEF or IRES, depending on their legal structure. In particular, the proportion of
households in the total IRPEF payment was deducted by recalling data on IRPEF fiscal declaration, released
by the Ministry of Economy and Finance33
. Other taxes were computed as residual, using data on
households’ total indirect tax payments provided by ISTAT.
Third, we net out the values of RoW resources and RoW uses to get only the value of net payment to RoW.
This is because we only want to model Italy’s net transactions with the world.
Finally, we model only key items which have non-zero values. For example, we do not model the sub-items
“by the government” and “from other sectors”, which appear as a sub-item under many items in the NA, but
with only zero values.
Following the economic process, transactions, in goods and services and distributive transactions, are shown
in a sequence of accounts ranging from production, income generation and income redistribution, through
the use of income for consumption and saving, and through the investment, to financial transactions such as
borrowing and lending. Sector accounts are reproduced in the model with roughly the same break-down of
the official data, leading to the computation of key economic indicators for the institutional agents, such as
Gross Domestic Product (GDP), Gross National Income (GNI), disposable income and net lending.
More in details, government outlays have an impact on GDP, as they affect the demand directly through the
purchase of intermediate consumption goods, or indirectly via transfers and subsidies. Government incomes
encompass final revenues and financial transactions. Final revenues include: capital incomes, interests
income, indirect taxes, direct taxes and social contributions; international aids, current transfers, tax on
capital, investment grants and other capital transfers from household. Financial transactions capture changes
in the governments' net liabilities and represent the difference between government revenue and expenditure.
Turning to households, disposable income represents the key indicator, which consists of: primary factors
income, social benefit incomes, social security payments, direct taxes and other incomes. Household
financial assets consists of saving (net of investment) augmented with capital transfers.
Once all of the relevant national account items have been identified, we reproduce them into the model.
Specifically, we compute resources and uses back in terms of a tax base times an implicit tax rate, linking
them to the relevant variables in the model, so to reconcile the respective values. In order to impute the
31
Available at http://www.istat.it/it/archivio/58448. 32
Conti ed aggregati economici delle Amministrazioni pubbliche: Table 12, http://www.istat.it/it/archivio/63156. 33
Available at http://www.finanze.gov.it\/stat\_dbNew\/index.php.
.

25
resulting economic flows from domestic production across domestic agents, we assume shares of
government ownership in each of the industry. Receipts and expenses relating to various forms of property
income, such as interest, dividends and (land) rent; and incomes imputed to households on their reserves
with (life) insurance corporations and pension funds are carefully modelled. In particular, interest payments
and dividends are reconciled with net foreign liabilities and domestic debt. The procedure is explained in the
remainder of this section.
4.1 Investment income items, net foreign liabilities and government domestic debts
The national income account shows investments income, which is comprehensive of interest payments,
dividends and reinvested earnings, for each institutional agent, but no information is given regarding the
flows between the agents. For modelling purpose, these flows are reconstructed, relying on data on the stock
of debt and the net investment foreign position, and on plausible assumptions. We gather data on total
government and private net debt and on total and government net international investment position from the
Bank of Italy's database (BIP on-line: financial account by institution and international investment position
for 2008). We then compute the private net investment position and the domestic debt as residuals.
Table 7. Data and calculation of stock and interest payments on foreign and domestic liabilities
Item Value13F
34 Source
A. Data and calculation of stock and interest payments on net foreign liabilities
(1) Italy’s net foreign liabilities (NFL) 380,738 BIP on-line: financial account by
institution and international
investment position for 2008
(2) Total interest payment on NFL 18,958 BIP on-line: financial account by
institution and international
investment position for 2008
(3) Implied interest rate on NFL 4.98% =(2)/(1)
(4) Government net foreign debt 655,802 BIP on-line: financial account by
institution and international
investment position for 2008
(5) Private NFL -275,064 = (1) –(4)
(6) Interest payment on government NFL 32,655 = (4) * (3)
(7) Interest payment on private NFL -13,696 = (5) * (3)
B. Data and calculation of stock and interest payment on government domestic debt
(8) Government net debt (foreign + domestic ) 1,474,298 BI Financial account – stock at
31/12/2008, by institutional sector
(9) Government domestic debt 818,497 = (8) – (4)
(10) Government net investment income
payment
74,696 National income accounts
(11) Government interest payment on domestic
debt
42,041 =(10) – (6)
(12) Implied interest rate on domestic debt 5.14% = (10) / (9)
34
EU m, unless otherwise indicated.

26
We model investment income items in the national accounts as the product of the relevant stock and interest
rate. Specifically: government pays interest on its foreign debts and domestic debt, households pays
investment income (which include both interest and dividends) on its net foreign liabilities, and receive
interests on its loan to government, RoW receives investment income from both government and households
on Italy’s net foreign liabilities. These items (denoted by bold) are included in the “Investment income” row
of Table 6.
4.2 Direct taxes
Within the national account, direct taxes have been explicitly introduced into the model (Table 6). Using data
on tax revenues released by ISTAT35
, we further disaggregate the national account item “Current taxes on
income” into several direct taxes, as listed below.
The personal income tax IRPEF, which includes the individual tax charged by the central government
together with the regional and local surcharges. The substitute taxes on household capital income ISOS,
which includes various financial substitute taxes (with lower rates) on interests, dividends, capital gains and
other form of returns. The property tax on buildings ICI. The corporate income tax IRES, which is levied on
corporate income, regardless of its nature, of specific forms of corporation. Other taxes, which is computed
as a residual, using data on households' total indirect payments provided by ISTAT and includes a
miscellaneous of taxes levied on households and industries. Examples are: tax on capital assets, tax on
capital gains from enterprise disposal, tax on insurance industry, ILOR, taxes on cars, other taxes on income
and wealth, taxes on life insurance and supplement state pension, tax on prizes and winnings, tax on
insurance, tax on driving licenses.
Households pay the main income tax IRPEF together with withholding income taxes ISOS, with the aim of
differentiating the treatment of specific income types, in particular financial assets income. IRPEF is mostly
imposed on labour income at progressive tax rates, but the tax base includes also mixed income and social
benefits, after deducting social contributions. However, as the present model specifies a representative
household, we consider an implied tax rate. ISOS is modelled considering the domestic government debt and
its implied rate of return and the gross operating surplus. Industries pay IRPEF or IRES, depending on their
legal structure. In particular, the proportion of households in the total IRPEF payment was deducted by
recalling data on IRPEF fiscal declaration, released by the Ministry of Finance36
. IRES taxable income is
represented by the gross operating surplus, for the share of industries that pay proper business taxes, and
expenses are allocated between households and government by using government capital shares.
4.3 Modifying the core equations to incorporate new information
Enriching the model with new details requires the modification of the model structure, in order to make the
new variables working. As explained in section 2, a tax dimension has been added to the commodity and
production tax matrices. Additional shifters with tax dimension are then incorporated in the equations
describing the power of tax for commodity taxes, to allow tax-specific shocks. The system of equations
composing the core model is presented in the Tablo Appendix.
Next, the full VAT structure explained in the previous sections has been included into the model,
empowering the range of applicable simulations, dealing with tax rates, tax base, exemptions, refundability
factors, compliance rates. In particular, equations enabling the move from a multiple rate structure to a
uniform tax rate have been introduced in order to evaluate the impact of such a reform on the economy.
35
Conti ed aggregati economici delle Amministrazioni pubbliche: Table 6, ISTAT. http://www.istat.it/it/archivio/63156. 36
Available at http://www.finanze.gov.it\/stat\_dbNew\/index.php.
27
Thanks to the introductions of the tax dimension, exercises aimed at rebuilding the fiscal system, which can
be characterized by an asymmetric structure, can be run. However, when dealing with these simulations
directly affected is the government budget. Government account critically depends on collected revenues.
Equations for revenue-neutral simulations are then incorporated into the model, to allow simulations where
the fiscal burden is switched from one tax to another, with no effect on the government budget.
All equations describing institutional agents’ accounts were linearised and added into the model. The
incorporation of the national accounts into the model also enables many interesting simulations whereby
government and household expenditures can be linked to their revenues or disposable income, which are
affected by changes in policies relating to taxes, transfers, and changes to interest rates.
Overall, the model is a powerful tool for policy analysis.
5 Conclusion
This paper extends the national computable general equilibrium model of Italy via the addition of a
significant fiscal detail, which consists in the detailed modelling of a full range of direct and indirect taxes.
At the methodological level, the paper provides a framework for including a fiscal detail into an existing
CGE model. Data on tax revenues are accommodated within the CGE database structure and the full range of
indirect taxes are explicitly modelled within the model’s theoretical structure, via the inclusion of the tax
dimension into the commodity and production tax matrices. The result is an extremely detailed indirect tax
matrix by commodity, user, source and tax type, providing a powerful tool for policy analysis.
Within the development of the fiscal detail, the paper enlarges a framework for economy-wide modelling of
the value-added tax system specific to the EU. As it incorporates features of the current EU VAT system
that are considered significant weaknesses, it provides a comprehensive model of VAT, which enables the
assessment of the current EU rules.
The model also features a detailed modelling of national income accounts, where major groups of revenue
and expenditure items by government, households, and net transactions with the rest of the world, are linked
to relevant economic activities in the core model.
As a result the capacity of analysis of the national model is enriched, allowing for the analysis of a wide
range of fiscal policies, tracing their impacts not only on the economy, but also on the government budget,
household income and savings, and on the net lending/borrowing position of the nation. Further researches
may be pursued in policy simulations.

28
References
Copenhagen Economics, (2013). VAT in the Public Sector and Exemptions in the Public Interest, Final
Report for TAXUD/2011/DE/334.
European Commission, (2010). GREEN PAPER On the future of VAT. Towards a simpler, more robust and
efficient VAT system, COM(2010)695/4, Brussels.
European Commission, (2013). Review of existing VAT legislation on public bodies and tax exemptions in
the public interest, Consultation paper. Downloaded at http://ec.europa.eu/taxation
customs/common/consultations/tax/201 vat public bodies en.htm.
Fehr, H., Rosenberg, C., Wiegard, W., (1995). Welfare effects of value-added tax harmonization in Europe:
A computable general equilibrium analysis, Berlin: Springer-Verlag.
Felici, F., Gesualdo, M., (2014). ORANI-IT: A Computable General Equilibrium Model of Italy, Working
Paper no. 7, Department of the Treasury, Ministry of the Economy and of Finance.
Fullerton, D., Henderson, Y.K., Shoven, J.B., (1984). A comparison of methodologies in empirical general
equilibrium models of taxation, NBER Working Paper 911, Cambridge: National Bureau of Economic
Research.
Giesecke, J., Tran, N.H., (2010). Modelling Value-Added Tax in the Presence of Multiproduction and
Differentiated Exemptions, Journal of Asian Economics, Volume 21, Issue 2, April 2010, Pages 156-173.
Giesecke, J., Tran, N.H., (2012). A general framework for measuring VAT compliance rates, Applied
Economics, 44, 1867-1889.
Gottfried P. and Wiegard W. (1991). Exemption versus zero rating: a hidden problem of VAT, Journal of
Public Economics, 46, 307-328.
Institute for Fiscal Studies, (2011). A retrospective evaluation of elements of the EU VAT system Final
report, TAXUD/2010/DE/328, FWC No. TAXUD/2010/CC/104.
International Monetary Fund (IMF), (2012). Italy : The Delega Fiscale and the Strategic Orientation of Tax
Reform, Michael Keen, Ruud de Mooij, Luc Eyraud, Justin Tyson, Stephen Bond, and Lawrence Walters.
McLure, C.E., (1990). Income distribution and tax incidence under the VAT, In M.Gillis, C.S.Shoup, &
G.P.Sicat(Eds), Value added taxation in developing countries (pp. 32-40), Whashington; DC: The World
Bank.


Ministry of Economy and Finance
Department of the Treasury
Directorate I: Economic and Financial Analysis
Address: Via XX Settembre, 97 00187 - Rome Websites: www.mef.gov.it www.dt.tesoro.it e-mail: [email protected] Telephone: +39 06 47614202 +39 06 47614197 Fax:
+39 06 47821886