NON-TARIFF BARRIERS IN COMPUTABLE GENERAL EQUILIBRIUM ... · NON-TARIFF BARRIERS IN COMPUTABLE...
25
UNITED NATIONS CONFERENCE ON TRADE AND DEVELOPMENT POLICY ISSUES IN INTERNATIONAL TRADE AND COMMODITIES STUDY SERIES No. 38 NON-TARIFF BARRIERS IN COMPUTABLE GENERAL EQUILIBRIUM MODELLING by Marco Fugazza UNCTAD, Geneva and Jean-Christophe Maur Groupe d’Economie Mondiale, Paris and Department for International Development, London UNITED NATIONS New York and Geneva, 2008
Transcript of NON-TARIFF BARRIERS IN COMPUTABLE GENERAL EQUILIBRIUM ... · NON-TARIFF BARRIERS IN COMPUTABLE...
UNITED NATIONS CONFERENCE ON TRADE AND DEVELOPMENT
POLICY ISSUES IN INTERNATIONAL TRADE AND COMMODITIES
STUDY SERIES No. 38
NON-TARIFF BARRIERS IN COMPUTABLEGENERAL EQUILIBRIUM MODELLING
by
Marco FugazzaUNCTAD, Geneva
and
Jean-Christophe MaurGroupe d’Economie Mondiale, Paris
and Department for International Development, London
UNITED NATIONSNew York and Geneva, 2008
ii
NOTE
The purpose of this series of studies is to analyse policy issues and to stimulate discussions in the area of international trade and development. This series includes studies by UNCTAD staff , as well as by distinguished researchers from academia. In keeping with the objective of the series, authors are encouraged to express their own views, which do not necessarily refl ect the views of the United Nations or its member states.
The designations employed and the presentation of the material do not imply the expression of any opinion whatsoever on the part of the United Nations Secretariat concerning the legal status of any country, territory, city or area, or of its authorities, or concerning the delimitation of its frontiers or boundaries.
Material in this publication may be freely quoted or reprinted, but acknowledgement is requested, together with a reference to the document number. It would be appreciated if a copy of the publication containing the quotation or reprint were sent to the UNCTAD secretariat at the following address:
ChiefTrade Analysis Branch
Division on International Trade in Goods and Services, and CommoditiesUnited Nations Conference on Trade and Development
Palais des NationsCH-1211 Geneva
Series editorVictor Ognivtsev
Offi cer-in-charge, Trade Analysis Branch
UNCTAD/ITCD/TAB/39
UNITED NATIONS PUBLICATION
ISSN 1607-8291
© Copyright United Nations 2008All rights reserved
iii
ABSTRACT
With diminishing tariff s, the focus of trade policy makers and analysts is logically turning towards non-tariff barriers (NTBs), but there much remains to be done. It is well-know that tackling NTBs poses many challenges for the analyst because of their diverse and complex nature, and the lack of available evidence. NTBs pose also particular diffi culties to computable/applied general equilibrium (CGE) modelling, traditionally more comfortable with policies whose impact can be interpreted into direct eff ects on prices.
This research provides a quantifi cation of the impact of NTBs at the global level. The model we use is signifi cantly larger than in previous studies, and to our knowledge, the fi rst truly global one. The main focus of this research, however, is to discuss and question the various treatments of NTBs in CGE models with a specifi c application of the Global Trade Analysis Project (GTAP) standard model, the workhorse of trade policy CGE analysis.
We fi nd that serious estimation and modelling eff orts remain to be undertaken in order to make CGE modelling a useful policy tool to analyze NTBs. Casual policy inferences from loose specifi cations may indeed lead to serious analytical mistakes. We show that while using the same robust estimates of NTB incidence we obtain vastly diff erent results under diff erent model specifi cations.
Key Words: Non tariff barriers; Computable general equilibrium
JEL Classifi cation: C68; F13
iv
ACKNOWLEDGEMENTS
Comments by Tom Hertel, David Laborde, and participants in the Ninth Annual Conference on Global Economic Analysis in Addis Ababa and the Eighth Annual Conference of the European Trade Study Group in Vienna are gratefully acknowledged.
v
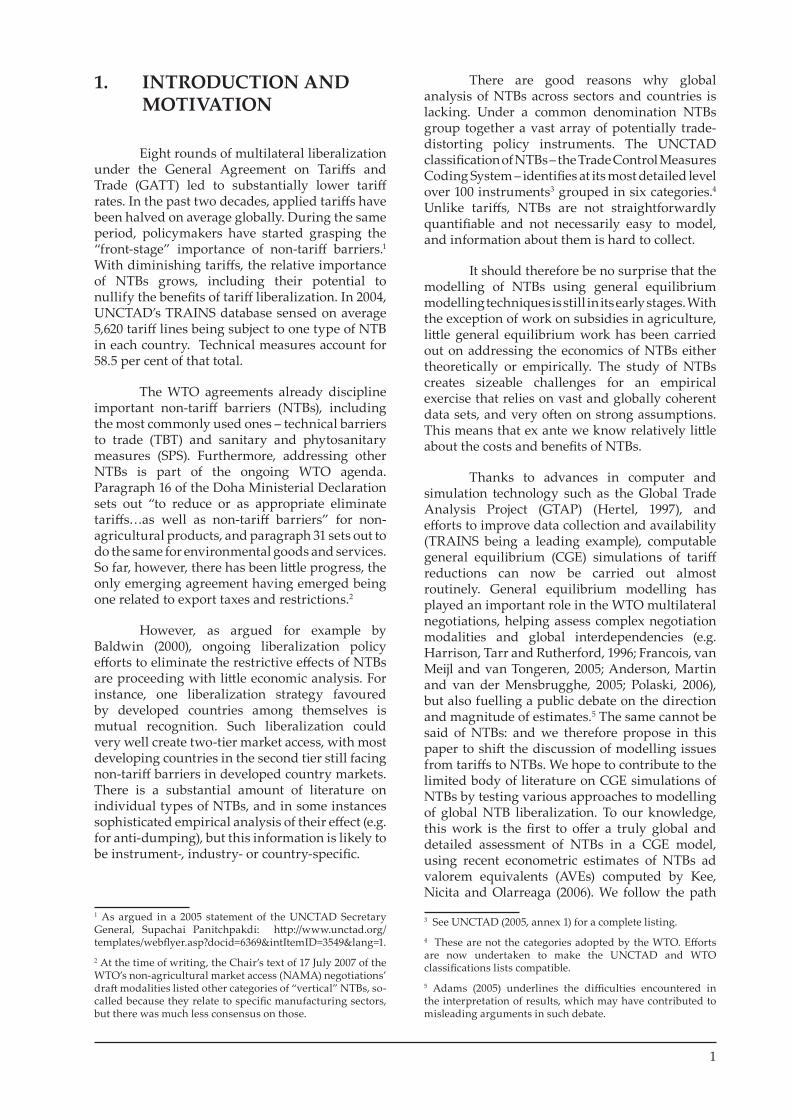
CONTENTS
1. INTRODUCTION AND MOTIVATION ............................................................................... 1
2. CGE MODELLING OF NTBs ................................................................................................... 2
2.1 Modelling in standard GTAP ........................................................................................... 3 2.2 A more diffi cult question for CGE modelling: the cost-raising eff ect of NTBs ......................................................................................... 4 2.3 Demand-shift and supply-shift eff ects ........................................................................... 4 2.4 Previous general equilibrium applications of the eff ect of non-tariff barriers ......... 5
3. THE EXPERIMENTS .................................................................................................................. 6
4. RESULTS ...................................................................................................................................... 9
4.1 Results of simulations ....................................................................................................... 9 4.2 A simple att empt at dealing with supply-shift eff ects, and further lessons on the choice of policy variables ...................................................................... 11
5. LESSONS FROM THE SIMULATIONS RESULT, AND CONCLUSIONS ............................................................................................................. 11
REFERENCES ......................................................................................................................................... 13
vi
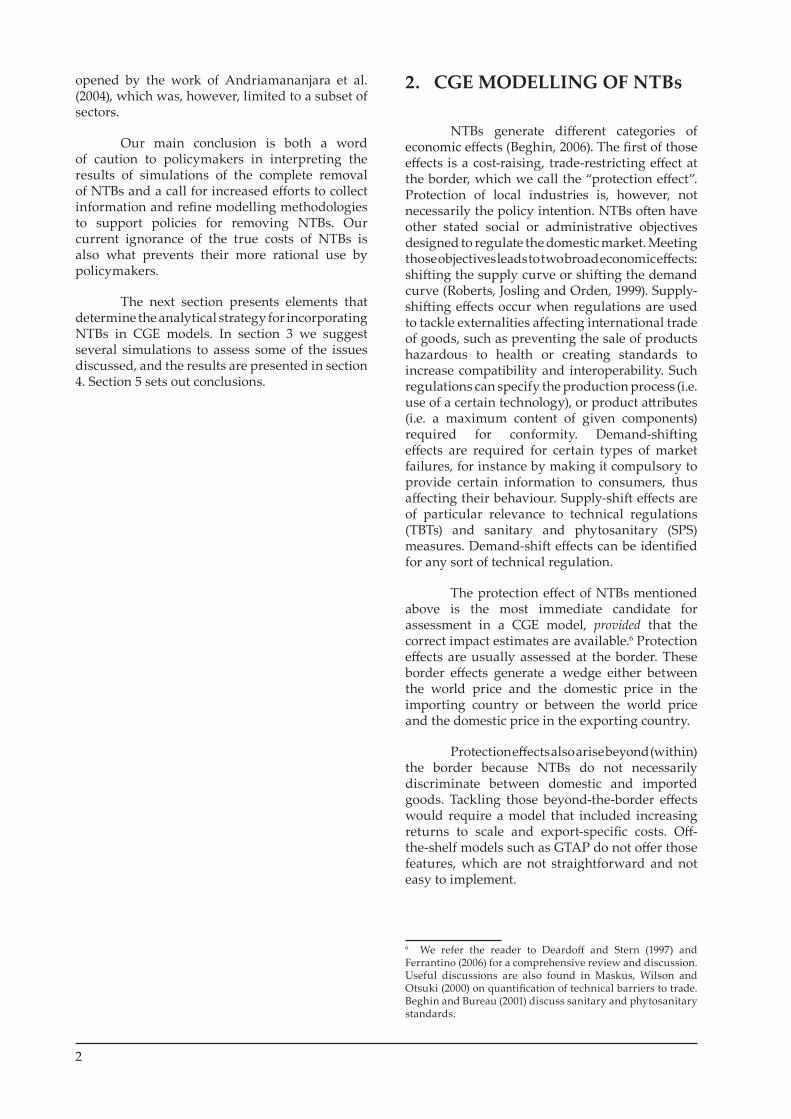
List of Figures
Figure 1. Share in total number of tariff lines aff ected by NTBs of rent-creating versus technical NTBs, by GTAP sector .........................................................................8Figure 2. Share in total number of tariff lines aff ected by NTBs of rent-creating versus technical NTBs, by GTAP region ........................................................................8
List of Tables
Table 1. Tariff s and ad valorem equivalent of NTBs, by GTAP region ....................................7Table 2. Equivalent variation (as percentage of GDP) ..............................................................10
1
1. INTRODUCTION AND MOTIVATION
Eight rounds of multilateral liberalization under the General Agreement on Tariff s and Trade (GATT) led to substantially lower tariff rates. In the past two decades, applied tariff s have been halved on average globally. During the same period, policymakers have started grasping the “front-stage” importance of non-tariff barriers.1 With diminishing tariff s, the relative importance of NTBs grows, including their potential to nullify the benefi ts of tariff liberalization. In 2004, UNCTAD’s TRAINS database sensed on average 5,620 tariff lines being subject to one type of NTB in each country. Technical measures account for 58.5 per cent of that total.
The WTO agreements already discipline important non-tariff barriers (NTBs), including the most commonly used ones – technical barriers to trade (TBT) and sanitary and phytosanitary measures (SPS). Furthermore, addressing other NTBs is part of the ongoing WTO agenda. Paragraph 16 of the Doha Ministerial Declaration sets out “to reduce or as appropriate eliminate tariff s…as well as non-tariff barriers” for non-agricultural products, and paragraph 31 sets out to do the same for environmental goods and services. So far, however, there has been litt le progress, the only emerging agreement having emerged being one related to export taxes and restrictions.2
However, as argued for example by Baldwin (2000), ongoing liberalization policy eff orts to eliminate the restrictive eff ects of NTBs are proceeding with litt le economic analysis. For instance, one liberalization strategy favoured by developed countries among themselves is mutual recognition. Such liberalization could very well create two-tier market access, with most developing countries in the second tier still facing non-tariff barriers in developed country markets. There is a substantial amount of literature on individual types of NTBs, and in some instances sophisticated empirical analysis of their eff ect (e.g. for anti-dumping), but this information is likely to be instrument-, industry- or country-specifi c.
1 As argued in a 2005 statement of the UNCTAD Secretary General, Supachai Panitchpakdi: htt p://www.unctad.org/templates/webfl yer.asp?docid=6369&intItemID=3549&lang=1.2 At the time of writing, the Chair’s text of 17 July 2007 of the WTO’s non-agricultural market access (NAMA) negotiations’ draft modalities listed other categories of “vertical” NTBs, so-called because they relate to specifi c manufacturing sectors, but there was much less consensus on those.
There are good reasons why global analysis of NTBs across sectors and countries is lacking. Under a common denomination NTBs group together a vast array of potentially trade-distorting policy instruments. The UNCTAD classifi cation of NTBs – the Trade Control Measures Coding System – identifi es at its most detailed level over 100 instruments3 grouped in six categories.4 Unlike tariff s, NTBs are not straightforwardly quantifi able and not necessarily easy to model, and information about them is hard to collect.
It should therefore be no surprise that the modelling of NTBs using general equilibrium modelling techniques is still in its early stages. With the exception of work on subsidies in agriculture, litt le general equilibrium work has been carried out on addressing the economics of NTBs either theoretically or empirically. The study of NTBs creates sizeable challenges for an empirical exercise that relies on vast and globally coherent data sets, and very oft en on strong assumptions. This means that ex ante we know relatively litt le about the costs and benefi ts of NTBs.
Thanks to advances in computer and simulation technology such as the Global Trade Analysis Project (GTAP) (Hertel, 1997), and eff orts to improve data collection and availability (TRAINS being a leading example), computable general equilibrium (CGE) simulations of tariff reductions can now be carried out almost routinely. General equilibrium modelling has played an important role in the WTO multilateral negotiations, helping assess complex negotiation modalities and global interdependencies (e.g. Harrison, Tarr and Rutherford, 1996; Francois, van Meij l and van Tongeren, 2005; Anderson, Martin and van der Mensbrugghe, 2005; Polaski, 2006), but also fuelling a public debate on the direction and magnitude of estimates.5 The same cannot be said of NTBs: and we therefore propose in this paper to shift the discussion of modelling issues from tariff s to NTBs. We hope to contribute to the limited body of literature on CGE simulations of NTBs by testing various approaches to modelling of global NTB liberalization. To our knowledge, this work is the fi rst to off er a truly global and detailed assessment of NTBs in a CGE model, using recent econometric estimates of NTBs ad valorem equivalents (AVEs) computed by Kee, Nicita and Olarreaga (2006). We follow the path
3 See UNCTAD (2005, annex 1) for a complete listing.4 These are not the categories adopted by the WTO. Eff orts are now undertaken to make the UNCTAD and WTO classifi cations lists compatible. 5 Adams (2005) underlines the diffi culties encountered in the interpretation of results, which may have contributed to misleading arguments in such debate.
2
opened by the work of Andriamananjara et al. (2004), which was, however, limited to a subset of sectors.
Our main conclusion is both a word of caution to policymakers in interpreting the results of simulations of the complete removal of NTBs and a call for increased eff orts to collect information and refi ne modelling methodologies to support policies for removing NTBs. Our current ignorance of the true costs of NTBs is also what prevents their more rational use by policymakers.
The next section presents elements that determine the analytical strategy for incorporating NTBs in CGE models. In section 3 we suggest several simulations to assess some of the issues discussed, and the results are presented in section 4. Section 5 sets out conclusions.
2. CGE MODELLING OF NTBs
NTBs generate diff erent categories of economic eff ects (Beghin, 2006). The fi rst of those eff ects is a cost-raising, trade-restricting eff ect at the border, which we call the “protection eff ect”. Protection of local industries is, however, not necessarily the policy intention. NTBs oft en have other stated social or administrative objectives designed to regulate the domestic market. Meeting those objectives leads to two broad economic eff ects: shift ing the supply curve or shift ing the demand curve (Roberts, Josling and Orden, 1999). Supply-shift ing eff ects occur when regulations are used to tackle externalities aff ecting international trade of goods, such as preventing the sale of products hazardous to health or creating standards to increase compatibility and interoperability. Such regulations can specify the production process (i.e. use of a certain technology), or product att ributes (i.e. a maximum content of given components) required for conformity. Demand-shift ing eff ects are required for certain types of market failures, for instance by making it compulsory to provide certain information to consumers, thus aff ecting their behaviour. Supply-shift eff ects are of particular relevance to technical regulations (TBTs) and sanitary and phytosanitary (SPS) measures. Demand-shift eff ects can be identifi ed for any sort of technical regulation.
The protection eff ect of NTBs mentioned above is the most immediate candidate for assessment in a CGE model, provided that the correct impact estimates are available.6 Protection eff ects are usually assessed at the border. These border eff ects generate a wedge either between the world price and the domestic price in the importing country or between the world price and the domestic price in the exporting country.
Protection eff ects also arise beyond (within) the border because NTBs do not necessarily discriminate between domestic and imported goods. Tackling those beyond-the-border eff ects would require a model that included increasing returns to scale and export-specifi c costs. Off -the-shelf models such as GTAP do not off er those features, which are not straightforward and not easy to implement.
6 We refer the reader to Deardoff and Stern (1997) and Ferrantino (2006) for a comprehensive review and discussion. Useful discussions are also found in Maskus, Wilson and Otsuki (2000) on quantifi cation of technical barriers to trade. Beghin and Bureau (2001) discuss sanitary and phytosanitary standards.
3
The assessment of the other economic eff ects, namely the supply-shift and demand-shift eff ects, in a CGE context is much more complex. The theoretical analysis by Ganslandt and Markusen (2001) off ers possible solutions for the integration of demand-shift elements into CGE modelling. A major hurdle in replicating this approach and obtaining credible estimates is, however, the accessibility of relevant empirical information for plausible parameterization.7
Arguably, supply-shift eff ects also present diffi cult challenges before being incorporated into existing CGE models, including the need to develop appropriate functional forms to model supply functions.
2.1 Modelling in standard GTAP
Border eff ects of NTBs can operate on the import or export side of trade fl ows. The most common way of measuring such eff ects is through AVEs, the diff erence between world and domestic prices. Where the import side is directly aff ected, change in the AVEs of NTBs can be implemented in GTAP to simulate either a change in taxes aff ecting imports or effi ciency eff ects representing the change in the price of imports from a particular trading partner.8 Similarly, in some instances NTBs can be thought to behave like a tax on export, and AVEs can then be used to simulate a change in export taxes. In a pioneer eff ort, Andriamananjara, Ferrantino and Tsigas (2003) explored those various options in a CGE.
Andriamananjara, Ferrantino and Tsigas (2003) assume for the footwear and apparel industry that implementing a shock on an equivalent import tax variable is admissible for the purpose of representing the eff ect of NTBs in the sector. Doing that requires that welfare eff ects be interpreted carefully. One may, for instance, consider, in the context of the theory of rent seeking developed by Krueger (1974), that protection rents are generated by NTBs and are captured by domestic interests, an eff ect qualitatively equivalent to that of tariff s, where the rent is captured by the government tax. However, rent seeking may also generate its own costs, dissipating part of the NTB rent. Therefore, there is a need to reinterpret the CGE results since no government tax revenue and probably other forms of rent transfer are operating. This
7 For a review of methodological issues applied to standards, see Maskus, Wilson and Otsuki (1999).8 The policy variables of interest in GTAP are respectively tms and ams.
means essentially two things in the context of a general equilibrium approach: (a) the variation in government consumption due to the artifi cially assigned tax revenue changes will need to be either controlled or accounted for; and (b) more straightforwardly, the welfare impacts att ributed to changes in the government revenue “rectangle” will have to be interpreted. It is likely that the size of such transfers will be important. Correct att ribution thus implies some knowledge of how NTBs function in practice, and who captures the rent. That might still be the Government – through, for instance, certifi cation agencies. Alternatively, it could be import-competing domestic or even foreign private operators, competing or intermediaries in the transport, logistic and border clearance chain.9
An alternative modelling of the protection eff ect through effi ciency impacts is suggested by Andriamananjara, Ferrantino and Tsigas (2003). The logic behind this is that NTBs add “sand in the wheels” of trade. Liberalization of measures included in the technical chapter of UNCTAD’s classifi cation, such as SPS and TBT, can, for instance, be thought of as having an effi ciency impact. Mutual recognition agreements and, to some extent, harmonization of standards will allow export of products that previously would have needed to undergo specifi c production processes (relative to the process needed for the domestic market) in order to meet the other partner’s standard without those extra production steps, thus translating into possible effi ciency gains.10 Recourse to the effi ciency approach also avoids issues related to tax revenues encountered when price taxes are used to model NTBs in GTAP. The effi ciency assumption implies that the price diff erential calculated by the AVEs is entirely explained by the effi ciency losses due to the presence of NTBs. That is unlikely to be the case, and conceptually it is not completely clear whether trade liberalization related to technical regulations is best represented by a reduction in effi ciency impediments.
Finally, in some instances exporters are directly aff ected by the presence of NTBs. In this case, the NTB eff ect can be introduced as an export tax equivalent that constrains the shipment
9 In the GTAP model, as long as rents remain within the country applying the NTB, controlling for the impact on tax revenues could be ignored since the use of a regional household as the basis for welfare analysis makes redistributive patt erns of second order importance. Whether rents are collected by fi rms or by government matt ers only for their resource allocation eff ect, as all revenues eventually belong to the regional household.10 Improved certifi cation procedures that reduce wastage could also be thought to have similar eff ects.
4
of exports. The use of export tax equivalents is relevant when economic rents are generated by export restrictions, as in the case of voluntary export restraints. Modelling export taxes is straightforward in CGE modelling and similar to import taxes. Andriamananjara, Ferrantino and Tsigas (2003) use this approach to model the impact of NTBs in apparels. As will be seen below, we also use export taxes to model NTBs but with a diff erent purpose in mind.
2.2 A more diffi cult question for CGE modelling: the cost-raising eff ect of NTBs
Notwithstanding the question of modelling supply-shift eff ects, the use of tariff equivalents is actually not completely satisfactory even when limited to the analysis of protection eff ect of NTBs (i.e. the impact on foreign producers only). The border eff ects of NTBs should be refl ected in the additional costs of production that fi rms have to incur in order to export to a specifi c market – for instance, changing manufacturing processes, as discussed earlier, or the cost of conformity certifi cation. Then, as argued in Baldwin (2000) TBT can aff ect both fi xed costs and variable costs. The presence of fi xed costs suggests that increasing returns and imperfect competition could be necessary modelling features.
Firms could be assumed to face constant marginal costs and two types of fi xed costs – one generic related to sett ing up production, and one specifi c to any destination market, representing diff ering TBT requirements (Baldwin and Forslid, 2006). Firms exporting to markets with TBT requirements could also face per-unit additional costs, which would be equivalent to an additional standard transport cost. Recent trade models, based on the seminal work of Melitz (2003) and where fi rms’ heterogeneity is the salient new element, off er a way of including those cost categories. Using this framework would, moreover, enable trade modelling to address the question of the extensive margin of trade and the creation of trade in sectors that were not previously exporting. CGE models such as GTAP only extrapolate from existing trade data. GTAP modelling underestimates trade liberalization eff ects on small trade (and by construction near zero) shares (Kuiper and van Tongeren, 2006). Incorporating the Melitz framework, in addition to its usefulness in assessing the impact of technical regulations in trade, could introduce additional sources of gains from trade liberalization. Implementing that approach to estimate parameters and perform
CGE modelling remains, however, in its infancy and beyond the scope of this paper.11
Fixed costs could be introduced via increasing returns to scale. Although this is not treated in the standard GTAP model, this can be in principle easily implemented, as discussed in Francois (1998). This augmented version of the GTAP framework does not, however, make it possible to account for export-specifi c fi xed costs.12
2.3 Demand-shift and supply-shift eff ects
Focussing only on the protection eff ects of NTBs is likely to cause the social benefi ts they might provide to be disregarded. This is important from a policy point of view, since the optimal liberalization policy for NTBs will oft en not – unlike for tariff s – be their elimination but rather their rationalization to the social-utility-maximizing level; in other words, the desirable policy prescription is to minimize their cost-benefi t ratio. One dimension of this policy problem may be the need to harmonize NTBs with those of trading partners, so as to avoid undesirable duplication costs and complexity.13
Although it would be desirable to investigate how one can identify and separate the cost and the welfare-enhancing dimension of NTBs, it is diffi cult to think of a methodology that would allow that to be done in a systematic way. Detailed information is needed; it would have to be provided by technical experts (Deardoff and Stern, 1997) and probably only for specifi c products or a limited range of countries.
11 An encouraging att empt to do that, the fi rst of its kind, has been made by Zhai (2007).12 In addition, and independently of the possibilities of extensions of the GTAP model to account for TBTs, it might be argued that increasing returns and imperfect competition are not usual features of the agricultural sector. Agricultural production is mostly assumed to be characterized by high goods homogeneity. But such production is an important element of any analysis of NTBs in view of the importance of SPS. A step towards reconciliation between those two elements would be to introduce increasing returns to scale for processed agricultural goods. This is likely to be a quite realistic assumption, as suggested for instance by Beghin and Bureau (2001). Finally, for more homogeneous goods, only variable costs would be aff ected.13 Among possible policy scenarios that could be devised without much further information, one could simulate worldwide or regional harmonization of NTBs, using countries or regions (the United States and Europe being obvious candidates) as the standard benchmark against which to harmonize. That is, however, beyond the scope of this research.
5
Standard models such as GTAP do not provide many ways of including demand-shift and supply-shift eff ects. One possible way would be to act on the elasticity parameters of the functional forms used to represent the supply and demand functions. Demand-shift eff ects could, for instance, be simulated through a modifi cation of the degree of substitution between domestic and imported goods and/or among imports. Technical regulations can be thought of as increasing consumers’ willingness to pay for foreign products (by imposing requirements that convey consumers’ global preferences). That may be done by modifying Armington elasticities of substitution among imported goods (foreign goods not meeting the requirements would increasingly be substituted away for other foreign goods that do meet the requirements). Technical regulations can also increase the substitutability between domestic and foreign goods (e.g. fully compatible plugs). This eff ect could be captured by modifying the elasticity of substitution between domestic and foreign products. A similar approach has been adopted in various studies, for instance in Harrison, Tarr and Rutherford (1994). In the absence of specifi c estimates of elasticity, which are diffi cult to compute, this preference change could be simulated along a continuum to assess the sensitivity of the results. Empirical knowledge of the demand-shift eff ects remains too scarce to be implemented in a CGE context beyond a sensitivity analysis approach, and too scarce for robust policy recommendations to be made.14
2.4 Previous general equilibrium applications of the eff ect of non-tariff barriers
Andriamanajara et al. (2004) provide the most comprehensive study made so far of the impact of NTBs in a CGE model. They include 14 product groups and 18 regions. The study fi rst estimates global AVEs for NTBs, using price data from Euromonitor and NTB coverage information from UNCTAD. The price eff ects obtained are generally very large: up to 190 per cent in the wearing apparel sector in Japan and in the bovine meat sector in China. The estimate of the price incidence in wearing apparel in the EU is 60 per cent, while the corresponding fi gure in Kee, Nicita and Olarreaga (2006) is 15 per cent. The study then uses its AVEs to simulate in GTAP the welfare eff ects of removal of the selected NTBs.
14 Harrison et al. (1993) also suggest that sensitivity analysis should be carried out in CGE modelling as part of a strategy to achieve more robust and policy-relevant results. However, carrying out such analysis remains costly in terms of computing power and time.
Global gains are important ($90 billion), arising mostly from liberalization in Japan and Europe and in the textile and machinery sectors.
Other important works such as Gasiorek, Smith and Venables (1992) and Harrison, Tarr and Rutherford (1994) simulate the eff ects of harmonization of regulations in the European Union in the post-Maastricht era. The former adopt the “sand in the wheel” approach and assume that trade costs are reduced uniformly by 2.5 per cent, allowing for the characterization of short run and long run equilibrium. The latt er use a similar framework, extended to endogenize the elasticity of substitution between domestic and EU goods in order to account, to some extent, for the demand-shift eff ect mentioned previously. Results in those two studies suggest that the impact of harmonization could reach 2.4 per cent of GDP. In a country-focused but similar computational set-up, Chemingui and Dessus (2007) assess the impact of NTBs in the Syrian Arab Republic. They introduce estimates of price eff ects of NTBs as regular tariff s. AVEs of NTBs are obtained in their study using the price comparison approach. Welfare gains could range between 0.4 and 4.8 per cent of GDP, depending on whether dynamic eff ects (associated with a technological catch-up with the rest of the world) are taken into consideration.
With the growing political interest in trade facilitation, several recent studies have att empted to assess its potential benefi ts, using the “sand in the wheels” approach.15 Hertel, Walmsley and Itakura (2001) were the fi rst to introduce an effi ciency shock variable in GTAP to simulate the impact of lower non-tariff trade costs, such as customs clearance costs in the free trade agreement between Japan and Singapore. Total expected welfare gains for the agreement are worth $9 billion annually, with most of them accruing from the trade facilitation component. Fox, Francois and Londono-Kent (2003) account for the diff erent nature of costs created by NTBs by modelling both the direct costs and the indirect transaction costs of lack of trade facilitation at the United States–Mexico border. Direct transaction costs are modelled as a usual import tax, refl ecting a transfer of rent between importers and domestic agents, while indirect transaction costs are modelled as pure effi ciency losses. Fox and his co-authors fi nd indirect costs to be the major source of welfare gains. Walkenhorst and Yasui (2005) follow the same approach to estimate the gains to be expected from trade facilitation liberalization, additionally splitt ing the taxes between those
15 See Engman (2005) for a review, and Walkenhorst and Yasui (2005) for methodological discussion on trade facilitation.
6
borne by importers and those borne by exporters. They fi nd important welfare gains of about $40 billion, with nearly 80 per cent arising from effi ciency gain eff ects). Finally, Francois, van Meij l and van Tongeren (2005) assess the impact of trade facilitation reform related to the WTO Doha round of negotiations. They adopt the trade effi ciency cost approach to simulate the impact of improvements in trade logistics. In their baseline simulation scenario, trade logistics impediments represent 1.5 per cent of value of trade. Results suggest that income eff ects related to trade facilitation reform could represent 0.2 per cent of GDP and two-fi ft h of overall reform impact.
This brief review of existing applied work reveals that they predict important welfare eff ects from the liberalization of NTBs. Obviously, these are likely according to the extent of the reform envisaged, but also with the functional form chosen to model them in simulation exercises. In particular, when modelled, effi ciency-type eff ects tend to weigh heavily in the overall largely positive welfare gain results. We examine this in more detail in the experiments discussed in the next section.
3. THE EXPERIMENTS
We have discussed so far the methodological obstacles to the modelling of NTBs. This should, we think, serve as a warning sign not to interpret simulation results too hastily without being confi dent that they refl ect accurately enough the reality of NTBs. We propose now to conduct several experiments in GTAP, highlighting some of those issues while also investigating specifi c aspects of large scale simulations. We also conduct what we believe is the fi rst truly general equilibrium simulation exercise in NTB liberalization.
Our work is made possible by recent advances in the large scale estimation of AVEs for NTBs. We use estimates from Kee, Nicita and Olarreaga (2006). In a companion work (Kee, Nicita and Olarreaga, 2004) the HS 6-digit level demand elasticities for 4,625 imported goods in 117 countries are estimated. AVEs for NTBs in 104 developing and developed countries are then computed using a quantity-impact estimation strategy (the comparative advantage approach) and the import demand elasticities estimates. Because of the limited degree of freedom in the estimation work, the authors distinguish only two groups of NTBs: core NTBs (price and quantity control measures) and non-core NTBs (technical regulations and monopolistic measures) on the one hand, and estimates of agricultural domestic support on the other.
Using the AVE estimates of Kee and his co-authors in our simulation set-up is debatable for many reasons. First, the estimates are obtained using a theoretical framework not fully compatible with the GTAP framework: Kee and his co-authors use a perfect competition sett ing, while GTAP uses an Armington structure (imperfect substitutability on the import side). The AVEs are also estimated at a much more disaggregated level than the one considered in our simulations.16 Not all types of NTBs are covered in the estimation procedure, and the impact of diff erent measures is assessed jointly. Nevertheless, at this stage in the research the main scope of the experiment is illustrative. Furthermore, given the preponderance of standards-type NTBs, on which Kee and his colleagues’ estimates concentrate, we can assume that the AVEs capture well the infl uence of the most preponderant NTB and thus provide a good rank order of magnitude of the importance of those barriers across countries and industries.
16 We used an import-weighted aggregation procedure. This is common for data manipulations related to GTAP applications.
7
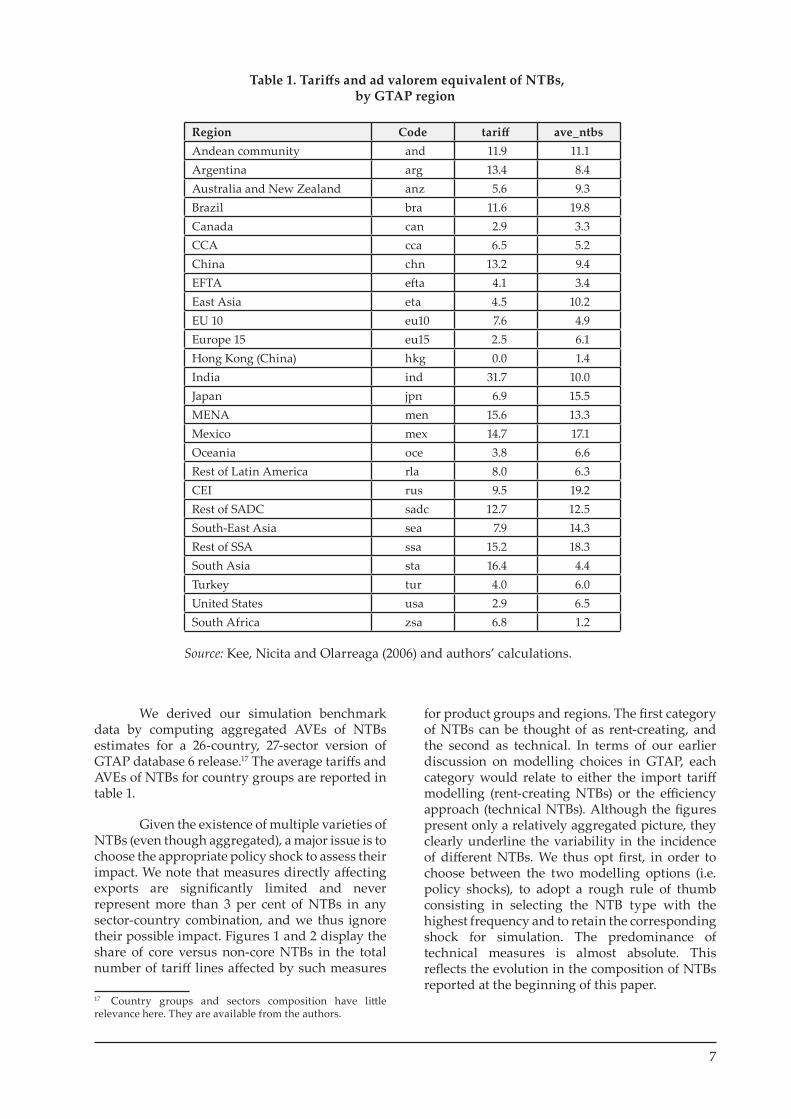
We derived our simulation benchmark data by computing aggregated AVEs of NTBs estimates for a 26-country, 27-sector version of GTAP database 6 release.17 The average tariff s and AVEs of NTBs for country groups are reported in table 1.
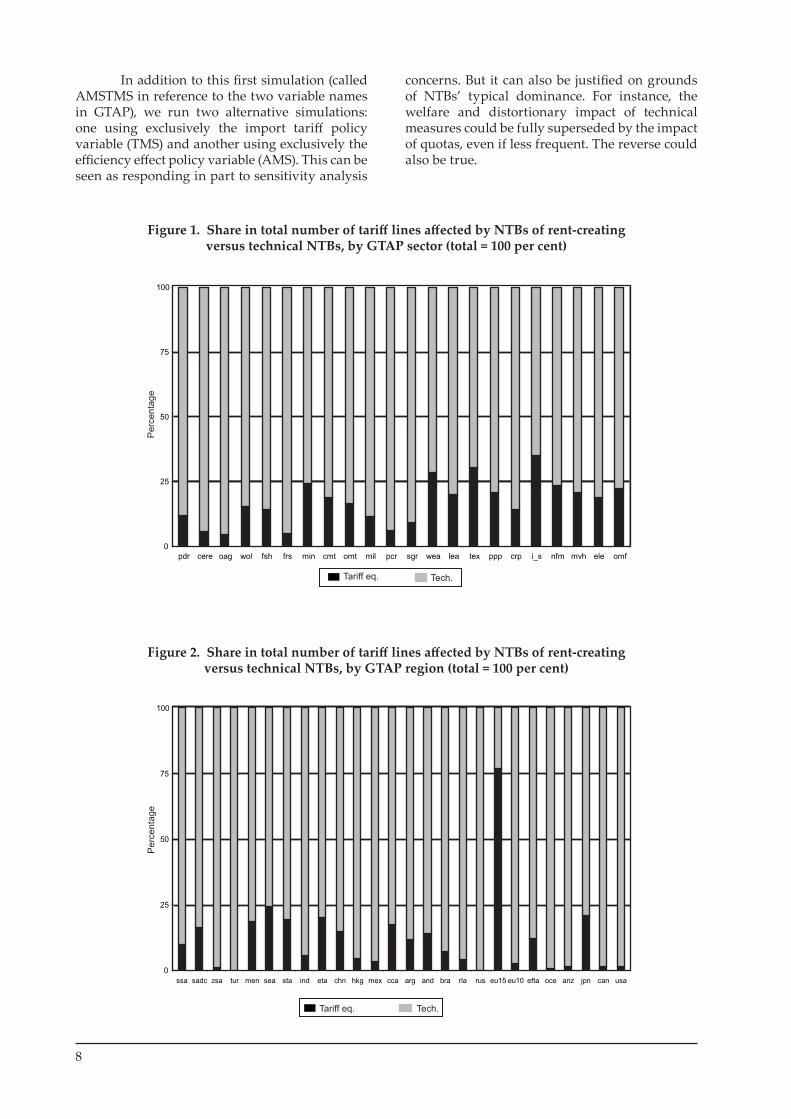
Given the existence of multiple varieties of NTBs (even though aggregated), a major issue is to choose the appropriate policy shock to assess their impact. We note that measures directly aff ecting exports are signifi cantly limited and never represent more than 3 per cent of NTBs in any sector-country combination, and we thus ignore their possible impact. Figures 1 and 2 display the share of core versus non-core NTBs in the total number of tariff lines aff ected by such measures
17 Country groups and sectors composition have litt le relevance here. They are available from the authors.
for product groups and regions. The fi rst category of NTBs can be thought of as rent-creating, and the second as technical. In terms of our earlier discussion on modelling choices in GTAP, each category would relate to either the import tariff modelling (rent-creating NTBs) or the effi ciency approach (technical NTBs). Although the fi gures present only a relatively aggregated picture, they clearly underline the variability in the incidence of diff erent NTBs. We thus opt fi rst, in order to choose between the two modelling options (i.e. policy shocks), to adopt a rough rule of thumb consisting in selecting the NTB type with the highest frequency and to retain the corresponding shock for simulation. The predominance of technical measures is almost absolute. This refl ects the evolution in the composition of NTBs reported at the beginning of this paper.
Table 1. Tariff s and ad valorem equivalent of NTBs,by GTAP region
Region Code tariff ave_ntbsAndean community and 11.9 11.1Argentina arg 13.4 8.4Australia and New Zealand anz 5.6 9.3Brazil bra 11.6 19.8Canada can 2.9 3.3CCA cca 6.5 5.2China chn 13.2 9.4EFTA eft a 4.1 3.4East Asia eta 4.5 10.2EU 10 eu10 7.6 4.9Europe 15 eu15 2.5 6.1Hong Kong (China) hkg 0.0 1.4India ind 31.7 10.0Japan jpn 6.9 15.5MENA men 15.6 13.3Mexico mex 14.7 17.1Oceania oce 3.8 6.6Rest of Latin America rla 8.0 6.3CEI rus 9.5 19.2Rest of SADC sadc 12.7 12.5South-East Asia sea 7.9 14.3Rest of SSA ssa 15.2 18.3South Asia sta 16.4 4.4Turkey tur 4.0 6.0United States usa 2.9 6.5South Africa zsa 6.8 1.2
Source: Kee, Nicita and Olarreaga (2006) and authors’ calculations.
8
In addition to this fi rst simulation (called AMSTMS in reference to the two variable names in GTAP), we run two alternative simulations: one using exclusively the import tariff policy variable (TMS) and another using exclusively the effi ciency eff ect policy variable (AMS). This can be seen as responding in part to sensitivity analysis
concerns. But it can also be justifi ed on grounds of NTBs’ typical dominance. For instance, the welfare and distortionary impact of technical measures could be fully superseded by the impact of quotas, even if less frequent. The reverse could also be true.
Per
cent
age
0
25
50
75
100
pdr cere oag wol fsh frs min cmt omt mil pcr sgr wea lea tex ppp crp i_s nfm mvh ele omf
Tariff eq. Tech.
Figure 1. Share in total number of tariff lines aff ected by NTBs of rent-creatingversus technical NTBs, by GTAP sector (total = 100 per cent)
Figure 2. Share in total number of tariff lines aff ected by NTBs of rent-creatingversus technical NTBs, by GTAP region (total = 100 per cent)
0
25
50
75
100
ssa sadc zsa tur men sea sta ind eta chn hkg mex cca arg and bra rla rus eu15 eu10 efta oce anz jpn can usa
Per
cent
age
Tariff eq. Tech.
9
4. RESULTS
For the sake of simplicity, we opt for simulating a complete removal of NTBs.18 Although not necessarily refl ecting the optimal policy prescription, the exercise makes it possible to estimate the cost of such measures and thus to contribute to an impact analysis. In the case of standards, a complete removal of barriers could also be associated with the implementation of full mutual recognition agreements.
While oft en the objective of NTBs is oft en clear, the cost of their implementation is generally not known. That fact can infl uence policy decisions.19 Of course, our approach is also limited because of data limitation. With adequate data distinguishing the discrimination eff ect against import from the regulatory eff ect to meet NTB social objectives we could proceed to a more sophisticated analysis.
4.1 Results of simulations
A general fi nding is the very high sensitivity of welfare results to the policy variable of choice in the simulation. This makes any policy interpretation hazardous. This was somewhat expected in the light of our discussion of previous empirical work, it being observed that one specifi c policy shock can have an overbearing infl uence on total results. Nevertheless, we expected closer results since, in theory, the “tariff equivalent” and “sand in the wheel” approaches both aff ect the terms of trade of the reforming country in a similar manner. But, as shown below, this would be without consideration of the technological-improvement content of the effi ciency shock of removing NTBs, the latt er being important.
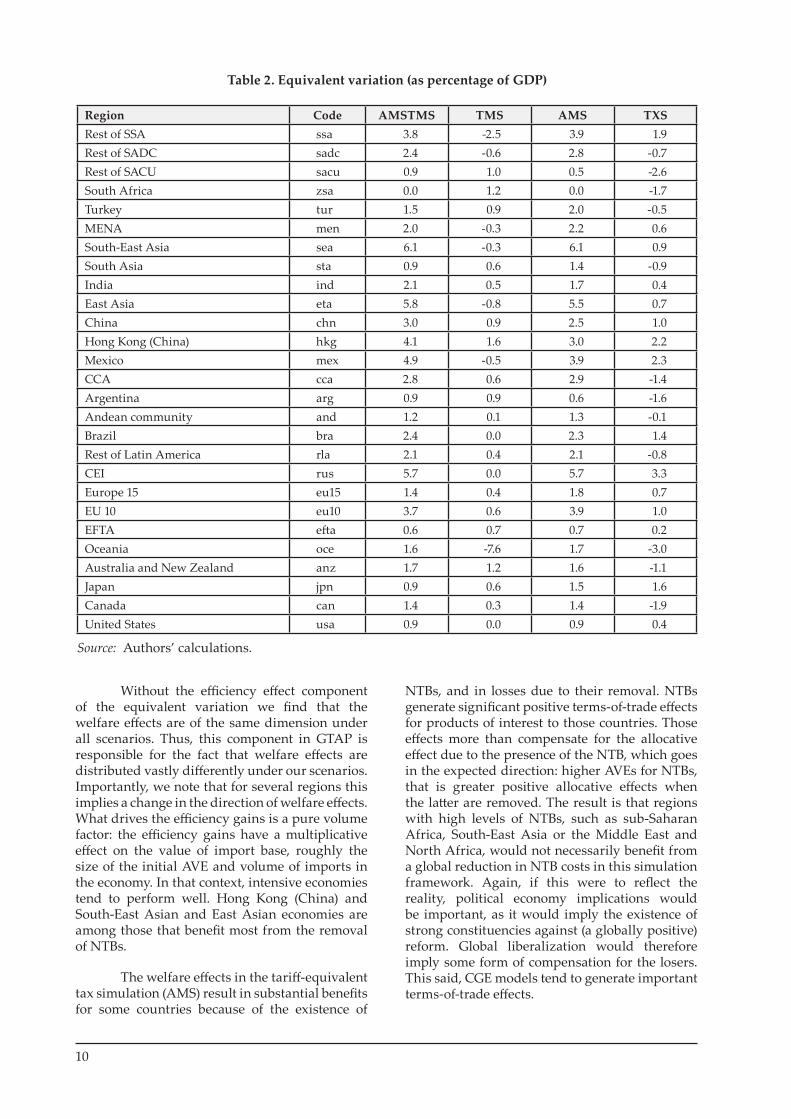
Welfare results are reported in table 2. Equivalent variation estimates in the effi ciency eff ect simulations (AMS and AMSTMS) are altogether of a completely diff erent order
18 We also run a pre-simulation that accounts for major trade policy changes that occurred aft er 2001, the year base of GTAP tariff data. The events in question are the EU enlargement, Agenda 2000, the accession of China to the WTO, the implementation of the rest of the GATT Uruguay round tariff commitments and the end of the Agreement on Textiles and Closing.19 See, for instance, the seminal work of Otsuki, Wilson and Sewadeh (2001), which evaluated the cost of afl atoxine standard protection in the EU to reducing by about 50 per cent exports of African countries ($400 million dollars) to Europe of cereal, dried fruits and preserved nuts. The risk reduction benefi t of the standard is considered negligible by the authors.
of magnitude than for tariff like eff ect. The results under the mixed AMSTMS scenario are qualitatively not very diff erent from the AMS scenario. This is explained by the predominance of the effi ciency eff ect and also refl ects the fact that the ratio of technical NTBs versus rent-creating ones is high for all countries except the European Union (fi gure 2). However, even in the latt er case we do not see a signifi cant diff erence between the two simulations.
Simulations using effi ciency eff ects generate positive welfare eff ects for all regions. In terms of policy implications this could be an extremely interesting result, because it would mean that multilateral liberalization, which could take the form of a fully mutual recognition of technical measures, would be a win-win for all. This, however, contrasts quite starkly with the reality of negotiations and implementation of NTB multilateral agreements, which suggests that dismantling of unnecessary protection is a long and protracted process, with litt le political involvement. This means either that there is in reality not the win-win observed in the simulation, or that political forces in the eventual losing sectors are strongly resisting change (although these two simulations also show positive sectoral gains in most instances).
It is also worth noting that win-win gains are oft en invoked in support of the WTO trade facilitation negotiations. As we saw earlier, evidence provided by simulations would suggest that there are such gains. There is strong casual evidence for the effi ciency eff ects of trade facilitation, which justifi es the optimism concerning possible gains, and possibly the simulation method used in CGE modelling.
Effi ciency eff ects can be expected by construction to generate positive gains altogether. First, in the GTAP framework effi ciency shocks lower the price of imports, and this leads to an increase in demand at the expense of domestic goods. Also, effi ciency gains increase the real production content of each single unit exported. This implies that fewer exports are required in order to meet the demand of the importing country. Because in GTAP this effi ciency gain applies non-discriminatorily to all imports there are no trade diversion eff ects at work.20 This should thus result in unambiguous positive welfare eff ects for all countries.
20 This is not always an unrealistic assumption: many NTBs do not discriminate regarding the origin of imports. For instance, standards or customs procedures are supposed to apply to all.
10
Without the effi ciency eff ect component of the equivalent variation we fi nd that the welfare eff ects are of the same dimension under all scenarios. Thus, this component in GTAP is responsible for the fact that welfare eff ects are distributed vastly diff erently under our scenarios. Importantly, we note that for several regions this implies a change in the direction of welfare eff ects. What drives the effi ciency gains is a pure volume factor: the effi ciency gains have a multiplicative eff ect on the value of import base, roughly the size of the initial AVE and volume of imports in the economy. In that context, intensive economies tend to perform well. Hong Kong (China) and South-East Asian and East Asian economies are among those that benefi t most from the removal of NTBs.
The welfare eff ects in the tariff -equivalent tax simulation (AMS) result in substantial benefi ts for some countries because of the existence of
NTBs, and in losses due to their removal. NTBs generate signifi cant positive terms-of-trade eff ects for products of interest to those countries. Those eff ects more than compensate for the allocative eff ect due to the presence of the NTB, which goes in the expected direction: higher AVEs for NTBs, that is greater positive allocative eff ects when the latt er are removed. The result is that regions with high levels of NTBs, such as sub-Saharan Africa, South-East Asia or the Middle East and North Africa, would not necessarily benefi t from a global reduction in NTB costs in this simulation framework. Again, if this were to refl ect the reality, political economy implications would be important, as it would imply the existence of strong constituencies against (a globally positive) reform. Global liberalization would therefore imply some form of compensation for the losers. This said, CGE models tend to generate important terms-of-trade eff ects.
Table 2. Equivalent variation (as percentage of GDP)
Region Code AMSTMS TMS AMS TXSRest of SSA ssa 3.8 -2.5 3.9 1.9Rest of SADC sadc 2.4 -0.6 2.8 -0.7Rest of SACU sacu 0.9 1.0 0.5 -2.6South Africa zsa 0.0 1.2 0.0 -1.7Turkey tur 1.5 0.9 2.0 -0.5MENA men 2.0 -0.3 2.2 0.6South-East Asia sea 6.1 -0.3 6.1 0.9South Asia sta 0.9 0.6 1.4 -0.9India ind 2.1 0.5 1.7 0.4East Asia eta 5.8 -0.8 5.5 0.7China chn 3.0 0.9 2.5 1.0Hong Kong (China) hkg 4.1 1.6 3.0 2.2Mexico mex 4.9 -0.5 3.9 2.3CCA cca 2.8 0.6 2.9 -1.4Argentina arg 0.9 0.9 0.6 -1.6Andean community and 1.2 0.1 1.3 -0.1Brazil bra 2.4 0.0 2.3 1.4Rest of Latin America rla 2.1 0.4 2.1 -0.8CEI rus 5.7 0.0 5.7 3.3Europe 15 eu15 1.4 0.4 1.8 0.7EU 10 eu10 3.7 0.6 3.9 1.0EFTA eft a 0.6 0.7 0.7 0.2Oceania oce 1.6 -7.6 1.7 -3.0Australia and New Zealand anz 1.7 1.2 1.6 -1.1Japan jpn 0.9 0.6 1.5 1.6Canada can 1.4 0.3 1.4 -1.9United States usa 0.9 0.0 0.9 0.4
Source: Authors’ calculations.
11
4.2 A simple att empt at dealing with supply-shift eff ects, and further lessons on the choice of policy variables
We saw earlier that the introduction of imperfect competition may be desirable for modelling more closely the cost impacts of NTBs. The standard GTAP off ers only perfect competition specifi cation, but can still be of use for assessing the impact of NTBs on variable costs. Variable costs due to the presence of NTBs should aff ect exports price in the way that an ad valorem export tax aff ects it, but obviously without the direct link to tax revenues. This issue has to be solved either theoretically or practically.21 One further complication is that AVEs refl ect the price eff ects on imports, when the relevant price for export taxes is the price prevailing in the exporting country. Fortunately, the GTAP modelling approach enables us to directly relate these two prices. We can then use estimates of import price eff ects to simulate export price changes.
The last column in table 2 reports the equivalent variation results of the export tax approach simulation (called TXS). Interestingly, and somewhat unexpectedly, from a magnitude point of view, welfare changes resulting from the export taxes simulation lie somewhere between those from the tariff s simulation and those from the effi ciency simulation. In general, the welfare impact is positive for most countries.
The results are not reported here, but we also fi nd that welfare eff ects related to changes in the terms of trade are more frequently positive and larger in the export tax reduction simulation. Those results were expected, since prices of imports in the liberalizing country are likely to fall if taxes on exports are removed in trade partners. The opposite happens with regard to the other two types of eff ects: import tax equivalent and effi ciency. Finally, under the three types of policy, shocks lead to highly correlated allocative effi ciency gains. However, the export tax shock dominates the previous simulations in respect of magnitude.
21 The tax revenues eff ect can be neutralized by adjusting the tax rate on private consumption. By doing so we implicitly assume that rents are generated domestically from the application of NTBs by foreign trade partners. Controlling for this does not signifi cantly aff ect the simulation results for the purpose of our exercise, and they are therefore not reported. Results can be obtained from the authors.
5. LESSONS FROM THE SIMULATIONS RESULT, AND CONCLUSIONS
The results of the simulations underline substantial diff erences in the measurement of protection eff ects, depending on whether AVEs are introduced using shocks on import tariff s or on technological change. Those diff erences are not surprising in the light of the very nature of a technological change in the GTAP framework.
First, the size of the diff erences discussed above, in terms of level and distribution, inevitably casts doubts on the appropriateness of using any technological shock to assess the impact of NTBs. In particular, the overwhelming positive welfare eff ects found across countries would need to be supported by a robust understanding of how NTB operate and what real effi ciency gains could be made, versus impacts of diff erent nature, such as raising costs or creating a wedge between domestic and international prices. Effi ciency gains tend to be very sizeable – partly by construction – and again robust evidence and model specifi cation should support the conclusion that effi ciency eff ects are likely to outperform other eff ects such as terms of trade. As a consequence, the use of effi ciency gains seems realistic only for small values of shocks, as has generally been assumed in the literature. We tend to have “sand” in the wheels, not “rocks”.
Secondly, we found that for some regions the direction of welfare eff ects changed depending on the assumption we made on how NTBs operate (irrespective of the level of AVEs). This is a very important cautionary tale, which derives from the general equilibrium eff ects that we simulated. It means that depending on whether, schematically, the price, allocative or technological effi ciency eff ects dominate the incentives to participate in global liberalization could be reversed: obviously the political economy inferences that can be drawn would also change drastically. While we could not test that aspect, our economic intuition tells us that allocative and technological effi ciency should dominate; but as our work demonstrates, this is not a foregone conclusion.
Thirdly, the diff erence observed between allocative eff ects obtained in the tariff -based simulation and those obtained in the export tax simulation can be surprising at fi rst glance since the primary impact on the market price in the liberalizing country is exactly the same. However, the price eff ect is the result of the shift ing of two diff erent curves – import demand and export
12
supply. Diff erent eff ects were observed because of diff erences in supply-and-demand elasticities. However, diff erences are likely to be essentially the consequence of the interaction between the policy shocks and remaining distortions. A fall in export taxes leads to a rise in imports in the liberalizing country. Then, imports which are likely to be constrained by tariff s come closer to their undistorted level. As far as exports are concerned, they are either unconstrained by policy or in most cases subsidized. This implies that, at best, welfare eff ects related to changes in exports are negligible. This is further proof that the selection of a policy variable in GTAP is far from innocuous.
The results of our experiments highlight that our initial assessment of the methodological hurdles of CGE modelling must be followed up if one wants to develop a bett er general equilibrium assessment of the presence of NTBs. Given the latt er’s increasing prevalence, such work should be prioritized. While it remains to be seen whether an appropriate liberalization scenario could be designed, since elimination is not necessarily the objective, even simple assumptions could help in arriving at numbers for the (distortionary) costs of having NTBs: this would help regulatory impact assessments.
Finally, eff orts to inventory and quantify NTBs should be intensifi ed – there are strong indications that their impact is important – and modelling eff orts improved to allow the inclusion of imperfect competition and beyond-the-border features.
Also, proper inclusion of NTBs in CGE models such has GTAP needs further refi nements in modelling. Within the GTAP framework, a more systematic use of increasing returns to scale modelling is needed. Additional eff orts should also be devoted to developing a margin-sector-like component that would allow the inclusion of cost elements specifi c to the country destination of exports aff ected by NTBs. This would extend the standard CGE modelling analysis to the extensive margin of trade. This would inevitably lead to a rethinking of the way in which AVEs are estimated, and thus additional eff orts in econometric research would also be welcome.
That is the price to pay to have informative policy guidance on what could be the gains from eliminating and rationalizing NTBs. The price may seem high, but we are convinced that the benefi ts of good policing of NTBs are well worth it.
13
Adams PD (2005). Interpretation of results from CGE models such as GTAP. Journal of Policy Modeling, 27(8), 941–959.
Anderson K, Martin W and van der Mensbrugghe D (2005). Market and welfare implications of Doha reform scenarios. In: Anderson K and Martin WJ, eds. Agricultural Trade Reform and the Doha Development Agenda. New York, Palgrave Mcmillan.
Andriamananjara S, Ferrantino MJ and Tsigas M (2003). Alternative approaches in estimating the economic eff ects of non-tariff measures: results from newly quantifi ed measures. U.S International Trade Commission, Offi ce of Economics Working Paper No.2003-12.C.
Andriamananjara S, Dean JM, Feinberg R, Ferrantino MJ, Ludema R and Tsigas M (2004). The eff ects of non-tariff measures on prices, trade and welfare: CGE implementation of policy-based price comparisons. U.S International Trade Commission, Offi ce of Economics Working Paper No.2004-04.A.
Baldwin RE (2000). Regulatory protectionism, developing nations and a two-tier world trading system. In: Collins S and Rodrik D, eds., Brookings Trade Forum. Washington, DC, Brookings Institution. Republished in: Maskus K and Wilson JS, eds. (2001). Quantifying the Impact of Technical Barriers to Trade: Can it be done? Ann Harbor, Michigan, Michigan University Press, Ann Harbor.
Baldwin RE and Forsild R (2006). Trade liberalization with heterogeneous fi rms. NBER Working Paper Series No. 12192.
Beghin JC (2006). Nontariff barriers. Forthcoming in: The New Palgrave Dictionary of Economics, 2nd edition, S. Darlauf and L. Blume, eds. New York, Palgrave Macmillan.
Beghin JC and Bureau J-C (2001). Quantifi cation of sanitary, phytosanitary, and technical barriers to trade for trade policy analysis. Working Paper 01-WP291. Center for Agricultural and Rural Development, Iowa State University.
Chemingui MA and Dessus S (2007). Assessing non-tariff barriers to trade in Syria. Journal of Policy Modeling, forthcoming.
Deardorff AV and Stern R (1997). Measurement of non-tariff barriers. OECD Economics Department Working Papers No. 179.
Engman M (2005). The economic impact of trade facilitation. OECD Trade Policy Working Paper No. 21.
Fernandez de Cordoba S and Vanzett i D (2006). Now what? Searching for a solution to the WTO industrial tariff negotiations. In: Fernandez de Cordoba S and Laird S, eds. Coping with Trade Reforms: A Developing-Country Perspective on the WTO Industrial Tariff Negotiations. New York, Palgrave-MacMillan.
Ferrantino M (2006). Quantifying the trade and economic eff ects of non-tariff measures. OECD Trade Policy Working Paper No. 28.
Fox A, Francois JF and Londono-Kent P (2003). Measuring border costs and their impact on trade fl ows: the United States-Mexican trucking case, Unpublished manuscript.
Francois JF (1998). Scale economies and imperfect competition in the GTAP model. GTAP Technical Paper No. 14, Purdue University.
Francois JF, van Meij l H and van Tongeren F (2005). Trade liberalization in the Doha development round. Economic Policy, 20 (42), 349–391.
Ganslandt M and Markusen JR (2001). Standards and related regulations in international trade: a modeling approach. NBER Working Paper No. 8346.
Gasiorek M, Smith A and Venables AJ (1992). “1992” trade and welfare - a general equilibrium model. In: Winters LA, ed. Trade fl ows and trade policy aft er “1992”. Cambridge, UK, Cambridge University Press.
Harrison GW, Jones R, Kimbell LJ and Wigle R (1993). How robust is general equilibrium analysis? Journal of Policy Modeling, 15 (1), 99–115.
REFERENCES
14
Harrison GW, Tarr D and Rutherford TF (1994). Product standards, imperfect competition, and the completion of the market in the European Union. World Bank Policy Research Working Paper No. 1293.
Harrison GW, Tarr D and Rutherford TF (1996). Quantifying the Uruguay round. In: Martin WJ and Winters LA, eds. The Uruguay Round and the Developing Countries. New York, Cambridge University Press.
Hertel TW, ed. (1997). Global Trade Analysis: Modeling and Applications. Cambridge, MA, Cambridge University Press.
Hertel TW, Walmsley T and Itakura K (2001). Dynamic eff ects of the “new age” free trade agreement between Japan and Singapore. Journal of Economic Integration, 16 (4), 446–484.
Kee HL, Nicita A and Olarreaga M (2004). Import demand elasticities and trade distortions. CEPR Discussion Paper 4669.
Kee HL, Nicita A and Olarreaga M (2006). Estimating trade restrictiveness indices. CEPR Discussion Paper 5576.
Krueger AO (1974). The political economy of the rent-seeking society. American Economic Review 64 (3), 291–303.
Kuiper M and van Tongeren F (2006). Using gravity to move Armington: an empirical approach to the small initial trade share problem in general equilibrium models. Paper presented at the 9th Annual Conference on Global Economic Analysis, Addis Ababa, Ethiopia.
Maskus K, Wilson JS and Otsuki T (2000). Quantifying the impact of barriers to trade: a framework for analysis. World Bank Research Working Paper No. 2512.
McDonald S, Robinson S and Thierfelder K (2005). A SAM based global CGE model using GTAP data. Sheffi eld Economic Research Papers Series No. 2005001, University of Sheffi eld, UK.
Melitz M (2003). The impact of trade on intraindustry reallocations and aggregate industry productivity. Econometrica, 71, 1695–1725.
Otsuki T, Wilson JS and Sewadeh M (2001). Saving two in a billion: quantifying the trade eff ect of European food safety standards on African exports. Food Policy, 25 (5), 495–514.
Polaski S (2006). Winners and loser: the impact of the Doha round on developing countries. Washington, DC, Carnegie Endowment for International Peace, March.
Roberts D, Josling TE and Orden D (1999). A framework for analyzing technical trade barriers in agricultural markets. Technical Bulletin No. 1876, U.S Department of Agriculture, Economic Research Service, Washington, DC.
UNCTAD (2005). Methodologies, classifi cation, quantifi cation and development impacts of non-tariff barriers (NTBs). Background Note TD/B/COM.1/EM.27/2, Expert Meeting, 5–7 September 2005, Geneva.
Walkenhorst P and Fliess B (2003). Non-tariff measures aff ecting EU exports: evidence from a complaints-inventory. Economics Department Working Papers No. 373, OECD, Paris.
Walkenhorst P and Yasui T (2005). Benefi ts of trade facilitation: a quantitative assessment. In: Dee P and Ferrantino M, eds. Quantitative measures for assessing the eff ect of non-tariff measures and trade facilitation. Singapore, World Scientifi c Publishing Co., 161–192.
Zhai F (2007). Armington Meets Melitz: introducing fi rm heterogeneity in global CGE model of trade. Paper presented at the GTAP 10th Conference, West Lafayett e, USA.
15
UNCTAD Study Series on
POLICY ISSUES IN INTERNATIONAL TRADEAND COMMODITIES
No. 1 Erich Supper, Is there effectively a level playing fi eld for developing country exports?, 2001, 138 p. Sales No. E.00.II.D.22.
No. 2 Arvind Panagariya, E-commerce, WTO and developing countries, 2000, 24 p. Sales No. E.00.II.D.23.
No. 3 Joseph Francois, Assessing the results of general equilibrium studies of multilateral trade negotiations, 2000, 26 p. Sales No. E.00.II.D.24.
No. 4 John Whalley, What can the developing countries infer from the Uruguay Round models for future negotiations?, 2000, 29 p. Sales No. E.00.II.D.25.
No. 5 Susan Teltscher, Tariffs, taxes and electronic commerce: Revenue implications for developing countries, 2000, 57 p. Sales No. E.00.II.D.36.
No. 6 Bijit Bora, Peter J. Lloyd, Mari Pangestu, Industrial policy and the WTO, 2000, 47 p. Sales No. E.00.II.D.26.
No. 7 Emilio J. Medina-Smith, Is the export-led growth hypothesis valid for developing countries? A case study of Costa Rica, 2001, 49 p. Sales No. E.01.II.D.8.
No. 8 Christopher Findlay, Service sector reform and development strategies: Issues and research priorities, 2001, 24 p. Sales No. E.01.II.D.7.
No. 9 Inge Nora Neufeld, Anti-dumping and countervailing procedures – Use or abuse? Implications for developing countries, 2001, 33 p. Sales No. E.01.II.D.6.
No. 10 Robert Scollay, Regional trade agreements and developing countries: The case of the Pacifi c Islands’ proposed free trade agreement, 2001, 45 p. Sales No. E.01.II.D.16.
No. 11 Robert Scollay and John Gilbert, An integrated approach to agricultural trade and development issues: Exploring the welfare and distribution issues, 2001, 43 p. Sales No. E.01.II.D.15.
No. 12 Marc Bacchetta and Bijit Bora, Post-Uruguay round market access barriers for industrial products, 2001, 50 p. Sales No. E.01.II.D.23.
No. 13 Bijit Bora and Inge Nora Neufeld, Tariffs and the East Asian fi nancial crisis, 2001, 30 p. Sales No. E.01.II.D.27.
16
No. 14 Bijit Bora, Lucian Cernat, Alessandro Turrini, Duty and quota-free access for LDCs: Further evidence from CGE modelling, 2002, 130 p. Sales No. E.01.II.D.22.
No. 15 Bijit Bora, John Gilbert, Robert Scollay, Assessing regional trading arrangements in the Asia-Pacifi c, 2001, 29 p. Sales No. E.01.II.D.21.
No. 16 Lucian Cernat, Assessing regional trade arrangements: Are South-South RTAs more trade diverting?, 2001, 24 p. Sales No. E.01.II.D.32.
No. 17 Bijit Bora, Trade related investment measures and the WTO: 1995-2001, 2002.
No. 18 Bijit Bora, Aki Kuwahara, Sam Laird, Quantifi cation of non-tariff measures, 2002, 42 p. Sales No. E.02.II.D.8.
No. 19 Greg McGuire, Trade in services – Market access opportunities and the benefi ts of liberalization for developing economies, 2002, 45 p. Sales No. E.02.II.D.9.
No. 20 Alessandro Turrini, International trade and labour market performance: Major fi ndings and open questions, 2002, 30 p. Sales No. E.02.II.D.10.
No. 21 Lucian Cernat, Assessing south-south regional integration: Same issues, many metrics, 2003, 32 p. Sales No. E.02.II.D.11.
No. 22 Kym Anderson, Agriculture, trade reform and poverty reduction: Implications for Sub-Saharan Africa, 2004, 30 p. Sales No. E.04.II.D.5.
No. 23 Ralf Peters and David Vanzetti, Shifting sands: Searching for a compromise in the WTO negotiations on agriculture, 2004, 46 p. Sales No. E.04.II.D.4.
No. 24 Ralf Peters and David Vanzetti, User manual and handbook on Agricultural Trade Policy Simulation Model (ATPSM), 2004, 45 p. Sales No. E.04.II.D.3.
No. 25 Khalil Rahman, Crawling out of snake pit: Special and differential treatment and post-Cancun imperatives, 2004.
No. 26 Marco Fugazza, Export performance and its determinants: Supply and demand constraints, 2004, 57 p. Sales No. E.04.II.D.20.
No. 27 Luis Abugattas, Swimming in the spaghetti bowl: Challenges for developing countries under the “New Regionalism”, 2004, 30 p. Sales No. E.04.II.D.38.
No. 28 David Vanzetti, Greg McGuire and Prabowo, Trade policy at the crossroads – The Indonesian story, 2005, 40 p. Sales No. E.04.II.D.40.
No. 29 Simonetta Zarrilli, International trade in GMOs and GM products: National and multilateral legal frameworks, 2005, 57 p. Sales No. E.04.II.D.41.
No. 30 Sam Laird, David Vanzetti and Santiago Fernández de Córdoba, Smoke and mirrors: Making sense of the WTO industrial tariff negotiations, 2006, Sales No. E.05.II.D.16.
17
No. 31 David Vanzetti, Santiago Fernandez de Córdoba and Veronica Chau, Banana split: How EU policies divide global producers, 2005, 27 p. Sales No. E.05.II.D.17.
No. 32 Ralf Peters, Roadblock to reform: The persistence of agricultural export subsidies, 2006, 43 p. Sales No. E.05.II.D.18.
No. 33 Marco Fugazza and David Vanzetti, A South-South survival strategy: The potential for trade among developing countries, 2006, 25 p.
No. 34 Andrew Cornford, The global implementation of Basel II: Prospects and outstanding problems, 2006, 30 p.
No. 35 Lakshmi Puri, IBSA: An emerging trinity in the new geography of international trade, 2007, 50 p.
No. 36 Craig VanGrasstek, The challenges of trade policymaking: Analysis, communication and representation, 2008, 45 p.
No. 37 Sudip Ranjan Basu, A new way to link development to institutions, policies and geography, 2008, 50 p.
No. 38 Marco Fugazza and Jean-Christophe Maur, Non-tariff barriers in computable general equilibrium modelling, 2008, 25 p.
United Nations publications may be obtained from bookstores and distributors throughout the world. Please consult your bookstore or write to:
United Nations Publications
All orders from North America, Latin America, the Caribbean and Asia and the Pacifi c should be sent to: United Nations Publications Room DC2-853, 2 UN Plaza New York, NY 10017, USA Telephone: (212) 963-8302, Toll Free 1-800-253-9646 (North America only) Fax: (212) 963-3489 E-mail: [email protected]
Customers in Europe, Africa and the Middle East should send their orders to: Section des Ventes et Commercialisation Bureau E-4, CH-1211 Geneva 10, Switzerland Telephone: 41 (22) 917-2613/2614 Fax: 41 (22) 917-0027 E-mail: [email protected]


Since 1999, the Trade Analysis Branch of the Division on International Trade in Goods and Services, and Commodities of UNCTAD has been carrying out policy-oriented analytical work aimed at improving the understanding of current and emerging issues in international trade and development. In order to improve the quality of the work of the Branch, it would be useful to receive the views of readers on this and other similar publications. It would therefore be greatly appreciated if you could complete the following questionnaire and return to:
Trade Analysis Branch, DITCRm. E-8076
United Nations Conference on Trade and DevelopmentPalais des Nations
CH-1211 Geneva 10, Switzerland
1. Name and address of respondent (optional):
2. Which of the following describes your area of work?
Government Public enterprise Private enterprise institution Academic or research International organization Media Not-for-profi t organization Other (specify) _________________
3. In which country do you work? _________________________________________
4. Did you fi nd this publication Very useful Of some use Litt le use to your work?
5. What is your assessment of the contents of this publication? Excellent Good Adequate Poor
6. Other comments:
QUESTIONNAIRE
UNCTAD Study series on
POLICY ISSUES IN INTERNATIONAL TRADEAND COMMODITIES
(Study series no. 38: Non-tariff barriers in computablegeneral equilibrium modelling)
Readership Survey