First Investment Company (OLAK.KW) NEUTRAL · Established in 1997, First Investment Company (FIC)...
23
Executive Summary Established in 1997, First Investment Company (FIC) is a Kuwait-based public shareholding company, which got listed on the Kuwait Stock Exchange in 2001. It is primarily engaged in investing activities and providing Islamic financial services in accordance with Shariah principles. FIC operates through two segments - Islamic Financing and Investment. FIC registered a massive 93% decline in total income During 1H09, FIC reported a 93.3% decline in total income to KWD 1.39 million from KWD 20.77 million in 1H08 on account of reduced activity in the financial sector. Gain on disposal of available for sale (AFS) investments contributed 22.6% to total income, decreasing 95.5% to KWD 0.31 million. On the services side, management fees fell 59.9% YoY to KWD 0.43 million. Share of losses of its associates amounted to KWD 1.39 million as against a gain of KWD 1.31 million in 1H08. On the other hand, murabaha, ijara and sukuk income jumped 76.2% to KWD 1.07 million, while dividend income increased nearly four-times to KWD 1.00 million from KWD 0.26 million. On the expenses side, total expenses increased 24.7% to KWD 5.21 million. Meanwhile, amid the current market scenario, the company incurred an impairment loss on its AFS investments of KWD 2.27 million in 1H09. As a result, FIC registered a net loss of KWD 5.48 million as opposed to a net profit of KWD 13.03 million in 1H08. Adjusted annualised loss per share (LPS) was KWD 0.017 compared to adjusted annualised earnings per share (EPS) of KWD 0.040 in 1H08. Outlook and valuation Kuwait’s real GDP is expected to decline by 1.5% in 2009 due to the recent financial turmoil and economic slowdown. The Kuwaiti investment sector has not been immune from the recent turmoil, and has witnessed investment losses and huge impairment charges. As the growth of investment companies is primarily driven by the real estate sector, the decline in real estate prices and weak demand has negatively impacted the values of investments in the sector. Though the sector’s medium-to-long-term outlook looks promising, given the investment outlay to the tune of USD 267 billion across a variety of projects, a cautious approach is recommended until the economy revives completely. FIC’s financial performance suffered a blow in 2008 and 1H09 hurt by the financial crisis and economic downturn. Total assets fell 7.0% YoY, while investments in the real estate sector need to be watched cautiously to minimise the impact of a further decline in real estate prices. However, the diversification of FIC’s investments across the GCC and in other sectors like energy, banking and education has helped counter the decline in asset valuations to some extent. As we expect FIC to incur losses during 2009 and 2010, the stock’s P/E multiple for the periods remains non-conclusive. At the same time, we expect the company to trade at P/B multiples of 0.77x and 0.75x on 2009E and 2010E BVPS, respectively. Meanwhile, the stock has declined 46.4% since the beginning of this year as against a gain of 0.8% by the KSE Price Index. Considering the above factors, we arrive at a price target of KWD 0.137, which exhibits an upside of 2.3% from its closing price of KWD 0.134 (as on October 08, 2009). Accordingly, we initiate our coverage on First Investment Company with a Neutral recommendation. KWD Millions 2007A 2008A 2009E 2010E 2011E Total Income 37.32 25.35 3.16 9.72 15.53 % Change YoY 38.7 -32.1 -87.5 207.1 59.9 Net Profit 25.38 3.23 -9.73 -2.54 1.39 % Change YoY 25.8 -87.3 N/A N/A N/A Net Profit Margin 68.0% 12.7% -307.5% -26.1% 8.9% Financing Income Yield 9.5% 3.7% 6.5% 6.7% 7.0% Adj. EPS (KWD) 0.039 0.005 -0.015 -0.004 0.002 ROAE 22.4% 2.5% -8.2% -2.2% 1.2% Call us on +973 17549499 or email us at [email protected] First Investment Company (OLAK.KW) CMP KWD 0.134 Target KWD 0.137 Upside 2.3% MSCI GCC Index 446.16 KSE Price Index 7,848.60 Key Stock Data Sector Financial Services Reuters Code OLAK.KW Bloomberg Code ALOLA KK Equity Net Out. Shares (mn) 649.431 Market Cap (KWD mn) 87.024 Market Cap (USD mn) 304.151 Avg. 12m Vol. (mn) 1.527 Volatility (30 day) 58.960 Volatility (90 day) 47.859 Stock Performance (%) 52 week high / low (KWD) 0.325 / 0.118 1M 3M 12M Absolute (%) -1.5 -37.4 -55.3 Relative (%) -2.1 -39.3 34.7 Shareholding Pattern (%) National Investments Company 16.59 National Investments Fund 16.27 Fahed Salem Al Homaidi 8.63 Kuwait Finance House 8.49 Al Safwa Investment Fund 5.30 Public 44.72 FIC and Kuwait Stock Exchange NEUTRAL
Transcript of First Investment Company (OLAK.KW) NEUTRAL · Established in 1997, First Investment Company (FIC)...

Executive Summary Established in 1997, First Investment Company (FIC) is a Kuwait-based public shareholding company, which got listed on the Kuwait Stock Exchange in 2001. It is primarily engaged in investing activities and providing Islamic financial services in accordance with Shariah principles. FIC operates through two segments - Islamic Financing and Investment.
FIC registered a massive 93% decline in total income During 1H09, FIC reported a 93.3% decline in total income to KWD 1.39 million from KWD 20.77 million in 1H08 on account of reduced activity in the financial sector. Gain on disposal of available for sale (AFS) investments contributed 22.6% to total income, decreasing 95.5% to KWD 0.31 million. On the services side, management fees fell 59.9% YoY to KWD 0.43 million. Share of losses of its associates amounted to KWD 1.39 million as against a gain of KWD 1.31 million in 1H08. On the other hand, murabaha, ijara and sukuk income jumped 76.2% to KWD 1.07 million, while dividend income increased nearly four-times to KWD 1.00 million from KWD 0.26 million. On the expenses side, total expenses increased 24.7% to KWD 5.21 million. Meanwhile, amid the current market scenario, the company incurred an impairment loss on its AFS investments of KWD 2.27 million in 1H09. As a result, FIC registered a net loss of KWD 5.48 million as opposed to a net profit of KWD 13.03 million in 1H08. Adjusted annualised loss per share (LPS) was KWD 0.017 compared to adjusted annualised earnings per share (EPS) of KWD 0.040 in 1H08.
Outlook and valuation Kuwait’s real GDP is expected to decline by 1.5% in 2009 due to the recent financial turmoil and economic slowdown. The Kuwaiti investment sector has not been immune from the recent turmoil, and has witnessed investment losses and huge impairment charges. As the growth of investment companies is primarily driven by the real estate sector, the decline in real estate prices and weak demand has negatively impacted the values of investments in the sector. Though the sector’s medium-to-long-term outlook looks promising, given the investment outlay to the tune of USD 267 billion across a variety of projects, a cautious approach is recommended until the economy revives completely. FIC’s financial performance suffered a blow in 2008 and 1H09 hurt by the financial crisis and economic downturn. Total assets fell 7.0% YoY, while investments in the real estate sector need to be watched cautiously to minimise the impact of a further decline in real estate prices. However, the diversification of FIC’s investments across the GCC and in other sectors like energy, banking and education has helped counter the decline in asset valuations to some extent. As we expect FIC to incur losses during 2009 and 2010, the stock’s P/E multiple for the periods remains non-conclusive. At the same time, we expect the company to trade at P/B multiples of 0.77x and 0.75x on 2009E and 2010E BVPS, respectively. Meanwhile, the stock has declined 46.4% since the beginning of this year as against a gain of 0.8% by the KSE Price Index. Considering the above factors, we arrive at a price target of KWD 0.137, which exhibits an upside of 2.3% from its closing price of KWD 0.134 (as on October 08, 2009). Accordingly, we initiate our coverage on First Investment Company with a Neutral recommendation. KWD Millions 2007A 2008A 2009E 2010E 2011E Total Income 37.32 25.35 3.16 9.72 15.53 % Change YoY 38.7 -32.1 -87.5 207.1 59.9 Net Profit 25.38 3.23 -9.73 -2.54 1.39 % Change YoY 25.8 -87.3 N/A N/A N/A Net Profit Margin 68.0% 12.7% -307.5% -26.1% 8.9% Financing Income Yield 9.5% 3.7% 6.5% 6.7% 7.0% Adj. EPS (KWD) 0.039 0.005 -0.015 -0.004 0.002 ROAE 22.4% 2.5% -8.2% -2.2% 1.2%
Call us on +973 17549499 or email us at [email protected]
First Investment Company (OLAK.KW)
CMP KWD 0.134 Target KWD 0.137 Upside 2.3%
MSCI GCC Index 446.16 KSE Price Index 7,848.60
Key Stock Data Sector Financial Services Reuters Code OLAK.KW Bloomberg Code ALOLA KK Equity Net Out. Shares (mn) 649.431 Market Cap (KWD mn) 87.024 Market Cap (USD mn) 304.151 Avg. 12m Vol. (mn) 1.527 Volatility (30 day) 58.960 Volatility (90 day) 47.859
Stock Performance (%) 52 week high / low (KWD) 0.325 / 0.118
1M 3M 12M Absolute (%) -1.5 -37.4 -55.3 Relative (%) -2.1 -39.3 34.7
Shareholding Pattern (%)
National Investments Company 16.59 National Investments Fund 16.27 Fahed Salem Al Homaidi 8.63 Kuwait Finance House 8.49 Al Safwa Investment Fund 5.30 Public 44.72
FIC and Kuwait Stock Exchange
NEUTRAL

Background First Investment Company (FIC) is a Kuwait-based public shareholding company, which was established in 1997 and got listed on the Kuwait Stock Exchange in 2001. The company is primarily engaged in investing activities and providing Islamic financial services in accordance with Shariah principles. The company invests through private equity, venture capital and asset management divisions. FIC has two operating segments - Islamic Financing and Investment. Through the Islamic Financing segment, the company provides a range of Islamic finance products to corporate and individual customers. The main objective and focus is on strategic investment placement services to institutional investors and high net-worth individuals. FIC has a successful track record of investing about USD 500 million in new product placements. Further, the company provides Islamic fund management services. The Investment segment, on the other hand, involves managing real estate investments, investment securities and investment in associates. FIC actively invests across an array of sectors that include real estate, energy, banking and education among others.
FIC has successfully invested nearly USD 500 million in new product placements Board of Directors • Chaired by Dr. Mohammed Al Alloush
• Mohammad M. Al-Gharaiba – Vice Chairman
• Khaled S. Al-Sanaousi • Saad A. Al-Hunayyan • Fahad A. Al-Mukhaizeem • Marzouq F. Al-Mutairi • Abdul Nasser Al-Subaih Source: FIC
First Investment Company (Products & Services)
Direct Investments • Establishing New
Companies • Acquisitions • Private Equity • Real Estate
Investments • Corporate Finance • Research & Advisory
Services
Asset Management • Portfolio
Management and Mutual Funds
• Treasury Services
Funds Management • First Gulf Equity
Fund • First Arabian Equity
2000 Fund • Muthanna Money
Market Fund
Business Model
FIC is diversifying its investments across the GCC into various growing sectors
FIRST INVESTMENT
COMPANY
Primarily engaged in investment activities through direct investments
Also provides Islamic products and services including asset management services
In a bid to diversify its revenue base, FIC expanded into real estate, energy, banking and education sectors

Subsidiaries/Associates/Affiliates of FIC FIC has a number of subsidiaries, associates and affiliates
SUBSIDIARIES/ASSOCIATES/INVESTMENTS COUNTRY % SHARE
Deema Real Estate Investment Company Saudi Arabia 100.00
First Investment Fund Company Bahrain 100.00
Shmoul Real Estate Company Saudi Arabia 100.00
Masadar Energy Company for General Trading Kuwait 98.00
Al Marwa Holding Company Kuwait 97.00
Yasmeen Al Kuwait Real Estate Company Kuwait 97.00
Asian Petroleum Facilities Maintenance Company Kuwait 50.00
Q80 Valve Industries Factory Kuwait 50.00
Sahab Al Khaleej Real Estate Company Bahrain 35.29
First Energy Resource Company Kuwait 33.21
Mashair Al Ola Saudi Arabia 30.00
Arkan Al Kuwait Real Estate Company Kuwait 28.83
Taameer Investment Company Oman 27.02
First Investment Bank - Bahrain Bahrain 26.66
INVESTMENTS
First Real Estate Investment Company Kuwait 19.79
First Education Company Kuwait 16.49
Burgan Company for Well Drilling Trading and Maintenance Kuwait 11.32
Bank Al Bilad Saudi Arabia 7.30
First Finance Company Qatar 4.60
FUNDS
Al-Muthanna Fund Kuwait -
First Arabian Equity 2000 Fund Bahrain -
First Gulf Equity Fund Bahrain - Source: Zawya

Middle East real GDP is likely to grow by 2.0% in 2009 Oil output is expected to contract in 2009
Industry Scenario According to the International Monetary Fund (IMF), the world economy will recede 1.1% during 2009 as a result of the continued economic slowdown. This is contrary to the positive growth rates of 5.2% and 3.0% registered for 2007 and 2008, respectively. However, the trend is likely to reverse with the growth rebounding to 3.1% in 2010. The Middle East region’s GDP, which registered a healthy real growth of 6.2% and 5.4% during 2007 and 2008, respectively, is likely to slow to 2.0% in 2009 before expanding 4.2% in 2010. Within the region, the GCC countries witnessed a GDP growth of 6.4% in 2008, but are likely to grow at a mere 1.3% during 2009 owing to multiple factors including weak oil prices, contraction of global demand and trade-related activity, liquidity crunch, lower tourism and reduced remittances. However, the GCC’s growth is expected to normalise to 4.2% in 2010 on improving market dynamics. Kuwait’s economy is largely dependent on hydrocarbon-related activities (oil & natural gas and refined petroleum products), which accounted for 56.8% of the nominal GDP and 94.9% of total export earnings during 2007. Buoyed by the high oil prices and consequent economic development, Kuwait’s real GDP had grown at an average 7.1% over the period 2004-2007, and has registered a growth rate of 6.3% in 2008. However, with the continuing economic slowdown and low export volumes, the growth in the country’s real GDP is expected to contract 1.5% in 2009 before recovering to 3.3% in 2010. Kuwait recorded a budget surplus of KWD 2.7 billion for the fiscal 2008/09 led by rising oil prices during the first half of 2008. Oil revenues accounted for nearly 94% of the total revenues of USD 72.3 billion that exceed the projections by 66.7%. Budgetary deficit is likely to stand at KWD 4.8 billion for 2009/10 on the budgeted revenues of KWD 8.1 billion.
Nominal GDP (KWD Billion) and Growth (%)
-
10
20
30
40
50
2005A 2006A 2007A 2008Est. 2009Exp. 2010Exp. 2011Exp.-30%
-15%
0%
15%
30%
45%
Nominal GDP YoY Grow th
Sectoral Contribution to GDP (2007)
0.6%
42.6%
56.8%
Crude Oil & Natural Gas Sector (incld. Petroleum Products)Non-oil SectorsImport Duties
Source: Economic Intelligence Unit Source: Central Bank of Kuwait Oil is likely to account for around half of Kuwait’s nominal GDP in 2009-10 and remain a significant driver of economic growth through increased government consumption. However, oil output, which increased 6.4% in 2008, is expected to contract this year following an agreement by OPEC to reduce oil production, before expanding about 9% in 2010. Growth in the services sector including financial services, logistics, telecommunications and retail, which account for around 40% of nominal GDP, is expected to be modest in 2009-10. Slowdown in economic growth, strengthening of the US dollar and the government’s commitment to extend subsidies is likely to reduce inflation from 10.6% in 2008 to 7.0% and 5.6% in 2009 and 2010, respectively. Further, with a dip in oil prices, export earnings are likely to fall leading to a current account deficit in 2009.
Current Account Surplus (KWD Billion) and as a % of Nominal GDP
-
10
20
30
40
50
60
2005A 2006A 2007A 2008Est. 2009Exp. 2010Exp. 2011Exp.0%
10%
20%
30%
40%
50%
60%
Current Account Surplus as a % of Nominal GDP
Consumer Price Index and Inflation (%)
-
32
64
96
128
160
192
2006A 2007A 2008Est 2009Exp 2010Exp 2011Exp0%
2%
4%
6%
8%
10%
12%
Consumer Price Index (CPI) Inf lation
Source: Economic Intelligence Unit

Recent financial crisis has impacted the investment companies’ assets growth Amid the deepening crisis, total assets and financial investment assets fell in 1H09 Amid the deepening crisis, total assets and financial investment assets fell in 1H09
The total number of investment companies in Kuwait including conventional as well as Islamic increased from 42 in 2004 to 99 in 2008 and further to 100 (46 conventional and 54 Islamic) by the end of 1H09. Accordingly, total assets of the investment companies grew at a 4-year CAGR of 28% to KWD 17.07 billion over 2004-08. While the assets of conventional investment companies grew at a 4-year CAGR of 17.7% over 2004-08, assets of Islamic investment companies witnessed an impressive CAGR of 50.8% over the same period. However, Islamic and conventional companies’ total assets to nominal GDP declined to 19.0% and 23.2% in 2008 from 20.8% and 29.6% in 2007, respectively. Moreover, since the end of 2008, total assets of investment companies have registered a decline of 9.4% in the first seven months ending July 2009 to KWD 15.46 billion. This can be attributed to the aftermath of the financial crisis and a fall in real estate demand and prices, which resulted in huge investment losses and impairments. Amongst these, Islamic investment companies were less affected than the conventional companies. Islamic companies registered a 6.3% decline in assets as against a 12.0% decline in assets of conventional companies during the same period.
Investment companies' assets to GDP
19.0%20.8%
16.3%11.7%
8.5%
27.8% 28.3% 28.2% 29.6%23.2%
0%
7%
14%
21%
28%
35%
2004 2005 2006 2007 2008Islamic Conventional
Total Assets Growth rates
-12%8%
28%48%68%88%
2004 2005 2006 2007 2008 July '09
Islamic Investment companiesConentional Investment companiesLocal Banks
Source: CBK, Economic Intelligence Unit Source: CBK The Islamic investment sector in Kuwait has 54 companies, which are regulated by the CBK. The major revenue source for the Islamic investment companies is the financial investments, which includes its profit-sharing business. With the rising popularity and demand for the Shariah-compliant product and services, the country’s Islamic investment sector attained tremendous growth in its financial investments, foreign assets and asset base supported by ample liquidity and rising money inflow owing to the high oil revenues till first half of 2008. Total assets within the sector grew at a CAGR of 50.8% over 2004-08, while financial investments and foreign assets advanced at a CAGR of 64.8% and 66.1%, respectively. However, amid the deepening crisis, total assets and financial investment assets plummeted 6.8% and 13.5%, respectively, during 1H09 compared to the end of 2008.
Total Assets of Islamic Investment Cos. (KWD Billion)
0134678
2004 2005 2006 2007 2008 1H09
Financial Investment Foreign Assets Total Assets
Total Liabilities of Islamic Investment Cos. (KWD Billion)
0134678
2004 2005 2006 2007 2008 1H09Funding from Financial Sector Foreign LiabilitiesOw n Funds Total Liabilities
Source: CBK Source: CBK On the liabilities front, these companies are strongly backed by their own funds, which constituted nearly 35.2% of their total liabilities as of July 2009. Majority funds are borrowed from the financial sector (28.9%), while foreign funding accounted for a significant 24.3%. From 2004-08, the company-owned funds rose at a CAGR of 49.0%, however declined by 6.6% in the 1H09 since 2008, owing to a fall in capital markets that negatively impacted the equity of various companies. Overall, total liabilities (excluding own funds) declined 7.0% in 1H09 over 2008. Going forward, investment companies continue to be suffering from the after effects of the economic crisis. Slower economic growth and weak financial markets have eroded the investments of the companies with impairment losses and heavy provisioning in 2Q09. The rather low level of economic activity continues to negatively impact the fees and commission income of investment companies. Moreover, the reversal in the trend for these companies can only be expected once the economies start moving on the growth path.

Assets worth USD 60-70 billion are being professionally managed in the GCC GCC sovereign wealth funds have lost more than USD 100 billion in highly leveraged markets Projects worth USD 2 trillion are either planned or underway in the GCC Real estate trading decreased 37% YoY in 2008
Asset Management Industry The increasing wealth within the GCC region mainly led by higher oil and gas revenues has necessitated the need to professionally manage assets. Assets under management (AUM) in the GCC cover investment funds, portfolio management services and discretionary portfolios. It has been estimated that currently, assets worth USD 60-70 billion are being professionally managed in the region. More than 70% of these AUM is in the form of funds. Country-wise Saudi Arabia is the largest market in the GCC with almost half of the regional funds followed by Kuwait. Amongst the funds in Kuwait, 51% are categorised as equity funds having the highest risk tolerance, followed by 26% as money market funds and 11% as fixed income funds. According to Cerulli Associates, a research provider, the Middle East’s AUM is expected to rise to USD 100 billion by 2012. However, the AUM industry was negatively impacted by the global financial crisis, which negatively impacted the regional financial markets, wiping off wealth across countries. Huge investment losses incurred on investments resulted in a rise in net loss for companies. Property prices rose on the back of easy availability of bank credit, with growth in credit reaching as high as 50% in countries like Qatar, Kuwait and UAE. The main reason behind the phenomenal rise in credit can be attributed to easy availability of cheap offshore funding. However, with the tremors of financial crisis even shaking the most fundamentally sound banks the availability of cheap money is curtailed. Moreover, the GCC banking systems are overleveraged, with loan-to-deposit ratios in excess of 100% in most countries. These call for a cautious lending approach and focus on increasing the deposits base to better prepare for any untoward situation. In addition to this, GCC sovereign wealth funds have lost more than USD 100 billion in a highly leveraged, aggressive deal making on Wall Street, the City of London, the European and Asian stock exchanges. The funds suffered losses as they sought leveraged stakes in international banks at their peak along with non-diversification from the petrochemical sector. Going forward, with an estimated wealth of USD 3 trillion, the region does present immense growth potential, but much will depend on the economic performance and how the revival from the financial crisis shapes up. Real Estate Rapid population growth, unprecedented expansion of the construction sector & industrial projects and huge investments in the GCC infrastructure led to a surge in the real estate sector. According to Middle East Economic Digest (MEED), projects worth USD 2.04 trillion are either planned or underway in the region, which in turn promises attractive growth prospects for the real estate sector. With investments to the tune of USD 266.99 billion, Kuwait ranks third in terms of infrastructure spending after UAE (USD 803.80 billion) and Saudi Arabia (USD 598.05 billion). However, the recent global credit crisis and cautious spending in the sector has slowed down the growth. The sector has been more prone to price correction and projects being delayed or postponed in the recent times. UAE, Kuwait and Saudi Arabia have projects worth USD 520.71 billion, USD 40.19 billion and USD 39.23 billion, respectively on hold as of August 18, 2009. Meanwhile, declining oil prices are expected to impact oil revenues and further affect the governments’ future investment plans.
Value of Projects in GCC (in USD billion as of August 18, 2009)
-
200
400
600
800
1,000
Bahrain Oman Qatar Kuw ait Saudi Arabia UAE
Value of Projects On Hold in GCC (in USD billion as of August 18, 2009)
-
110
220
330
440
550
Bahrain Qatar Oman Kuw ait Saudi Arabia UAE
Source: MEED Source: MEED The real estate sector in Kuwait is highly fragmented and dominated by small to medium-sized players. There are 58 real estate companies, of which 35 are listed. Since the economy is not vastly diversified, real estate as a sector receives a large portion of the bank credit. The major development in the Kuwaiti real estate sector was the promulgation of Laws 8 and 9 of 2008 in May 2009 that prevented all sole proprietorships from buying, selling, placing lien on and issuing letters of assignment to third parties and prevented Islamic banks from financing the residential housing. While real estate prices witnessed a 10%-30% decline in certain areas, real estate trading decreased 37% YoY in 2008. The trend continued in the first two quarters of 2009 with trading reportedly down 5.8% and 2.3% in 1Q09 and 2Q09, respectively.

The short-term outlook for the real estate sector looks weak; however medium to long term looks attractive
Real estate trading (KWD Billion)
0
1,000
2,000
3,000
4,000
5,000
2003 2004 2005 2006 2007 2008
Change in Real estate trading (YoY)
-36.0%
-18.0%
0.0%
18.0%
36.0%
54.0%
1Q07 2Q07 3Q07 4Q07 1Q08 2Q08 3Q08 4Q08 1Q09 2Q09
Source: Estate Registration & Authentication Dept. Ministry of Justice Private housing transactions increased 5.1% sequentially to KWD 180.46 billion in 2Q09 as transactions increased from 738 in 1Q09 to 834 for the quarter. This also represents a reversal in the trend as private housing transactions reported a 12.4% sequential decline in 1Q09 to KWD 171.67 billion. Furthermore, real estate investment transactions increased 3.7% sequentially to KWD 149.04 billion as the market regained confidence and looked for promising real estate opportunities. However, total commercial real estate trading dropped remarkably by 45.9% sequentially to KWD 81.74 billion due to the inability of some companies to pay off their debts and shortage of cash to finance existing projects. The global economic downturn continues to negatively impact the Kuwaiti real estate sector with reduced transactions and weakening real estate prices. On the other hand, the Kuwaiti government remains committed to adopting measures to minimise the impact and bail out the economy from the economic crisis. The government has set up the Real Estate Clearing Company (RECC) to highlight the problems in the real estate market, to improve regulatory clarity and extend quality market information. Moreover, to reduce inflation the government has also implemented a new regulation, which refrain investment companies from trading in residential properties. In addition, the central bank has also implemented other regulations that limit monthly interest and repayment instalments for private borrowers seeking a new loan to the equivalent of 40% or less of their salaries compared to the previous ceiling of 50%, which further affect property sales. Going forward, even though the short-term outlook for the sector looks weak on declining prices and demand, infrastructure spending lined up for the sector and government’s bid to diversify the economy from its oil-dependence promises hope in the long-term.

Total income plunged 32% to KWD 25 million on lower income from investments Operating expenses reduced 36% to KWD 2 million Adjusted EPS down to KWD 0.005 from KWD 0.039
Financial Performance – FY 2008 Operating income During 2008, FIC’s total income plummeted 32.1% to KWD 25.35 million from KWD 37.32 million in 2007 hurt by the decline in income from investments and fall in fair value of investments. Gain from disposal of AFS investments contributed 26.9% to total income (26.2% in 2007), decreasing 30.3% to KWD 6.82 million from KWD 9.79 million. While unrealised fair value gain on investments fell 41.0% YoY to KWD 5.47 million, realised fair value gain on investments declined 7.7% to KWD 3.96 million in 2008. Murabaha, ijara and sukuk income dropped 60.2% to KWD 1.39 million compared to KWD 3.48 million last year. On the services side, placement & arrangement fees declined a massive 93.2% to KWD 0.33 million from KWD 4.81 million, while management fees rose 69.0% YoY to KWD 1.35 million. Meanwhile, dividend income fell 58.8% to KWD 0.72 million, whereas share of results of associates soared 49.7% to KWD 4.45 million from KWD 2.98 million. Expenses FIC’s operating expenses declined 36.4% to KWD 1.91 million in 2008 from KWD 2.99 million in 2007 primarily on account of reduction in staff costs. Staff costs were down 37.7% YoY to KWD 1.81 million, while depreciation was up 4.0% to KWD 0.10 million. Other expenses decreased 40.7% to KWD 0.80 million. On the other hand, finance costs increased 64.1% to KWD 6.39 million from KWD 3.90 million last year. Overall, total expenses increased 10.4% YoY to KWD 9.1 million in 2008. Impairment The impact of the financial crisis and the fall in capital markets has forced financial institutions to record impairment losses owing to the decline in fair value of investments. FIC recorded a KWD 10.96 million and KWD 0.92 million impairment loss on its available for sale investments and other receivables, respectively. Net Profit Driven by higher expenses and impairment losses, FIC’s net profit plummeted 87.3% to KWD 3.23 million from KWD 25.38 million in 2007. Consequently, adjusted EPS stood at KWD 0.005, down from KWD 0.039.

0
8
16
24
32
40
2006A 2007A 2008A 1H08 1H09
Total Income (KWD Millions)
-10
0
10
20
30
2006A 2007A 2008A 1H08 1H09
Net Profit (KWD Millions)
0
30
60
90
120
150
2006A 2007A 2008A 1H08 1H09
Shareholders' Equity (KWD Millions)
0
60
120
180
240
300
2006A 2007A 2008A 1H08 1H09
Total Assets (KWD Millions)
RoAA
-5%0%5%
10%15%20%25%
2006A 2007A 2008A 1H08 1H09
RoAE
-10.0%
0.0%
10.0%
20.0%
30.0%
40.0%
2006A 2007A 2008A 1H08 1H09
Chart Gallery

Size of the Company The salient features of the balance sheet are as follows:
During 1H09, total assets declined 7.0% to KWD 243.80 million from KWD 262.20 million in 1H08. This was on account of decrease in investments and murabaha & ijara receivables. Investments carried at fair value through income statement, representing 10.9% (22.7% in 1H08) of total assets, fell 55.2% YoY to KWD 26.61 million, while murabaha & ijara receivables plunged 76.5% to KWD 4.87 million in 1H09. Moreover, bank & cash balances plummeted 92.6% to KWD 0.56 million from KWD 7.63 million.
The AFS investments, accounting for 45.6% (41.2% in 1H08) of total assets, increased a marginal
2.8% to KWD 111.05 million compared to KWD 108.00 million in 1H08. While investment in associates increased 15.3% YoY to KWD 55.70 million, properties under development stood at KWD 32.97 million compared to nil in the same period last year.
Total liabilities reduced 7.9% to KWD 114.69 million from KWD 124.52 million, as it cleared
outstanding balances with banks. Meanwhile, murabaha payables and other liabilities advanced 8.2% to KWD 103.87 million and 7.6% to KWD 10.83 million, respectively.
Shareholders’ equity reduced 12.7% to KWD 120.16 million from KWD 137.65 million mainly
driven by the decline in retained earnings and fair value of investments. Retained earnings turned negative KWD 1.05 million from positive KWD 15.23 million on losses, while cumulative changes in fair value decline 84.9% YoY to KWD 1.97 million in 1H09. However, total reserves increased 5.4% YoY to KWD 18.41 million, while foreign currency translation reserve turned positive to KWD 2.79 million from negative KWD 6.13 million. FIC’s minority interest amounting to KWD 8.95 million in 1H09 compared to KWD 0.03 million in 1H08.
Financial Performance Analysis – 1H09 During 1H09, FIC reported a 93.3% decline in total income to KWD 1.39 million from KWD 20.77 million in 1H08 on account of reduced activity in the financial sector. Gain from disposal of AFS investments, contributing 22.6% to total income (33.6% in 1H08), decreased 95.5% to KWD 0.31 million from KWD 6.97 million. The company recorded an unrealised gain on revaluation of investment properties of KWD 0.40 million during the period. FIC registered an unrealised fair value loss on investments of KWD 0.56 million as against a gain of KWD 4.15 million. On the services side, placement & arrangement fees decreased 74.9% YoY to KWD 0.06 million, while management fees fell 59.9% YoY to KWD 0.43 million in 1H09. FIC’s share of losses of its associates amounted to KWD 1.39 million as against a gain of KWD 1.31 million in 1H08. On the other hand, murabaha, ijara and sukuk income jumped 76.2% to KWD 1.07 million compared to KWD 0.61 million in the same period last year, while dividend income increased nearly four-times to KWD 1.00 million from KWD 0.26 million. On the expenses side, total expenses increased 24.7% to KWD 5.21 million from KWD 4.18 million on the back of increased finance costs and other expenses partially countered by a decline in staff costs. Meanwhile, given the current market scenario, the company incurred an impairment loss on AFS investments of KWD 2.27 million in 1H09. As a result, FIC registered a net loss of KWD 5.48 million as against a net profit of KWD 13.03 million in 1H08. Consequently, adjusted annualised LPS stood at KWD 0.017 compared to an adjusted annualised EPS of KWD 0.040 in the prior year period.
Total income plummeted 93% YoY to KWD 1.4 million FIC recorded a net loss of KWD 5.48 million as against a profit of KWD 13.03 million

Peer Comparison In order to do a peer comparison, we have taken comparable companies within Kuwait that includes Al Safat Investment Company, The Securities House and FIC.
Financial Performance of Comparable Companies (KWD '000) Al Safat SH FIC 2008 1H09 2008 1H09 2008 1H09 Total Income/(Loss) -3,081 4,670 4,907 -2,396 25,348 1,390 % YoY Growth -109.6 -87.5 -73.0 -108.8 -32.1 -93.3 Total Operating Profit -7,537 3,739 -24,031 -18,483 22,641 -33 % YoY Growth -125.6 -89.1 -393.7 -232.6 -31.3 -100.2 Net Profit -24,867 50 -25,612 -19,367 3,226 -5,483 % YoY Growth -201.1 -99.8 -193.7 -236.5 -87.3 -142.1 Total Investments 104,854 114,379 149,766 144,162 152,833 142,530 % YoY Growth -19.9 -42.6 -13.1 -24.5 -8.0 -24.2 Total Assets 208,661 209,577 315,708 289,631 250,553 243,800 % YoY Growth 12.6 -38.7 11.6 -17.5 16.2 -7.0 Total Liabilities 84,169 73,019 217,254 212,291 120,953 114,691 % YoY Growth -22.5 -39.4 17.2 -0.1 59.3 -7.9 Shareholders' Equity 124,466 136,533 89,993 69,447 120,872 120,161 % YoY Growth 62.2 -38.4 -4.0 -49.6 -13.5 -12.7 Operating expenses to income ratio -144.6% 19.9% 589.7% -671.4% 10.7% 102.3% Total Investments to Assets Ratio 50.3% 54.6% 47.4% 49.8% 61.0% 58.5% Equity to Total Assets Ratio 59.6% 65.1% 28.5% 24.0% 48.2% 49.3% RoAA -12.6% 0.0%* -8.6% -12.8%* 1.4% -4.4%* RoAE -24.7% 0.1%* -27.9% -48.6%* 2.5% -9.1%* Source: Zawya, FIC * Annualised

FIC is looking to merge with or acquire GIH
New Projects and Strategies In January 2009, FIC entered into an initial agreement with Gulf Investment House (GIH) leading eventually to a merger or an acquisition. As per the latest update in July 2009, Barclays Bank has been appointed to evaluate the assets of both the companies. The merger or acquisition would provide the two Islamic investment banks a larger capital base along with an expanded and diversified presence in the GCC region. SWOT Analysis
Risks and Concerns:
The current economic downturn could restrict its expansionary plans Lower oil revenue is driving away investments from infrastructure and real estate, which may
further dampen the activity in the sectors
THREATS
Intensifying competition with the expansion of regional players in the country Conventional banks opening more Islamic banking windows would impact its Islamic financing segment
OPPORTUNITIES
Rising popularity of Shariah-compliant products and services provide enormous growth opportunity Fall in capital markets throwing up investment opportunities at attractive valuations
WEAKNESS
Exposure to investments in a weak financial market
STRENGTHS
Wide range of Islamic products and services Diversified investments across the GCC
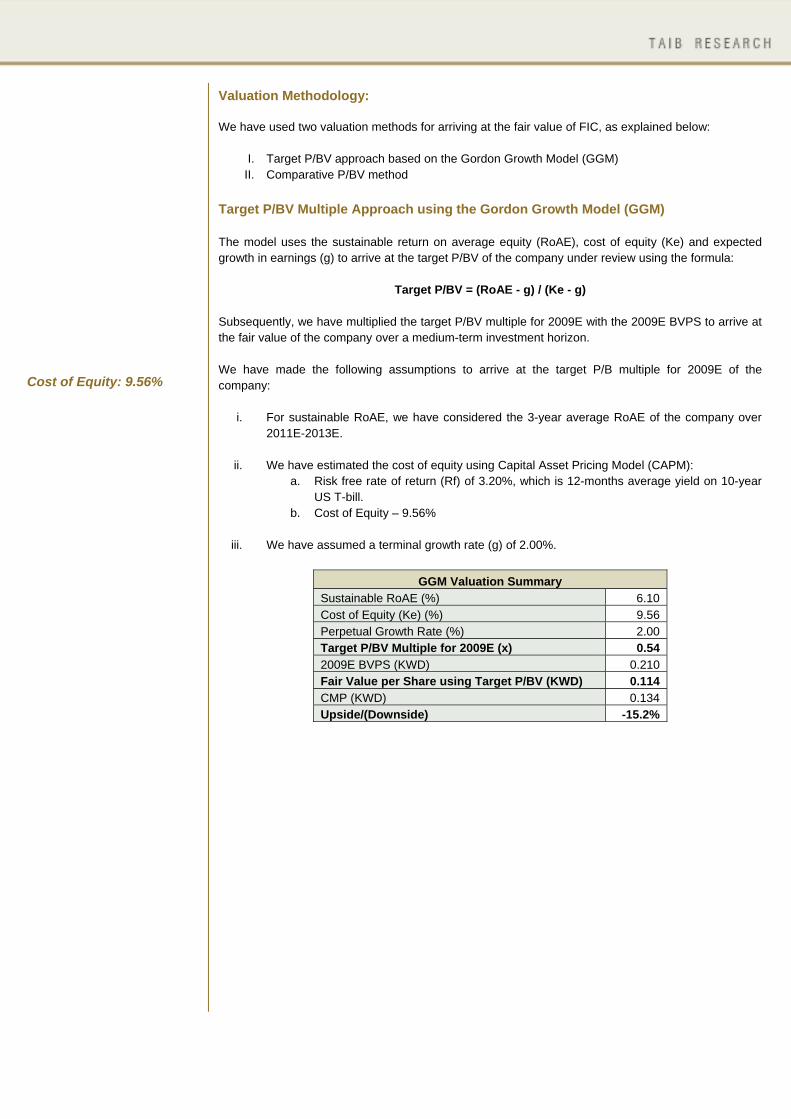
Cost of Equity: 9.56%
Valuation Methodology: We have used two valuation methods for arriving at the fair value of FIC, as explained below:
I. Target P/BV approach based on the Gordon Growth Model (GGM) II. Comparative P/BV method
Target P/BV Multiple Approach using the Gordon Growth Model (GGM) The model uses the sustainable return on average equity (RoAE), cost of equity (Ke) and expected growth in earnings (g) to arrive at the target P/BV of the company under review using the formula:
Target P/BV = (RoAE - g) / (Ke - g) Subsequently, we have multiplied the target P/BV multiple for 2009E with the 2009E BVPS to arrive at the fair value of the company over a medium-term investment horizon. We have made the following assumptions to arrive at the target P/B multiple for 2009E of the company:
i. For sustainable RoAE, we have considered the 3-year average RoAE of the company over 2011E-2013E.
ii. We have estimated the cost of equity using Capital Asset Pricing Model (CAPM):
a. Risk free rate of return (Rf) of 3.20%, which is 12-months average yield on 10-year US T-bill.
b. Cost of Equity – 9.56%
iii. We have assumed a terminal growth rate (g) of 2.00%.
GGM Valuation Summary Sustainable RoAE (%) 6.10 Cost of Equity (Ke) (%) 9.56 Perpetual Growth Rate (%) 2.00 Target P/BV Multiple for 2009E (x) 0.54 2009E BVPS (KWD) 0.210 Fair Value per Share using Target P/BV (KWD) 0.114 CMP (KWD) 0.134 Upside/(Downside) -15.2%

Sensitivity Analysis The tables below exhibits the sensitivity analysis for the estimated fair value per share based on various terminal growth rates, cost of equity and RoAE. The shaded area represents the most probable outcomes.
Sensitivity Analysis - GGM (Ke vs. g) Terminal/Perpetual Growth Rate (g)
Cost of Equity (Ke)
1.00% 1.50% 2.00% 2.50% 3.00% 7.56% 0.163 0.159 0.155 0.149 0.142 8.56% 0.141 0.137 0.131 0.125 0.117 9.56% 0.125 0.120 0.114 0.107 0.099
10.56% 0.112 0.106 0.100 0.094 0.086 11.56% 0.101 0.096 0.090 0.083 0.076
Sensitivity Analysis - GGM (Ke vs. RoAE)
Return on Average Equity (RoAE)
Cost of Equity (Ke)
4.10% 5.10% 6.10% 7.10% 8.10% 7.56% 0.079 0.117 0.155 0.192 0.230 8.56% 0.067 0.099 0.131 0.163 0.195 9.56% 0.058 0.086 0.114 0.141 0.169
10.56% 0.051 0.076 0.100 0.125 0.149 11.56% 0.046 0.068 0.090 0.112 0.134
Sensitivity Analysis - GGM (RoAE vs. g)
Terminal Growth Rate (g)
Return on Average Equity (RoAE)
1.00% 1.50% 2.00% 2.50% 3.00% 4.10% 0.076 0.068 0.058 0.047 0.035 5.10% 0.100 0.094 0.086 0.077 0.067 6.10% 0.125 0.120 0.114 0.107 0.099 7.10% 0.149 0.146 0.141 0.137 0.131 8.10% 0.174 0.172 0.169 0.166 0.163
Comparative P/BV Multiple Based Valuation
Comparative P/BV Multiple Based Valuation Summary FIC’s 2009E BVPS (KWD) 0.178 Target P/BV (x) 0.90 Fair Value per Share using Target P/BV (KWD) 0.161 CMP (KWD) 0.134 Upside/ Downside(-) 19.8%
Banks
Outstanding Shares
(millions) CMP# (KWD)
Market Capitalisation
(KWD millions)
BVPS (KWD)
P/BV (x)
First Investment Company 649.4 0.134 87.02 0.19 0.72 AREF Investment Group 1,061.3 0.166 176.17 0.25 0.65 Al Safat Investment Company 773.0 0.152 117.49 0.18 0.86 Gulf Investment House 442.2 0.102 45.10 0.14 0.75 The Securities House 680.0 0.154 104.72 0.10 1.51 Average TTM P/E 0.90 Sources: Zawya # CMP as on October 08, 2009

Weighted Average Fair Value On an equal weight basis (GGM – 50% and comparative P/BV – 50%), we have arrived at a final fair value of KWD 0.137 for FIC, which provides an upside of 2.3% from its current market price of KWD 0.134 (as on October 08, 2009).
Weighted Average Fair Value
Valuation Method
Fair Value per Share
(KWD) Weight Weighted Value per Share (KWD)
Target GGM Method 0.114 50% 0.057 Comparative P/BV Method 0.161 50% 0.080 Target Price 0.137 CMP (KWD) 0.134 Upside/Downside(-) 2.3%
Investment Opinion Kuwait’s real GDP grew at an average of 7.1% over the period 2004-2007 and has grown by 6.3% in 2008 driven by high oil prices and the associated economic development. However, with the prevailing economic crisis and reduced oil revenues, the country’s real GDP growth is likely to contract by 1.5% in 2009 before recovering to 3.3% in 2010. In addition, the budget deficit is likely to hover around KWD 4.8 billion for 2009-10 compared to a surplus of KWD 2.7 billion for 2008-09. Till the impact of the crisis was felt, credit facilities and investments witnessed strong growth given the ample liquidity and high oil prices. However, the investment sector has been badly hit by the economic slowdown with the expected contraction in the GDP growth along with the lower budget allocation. Meanwhile, the capital markets have also witnessed the effect of the financial crisis that remained weak and generated negative returns. This resulted in huge investment losses and impairment charges for the companies having large exposure to investments. As a result, in the first five months of 2009, total assets of investment companies’ declined 9.4% to KWD 15.46 billion. Simultaneously, the real estate sector has also been impacted by the economic crisis, with several projects being put on hold or cancelled due to liquidity crunch and reduced demand and falling prices. Subsequently, this has resulted in the downward revision in fair value of real estate assets. On an optimistic side, the government has taken various measures through stimulus packages, changes in regulations and bail-outs to revive the economy. Along with the measures taken by government, the recent increase in oil prices has resulted in higher oil revenues. Kuwait has earned KWD 6.64 billion in the first five months of 2009-10, about 82% of projected annual income. This reflects the ability to fund infrastructure projects that were reduced doubting lower income. Though the sector’s medium to long term outlook looks promising on investments to the tune of USD 267 billion across a variety of projects, a cautious approach is recommended until the economy takes a full u-turn from the downturn. FIC is primarily engaged in the investing activities and providing financial services in accordance to Islamic Shariah-principles. FIC has efficiently diversified itself through its investments across the GCC and in various sectors like real estate, energy, banking and education sectors. Hurt by the financial crisis and economic downturn, the company’s financial performance suffered a big blow in 2008 and 1H09. The company reported a decline of 87.3% YoY in net profits and incurred losses in 1H09. FIC recognised impairment on investments to the tune of 43.3% and 163.6% of total income in 2008 and 1H09, respectively. Moreover, total assets fell 7.0% YoY in 1H09, while investments exposed to the real estate sector are required to be cautiously watched to minimise the impact of a further decline in real estate prices. Though the expected recovery in the economy would create growth opportunities for the company in the medium-to-long-term, the current economic slowdown leaves no option except to have cautious approach on the company. As we expect FIC to incur losses during 2009 and 2010, the stock’s P/E multiple for the periods remains non-conclusive. At the same time, we expect the company to trade at P/B multiples of 0.77x and 0.75x on 2009E and 2010E BVPS, respectively. Meanwhile, the stock has declined 46.4% since the beginning of this year as against a gain of 0.8% by the Kuwait Stock Exchange Price Index (KSE Price Index). Considering the above factors, we arrive at a price target of KWD 0.137, which exhibits an upside of 2.3% from its closing price of KWD 0.134 (as on October 08, 2009). Accordingly, we initiate our coverage on First Investment Company with a Neutral recommendation.
Fair Value: KWD 0.137 Investment Opinion: NEUTRAL

Financial Statements
Consolidated Balance Sheet (KWD '000) 2007A 2008A 1H08A 1H09A 2009E 2010E 2011E ASSETS Bank balances and cash 657 1,170 7,627 562 1,573 3,570 3,756 Investments carried at fair value through income statement 49,218 25,624 59,448 26,608 27,430 30,396 33,287 Murabaha and ijara receivables 12,686 14,792 20,692 4,869 5,270 6,258 7,463 Amount due from a bank 0 0 13,199 0 0 0 0 Other assets 7,812 8,679 4,773 11,910 12,027 12,909 13,527 Available for sale investments 104,167 112,417 108,000 111,054 114,484 126,864 139,844 Investment in associates 40,999 56,235 48,295 55,702 56,429 60,704 65,715 Properties under development 0 31,488 0 32,971 33,990 37,666 41,247 Furniture and equipment 103 148 169 125 129 143 156 TOTAL ASSETS 215,644 250,553 262,203 243,800 251,331 278,510 304,996 EQUITY AND LIABILITIES Equity Share capital 58,767 65,107 65,107 65,107 65,107 65,107 65,107 Share premium 32,447 32,910 32,910 32,910 32,910 32,910 32,910 Treasury shares -3,865 0 0 0 0 0 0 Statutory reserve 6,945 7,276 6,945 7,276 7,276 7,276 7,418 General reserve 6,384 7,046 6,384 7,046 7,046 7,046 7,189 Share options reserve 2,137 3,017 3,017 3,017 3,017 3,017 3,017 Treasury shares reserve 1,000 1,122 1,139 1,091 1,091 1,091 1,091 Cumulative changes in fair value 14,228 1,733 13,042 1,973 1,973 1,973 1,973 Foreign currency translation reserve -4,086 -1,773 -6,125 2,791 2,791 2,791 2,791 Retained earnings 25,707 4,434 15,233 -1,049 -5,294 -7,829 -6,726 139,664 120,872 137,652 120,161 115,916 113,381 114,769 Minority interest 32 8,728 34 8,949 8,948 8,947 8,947 Total equity 139,695 129,600 137,686 129,109 124,864 122,328 123,716 Liabilities Murabaha payables 66,174 109,967 95,998 103,865 110,308 123,629 137,216 Amount due to bank 0 0 18,460 0 0 0 0 Other liabilities 9,774 10,986 10,059 10,826 16,159 32,553 44,063 Total liabilities 75,948 120,953 124,517 114,691 126,467 156,182 181,279 TOTAL EQUITY AND LIABILITIES 215,644 250,553 262,203 243,800 251,331 278,510 304,996
Source: FIC

Consolidated Income Statement (KWD '000) 2007A 2008A 1H08A 1H09A 2009E 2010E 2011E INCOME Murabaha, ijara and sukuk income 3,483 1,387 608 1,072 1,962 2,270 2,654 Realised gain on investments carried at fair value through income statement 4,291 3,959 6,084 13 53 1,401 2,200 Unrealised gain on investments carried at fair value through income statement 9,270 5,468 4,150 -559 -576 577 2,297 Unrealised gain on revaluation of investment properties 0 0 0 400 400 0 0 Gain on disposal of available for sale investments 9,785 6,824 6,972 314 648 1,479 3,029 Gain on sale of associated companies 148 93 100 0 0 0 0 Excess of interest in the net fair value of identifiable assets, liabilities and contingent liabilities over the cost of acquisition 0 765 0 0 0 0 0 Placement and arrangement fees 4,808 327 231 58 115 230 471 Management fees 797 1,347 1,063 426 944 1,086 1,249 Dividend income 1,759 724 257 999 1,008 217 614 Share of results of associates 2,976 4,453 1,309 -1,388 -1,447 2,456 3,020 Other income 0 0 0 56 56 0 0 37,317 25,348 20,773 1,390 3,163 9,716 15,533 EXPENSES Impairment of other receivables 0 924 924 0 0 0 0 Impairment of available for sale investments 0 10,964 0 2,274 2,274 0 0 Provision against murabaha and ijara receivables 0 0 0 194 194 0 0 Reversal of credit losses 0 -331 0 0 0 0 0 Staff costs 2,898 1,806 1,170 745 1,948 2,097 2,577 Cost of share based transaction with employees 1,320 880 880 0 0 0 0 Loss or (gain) on foreign exchange 1,393 501 1,159 -801 -801 0 0 Depreciation 95 99 45 58 120 133 146 Provision charge for murabaha and ijara 0 0 0 0 0 0 0 Finance costs 3,896 6,394 2,635 3,786 7,592 8,509 9,512 Other expenses 1,353 802 328 620 1,568 1,512 1,874 10,956 22,039 7,141 6,875 12,894 12,252 14,109 Profit Before Contribution To KFAS, NLST, Zakat and Directors’ Remuneration 26,361 3,309 13,632 -5,485 -9,731 -2,536 1,424 Contribution to KFAS -231 -10 -123 0 0 0 -4 Contribution to NLST -640 -52 -341 0 0 0 -22 Zakat -16 -21 -136 0 0 0 -9 Directors’ remuneration -100 0 0 0 0 0 0 PROFIT FOR THE YEAR 25,375 3,226 13,032 -5,485 -9,731 -2,536 1,388 Attributable to: Profit Attributable To The Equity Holder Of The Parent Company 25,375 3,226 13,032 -5,483 -9,728 -2,535 1,388 Minority interest 0 0 0 -2 -3 -1 0
Source: FIC

Consolidated Cash Flow Statement (KWD '000) 2007A 2008A 1H08A 1H09A 2009E 2010E 2011E OPERATING ACTIVITIES Profit for the year 25,375 3,226 13,632 -5,485 -9,731 -2,536 1,388 Adjustments for: Realised gain on investments at fair value through income statement -4,291 -3,959 -6,084 -13 -53 -1,401 -2,200 Unrealised gain on investments at fair value through income statement -9,270 -5,468 -4,150 559 576 -577 -2,297 Unrealised gain on revaluation of investment properties 0 0 0 -400 -400 0 0 Gain on disposal of available for sale investments -9,785 -6,824 -6,972 -314 -648 -1,479 -3,029 Dividend income -1,759 -724 -257 -999 -1,008 -217 -614 Share of results of associates -2,976 -4,453 -1,309 1,388 1,447 -2,456 -3,020 Gain on sale of associated companies -148 -93 -100 0 0 0 0 Excess of interest in the net fair value of identifiable assets, liabilities and contingent liabilities over the cost of acquisition 0 -765 0 0 0 0 0 Impairment of other receivables 0 924 924 0 0 0 0 Impairment of available for sale investments 0 10,964 0 2,274 2,274 0 0 Reversal of credit losses 0 -331 0 0 0 0 0 Loss or (gain) on foreign exchange 0 0 1,159 -801 -801 0 0 Depreciation 95 99 45 58 120 133 146 Cost of share based payment 1,320 880 880 0 0 0 0 Finance cost 3,896 6,394 2,635 3,786 7,592 8,509 9,512 Murabaha, ijara and sukuk income -3,483 -1,387 -608 -1,072 -1,962 -2,270 -2,654 -1,025 -1,517 -204 -1,018 -2,595 -2,294 -2,767 Changes in operating assets and liabilities: Investments carried at fair value through income statement -20,415 375 2,024 1,324 -2,329 -988 1,606 Murabaha and ijara receivables 2,455 -1,693 -7,031 -477 9,521 -988 -1,205 Amount due from bank 0 0 -13,199 0 0 0 0 Amount due to bank 0 0 18,460 0 0 0 0 Other assets 6,758 -3,431 458 132 -3,347 -883 -618 Other liabilities 1,356 1,213 390 -131 5,173 16,394 11,510 Cash from operations -10,872 -5,053 899 -171 6,423 11,241 8,527 Murabaha, ijara and sukuk income received 3,519 1,761 0 684 2,393 2,541 2,706 Finance cost paid -3,294 -6,555 -2,633 -3,895 -7,669 -8,468 -9,371 Net cash (used in)/from operating activities -10,646 -9,846 -1,734 -3,382 1,147 5,314 1,861 INVESTING ACTIVITIES Dividends income received 1,759 724 257 999 1,008 217 614 Net proceeds from disposal/(purchase) of available for sale investments -17,326 -14,629 -6,081 2,763 -572 -10,901 -9,950 Net proceeds from disposal/(purchase) of investment in associates -22,768 -7,068 -2,247 454 -794 -1,819 -1,992 Dividend received from associate 116 663 664 174 178 72 246 Purchase of properties under development 0 -371 0 -357 -1,654 -3,676 -3,582 Purchase of investment properties 0 0 -1,780 0 0 0 0 Purchase of furniture and equipments -43 -144 -111 -35 -101 -147 -159 Net cash (used in)/from investing activities -38,262 -20,824 -9,298 3,999 -1,933 -16,253 -14,823

Consolidated Cash Flow Statement (KWD '000) 2007A 2008A 1H08A 1H09A 2009E 2010E 2011E FINANCING ACTIVITIES Movement in murabaha payables 21,551 43,792 30,280 -1,194 1,189 12,937 13,148 Purchase and sale of treasury shares, net 5,652 3,988 4,005 -32 0 0 0 Issue of share capital 31,664 926 926 0 0 0 0 Dividends -12,475 -17,522 -17,209 0 0 0 0 Minority Interests 32 0 0 0 0 0 0 Net cash (used in)/from financing activities 46,423 31,184 18,001 -1,225 1,189 12,937 13,148 (DECREASE) INCREASE IN CASH AND BANK BALANCES -2,485 513 6,970 -608 403 1,998 186 Cash and bank balances at the beginning of the year 3,142 657 657 1,170 1,170 1,573 3,570 CASH AND BANK BALANCES AT THE END OF THE YEAR 657 1,170 7,627 562 1,573 3,570 3,756
Source: FIC

Common – Size Statements
Common-Size Consolidated Balance Sheet 2007A 2008A 1H08A 1H09A 2009E 2010E 2011E ASSETS Bank balances and cash 0.3% 0.5% 2.9% 0.2% 0.6% 1.3% 1.2% Investments carried at fair value through income statement 22.8% 10.2% 22.7% 10.9% 10.9% 10.9% 10.9% Murabaha and ijara receivables 5.9% 5.9% 7.9% 2.0% 2.1% 2.2% 2.4% Amount due from a bank 0.0% 0.0% 5.0% 0.0% 0.0% 0.0% 0.0% Other assets 3.6% 3.5% 1.8% 4.9% 4.8% 4.6% 4.4% Available for sale investments 48.3% 44.9% 41.2% 45.6% 45.6% 45.6% 45.9% Investment in associates 19.0% 22.4% 18.4% 22.8% 22.5% 21.8% 21.5% Properties under development 0.0% 12.6% 0.0% 13.5% 13.5% 13.5% 13.5% Furniture and equipment 0.0% 0.1% 0.1% 0.1% 0.1% 0.1% 0.1% TOTAL ASSETS 100.0% 100.0% 100.0% 100.0% 100.0% 100.0% 100.0% EQUITY AND LIABILITIES Equity Share capital 27.3% 26.0% 24.8% 26.7% 25.9% 23.4% 21.3% Share premium 15.0% 13.1% 12.6% 13.5% 13.1% 11.8% 10.8% Treasury shares -1.8% 0.0% 0.0% 0.0% 0.0% 0.0% 0.0% Statutory reserve 3.2% 2.9% 2.6% 3.0% 2.9% 2.6% 2.4% General reserve 3.0% 2.8% 2.4% 2.9% 2.8% 2.5% 2.4% Share options reserve 1.0% 1.2% 1.2% 1.2% 1.2% 1.1% 1.0% Treasury shares reserve 0.5% 0.4% 0.4% 0.4% 0.4% 0.4% 0.4% Cumulative changes in fair value 6.6% 0.7% 5.0% 0.8% 0.8% 0.7% 0.6% Foreign currency translation reserve -1.9% -0.7% -2.3% 1.1% 1.1% 1.0% 0.9% Retained earnings 11.9% 1.8% 5.8% -0.4% -2.1% -2.8% -2.2% 64.8% 48.2% 52.5% 49.3% 46.1% 40.7% 37.6% Minority interest 0.0% 3.5% 0.0% 3.7% 3.6% 3.2% 2.9% Total equity 64.8% 51.7% 52.5% 53.0% 49.7% 43.9% 40.6% Liabilities Murabaha payables 30.7% 43.9% 36.6% 42.6% 43.9% 44.4% 45.0% Amount due to bank 0.0% 0.0% 7.0% 0.0% 0.0% 0.0% 0.0% Other liabilities 4.5% 4.4% 3.8% 4.4% 6.4% 11.7% 14.4% Total liabilities 35.2% 48.3% 47.5% 47.0% 50.3% 56.1% 59.4% TOTAL EQUITY AND LIABILITIES 100.0% 100.0% 100.0% 100.0% 100.0% 100.0% 100.0%

Common-Size Consolidated Income Statement 2007A 2008A 1H08A 1H09A 2009E 2010E 2011E INCOME Murabaha, ijara and sukuk income 9.3% 5.5% 2.9% 77.1% 62.0% 23.4% 17.1% Realised gain on investments carried at fair value through income statement 11.5% 15.6% 29.3% 0.9% 1.7% 14.4% 14.2% Unrealised gain on investments carried at fair value through income statement 24.8% 21.6% 20.0% -40.2% -18.2% 5.9% 14.8% Unrealised gain on revaluation of investment properties 0.0% 0.0% 0.0% 28.7% 12.6% 0.0% 0.0% Gain on disposal of available for sale investments 26.2% 26.9% 33.6% 22.6% 20.5% 15.2% 19.5% Gain on sale of associated companies 0.4% 0.4% 0.5% 0.0% 0.0% 0.0% 0.0% Excess of interest in the net fair value of identifiable assets, liabilities and contingent liabilities over the cost of acquisition 0.0% 3.0% 0.0% 0.0% 0.0% 0.0% 0.0% Placement and arrangement fees 12.9% 1.3% 1.1% 4.2% 3.6% 2.4% 3.0% Management fees 2.1% 5.3% 5.1% 30.7% 29.9% 11.2% 8.0% Dividend income 4.7% 2.9% 1.2% 71.9% 31.9% 2.2% 4.0% Share of results of associates 8.0% 17.6% 6.3% -99.9% -45.7% 25.3% 19.4% Other income 0.0% 0.0% 0.0% 4.0% 1.8% 0.0% 0.0% 100.0% 100.0% 100.0% 100.0% 100.0% 100.0% 100.0% EXPENSES Impairment of other receivables 0.0% 3.6% 4.4% 0.0% 0.0% 0.0% 0.0% Impairment of available for sale investments 0.0% 43.3% 0.0% 163.6% 71.9% 0.0% 0.0% Provision against murabaha and ijara receivables 0.0% 0.0% 0.0% 13.9% 6.1% 0.0% 0.0% Reversal of credit losses 0.0% -1.3% 0.0% 0.0% 0.0% 0.0% 0.0% Staff costs 7.8% 7.1% 5.6% 53.6% 61.6% 21.6% 16.6% Cost of share based transaction with employees 3.5% 3.5% 4.2% 0.0% 0.0% 0.0% 0.0% Loss or (gain) on foreign exchange 3.7% 2.0% 5.6% -57.7% -25.3% 0.0% 0.0% Depreciation 0.3% 0.4% 0.2% 4.2% 3.8% 1.4% 0.9% Provision charge for murabaha and ijara 0.0% 0.0% 0.0% 0.0% 0.0% 0.0% 0.0% Finance costs 10.4% 25.2% 12.7% 272.4% 240.0% 87.6% 61.2% Other expenses 3.6% 3.2% 1.6% 44.6% 49.6% 15.6% 12.1% 29.4% 86.9% 34.4% 494.6% 407.6% 126.1% 90.8% Profit Before Contribution To KFAS, NLST, Zakat and Directors’ Remuneration 70.6% 13.1% 65.6% -394.6% -307.6% -26.1% 9.2% Contribution to KFAS -0.6% 0.0% -0.6% 0.0% 0.0% 0.0% 0.0% Contribution to NLST -1.7% -0.2% -1.6% 0.0% 0.0% 0.0% -0.1% Zakat 0.0% -0.1% -0.7% 0.0% 0.0% 0.0% -0.1% Directors’ remuneration -0.3% 0.0% 0.0% 0.0% 0.0% 0.0% 0.0% PROFIT FOR THE YEAR 68.0% 12.7% 62.7% -394.6% -307.6% -26.1% 8.9% Attributable to: Profit Attributable To The Equity Holder Of The Parent Company 68.0% 12.7% 62.7% -394.4% -307.5% -26.1% 8.9% Minority interest 0.0% 0.0% 0.0% -0.1% -0.1% 0.0% 0.0%
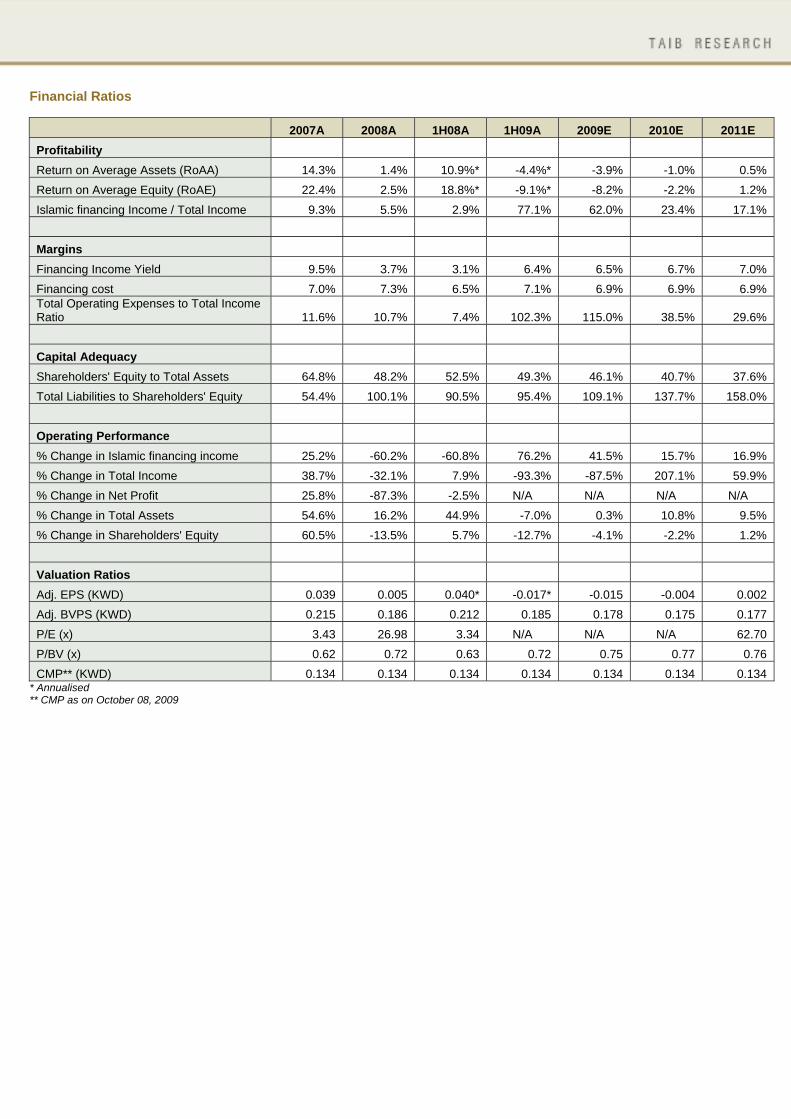
Financial Ratios
2007A 2008A 1H08A 1H09A 2009E 2010E 2011E Profitability Return on Average Assets (RoAA) 14.3% 1.4% 10.9%* -4.4%* -3.9% -1.0% 0.5% Return on Average Equity (RoAE) 22.4% 2.5% 18.8%* -9.1%* -8.2% -2.2% 1.2% Islamic financing Income / Total Income 9.3% 5.5% 2.9% 77.1% 62.0% 23.4% 17.1% Margins Financing Income Yield 9.5% 3.7% 3.1% 6.4% 6.5% 6.7% 7.0% Financing cost 7.0% 7.3% 6.5% 7.1% 6.9% 6.9% 6.9% Total Operating Expenses to Total Income Ratio 11.6% 10.7% 7.4% 102.3% 115.0% 38.5% 29.6% Capital Adequacy Shareholders' Equity to Total Assets 64.8% 48.2% 52.5% 49.3% 46.1% 40.7% 37.6% Total Liabilities to Shareholders' Equity 54.4% 100.1% 90.5% 95.4% 109.1% 137.7% 158.0% Operating Performance % Change in Islamic financing income 25.2% -60.2% -60.8% 76.2% 41.5% 15.7% 16.9% % Change in Total Income 38.7% -32.1% 7.9% -93.3% -87.5% 207.1% 59.9% % Change in Net Profit 25.8% -87.3% -2.5% N/A N/A N/A N/A % Change in Total Assets 54.6% 16.2% 44.9% -7.0% 0.3% 10.8% 9.5% % Change in Shareholders' Equity 60.5% -13.5% 5.7% -12.7% -4.1% -2.2% 1.2% Valuation Ratios Adj. EPS (KWD) 0.039 0.005 0.040* -0.017* -0.015 -0.004 0.002 Adj. BVPS (KWD) 0.215 0.186 0.212 0.185 0.178 0.175 0.177 P/E (x) 3.43 26.98 3.34 N/A N/A N/A 62.70 P/BV (x) 0.62 0.72 0.63 0.72 0.75 0.77 0.76 CMP** (KWD) 0.134 0.134 0.134 0.134 0.134 0.134 0.134
* Annualised ** CMP as on October 08, 2009

DISCLAIMER: All reasonable care has been taken to ensure that the information contained herein is not misleading or untrue at the time of publication, but we make no representation as to its accuracy or completeness. All information is for the private use of the person to whom it is provided without any liability whatsoever on the part of TAIB Securities WLL, any associated company or the employees thereof. Nothing contained herein should be construed as an offer to buy or sell or a solicitation of an offer to buy or sell. The value of any investment may fall as well as rise. Past performance is no guide to the future. The rate of exchange between currencies may cause the value of the investment to increase or diminish. Consequently, investors may not get back the full value of their original investment
Call us on +973 17549499 or email us at [email protected]