Kuwait Oil Company Gas Flaring - World...
13
www.kockw.com Kuwait Oil Company Gas Flaring Global Gas Flaring Reduction Partnership’s (GGFR) Steering Committee Washington DC, USA November 2011
Transcript of Kuwait Oil Company Gas Flaring - World...

www.kockw.com
Kuwait Oil Company Gas Flaring
Global Gas Flaring Reduction Partnership’s (GGFR)
Steering Committee
Washington DC, USA
November 2011

KOC Gas & Condensate Handling
2 December 2011 2
HP Sour Rich Gas
HP Lean (Fuel)
Gas (Mainly C1)
BS-140
BS-150
Ric
h F
uel G
as
SE
K / N
K
KOC Fuel Gas
Requirement
LP Lean
(Fuel) Gas
WK Gas
Sweetening
Facility
NK GCs
SEK
GCs
WK GCs
BS-131
HP Gas
LP Gas
Jurassic
EPF-50
LP
G –
MA
A
LPG Rich
By-Pass
AG
RP
s –
MA
A &
SH
U
HP Export Rich Gas
Sour Condensate
Condensate
MEW,
KNPC,
EQUATE
PIC,
SHU,
MISC
C5+ (KNG)
LPG
Ethane EQUATE
Slug-
Catcher Pig-Trap
Pig-Trap
Slug-
Catcher
HP Gas
HP Gas
LP Gas Burn-Off Pit
Coanda
Flare
LP Fuel
Relief Stacks
BS-170 Wafra
JO Gas
HP Fuel
Relief Stacks
Kuwait National Petroleum Corporation Kuwait Oil Company
Pentane
EXPORT
Imported LNG
www.kockw.com
Future Plans & Projects
3
Current exports to KNPC are about 1.25 – 1.40 BSCFD Rich Gas &
about 50 M BLPD condensate. The total gas production after
development of all phases of Jurassic, KGOC and ‘Others’ is aimed at
about 4.0 BSCFD by 2030.
KOC has a corporate mission to achieve gas flaring of < 1% of its
production by end of 2012-13. Currently it is ~ 1.15%.
KOC is building new booster stations and new rich gas & condensate
export pipelines in all assets to increase reliability / availability of surface
facilities.
New large diameter fuel pipelines are being built to feed power stations
with alternate / back-up fuels besides gas, supply of which is limited.
New motor-driven Tank Vapor Compressors (TVCs) are replacing old
machines and efficient air-assisted flares are replacing obsolete flares
thereby maximizing gas utilization.
www.kockw.com
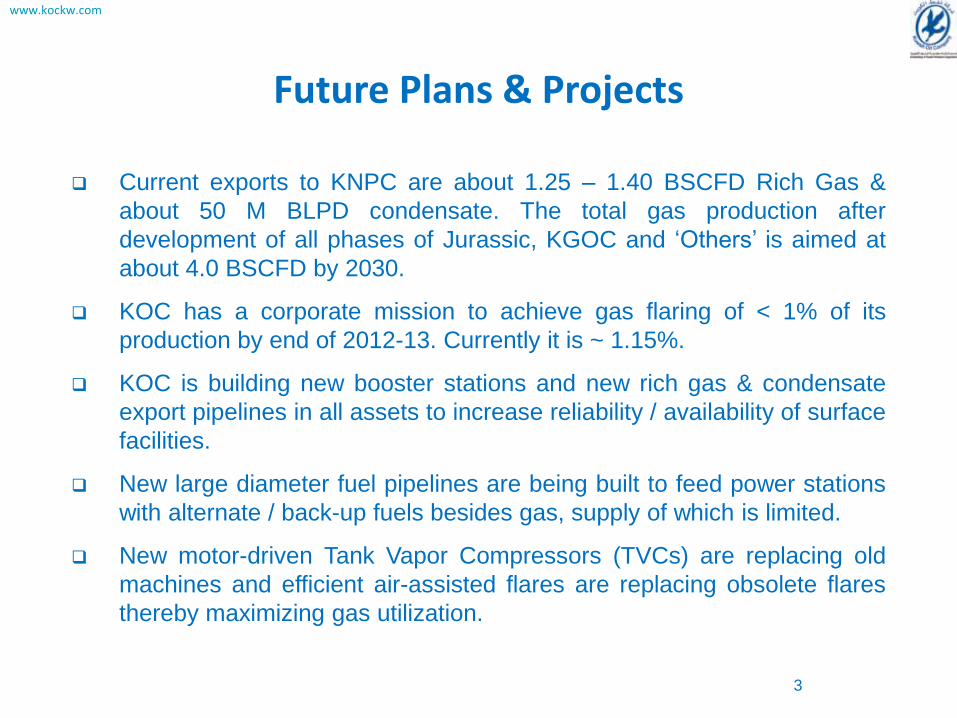
KOC’s Flaring Vision
Where we were Where we are
17.18% 1.14%
2005-06 2011-12 Q2
Where we aim
< 1.0%
2012-13
www.kockw.com
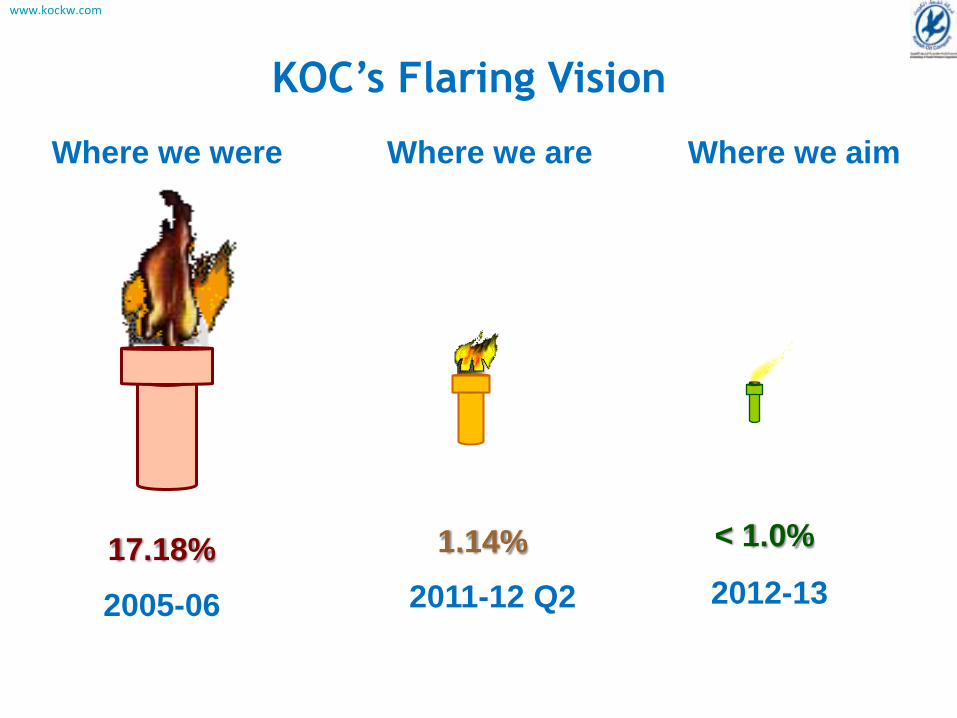
KOC Gas Flaring Over The Years
5
www.kockw.com
17.18%
9.94%
7.72%
3.98%
2.60%
1.75% 1.14%
0
5
10
15
20
2005-06 2006-07 2007-08 2008-09 2009-10 2010-11 2011-12 2012-13
Fla
ring,
as
%age o
f G
as
Pro
ducti
on
KOC Flaring Over The Past Few Years: As % of Gas Produced
% : Target / Plans
% : Actual Performance
2.30%
4.80%
YTD Sep „11
3.40%
1.80% 1.00%
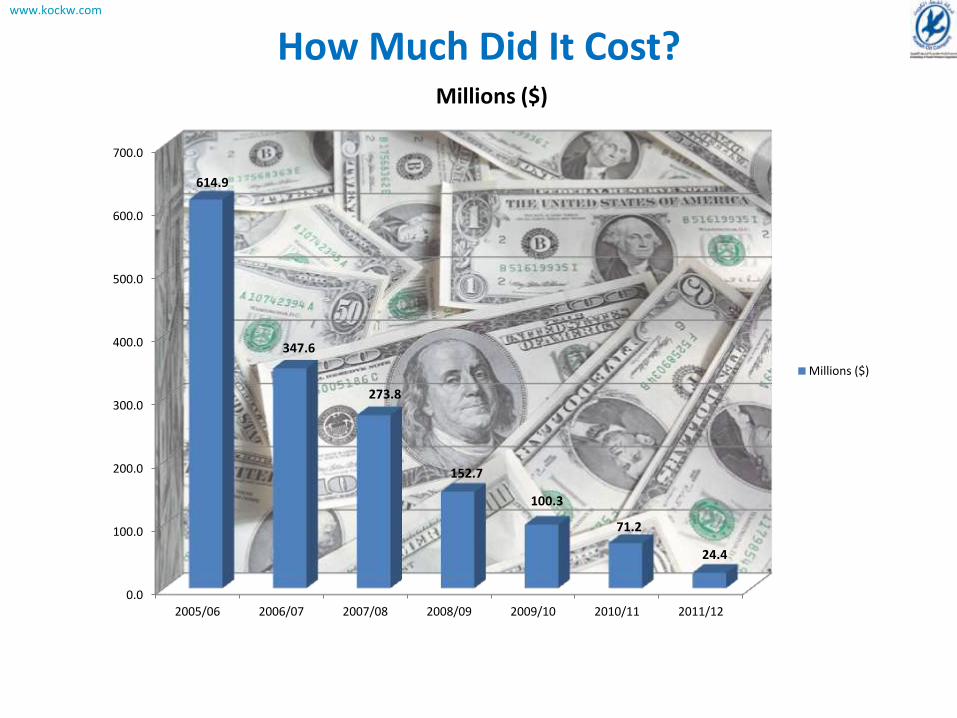
How Much Did It Cost?
0.0
100.0
200.0
300.0
400.0
500.0
600.0
700.0
2005/06 2006/07 2007/08 2008/09 2009/10 2010/11 2011/12
614.9
347.6
273.8
152.7
100.3
71.2
24.4
Millions ($)
Millions ($)
www.kockw.com
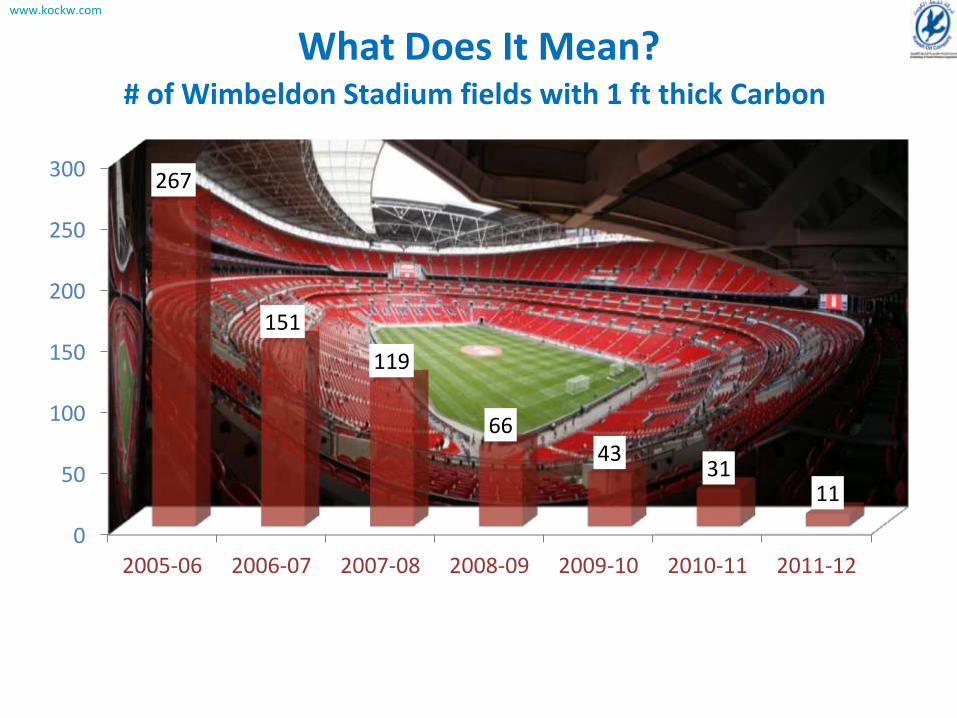
What Does It Mean?
0
50
100
150
200
250
300
2005-06 2006-07 2007-08 2008-09 2009-10 2010-11 2011-12
267
151
119
66 43
31 11
# of Wimbeldon Stadium fields with 1 ft thick Carbon
www.kockw.com
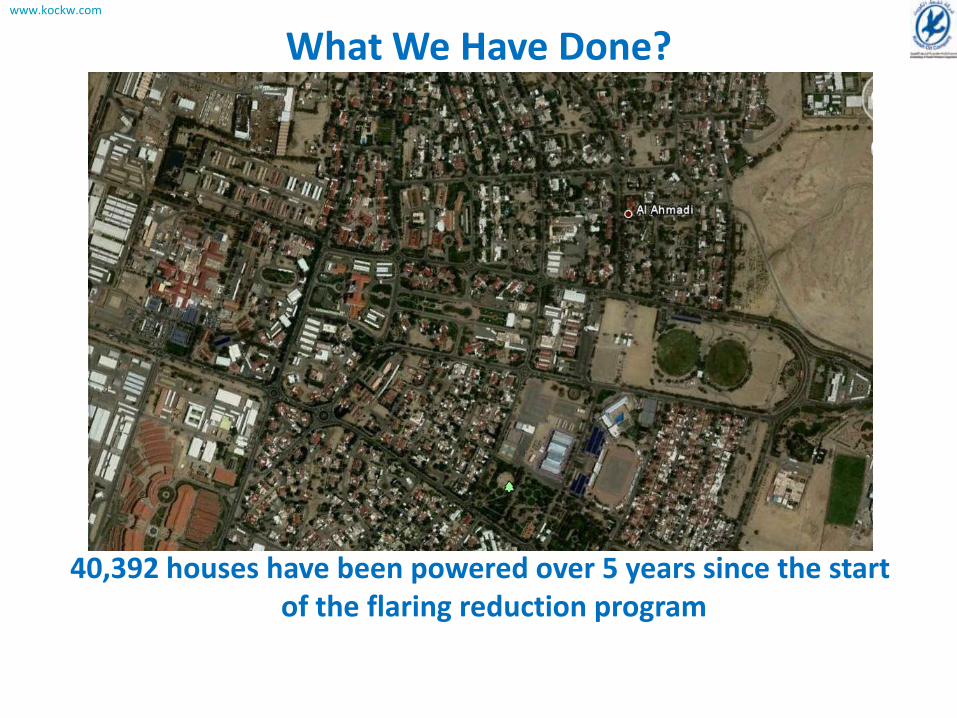
What We Have Done?
40,392 houses have been powered over 5 years since the start of the flaring reduction program
www.kockw.com
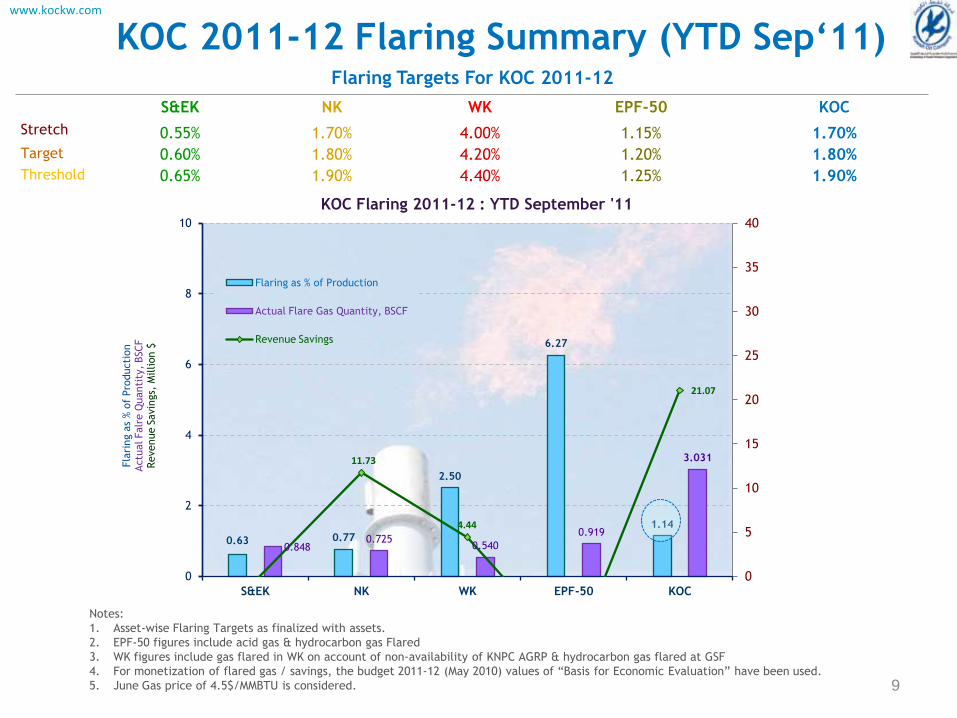
KOC 2011-12 Flaring Summary (YTD Sep‘11)
9
Flaring Targets For KOC 2011-12
S&EK NK WK EPF-50 KOC
Stretch 0.55% 1.70% 4.00% 1.15% 1.70%
Target 0.60% 1.80% 4.20% 1.20% 1.80%
Threshold 0.65% 1.90% 4.40% 1.25% 1.90%
Notes:
1. Asset-wise Flaring Targets as finalized with assets.
2. EPF-50 figures include acid gas & hydrocarbon gas Flared
3. WK figures include gas flared in WK on account of non-availability of KNPC AGRP & hydrocarbon gas flared at GSF
4. For monetization of flared gas / savings, the budget 2011-12 (May 2010) values of “Basis for Economic Evaluation” have been used.
5. June Gas price of 4.5$/MMBTU is considered.
www.kockw.com
0.63 0.77
2.50
6.27
1.14
0.848 0.725
0.540
0.919
3.031 11.73
4.44
21.07
0
5
10
15
20
25
30
35
40
0
2
4
6
8
10
S&EK NK WK EPF-50 KOC
Fla
ring a
s % o
f Pro
ducti
on
Actu
al Falr
e Q
uanti
ty,
BSCF
Revenue S
avin
gs,
Million $
KOC Flaring 2011-12 : YTD September '11
Flaring as % of Production
Actual Flare Gas Quantity, BSCF
Revenue Savings

KOC 2011-12 Flaring Summary (YTD September ‘11)
10
www.kockw.com
Notes:
1. Non-KOC Operated Facilities include KNPC Gas Plants (LPG & AGRPs), Jurassic EPF-50 & WK Gas Sweetening Facility (GSF).
2. EPF-50 figures include acid gas & hydrocarbon gas Flared
3. WK figures include gas flared in WK on account of non-availability of KNPC AGRP & hydrocarbon gas flared at GSF
YTD Sep ’11 KOC Flaring = 3.031 BSCF
SEK: 848 MMSCF
28%
NK: 725 MMSCF
24%
WK: 540 MMSCF
18%
EPF-50: 919 MMSCF
30%
Asset-Wise Break-Up from Overall KOC Flaring

How Did We Do It? Gas Flaring Related Capital Projects
“Projects Completed”
11
Project Title Cost
Million ($)
Upgrading of LP Gas Network in SEK 23.0
Modification in Tank Vapor System in EK GCs 40.1
New 30” HP Export Gas Line from BS-140 to GCMB 8.8
Facilities Modernization Project in SK (including 3 New Condensate Recovery Units in GC-3, 4 &6)
886.1
Facilities Modernization Project in EK (including 8 New Condensate Recovery Units in GC-1, 2 , 9, 10, 11, 19, 20 & 22)
1417.5
GC-28 Capacity Expansion (Including 3rd Compressor Train) 97.9
Gas Sweetening Facility in WK (EPF) 22.6
New Booster Station BS - 160 at SEK facilities 570.0
40"Gas Line from BS-131 (NK) to LPG Plant (MAA) 509.3
Installation of New Air-Assisted Flare Stacks at GC-17 /27 / 28 & BS-170 & Liquid Separator Area Near GC-11
29.9
www.kockw.com

Gas Flaring Related Capital Projects
12
Project Title Cost
Million
($)
New Booster Station BS - 171 at West Kuwait Area.
906.3
New Booster Station BS - 132 and enhancement of BS 131 (NK)
721.2
3 New Tank Vapor Compressors in GC - 7, 8 & 21 121.7
GCP for GC-16 & Gas Re-Injection Project 75.1
MAA - Sabiya/Doha Fuel Pipelines (EF/1713) 1404.8
MAA - Azzour/Shuaiba Fuel Pipelines (EF/1760) 833.3
Project Title Improvements to Existing Booster Stations BS-140 & BS-150 including new smokeless flares
Replacement of 40” HP Export Gas Pipeline from M/F-GCMB to LPG Plant (MAA-02).
Replacement of 16” Condensate line by a new 20" pipeline from GCMB Manifold to MAA-02
New 24" Export Gas pipeline & 14" condensate pipeline from BS-171 to AGRP-MAA
14 New Multi-point Smokeless HP flares at SEK GCs
“Projects Awarded” “Projects Under KOC GATE
System & Contract Action”
With Total Cost of 7.9 Billions $
www.kockw.com

www.kockw.com
THANK YOU