Financial Summary FY2013-1Q - 東北電力 · 2020-03-02 · Financial Summary 3rd Quarter of...
19
Financial Summary 3rd Quarter of FY2013 ( April 1, 2013 – December 31, 2013) January 30, 2014 Tohoku Electric Power Co., Inc.
Transcript of Financial Summary FY2013-1Q - 東北電力 · 2020-03-02 · Financial Summary 3rd Quarter of...

Financial Summary
3rd Quarter of FY2013
( April 1, 2013 – December 31, 2013)
January 30, 2014
Tohoku Electric Power Co., Inc.

Contents
1. Summary of Financial Results
2. Electricity Sales
3. Large Industry Sector
4. Electricity Generated and Purchased, Major Factors
5. Comparison Statements of Revenue & Expense (Non-Consolidated)
6. Balance Sheets (Non-Consolidated)
7. Statements of Income, Balance Sheets (Consolidated)
8. Segment Information (Consolidated)
■ Topics ■
■ Financial Results ■
1. Tohoku Electric Power Group Midterm Management Policy
(FY2014-2018)
2. Current Situations and Outlook for Onagawa Nuclear Power Station
3. Current Situations and Outlook for Higashidori Nuclear Power Station
4-6. Results of an additional geological survey on the faults within the
premises of the Higashidori nuclear power plant

3rd quarter of FY2013
Financial Results

1 Summary of Financial Results
3rd quarter of
FY2013
(A)
3rd quarter of
FY2012
(B)
Comparison Consolidated/Non-consolidated
of 3rd quarter of FY2013
(A) - (B) (A) / (B) Comparison Ratio
Conso
lidated
Operating Revenues 1,425.8 1,274.5 151.3 111.9% 133.4 1.10 times
Operating Income (Loss) 38.9 ( 25.2 ) 64.1 - ( 1.0 ) 0.97 times
Ordinary Income (Loss) 9.4 ( 55.7 ) 65.2 - ( 0.3 ) 0.96 times
Net Income (Loss) 13.1 ( 56.1 ) 69.2 - ( 2.9 ) 0.81 times
Non-C
onso
lidated
Operating Revenues 1,292.4 1,140.4 152.0 113.3%
Operating Income (Loss) 39.9 ( 14.9 ) 54.8 -
Ordinary Income (Loss) 9.8 ( 13.9 ) 23.8 -
Net Income (Loss) 16.0 ( 14.3 ) 30.3 -
(billions of yen)
■ Year-on-year comparison of non-consolidated ordinary income (increase of 23.8 billions of yen)
+39.0
(13.2)
+54.0
(19.9)
FY2013-3Q
(28.5)
(13.9)
(7.6)
+9.8 FY2012-3Q
Electricity rate revision
Haramachi Thermal
restoration
Increase in depreciation
Increase in maintenance
cost Decrease in dividends income
Others
5,000
5,500
6,000
6,500
7,000
7,500
8,000
Apr. May Jun. Jul. Aug. Sep. Oct. Nov. Dec. Jan. Feb. Mar.
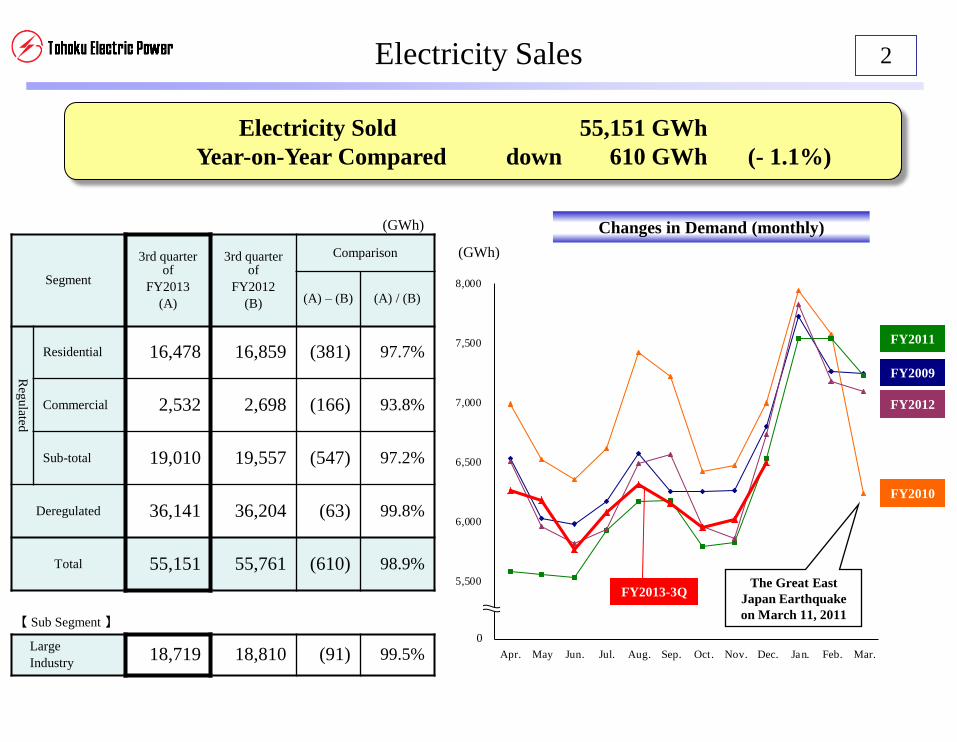
2 Electricity Sales
Electricity Sold 55,151 GWh
Year-on-Year Compared down 610 GWh (- 1.1%)
(GWh)
Segment
3rd quarter of
FY2013
(A)
3rd quarter of
FY2012
(B)
Comparison
(A) – (B) (A) / (B)
Reg
ulated
Residential 16,478 16,859 (381) 97.7%
Commercial 2,532 2,698 (166) 93.8%
Sub-total 19,010 19,557 (547) 97.2%
Deregulated 36,141 36,204 (63) 99.8%
Total 55,151 55,761 (610) 98.9%
【 Sub Segment 】
Large
Industry 18,719 18,810 (91) 99.5%
Changes in Demand (monthly)
FY2009
FY2010
FY2012
FY2013-3Q The Great East
Japan Earthquake
on March 11, 2011
(GWh)
0
FY2011
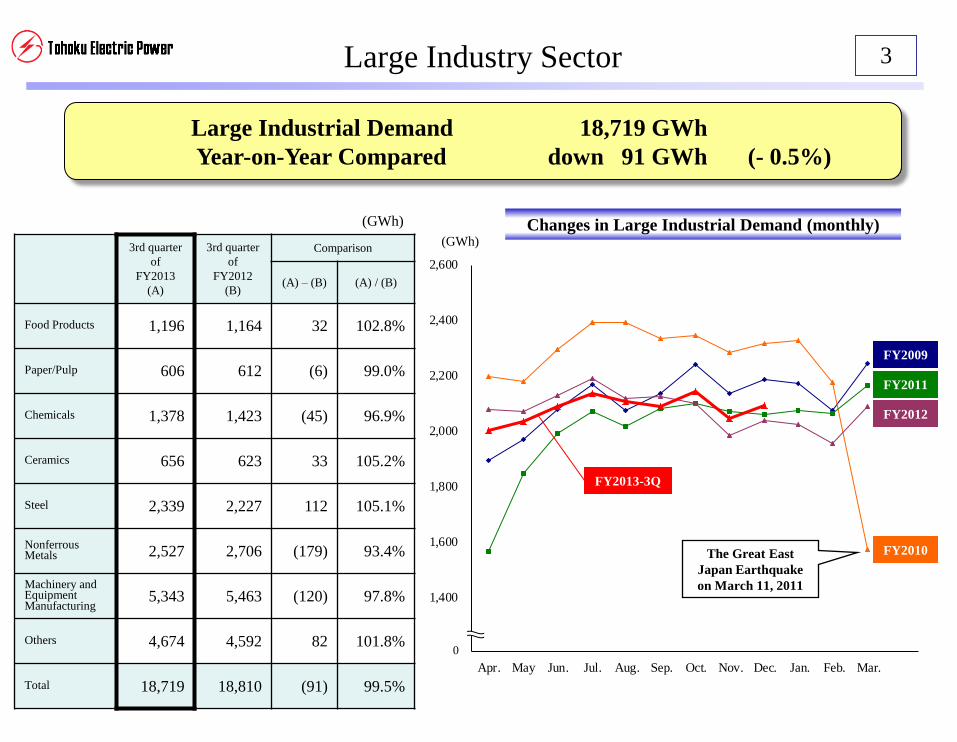
Large Industry Sector
3rd quarter
of
FY2013
(A)
3rd quarter
of
FY2012
(B)
Comparison
(A) – (B) (A) / (B)
Food Products 1,196 1,164 32 102.8%
Paper/Pulp 606 612 (6) 99.0%
Chemicals 1,378 1,423 (45) 96.9%
Ceramics 656 623 33 105.2%
Steel 2,339 2,227 112 105.1%
Nonferrous Metals 2,527 2,706 (179) 93.4%
Machinery and Equipment Manufacturing
5,343 5,463 (120) 97.8%
Others 4,674 4,592 82 101.8%
Total 18,719 18,810 (91) 99.5%
3
Changes in Large Industrial Demand (monthly) (GWh)
1,200
1,400
1,600
1,800
2,000
2,200
2,400
2,600
Apr. May Jun. Jul. Aug. Sep. Oct. Nov. Dec. Jan. Feb. Mar.
FY2009
FY2011
FY2010
FY2012
The Great East
Japan Earthquake
on March 11, 2011
(GWh)
0
Large Industrial Demand 18,719 GWh
Year-on-Year Compared down 91 GWh (- 0.5%)
FY2013-3Q
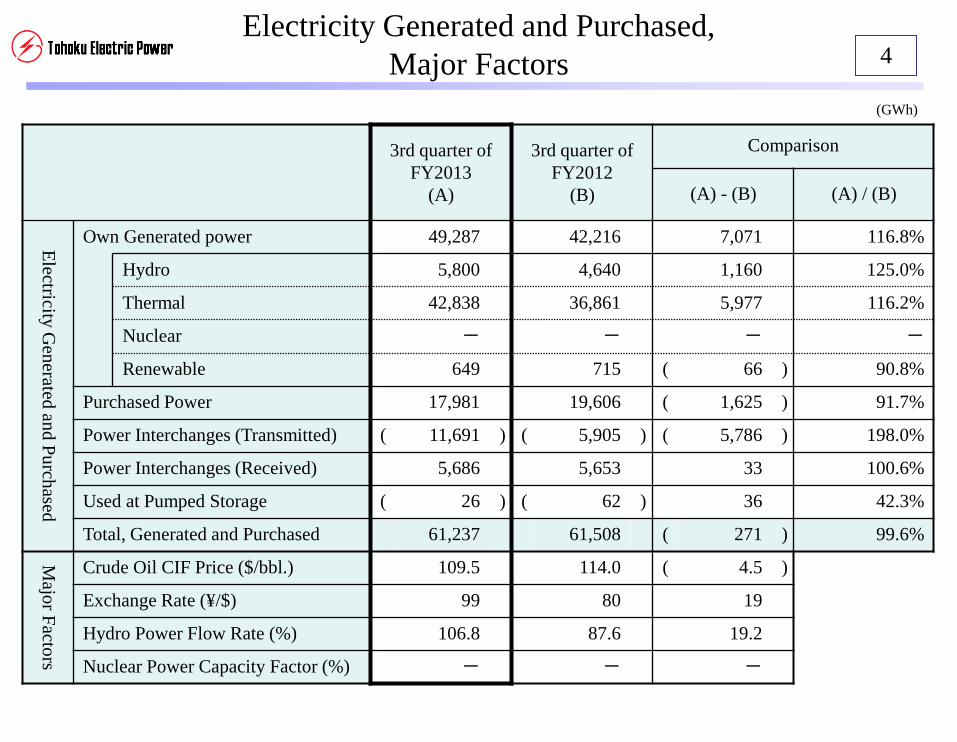
4 Electricity Generated and Purchased,
Major Factors
3rd quarter of
FY2013
(A)
3rd quarter of
FY2012
(B)
Comparison
(A) - (B) (A) / (B)
Electricity
Gen
erated an
d P
urch
ased
Own Generated power 49,287 42,216 7,071 116.8%
Hydro 5,800 4,640 1,160 125.0%
Thermal 42,838 36,861 5,977 116.2%
Nuclear - - - -
Renewable 649 715 ( 66 ) 90.8%
Purchased Power 17,981 19,606 ( 1,625 ) 91.7%
Power Interchanges (Transmitted) ( 11,691 ) ( 5,905 ) ( 5,786 ) 198.0%
Power Interchanges (Received) 5,686 5,653 33 100.6%
Used at Pumped Storage ( 26 ) ( 62 ) 36 42.3%
Total, Generated and Purchased 61,237 61,508 ( 271 ) 99.6%
Majo
r Facto
rs
Crude Oil CIF Price ($/bbl.) 109.5 114.0 ( 4.5 )
Exchange Rate (¥/$) 99 80 19
Hydro Power Flow Rate (%) 106.8 87.6 19.2
Nuclear Power Capacity Factor (%) - - -
(GWh)

5 Comparison Statements of Revenue & Expense
(Non-consolidated)
3rd quarter of FY2013
(A)
3rd quarter of FY2012
(B)
Comparison Increase/Decrease
(A) - (B) (A) / (B)
Rev
enues
Residential 396.0 379.8 16.1 104.3% Rise in electricity rate: 70.3 Surcharge on renewable energy: 11.0 Decrease in electric sales volume: (10.6)
Commercial 657.5 602.9 54.5 109.0%
Sub total 1,053.5 982.8 70.7 107.2% Sales of power to other utilities 164.1 118.1 46.0 138.9% Thermal power interchange: 30.0
Sales of power to other companies 19.9 3.9 15.9 498.9%
Other revenues 60.2 71.8 ( 11.5 ) 83.9% Dividends income: (28.5), Grants on the act of renewable energy: 18.4
[Operating revenues] [ 1,292.4 ] [ 1,140.4 ] [ 152.0 ] [ 113.3% ]
Total revenues 1,297.9 1,176.8 121.0 110.3%
Exp
enses
Personnel 103.6 108.2 ( 4.6 ) 95.7%
Fuel 408.1 386.4 21.7 105.6% Exchange gain: 76.0, Drop in CIF: (29.7) Increase in the proportion of coal fuel: (24.6)
Maintenance 82.2 74.5 7.6 110.3% Thermal power: 2.3, Nuclear power: 2.0
Depreciation 176.4 156.4 19.9 112.7% Thermal power: 22.7, Nuclear power: (1.5)
Power purchased from other utilities 95.5 81.2 14.3 117.6%
Power purchased from other companies 201.9 192.9 9.0 104.7% Photovoltaic power: 6.7, Wind power: 6.3
Interest 32.0 30.0 1.9 106.5%
Taxes, etc. 60.8 59.4 1.4 102.5%
Nuclear power back-end cost 5.1 4.1 0.9 123.6%
Other expenses 122.0 97.2 24.7 125.4% Payment on the act of renewable energy: 10.8 Contribution to the Fund of Nuclear Damage Liability Facilitation: 8.0
Total expenses 1,288.0 1,190.8 97.2 108.2%
[Operating income (loss)] [ 39.9 ] [ ( 14.9 ) ] [ 54.8 ] [ - ]
Ordinary income (loss) 9.8 ( 13.9 ) 23.8 -
Extraordinary gain 16.2 - 16.2 - Gain on revision of retirement benefit plan: 16.2
Extraordinary loss - 13.5 ( 13.5 ) - Loss on disaster: (13.5)
Net income (loss) 16.0 ( 14.3 ) 30.3 -
(billions of yen)

6
Dec. 31, 2013
(A)
Mar. 31, 2013
(B)
Comparison
(A) - (B) Increase/Decrease
Total Assets 3,878.5 3,996.5 ( 117.9 )
Fixed Assets 3,439.1 3,529.5 ( 90.4 )
Current Assets 439.4 466.9 ( 27.5 )
Liabilities 3,440.4 3,577.1 ( 136.6 ) Reserve for loss on disaster: (40.4)
Accrued retirement benefits: (35.2)
Net Assets 438.0 419.3 18.6
Interest-Bearing Liabilities
2,651.5 2,631.3 20.1 Bonds: 20.0
CP: 20.0
Loans: (19.8)
Balance Sheets (Non-consolidated)
(billions of yen)

7
3rd quarter of
FY2013
(A)
3rd quarter of
FY2012
(B)
Comparison
(A) - (B) Increase/Decrease
Operating Revenues 1,425.8 1,274.5 151.3 Electric power: 150.6, Other: 0.6
Operating Expenses 1,386.9 1,299.8 87.1 Electric power: 92.0, Other: (4.9)
Operating Income (Loss) 38.9 ( 25.2 ) 64.1
Ordinary Income (Loss) 9.4 ( 55.7 ) 65.2
Extraordinary Gain 16.2 - 16.2 Gain on revision of retirement benefit plan: 16.2
Extraordinary Loss - 13.5 ( 13.5 ) Loss on disaster: (13.5)
Net Income (Loss) 13.1 ( 56.1 ) 69.2
Dec 31, 2013
(A)
Mar. 31, 2013
(B)
Comparison
(A) - (B) Increase/Decrease
Total Assets 4,154.0 4,284.3 ( 130.3 )
Fixed Assets 3,552.6 3,645.1 ( 92.4 )
Current Assets 601.3 639.2 ( 37.8 )
Liabilities 3,616.2 3,761.6 ( 145.4 ) Reserve for loss on disaster: (40.4) Accrued retirement benefits: (35.3)
Net Assets 537.7 522.7 15.0
Interest-Bearing Liabilities 2,700.9 2,714.5 ( 13.5 ) Loans: (53.5), Bonds: 20.0, CP: 20.0
Statements of Income, Balance Sheets
(Consolidated) (billions of yen)
(billions of yen)
Statements of Income
Balance Sheets
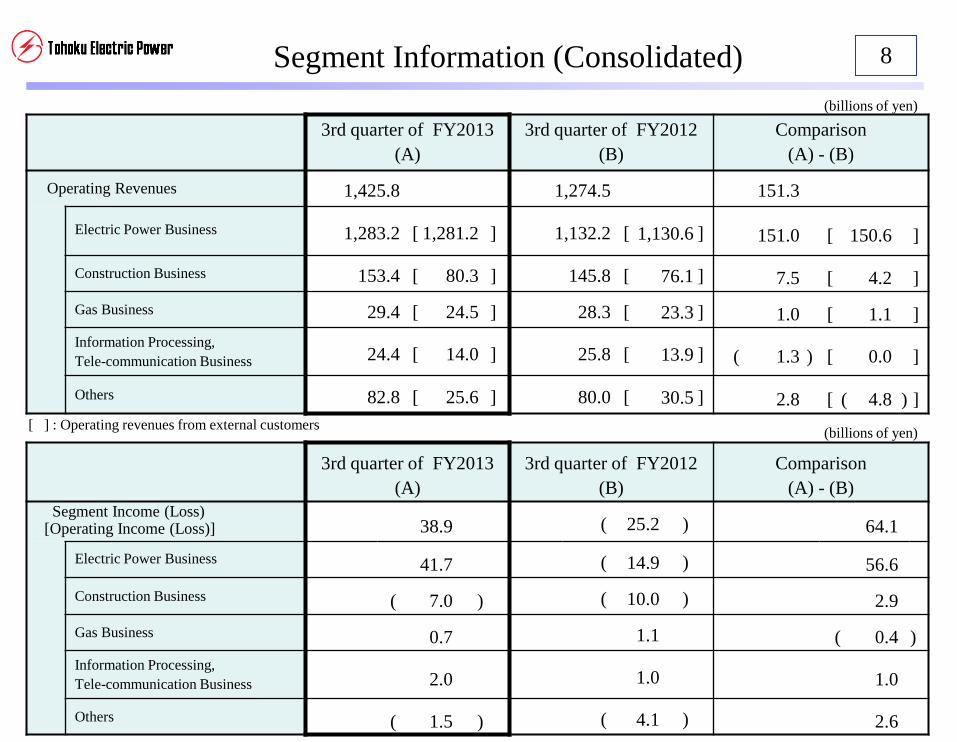
Segment Information (Consolidated)
3rd quarter of FY2013
(A)
3rd quarter of FY2012
(B)
Comparison
(A) - (B)
Operating Revenues 1,425.8 1,274.5 151.3
Electric Power Business 1,283.2 [ 1,281.2 ] 1,132.2 [ 1,130.6 ] 151.0 [ 150.6 ]
Construction Business 153.4 [ 80.3 ] 145.8 [ 76.1 ] 7.5 [ 4.2 ]
Gas Business 29.4 [ 24.5 ] 28.3 [ 23.3 ] 1.0 [ 1.1 ]
Information Processing,
Tele-communication Business 24.4 [ 14.0 ] 25.8 [ 13.9 ] ( 1.3 ) [ 0.0 ]
Others 82.8 [ 25.6 ] 80.0 [ 30.5 ] 2.8 [ ( 4.8 ) ]
3rd quarter of FY2013
(A)
3rd quarter of FY2012
(B)
Comparison
(A) - (B)
Segment Income (Loss) [Operating Income (Loss)] 38.9 ( 25.2 ) 64.1
Electric Power Business 41.7 ( 14.9 ) 56.6
Construction Business ( 7.0 ) ( 10.0 ) 2.9
Gas Business 0.7 1.1 ( 0.4 )
Information Processing,
Tele-communication Business 2.0 1.0 1.0
Others ( 1.5 ) ( 4.1 ) 2.6
[ ] : Operating revenues from external customers
8
(billions of yen)
(billions of yen)

Topics

Tohoku Electric Power Group
Midterm Management Policy (FY2014–2018)
To achieve the equity ratio of 15% or more by the end of FY2018
Offering new value to cope with full liberalization of the retail market
Restarting nuclear power plants and achieving an optimal power generation mix
Improving financial strength through cost structure reform with no sacred cows
Actively developing business while seeking growth opportunities
To outpace the competition and become a company chosen by customers
To work on corporate reform To contribute to reconstruction/development
of local communities Securing/training diverse human resources and
achieving a vibrant corporate culture
Building an organization that appropriately
deals with environmental changes
Ensuring safety and a stable supply of electricity
Operating the business from the viewpoint of
contributing to local communities
Promoting environmental management and
ensuring compliance with corporate ethics and
law
Financial target
Vision of business
development
Main measures
We regard the next five years as “the period of rebuilding our management foundation”.
Specifically, we will normalize our management framework and make preparations for future growth.
We will give top priority to improving the financial condition of the Group through cost structure
reform and profit increase by offering new value so that we can enhance our capability to cope with
major changes in the business environment and business risks (e.g. reform of the electric power
system).
In a full-scale competitive environment, we aim to be a company group which is chosen by customers
and grows with local community.
1
Current Situations and Outlook for
Onagawa Nuclear Power Station
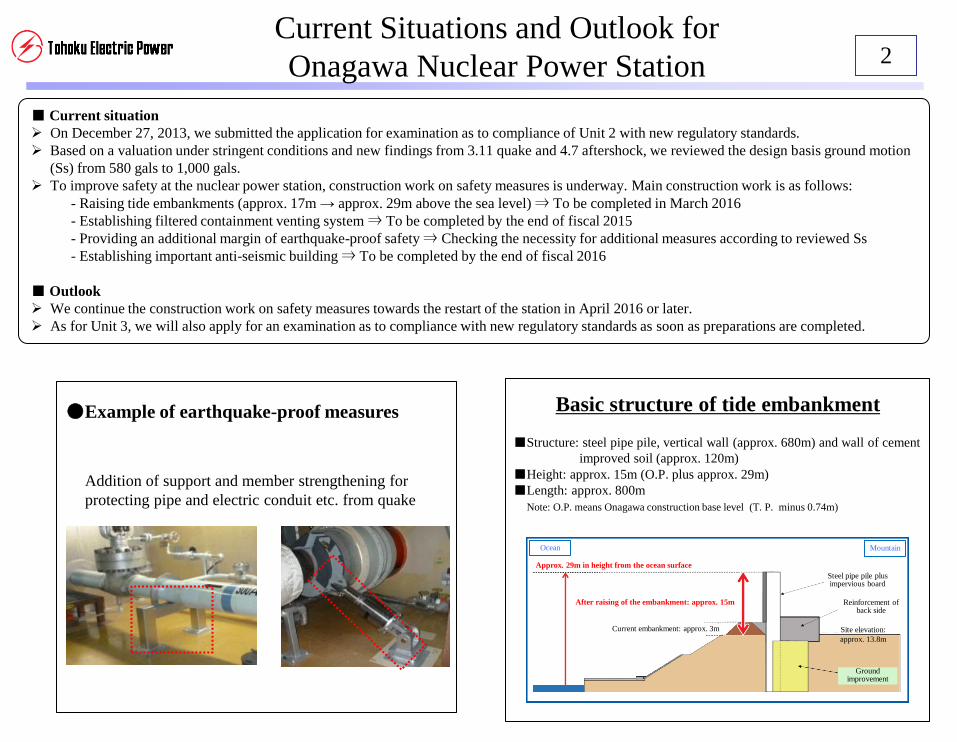
■ Current situation
On December 27, 2013, we submitted the application for examination as to compliance of Unit 2 with new regulatory standards.
Based on a valuation under stringent conditions and new findings from 3.11 quake and 4.7 aftershock, we reviewed the design basis ground motion
(Ss) from 580 gals to 1,000 gals.
To improve safety at the nuclear power station, construction work on safety measures is underway. Main construction work is as follows:
- Raising tide embankments (approx. 17m → approx. 29m above the sea level) ⇒ To be completed in March 2016
- Establishing filtered containment venting system ⇒ To be completed by the end of fiscal 2015
- Providing an additional margin of earthquake-proof safety ⇒ Checking the necessity for additional measures according to reviewed Ss
- Establishing important anti-seismic building ⇒ To be completed by the end of fiscal 2016
■ Outlook
We continue the construction work on safety measures towards the restart of the station in April 2016 or later.
As for Unit 3, we will also apply for an examination as to compliance with new regulatory standards as soon as preparations are completed.
Site elevation:
approx. 13.8m
Ground improvement
Current embankment: approx. 3m
After raising of the embankment: approx. 15m Reinforcement of back side
Steel pipe pile plus impervious board
Mountain Ocean
Approx. 29m in height from the ocean surface
■Structure: steel pipe pile, vertical wall (approx. 680m) and wall of cement
improved soil (approx. 120m)
■Height: approx. 15m (O.P. plus approx. 29m)
■Length: approx. 800m
Note: O.P. means Onagawa construction base level (T. P. minus 0.74m)
Basic structure of tide embankment
2
●Example of earthquake-proof measures
Addition of support and member strengthening for
protecting pipe and electric conduit etc. from quake

Current Situations and Outlook for
Higashidori Nuclear Power Station
■ Current situation
On January 17, 2014, we submitted the report according to the results of an additional geological survey to Nuclear Regulation Authority.
The report shows that the faults within the premises are not faults that are likely to become active in the future.
*For the results of the additional geological survey, see the following pages.
To improve safety at the nuclear power station, construction work on safety measures is underway. Main construction work is as follows:
- Establishing filtered containment venting system ⇒ To be completed in March 2015
- Establishing important anti-seismic building ⇒ To be completed in March 2016 Based on new findings from 3.11 quake and 4.7 aftershock, we decided to review the design basis ground motion (Ss) from 450 gals to around 600
gals.
■ Outlook
We continue the preparation for application for an examination as to compliance with new regulatory standards and the construction work on safety
measures towards the restart of the station in July 2015.
We will apply for an examination as to compliance with new regulatory standards as soon as preparations are completed.
3
●Enhanced training
Training in electricity securement
in winter
●Filtered containment venting system
Filter equipment
Release into
the air
From reactor
●Important anti-seismic building
Rendering
Installation of anti-seismic building for
reliability improvement of emergency
headquarters
Training session in severe accident
under the bad conditions such as winter
season or nighttime
Curbing radiological release to one-
thousandth or less of direct release, in
case of severe accident

Results of an additional geological survey on the faults within the
premises of the Higashidori nuclear power plant
◆Overview of the evaluation report (draft) prepared by the panel of experts
There are no grounds to show fault activity within the
premises after the late Quaternary period (the Pleistocene
epoch) (for about the past 120,000–130,000 years), as follows:
• There are no traces of strike-slip fault activity.
• There are no faults that are linked with the area considered as
tectonic relief.
• The characteristics of the Quaternary deformations do not show a
relationship with fault activity etc.
The Quaternary deformations are
attributed to volume expansion
affected by (i) swelling of clay
minerals in the areas where the
bedrock has deteriorated and (ii)
swelling caused by weathering.
(This is more rational than other
causes.)
Notably, the fault near the nuclear
reactor was formed at least before
the Neogene period (Pliocene epoch)
(about 2.6 million years ago or
earlier). No activity has been
observed since the late Quaternary
period (the Pleistocene epoch).
Surveys/evaluations were conducted based on the issues described in the evaluation report (draft) prepared by the panel of experts, while taking into account
new findings. No grounds were confirmed to show activity of the faults within the premises after the late Quaternary period (the Pleistocene epoch).
Based on the results of the additional geological survey, the evaluation showed that the faults within the premises are not “faults that are likely to
become active in the future” as defined in the new regulatory requirements. This conclusion was supported by external experts (including experts in
geology).
1) Fault activity within the premises of the power plant
Fault activity within the premises cannot be denied due to the
following characteristics.
• Traces of fault activity attributed to horizontal displacement
(strike-slip fault activity)
• Tectonic relief that indicates fault activity
• Presence of displacements/deformations in the Quaternary strata
that cover the faults (Quaternary deformations) etc.
3) Factors that contributed to
the Quaternary deformations
It is not reasonable to conclude that
the Quaternary deformations were
caused primarily by swelling of the
bedrock etc.
(The deformations were caused by
active faults.)
2) Evaluation of the fault near
the location of the nuclear
reactor building
Safety should be determined based
on survey results.
Issues
◆In-house evaluation (including opinions from external experts)
Ind
ivid
ual ev
alu
atio
n
Ov
erall
evalu
atio
n
4

Results of an additional geological survey on the faults within the
premises of the Higashidori nuclear power plant (Reference 1)
Some of faults within the premises of the Higashidori nuclear power plant are
characterized by displacements/deformations in the Quaternary stratum
(Quaternary deformations) that cover the faults. A review of the fault activity
was carried out. In the safety screening that was conducted when we applied
for permission to construct the nuclear reactor, the Japanese government’s
evaluation was that the faults are not active.
Neogene stratum
(the Miocene epoch)
Quaternary
stratum
③Quaternary
deformations
① Main faults
Power plant
facility
② Fault near the location of the nuclear reactor building
Process of an additional geological survey and evaluation Faults and Quaternary deformations
Opinions
from
external
experts
(Additional geological survey)
A lot of data obtained from
boring and trench surveys, etc. was
evaluated. R
easo
na
ble
exp
lan
atio
n
(Conclusion)
The faults within the
premises are not active.
Survey on the horizontal drilling surface
The points just above the faults and surrounding areas were
closely inspected. No traces of strike-slip fault activity were
confirmed.
Boring survey and core cross section
It was confirmed that the protrusions in the terrain are not
attributed to strike-slip fault activity.
Trench survey on the area considered as a tectonic relief
It was confirmed that there are no faults corresponding to the
terrain.
Numerical analysis of Quaternary deformation
The Quaternary deformations (attributed to the volume
expansion in the areas where the bedrock has deteriorated) were
reproduced in simulation.
External experts (e.g. geology and topography) from whom a written opinion
regarding the results of the additional geological survey was obtained
CHIGIRA, Masahiro (Professor, Kyoto University)
KANAORI, Yuji (Professor, Yamaguchi University)
OKUMURA, Koji (Professor, Hiroshima University)
TOKUYAMA, Akira (former president of Fuji Tokoha University; Professor Emeritus, Hyogo University of
Teacher Education)
TOODA, Shinji (Professor, Tohoku University)
YAMAZAKI, Haruo (Professor, Tokyo Metropolitan University)
YANAGIDA, Makoto (Lecturer, Komazawa University; Director, Hanshin Consultants, Co., Ltd.)
(listed in alphabetical order)
5

Results of an additional geological survey on the faults within the
premises of the Higashidori nuclear power plant (Reference 2)
Trench and boring surveys etc., are conducted to investigate the underground
geological features and faults.
In the case of building a nuclear power plant, boring surveys cover up to
hundreds of meters in depth, while trench surveys cover up to 100 m or more in
length and 10 m or more in depth.
< Trench surveys >
The topsoil and bedrock are excavated to
directly observe geological features and faults.
Survey points within the premises of
the Higashidori nuclear power plant
70 in total
(including 9 points subject to the
additional geological survey)
< Boring surveys >
Underground rocks etc. are continuously taken out as cylindrical cores
for observation and analysis.
Survey length within the premises of
the Higashidori nuclear power plant
About 53,000 m in total length
(including 13,000 m subject to the
additional geological survey)
Example of core sample
Diameter: about 7–9 cm
Length: cut into 1 m pieces
Typical geological survey method
6
Location of faults within the premises
and additional survey
【Legend】
Boring survey
Trench survey
Horizontal excavated survey
Geophysical exploration
Geological ground survey
●
drilling machine
pump
pipe
boring rod
F-7 fault
F-8 fault
F-6 fault
F-5 fault
Kooippe River
f-2 fault
f-1 fault
F-3 fault
Oippe River
Reactor Building
Premises of
TEPCO

(Note)
This presentation solely constitutes reference material for the purpose of providing the readers with
relevant information to evaluate our company.
The information contains forward-looking statements based on assumptions and projections about the
future with regard to our company. As such, the readers are kindly asked to refrain from making judgment
by depending solely on this information.
The forward-looking statements inherently involve a degree of risks and uncertainties. Consequently,
these risks and uncertainties could cause the actual results and performance to differ from the assumed or
projected status of the company.
Tohoku Electric Power Co., Inc. hereby disclaim any responsibility or liability in relation to
consequences resulting from decisions made by investors.