FY2013 Financial Results - tamron.co.jp · FY2013 Financial Results 2 Contents ... Net Sales 30,432...
33
FY2013 Financial Results February 12, 2014 Tamron Co., Ltd. (Code: 7740)
-
Upload
truongxuyen -
Category
Documents
-
view
215 -
download
0
Transcript of FY2013 Financial Results - tamron.co.jp · FY2013 Financial Results 2 Contents ... Net Sales 30,432...

FY2013
Financial Results
February 12, 2014
Tamron Co., Ltd. (Code: 7740)
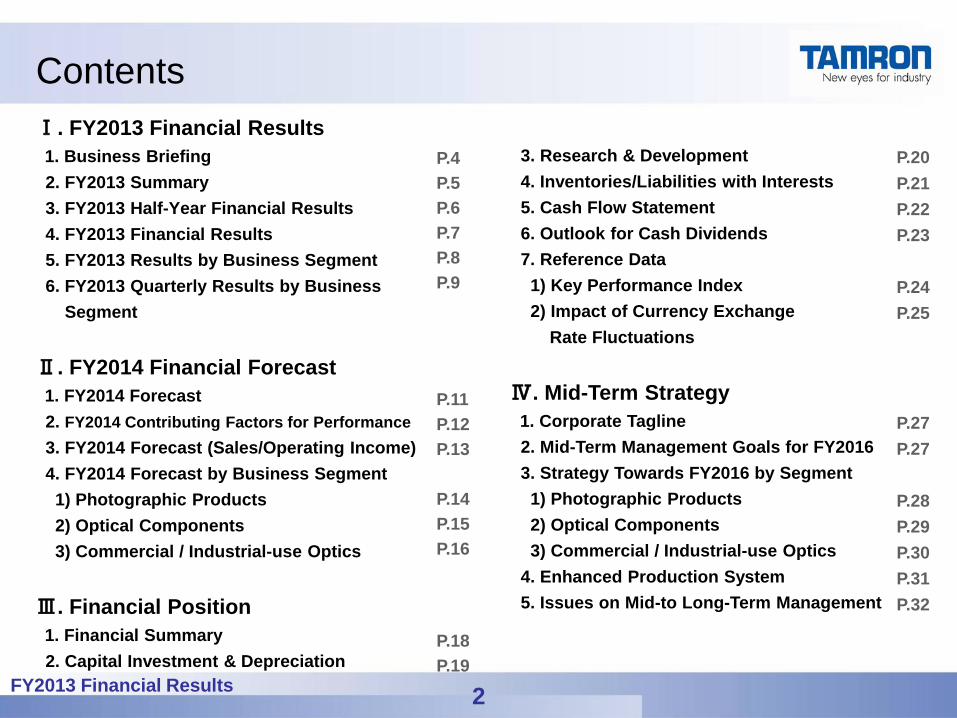
FY2013 Financial Results 2
Contents
Ⅰ. FY2013 Financial Results
1. Business Briefing
2. FY2013 Summary
3. FY2013 Half-Year Financial Results
4. FY2013 Financial Results
5. FY2013 Results by Business Segment
6. FY2013 Quarterly Results by Business
Segment
Ⅱ. FY2014 Financial Forecast
1. FY2014 Forecast
2. FY2014 Contributing Factors for Performance
3. FY2014 Forecast (Sales/Operating Income)
4. FY2014 Forecast by Business Segment
1) Photographic Products
2) Optical Components
3) Commercial / Industrial-use Optics
Ⅲ. Financial Position
1. Financial Summary
2. Capital Investment & Depreciation
3. Research & Development
4. Inventories/Liabilities with Interests
5. Cash Flow Statement
6. Outlook for Cash Dividends
7. Reference Data
1) Key Performance Index
2) Impact of Currency Exchange
Rate Fluctuations
Ⅳ. Mid-Term Strategy
1. Corporate Tagline
2. Mid-Term Management Goals for FY2016
3. Strategy Towards FY2016 by Segment
1) Photographic Products
2) Optical Components
3) Commercial / Industrial-use Optics
4. Enhanced Production System
5. Issues on Mid-to Long-Term Management
P.4
P.5
P.6
P.7
P.8
P.9
P.20
P.21
P.22
P.23
P.24
P.25
P.11
P.12
P.13
P.14
P.15
P.16
P.27
P.27
P.28
P.29
P.30
P.31
P.32
P.18
P.19
FY2013 Financial Results 3
Ⅰ.FY2013 Financial Results
FY2013 Financial Results
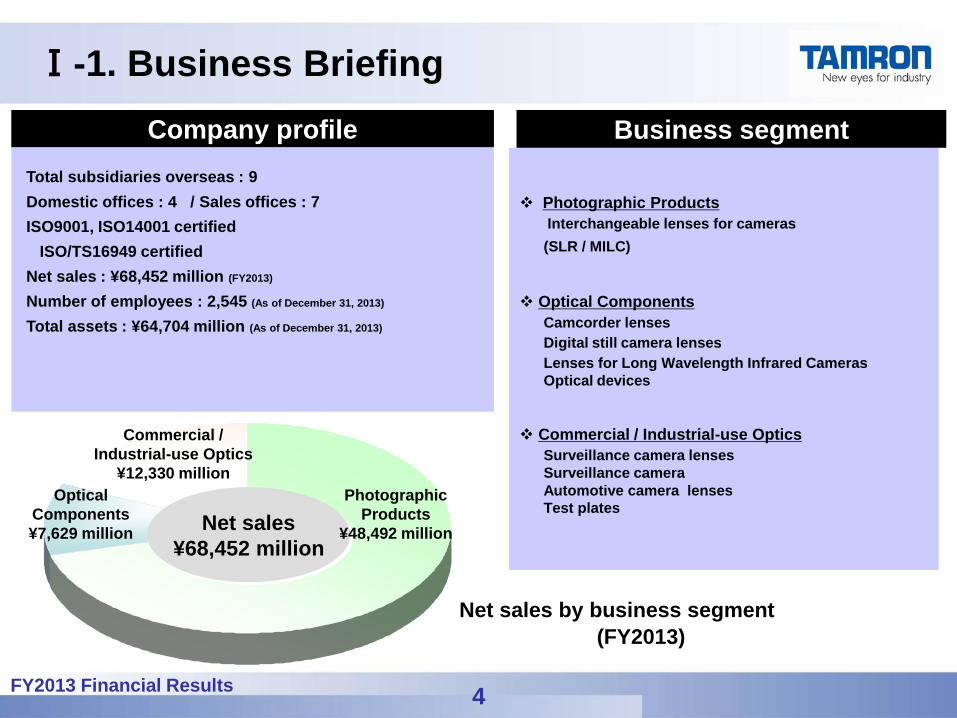
Ⅰ-1. Business Briefing
Total subsidiaries overseas : 9
Domestic offices : 4 / Sales offices : 7
ISO9001, ISO14001 certified
ISO/TS16949 certified
Net sales : ¥68,452 million (FY2013)
Number of employees : 2,545 (As of December 31, 2013)
Total assets : ¥64,704 million (As of December 31, 2013)
Company profile
Photographic Products
Interchangeable lenses for cameras
(SLR / MILC)
Optical Components
Camcorder lenses
Digital still camera lenses
Lenses for Long Wavelength Infrared Cameras
Optical devices
Commercial / Industrial-use Optics
Surveillance camera lenses
Surveillance camera
Automotive camera lenses
Test plates
Business segment
Net sales
¥68,452 million
Photographic
Products
¥48,492 million
Optical
Components
¥7,629 million
Commercial /
Industrial-use Optics
¥12,330 million
Net sales by business segment
(FY2013)
4
FY2013 Financial Results 5
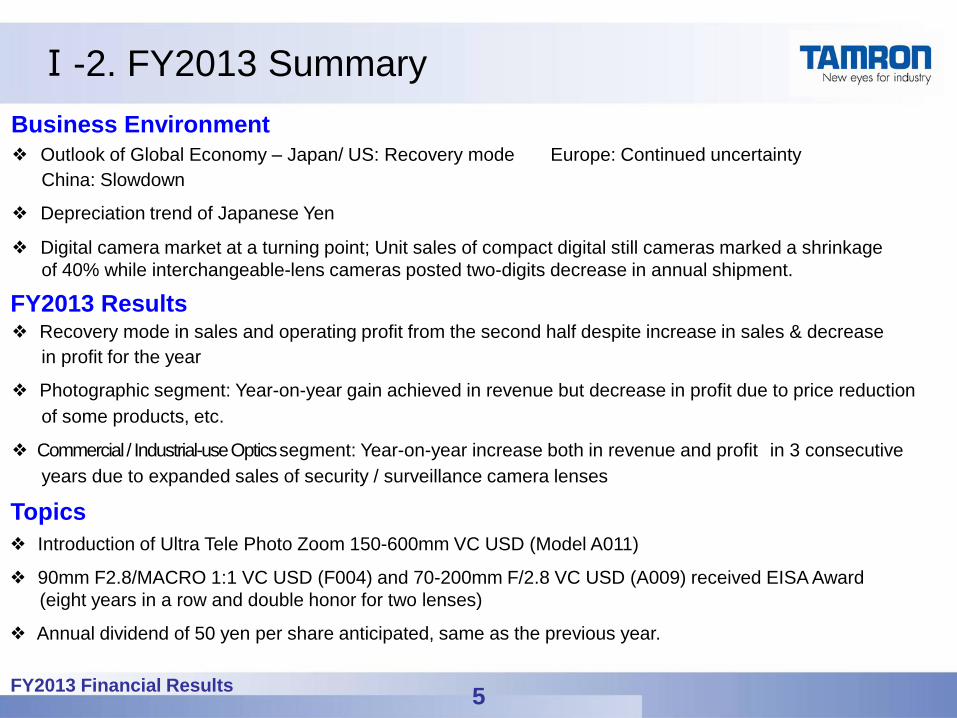
Ⅰ-2. FY2013 Summary
Business Environment
FY2013 Results
Topics
❖ Introduction of Ultra Tele Photo Zoom 150-600mm VC USD (Model A011)
❖ 90mm F2.8/MACRO 1:1 VC USD (F004) and 70-200mm F/2.8 VC USD (A009) received EISA Award
(eight years in a row and double honor for two lenses)
❖ Annual dividend of 50 yen per share anticipated, same as the previous year.
❖ Outlook of Global Economy – Japan/ US: Recovery mode Europe: Continued uncertainty
China: Slowdown
❖ Depreciation trend of Japanese Yen
❖ Digital camera market at a turning point; Unit sales of compact digital still cameras marked a shrinkage
of 40% while interchangeable-lens cameras posted two-digits decrease in annual shipment.
❖ Recovery mode in sales and operating profit from the second half despite increase in sales & decrease
in profit for the year
❖ Photographic segment: Year-on-year gain achieved in revenue but decrease in profit due to price reduction
of some products, etc.
❖ Commercial / Industrial-use Optics segment: Year-on-year increase both in revenue and profit in 3 consecutive
years due to expanded sales of security / surveillance camera lenses
FY2013 Financial Results 6
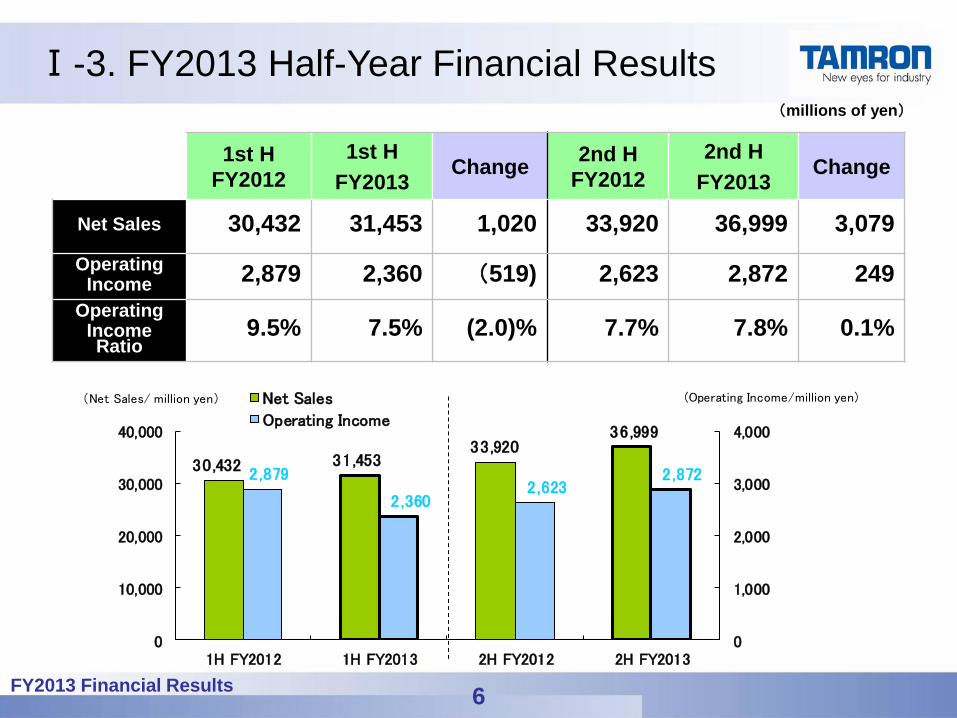
Ⅰ-3. FY2013 Half-Year Financial Results (millions of yen)
1st H
FY2012
1st H
FY2013 Change
2nd H
FY2012
2nd H
FY2013 Change
Net Sales 30,432 31,453 1,020 33,920 36,999 3,079
Operating Income
2,879 2,360 (519) 2,623 2,872 249
Operating Income Ratio
9.5% 7.5% (2.0)% 7.7% 7.8% 0.1%
30,432 31,45333,920
36,999
2,879
2,3602,623
2,872
0
1,000
2,000
3,000
4,000
0
10,000
20,000
30,000
40,000
1H FY2012 1H FY2013 2H FY2012 2H FY2013
(Operating Income/million yen)(Net Sales/ million yen) Net Sales
Operating Income
FY2013 Financial Results 7
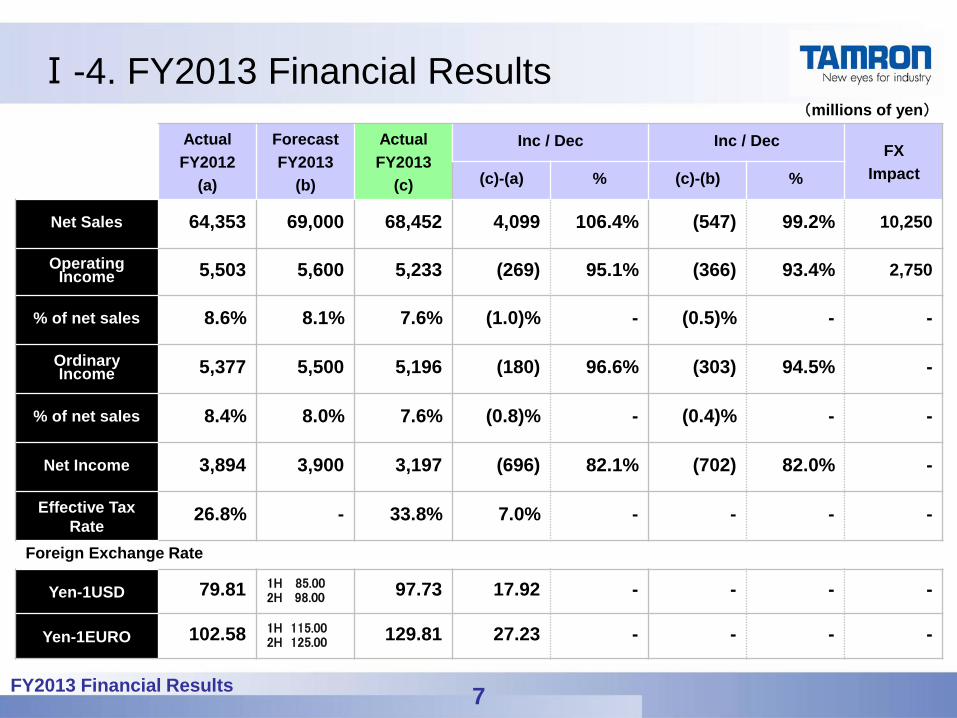
Ⅰ-4. FY2013 Financial Results (millions of yen)
Actual
FY2012
(a)
Forecast
FY2013
(b)
Actual
FY2013
(c)
Inc / Dec Inc / Dec FX
Impact (c)-(a) % (c)-(b) %
Net Sales 64,353 69,000 68,452 4,099 106.4% (547) 99.2% 10,250
Operating Income 5,503 5,600 5,233 (269) 95.1% (366) 93.4% 2,750
% of net sales 8.6% 8.1% 7.6% (1.0)% - (0.5)% - -
Ordinary Income 5,377 5,500 5,196 (180) 96.6% (303) 94.5% -
% of net sales 8.4% 8.0% 7.6% (0.8)% - (0.4)% - -
Net Income 3,894 3,900 3,197 (696) 82.1% (702) 82.0% -
Effective Tax
Rate 26.8% - 33.8% 7.0% - - - -
Foreign Exchange Rate
Yen-1USD 79.81 1H 85.00 2H 98.00 97.73 17.92 - - - -
Yen-1EURO 102.58 1H 115.00 2H 125.00 129.81 27.23 - - - -
FY2013 Financial Results 8
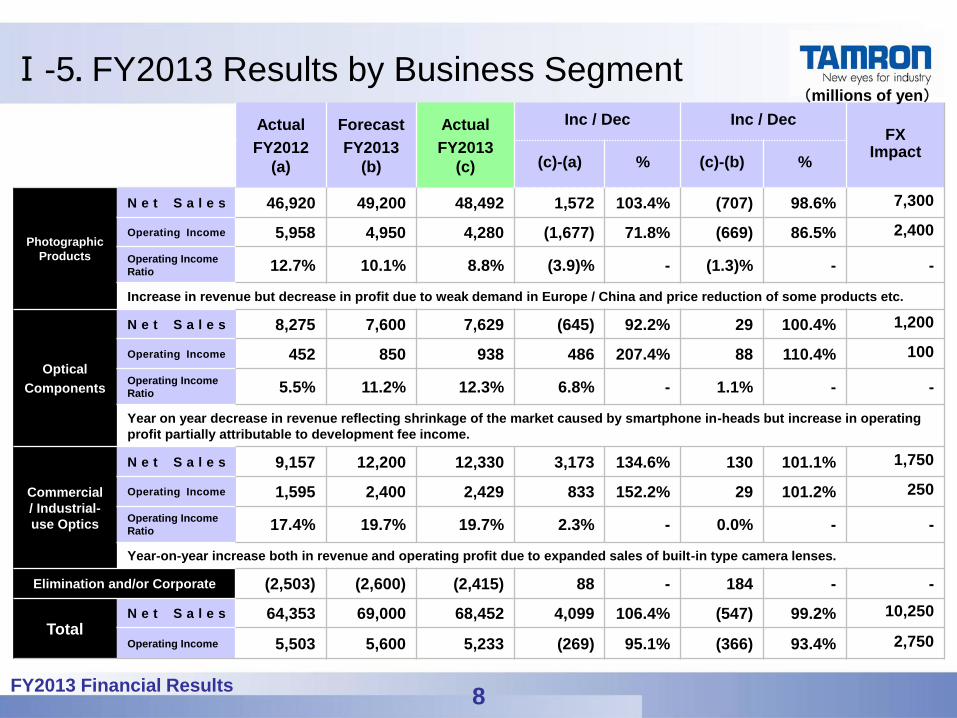
Ⅰ-5. FY2013 Results by Business Segment
Actual
FY2012
(a)
Forecast
FY2013
(b)
Actual
FY2013
(c)
Inc / Dec Inc / Dec FX
Impact (c)-(a) % (c)-(b) %
Photographic
Products
N e t S a l e s 46,920 49,200 48,492 1,572 103.4% (707) 98.6% 7,300
Operating Income 5,958 4,950 4,280 (1,677) 71.8% (669) 86.5% 2,400
Operating Income
Ratio 12.7% 10.1% 8.8% (3.9)% - (1.3)% - -
Increase in revenue but decrease in profit due to weak demand in Europe / China and price reduction of some products etc.
Optical
Components
N e t S a l e s 8,275 7,600 7,629 (645) 92.2% 29 100.4% 1,200
Operating Income 452 850 938 486 207.4% 88 110.4% 100
Operating Income
Ratio 5.5% 11.2% 12.3% 6.8% - 1.1% - -
Year on year decrease in revenue reflecting shrinkage of the market caused by smartphone in-heads but increase in operating
profit partially attributable to development fee income.
Commercial
/ Industrial-
use Optics
N e t S a l e s 9,157 12,200 12,330 3,173 134.6% 130 101.1% 1,750
Operating Income 1,595 2,400 2,429 833 152.2% 29 101.2% 250
Operating Income
Ratio 17.4% 19.7% 19.7% 2.3% - 0.0% - -
Year-on-year increase both in revenue and operating profit due to expanded sales of built-in type camera lenses.
Elimination and/or Corporate (2,503) (2,600) (2,415) 88 - 184 - -
Total N e t S a l e s 64,353 69,000 68,452 4,099 106.4% (547) 99.2% 10,250
Operating Income 5,503 5,600 5,233 (269) 95.1% (366) 93.4% 2,750
(millions of yen)
FY2013 Financial Results 9
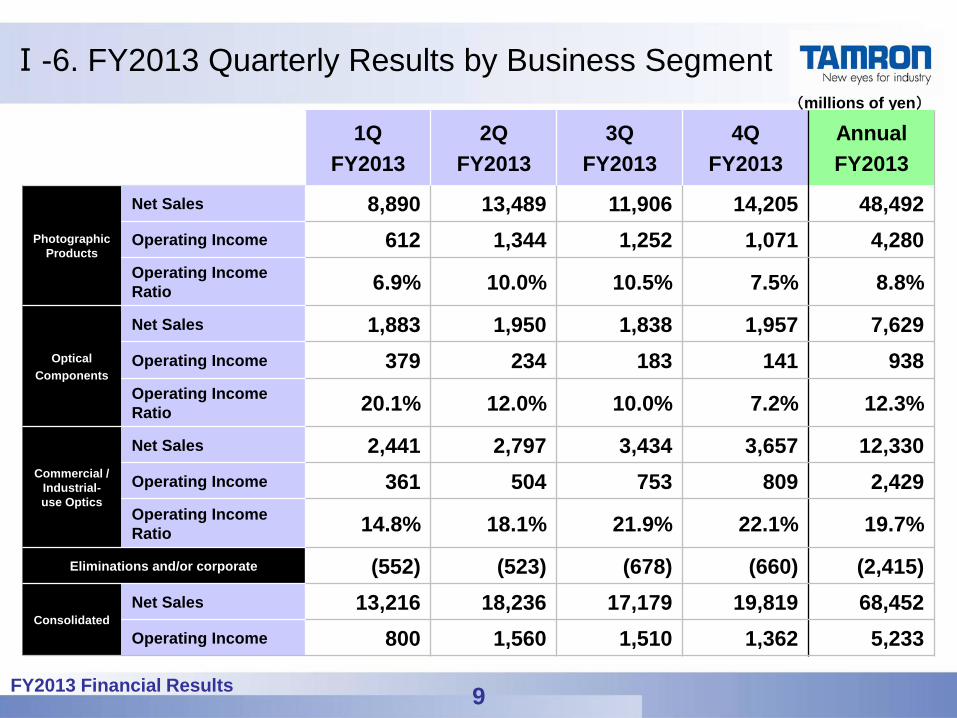
Ⅰ-6. FY2013 Quarterly Results by Business Segment (millions of yen)
1Q
FY2013
2Q
FY2013
3Q
FY2013
4Q
FY2013
Annual
FY2013
Photographic
Products
Net Sales 8,890 13,489 11,906 14,205 48,492
Operating Income 612 1,344 1,252 1,071 4,280
Operating Income
Ratio 6.9% 10.0% 10.5% 7.5% 8.8%
Optical
Components
Net Sales 1,883 1,950 1,838 1,957 7,629
Operating Income 379 234 183 141 938
Operating Income
Ratio 20.1% 12.0% 10.0% 7.2% 12.3%
Commercial /
Industrial-
use Optics
Net Sales 2,441 2,797 3,434 3,657 12,330
Operating Income 361 504 753 809 2,429
Operating Income
Ratio 14.8% 18.1% 21.9% 22.1% 19.7%
Eliminations and/or corporate (552) (523) (678) (660) (2,415)
Consolidated
Net Sales 13,216 18,236 17,179 19,819 68,452
Operating Income 800 1,560 1,510 1,362 5,233
FY2013 Financial Results 10
Ⅱ.FY2014 Financial Forecast
FY2013 Financial Results 11
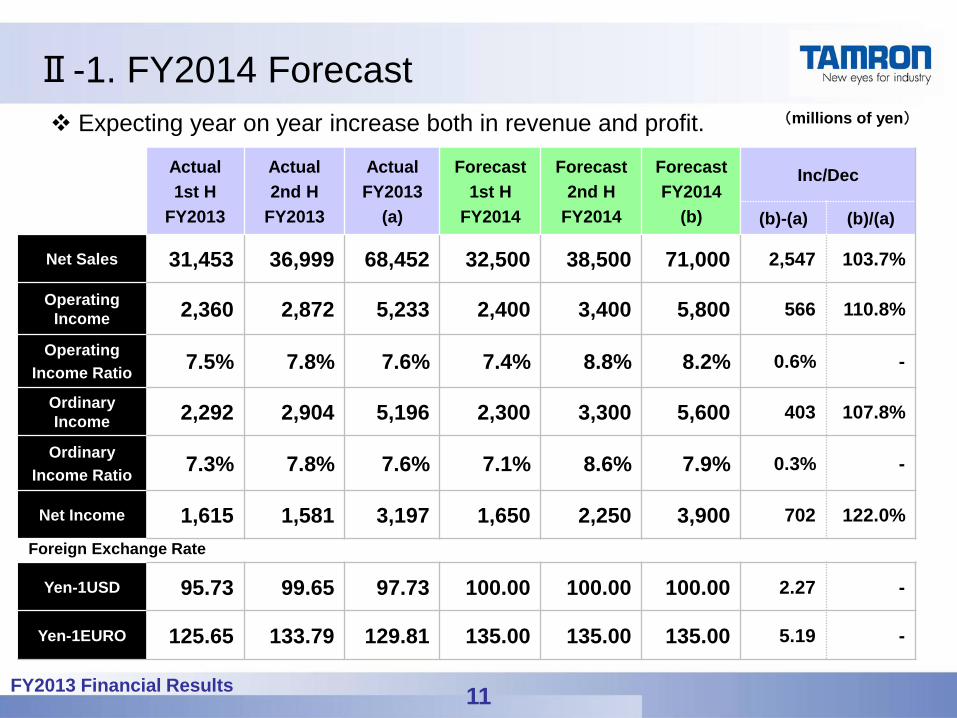
Ⅱ-1. FY2014 Forecast (millions of yen)
Actual
1st H
FY2013
Actual
2nd H
FY2013
Actual
FY2013
(a)
Forecast
1st H
FY2014
Forecast
2nd H
FY2014
Forecast
FY2014
(b)
Inc/Dec
(b)-(a) (b)/(a)
Net Sales 31,453 36,999 68,452 32,500 38,500 71,000 2,547 103.7%
Operating
Income 2,360 2,872 5,233 2,400 3,400 5,800 566 110.8%
Operating
Income Ratio 7.5% 7.8% 7.6% 7.4% 8.8% 8.2% 0.6% -
Ordinary
Income 2,292 2,904 5,196 2,300 3,300 5,600 403 107.8%
Ordinary
Income Ratio 7.3% 7.8% 7.6% 7.1% 8.6% 7.9% 0.3% -
Net Income 1,615 1,581 3,197 1,650 2,250 3,900 702 122.0%
Foreign Exchange Rate
Yen-1USD 95.73 99.65 97.73 100.00 100.00 100.00 2.27 -
Yen-1EURO 125.65 133.79 129.81 135.00 135.00 135.00 5.19 -
Expecting year on year increase both in revenue and profit.
FY2013 Financial Results 12
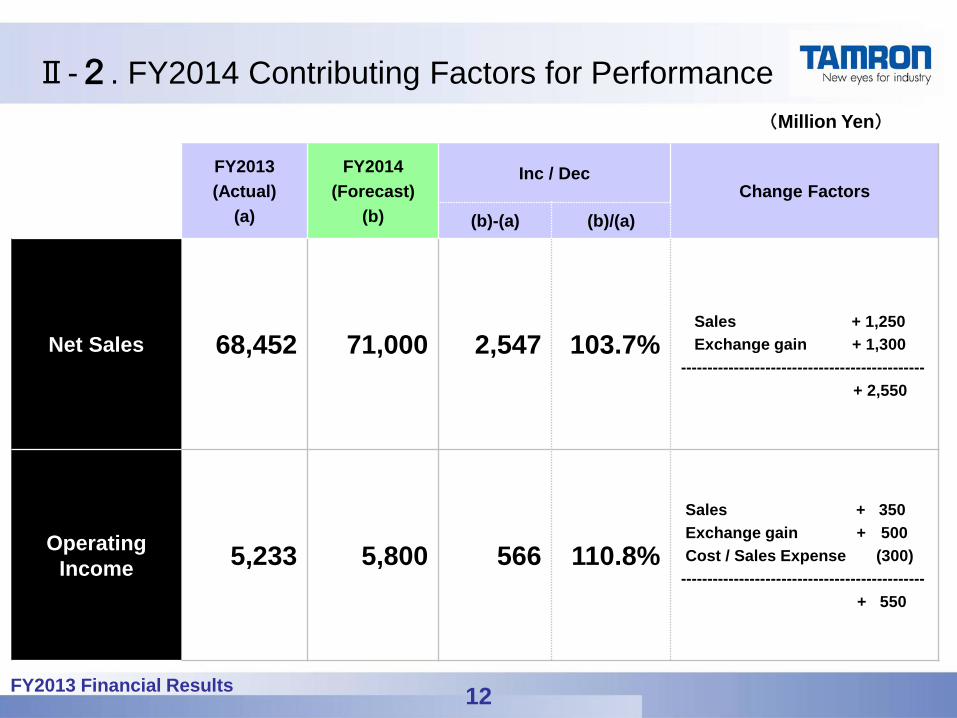
Ⅱ-2. FY2014 Contributing Factors for Performance
FY2013
(Actual)
(a)
FY2014
(Forecast)
(b)
Inc / Dec Change Factors
(b)-(a) (b)/(a)
Net Sales 68,452 71,000 2,547 103.7%
Sales + 1,250
Exchange gain + 1,300
----------------------------------------------
+ 2,550
Operating
Income 5,233 5,800 566 110.8%
Sales + 350
Exchange gain + 500
Cost / Sales Expense (300)
----------------------------------------------
+ 550
(Million Yen)
FY2013 Financial Results 13
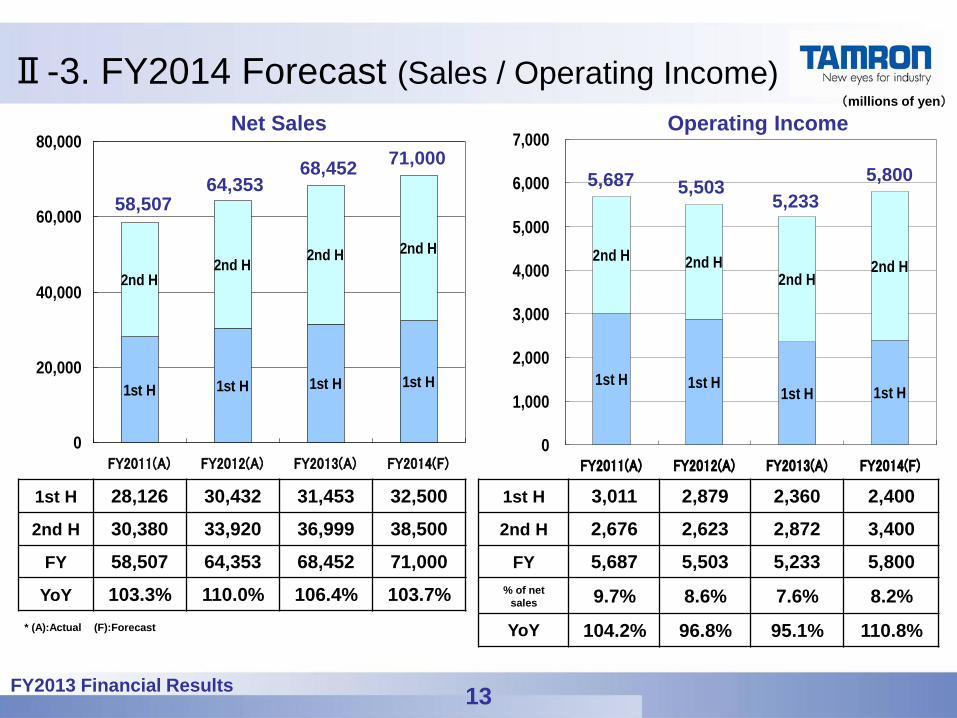
Ⅱ-3. FY2014 Forecast (Sales / Operating Income)
1st H 1st H 1st H 1st H
2nd H2nd H
2nd H 2nd H
0
20,000
40,000
60,000
80,000
FY2011(A) FY2012(A) FY2013(A) FY2014(F)
Net Sales
1st H 1st H1st H 1st H
2nd H 2nd H2nd H
2nd H
0
1,000
2,000
3,000
4,000
5,000
6,000
7,000
FY2011(A) FY2012(A) FY2013(A) FY2014(F)
Operating Income
1st H 28,126 30,432 31,453 32,500
2nd H 30,380 33,920 36,999 38,500
FY 58,507 64,353 68,452 71,000
YoY 103.3% 110.0% 106.4% 103.7%
1st H 3,011 2,879 2,360 2,400
2nd H 2,676 2,623 2,872 3,400
FY 5,687 5,503 5,233 5,800
% of net
sales 9.7% 8.6% 7.6% 8.2%
YoY 104.2% 96.8% 95.1% 110.8%
64,353 58,507
71,000 5,800 5,687 5,503
68,452
5,233
(millions of yen)
* (A):Actual (F):Forecast
FY2013 Financial Results 14
1st H 1st H 1st H
2nd H 2nd H2nd H
0
10,000
20,000
30,000
40,000
50,000
60,000
FY2012(A) FY2013(A) FY2014(F)
1st H1st H 1st H
2nd H
2nd H
2nd H
0
1,000
2,000
3,000
4,000
5,000
6,000
7,000
FY2012(A) FY2013(A) FY2014(F)
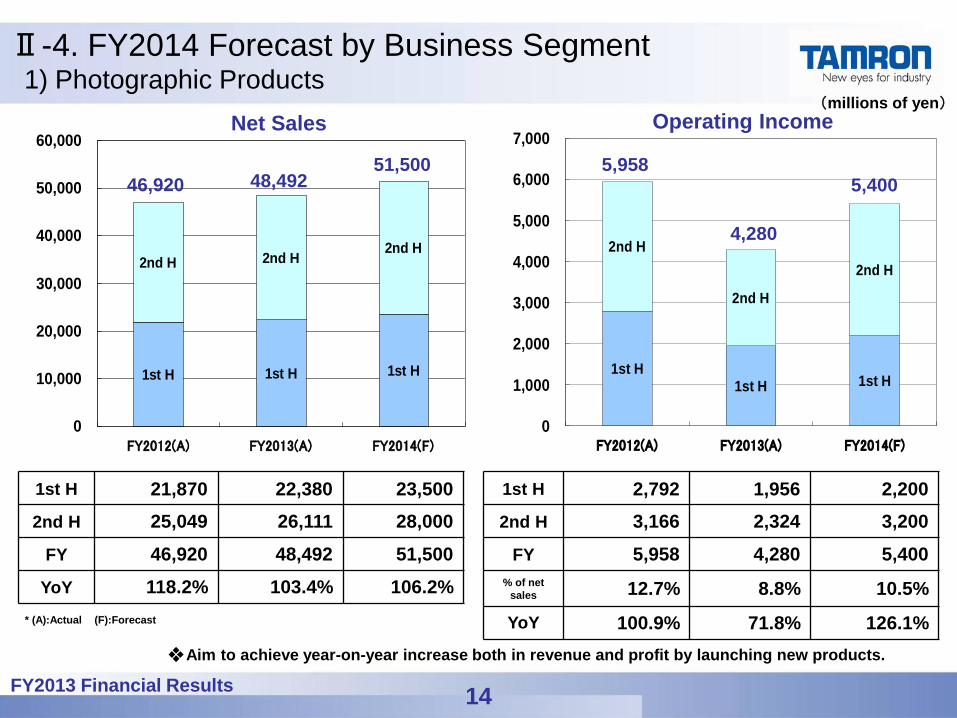
1st H 21,870 22,380 23,500
2nd H 25,049 26,111 28,000
FY 46,920 48,492 51,500
YoY 118.2% 103.4% 106.2%
1st H 2,792 1,956 2,200
2nd H 3,166 2,324 3,200
FY 5,958 4,280 5,400
% of net
sales 12.7% 8.8% 10.5%
YoY 100.9% 71.8% 126.1%
48,492
4,280
51,500 5,400 46,920
5,958
Ⅱ-4. FY2014 Forecast by Business Segment 1) Photographic Products
* (A):Actual (F):Forecast
Net Sales Operating Income (millions of yen)
❖Aim to achieve year-on-year increase both in revenue and profit by launching new products.
FY2013 Financial Results 15
1st H1st H
1st H
2nd H2nd H
2nd H
0
2,000
4,000
6,000
8,000
10,000
FY2012(A) FY2013(A) FY2014(F)
1st H
1st H
1st H
2nd H
2nd H
2nd H
0
100
200
300
400
500
600
700
800
900
1,000
FY2012(A) FY2013(A) FY2014(F)
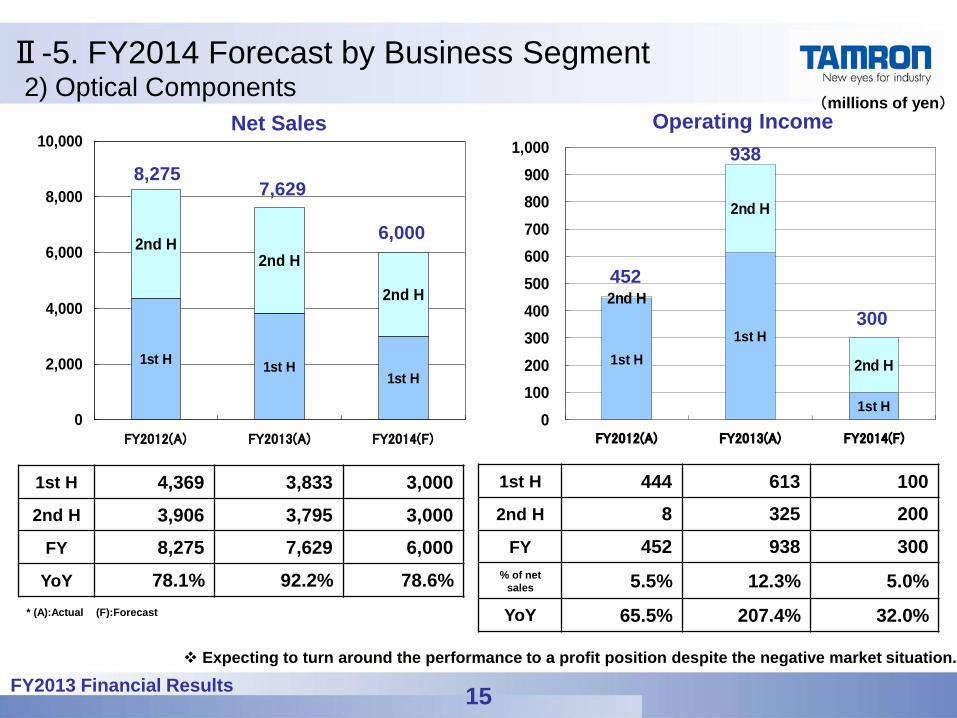
1st H 4,369 3,833 3,000
2nd H 3,906 3,795 3,000
FY 8,275 7,629 6,000
YoY 78.1% 92.2% 78.6%
1st H 444 613 100
2nd H 8 325 200
FY 452 938 300
% of net
sales 5.5% 12.3% 5.0%
YoY 65.5% 207.4% 32.0%
8,275 938
6,000
300
7,629
452
Ⅱ-5. FY2014 Forecast by Business Segment 2) Optical Components
Net Sales (millions of yen)
Operating Income
* (A):Actual (F):Forecast
Expecting to turn around the performance to a profit position despite the negative market situation.
FY2013 Financial Results 16
1st H1st H 1st H
2nd H
2nd H2nd H
0
3,000
6,000
9,000
12,000
15,000
FY2012(A) FY2013(A) FY2014(F)
1st H 1st H1st H
2nd H
2nd H
2nd H
0
500
1,000
1,500
2,000
2,500
3,000
FY2012(A) FY2013(A) FY2014(F)
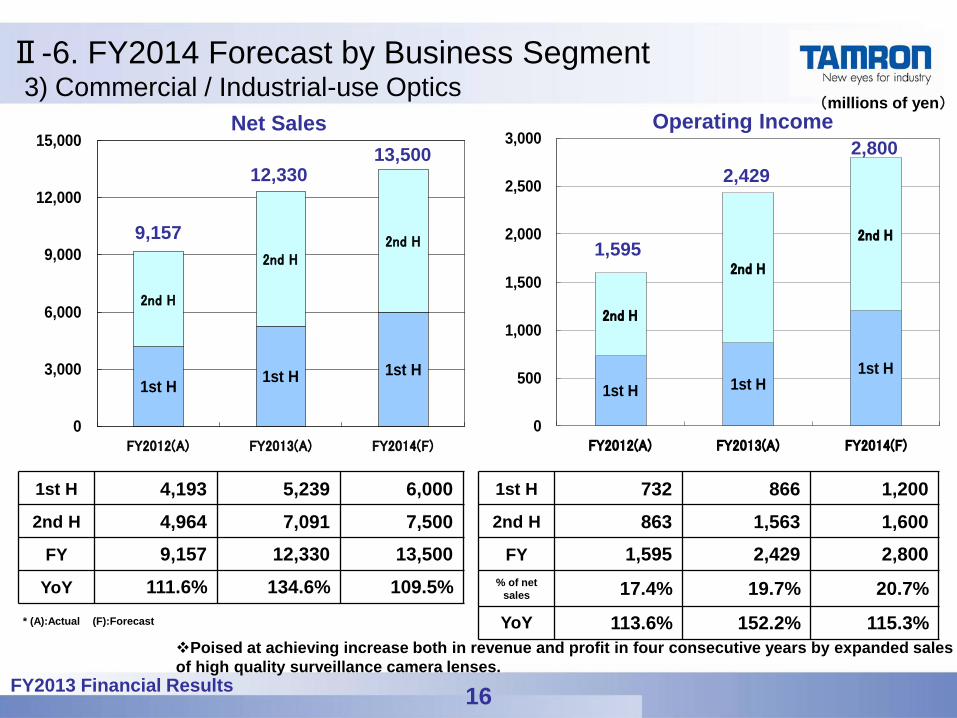
1st H 4,193 5,239 6,000
2nd H 4,964 7,091 7,500
FY 9,157 12,330 13,500
YoY 111.6% 134.6% 109.5%
1st H 732 866 1,200
2nd H 863 1,563 1,600
FY 1,595 2,429 2,800
% of net
sales 17.4% 19.7% 20.7%
YoY 113.6% 152.2% 115.3%
12,330
1,595
13,500 2,800
9,157
2,429
Ⅱ-6. FY2014 Forecast by Business Segment 3) Commercial / Industrial-use Optics
Net Sales (millions of yen)
Operating Income
* (A):Actual (F):Forecast
Poised at achieving increase both in revenue and profit in four consecutive years by expanded sales
of high quality surveillance camera lenses.
FY2013 Financial Results 17
Ⅲ.Financial Situation
FY2013 Financial Results 18
Ⅲ-1. Financial Summary
FY2012
(a)
FY2013
(b)
Change
(b)-(a) Main Factor for Change
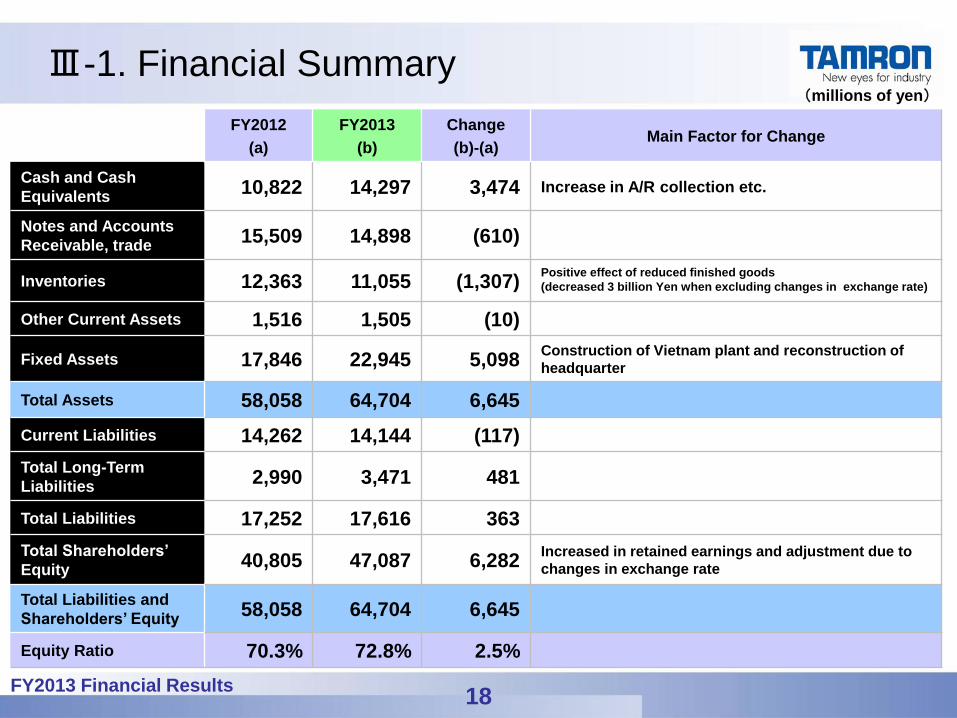
Cash and Cash
Equivalents 10,822 14,297 3,474 Increase in A/R collection etc.
Notes and Accounts
Receivable, trade 15,509 14,898 (610)
Inventories 12,363 11,055 (1,307) Positive effect of reduced finished goods
(decreased 3 billion Yen when excluding changes in exchange rate)
Other Current Assets 1,516 1,505 (10)
Fixed Assets 17,846 22,945 5,098 Construction of Vietnam plant and reconstruction of
headquarter
Total Assets 58,058 64,704 6,645
Current Liabilities 14,262 14,144 (117)
Total Long-Term
Liabilities 2,990 3,471 481
Total Liabilities 17,252 17,616 363
Total Shareholders’
Equity 40,805 47,087 6,282
Increased in retained earnings and adjustment due to
changes in exchange rate
Total Liabilities and
Shareholders’ Equity 58,058 64,704 6,645
Equity Ratio 70.3% 72.8% 2.5%
(millions of yen)
FY2013 Financial Results 19
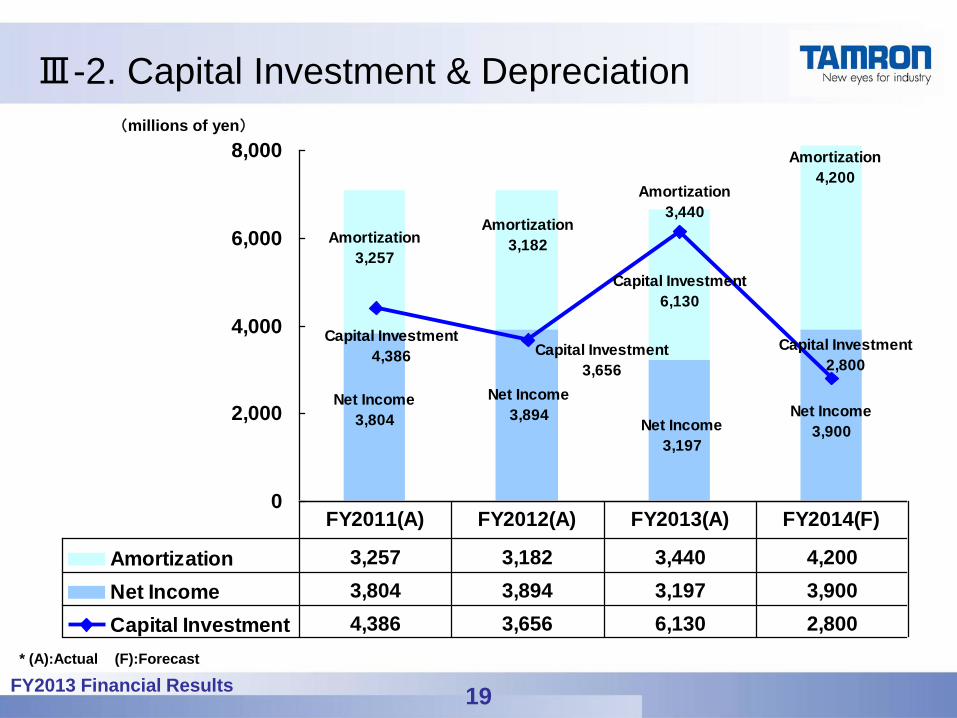
Net Income
3,197
Net Income
3,894Net Income
3,804Net Income
3,900
Amortization
3,257
Amortization
3,440Amortization
3,182
Amortization
4,200
Capital Investment
6,130
Capital Investment
2,800Capital Investment
3,656
Capital Investment
4,386
0
2,000
4,000
6,000
8,000
Amortization 3,257 3,182 3,440 4,200
Net Income 3,804 3,894 3,197 3,900
Capital Investment 4,386 3,656 6,130 2,800
FY2011(A) FY2012(A) FY2013(A) FY2014(F)
Ⅲ-2. Capital Investment & Depreciation
* (A):Actual (F):Forecast
(millions of yen)
FY2013 Financial Results 20
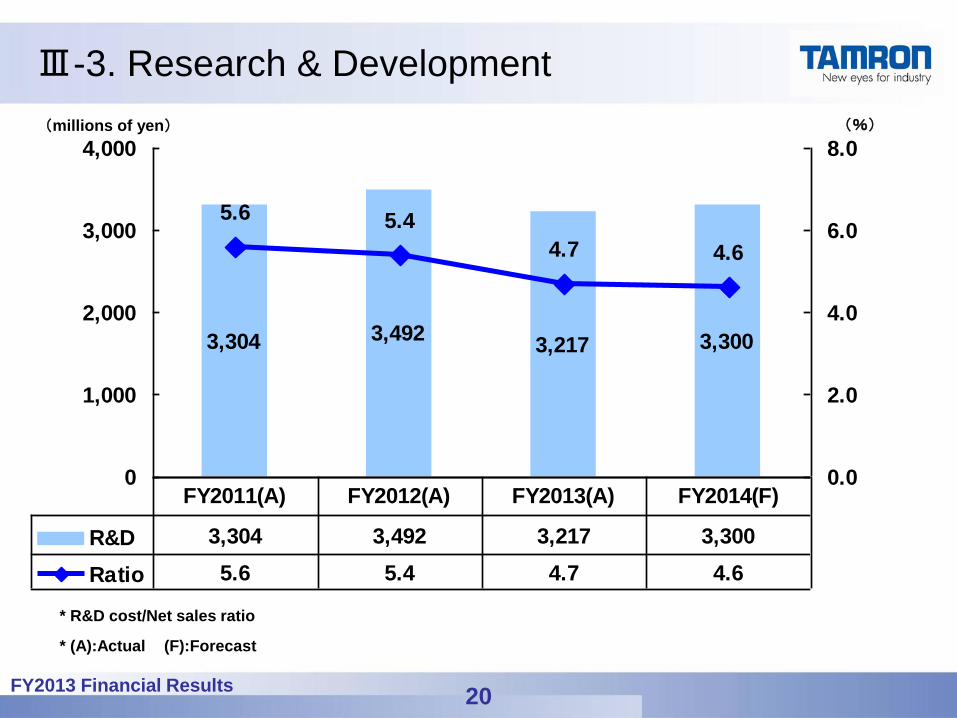
3,304 3,4923,217 3,300
4.64.7
5.45.6
0
1,000
2,000
3,000
4,000
0.0
2.0
4.0
6.0
8.0
R&D 3,304 3,492 3,217 3,300
Ratio 5.6 5.4 4.7 4.6
FY2011(A) FY2012(A) FY2013(A) FY2014(F)
Ⅲ-3. Research & Development
(millions of yen)
* R&D cost/Net sales ratio
* (A):Actual (F):Forecast
(%)
FY2013 Financial Results 21
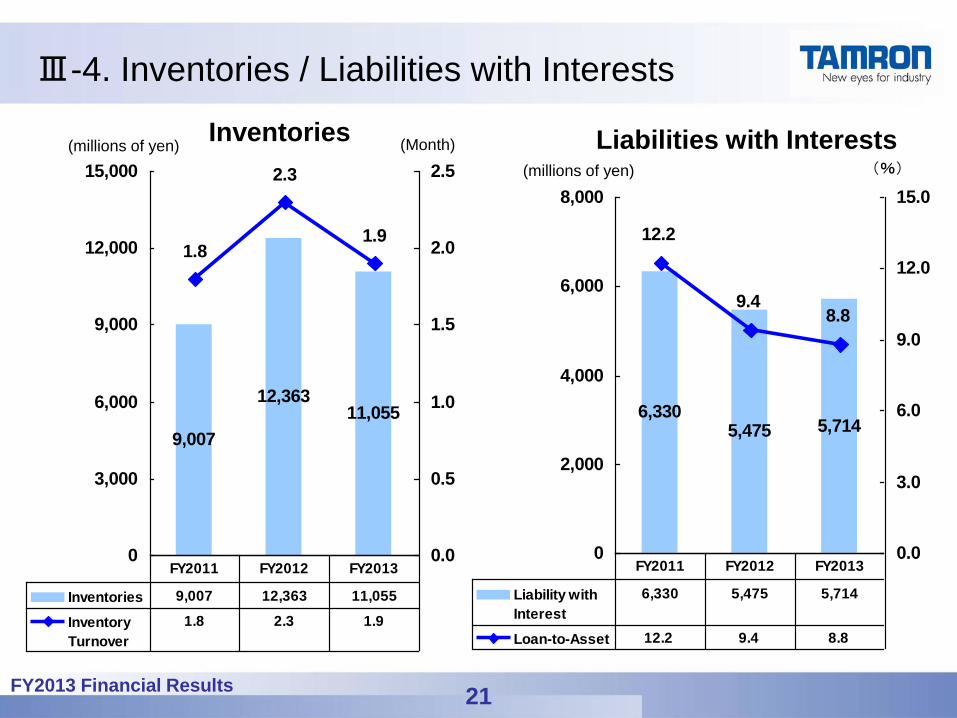
9,007
12,36311,055
1.9
2.3
1.8
0
3,000
6,000
9,000
12,000
15,000
0.0
0.5
1.0
1.5
2.0
2.5
Inventories 9,007 12,363 11,055
Inventory
Turnover
1.8 2.3 1.9
FY2011 FY2012 FY2013
Ⅲ-4. Inventories / Liabilities with Interests
Inventories Liabilities with Interests (millions of yen) (Month)
(millions of yen) (%)
6,3305,475 5,714
8.89.4
12.2
0
2,000
4,000
6,000
8,000
0.0
3.0
6.0
9.0
12.0
15.0
Liability with
Interest
6,330 5,475 5,714
Loan-to-Asset 12.2 9.4 8.8
FY2011 FY2012 FY2013
FY2013 Financial Results 22
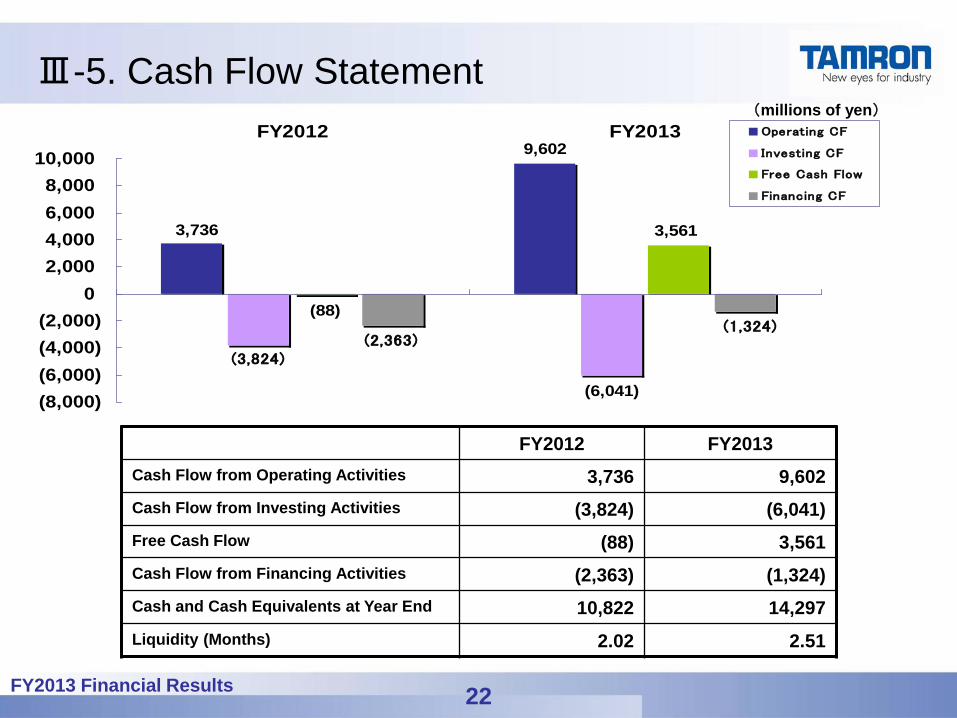
Ⅲ-5. Cash Flow Statement (millions of yen)
FY2012 FY2013
Cash Flow from Operating Activities 3,736 9,602
Cash Flow from Investing Activities (3,824) (6,041)
Free Cash Flow (88) 3,561
Cash Flow from Financing Activities (2,363) (1,324)
Cash and Cash Equivalents at Year End 10,822 14,297
Liquidity (Months) 2.02 2.51
3,736
9,602
(3,824)
(6,041)
3,561
(88)
(2,363)(1,324)
(8,000)
(6,000)
(4,000)
(2,000)
0
2,000
4,000
6,000
8,000
10,000
FY2012 FY2013 Operating CF
Investing CF
Free Cash Flow
Financing CF
FY2013 Financial Results 23
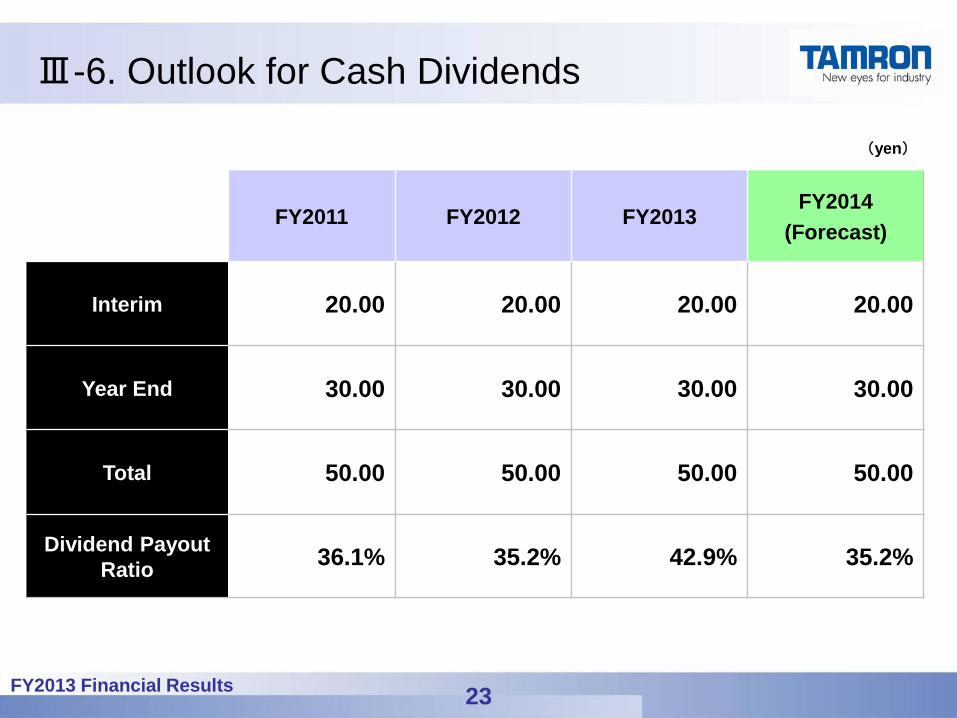
Ⅲ-6. Outlook for Cash Dividends
FY2011 FY2012 FY2013 FY2014
(Forecast)
Interim 20.00 20.00 20.00 20.00
Year End 30.00 30.00 30.00 30.00
Total 50.00 50.00 50.00 50.00
Dividend Payout
Ratio 36.1% 35.2% 42.9% 35.2%
(yen)
FY2013 Financial Results 24
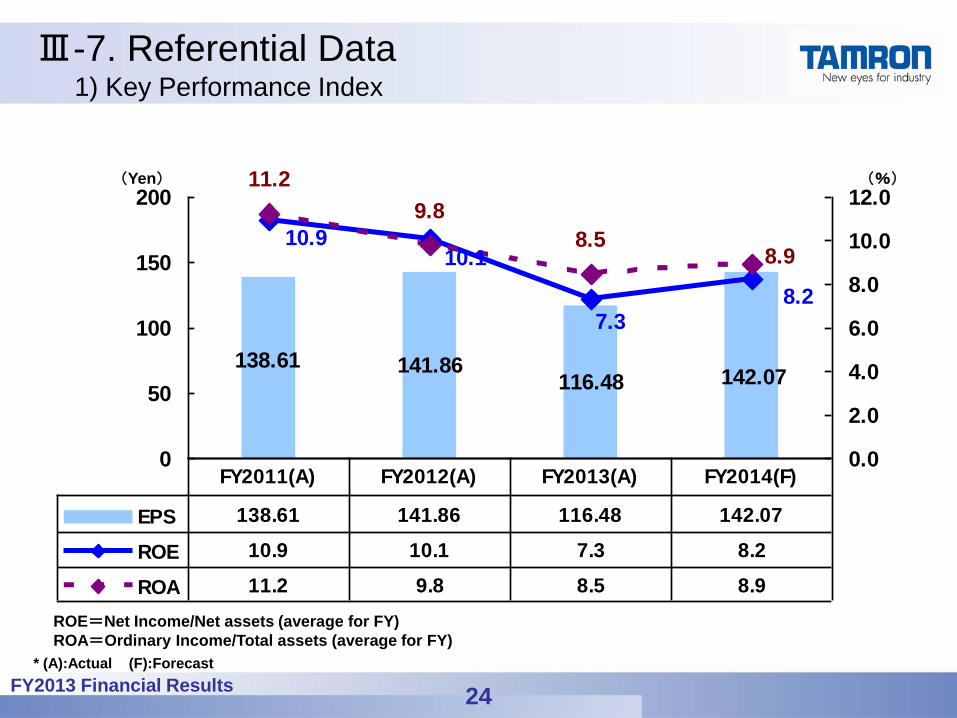
138.61 141.86116.48 142.07
11.2
8.27.3
10.110.9
8.9
9.8
8.5
0
50
100
150
200
0.0
2.0
4.0
6.0
8.0
10.0
12.0
EPS 138.61 141.86 116.48 142.07
ROE 10.9 10.1 7.3 8.2
ROA 11.2 9.8 8.5 8.9
FY2011(A) FY2012(A) FY2013(A) FY2014(F)
1) Key Performance Index
Ⅲ-7. Referential Data
(Yen) (%)
ROE=Net Income/Net assets (average for FY)
ROA=Ordinary Income/Total assets (average for FY)
* (A):Actual (F):Forecast
FY2013 Financial Results 25
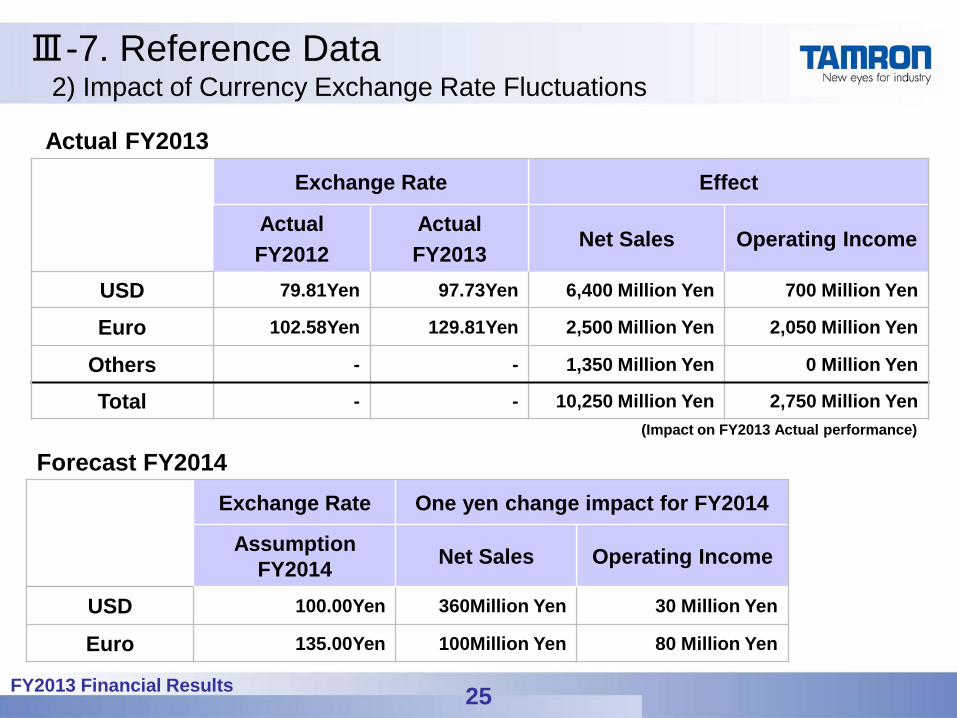
Actual FY2013
Exchange Rate Effect
Actual
FY2012
Actual
FY2013 Net Sales Operating Income
USD 79.81Yen 97.73Yen 6,400 Million Yen 700 Million Yen
Euro 102.58Yen 129.81Yen 2,500 Million Yen 2,050 Million Yen
Others - - 1,350 Million Yen 0 Million Yen
Total - - 10,250 Million Yen 2,750 Million Yen
Exchange Rate One yen change impact for FY2014
Assumption
FY2014 Net Sales Operating Income
USD 100.00Yen 360Million Yen 30 Million Yen
Euro 135.00Yen 100Million Yen 80 Million Yen
Forecast FY2014
2) Impact of Currency Exchange Rate Fluctuations
Ⅲ-7. Reference Data
(Impact on FY2013 Actual performance)
FY2013 Financial Results 26
Ⅳ.Mid-Term Strategy
FY2013 Financial Results 27
Ⅳ‐2. Mid-Term Management Goals for FY2016
Ⅳ-1. Corporate Tagline
Net Sales: ¥90.0 billion
Operating Income: ¥8.5 billion (Operating Income ratio 9.4%)
FY2013 Financial Results
Ⅳ-3. Strategy Towards FY2016 by Segment
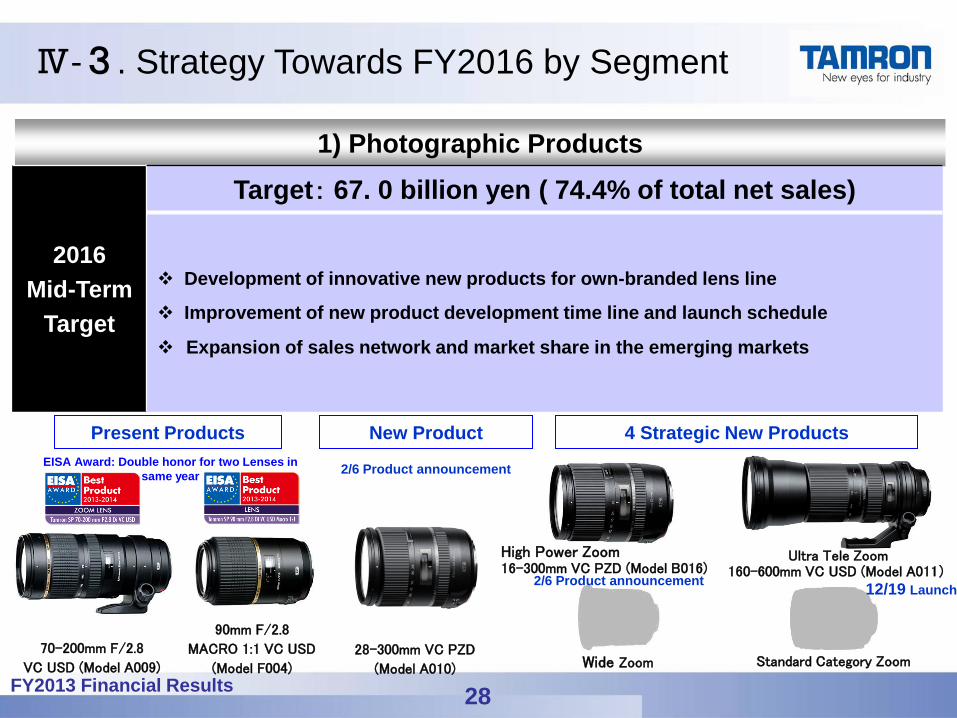
1) Photographic Products
2016
Mid-Term
Target
Target: 67. 0 billion yen ( 74.4% of total net sales)
Development of innovative new products for own-branded lens line
Improvement of new product development time line and launch schedule
Expansion of sales network and market share in the emerging markets
28
4 Strategic New Products Present Products
70-200mm F/2.8
VC USD (Model A009)
90mm F/2.8
MACRO 1:1 VC USD
(Model F004)
High Power Zoom 16-300mm VC PZD (Model B016)
Wide Zoom Standard Category Zoom
New Product
28-300mm VC PZD
(Model A010)
2/6 Product announcement
12/19 Launch
EISA Award: Double honor for two Lenses in
same year
Ultra Tele Zoom 160-600mm VC USD (Model A011)
2/6 Product announcement
FY2013 Financial Results
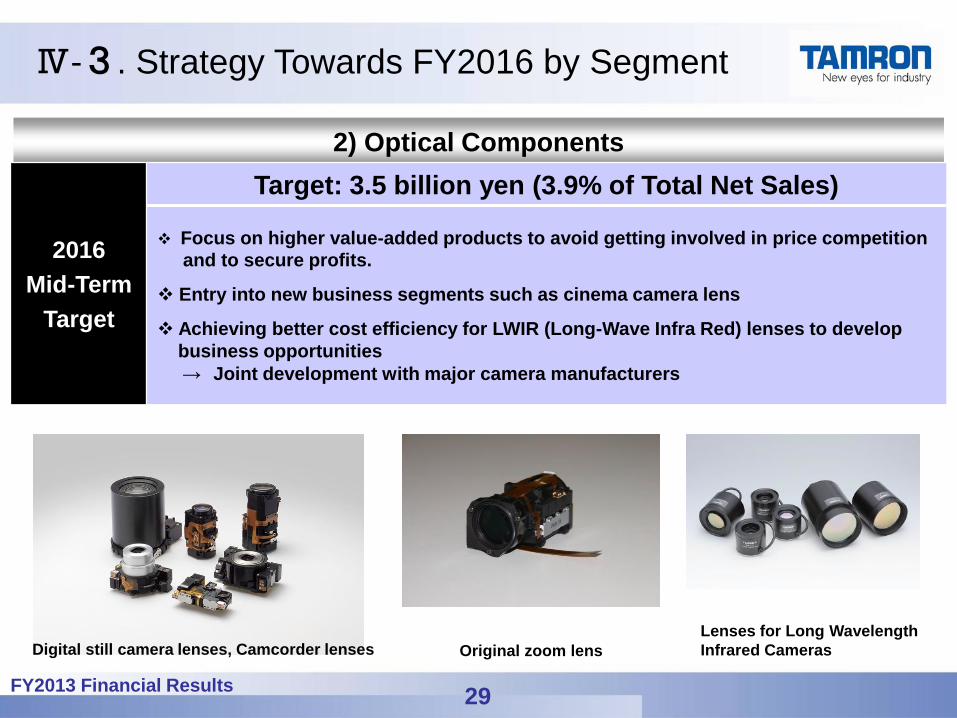
2) Optical Components
Ⅳ-3. Strategy Towards FY2016 by Segment
2016
Mid-Term
Target
Target: 3.5 billion yen (3.9% of Total Net Sales)
Focus on higher value-added products to avoid getting involved in price competition
and to secure profits.
Entry into new business segments such as cinema camera lens
Achieving better cost efficiency for LWIR (Long-Wave Infra Red) lenses to develop
business opportunities
→ Joint development with major camera manufacturers
Original zoom lens
Lenses for Long Wavelength
Infrared Cameras Digital still camera lenses, Camcorder lenses
29
FY2013 Financial Results
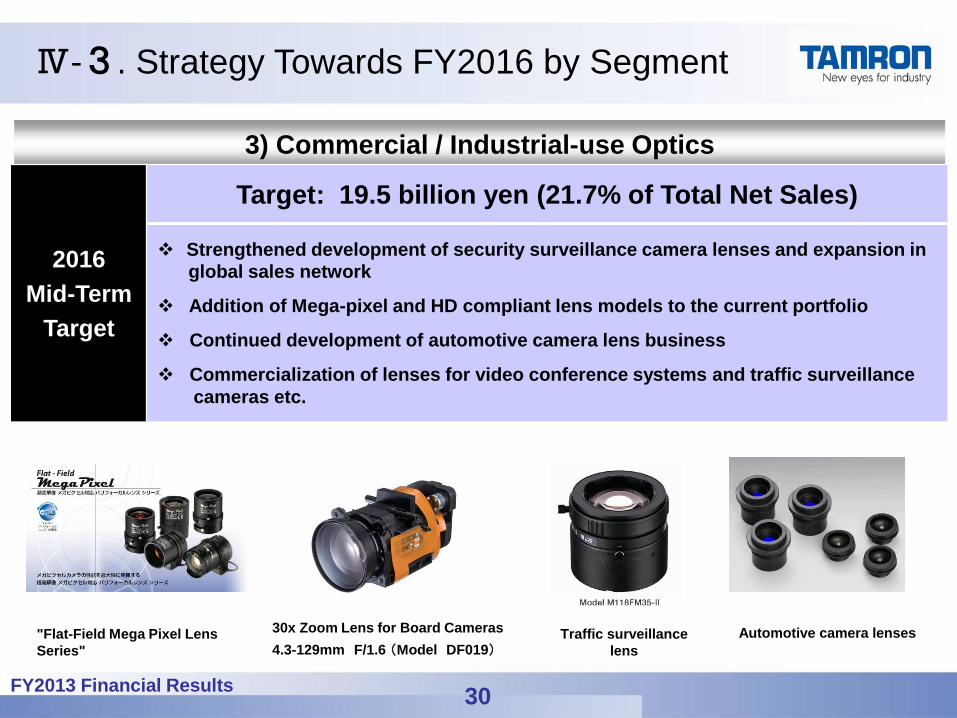
3) Commercial / Industrial-use Optics
Ⅳ-3. Strategy Towards FY2016 by Segment
2016
Mid-Term
Target
Target: 19.5 billion yen (21.7% of Total Net Sales)
Strengthened development of security surveillance camera lenses and expansion in
global sales network
Addition of Mega-pixel and HD compliant lens models to the current portfolio
Continued development of automotive camera lens business
Commercialization of lenses for video conference systems and traffic surveillance
cameras etc.
"Flat-Field Mega Pixel Lens
Series"
Automotive camera lenses Traffic surveillance
lens
30
30x Zoom Lens for Board Cameras
4.3-129mm F/1.6 (Model DF019)
FY2013 Financial Results
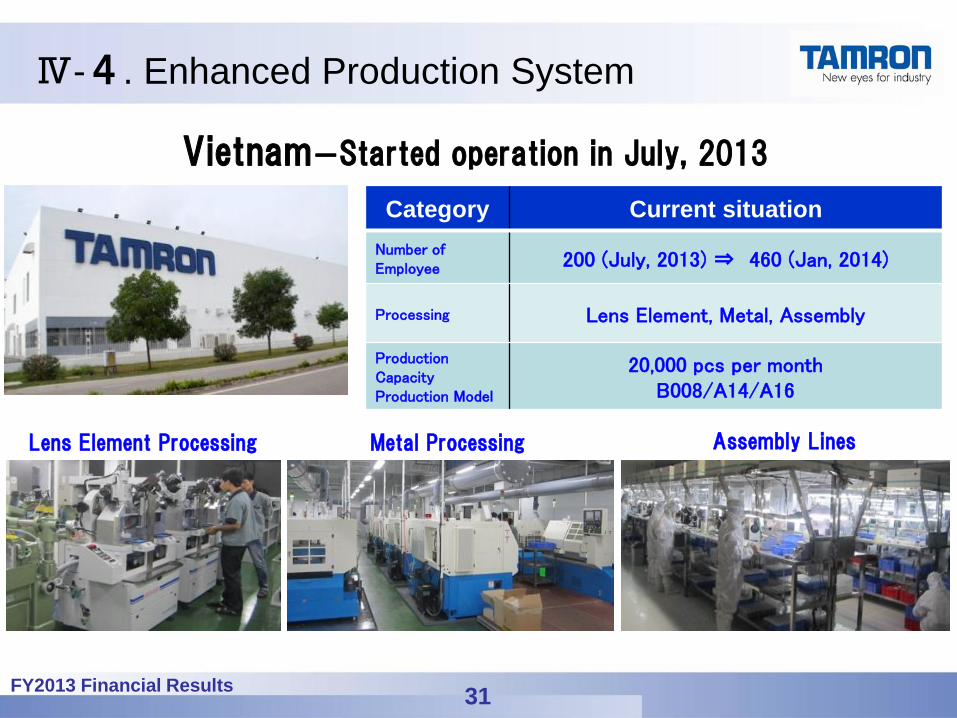
Ⅳ-4. Enhanced Production System
31
Vietnam-Started operation in July, 2013
Lens Element Processing
Category Current situation
Number of Employee 200 (July, 2013) ⇒ 460 (Jan, 2014)
Processing Lens Element, Metal, Assembly
Production Capacity Production Model
20,000 pcs per month B008/A14/A16
Metal Processing Assembly Lines
FY2013 Financial Results 32
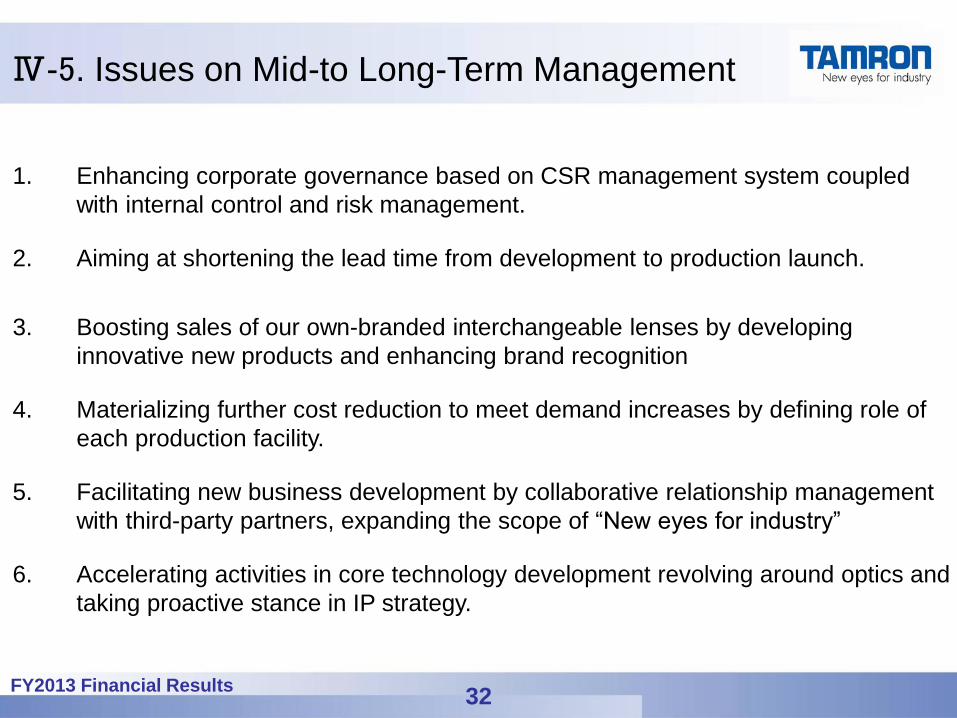
Ⅳ-5. Issues on Mid-to Long-Term Management
1. Enhancing corporate governance based on CSR management system coupled
with internal control and risk management.
2. Aiming at shortening the lead time from development to production launch.
3. Boosting sales of our own-branded interchangeable lenses by developing
innovative new products and enhancing brand recognition
4. Materializing further cost reduction to meet demand increases by defining role of
each production facility.
5. Facilitating new business development by collaborative relationship management
with third-party partners, expanding the scope of “New eyes for industry”
6. Accelerating activities in core technology development revolving around optics and
taking proactive stance in IP strategy.
FY2013 Financial Results 33
Disclaimer
1. The purpose of this material is to provide information on the “FY2013 Financial Results” and future business strategies. It is not an offer or a solicitation of an offer to buy or sell securities.
2. This material and the information provided verbally in our presentation are based on the data that are obtainable at the time of the presentation in compliance with our management policies and certain premises that are deemed reasonable by us.
3. Please note that the actual results may sometimes differ from the forecasts contained herein due to various factors.
4. We are not liable in any way for any damages or losses incurred in connection with your use of any information or data contained herein or provided verbally in our presentation.