Aviation Emissions, Impacts & Mitigation: A Primer, January 2015

Final Report Aviation Emissions and their Impact on Air Quality
Main thematic area: Science
Angus Graham Manchester Metropolitan University February 2009 Co-investigators: Rod Jones, Vitchko Tsanev, Iq Mead- University of Cambridge, Mike Bennett, Simon Christie- Manchester Metropolitan University, Moira Hilton, Mike Walsh- University of Reading, Don Grainger, Dan Peters, Cathy Ansell, Rhys Jones- Oxford University, James Lee- York University

Page 2 www.omega.mmu.ac.uk
About Omega Omega is a one-stop-shop providing impartial world-class academic expertise on the environmental issues facing aviation to the wider aviation sector, Government, NGO’s and society as a whole. Its aim is independent knowledge transfer work and innovative solutions for a greener aviation future. Omega’s areas of expertise include climate change, local air quality, noise, aircraft systems, aircraft operations, alternative fuels, demand and mitigation policies. Omega draws together world-class research from nine major UK universities. It is led by Manchester Metropolitan University with Cambridge and Cranfield. Other partners are Leeds, Loughborough, Oxford, Reading, Sheffield and Southampton. Launched in 2007, Omega is funded by the Higher Education Funding Council for England (HEFCE). www.omega.mmu.ac.uk
Report prepared by Principal Investigator: Dr Angus Graham
Reviewed / checked by Omega
© Copyright MMU 2008

Page 3 www.omega.mmu.ac.uk
Contents
EXECUTIVE SUMMARY ............................................................................................................................................ 4
1. Overview ........................................................................................................................................................... 11
2. Instrument development .................................................................................................................................. 14
3. Experiment ........................................................................................................................................................ 15
3.1. Cranfield Airport ........................................................................................................................................ 15
3.2. Manchester Airport .................................................................................................................................... 17
4. Core data output ............................................................................................................................................... 19
5. Observations ..................................................................................................................................................... 20
6. Proposal for future analyses ............................................................................................................................. 30
7. Summary and conclusions ................................................................................................................................ 31
ACKNOWLEDGEMENTS ......................................................................................................................................... 32
REFERENCES .......................................................................................................................................................... 33

Page 4 www.omega.mmu.ac.uk
EXECUTIVE SUMMARY
Motivation To satisfy statutory procedures and directives, the impact of a major airport development on air quality as well as noise levels must be assessed. With only limited scope for reducing emissions from jet engines, it appears quite possible that airport capacity in the UK may become constrained by air-quality requirements. At Heathrow, in particular, projections indicate that the EU standard on mean annual NO2 levels may be hard to achieve as the airport is developed further. In announcing Government approval for a third runway, the Secretary of State has made it clear planning consent is contingent upon a robust projection of compliance with air-quality targets. Aircraft in ground run and flight constitute an unavoidable, strong, intermittent, mobile source of emissions with a speed and direction that can change rapidly. The intermittent nature of release, practical difficulties in working near taxiways and runways and commercial sensitivities in general hinder acquisition of accurate data on the times, locations and rates of release of emissions at a busy civil airport, and thus estimation of these emissions’ contribution to mean concentrations. Emissions are furthermore subject not only to the transport processes of the ambient atmosphere, but also to those engendered by the aircraft itself. Exhausts from engines have a release momentum and acquire a vertical momentum as a result of their buoyancy, and may reside within a wake as result of the lift and drag on the airframe. Air-quality models have emerged in recent years in which there is some representation of the dynamical activity of exhausts, predicated on a limited set of measurements. These models provide the principal means of assessing the impact of a proposed airport development. Use of a specially-adapted, swept-beam UV backscatter Lidar by a team led by Dr M. Bennett at Manchester Metropolitan University has latterly brought much insight into the exhaust dynamics, and allowed some further model development. It is, however, essential to obtain more data for models to be validated against. Chemical measurements matching the rapidity, coverage and detail of the Lidar data might be taken as the highest priority.
Objectives The broad aim was to develop and demonstrate techniques to measure the chemical evolution of aircraft exhausts, so that monitoring at airports may be improved, and air-quality models tested and made more accurate. This was to be pursued through the following tasks.
i. To construct and calibrate a passive spectrometer so as to measure excess concentrations of NO2 in aircraft-exhaust plumes, as integrated along lines of
Page 5 www.omega.mmu.ac.uk
sight to a detector array, and with a field of view that may be swept so as to image plumes side-on.
ii. To deploy the spectrometer in a set of three field trials over the course of twelve months, studying the exhausts from a BAe146 at Cranfield Airport, as operated under the direction of the experimenters (the aircraft is used to undertake atmospheric research by the Met Office and NERC).
iii. To make supplementary measurements on plumes in the trials, principally of particulates and gaseous pollutants (NO, NO2, O3, CO and CO2), using a rapidly-swept UV backscatter Lidar to image the excess return from exhaust aerosol in vertical sections through plumes; an active IR spectrometric system whose beam transects the line of the runway; and a set of instruments placed near the runway so as to yield in-situ concentrations.
iv. To obtain a comprehensive set of supporting field data, including engine operating condition; aircraft position, velocity and acceleration; and ambient atmospheric conditions and trace composition.
v. To conduct a field trial at a nationally significant airport, as far as possible using the same instrumentation, to obtain measurements over a range of transports representative of the UK civil fleet.
vi. To work up, parameterise and interpret the data from the trials, identifying characteristic plume scales and signal levels, and trends of these with distance from engines and time since ground run was begun, as appropriate.
vii. To combine concomitant data from the spectrometer and Lidar so as to yield characteristic concentrations of NO2 in plumes.
viii. To analyse the data by, as far as possible, comparing values of parameters of the rise and spread of exhausts, and of the concentrations of NOx and NO2, with predictions from models, with validation accuracies being elicited.
Investigations undertaken
A novel instrument was designed and constructed (Prof. R. Jones, Cambridge), applying differential optical absorption spectroscopy to the spectrum of daylight to make rapid, remote, non-intrusive measurements on the concentrations of pollutant gas species (NO2 and HONO, or nitrous acid) (Objective i).
The dependence of spectral signatures on excess concentrations of pollutants in lines of sight between an array of detectors and a tall, narrow field of view was established, and verified to within 10% using a calibration gas cell (Objective i).
A horizontally steerable mirror was incorporated so that the field of view could be swept, and images of exhaust plumes in wide side elevation thus built up (Objective i).
The instrument was deployed in three field trials over twelve months to study exhausts from a BAe146 at Cranfield Airport, along with up to two other passive spectrometers, an IR camera (to image the hot exhausts at engine exits), a set of 4 specially-acquired CO2 sensors and a gas analyser measuring NO2 and O3 (Objectives ii and iii).

Page 6 www.omega.mmu.ac.uk
Also deployed in the trials were a UV backscatter Lidar and particle counter (Dr M. Bennett, Manchester Metropolitan University), an active IR spectrometric system and additional particle counters (Dr M. Hilton, Reading University), and a rapid gas sampler measuring NO and NO2 (Dr J. Lee, York University) (Objective iii).
A large body of supporting data on the aircraft was obtained in the trials, including weight and flap angle, and onboard data from a flight recorder (viz. engine fuel-burn rate, fan speed and exhaust-gas temperature), a high-resolution GPS, an air-speed indicator, inclinometers, an accelerometer and a pair of cameras (Objective iv).
Other instruments onboard gave ambient profiles in the lower boundary layer of wind, turbulence intensities, air temperature, humidity, and concentrations of NO, NO2, O3 and CO (Objective iv). (Note that mean horizontal concentration gradients may be assumed weak, the 146 being the only transport aircraft operating at the Airport.)
Supporting measurements were also obtained from instruments on the ground, including radial wind and turbulence-intensity profiles from a Doppler Lidar, and surface wind, temperature, humidity and irradiance, with footage of the aircraft also being shot (Objective iv).
A complementary field trial initially envisaged at British Airways’ maintenance noise pen at Heathrow proved impractical; a two-day trial in late summer at Manchester Airport was arranged instead (Objective v).
Passive spectrometers and the backscattering Lidar were deployed at Manchester Airport, landside of the Airport fence, with supporting meteorological measurements and film footage being obtained, and with upwards of 70 aircraft movements being captured (Objective v).
Data from the Cranfield trials have been calibrated, worked up and placed on the Internet, including images from the passive spectroscopy and Lidar (Objective vi).
Exhaust plumes are clearly evidenced within the images and time-series plots, and have correspondingly been ascribed scales (Objective vi).
Trends in these scales with distance from engines and time since ground run was begun have been identified and accounted for, and reconciled with findings from models and other experiments (Objective vi).
In a special case in which engines were run statically at takeoff power, the images and a simple analytic model of the plume dynamics have been used to yield a characteristic molecular fraction of NOx in the form of NO2 (Objectives vii and viii).
Knowledge-transfer activity Liaison took place with three groups involved in related Omega studies, and a joint workshop to assess findings was held in London in October 2008. The groups were as led by Prof. I. Poll at Cranfield, investigating the experimental and numerical modelling

Page 7 www.omega.mmu.ac.uk
of exhaust jets and their interactions with one another, the ground and wake vortices; by Dr D. Grainger at Oxford, developing a novel instrument, SPARCLE, to make real-time measurements of the size and composition of particulates; and by Prof. C. Wilson at Sheffield, constructing an emissions-testing rig, ALFA, for deployment at an engine exit. Findings have been disseminated in presentations and a written paper to two international academic conferences in October 2008, on air-quality modelling and harmonisation, in Croatia, and on airport air quality, hosted by Omega in London. Preliminary results have also been presented at a joint US-UK Lidar Workshop in Boston in October 2007. There has been exposure of the work within the Research Councils: the BAe146 at Cranfield is made available for research through NERC, jointly with the Met Office and under the auspices of FAAM; while EPSRC - who first funded the Lidar and spectroscopic research - recently hosted a ‘sandpit’ on airport research, in which an air-quality-mitigation initiative advanced by Dr Bennett was provisionally approved for funding. Data and findings have been made available to EU researchers through the Commission’s ECATS network (to which Manchester Metropolitan University belongs). Students have also participated in the instrument development, fieldwork and analysis of data, with undergraduate research projects correspondingly carried out at each of the three partner universities. There has also been a wider dissemination amongst airports, airlines and aviation organisations. The study could not have taken place without the endorsement, support and time of environmental and operational managers at Cranfield and Manchester Airports. A presentation on research methods and findings was given to ICAO’s Committee on Aviation and Environmental Protection in Montreal in October 2007. A presentation of similar scope was given at a two-day course on aviation and the environment run for the aviation industry by OMEGA at Cranfield in June 2008.
Findings
Remote and rapid measurements may be collected on plume scales and pollutant concentrations, conveniently and safely, and at many airports sufficiently far from the runway as to be beyond the airfield fence.
Passive spectroscopy may be used to resolve path-integrated concentrations of NO2 in exhausts, and to image these both when engines are idling and when takeoff power is realised.
HONO is also detectable in significant quantities, as is thought to form in heterogeneous reactions of NO2 with plume aerosol.
When the engines of a BAe146 are powered up for takeoff, concentrations of NO2 as integrated over a path across the release are observed to tend to equilibrate over some 30-130 m from engines.

Page 8 www.omega.mmu.ac.uk
This may be explained on adopting a simple first-order model in which the exhausts are taken to be too young for their buoyancy to be dynamically active, and so come to reside within a wall jet.
A characteristic trend value of 1.6 1016 molecules of NO2 cm−2 may be identified
from the measurements, which on comparison with model predictions is consistent with about 6% of NOx molecules being in the form of NO2.
The speciation of NOx in these exhausts thus appears comparable to that reported in the literature in the case of the primary emission.
Data from a deployment of the spectrometer at Manchester Airport, this time without any sweeping in the azimuth and there thus being only a narrow swath through the line of the runway, exhibit spikes that occur at broadly the same frequency as at which aircraft depart.
A swept-beam UV Lidar may be used to study the scattering from aerosol through complete sections through plumes, with exhausts from the 146 being observable for upwards of a minute after the aircraft moves off on its takeoff ground run.
The Lidar sections may be used to obtain objective statistics on the width, mean height and vertical extent of plumes.
These statistics corroborate and strengthen findings from other recent Lidar deployments, namely that exhaust streams from engines merge to form a common plume within about a wingspan downstream, with exhaust buoyancy thereafter coming to heighten and narrow the plume, but not causing the plume to separate from ground before the aircraft itself becomes airborne.
On combining data from the passive spectrometer and Lidar, the plume may be ascribed a characteristic NO2 concentration at a given downstream location and time since power-up for takeoff.
Outcomes Advances The measurement campaign has yielded an extensive set of simultaneous physical and chemical measurements on the evolution of exhaust plumes from aircraft at the start of takeoff. A novel passive imaging spectrometer has been used, yielding path-integrated concentrations of NO2. Such measurements may be statistically more reliable than spot values, and, as they have been obtained concomitantly with measurements from an imaging backscatter Lidar, allow mean concentrations as averaged over a plume cross-section to be obtained. The study included the simplifying case of a static aircraft with engines powered at takeoff thrust, so that data might be used to validate models via a stage of intermediate representativeness and complexity (see Impacts).
Page 9 www.omega.mmu.ac.uk
Three trials studying exhausts from a BAe146 at Cranfield Airport were undertaken over the course of one year, allowing investigation of the influence of differing atmospheric conditions and trace composition. In two of the trials, the aircraft executed sorties with a minimum delay in between, allowing investigation of the statistical variability resulting from aircraft-forced and ambient turbulence, and any associated compositional inhomogeneities. A trial also took place at Manchester Airport, so that a representative range of civil transports could be studied. A number of serendipitous observations were made during the campaign. The imaging spectrometer proved sensitive enough to measure NO2 in exhausts from the 146 while its engines idled on the runway, for a few minutes prior to takeoff. In-situ measurements of NO2 in exhausts from a range of departing light aircraft were also obtained. Tyre smoke released during the spin-up of wheels as aircraft touched down was observed with the Lidar and in film footage. The associated emission of particulates may exceed that from aircraft engines at airports (DfT report, 2006); aircraft tyres may, moreover, contain up to ten times the new EU limit on PAHs in car tyres. Smoke from touchdown of the 146 usually left a signature in both data streams, but, in the case of at least one landing, was not evident in either. It thus seems possible that the emission might be alleviated merely by reducing the vertical speed of impact, achievable simply through some minor modification of pilot training or flight-control software. Impacts
The measurements are of relevance to modellers of local and regional air quality, and to planners and environmental managers and engineers, as employed within UK airports, the DfT, DEFRA and Environment Agency, and local authorities. Modellers can use the data to validate or improve their representation of aircraft emissions and the evolution of these after release. A more reliable means of predicting the contribution of emissions from aircraft on runways to nearby air quality (if poor) would aid in the attribution of sources there, and thus in the formulation of effective mitigation and compliance strategies. The techniques advanced here are remote, safe, convenient and rapid, and should be considered for use by airports where gaps might be identified in what is known from their routine monitoring.
Further work As the study was nearing completion, funding for a further field trial became available from Omega. The aim was to bear down further on statistical error, and to deploy better instrumentation for in-situ sampling of emissions for comparison with the remote measurements. The trial was conducted in February 2009; a preliminary report appears in an Appendix to this document.

Page 10 www.omega.mmu.ac.uk
Looking ahead, further research in the area of airport air quality should be directed broadly toward improving the accuracy of the air-quality models, as validated to suitably detailed data, and to investigating how findings might best be utilised in the management of airport air quality. The physics and chemistry of the young exhaust plume from an aircraft appear too complex for wholly empirical relationships realistically to be sought from field data. Resource in the area has, after targeting - highly successfully - a development of suitable instrumentation, accommodated this through the acquisition and working up of datasets of sufficient breadth, resolution and statistical robustness as to permit reliable model validation. A top priority must now be to complete and make public a comprehensive data analysis, so as to maximise the scope for validation. Thus far, only Lidar data on the dispersion of exhausts during the takeoff ground run have been analysed statistically (though not in the case of this campaign), and tested against a theoretical model developed in parallel (Graham et al, 2008). Even here, the data analysis has yet to be extended to examine the dispersion of these exhausts after the aircraft has been rotated upward and becomes airborne. Lidar data as described herein should also be combined with those from earlier studies at Heathrow and Manchester Airports in an analysis of the dispersion of exhausts released at close to the time of liftoff, when wing lift and circulation affect the exhaust dynamics. A similar analysis of data from the other instruments used as described herein is also needed. There should be some reduction of data, so that comparison may be made with predictions from models in which cross-stream variations within the plume are not resolved, models which may thus be embedded within larger-scale air-quality models at little extra computational cost. Images from the passive spectroscopy of excess path-integrated concentrations of NO2 resulting from aircraft exhausts might correspondingly be further integrated vertically. Wherever and whenever the plume was also observed by Lidar, mean concentrations as averaged over a plume cross-section should be systematically computed. There are now sufficient data from film footage and Lidar on the dispersion of tyre smoke released when aircraft touch down for some statistical analysis to be possible. Observations point to the dynamical action of lift and circulation (the lift being essentially equal and opposite to aircraft weight up to and including the time of touchdown), and of smoke buoyancy. Estimates are available of the quantity of rubber typically shed from tyres at touchdown (DfT report, 2006), according to measured differences in the weight of new and worn tyres. Practical options for reducing the impact of emissions from aircraft as part of a mitigation strategy may be limited, and differ radically from airport to airport. They may include adoption of delayed-start or single-engine-taxi operations. The focus might alternatively be on targeting emissions in the vicinity of air-quality hotspots (as typically

Page 11 www.omega.mmu.ac.uk
arise alongside busy perimeter roads), through a reallocation of taxiways and runway entry points, or revision of any runway-alternation scheme in operation so as to take into account impacts on air quality as well as noise. Omega partners Manchester Metropolitan University and the universities of Cranfield and Southampton have also provisionally been awarded funding from EPSRC to investigate alternative impact-abatement techniques.
1. Overview To satisfy statutory planning procedures and national and international directives, the impact of a major airport development on air quality as well as noise levels must be assessed. Pollutants form in the exhaust streams of aircraft, road and service vehicles and power and heating plants, and may adversely affect the health of airport workers and local residents, and any areas of uncommon or protected ecology. The recent White Paper on aviation (DfT, 2003) foresees a 5-7% mean annual increase in air-traffic movements if unconstrained, but with only modest scope for reducing emissions from jet engines, it appears quite possible that airport capacity in the UK may become limited by air-quality requirements. At Heathrow, in particular, projections indicate that the standard on mean annual NO2 levels may not be met if a third runway is built, with the Secretary of State making it clear construction could be precluded on this basis. Aircraft in ground run and flight constitute an unavoidable, strong, intermittent, mobile source of emissions, with a speed and direction that can change rapidly. It is hard to identify their impact on mean concentrations in comparison with other transport-source categories. Most particulates are emitted at ultrafine scales, and the NOx released at high emission rates during takeoff derives overwhelmingly from NO, making the primary emission relatively benign. The intermittent nature of release, practical difficulties in working near taxiways and runways and commercial sensitivities in general hinder acquisition of accurate data on the times, locations and rates of release of emissions at a busy civil airport. Data from standard engine tests are freely available from the ICAO, but leave large questions unanswered as to the form and composition of particulate matter and the speciation of NOx at the engine exit. There are also important uncertainties in how emissions disperse, before they are effectively subsumed within the ambient contaminant field. Airports are often sited at the urban fringe, where the aerodynamic roughness length may vary markedly with wind direction. This is not addressed by most air-quality models. Exhausts are, moreover, subject not only to the transport processes of the ambient atmosphere, but also to those engendered by the aircraft itself. They have a Lagrangian (excess) momentum in the downstream direction (opposite to aircraft heading), as a result of the engine thrust, and acquire a vertical momentum as a result of their buoyancy. If the aircraft is moving quickly, and the lift and drag on it are significant in relation to the combined thrust from the engines, exhausts will furthermore interact with an airframe wake. The generation of lift causes the wake to move downwards, as mediated

Page 12 www.omega.mmu.ac.uk
principally through the mutual induction of a pair of trailing counter-rotating vortices. The vortices arise from the circulation about wings associated with the lift and as shed to the wake, and roll up within a few wingspans downstream. Their descent is arrested near the ground, and the pair instead start moving apart, through the action of a flow corresponding to that were each to induce an ‘image’ in the ground plane (to satisfy zero flux of fluid through the ground). The excess momentum of exhausts forces an entrainment of ambient air into exhaust streams, determining their rates of cooling and early dilution, and thus influencing their chemical transformation. There may initially be a trend to a growth of aerosol as a result of processes of coagulation, condensation and adsorption, followed by some decline as humidity levels fall below saturation and evaporation from aerosol begins (see Wilson et al, 2004). An oxidation of contaminants leads to more NO2 being generated, but at a sharply declining rate, as concentrations fall. Ambient O3 will initially be destroyed by the high temperatures, but an oxidation of NO by O3 as entrained later on may become the principal means of generation of NO2. Some partial reversal of this through a photolysis of NO2 may occur before exhaust turbulence falls to ambient levels, and the bulk dynamical activity of exhausts ceases. Models have emerged in recent years in which there is some representation of exhausts’ dynamical activity, predicated on a limited set of measurements. Use of a specially-adapted, swept-beam, UV backscatter Lidar by a team led by Dr M. Bennett, Manchester Metropolitan University, has latterly brought much insight into the exhaust dynamics, but it is essential to obtain more data for models to be validated against. Chemical measurements matching the rapidity, coverage and detail of the Lidar data are perhaps the highest priority. As part of this study, a team led by Prof. R. Jones, University of Cambridge, designed and constructed an imaging instrument, applying differential optical absorption spectroscopy to the spectrum of naturally-scattered sunlight to make rapid, remote, non-intrusive measurements of concentrations of pollutant gas species, as integrated over lines of sight through exhaust plumes from aircraft. The passive nature of the technique meant none of the exposure or distraction hazards associated with a beam. Path-integrated measurements are also less prone to statistical fluctuation than spot values. As rapid measurements are associated with lower light levels, state-of-the-art photonic components were used to resolve signals adequately. The Lidar and spectrometer were then deployed, along with other instruments, in dedicated field trials to study aircraft-exhaust plumes. The trials took place at Cranfield and Manchester Airports between September 2007 and September 2008. Most of the work took place at Cranfield, and involved a single aircraft only, a BAe146 in use at the airport for the purposes of conducting atmospheric research, on behalf of NERC and the Met Office. The aircraft is the only transport operating at the Airport, and

Page 13 www.omega.mmu.ac.uk
the background chemical environment may thus be considered relatively homogeneous. Airport personnel were furthermore familiar with the requirements of research teams, and experimenters were afforded ready airfield access, with a deployment of instruments close to the runway being facilitated. A set of supporting measurements on airframe and engine dynamics and ambient atmospheric trace composition and meteorology were also obtainable from dedicated onboard and ground-based instruments. Plume parameters could thus be related to source strengths, ambient concentrations, emission ages and other parameters of the aircraft and atmospheric forcings. The purpose of the work at Manchester was to obtain a set of measurements - albeit a more limited one - on a range of aircraft broadly representative of the UK civil fleet. It was originally planned to do this in tandem with the ALFA study in BA’s maintenance noise pen at Heathrow Airport. This proved not possible on study timescales, however, and an alternative deployment over the course of two days at Manchester Airport was set up. The remote-sensing capabilities of the Lidar and swept-field spectrometer were fully exploited, with the pair being collocated immediately landside of the airfield fence, close to where aircraft commenced their takeoff ground run on the second (southern) runway. Supporting spot measurements on air quality could not be obtained, however, as deployments beside the runway were impractical, and emissions were not blown over the experimental site during the fieldwork. Supporting film footage to identify aircraft and locate them in relation to the Lidar beam and spectrometer field of view was, however, obtained.

Page 14 www.omega.mmu.ac.uk
2. Instrument development Significant instrument development took place in advance of the fieldwork. Modifications were made to Manchester Metropolitan University’s swept backscatter Lidar system. This comprises an Nd-YAG laser mounted in a vehicle, with a beam that may be swept rapidly in either elevation or azimuth at the exit by a rotating mirror, yielding near-instantaneous spatial maps of the aerosol scattering field. (It should be understood that the system is not calibrated to yield absolute aerosol concentrations, which would require knowledge of spectral forms of the aerosol number density, shape and composition.) An eye-safe and invisible beam is a prerequisite for deployment at an airport, and an additional nonlinear crystal was duly installed in the laser as part of a prior project, yielding output in the near UV (λ=355 nm). Modern aircraft engines emit fine particulates, of scale on the order 30 nm, and the enhancement of backscatter is typically rather subtle. A use of high-sulphur fuel by the BAe146 at Cranfield was consequently investigated, so that the growth of aerosol downstream of engines might be enhanced, but this could have made the chemical evolution less representative, and was in any case ultimately refused by the aircraft’s operators. Efforts were thus instead directed toward reducing noise and loss of signal, with optical filters on inputs to photomultiplier detector tubes being replaced with 1.3 nm holographic filters, reducing the pickup of daylight during daytime operation. Mirrors were recoated and a beam-splitter replaced, and the optics of the whole system then systematically realigned, perhaps doubling its overall optical efficiency. Signal-processing algorithms were also refined, so as to allow accurate determination of ambient backscattering levels in the presence of a hard target, given a tendency of emissions from aircraft on runways to hug the ground after release (see Section 5). An instrument applying imaging differential optical absorption spectroscopy (IDOAS) to naturally-scattered sunlight was designed and constructed by the University of Cambridge, for the purpose of making rapid measurements of NO2 in aircraft plumes. The working spectral range was adjustable, with an optimal window for detection of NO2 of 420-450 nm - within the blue - being adopted. A rotatable mirror conveys a narrow field of view to a commercial grating spectrometer, where the light is dispersed (into 1024 wavelength bins), and passed to a charge-coupled device for arrayed
detection (1024 spatial bins 1024 wavelength bins). The default mounting is such that
the long side of the field of view is aligned vertically, allowing instantaneous profiles of the path-integrated gas concentration to be obtained. By steering the mirror azimuthally, a near-instantaneous spatial map of path-integrated concentrations may then be built up. To use the spectrometer at an airport, an ambient spectrum from the area of sky under study must firstly be obtained, with aircraft far from the instrument, so the ambient absorption signature of the gaseous pollutant of interest may be identified. The identification procedure is necessarily sophisticated, with the algorithm taking account

Page 15 www.omega.mmu.ac.uk
of Fraunhofer lines in the incident solar spectrum and their atmospherically-induced broadening, and of changes in baseline trend as a result of a variable cloud cover. When exhausts from an aircraft pass into the field of view and the signature becomes more prominent, an excess path-integrated concentration may thus be derived. The scaling of signature with concentration follows from absorption cross-sections in the literature, as verified during the construction to within 10% using a calibration gas cell containing N2 and NO2.
3. Experiment 3.1. Cranfield Airport Three short trials investigating the emissions from a BAe146 operating under the direction of experimenters took place over the course of one year at Cranfield Airport. There is one runway operational there, 1.8 km long and aligned along 31°-211°. Trials were spread over the year, in September 2008 and January and June 2009, so as to investigate the influence of differing atmospheric conditions and trace composition. A total of eight aircraft sorties took place, with an additional takeoff also being studied on an opportune basis. Some sorties were conducted in the middle of the day, in expectation of a maximum light intensity for the passive spectroscopy. There was a minimum delay between sorties in the September and June trials: the statistical variability resulting from aircraft-forced and ambient turbulence and any associated compositional inhomogeneities could thus be assessed. In the January trial, sorties also took place shortly after dawn and before darkness. The aim here was to rectify a deficit of data on the dispersion of exhausts in the presence of a stable surface stratification (albeit with no contribution then from the passive spectroscopy). Emissions associated with the early-morning peak in daily air-traffic movements at civil airports disperse in such circumstances in midwinter. The 146 was fuelled to its maximum landing weight prior to sorties, so the aircraft could employ a high thrust for takeoff without developing an acceleration or lift atypical of civil transports in the early phase of takeoff. In the first and final trials, a sortie took place in which engines were run statically at above-idle thrust for some 30 s before the ground run commenced, so instruments could record a strong and sustained signal and their outputs thus be best calibrated to source condition. A sortie also took place in the first trial in which the aircraft executed a missed approach, descending to within about 15 m above the runway before engines were powered up to takeoff levels and a second ascent was begun, with turning, circling and landing thereafter as normal. The aim here was to study the evolution and arrival at the ground of exhausts from an airborne aircraft, the brief boost in concentrations maximising the chance of their detection. On some sorties in the trials, the aircraft idled for several minutes immediately prior to departure, as often happens when airports are busy. A sortie in the January trial ended with the aircraft applying maximum brake after touchdown, with an associated

Page 16 www.omega.mmu.ac.uk
maximum generation of tyre smoke. (Note that the aircraft does not have reverse thrust.) All departures took place from the northern end of the runway and into the wind. Winds were light or moderate, and the runway dry. Light aircraft queuing to use the runway after the 146 were usually kept back beside the main cluster of Airport buildings, well away from the end of the runway, to prevent them obstructing fields of view (a problem coming to light in the first trial), and so their exhausts could not significantly contaminate measurements during the sortie. Care was taken when setting up instruments so as to minimise the number of generators run, and to site instruments so sampling volumes as far as possible lay outside of generator exhaust streams. The main group of instruments was located near a VDF hut, with power, shelter, lighting and storage space thus being available. The hut lay about 160 m from the runway centreline (to 301°) and 85 m along the runway from its north-eastern end. A swept UV backscatter Lidar was used to study the scattering from aerosol within vertical sections through the exhausts of the 146 (see Section 2). The preferred location for the vehicle was a field set back from the hut a further 50 m laterally from the runway, ensuring that the observation plane intersected the runway axis in the optically fully-formed far field. The beam was swept vertically upward from within 1° of the horizontal along a number of azimuths, with an alternate cycling between two azimuths sometimes employed. Care was taken to ensure sections were obtained through the same portion of the plume as was under study with the imaging spectrometer. The latter was also deployed near the hut, obtaining excess path-integrated levels of NO2 and HONO (or nitrous acid vapour) side-on to the runway. Two other passive spectrometers with fixed fields of view and single-element detectors (λ=280-430 nm) were deployed on occasion. These similarly measured excess concentrations of NO2 and HONO along lines of sight inclined obliquely upward, at about 10°, their preferred position being beyond the end of the runway so as to look azimuthally straight down or perpendicularly across it. They predated the study, having been designed with other purposes in mind, so they took an order of magnitude longer to make measurements at the same accuracy as the imaging spectrometer. A third type of spectroscopic instrument, in this case performing active Fourier transform of the infrared (FTIR), was deployed by the University of Reading. It measured excess exhaust concentrations of CO and CO2 (and, less quantitatively, unburnt hydrocarbons), as integrated over a horizontal path between a glow-bar source on a tripod and a liquid-nitrogen-cooled receiver, with deployment so as to transect the runway being favoured. Rapid measurements on exhausts were also obtained in-situ, using aspirated sampling lines. Measurements of NO and NO2 were obtained opportunely by Dr J. Lee, University of York, in the first trial, and of NO, NO2 and O3 by the University of Cambridge in the second. In the latter case, chemi-luminescence sensors with saturation concentrations of about 1 ppm were used. Measurements on fine aerosol were also obtained, with the University of Reading using a condensation particle counter in the first two trials to

Page 17 www.omega.mmu.ac.uk
measure the total number of particulates of scale 10-850 nm. In the third trial, a scanning mobility particle sizer was used to obtain the distribution over this range, though on much longer repetition times. Opportunistic measurements were made with an optical particle counter in the second trial by Dr D. Peters, University of Oxford, and in the third, by Manchester Metropolitan University. A set of 4 standalone commercial CO2 sensors was acquired during the study by the University of Cambridge (saturation level 2000 ppm), and deployed alongside the runway. The aim here was to compare time series so as to shed light on the advance and dilution of exhausts, with absolute dilutions being calculable as the rate of fuel burn in engines was known (as described shortly), and with the CO2 emission following immediately from this. By locating one of the sensors beside a NOx sensor, moreover, NOx emission factors could be deduced for comparison with ICAO values without any assumption as to dilution and entrainment rates. A large body of supporting data on the aircraft was obtained in the trials. Aircraft weight and flap angles during departure and arrival were recorded. Data were obtained from an onboard flight recorder, with interest focusing on the fuel-burn rate, engine fan speed and exhaust-gas temperature; and from a high-resolution navigation unit, an air-speed indicator, inclinometers and an accelerometer. Footage from cameras pointing downward, both forward and backward, was obtained. Footage of the aircraft was also shot from the control-tower balcony, and of the hot exhausts at engine exits, using an infrared camera (λ=6-14 μm), from the VDF hut. Supporting data were obtained on ambient atmospheric conditions and trace composition. Instruments on the aircraft yielded ambient profiles over the lower boundary layer of wind, turbulence intensities, air temperature and dew point, and concentrations of NO, NO2, O3 and CO. On the ground, an eye-safe Doppler IR Lidar (λ=1.5 μm) yielded profiles of radial wind and turbulence intensity, and a met station on the Lidar vehicle measured surface wind, temperature, humidity and short-wave insolation. 3.2. Manchester Airport There was a need to conduct complementary fieldwork so as to obtain measurements over a range of aircraft representative of the UK civil fleet. A study of aircraft at British Airways’ maintenance noise pen at Heathrow Airport was pursued, but proved impractical, and a two-day deployment at Manchester Airport in September 2008 was arranged instead. The backscatter Lidar and passive spectrometers were deployed landside of the Airport fence. Supporting data from instruments onboard aircraft were not available. The Airport has two runways 3 km long and aligned along 51°-231°. Terminals lie to the north of runway 1, runway 2 to its south and west, the offset being 400 m along 141° and 1.7 km along 231°. Departures take place from runway 1 between 12:00 and

Page 18 www.omega.mmu.ac.uk
15:00 local time, otherwise from runway 2. Lidar and spectrometers were deployed on a public bridleway alongside runway 2 on its southern side, on a slight embankment 130 m from the runway centreline and beside its north-eastern end. Lines of sight thus comfortably cleared the Airport fence. Winds were light and blew from the bridleway to runways, so aircraft exhausts could not be sampled with in-situ sensors. Some partial study of aircraft was made on the afternoon of the first day, in which conditions were dull and the wind direction such that aircraft on runways headed toward 51°. The second day was fine, with little in the way of cloud, and with aircraft on runways headed toward 231°. As at Cranfield, the Lidar beam was swept upward from a low starting elevation, in this case a declination of about 1°, with a number of azimuthal angles being employed. Aircraft departing runway 1 were studied close to the time when they were rotated upward in advance of liftoff. On the second day, aircraft departing runway 2 were also studied at the beginning of their ground run. The imaging spectrometer was additionally deployed on the second day, along with one its predecessors. Both now studied fixed fields of view at a mean elevation of about 10°, sometimes oriented to view the same part of the runway as the Lidar. Supporting footage of aircraft and their identifying call signs was shot onsite. Airframe and power-plant type together with the location of aircraft and - from engine sound - the time of power-up for takeoff could thus all be ascertained. A log of aircraft movements was also made available by the Airport. A technical fault unfortunately prevented data from the Lidar’s met station from being recorded. The failing is compounded by a lack of alternative reliable data on local conditions, with previous investigations having shown the Airport’s own met station to be severely compromised as a result of a sheltered positioning, and by recent closure of a Met Office site at the Airport.

Page 19 www.omega.mmu.ac.uk
4. Core data output Measurements on the evolution of aircraft exhausts were made over the course of three short trials involving a BAe146 at Cranfield Airport. Nine sorties of the aircraft were studied, two in the first trial, three in the second and four in the third. A short trial studying a range of aircraft also took place at Manchester Airport. At Cranfield, a backscatter Lidar was deployed with a beam of radial resolution ~ 5 m and a spreading angle ~ 1 mrad, as swept upward at about 10° s−1 to yield images of the scattering from exhaust aerosol every 4-5 s. A high-performance passive spectrometer with an arrayed detector and a resolution in the elevation of 0.1 mrad was also used, such that an excess path-integrated concentration of NO2 of 1 ppm m could be resolved in 1 s. The field of view was swept azimuthally so as to obtain images in the form of spatial plots. A second passive spectrometer was deployed in the second trial, with a fixed 8 mrad field of view, and a resolution of about 5 ppm m NO2 in 10 s. Two spectrometers of the latter type were deployed in the third trial. Path-integrated concentrations of CO and CO2 were measured with an active spectroscopic system over intervals of up to 1 min, with excess levels resulting from aircraft exhausts being identifiable in the second and third trials. Exhaust temperatures were examined in the second trial with a thermal-imaging camera, with a temperature resolution of 0.5°C and a 1 s image-repetition time. Supporting in-situ measurements on exhausts were made, with concentrations of NO and NO2 being recorded every 1 s in the first trial, and concentrations of NO, NO2 and O3 every 4 s in the second. Number densities of particulates smaller than 1 μm were recorded every 1 s in the first two trials, with size distributions being obtained over 64 logarithmic bins every 5 mins in the third. Concentrations of CO2 were recorded every 1 s in the first two trials. The CO2 sensors were commercial models that sadly proved inadequately aspirated, and the evolution of exhaust concentrations could not be resolved. (Instruments have subsequently been modified in an attempt to remedy this.) Measurements were made at Manchester Airport over the course of two days. The backscatter Lidar yielded measurements on upwards of 70 takeoffs, with some of these also studied with the passive spectrometers on the second day.

Page 20 www.omega.mmu.ac.uk
5. Observations The focus here is on bringing together measurements from the various instruments to illustrate what they reveal on the evolution of exhausts from aircraft. The BAe146 based at Cranfield Airport has a wingspan of 26 m and maximum takeoff and landing weights of 42 tonnes and 37 tonnes, respectively. It has four wing-mounted Avco-Lycoming ALF502R-3 power plant, axes about 4 m and 7 m from the vertical plane of symmetry and 2.4 m from ground at the stand. They have a combined top fuel burn and static thrust of 1.5 kg s−1 and 120 kN, respectively, and an idle fuel burn and thrust of about 12% and 8% of top values, respectively. ICAO’s engine-emissions databank shows 11.2 g NOx and 0.4 g CO to be emitted per kg of fuel burnt at top thrust, and 3.3 g NOx and 44.7 g CO per kg burnt at idle. (NOx values are those holding on conversion of all NO to NO2.) A departure of the aircraft under the direction of experimenters took place on the morning of 25th September 2007, from the north-eastern end of the runway. Mean wind in the vicinity of the runway was 4.3 ± 0.4 m s−1 at 10 m from 272° ± 12°, or from 61° right of aircraft heading during takeoff and landing. Conditions were overcast and thermally neutral (shortwave insolation was 100 W m−2). Air temperature at 10 m was 13°C and relative humidity, 71%. Ambient surface concentrations of NO, NO2 and O3 were about 2 ppb, 4 ppb and 23 ppb, respectively (the onboard CO sensor was unfortunately not working). The aircraft weighed 36.2 tonnes. Prior to takeoff, it idled in position at the runway threshold for upwards of 5 minutes, during which the fuel flow in each engine was 47 g s−1, the fan speed 26% maximum and the exhaust-gas temperature at the turbine exit, 465°C. The aircraft was then powered up for takeoff, with the fuel flow in each engine reaching 390 g s−1, the fan speed, 95% maximum, and the exhaust-gas temperature, 829°C. The aircraft was kept stationary for a little over half a minute and then commenced its ground run, with an acceleration reaching 3.3 m s−2, and becoming airborne half a minute later. Exhausts were imaged with the backscatter Lidar and passive spectrometer. Instruments were sited right of aircraft heading on takeoff, the wind thus acting so as to blow exhausts on the runway away from instruments. The Lidar beam was swept upwards through planes of alternating azimuth behind the aircraft. Exhausts could be observed after engines had been powered up for takeoff, as shown in Figs. 1 and 2. The figures demonstrate how exhaust streams may be taken to interact with one another and the ground so as to form a common plume within about a wingspan downstream (this perhaps speeded up through a Coanda effect). Aerosol - and thus by inference emissions in general - tend to be most concentrated at ground level. Trends for exhausts to spread as they age and to drift and become sheared through the action of the component of wind normal to the runway may be discerned, on comparing sections obtained near the source (Fig. 1) with those obtained further downstream (Fig.

Page 21 www.omega.mmu.ac.uk
2), and sections at a given location before and after the aircraft moves off (Figs. 1a-d versus Figs. 1e-f, and Figs. 2a-c versus Figs. 2d-e). The wind was of downstream component 2.1 m s−1 at 10 m. Were exhausts released when power-up for takeoff commenced to have been advected passively, they would have travelled about 8 m downstream of the exit plane at the time of Fig. 1a, and about 19 m downstream at the time of Fig. 2a. Thus they would not have been observed, and it can be seen their transport derives overwhelmingly from their excess (release) momentum. With the aircraft at its static location, therefore, the plume may be taken as aligned approximately in the downstream direction over the area of airfield studied. Allowing for the angles of observation planes to the plume accordingly, the plume may be seen to extend to a height from the ground characteristically about a factor, 0.3, times its width. On the basis of Figs. 1a-d, with the associated exhausts thus supposed no more than 4 s old, plume width and height may be calculated in the absence of wind to be factors of up to 0.9 and 0.2, respectively, times the downstream distance. On the basis of Figs. 2a-c, corresponding factors of up to 0.8 and 0.3, respectively, may be identified. There is little to evidence the dynamical action of exhaust buoyancy in Figs. 1 and 2: exhausts may be supposed too young to have acquired significant vertical momentum. A simple flow that might thus approximate that of the plume arises in the steady neutrally-buoyant emission from an aperture fixed at, and normal to, a flat rigid boundary, bordering a fluid which is uniform and still at its undisturbed limits. Sufficiently far from the aperture, its scales and mass flux become dynamically unimportant (the flow then deriving overwhelmingly from entrained ambient fluid). Any excess pressure at release is similarly unimportant, and a fully-developed turbulence may be anticipated. Sensitivity to the release force, F (equal to 120 kN in the application of interest), may, however, be supposed retained, and the flow is that of a turbulent wall jet. The characteristics of such jets may broadly be inferred from laboratory study, as incorporating a smooth flat boundary (Launder and Rodi, 1983; Law and Herlina, 2002). (Precise match-up is unlikely: lower discharge Reynolds numbers obtaining in the laboratory may be associated with an enhanced drag, as drag must tend to zero as Reynolds number tends to infinity, though the neglect of airfield roughness must at the same time be associated with some under-representation of drag.) The jet is of width characteristically comparable to the downstream distance, x, and the boundary-normal extent is characteristically a factor, 0.1-0.2, times x. These relations are consistent with the Lidar findings. With most of the drag loss arising close to the source, jet velocity may be taken as characteristically about a factor, 2, times (F/ρ)½/x, where ρ is the fluid density (1.2 kg m−3 in the case of air under ISA sea-level conditions). Emissions of age, t, thus characteristically arise at a value of x of about a factor, 2, times (F/ρ)¼t½. Exhausts captured in the images of Figs 1a-d would on this basis be supposed characteristically about 2 s old, and in the images of Figs. 2a-c, about 6 s old, as is consistent with the times of first observation.

Page 22 www.omega.mmu.ac.uk
The passive spectrometer imaged NO2 side-on to the runway. Exhausts could be observed when the aircraft was at the runway threshold, during idling as well as the static burn at full power, as shown in Fig. 3. As the aircraft idles (Figs. 3a-i), path-integrated concentrations show a trend to a mid-downstream maximum, developing from below and increasing with time, despite a simultaneous steadiness of the fuel burn and, statistically, of the wind. By the end of the static burn at full power (Fig. 3n), in contrast, a downstream trend is no longer in evidence. Path-integrated concentrations then fall off sharply above a height of about 14 m, and below this may be ascribed a
characteristic value of, say, 16 1015 molecules cm−2. A steady fixed source forcing a wall jet of characteristic width, 0.8x, vertical extent, 0.2x, and speed, 2(F/ρ)½/x, effects a volume flux a factor, 0.32, times (F/ρ)½x. A conservative pollutant released in the emission at a rate, Qt, should thus arise in the jet at a characteristic concentration a factor, 3.1, times Qt/[(F/ρ)½x]. The concentration as
integrated along a horizontal line of sight at an angle to the jet axis, , follows as a
factor, 2.5/sin , times Qt/(F/ρ)½. The path-integrated concentration should thus be
broadly independent of downstream distance, as consistent with Fig. 3n, and implying little chemical conversion over these distances. At takeoff thrust, NOx may be calculated to exit engines at a collective rate of 17 g s−1 as NO2 equivalent, or, alternatively,
2.2 1023 molecules NOx s−1. The range of downstream distances studied is associated
with azimuthal angles to the runway of 45° ± 12°. A characteristic concentration of NOx
as integrated along a line of sight to the spectrometer of 2.5 1017 molecules cm−2
may thus be calculated to obtain in the static burn at full power. Comparison with the characteristic value of 16 1015 molecules NO2 cm
−2 from Fig. 3n thus implies about
6% of the NOx is in the form of NO2. This is within the range of 1-8% that has been identified in the case of the primary emission from civil aircraft (DfT report, 2006). The pattern evident in images from the spectrometer during the idling period indicates a different interplay of plume-evolution processes and observation frame. With the source momentum flux being an order of magnitude smaller, the wind may play an important role in the dispersion. A particle released in a uniform wind of speed, W, and a particle released into a wall jet as following from a source forcing, F, may be expected to move at the same speed at the same distance from their sources where this distance is a factor, 2, times a length scale, (F/ρ)½/W. In the more complicated case where a wall jet issues into a wind, the jet may thus be taken to be oriented broadly with the wind at a downstream distance several times this length scale. With F=120 kN, ρ=1.2 kg m−3 and W=4 m s−1 from 60° right of aircraft heading, the length scale works out at about 80 m, and so a reorientation of plume with wind over the area of airfield studied may be neglected to first order, as has already been deduced. At an idling thrust of F=9.6 kN, however, the length scale works out at about 20 m, and a reorientation over the study area is to be expected. Thus, along lines of sight to the spectrometer that pass over the extrapolated runway centreline some 50 m from engines, the plume may lie close to the wind direction. Such lines of sight will track obliquely through the plume, through emissions of a broad range of ages, while lines of

Page 23 www.omega.mmu.ac.uk
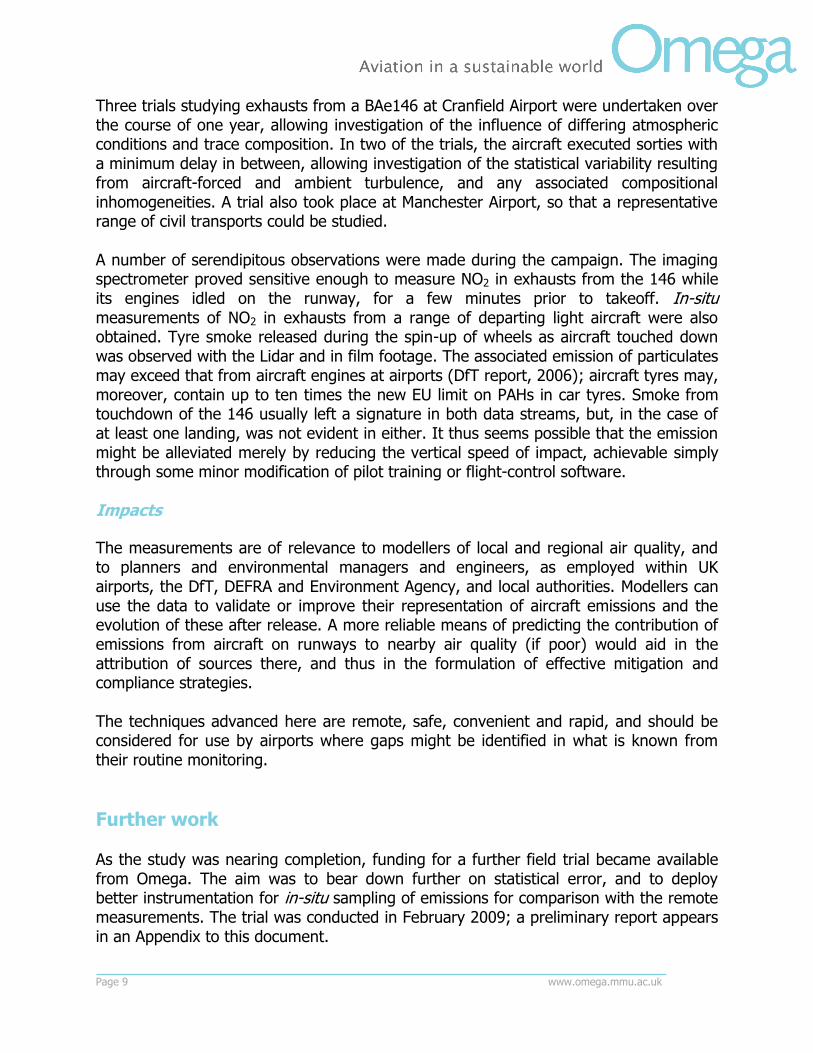
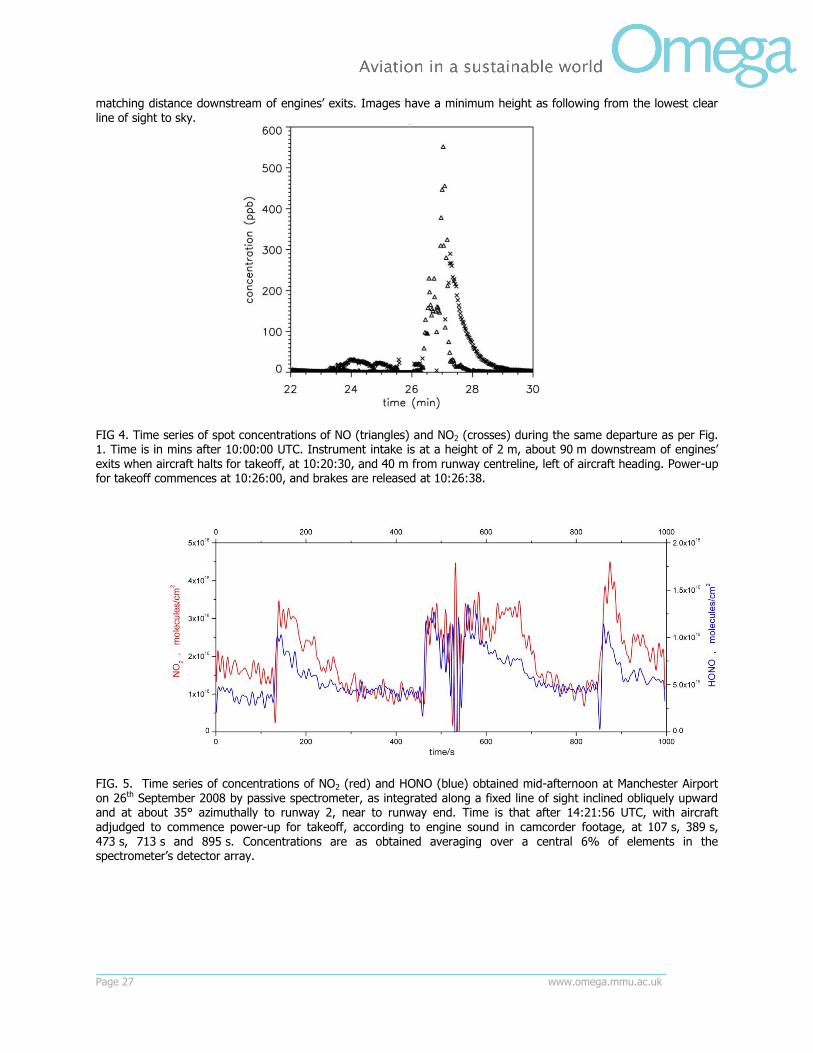
sight that pass the extrapolated centreline at still greater distances from engines may lie out of the plume altogether. A horizontal maximum in path-integrated concentrations is then to be expected, as will increase slowly over time as the plume drifts out toward the horizon, and as will decrease slowly over time once takeoff thrust is realised. Spot measurements of NO and NO2 obtained during the same departure are shown in Fig. 4. There is some rise of NO2 levels during idling, with concentrations of both gases rising sharply upward from midway through the static burn at takeoff power. The sensor was situated such that, according to the Lidar observations, it was at the edge of the plume during the static burn. Levels peak after the aircraft has moved off, presumably as, with the plume being wider and having drifted off the runway centreline, the sensor then occupies a more central location within it. The decline thereafter is more marked in the case of NO than NO2, pointing to some secondary conversion of former to latter. Preliminary measurements obtained using the IDOAS at Manchester Airport are shown in Fig. 5 (the field of view was fixed at Manchester; space-versus-time images have yet to be worked up). Sharp peaks in path-integrated NO2 concentrations are seen, at a mean frequency comparable to that at which aircraft takeoff, but without a clear correlation with times of power-up for takeoff. This illustrates the complexity that may attend the interpretation of such measurements at a busy regional airport. Lidar measurements on smoke released from the tyres of the BAe146 at Cranfield on touchdown are shown in Fig 6. A drift of the smoke off the runway in the wind, which was from right of aircraft heading, would account for the smoke first being observed about 400 m from the Lidar, rather than where the observation plane intersects the runway centreline, at 245 m. The smoke extends to much greater heights than would be expected from a growth in ambient shear-forced turbulence, as occurs in neutral conditions at a vertical speed characteristically equal to a factor, 0.4 (von Kármán’s constant), times the friction velocity (see Webb, 1982; Högström, 1988). Assuming a characteristic airfield roughness of 5 cm, the friction velocity may be estimated at 32 cm s−1, and it follows that, in the 38 s between touchdown and first observation of smoke in the Lidar beam, ambient turbulence would force an upward growth of about 5 m. There are indications in the figure of an off-ground maximum in the scattering, suggesting some dynamical action of the heat generated on touchdown (as gives rise to the smoke). As the scattering extends from the ground to a height comparable to the wingspan (26 m), however, the smoke may also have been subject to the action of a trailing vortex, rolling up on the side of the aircraft on which touchdown occurred. At the time of touchdown, lift remains essentially equal and opposite to aircraft weight, with the nose wheel still to be brought down and ground spoilers to be deployed (spin-up of the wheels on the main gear is indeed what generally arms or activates these spoilers on transport aircraft).

Page 24 www.omega.mmu.ac.uk
(a) (b) (c)
(d) (e) (f)
FIG. 1. Time series of Lidar images from Cranfield Airport of exhausts from a departing BAe146, beam as swept upward in a plane at 65° to the runway, and a) intersecting the extrapolated runway centreline 50 m downstream of engines’ exits, 4 s after aircraft commences power-up for a 38 s static burn, b) 14 s after aircraft commences power-up, c) 24 s after, d) 34 s (with a faulty triggering of the laser preventing observations at the first and lowest elevations), e) 6 s after brakes are released, f) 16 s after release. Radial beam ranges are established from the return time of the pulse and speed of light (0.03% slower in air than in vacuo). Range along ordinate is height above the effective beam origin (at the roof of the Lidar vehicle, 3 m from ground), this being the level of the dashed line. Range along abscissa is horizontal distance from the Lidar (cropped so as to focus on the scattering of interest). Colour bars calibrate fractional enhancements in backscattering over ambient levels, the latter as deduced on allowing for geometric spreading and extinction due to absorption and scattering. (A fitting procedure treats the medium as uniform along the beam, with the e-folding length of extinction being treated as a free variable.) Bar for (c) onwards is as per (b). Observation plane intersects extrapolated centreline 250 m from Lidar.

Page 25 www.omega.mmu.ac.uk
(a) (b) (c)
(d) (e)
FIG 2. Time series of Lidar images of the same departure as per Fig. 1, beam as swept upward in a plane at 55° to the runway, and a) intersecting the extrapolated runway centreline 95 m downstream of engines’ exits, 9 s after aircraft commences power-up for the static burn (with a faulty triggering of the laser as per Fig. 1d), b) 19 s after aircraft commences power-up, c) 29 s after, d) 1 s after brakes are released, e) 11 s after release. Observation plane
intersects extrapolated centreline 275 m from Lidar.

Page 26 www.omega.mmu.ac.uk
FIG. 3. Time series from a swept passive spectrometer of the same departure as per Fig. 1, showing path-integrated levels of NO2 in molecules cm−2 1015 (1 ppm m=2.53 contour units), a) toward aircraft over a 10 s period from
154 s after aircraft halts for takeoff, b) 14 s period 176 s after halt, c) 13 s period 200 s after, d) 10 s period 228 s after, e) 8 s period 248 s after, f) 6 s period 264 s after, g) 11 s period 280 s after, h) 9 s period 299 s after, i) 10 s period 317 s after; j) away from aircraft over an 8 s period from 327 s after halt and ending 5 s after aircraft commences power-up for takeoff, k) toward aircraft over 7 s period from 5 s after aircraft commences power-up, l) away from aircraft over 7 s period 12 s after, m) toward aircraft over 6 s period 19 s after, n) away from aircraft over 7 s period 25 s after. Ordinate shows height of lines of sight over the extrapolated runway centreline, abscissa the
Page 27 www.omega.mmu.ac.uk
matching distance downstream of engines’ exits. Images have a minimum height as following from the lowest clear line of sight to sky.
FIG 4. Time series of spot concentrations of NO (triangles) and NO2 (crosses) during the same departure as per Fig. 1. Time is in mins after 10:00:00 UTC. Instrument intake is at a height of 2 m, about 90 m downstream of engines’ exits when aircraft halts for takeoff, at 10:20:30, and 40 m from runway centreline, left of aircraft heading. Power-up for takeoff commences at 10:26:00, and brakes are released at 10:26:38.
FIG. 5. Time series of concentrations of NO2 (red) and HONO (blue) obtained mid-afternoon at Manchester Airport on 26th September 2008 by passive spectrometer, as integrated along a fixed line of sight inclined obliquely upward and at about 35° azimuthally to runway 2, near to runway end. Time is that after 14:21:56 UTC, with aircraft adjudged to commence power-up for takeoff, according to engine sound in camcorder footage, at 107 s, 389 s, 473 s, 713 s and 895 s. Concentrations are as obtained averaging over a central 6% of elements in the spectrometer’s detector array.

Page 28 www.omega.mmu.ac.uk
(a) (b) (c)
Fig. 6. Time series of Lidar images after a landing of the same aircraft as per Fig. 1, beam as swept upward in a plane at 67° to the runway, looking further in the direction of aircraft travel as range increases, and with touchdown occurring about 130 m from the intersection of observation plane and runway centreline, a) 38 s after touchdown, b) 42 s after, c) 45 s. Observation plane intersects centreline 245 m from Lidar. Aircraft touches down at a ground speed of 60 m s−1, about 90 mins after Fig. 1 was obtained.
FIG. 7. Time series of excess path-integrated concentrations of CO (crosses) and CO2 (triangles) obtained by an active spectroscopic system during a sortie of the same aircraft as per Fig.1 on 21st January 2008. Concentrations are percentages above ambient, time is in mins after 10:00 UTC. Beam is horizontal, 122 m long and approximately normal to runway, with an infrared source of diameter 25 cm and centre height 0.8 m being located beside runway, left of aircraft heading during takeoff and landing. Aircraft halts for takeoff at 10:57:38 with engines’ exits then about 110 m from beam, and idles until commencing power-up for takeoff at 11:00:48. It moves off 10 s later under maximum fuel burn with an acceleration reaching 3.3 m s−2 and an exhaust-gas temperature at turbine exit, 778°C. After turning, circling and descending, it touches down at 11:06:03. Mean wind on runway is 2.7 m s−1 at 10 m from 12° left of aircraft heading during takeoff and landing, and thermally neutral (overcast skies). Air temperature at 10 m is 3°C and relative humidity, 85%. Ambient surface concentration of CO at dusk is about 190 ppb.

Page 29 www.omega.mmu.ac.uk
FIG. 8. Time series of particulate size distributions at Cranfield Airport on 18th June 2008 obtained with a scanning mobility particle sizer, z-axis out of paper. Count is number density, in particles cm−3, diameter that of sphere of equivalent volume, in μm. The same aircraft as per Fig. 1 executes 3 sorties during this time. In the first, it halts for takeoff at 12:53:43 BST, commences power-up for takeoff at 12:56:48, moves off 26 s later and touches down at 13:03:13. In the second, it halts for takeoff at 13:55:20, commences power-up for takeoff at 13:58:27, moves off and touches down at 14:04:02. In the third, it halts for takeoff at 15:00:56, commences power-up to a fuel burn of 30% maximum at 15:03:45 and to takeoff power 39 s later, moves off and touches down at 15:09:49. At the halt, instrument is about 90 m downstream of engines’ exits and a similar distance from runway centreline, right of aircraft heading. Intake height is 3 m. Colour stripes are to aid in reading counts. Mean wind on runway is 8-10 m s−1 at 10 m from 10° left of aircraft heading during takeoff and landing, and thermally neutral (overcast skies). Air temperature at 10 m is 14-17°C and relative humidity, 70-80%.

Page 30 www.omega.mmu.ac.uk
Measurements on longer repetition times of concentrations of CO and CO2 as integrated along a runway transect, downstream of the 146 from the start of takeoff, are shown in Fig. 7. Statistically significant peaks are seen. Although the aircraft was far from the transect at the corresponding times, exhausts released during the ground run may still have been passing through the transect in the wind. (It should, however, be borne in mind that shortly after the aircraft landed and a sortie was completed, a queue of light aircraft generally made its way to the runway hold.) Spot measurements of particulates obtained with a scanning mobility particle sizer over the course of an afternoon at Cranfield in which three sorties of the 146 took place are shown in Fig. 8. Other sources such as light aircraft clearly contribute. The relatively large particles observed at around 15:00 may, however, result from the 146.
6. Proposal for future analyses This section describes profitable future lines of research which could be undertaken should the requisite funding be obtained. Once data have been fully worked up, a qualitative, but comprehensive, survey of the dataset could be undertaken. Instances where different time series may be correlated should, in particular, be identified and investigated. A considerable body of Lidar observations has now been amassed, following earlier work at Heathrow and Manchester Airports. Observations have typically been obtained closer to engines in this study, and there is thus the opportunity to derive statistically reliable scales of the young exhaust plume at the start of takeoff, when exhaust buoyancy is dynamically passive. Scales may now be derived in the case of a static source, given the sorties of the 146 at Cranfield in which the aircraft was for a time fully powered but still, as well as in the more representative case of an upstream source acceleration. The role of the acceleration in determining plume scales may thus be investigated. A model of the plume dispersion developed recently by Graham et al (2008) could prove useful in this regard, as it accommodates a source acceleration and the corresponding unsteadiness of plume parameters. It is thus necessarily numerical, but otherwise reductive and straightforward to run. The pooled Lidar data should be sufficient to determine statistics on how emissions released in the early part of the takeoff ground run disperse after the aircraft has been rotated upward and become airborne. Exhausts are then older and more dilute, and consequently harder to observe, but it may nonetheless be in this condition that they pass through air-quality hotspots beside an airfield. At liftoff, the net downstream forcing is half that at the start of the ground run, and the upstream acceleration of the aircraft has fallen by an order of magnitude. More importantly, lift on the airframe and

Page 31 www.omega.mmu.ac.uk
the associated shed circulation cause exhausts to move downwards and, in the vicinity of ground, outwards, so their dynamics will decouple from those of exhausts released earlier, with re-coupling unlikely before the aircraft has turned in its flight path. From the initiation of rotation, therefore, the forcing by the aircraft of exhausts released earlier may effectively cease, these exhausts then dispersing according to their residual downstream momentum and buoyancy. Graham et al show how this scenario may be tackled, and make as-yet-untested predictions. There should also be sufficient data from Heathrow and Manchester to derive reliable statistics on the dispersion of exhausts released from close to the time upward rotation of the aircraft is begun to when the aircraft is at an altitude of half a wingspan. This is a highly complex situation dynamically, in which exhaust momentum and buoyancy and wing lift and drag - in the presence of a strong ground effect - may all be significant. Lidar images of such exhausts point particularly to the action of lift and circulation, with a drawing of exhausts into two plumes either side of the runway being implicated (DfT report, 2006). It is not clear where in the ground run the plume bifurcates, and whether, given a shear of the cross-flow at the ground inevitably accompanying this, a trailing vortex pair endures afterward. Images from the passive spectrometer might usefully be vertically integrated to allow comparison with models in which cross-stream variations are not resolved. Wherever and whenever the plume was also observed by Lidar, mean concentrations as averaged over a plume cross-section should be systematically estimated.
7. Summary and conclusions A measurement campaign at Cranfield and Manchester Airports has yielded an extensive set of simultaneous physical and chemical measurements on the evolution of exhausts from aircraft embarking on takeoff. At Cranfield, a BAe146 moving under the direction of experimenters was studied. A novel passive imaging spectrometer was constructed and deployed so as to establish the concentration of NO2 in exhausts as integrated along skyward lines of sight, according to the signature of the gas in naturally-scattered sunlight. An imaging UV Lidar simultaneously measured the backscattering from exhaust aerosol. Remote and rapid measurements on the concentration and transport of exhaust pollutants were thus obtained, conveniently and safely, and sufficiently far from aircraft as to lie beyond airport security fencing. The Lidar captures the scattering from aerosol throughout sections through exhaust plumes. The images show that, within about a wingspan downstream of an aircraft embarking on takeoff, exhaust streams from engines merge to form a common plume that tends to hug the ground. (The relatively high wing and engine height of the 146 is thus quickly rendered unimportant.) Statistics on the width and vertical extent of the young plume concur with those described for wall jets in the literature. The exhausts

Page 32 www.omega.mmu.ac.uk
may thus be supposed too young to have acquired significant upward momentum from their buoyancy. Older exhausts may also be observed, to upwards of a minute after the 146 moves off, though their weak scattering makes it difficult to obtain reliable statistics on their dispersion. The spectroscopy captures NO2 in exhausts both from idling engines and when takeoff power is realised. HONO is also detectable in significant quantities, as is thought to form in heterogeneous reactions of NO2 with plume aerosol. When the 146 is powered up statically for takeoff, concentrations of NO2 as integrated over a path across the release are observed to tend to equilibrate, over some 30-130 m from engines. A
characteristic trend value of 1.6 1016 molecules NO2 cm−2 may be identified. On
comparison with predictions made on taking exhausts to reside in a wall jet, this is consistent with about 6% of NOx molecules being in the form of NO2. The speciation of NOx in this part of the plume thus appears comparable to that reported in the literature in the case of the primary emission.
The study has demonstrated the utility and practicality of Lidar and spectroscopic methods in observing aircraft emissions at commercial airports. Both techniques yield informative images over a continuum of ranges and angles. A dataset has been obtained which should aid and stimulate the further development of air-quality models for regulatory purposes.
ACKNOWLEDGEMENTS The study could not have taken place without the help and support of management and staff at Cranfield (including the FAAM flight crew and operators) and at Manchester Airport to whom the experimenters are grateful. We are particularly grateful to Mr R. Edwards (Cranfield) and Mr C. Paling (Manchester). The study was funded by the Omega consortium.

Page 33 www.omega.mmu.ac.uk
REFERENCES Department for Transport, 2003. The Future of Air Transport. Department for Transport, 2006. Project for the Sustainable Development of Heathrow:
Report of the Airport Air Quality Technical Panels. Graham, A., Bennett, M. and Christie, S. 2008. Representing the dispersion of emissions
from aircraft on runways. Proc. 12th Int. Conf. on Harmonisation within Atmospheric Dispersion Modelling for Regulatory Purposes, Cavtat, Croatia, Croatian Meteorol. J., 43, 563-568.
Högström, U. 1988. Non-dimensional wind and temperature profiles in the atmospheric
surface layer: A re-evaluation. Boundary Layer Meteorol., 42, 55-78. Launder, B. E. and Rodi, W. 1983. The turbulent wall jet, measurements and modelling.
Ann. Rev. Fluid Mech., 15, 429-459. Law, A. W.-K. and Herlina. 2002. An experimental study on turbulent circular wall jets.
J. Hydraul. Eng., 128, 161-174. Webb, E. K. 1982. Profile relationships in the superadiabatic surface layer. Q. J. R.
Meteorol. Soc., 108, 661-688. Wilson, C. W., Petzold, A., Nyeki, S., Schumann, U. and Zellner, R. 2004. Measurement
and prediction of emissions of aerosols and gaseous processes from gas turbine engines (PartEmis): an overview. Aerosp. Sci. Technol., 8, 131-143.