AERO2K Global Aviation Emissions Inventories for 2002 and 2025.
29
AERO2K Global Aviation Emissions Inventories for 2002 and 2025.
-
Upload
rose-shepherd -
Category
Documents
-
view
256 -
download
2
Transcript of AERO2K Global Aviation Emissions Inventories for 2002 and 2025.

AERO2K Global Aviation Emissions Inventories for
2002 and 2025.

University of Cambridge
Not involved in the AERO2K project.
User of the AERO2K 2002 data for the LEEA project
(Airbus/Dti/U.Cam/U.Read).

AERO2K website
At Manchester Metropolitan University:
www.cate.mmu.ac.uk/aero2k.asp

AERO2K website

AERO2K report:
http://www.cate.mmu.ac.uk/reports_aero2k.asp

AERO2K data:
http://www.cate.mmu.ac.uk/data_aero2k.asp

AERO2K data:
2002 Gridded Data
Civil aviation monthly emissions+ 6 hourly emissions
Military annual emissions
2025 Gridded Data
Civil aviation monthly emissions+ 6 hourly emissions
No separate forecast is made for military aviation. When a figure for total aviation emissions is required, gridded military emissions data for 2002 should be used.
1º x 1º x 500ft

AERO2K 2002:
2002 Gridded Data
Civil aviation: radar tracked flight data from North America and Europe showing actual latitude-longitude-altitude along the flight pass. Routing information is used to place timetable flight from the rest of the world onto a global grid. Using 40 representative aircraft, fuel used for each flight is calculated using performance data from the PIANO aircraft performance tool. Calculation emissions from all the flight are then allocated on the global 3D grid cell representing the latitude longitude and altitude of the flight segment.

AERO2K file:
Different format for the military data.

AERO2K quantities:
ANCAT2
1992
NASA
1992
TRADEOFF
2000
NASA
1999
AERO2K
2002
114.3 113.7 152. 128.156.5
Tg Fuel
1.6 1.44 1.95 1.692.06
Tg NOx
Civil fleet / year

AERO2K quantities:Distance
Flown
(103 million n.miles)
Fuel
Used
(Tg)
CO2
(Tg)
H2O
(Tg)
NOx
(Tg)
HC
(Tg)
Soot
(Tg)
Part.
(number)
CO
(Tg)
CIVIL 17.9 156 492 193 2.06 .063 .0039 4.03E25 .507
MILIT. NA 19.5 61.0 24.1 .178 .066 NA NA .647
CIVIL
202536.1 327 1029 404 3.3 .144 .0087 8.54 1.15

MILITARY zonal mean:
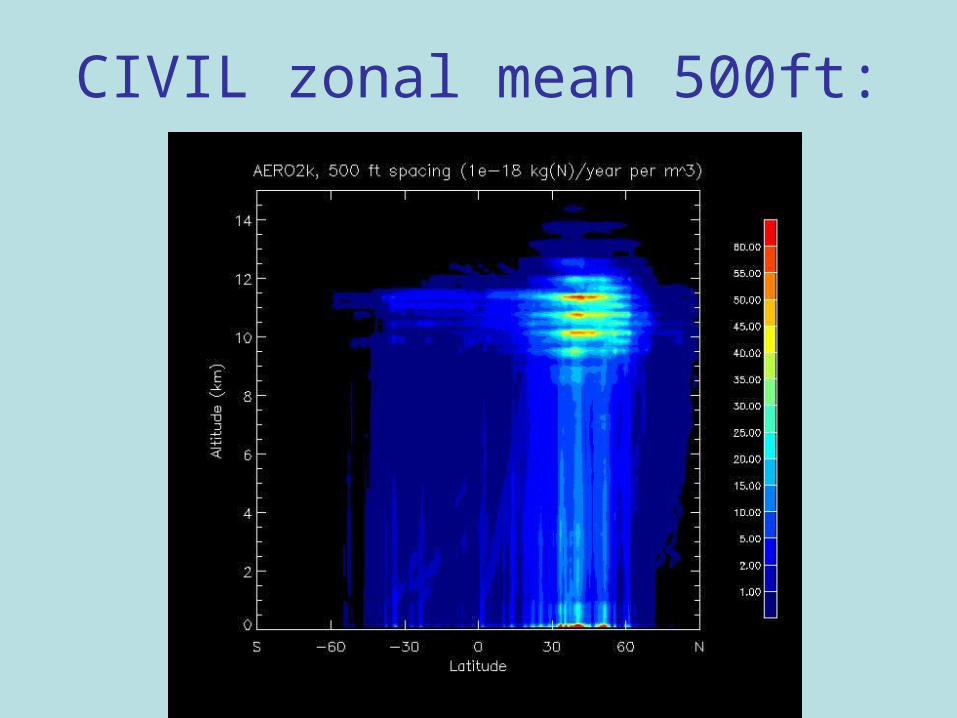
CIVIL zonal mean 500ft:

CIVIL 500ft:

CIVIL 500ft:

AERO2K data:Altitude effects for Civil Aviation
The gridded data are presented at 500ft intervals (eg 30000ft represents all flights between 29500 and 30500ft) in a grid of resolution of 1deg longitude by 1deg latitude. Data are presented at 500ft intervals to retain data granularity commensurate with real flight activity. Although the data are given at a vertical resolution of 500 feet, these data need to be treated with care. The majority of the flight data provides altitude information to 3 significant figures (eg FL302 representing 30200ft). As air traffic convention provides for vertical separation by constraining actual cruise flight close to the round thousands of feet altitude, much of the cruise data are of the form of round thousands of feet eg “FL300” representing 30000ft. With a grid vertical resolution of 500ft this results, for example, around 30000ft, with a large emissions value falling into the 30000ft to 30499ft cell with very few in the 29500ft to 29999ft cell.
In some senses, this is a real effect, with emissions concentrated in horizontal bands 1000ft apart. These bands are “blurred” by the effects of slight variations from the target flight altitude, by errors and uncertainties in radar information and even in the position of the engines on the aircraft. However, to which of the cells (for example just above or just below 30000ft) the emissions should be allocated is somewhat arbitrary.

AERO2K data:
It is therefore recommended that for most purposes associated with climate impact assessment, the gridded data are initially combined to 1000ft cells, ideally starting with a 500ft cell at ground level with subsequent cells from 500 to 15500ft, 1500 to 2500ft and so on.
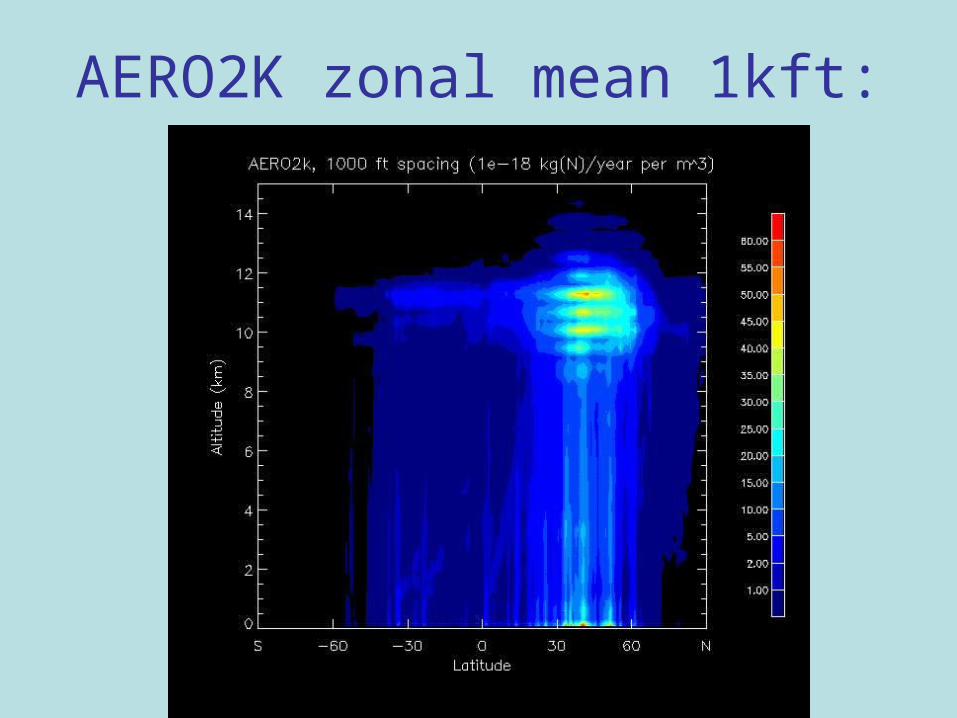
AERO2K zonal mean 1kft:
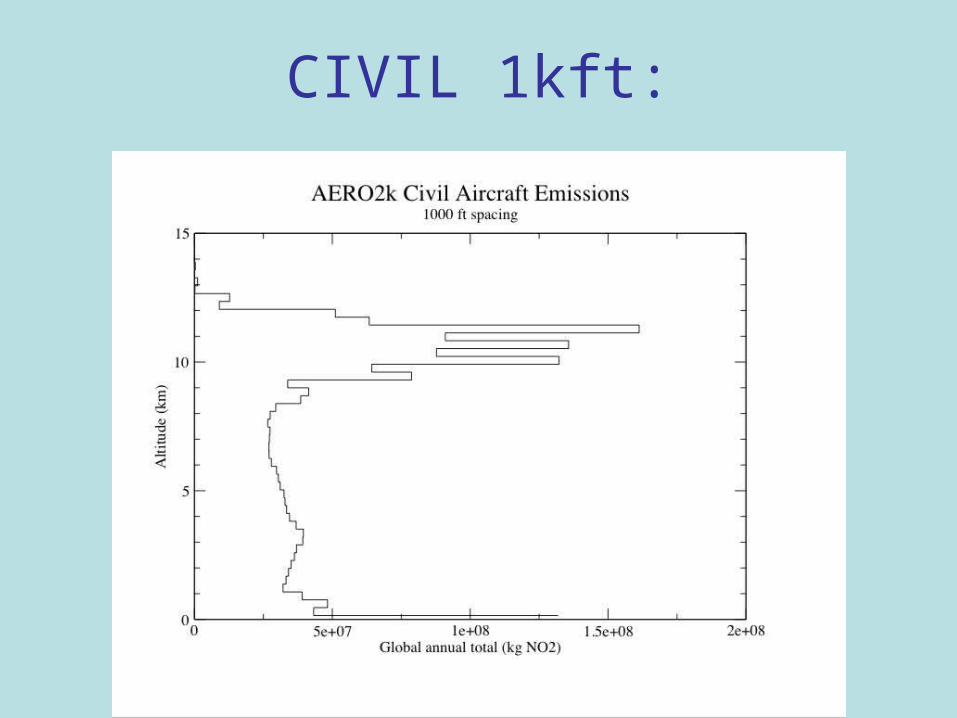
CIVIL 1kft:
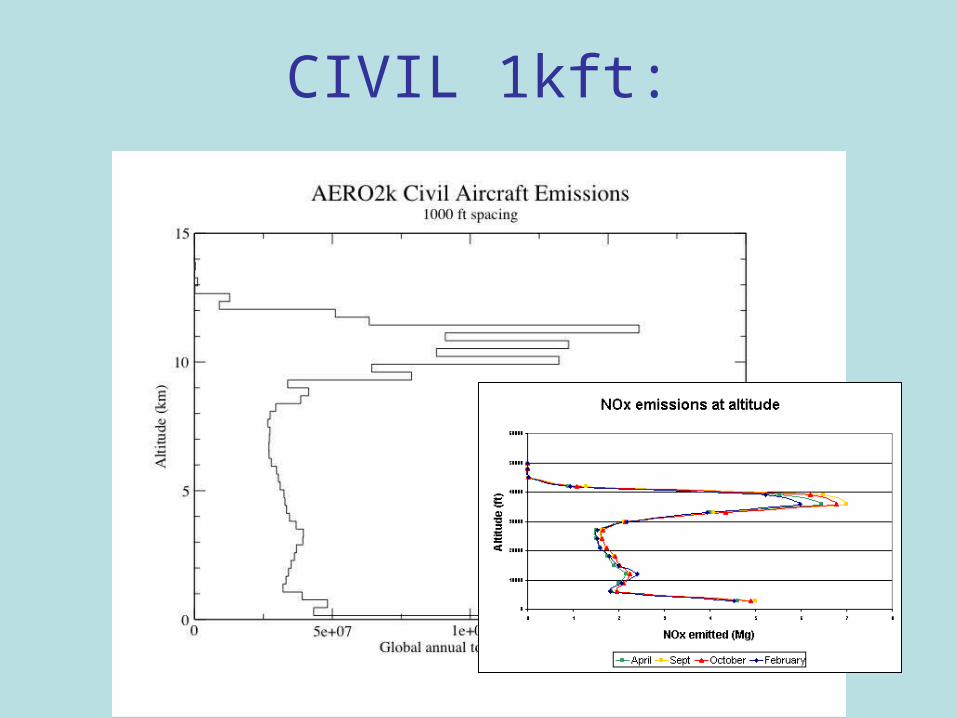
CIVIL 1kft:

Flight level:
The goal of RVSM is to reduce the vertical separation above flight level (FL) 290 from the current 2000-ft minimum to 1000-ft minimum. This will allow aircraft to safely fly more optimum profiles, gain fuel savings and increase airspace capacity.

USA versus EU:
0 20000 40000
290
310
330
350
370
390
410 N Sea
0 20000 40000
290300310320330340350360370380390400410
Flig
ht
Lev
el
NOx emitted
S Dakota

AERO2K in TOMCAT:

AERO2K in TOMCAT:

AERO2K at UCAM:
2002: civil+militarymonthly meanonly NOx and water vapour extractedT42 or T21 grid / 1000ft

AERO2K at UCAM:
2002: civil+militarymonthly meanonly NOx and water vapour extractedT42 or T21 grid / 1000ft
2002: civil+militarymonthly mean? species? grid (1ºx1ºx1000ft)? Format
And 2025?

Aircraft Impact.
TOMCAT
SLIMCAT
Ozone change:

Aircraft Impact.
TOMCAT
SLIMCATOzone change
Profile at 65 North: