Feasibility of fiber optic sensors in sensing high ...
160
Feasibility of fiber optic sensors in sensing high refractive index for the potential application of acquiring solubility and diffusivity of gases and supercritical fluids in polymers by Keonhag Lee Bachelor of Engineering, University of Victoria, 2014 A Thesis Submitted in Partial Fulfillment of the Requirements for the Degree of MASTER OF APPLIED SCIENCE in the Department of Mechanical Engineering Keonhag Lee, 2016 University of Victoria All rights reserved. This thesis may not be reproduced in whole or in part, by photocopy or other means, without the permission of the author.
Transcript of Feasibility of fiber optic sensors in sensing high ...

Feasibility of fiber optic sensors in sensing high refractive index for the potential
application of acquiring solubility and diffusivity of gases and supercritical fluids in
polymers
by
Keonhag Lee
Bachelor of Engineering, University of Victoria, 2014
A Thesis Submitted in Partial Fulfillment
of the Requirements for the Degree of
MASTER OF APPLIED SCIENCE
in the Department of Mechanical Engineering
Keonhag Lee, 2016
University of Victoria
All rights reserved. This thesis may not be reproduced in whole or in part, by photocopy
or other means, without the permission of the author.

ii
Supervisory Committee
Feasibility of fiber optic sensors in sensing high refractive index for the potential
application of acquiring solubility and diffusivity of gases and supercritical fluids in
polymers
by
Keonhag Lee
BEng, University of Victoria, 2014
Supervisory Committee
Dr. Martin Byung-Guk Jun, Department of Mechanical Engineering Supervisor
Dr. Patrick Changdong Lee, Department of Engineering and Mathematical Sciences Co-Supervisor
Dr. Peter Wild Departmental Member

iii
Abstract
Supervisory Committee
Dr. Martin Byung-Guk Jun, Department of Mechanical Engineering Supervisor
Dr. Patrick Changdong Lee, Department of Engineering and Mathematical Sciences Co-Supervisor or Departmental Member
Dr. Peter Wild Departmental Member
Many properties of polymers can be affected by dissolving gases and supercritical
fluids at high temperatures and pressures. Solubility and diffusivity are crucial parameters
in polymer processing applications that indicates the content of gases and supercritical
fluids in a polymer. Hence, different devices for measuring solubility and diffusivity have
been researched, but most of the devices used today are very complex, expensive, and
requires long experiment time. In this final thesis, the feasibility of fiber optic sensors as
measurement devices for solubility and diffusivity of gas/SCF in polymers have been
investigated. Many of the polymers used in polymer processing have high refractive
index, from 1.40 to 1.60. However, most of the refractive index sensors based on fiber
optics only operate in refractive index ranges of 1 to 1.44 because once the surrounding
refractive index becomes greater than that of cladding, the total internal reflection is lost
and only small portion of the light propagation occurs. This final thesis first reviews the
current methods to measure solubility and diffusivity of gases and supercritical fluids in
polymers. In addition, different types of fiber optics sensors used for sensing the
refractive index are reviewed. Then, the thesis presents cost efficient, but effective fiber
optic refractive index sensors, which are the silver nanoparticle coated LPG sensor,
uncoated PCF MZI sensor, silver nanoparticle PCF MZI sensor, and the transmission
intensity based gap sensor, to sense the surrounding refractive index in the region greater

iv
than the cladding, for the future application of solubility and diffusivity measurement.
Moreover, future works that would help in sensing solubility and diffusivity of gas in
polymers are also proposed.

v
Table of Contents
Supervisory Committee ...................................................................................................... ii
Abstract .............................................................................................................................. iii
Table of Contents ................................................................................................................ v
List of Tables .................................................................................................................... vii
List of Figures .................................................................................................................. viii
Acknowledgments............................................................................................................. xii
Chapter 1. Introduction ................................................................................................. 1
1.1. Solubility and diffusivity of gas/SCF in a polymer ............................................ 3
1.2. Fiber optics sensors ............................................................................................. 4
1.3. Significance of the problem ................................................................................ 6
1.4. Fiber optic refractive index sensors in refractive index greater than the silica .. 8
1.5. Research scope and outline ................................................................................. 9
Chapter 2. Theoretical background and literature review .......................................... 11
2.1. Methods for measuring solubility of gas/SCF in polymers ................................... 11
2.1.1. Gravimetric methods ....................................................................................... 11
2.1.2. Piezoelectric methods ..................................................................................... 19
2.1.3. Mamometric methods ..................................................................................... 21
2.2. Methods for measuring diffusivity of gas/SCF in polymers .................................. 25
2.2.1. Gravimetric method ........................................................................................ 25
2.2.2. Pressure decay method .................................................................................... 26
2.3. In fiber gratings based refractive index sensors ..................................................... 27
2.3.1. Fiber Bragg grating based refractive index sensors ........................................ 27
2.3.2. Long period grating based refractive index sensors ....................................... 36
2.4. Mach-Zehnder Interferometer as refractive index sensor ...................................... 42
2.5. Intensity based fiber optic sensor as refractive index sensor ................................. 46
2.6. High refractive index sensors ................................................................................. 51
2.7. Conclusion ............................................................................................................. 53
Chapter 3. Long period grating sensor for measuring high surrounding refractive
index solution 55
3.1. Introduction to long period grating sensor ............................................................. 55
3.2. Long period grating sensor in high refractive index .............................................. 58
3.3. Coated Long period grating sensor ........................................................................ 60
3.4. Fabrication of long period grating sensor using the femtosecond laser................. 61
3.5. Silver nano particle deposition using the atomization based coating system ........ 63
3.6. Experiment setup ................................................................................................... 64
3.7. Behavior of silver nanoparticle coated long period grating sensor at high refractive
index .............................................................................................................................. 65
3.8. Conclusion ............................................................................................................. 68
Chapter 4. Coated Mach-Zehnder Interferometer for measuring high surrounding
refractive index solution ................................................................................................... 70
4.1 Mach-Zehnder interferometer sensor ...................................................................... 70
4.2. PCF MZI sensor in high refractive index .............................................................. 76
4.3. Effect of coating on PCF MZI ............................................................................... 80
4.4. Fabrication of MZI refractive index sensors .......................................................... 81
4.5. Experiment setup ................................................................................................... 82

vi
4.6. 40 um MZI at high index ....................................................................................... 83
4.7. PCF MZI at high surrounding refractive index ...................................................... 85
4.8. Effect of PCF length in leaky configuration .......................................................... 88
4.9. Coated PCF MZI at high surrounding refractive index ......................................... 91
4.10. Conclusion ........................................................................................................... 97
Chapter 5. Transmission intensity based gap sensor for measuring high surrounding
refractive index solution ................................................................................................... 98
5.1. Introduction ............................................................................................................ 98
5.2. Fabrication of the gap sensor ............................................................................... 101
5.3. Gap sensor at high surrounding refractive index ................................................. 102
5.4. Gap distance parameterization ............................................................................. 105
5.5. Polymer testing .................................................................................................... 107
5.6. Carbon dioxide desorption in a polycarbonate film ............................................. 112
5.7. Conclusion ........................................................................................................... 115
Chapter 6. Conclusion and future work .................................................................... 116
6.1. Conclusion ........................................................................................................... 116
6.2. Future work .......................................................................................................... 118
Bibliography ................................................................................................................... 121
Appendix A – Theoretical approaches for solubility study ............................................ 135
A.1. Henry’s law ......................................................................................................... 136
A.2. Flory-Huggins Theory (Cell Model) ................................................................... 136
A.3. Sanchez-Lacombe Theory (Lattice Fluid Model) ............................................... 137
A.4. Simha-Somcynsky Theory (Hole Model) ........................................................... 138
A.5. Statistical Association Fluid Theory (SAFT)...................................................... 139
Appendix B – Theoretical approaches for diffusivity study ........................................... 141
B.1. Steady Diffusion .................................................................................................. 141
B.2. Unsteady Diffusion ............................................................................................. 142

vii
List of Tables
Table 1-1 Refractive indices of polymers prevalently used in polymer processing. .......... 7
Table 5-1. Properties of the polymer films ..................................................................... 111

viii
List of Figures
Figure 1-1. Schematic of pressure-temperature phase diagram where the triple and critical
points are shown. The phase regions are labeled in the diagram. ....................................... 4
Figure 1-2. Simulated data of coupling wavelength shift against surrounding refractive
index on a wide range [27] .................................................................................................. 7
Figure 2-1. Schematic of a McBain Balance in superposed thermostats: (A) heating coil,
(B) quartz spring, (C) polymer specimen [42] .................................................................. 14
Figure 2-2. High pressure sorption apparatus with a Cahn model 2000 electronic
microbalance by Kamiya [56]: (A) pressure chamber containing an electronic
microbalance, (B) thermostatically controlled air bath, (C) temperature controller, (D)
thermometer, (E) pressure gauge, (F) safety valve, (G) flow meter, (H) columns of active
charcoal and silica gel, (I) pressure regulator, and (J) a gas cylinder [56] ....................... 16
Figure 2-3. Sorption apparatus with a Sartorius S3D-P electro microbalance by Kamiya
[58]: (A) Sartorius microbalance, (B) constant temperature water bath, (C) auxiliary
furnaces, (D) constant temperature air-bath, (E) pressure chambers, (F) thermocouple,
(G) water inlet, (H) gas inlet, (I) polymer sample plus buoyancy corrective (gold wire),
(J) counter balance (aluminum rod) [58] .......................................................................... 16
Figure 2-4. The schematic of a solubility measurement apparatus with a MSB by Sato
[69]. ................................................................................................................................... 18
Figure 2-5. Schematic of a sorption apparatus with a QCM used by Miura et al. [81]. ... 21
Figure 2-6. Schematic of a sorption apparatus with dual sorption pressure decay used by
Stern [105]: (A) Auxiliary glass system for volume calibrations, (A1) reference volume,
(A2) thermocouple gauge, (A3) mercurial manometer, (B, C, D, E) calibrated volumes of
apparatus, (D) gas reservoir, (E) gas absorption cell with polymer sample, (F) differential
pressure null indicator, (G) null indicator control, (H) dead-weight gauge, (1-7) needle
valves [105] ....................................................................................................................... 24
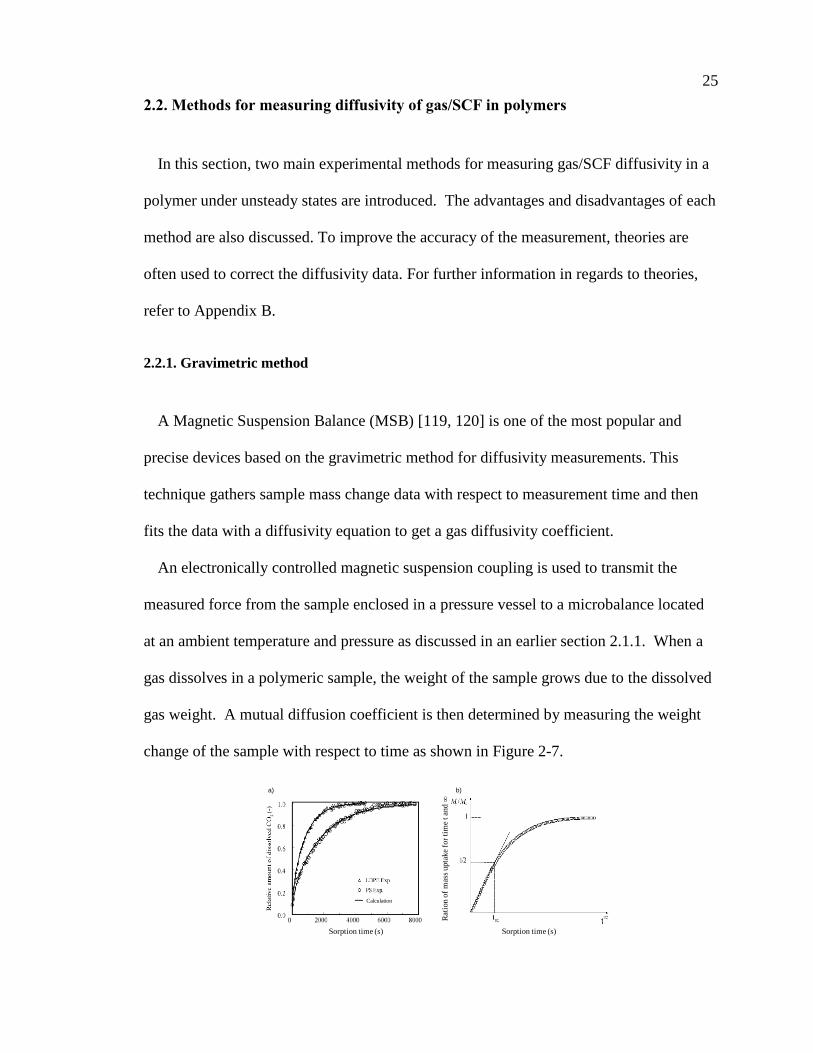
Figure 2-7. (a) CO2 Sorption profiles in LDPE and PS samples obtained by the step
change in pressure from 11 to 12 MPa at 200 °C. The solid fitting lines are calculated by
Fick’s second law [71]; (b) a typical diagram of sorption/desorption experimental
measurements [121] .......................................................................................................... 26
Figure 2-8. Schematic of common pressure-decay apparatus [122] ................................. 26
Figure 2-9. The schematic of a typical Fiber Bragg grating sensor [126] ........................ 28
Figure 2-10. The spectrum of a Fiber Bragg grating sensor in different refractive index
environment [126] ............................................................................................................. 29
Figure 2-11. The principle of fiber bragg described by Hill et al. [135]. The Bragg
resonance for reflection occurs at the wavelength which the grating pitch is one-half of
the modal wavelength of the core. The transmitted wavelength would be resultant of
wavelength subtracted by the Bragg reflection. ................................................................ 30
Figure 2-12. Transmission spectrum using TFBG fabricated by Miao et al. [137] ......... 31
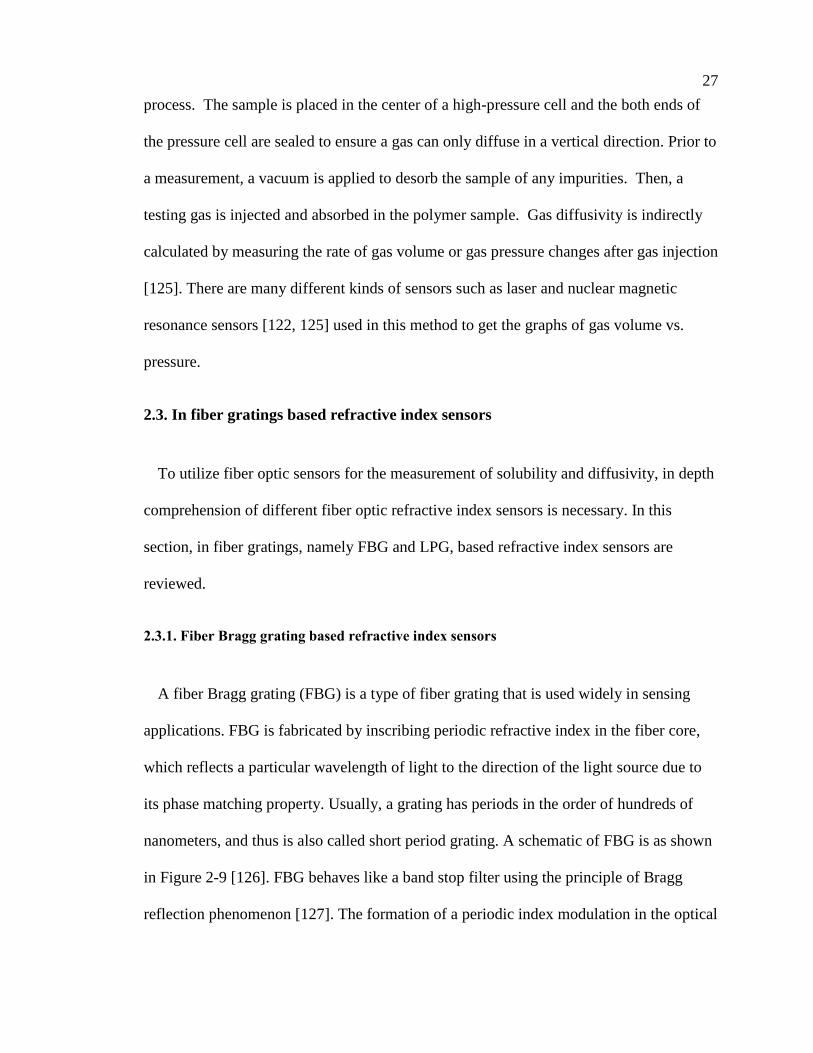
Figure 2-13. The comparison in relative shifts between the thinned FBG sensor and
unperturbed FBG sensor [138].......................................................................................... 32
Figure 2-14. A novel in-fiber structured intensity based tilted fiber Bragg grating sensor
with a lateral offset [140] .................................................................................................. 33

ix
Figure 2-15. An image of (a) six holes and (b) two-ring triangular photosensitive
microstructured optical fibers [141] .................................................................................. 34
Figure 2-16. The resonance shift versus refractive indices for (a) six holes and (b) two-
ring triangular microstructured optical fibers [141]. ......................................................... 34
Figure 2-17. A schematic of a liquid core waveguide based refractometer. The slot for
liquid filling can be seen across the fiber Bragg gratings [142]. ...................................... 35
Figure 2-18. Reflection spectrum diagrams of the proposed liquid core waveguide based
refractometer when the refractive index of the oil is (a) below and (b) above the refractive
index of the optical fiber. The arrows in (b) corresponds to the fundamental mode of the
liquid core waveguide and the inset focuses on these peaks. (c) Wavelength shift and
change of the intensity of the main Bragg peak with respect to RI of the oil. (d)
Experimental and simulated wavelength shift of the liquid core FBGs. (e) Sensitivity of
the device over the low RI and high RI regime [142]. ...................................................... 36
Figure 2-19. The transmission profile of LPG in response to (a) sugar solution (b)
ethylene glycol solution (c) salt solution and (d) all three plotted together [143] ............ 37
Figure 2-20. The wavelength shift in response to the surrounding refractive index [144]38
Figure 2-21. Wavelength shift plotted against the changing of cladding radius by etching
[144] .................................................................................................................................. 39
Figure 2-22. The transmission spectrum of the large mode area LPG PCF in response to
high refractive index [153]. ............................................................................................... 41
Figure 2-23. The transmission spectrum of (a) LPG PCF, (b) single mode LPG, (c)
depicting wavelength shift with respect to surrounding refractive index and (d) depicting
intensity change with respect to the surrounding refractive index. .................................. 41
Figure 2-24. Transmission responses of LPG sensor in refractive range of 1<nSRI<1.7
from two different literature [19, 31] ................................................................................ 42
Figure 2-25. The transmission response of LPG-MZI and tapered LPG-MZI to the
variation of surrounding refractive index and (b) transmission response of taper-MZI to
the variation of surrounding refractive index [154, 155] .................................................. 43
Figure 2-26. A phase shift based high sensitive refractive index in fiber MZI by Q. Rong
and the research group [156]. (a) A schematic of the diameter mismatch MZI and (b)
wavelength shift in response to varying surrounding refractive index. ............................ 45
Figure 2-27. A refractive index sensor using the core offset MZI configuration by Q. Yao
[157]. ................................................................................................................................. 45
Figure 2-28. Change in transmission spectra of PCF MZI with respect to varying
refractive index [158]. ....................................................................................................... 46
Figure 2-29. Intensity based transmission spectrum in MSM configuration [163] .......... 47
Figure 2-30. Change in wavelength shift with respect to surrounding refractive index
[164, 165] .......................................................................................................................... 48
Figure 2-31. A schematic of a single mode-thin core-multimode-single mode fiber
configuration [166] ........................................................................................................... 49
Figure 2-32. Transmission spectra of the STMS configuration with increasing
surrounding refractive index [166] ................................................................................... 49
Figure 2-33. The schematic of multimode-coreless-multimode refractive index sensor
[167] .................................................................................................................................. 50
Figure 2-34. The transmission spectra of the MSM configuration in region I and region II
with varying surrounding refractive index [167] .............................................................. 51

x
Figure 2-35. A schematic of TiO2 coated LPG refractive index sensor developed by L.
Coelho et al. [172]............................................................................................................. 53
Figure 2-36. The effect of TiO2 coating on the measurement of refractive index. The plots
on the right shows the effect of varying thickness [172]. ................................................. 53
Figure 3-1. The schematic of a long period grating sensor [17] ....................................... 56
Figure 3-2. A spectrum of the long period grating sensor ................................................ 56
Figure 3-3. Simulated data of coupling wavelength shift against the surrounding
refractive index greater than refractive index of the cladding [27] .................................. 60
Figure 3-4. (a) The femtosecond laser system and (b) the computer controlled 4-axis
stage used for aligning fiber [127] .................................................................................... 62
Figure 3-5. A schematic of the setting used for fabricating LPG [127] ........................... 62
Figure 3-6. Atomization based coating system. ................................................................ 64
Figure 3-7 A schematic of the refractive index experiment using LPG sensor. ............... 65
Figure 3-8. A transmission spectrum for uncoated LPG in the leaky configuration. No
noticeable shift in wavelength is seen. .............................................................................. 66
Figure 3-9. A transmission spectrum for 7 passes of silver nanoparticle coating deposited
LPG in the leaky configuration. No noticeable shift in wavelength is seen. .................... 67
Figure 3-10. About 0.7 nm wavelength shift occurred in refractive index ranges of 1.4823
to 1.4944, 0.3 nm from 1.4944 to 1.5094, and 0.3 nm from 1.5094 to 1.5365. ................ 68
Figure 4-1. A schematic of the Mach-Zehnder interferometer. (a) a light source (b,e)
couplers (c) a reference arm (d) a sensing arm (f) an optical spectrum analyzer ............. 72
Figure 4-2. A Mach-Zehnder interferometer created by a pair of long period gratings ... 73
Figure 4-3. A schematic of (a) core mismatch and (b) small single mode fiber Mach-
Zehnder interferometer ..................................................................................................... 74
Figure 4-4. A sample spectrum of 40 um Mach-Zehnder interferometer sensor .............. 74
Figure 4-5. A schematic of tapered single mode fiber Mach-Zehnder interferometer ..... 75
Figure 4-6. A cross section view of a photonic crystal fiber [198] ................................... 75
Figure 4-7. a schematic of photoic crystal fiber Mach-Zehnder (a,e) single mode fiber
(b,d) collapsed region (c) photonic crystal fiber ............................................................... 76
Figure 4-8. Fujikura FSM 40PM fusion splicer used for all splicing operations. ............ 81
Figure 4-9. A schematic of a single mode fiber spliced to the photonic crystal fiber using
Fujikura FSM 40PM fusion splicer. ................................................................................. 81
Figure 4-10. Endlessly single mode LMA PCF used for MZI configuration. .................. 82
Figure 4-11. A schematic of refractive index experiment using MZI sensors .................. 83
Figure 4-12. Transmission spectrum of 40 um microfiber MZI in response to air and
water. ................................................................................................................................. 84
Figure 4-13. The transmission spectrum of 40 um microfiber MZI. Note that the
transmission dip is very small. .......................................................................................... 84
Figure 4-14. The transmission spectrum of 40 um microfiber MZI. No noticeable shift
has been observed. ............................................................................................................ 85
Figure 4-15. A transmission spectrum for uncoated PCF MZI in varying high refractive
index. ................................................................................................................................. 86
Figure 4-16. A transmission spectrum for uncoated PCF MZI zoomed in at wavelength
1530 nm to 1550 nm. Clearly, the wavelength shifts to the right while the transmission
intensity decreases increasing surrounding refractive index. ........................................... 87
xi
Figure 4-17. About 1.6 nm wavelength increased by increasing refractive index from
1.4823 to 1.5365. .............................................................................................................. 87
Figure 4-18. Transmission spectrum of (a) 11mm PCF MZI (b) 20 mm PCF MZI and (c)
25 mm PCF MZI ............................................................................................................... 91
Figure 4-19. The comparison between a single mode fiber-core only fiber-single mode
fiber sensor with a PCF MZI sensor. ................................................................................ 91
Figure 4-20. The transmission spectrum in leaky mode configuration of (a) uncoated 11
mm PCF MZI (b) coated 11 mm PCF MZI (c) uncoated 20 mm PCF MZI (d) coated 20
mm PCF MZI (e) uncoated 25 mm PCF MZI (f) coated 25 mm PCF MZI ..................... 95
Figure 4-21. Change of transmission intensity in (a) uncoated and (b) coated 11 mm PCF
MZI ................................................................................................................................... 96
Figure 5-1. A schematic of D-shaped optical fiber refractive index sensor. Refractive
index solution would make direct contact with the core [204] ......................................... 99
Figure 5-2. Light guiding of the femtosecond laser machined microhole refractive index
sensor [205] ..................................................................................................................... 100
Figure 5-3. A schematic of the gap sensor ...................................................................... 102
Figure 5-4. Normalized transmission value with respect to refractive index in the primary
experiment setup, but misaligned. .................................................................................. 104
Figure 5-5. Normalized transmission spectrum of the gap sensor with increasing
refractive index. Note that the intensity increases up to about 1.45 and starts to decrease
then. The general trend of the sensor is similar to the primary experiment results. ....... 105
Figure 5-6. The schematic of the gap distance parameterization .................................... 107
Figure 5-7. Change in the transmission intensity with increasing gap distance. ............ 107
Figure 5-8. The change in transmission intensity with response to temperature. ........... 108
Figure 5-9. Difference in transparency between solid and molten PCL. ........................ 109
Figure 5-10. The transmission intensity of PCL film with varying temperature ............ 110
Figure 5-11. The transmission spectrum of polymer films compared with the RI solutions.
......................................................................................................................................... 111
Figure 5-12. 1 mm by 1 mm by 189 μm thick PET film machined using femtosecond
laser. ................................................................................................................................ 113
Figure 5-13. A customized pressure chamber used t pressurize PET film. (A) a CO2 tank
(B) a high pressure regulator (C) a valve (D) a sample chamber (E) an exit valve. ....... 113
Figure 5-14. The change in transmission intensity with time as the CO2 desorbs out of
PET film. ......................................................................................................................... 114
Figure 5-15. The CO2 sorption film in PET using weight change method in literature. 114

xii
Acknowledgments
I gratefully acknowledge the motivation, support, and assistance I received from Dr.
Martin Jun as an M.ASc student at the University of Victoria. To me, Dr. Jun was not
only an academic supervisor but also was my mentor of life. By pursuing Dr. Jun’s
advices not only in academics but in life, I was able to find my genunity. It was my
pleasure to have Dr. Patrick C. Lee as my co-supervisor because I was able to learn a
whole new side of academics from Dr. Lee with his valuable supports.
I thank to everyone who pursued studies with me in the laboratory of advanced multi-
scale manufacturing (LAMM). I thank to Jung-Hyuk Ko and Yonghyun Cho for assisting
throughout my M. ASc study. Moreover, I appreciate all the technical helps from Farid
Ahmed, Vahid Ahsani, Kaveh Nazeri, Salah Elfurjani, Young-Keun Hong,and Max
Rukosuyev. I thank to Ahmad Esmaelirad and Syed Ali Baqar for all the
encouragements.
I would also thank to my beloved father, mother, and brother who supported and
provided me throughout my whole life. It is my honor to have family members like them.
In particular, I would like to thank my fiancé for their sincere prayer and supports. I
cannot forget to best friends, Chan-uk Song, Seung Won Jun, and Hanbin Choi, for their
supports, prayers, and encouragements. Lastly, I would like to thank God for everything.

Chapter 1. Introduction
Polymers are widely used in various applications after becoming high-value products
by many processing techniques such as composite manufacturing, blending, and foaming.
Depending on how polymers are processed, the properties of finished products can be
significantly different. Polymer processes may go through several chemical reactions
and/or mechanical processes to shape raw polymer materials from pellets, granules,
flakes, or powders, into the desired finished products. The finished product may have
different morphologies and properties from the raw materials [1]. Polymer processes
involving supercritical fluids (SCFs) and gases are one of the most prevalently used
processes and offers wide variety of applications researched in the field. Polymer
processes using gas/SCF can be categorized into two major groups. The first group is a
process where a polymer is dissolved into a gas/SCF solvent. The second group includes
the processes where a gas/SCF is dissolved into a polymer. In both categories, correct
understandings about the interactions between a gas/SCF and a polymer are critical for
the optimum fabrication process. Many properties of polymers can be affected by the
dissolved SCFs and gases at high temperatures and pressures. Among these effects,
solubility and diffusivity are crucial parameters in polymer processing applications.
Hence, different devices to measure solubility and diffusivity have been researched, but
most of the devices used today are very complex, expensive, and requires long
experiment time for operation. In this final thesis, the feasibility of the usage of fiber
optic sensors as measurement devices for solubility and diffusivity of gas/SCF in
polymers have been investigated. The fiber optic sensors have already been investigated
2
in gas sensing applications, such as in CO2 detection [2, 3]. Therefore, by configuring the
experimental setup for a molten polymer, gas diffusing into polymers could be measuring
using the fiber optic sensors. As gases dissolve into polymers, it would alter the refractive
index (RI) of the polymer resin, which could be detected using fiber optic refractive
index sensors. Many of the polymers used in polymer processing have high refractive
index, around from 1.4 to 1.68. However, fiber optic sensors offer very low sensitivity
when the surrounding refractive index becomes greater than that of the cladding, which is
approximately 1.44. This final thesis investigates the feasibility of fiber optic sensors in
sensing high refractive index for the future application of solubility and diffusivity
measurement.
The recent advances in fiber optic sensors has extended measurement technologies and
telecommunications a step further by providing solutions to current limitations with its
unique characteristics. Different types of fiber optic sensors, such as in fiber
interferometers or in fiber gratings, are prevalently used for temperature, refractive index,
pressure, and strain sensing because fiber optic sensors offer the unique properties such
as remote sensing, low propagation loss, high sensitivity, high accuracy, low cost, and
immunity to electromagnetic interference. The quality of fiber optic sensors depends on
the reliability, robustness, and ease of a fabrication process. The feasibility of fiber optic
sensors for detecting the solubility and diffusivity of gas/SCF in a polymer is discussed in
this final thesis. In this chapter, the fundamental knowledge in the solubility and
diffusivity of gas/SCF in a polymer, fiber optics sensors, limitations encountered by the
sensors, and the research scope of this final thesis would be presented.
3
1.1. Solubility and diffusivity of gas/SCF in a polymer
According to the International Union of Pure and Applied
Chemistry (IUPAC) definition [4], solubility is the proportional ratio of a solute in a
solvent. Diffusion can be described as the process where a material is transported by the
thermal motion of the molecules in a fluid or a matrix. Solubility and diffusivity act as
crucial parameters in many polymer processing applications. For example, in the
fabrication of nano-/micro cellular foamed plastics, solubility information provides the
maximum allowable amount of a gas/a SCF dissolved into a polymer resin at a specific
temperature and pressure. Solubility significantly affects the cell nucleation and growth
processes and thus, the final foam product properties [5]. Moreover, solubility and
diffusivity characteristics are crucial in polymer impregnation processes as they would
control additive contents in polymers. In polymer impregnation, both solubility of a
solute in a SCF and solubility of a SCF in a polymer are significant parameters [6]. It is
also known that SCF solubility in polymers has also a considerable effect in the polymer
blend structures in extrusion because a SCF reduces the viscosities and interfacial
tensions of the polymers and changes the final blend morphologies [7]. Since solubility
and diffusivity have significant effects in the polymer processes as mentioned earlier,
further knowledge in solubility and diffusivity measurement methods is essential to allow
more flexibility in these polymer processes and the relevant applications.
SCFs are frequently involved in polymer processes because their unique properties
provide numerous advantages as an alternative to other organic solvents. A SCF is a
substance above its critical temperature and pressure as shown in Figure 1-1. SCFs
behave similarly to gas in terms of viscosity and diffusivity while they behave like liquid
4
for density and solvating properties. The properties such as density, diffusivity, or
viscosity can be tuned simply by adjusting the operating pressure and temperature.
Moreover, SCFs are also widely used due to their economic advantages. SCFs can be
recovered and reused without any purification processes. In addition, the usage of SCFs
can benefit many industrial processes from low energy consumption and minimum
toxicity when compared to the conventional organic solvents. SCFs are non-carcinogenic,
non-flammable, and thermodynamically stable, which are the health and safety
advantages of SCFs [8]. As mentioned above, some polymer processes, such as the
micro-particle generation use SCFs as solvents to dissolve polymers [7, 9-14]. In this
final thesis, the potential usage of fiber optic sensor for measuring solubility and
diffusivity of gas/SCF in polymers have been investigated.
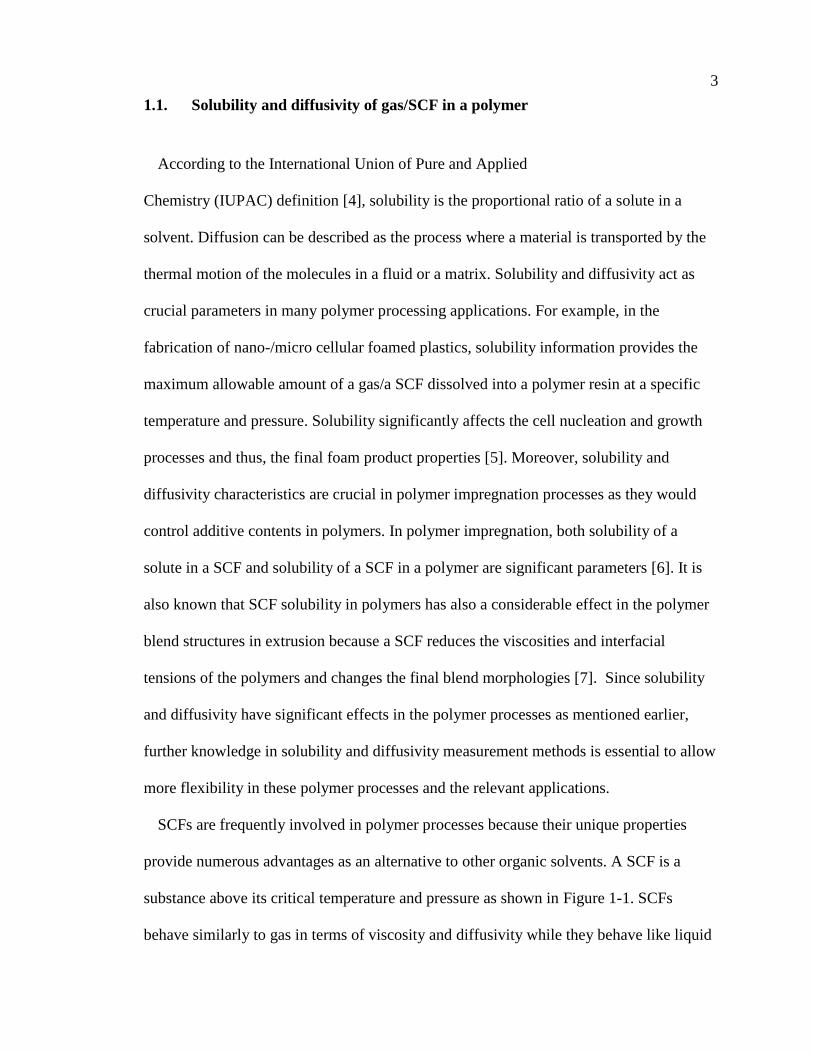
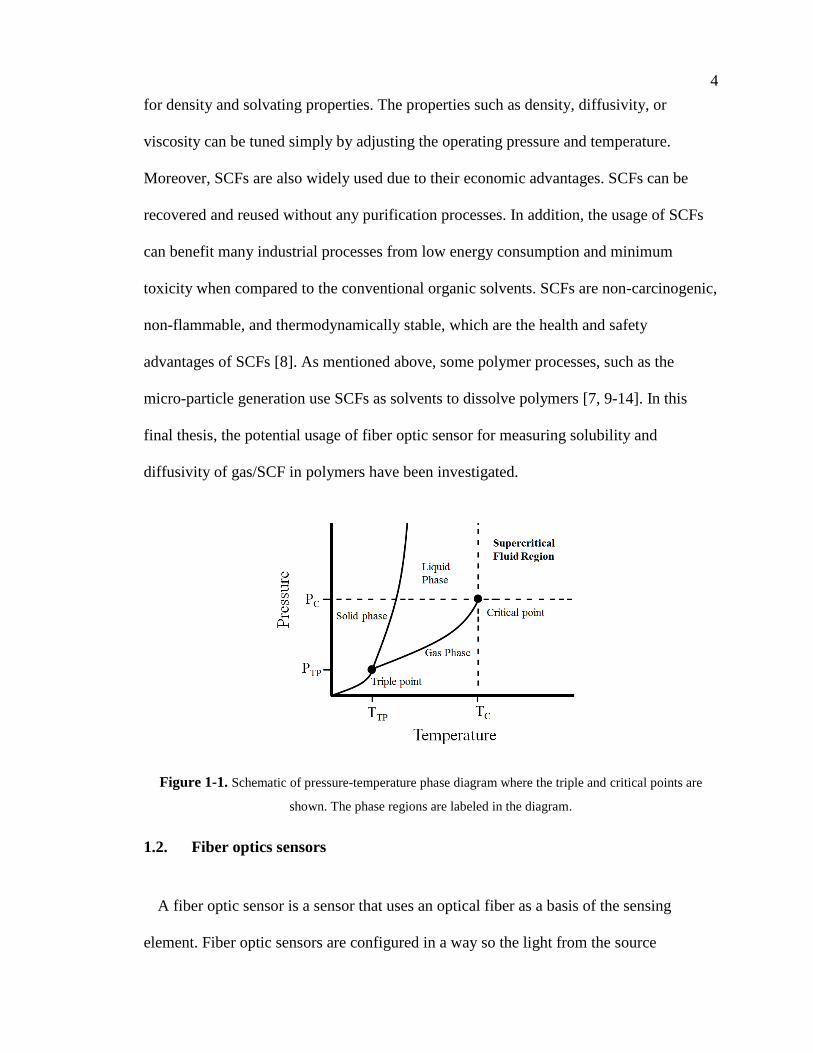
Figure 1-1. Schematic of pressure-temperature phase diagram where the triple and critical points are
shown. The phase regions are labeled in the diagram.
1.2. Fiber optics sensors
A fiber optic sensor is a sensor that uses an optical fiber as a basis of the sensing
element. Fiber optic sensors are configured in a way so the light from the source

5
propagates through the optical fiber sensor to the detector, usually in the reflection or
transmission mode. Depending on whether the optical fiber sensor actually modulates the
light or not, the fiber optic sensors can be categorized as an extrinsic optical fiber sensor
or an intrinsic optical fiber sensor. In the extrinsic optical fiber sensor, the transducer,
which is not an optical fiber, modulates light, and optical fiber is used to propagate
modulated light to a converting device. Extrinsic sensors are used in applications
requiring low resolution and low cost because extrinsic sensors generally do not provide
high resolution measurements [15]. An example of extrinsic optical fiber sensor is an
extrinsic Fabry-Perot type sensor used by S. Chen et al. [16]. In case of the intrinsic
optical fiber sensor, the light modulation is caused by the optical fiber, and grants control
over the light propagating in the fiber. Although the fabrication is more complex
compared to extrinsic sensors, intrinsic sensors offer better performances, and therefore,
intrinsic sensors are often used in applications as spectral filters [15, 17]. An intrinsic
Fabry-Perot sensor, long period gratings sensor, fiber bragg gratings sensor, and Mazh–
Zehnder Interferometer sensors all fall under the category of an intrinsic optical fiber
sensor [18-20]. Furthermore, the fiber optic sensor is also categorized into an intensity
based sensor or shift based sensor depending on its operating principle. The intensity
based sensing is the simplest approach where the intensity modulation of light from
optical spectrum analyzer is used for sensing [21]. The disadvantages in the intensity
based sensors are that random losses exist in the sensing environment. For example, there
could be intensity losses from splice joints, fiber connections, bending. Changing a fiber
position could lead to a change in intensity. A shift based sensor, on the other hand, uses
the shifts of a phase or wavelength in response to the environment for sensing. The shift

6
based sensor provides high sensitivity to temperature, strain, and refractive index, and
therefore is used widely [22-25].
1.3. Significance of the problem
Most of the solubility and diffusivity measurement devices currently used in practices,
such as the magnetic suspension balance or the pressure decay system, are expensive,
complex, and requires long experimental time. In order to improve upon the mentioned
aspects in measuring the solubility, the fiber optic refractive index sensor could
potentially be implemented. As gas sorb into a polymer, its refractive index would
change, which is already hypothesized using Gladstone-Dale relation and have been
observed by R. St-Gelais et al. [26]. By observing this change in refractive index, the
solubility and diffusivity of gas in a polymer can be obtained. Fiber optic sensors are
ideal for this measurement because they offer accurate measurement of refractive index,
even in the harsh environment such as in high temperature, pressure, and electromagnetic
fields. However, a significant problem would be encountered when fiber optic sensors are
attempted to be used in measuring solubility and diffusivity of gases in a polymer. Fiber
optic refractive index sensors offer very low sensitivity when the surrounding refractive
index (SRI) becomes greater than that of silica, which is approximately 1.45. For
example, as illustrated in Figure 1-2, R. Hou et al. have simulated the sensitivity of long
period gratings sensor with varying refractive index and showed that once SRI becomes
greater than 1.45, the sensitivity with refractive index becomes almost negligible. This is
a significant problem because majority of the polymers used for processing have
refractive index greater than 1.45. Some of the main polymers used for polymer

7
processing are tabulated in Table 1-1. Polymers widely known, such as PMMA, PVA,
Nylon 6, PS, PVC, and PE, all have refractive index above 1.5. Therefore, a solution to
sense refractive index in regions greater than the cladding is necessary to allow solubility
measurement using the fiber optic sensors.
Table 1-1 Refractive indices of polymers prevalently used in polymer processing.
Polymers Refractive
Index (n)
Polymers Refractive
Index (n)
Polytetrafluoroethylene 1.35-1.38 Polybenzyl methacrylate
1.57
Poly-4-methylpentene-1 1.47 Stylene-acrylonitrile
copolymer
1.57
Polymethyl methacrylate 1.5 Polyphenylene methacrylate 1.57
Polyvinyl alcohol 1.49-1.53 Polydiallyl phthalate 1.57
Diethylene glycol bis allyl
carbonate
1.5 Polyethylene terephthalate
1.58
Polycyclohexyl methacrylate 1.51 Polystyrene 1.59
Polyethylene 1.51 Polyvinyl chloride 1.63
Polyacrylonitrile 1.52 Polyvinyl naphthalene 1.68
Nylon 6 1.53 Polyvinyl carbazole 1.68
Figure 1-2. Simulated data of coupling wavelength shift against surrounding refractive index on a
wide range [27]
8
1.4. Fiber optic refractive index sensors in refractive index greater than the silica
In order to utilize fiber optic sensors for measuring the solubility and diffusivity of
gas/SCF in polymers, the fiber optic sensors must be capable of measuring surrounding
refractive index that is higher than the cladding. Most of the fiber optic refractive index
sensors set a limitation in its range so the surrounding refractive index is smaller than the
refractive index of the cladding. This is because once the surrounding refractive index
(SRI) becomes greater than the refractive index of the cladding (ncladd), the total internal
reflection is lost and becomes a leaky configuration. As the SRI approaches to the
refractive index of the cladding, the light propagation at outer cladding modes become
leaky as total internal reflection is lost at the boundary of the outer cladding and the
environment. In the early times, the case of a SRI being greater than that of silica (i.e.
leaky configuration) did not capture interests because no guided propagation happened
into the cladding in the leaky configuration [28]. However, Lee et al.’s work on couplings
in a leaky configuration has found a potential in refractive index sensors operating on a
wide range of refractive index values [19, 29]. In the leaky configuration, it is
conventionally known that light would leak from losing the total internal reflection [30].
For the leaky wave guiding situation, the dispersion relation of effective refractive index
in cladding mode no longer has purely real solutions [31]. However, it is important to
know that even with the light leaking out in transversely, the light do propagate in a
longitudinal direction with attenuated amplitude [32] . This small portion of propagation
is from Fresnel reflection and this could enable reasonably low-loss propagation for some
applications [31]. Only limited number of studies have reported in Mach-Zehnder
Interferometer (MZI) based refractive index sensors in the leaky configuration as well

9
because the response of MZI to varying surrounding refractive index ceases to be linear
in this domain [33]. In leaky configurations, certain optical sensors do react with either a
shift based or intensity based response. However, the sensitivity of these responses are
very low and insufficient to be used as a refractive index sensor in leaky configuration.
Moreover, some researchers endeavored and succeeded in measuring high refractive
index but their sensitivity was still low and required usage of high cost fibers and
fabrication methods. They also neglected temperature dependence on the refractive index
which limits the usage in the practical applications [19, 27, 32-35]. Some of these
literature reviews will be discussed in Chapter 2. To apply fiber optic refractive index
sensors for the measurement of solubility and diffusivity of gas/SCF in a polymer, the
problem of low sensitivity in the leaky configuration must be overcome.
1.5. Research scope and outline
The research scope of this final thesis is to investigate the feasibility of in fiber
gratings, in fiber interferometers, and transmission intensity based fiber optic sensors for
acquiring solubility and diffusivity of gas/SCF in a polymer. To use fiber optic sensors
for solubility and diffusivity measurement, the sensors must be capable of sensing
refractive index higher than silica, which has been little of interest. This final thesis
suggests a fiber optic based sensor that is capable of sensing in high refractive indices,
and potentially be used to measure solubility and diffusivity measurement in polymers.
Chapter 1 introduces the solubility and diffusivity of gas/SCF in polymers, fiber optic
sensors/interferometers and the problems encountered in leaky configurations in fiber
optic refractive index sensors. Chapter 2 reviews and discusses current technologies

10
developed in literature in solubility measurement, diffusivity measurement, fiber optics as
refractive index sensors. Fiber brag gratings sensors, long period gratings sensors, and all
the different configurations of Mach-Zehnder interferometers as refractive index sensors
would be presented. Moreover, any refractive index studies conducted in leaky mode
would also be within the scope of the literature review. Chapter 3 of this thesis presents
long period grating sensor for measuring high surrounding refractive index solution. The
fabrication of long period gratings sensor using the femtosecond laser, the process of
coating LPG, and the behavior of both coated and uncoated LPG in high refractive index
solutions are discussed. In Chapter 4, the behavior of smaller core based Mach-Zehnder
interferometer, PCF Mach-Zehnder interferometer, and the coated PCF Mach-Zehnder
interferometer to the high refractive index solutions are presented. The fabrication
process of the discussed MZIs would be introduced as well. In Chapter 5, the novel
intensity based gap sensor for measuring high refractive index solutions is described. The
sensing principle, experiment setup, and parametric studies are present along with the
high refractive index sensing data. Preliminary experiments using polymer films have
been conducted to test the feasibility of the gap sensor. Finally in Chapter 6 provide the
overall conclusion of the thesis and suggest a potential future works to improve fiber
optic sensors in high refractive index environment.

11
Chapter 2. Theoretical background and literature review
In this chapter, first, the current status of measurement methods for measuring
solubility and diffusivity of gas/SCF in polymers are reviewed. Then, the relevant
research for the measurement of refractive index using fiber optics sensors is reviewed.
The usage of in fiber grating sensors, in line interferometers, and in fiber intensity based
sensors used as refractive index sensors are reviewed. Moreover, since measurement of
high refractive index leads to loss of perfect internal reflection of the propagating guided
mode at the cladding to surrounding refractive index interface, the refractive
measurement in the leaky configuration are investigated.
2.1. Methods for measuring solubility of gas/SCF in polymers
Solubility data are crucial in many of polymer processes, such as polymer
impregnation, blending, and microcellular foaming. Hence, different techniques for
measuring gas/SCF solubility in a polymer have been investigated by numerous
researchers. In this section, various theoretical methods used to obtain solubility data are
discussed in detail. In addition, the limitations of each method are described as well.
Commonly, theories, such as equations of states and empirical equations, are used to
improve the accuracy of the measured solubility and diffusivity data. For further
information in regards to theories, refer to Appendix A.
2.1.1. Gravimetric methods

12
The gravimetric method measures solubility of a gas/SCF dissolved in a polymer by
acquiring the changes of the sample weight by a gas/SCF. When a polymer sample is
exposed to a gas/SCF, the sample swells and the volume change occurs which affects the
calculation of solubility data. Therefore, in gravimetric methods, it is critical to
compensate for a volume swelling of the sample since the volume swelling correction can
affect up to 40% of the measured weight difference depending on gas/SCF and polymer
types, and pressure ranges [36]. There are experimental techniques such as a photometric
method or a thermomechanical analyzer (TMA) method to measure the sample swelling
and buoyancy behaviors [37-40]. Also, the EOS theories such as Henry’s Law, SL-EOS,
Flory-Huggins theory, SS EOS, or SAFT EOS are used to account for swelling. Y. Zhang
and co-investigators studied the swelling and sorption behaviors of various polymers in
the presence of CO2 at 35 ˚C and 10.3 MPa [41].
A quartz spring balance is one of the early gas/SCF solubility measuring techniques
based on the gravimetric method. This apparatus determines solubility by monitoring the
extension of a spring from an increased sample’s weight. Using the Hooke’s Law, the
mass of the sample is determined as a function of a spring elongation. The spring used in
this technique is fabricated from quartz or similar materials such as tungsten. J.W.
McBain is one of the early researchers who used a quartz spring apparatus to study the
gas sorption behaviors in rubbers and naturally occurring polymers [42]. Thus, this
apparatus is commonly referred as a McBain Balance. The schematic of a quartz spring
balance used by McBain can be seen in Figure 2-1. A McBain balance is suitable for the
sorption study of organic vapors or gases that are highly soluble in polymers. Only a
small portion in a McBain balance is required to be heated and a pressure is held constant

13
for solubility measurements. Precautions are necessary when operating a McBain balance
as this device is sensitive to a vibration. The preliminary volume calculations required for
solubility calculations in other types of gravimetric measurement techniques are not
required in a McBain balance. Instead, the sensitivity of a spring and the extension per
unit weight calculations must be done for solubility calculations [36]. The sensitivity of a
McBain balance is low and therefore it is hard to measure solubility of light gases in a
polymer [36]. However, this limitation can be overcome by using more modern and
sophisticated types of quartz spring for a higher sensitivity. These modifications on a
McBain balance allow the users to operate up to 1.01 MPa [43]. Furthermore, precise
temperature and pressure controls can be implemented to improve the experimental
accuracy [44, 45]. A McBain balance is compatible with different gases and polymers in
the moderate range of temperatures (35 – 178 ˚C) with modifications. G.E. Serad and co-
researchers used a McBain balance to study the sorption and diffusion behaviors of n-
Butane in PET [46]. S. Lequin and co-investigators used a McBain balance to study
water vapor sorption on cork [47], and Y. Iwai and Y. Arai studied solubility of m-xylene
and nonane vapors in PS, and ethylbenzene and nonane vapors in polybutadiene (PBD) in
the temperature ranges from 130 to 175 ˚C and 80 to 130 ˚C, respectively [48]. A
McBain balance is also capable of measuring gas/SCF solubility of a thin film sample.
This can be done by suspending the thin film sample in the cell. However, this technique
is impossible if the sample is in a semi-liquid state or in a molten state (i.e., high
temperature experiments). This limitation can be overcome by utilizing suspended pans
or caps but this can cause other experimental challenges such as sample adhesion to the
bottom of the pan. As mentioned above, gravimetric methods must consider for the

14
buoyancy effect and, in case of a McBain balance, the calibration of the unstrained spring
needs to be calculated as well before the solubility calculation [44, 49, 50]. The weight,
temperature, and pressure sensitivities of a modified McBain balance are ± 0.05 mg, ±
0.5 ˚C up to 400 ˚C [51], and ±1 Pa [47], respectively. The sample of 5 to 20 mg can be
loaded on the spring [52].
Figure 2-1. Schematic of a McBain Balance in superposed thermostats: (A) heating coil, (B)
quartz spring, (C) polymer specimen [42]
Usage of electronic microbalances are also available for gas/SCF solubility
measurements in polymers. Electronic microbalances can take a smaller sample sized
specimen because of a higher sensitivity. In addition, these microbalances have a shorter
measurement time compared to McBain type balances [40]. Three electronic

15
microbalances are frequently mentioned in literatures: ones manufactured by Cahn
Instruments, Sartorius Stedim Biotech GmbH, and Mettler Toledo. In a Cahn type
microbalance, the sample is positioned in a high pressure chamber and is balanced with a
weight suspended on the other end of a beam. Electronic signals with a variable gain
amplifier and a digital to analog converter are used to observe any imbalances of the
device. A Cahn microbalance was used by Y. Kamiya and the research group to study
sorption and dilation of a polymer with various gases [53-56]. Moreover, B. Wong and
investigators used a Cahn microbalance to determine solubility and diffusivity of CO2
and HFC134a in PS, filled poly(vinylchloride) (FPVC), and unplasticized
poly(vinylchloride) (UPVC) [57]. The schematic of the sorption apparatus using a Cahn
microbalance is shown in Figure 2-2. In a Sartorius type microbalance, an electromagnet
coil is connected at the center of a beam within a permanent magnet field. The current in
the coil changes relatively to the change in the sample’s weight. This fluctuation of
current is monitored with a microprocessor to determine the weight of the sample. Y.
Kamiya and the group studied CO2 sorption and dilation of Poly(methyl methacrylate)
(PMMA) using a Sartorius microbalance [58]. Similarly, L. Phan Thuy and J. Springer
studied CO2 sorption in poly(butylene terephthalate) (PBT) [59]. In addition, N. Von
Solms and co-authors made a direct measurement of solubility and diffusion of methane
and CO2 in high density polyethylene (HDPE) [60]. The schematic of a sorption
apparatus using a Sartorius electronic microbalance is shown in Figure 2-3. Several
sorption studies in literature used a Mettler AE163 electronic microbalance, which is
sensitive up to ± 0.0001g, to study sorption of CO2 in poly(chlorotrifluoroethylene)

16
(PCTFE), PDMS, PMMA, and PS [61-64]. More recently, C. Gutierrez et al. studied the
sorption of CO2 in PS using the same technique [65].
Figure 2-2. High pressure sorption apparatus with a Cahn model 2000 electronic microbalance by
Kamiya [56]: (A) pressure chamber containing an electronic microbalance, (B) thermostatically
controlled air bath, (C) temperature controller, (D) thermometer, (E) pressure gauge, (F) safety
valve, (G) flow meter, (H) columns of active charcoal and silica gel, (I) pressure regulator, and
(J) a gas cylinder [56]
Figure 2-3. Sorption apparatus with a Sartorius S3D-P electro microbalance by Kamiya [58]: (A)
Sartorius microbalance, (B) constant temperature water bath, (C) auxiliary furnaces, (D) constant
temperature air-bath, (E) pressure chambers, (F) thermocouple, (G) water inlet, (H) gas inlet, (I)
polymer sample plus buoyancy corrective (gold wire), (J) counter balance (aluminum rod) [58]

17
A magnetic suspension balance (MSB) is another famous instrument allowing
gravimetric measurements of gas/SCF solubility in polymers. A MSB is differentiated
from other gravimetric techniques described earlier due to contactless weight
measurements. A microbalance in a MSB is isolated from a high pressure and
temperature sample chamber and is positioned in an ambient environment. A MSB is
capable of measuring gas/SCF solubility in extreme pressures and temperatures unlike
other gravimetric techniques, such as a McBain balance, and shares similar advantages
such as a high sensitivity with other electronic microbalances mentioned earlier. A
polymer sample is positioned in a sample holder and it is isolated from the balance as
shown in Figure 2-4. The sample holder is hung on to a suspension magnet (i.e.,
permanent magnet), which is kept free in the sorption chamber to allow the transmission
of a magnetic attraction force to the external electronic balance. Therefore, the weight
measured in the sorption chamber can be precisely transmitted to the isolated
microbalance through this suspension magnet. A MSB is used by numerous researchers
to measure gas/SCF solubility in polymers. For example, Li, G., Gunkel, F., Wang, J.,
Park, C.B., and Altstädt, V. measured solubility of N2 and CO2 in PP and Ethylene
Octene copolymers from 180˚C to 220˚C and 160˚C to 200˚C, respectively, up to
pressures of 27.6 MPa [66]. Y. Sato and co-workers found solubility of CO2 in
Polyphenylene Oxide (PPO) and PPO/PS blends using a MSB [67]. A MSB can detect
mass changes of 3×10⁻⁵g. A sample mass for measurements is from 0.01 to 30 g with a
pressure control of ±10 Pa between 0.1 ×10⁵ and 1.33 ×10⁵ Pa, and a temperature control
of ±0.05 ˚C from 20 and 150 ˚C [52]. Many literatures mention a MSB manufactured by
Rubotherm GmbH (Rubotherm) to study solubility and diffusivity of a gas/SCF in

18
various polymers. B.I. Chaudhary and A.I. Johns studied the sorption of N2, Isobutane,
and CO2 in PE in the temperature range of 110 to 200 ˚C up to 20 MPa [68]. Von
Schnitzler et al. measured the sorption of CO2 in PBT with a MSB in the temperature
range of 40 to 120 ˚C and the pressures up to 30 MPa. Y. Sato and the group studied CO2
solubility in various polymers and polymer blends using a MSB [67, 69, 70].
Furthermore, S. Areerat and the research group also studied solubility of CO2 in molten
polymers such as HDPE, Low Density Polyethylene (LDPE), PP, Ethylene-Ethylacrylate
copolymer (EEA) and PS [71, 72]. In more recent work, Z. Lei and co-authors studied
CO2 sorption in PP. Similarly, E. Aionicesei et al. studied CO2 solubility in PEG, poly(l-
lactide) (PLLA) and poly(d,l-lactide-co-glycolide) (PLGA). In 2015, N. Trupej and co-
investigators measured the solubility and diffusion coefficient of a Ar gas in PEG using a
MSB [73-76].
Figure 2-4. The schematic of a solubility measurement apparatus with a MSB by Sato [69].

19
2.1.2. Piezoelectric methods
Piezoelectric crystals can be used to investigate gas sorption behaviors in polymers
using the principle of piezoelectric crystal frequencies. The vibration frequency of a
piezoelectric crystal changes with respect to its mass, and this frequency change can be
measured using a control system [36]. The oscillation frequency of a polymer sample
coated atop a piezoelectric crystal is used for the solubility measurement. Prior to the
experiment, it is necessary to know the frequencies of uncoated and coated crystals at an
ambient environment. Then, the weight of the sample is determined as a function of gas
pressures, and through the mass balance, the weight of a gas dissolved in the sample can
be calculated. D.C. Bonner and Y.L. Cheng used a piezoelectric crystal sorption device to
study N2 sorption in LDPE [77]. Moreover, this method is well elaborated in the studies
of B.J. Brisco and the research group where they measured gas solubility and gas induced
dilation in poly(urethane) elastomers using a vibrating beam technique, which involves
the measurement of the first harmonic resonant frequency of the beam that can vary with
the mass of gas absorbed in a polymer [78-80]. More recently, the work by K. Miura and
co-authors with a quartz crystal microbalance (QCM) attracted people’s attention, where
quartz crystals are used as mass ‘sensors’ to obtain CO2 solubility and adsorption data at
high pressures [81]. The schematic of a solubility measurement setup using a QCM are
shown in Figure 2-5. K. Miura et al. used a platinum resistance thermometer to measure a
temperature inside the cell and a strain gauge to measure the pressure of the cell. The
solubility was obtained by calculating the frequency difference between the initial
frequency and the measured frequency at a certain pressure and temperature. G. Wibawa
and co-investigators used a QCM to measure solubility of seven nonpolar organic

20
solvents such as octane, cyclopentane, cyclohexane, benzene, toluene, ethylbenzene and
p-xylene in cis-1,4-polyisoprene, poly (isobutylene) PIB, poly(n-butyl methacrylate), and
poly(vinyl acetate) (PVA) [82]. The advantages of a piezoelectric method are; first, this
method does not require a volume change correction as other measurement methods due
to its vibration frequency based measurement; second, a QCM has a short experiment
time; third, a very small change in weights can be measured; and lastly, it is relatively
easy to add an automated measurement system [81, 82]. However, the hysteresis error
from the adhesion of polymer films to the crystals should be taken into account [36, 83].
Moreover, since a QCM is a fast measurement device, it cannot detect the slow changes
during sorption caused by the polymer relaxation which is independent of the film
thickness [52, 84]. Preparing a thin polymer film on the crystal is a fundamental
challenge, limiting the types of polymers used with a QCM. CO2 solubility in poly 4-
methyld-1-pentene (TPX), PMMA, polyimide, PC, PS, chlorinated polyethylene,
poly(xylylene), poly(2-chloroxylylene), poly(2,3-dichloroxylylene), and teflon were
investigated by James Aubert using a QCM up to 40 ˚C and 9.65 MPa [85]. D. Boudouris
and co-researchers studied the sorption behaviors of HCFC-22 and HFC-152a in PMMA,
PS, and PC, and M. Pantoula and C. Panayiotou studied CO2 sorption in PMMA and PS
[86]. In their work, M. Pantoula and C. Panayiotou compared the obtained solubility data
with a QCM with other literature data to elucidate the accuracy of their results [87]. N.S.
Oliveira et al. found solubility of N2, O2, CO2 and water in PLA with an overall average
absolute deviation of 6% when compared with the theoretical values obtained with the
Flory-Huggins theory [88]. More recently, F. Herran and the research group studied the
sorption of H2O vapor in PC using a QCM [89]. A.L. Smith and H.M. Shirazi have

21
obtained the temperature control of 0.0001 ˚C up to 45 ˚C and 0.005 ˚C up to 110 ˚C in
their QCM experimental setup [90].
Figure 2-5. Schematic of a sorption apparatus with a QCM used by Miura et al. [81].
2.1.3. Mamometric methods
A manometric method determines the solubility of gases/SCFs in polymers by
measuring the pressures or volumes of the gases sorbed in or desorbed from the sample in
equilibrium [36]. Early studies were performed in sub-atmospheric pressures (0.101
MPa) [91, 92]. C.S. Venable and T. Fuwa acquired solubility data of different gases in
rubber using a direct experimental procedure, which is to calculate solubility data from
volume differences between before and after a gas exposure at 100˚C in a sub-
atmospheric pressure [93]. By monitoring the pressure or volume changes of a gas in a
chamber, the solubility of gases in polymers are determined. The chamber volume
calibration must be done prior to an experiment in this configuration. In these early direct
experimental techniques, one of the challenges is the process of removing all ambient gas
phases as soon as possible once the equilibrium is reached, while preventing the

22
dissolved gas from being pumped out of the sample. The usage of a high power pump for
evacuating the chamber removes a gas phase effectively [94, 95].
A phase separation technique is one type of manometric methods used to obtain
solubility data. In a phase separation method, the molten polymer sample is exposed to a
gas under a certain pressure in an autoclave. Once equilibrium is attained, the solubility
can be determined by calculating the amount of gas present in the polymer-rich phase of
a sample. This method is mainly applicable to low viscosity polymers as mixings
between a low viscosity polymer and a gas/SCF are easier [96]. M. Daneshvar, S. Kim,
and E. Gulari used the phase separation method to obtain sorption of CO2 in PEG up to
100 ˚C and 35 MPa, while Garg et al. obtained CO2 and 1,1-difluroroethane sorption in
PDMS and PS in the range of 50 to 160 ˚C and up to 26 MPa [96-98]. The solubility of
propane, N2, and CO2 in PEG was also investigated by Wiesmet and the research group
using a phase separation method [99, 100].
A pressure decay method is a prevalently used manometric based solubility
measurement technique. This technique was developed by Newitt and Weale in 1948 to
measure solubility of H2 and N2 in PS [101]. In a pressure decay method, a polymer
sample is placed in a closed pressure vessel with a known volume and a temperature. As
a preheated gas is introduced to the chamber, pressures are measured as a function of
time until gas sorption to the sample completes. The solubility is determined by
calculating the pressure difference between an initial gas amount and a gas amount at
equilibrium. It is important to consider for the polymer sample swelling during gas
sorption because this changes the total sample volume. Theoretical EOSs can be used to
compensate for the swelling volume of a sample due to gas sorption. The solubility

23
measurement at a high temperature is particularly difficult with a pressure decay method
due to the lack of suitable pressure sensors [40, 70]. Moreover, at a high pressure
experiment, small gas leakage from the chamber can lead in underestimating the
solubility data. Therefore, solubility measurements at high pressures require accurate
EOSs, and should take account of Pressure-Volume-Temperature (PVT) behaviors of the
polymers at high pressure and temperature conditions. Furthermore, polymer degradation
problems could also occur at high temperature experiments [40]. For a pressure decay
method, a large amount of samples is required. Hence, a long measurement time is
required to obtain solubility data because reaching equilibrium takes a long period of
time. The measurement errors can arise when accounting for an initial gas pressure
introduced to the cell because a stabilization period is required for a pressure measuring
device. During this stabilization period, a substantial amount of gas sorption can occur
and this can cause solubility measurement errors. The extrapolation of a pressure decay
curve to a zero time was conducted in attempt to correct for this error [102-105].
Moreover, a reference reservoir was used to correct for this type of error [106]. An
attempt to use dual sorption cells was made by W.J. Koros, A.H. Chan, and D.R. Paul
and they were able to measure solubility of multiple gases in PC without a stabilization
related error [107]. Multi-sorption cells were also used to eliminate the errors as in the
experiments by Y. Sato’s research group and V.I. Bondar’s research group [108-112].
Using these multi-sorption cells allowed the researchers to perform solubility
measurements at high pressures. The schematic of a dual cell pressure decay sorption
apparatus is depicted in Figure 2-6. Not only gas sorption behaviors, but also the
diffusivity and permeability of different gases in PEO at 35 ˚C and pressures up to 4 MPa
24
were obtained using a dual sorption pressure decay method by H. Lin and B.D. Freeman
[113]. Moreover, J.E. Groiler and the research group used a vibrating wire sensor with a
pressure decay method to obtain solubility of CO2 in medium density polyethylene
(MDPE) and poly (vinylidene fluoride) (PVDF) [114, 115]. Recently, D. Li and
investigators studied CO2 sorption in solid-state isotactic polypropylene (iPP) in the
temperature and pressure ranges of 100 to 150 ˚C and up to 15 MPa, respectively. S. Kim
and co-authors studied the gas sorption of H2, N2, O2, CH4, and CO2 in different
thermally rearranged polymers, and C.G.F. Rezende et al. studied the sorption of
propylene and propane in polyurethane containing silver nanoparticles [116-118].
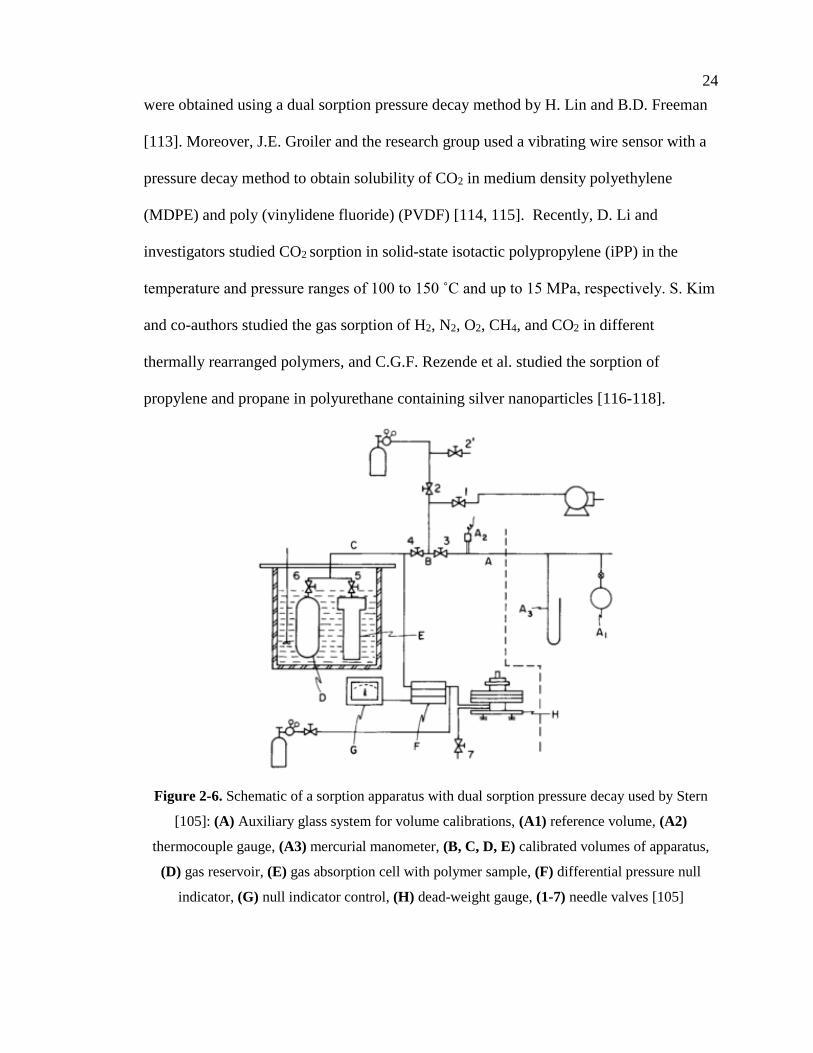
Figure 2-6. Schematic of a sorption apparatus with dual sorption pressure decay used by Stern
[105]: (A) Auxiliary glass system for volume calibrations, (A1) reference volume, (A2)
thermocouple gauge, (A3) mercurial manometer, (B, C, D, E) calibrated volumes of apparatus,
(D) gas reservoir, (E) gas absorption cell with polymer sample, (F) differential pressure null
indicator, (G) null indicator control, (H) dead-weight gauge, (1-7) needle valves [105]
25
2.2. Methods for measuring diffusivity of gas/SCF in polymers
In this section, two main experimental methods for measuring gas/SCF diffusivity in a
polymer under unsteady states are introduced. The advantages and disadvantages of each
method are also discussed. To improve the accuracy of the measurement, theories are
often used to correct the diffusivity data. For further information in regards to theories,
refer to Appendix B.
2.2.1. Gravimetric method
A Magnetic Suspension Balance (MSB) [119, 120] is one of the most popular and
precise devices based on the gravimetric method for diffusivity measurements. This
technique gathers sample mass change data with respect to measurement time and then
fits the data with a diffusivity equation to get a gas diffusivity coefficient.
An electronically controlled magnetic suspension coupling is used to transmit the
measured force from the sample enclosed in a pressure vessel to a microbalance located
at an ambient temperature and pressure as discussed in an earlier section 2.1.1. When a
gas dissolves in a polymeric sample, the weight of the sample grows due to the dissolved
gas weight. A mutual diffusion coefficient is then determined by measuring the weight
change of the sample with respect to time as shown in Figure 2-7.
Sorption time (s)Sorption time (s)
Rat
ion o
f m
ass
up
tak
e fo
r ti
me
t an
d ∞
a) b)
Calculation

26
Figure 2-7. (a) CO2 Sorption profiles in LDPE and PS samples obtained by the step change in
pressure from 11 to 12 MPa at 200 °C. The solid fitting lines are calculated by Fick’s second law
[71]; (b) a typical diagram of sorption/desorption experimental measurements [121]
Many diffusion experiments generate permeate flux data with respect to time to fit
modified Fick’s second law functions to estimate diffusion coefficients. For example,
Figure 2-7a) shows the Fick’s second law fit on the experimental data.
2.2.2. Pressure decay method
Figure 2-8. Schematic of common pressure-decay apparatus [122]
Among all experimental methods for measuring gas diffusivity in a polymer, a
pressure-decay method, as shown in Figure 2-8, is attractive because of its convenience,
simplicity, and accuracy [123]. In 1963, J. L. Lundberg and his team members used this
method to measure diffusivity and solubility of methane in PS at 33 MPa in the
temperature range between 100 and 188 °C [103]. In 1969, his group repeated similar
experiments using PIB [124]. In a pressure decay method, a molten polymer is molded to
form a sheet where the sides of the samples are sealed to satisfy a single-sided diffusion
27
process. The sample is placed in the center of a high-pressure cell and the both ends of
the pressure cell are sealed to ensure a gas can only diffuse in a vertical direction. Prior to
a measurement, a vacuum is applied to desorb the sample of any impurities. Then, a
testing gas is injected and absorbed in the polymer sample. Gas diffusivity is indirectly
calculated by measuring the rate of gas volume or gas pressure changes after gas injection
[125]. There are many different kinds of sensors such as laser and nuclear magnetic
resonance sensors [122, 125] used in this method to get the graphs of gas volume vs.
pressure.
2.3. In fiber gratings based refractive index sensors
To utilize fiber optic sensors for the measurement of solubility and diffusivity, in depth
comprehension of different fiber optic refractive index sensors is necessary. In this
section, in fiber gratings, namely FBG and LPG, based refractive index sensors are
reviewed.
2.3.1. Fiber Bragg grating based refractive index sensors
A fiber Bragg grating (FBG) is a type of fiber grating that is used widely in sensing
applications. FBG is fabricated by inscribing periodic refractive index in the fiber core,
which reflects a particular wavelength of light to the direction of the light source due to
its phase matching property. Usually, a grating has periods in the order of hundreds of
nanometers, and thus is also called short period grating. A schematic of FBG is as shown
in Figure 2-9 [126]. FBG behaves like a band stop filter using the principle of Bragg
reflection phenomenon [127]. The formation of a periodic index modulation in the optical

28
fiber core allows particular wavelengths of light to be reflected while transmitting the rest
of the light [128]. FBG fiber optics have been investigated for the telecommunication and
sensing applications [129]. Furthermore, FBG sensors resulted in high performance
sensing for individual or simultaneous measurement of temperature, strain, and refractive
index [130-133]. The sample spectrum of FBG refractometer in response to different
refractive index environment is shown in Figure 2-10 [126]. The strengths of FBG
sensors in single mode fibers are that they offer real time response, accurate
measurement, and allow multi parameter measurement. Fiber Bragg gratings can also be
inscribed in in fiber interferometers to allow a configuration of Mach-Zehnder
interferometer and improve in the performance [18].
Figure 2-9. The schematic of a typical Fiber Bragg grating sensor [126]

29
Figure 2-10. The spectrum of a Fiber Bragg grating sensor in different refractive index
environment [126]
When the core is exposed to an intensive optical interference pattern, a periodic
perturbation of the refractive index along the fiber is formed, called fiber Bragg grating
and the FBG is first developed onto optical fiber in 1978 at the Canadian Communication
Research Center [134, 135]. The periodic perturbation behaves as a stop-band filter,
where a narrow band of optical wavelength is reflected by the scattering from index
variations. In FBG, the mode coupling occurs at the Bragg wavelength, 𝜆𝐵 which can be
obtained by:
𝜆𝐵 = 2𝑛𝑒𝑓𝑓𝛬 (1)

30
where 𝛬 represents the period of the grating and neff represents the modal index. Each
reflection is in phase with the next one as shown in Figure 2-11. Any change in fiber
properties such as refractive index, strain, or temperature would change the modal index
or grating pitch which would lead to change in Bragg wavelength [135].
Figure 2-11. The principle of fiber bragg described by Hill et al. [135]. The Bragg resonance for
reflection occurs at the wavelength which the grating pitch is one-half of the modal wavelength of
the core. The transmitted wavelength would be resultant of wavelength subtracted by the Bragg
reflection.
Single mode optical fiber with FBG is used widely used as a refractometer. The
effective short period FBG sensor based on the resonance shift is successfully fabricated
by C. Chan and researchers and they allowed a refractive index measurement in range
between 1.25 and 1.44 [136]. Similarly, tilted FBG (TFBG) sensor based on intensity is
investigated by Y. Miao, B. Liu, and Q. Zhao [137]. In case of a single mode fiber, the
TFBG enhances the coupling of the light from forward propagating core to backward
propagating cladding mode. By analyzing the transmission spectrum of the fabricated
TFBG sensor, they observed that with higher refractive indices, the transmission power

31
decreased linearly as shown in Figure 2-12. Near the leaky configuration (i.e. nSRI ~
1.4532), the transmission spectrum was nearly diminished.
Figure 2-12. Transmission spectrum using TFBG fabricated by Miao et al. [137]
Numerous researchers endeavored to improve the quality of FBG refractive index
sensors by applying more advanced techniques. For instance, modelling and
characterizing of fiber Bragg gratings are investigated by Ugale et al in order to achieve
the maximum reflectivity [128]. Modifications on FBG sensors also improved its
performance. For example, the usage of thinned FBGs is researched for refractive index
sensing because it has been found that reducing cladding diameter led to a non-linear
dependence on surrounding refractive index and effective refractive index, neff [138,
139]. The Figure 2-13 elucidates the difference in sensitivity to the surrounding refractive
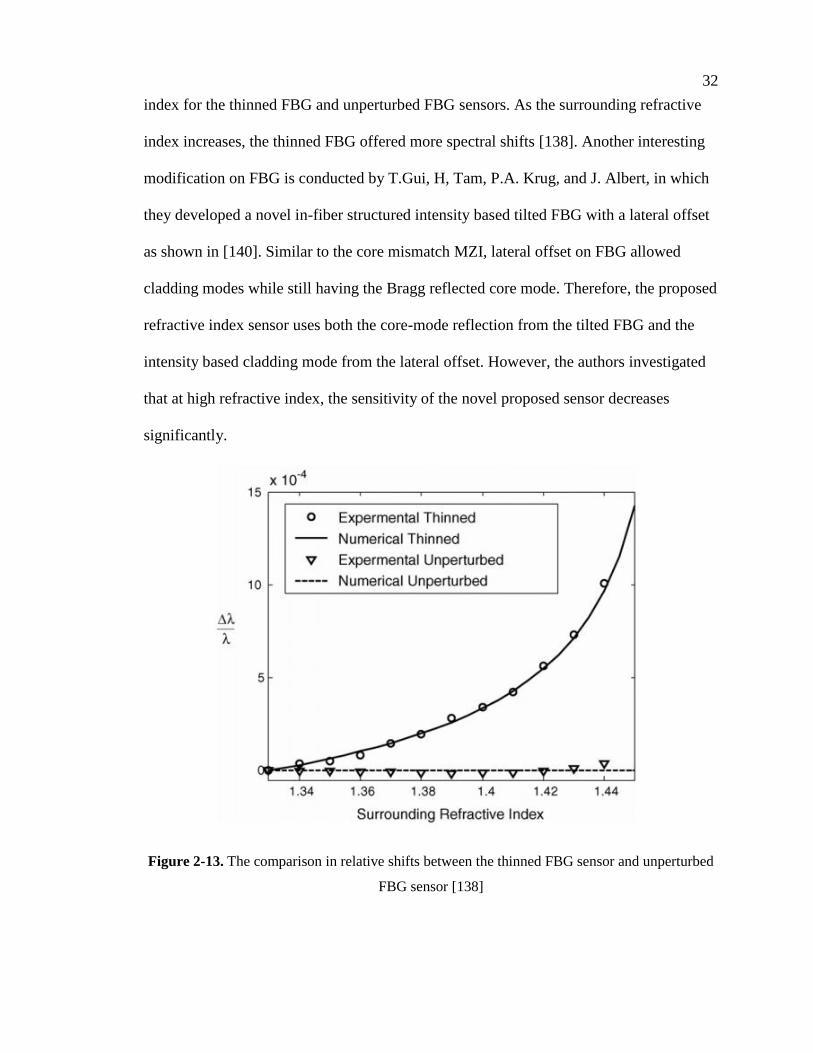
32
index for the thinned FBG and unperturbed FBG sensors. As the surrounding refractive
index increases, the thinned FBG offered more spectral shifts [138]. Another interesting
modification on FBG is conducted by T.Gui, H, Tam, P.A. Krug, and J. Albert, in which
they developed a novel in-fiber structured intensity based tilted FBG with a lateral offset
as shown in [140]. Similar to the core mismatch MZI, lateral offset on FBG allowed
cladding modes while still having the Bragg reflected core mode. Therefore, the proposed
refractive index sensor uses both the core-mode reflection from the tilted FBG and the
intensity based cladding mode from the lateral offset. However, the authors investigated
that at high refractive index, the sensitivity of the novel proposed sensor decreases
significantly.
Figure 2-13. The comparison in relative shifts between the thinned FBG sensor and unperturbed
FBG sensor [138]

33
Figure 2-14. A novel in-fiber structured intensity based tilted fiber Bragg grating sensor with a
lateral offset [140]
FBG sensor on different type of optical fibers are also used as a refractometer. The
effect of microstructures in the FBG optical fibers on the measurement of refractive index
has been studied by M.C. Phan Huy et al. [141]. Two types of microstructures optical
fibers (MOFs, or also known as PCF), which are six hole and two-ring triangular MOF,
are used for the study as shown in Figure 2-15. As seen from Figure 2-16, for the case of
the six hole fiber, the experimental data did not fit with the model but this is because the
core shape of the six hole fiber was not exactly circular when the model assumed that the
core was circular. In case of two-ring triangular fiber, both multiple FBG mode and
single FBG mode agreed well with the theoretical model. Moreover, ear the leaky
configuration (i.e. n ~1.45) both MOF sensors resulted in poor resolution.

34
Figure 2-15. An image of (a) six holes and (b) two-ring triangular photosensitive microstructured
optical fibers [141]
Figure 2-16. The resonance shift versus refractive indices for (a) six holes and (b) two-ring
triangular microstructured optical fibers [141].
A unique refractometer based on a micro-slot in a FBG has been studied in 2007. K.
Zhou and the research group proposed a liquid core waveguide based refractometer
fabricated with a micro slot in a FBG [142]. As illustrated in Figure 2-17, a micro slot is
fabricated across the FBG in order to allow liquid core principle. In this device, a liquid is
used as a core of a waveguide rather than cladding. Therefore, at high liquid refractive
index, the light exists mainly in the liquid, and the neff is determined by the liquid. In
other words, the refractive index higher than cladding could be measured with this
device. K. Zhou and the research group first studied the reflection spectra of Figure
2-18(a) below the refractive index of silica fiber and Figure 2-18(b) above that silica. At
lower ranges of refractive index, only the main Bragg peak is seen. However, as the

35
refractive index becomes higher than 1.45, new reflection peak can be seen as shown in
the arrows. Moreover, the response of Bragg peak to the variation of the refractive index
in terms of the wavelength is as illustrated in Figure 2-18(c). At the low refractive index
regime, the sensitivity is same as the literature. However, as the refractive index becomes
higher, the trend changes significantly. At the high refractive index regime, the slot
initiates to support the propagation modes, which is dependent to the refractive index of
the oil (since more peaks appear in Figure 2-18(b)) and peak is increased. As the
refractive index continues to increase, the peak decreased due to decreasing coupling
from un-etched fiber section. More importantly, a linear relationship is achieved when the
wavelength shift is plotted with the varying refractive index above 1.46 as shown in
Figure 2-18(d). The sensitivity of the device is found to be higher in the high refractive
index region as shown in Figure 2-18(e).
Figure 2-17. A schematic of a liquid core waveguide based refractometer. The slot for liquid
filling can be seen across the fiber Bragg gratings [142].

36
Figure 2-18. Reflection spectrum diagrams of the proposed liquid core waveguide based
refractometer when the refractive index of the oil is (a) below and (b) above the refractive index
of the optical fiber. The arrows in (b) corresponds to the fundamental mode of the liquid core
waveguide and the inset focuses on these peaks. (c) Wavelength shift and change of the intensity
of the main Bragg peak with respect to RI of the oil. (d) Experimental and simulated wavelength
shift of the liquid core FBGs. (e) Sensitivity of the device over the low RI and high RI regime
[142].
2.3.2. Long period grating based refractive index sensors
Since the fiber Bragg gratings offer higher sensitivity to strain and temperature and
require expensive interferometric techniques, which are often a complex process, for
determining wavelength shifts caused by the surrounding refractive index, long period

37
gratings became a fascinating topic for the researchers in measuring the surrounding
refractive index. One of the feature of LPGs is to sense the refractive index of the
surrounding material. This comes from the dependence of the attenuation band
wavelengths on the effective index of refraction of the cladding modes, which is also
dependant to the surrounding refractive index. J.H. Chong et al. have demonstrated a
refractive index sensor in different refractive indices of sugar, ethylene glycol, and salt
solutions, up to refractive index of 1.44, using the long period gratings [143]. As
illustrated on Figure 2-19, the increase in refractive index on all sugar, ethylene glycol,
and salt solutions have led the spectrum to shift to the left (i.e. decreased in wavelength).
Figure 2-19. The transmission profile of LPG in response to (a) sugar solution (b) ethylene
glycol solution (c) salt solution and (d) all three plotted together [143]
The behavior of LPG to the surrounding refractive index after etching has also been
studied. K.S. Chiang and co-investigators have described the shift in the resonance
wavelength of LPG in response to etching of cladding and the change of surrounding

38
refractive index for the first time in 2000 [144]. Although Vasiliev et al. have already
demonstrated that etching the LPG with HF acid led the resonance wavelength of LPG to
shift to longer wavelengths, they did not study the effect of etched LPG to the variations
of surrounding refractive indices [145]. Therefore, K.S. Chiang and the co-investigators
developed analytical formulas for the wavelength shift of etched LPG in response to the
surrounding refractive and verified the accuracy of the data with the numerical
simulations and experimental results as shown in Figure 2-20. K.S. also discovered that
the sensitivity of the variation of the surrounding refractive index increased as the
cladding radius decreased as shown in Figure 2-21.
Figure 2-20. The wavelength shift in response to the surrounding refractive index [144]
39
Figure 2-21. Wavelength shift plotted against the changing of cladding radius by etching [144]
The long period gratings on photonic crystal fiber (PCF) is also used as a sensor to
measure the surrounding refractive index. The core of the PCF is in the form of a missing
air channel in the center of the fiber while the cladding has microstructured array of air
channel running along the fiber axis. Since PCFs allow wide spectrum of design
possibilities form the variation of air channel geometry or lattice structure, the optical
properties not known in typical single mode optical fiber could be investigated. LPG on
PCF has been studied by numerous researchers. J.S. Petrovic et al have theoretically
analyzed that PCF LPG is sensitive to strain and surrounding refractive index [146]. L.
Rindorf et al. used PCF LPG as a refractive index transducer in measuring thickness of
DNA [147]. Different methods are available to fabricate LPG into PCFs, such as UV
imprinting, periodic deformation through CO2 laser, or using the arc discharge [148-152].
In the work of Y. Zhu, Z. He, and H. Du, the authors compared the difference in the
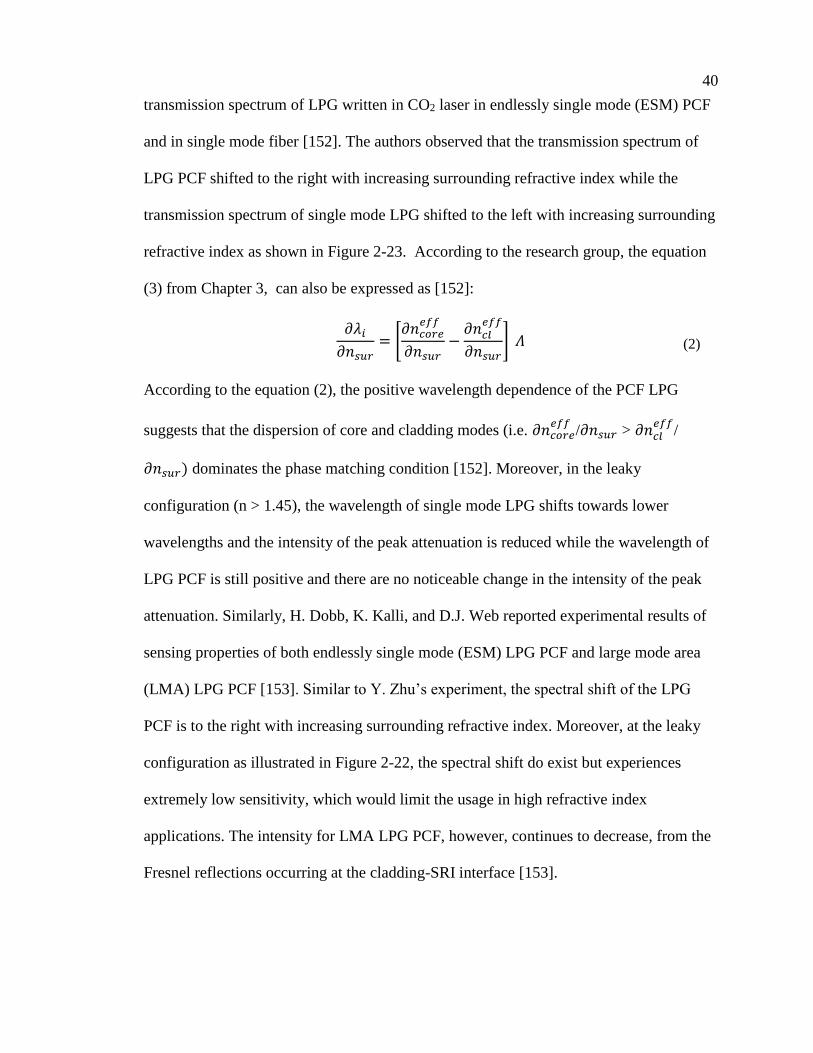
40
transmission spectrum of LPG written in CO2 laser in endlessly single mode (ESM) PCF
and in single mode fiber [152]. The authors observed that the transmission spectrum of
LPG PCF shifted to the right with increasing surrounding refractive index while the
transmission spectrum of single mode LPG shifted to the left with increasing surrounding
refractive index as shown in Figure 2-23. According to the research group, the equation
(3) from Chapter 3, can also be expressed as [152]:
𝜕𝜆𝑖
𝜕𝑛𝑠𝑢𝑟= [
𝜕𝑛𝑐𝑜𝑟𝑒𝑒𝑓𝑓
𝜕𝑛𝑠𝑢𝑟−
𝜕𝑛𝑐𝑙𝑒𝑓𝑓
𝜕𝑛𝑠𝑢𝑟] 𝛬 (2)
According to the equation (2), the positive wavelength dependence of the PCF LPG
suggests that the dispersion of core and cladding modes (i.e. 𝜕𝑛𝑐𝑜𝑟𝑒𝑒𝑓𝑓
/𝜕𝑛𝑠𝑢𝑟 > 𝜕𝑛𝑐𝑙𝑒𝑓𝑓
/
𝜕𝑛𝑠𝑢𝑟) dominates the phase matching condition [152]. Moreover, in the leaky
configuration (n > 1.45), the wavelength of single mode LPG shifts towards lower
wavelengths and the intensity of the peak attenuation is reduced while the wavelength of
LPG PCF is still positive and there are no noticeable change in the intensity of the peak
attenuation. Similarly, H. Dobb, K. Kalli, and D.J. Web reported experimental results of
sensing properties of both endlessly single mode (ESM) LPG PCF and large mode area
(LMA) LPG PCF [153]. Similar to Y. Zhu’s experiment, the spectral shift of the LPG
PCF is to the right with increasing surrounding refractive index. Moreover, at the leaky
configuration as illustrated in Figure 2-22, the spectral shift do exist but experiences
extremely low sensitivity, which would limit the usage in high refractive index
applications. The intensity for LMA LPG PCF, however, continues to decrease, from the
Fresnel reflections occurring at the cladding-SRI interface [153].

41
Figure 2-22. The transmission spectrum of the large mode area LPG PCF in response to high
refractive index [153].
Figure 2-23. The transmission spectrum of (a) LPG PCF, (b) single mode LPG, (c) depicting
wavelength shift with respect to surrounding refractive index and (d) depicting intensity change
with respect to the surrounding refractive index.
The transmission spectrum of LPG in response to the leaky configuration has been
investigated. H. Patrick et al. have experimentally obtained wavelength shift and

42
transmission of 275 um period LPG for refractive index of 1< nSRI < 1.72 [19].
Furthermore, Stegall et al. also have experimented wavelength shift and transmission of
LPG with period 290 um for refractive index of 1 < nSRI < 1.734 [31]. From Figure 2-24,
the wavelength shift of LPG in leaky configuration do exist, but the sensitivity is not
sufficient for use in high refractive index applications. Typical LPG in single mode
optical fibers without any further processing, such as thin film layer coating atop optical
fiber, high refractive index sensing is difficult.
Figure 2-24. Transmission responses of LPG sensor in refractive range of 1<nSRI<1.7 from two
different literature [19, 31]
2.4. Mach-Zehnder Interferometer as refractive index sensor
Mach-Zehnder interferometers (MZI) in many different configurations are widely used
as the refractive index sensor. In all configurations of fiber optic interferometers, the
processes of beam splitting and beam combing are required because the fiber optic
interferometer operates using the interference between the two beams which have
propagated through different optical paths. As a refractive index sensor, it is critical to
have one of the optical paths to be positioned in a way so that the signal can be affected
by the surrounding refractive index. Both intensity based and phase based fiber optic

43
interferometer sensors has been already researched in sensing applications. A phase shift
based refractometer is obtained using a pair of LPG [154]. The first LPG couples the
incident light guided to the core of a single mode fiber to the cladding mode of the fiber.
The coupled cladding mode is again recoupled to the core mode of the fiber by the
second LPG. As shown in Figure 2-25, the transmission wavelength of LPG MZI shifts to
the left (i.e. towards the lower wavelength) as the refractive index increases, similar to
the typical LPG refractive index sensor. However, the sensitivity of LPG MZI is low
compared to the typical LPG. The refractive index sensitivity of MZI is improved by
introducing tapers to MZI. The fiber tapering causes the change in the diameter of the
core mode, and therefore, portions of the core mode couples with the cladding mode. As
shown in Figure 2-25(b), the wavelength of tapered MZI shifts to the left, and having
three tapers improved the refractive index sensitivity. By introducing a taper into LPG-
MZI by J.F. Ding et al., the refractive index sensitivity of the LPG-MZI have been
substantially enhanced.
Figure 2-25. The transmission response of LPG-MZI and tapered LPG-MZI to the variation of
surrounding refractive index and (b) transmission response of taper-MZI to the variation of
surrounding refractive index [154, 155]
44
Having a mismatch in diameter is another configuration of MZI that has the capability
to sense the surrounding refractive index. By splicing a smaller or larger core single
mode fiber to a typical single mode fiber, a core diameter mismatch MZI is configured,
and in this case, the light in the core mode would couple to the cladding mode of the
smaller fiber at the splice point and would recouple with the uncoupled core mode at the
other end of the splice point as shown in Figure 4-3(b). In 2012, Q. Rong and the research
group developed a phase shift based high sensitive refractive index in fiber MZI by
sandwiching a single mode fiber in between two thin-core fibers (TCFs) as illustrated in
Figure 2-26(a) [156]. The wavelength of TCF-SMF-TCF MZI shifted to the right (i.e.
towards higher wavelengths) as it is emerged to the higher surrounding refractive index,
which could be seen from Figure 2-26(b). Also, the shorter length of SMF sandwiched in
between the TCF led to higher sensitivity in comparison to the longer ones. A refractive
index sensor based on core offset has been investigated by Q. Yao et al. [157]. In their
core offset configuration of MZI, FBG is implemented to control the number of cladding
modes in the MZI. As illustrated in Figure 2-27, the amplitude of the measured
transmission intensity decreases with increased refractive index. The phase, on the other
hand, shifts to the right (i.e. increases in wavelength) by 0.4 nm as the surrounding
refractive index increased by 0.025 [157].

45
Figure 2-26. A phase shift based high sensitive refractive index in fiber MZI by Q. Rong and the
research group [156]. (a) A schematic of the diameter mismatch MZI and (b) wavelength shift in
response to varying surrounding refractive index.
Figure 2-27. A refractive index sensor using the core offset MZI configuration by Q. Yao [157].
The refractive index sensing using photonic crystal fibers are prevalently used in the
MZI configuration. PCF is not only used because its microstructure allows a variety of
different configurations, but also is used because PCF sensors survives in the harsh
environments, such as in high temperature and pressure. Therefore, although PCF offers
higher losses compared to single mode fibers, the development of PCF as sensors are
continued. In order to achieve a PCF MZI, PCF must be fusion spliced onto the single
mode fiber. During the fusion splicing, a small segment of PCF collapses, diffracting
some of the core mode light to couple to the cladding mode. A simple and compact PCF
MZI refractive index sensor is developed by R. Jha and co-investigators [158]. The
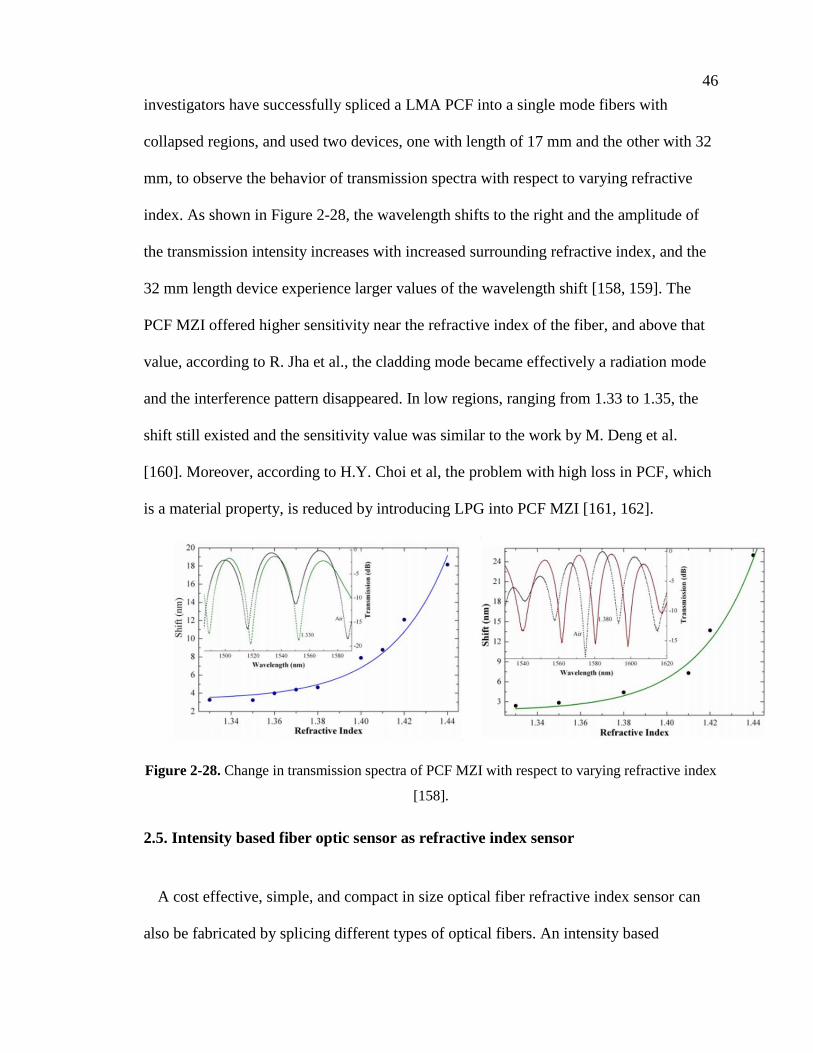
46
investigators have successfully spliced a LMA PCF into a single mode fibers with
collapsed regions, and used two devices, one with length of 17 mm and the other with 32
mm, to observe the behavior of transmission spectra with respect to varying refractive
index. As shown in Figure 2-28, the wavelength shifts to the right and the amplitude of
the transmission intensity increases with increased surrounding refractive index, and the
32 mm length device experience larger values of the wavelength shift [158, 159]. The
PCF MZI offered higher sensitivity near the refractive index of the fiber, and above that
value, according to R. Jha et al., the cladding mode became effectively a radiation mode
and the interference pattern disappeared. In low regions, ranging from 1.33 to 1.35, the
shift still existed and the sensitivity value was similar to the work by M. Deng et al.
[160]. Moreover, according to H.Y. Choi et al, the problem with high loss in PCF, which
is a material property, is reduced by introducing LPG into PCF MZI [161, 162].
Figure 2-28. Change in transmission spectra of PCF MZI with respect to varying refractive index
[158].
2.5. Intensity based fiber optic sensor as refractive index sensor
A cost effective, simple, and compact in size optical fiber refractive index sensor can
also be fabricated by splicing different types of optical fibers. An intensity based

47
refractive index sensor is developed by Joel Villatoro and David Monzon-Hernandez,
using a diameter mismatch [163]. In this case, J. Villatoro and D. Monzon-Hernandez
used a multimode-single mode-multimode (MSM) structure to fabricate the index sensor.
The principle of the structure is similar to MZI, where the propagating core more is
coupling to the cladding mode due to diameter mismatch. However, the SMS or MSM is
differentiated to different section from MZI because there is a new field of study based
on the intensity based and phase shift based SMS or MSM configuration index sensor. In
the MSM index sensor developed by J. Villatoro, the core diameter mismatch is obtained
very economically and simple because all it required is splicing a single mode fiber in
between the two multimode fibers. As illustrated in Figure 2-29, J. Villatoro observed
increase of the amplitude of transmission intensity with the increased surrounding
refractive index. In the leaky configuration (n>1.44), the change in transmission is still
observed.
Figure 2-29. Intensity based transmission spectrum in MSM configuration [163]
A refractive index sensor based on single mode-multimode-single mode (SMS)
configuration has also been investigated. Two research groups, one led by P. Wang and
the other led by Q. Wu, developed a wavelength shift based refractometer by splicing a

48
multimode fiber in between the two single mode fibers [164, 165]. From both studies, the
increase in surrounding refractive index caused the wavelength to shift to the right, as can
be seen from Figure 2-30. Moreover, Q. Wu did analysis on the effect of the multimode
fiber diameter on the sensitivity and discovered that smaller multimode fiber diameter
increased the sensitivity. In both studies, the refractive index sensitivity is higher near the
refractive index of the cladding (n~1.44).
Figure 2-30. Change in wavelength shift with respect to surrounding refractive index [164, 165]
In 2014, a similar type of refractive index sensor to SMS is developed by M. Shao et al.
[166]. The difference of this refractive index sensor to the SMS configuration is that first,
single mode fiber is spliced to the thin cored fiber, which is spliced to the multimode
fiber core at the other end and then spliced back to the single mode fiber resulting a
STMS configuration, as illustrated in Figure 2-31. With a STMS configuration, M. Shao
et al. observed a wavelength shift to the right in the increasing surrounding refractive
index and observed a decrease in intensity with rising surrounding refractive index.
Furthermore, the researchers conducted a parametric study on the length of the thin cored
fiber, length of the multimode fiber core, and the diameter of the multimode fiber core
with the varying surrounding refractive index and discovered that 8 mm LTCF, 15 mm
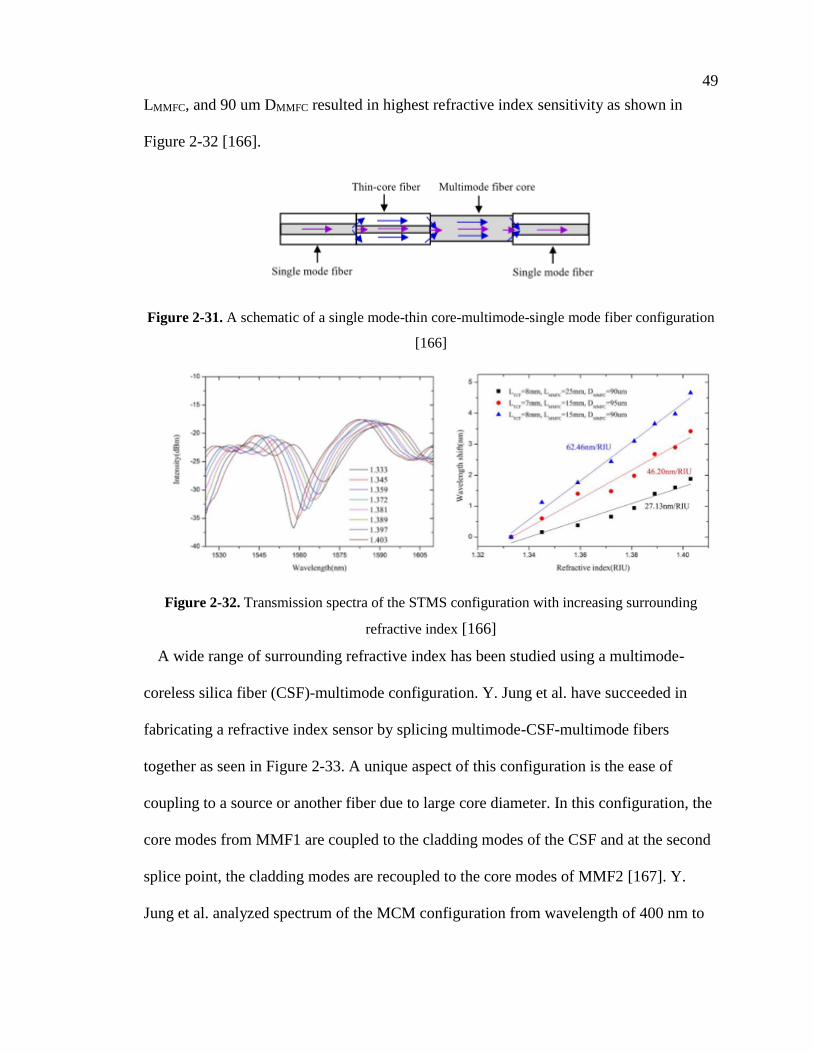
49
LMMFC, and 90 um DMMFC resulted in highest refractive index sensitivity as shown in
Figure 2-32 [166].
Figure 2-31. A schematic of a single mode-thin core-multimode-single mode fiber configuration
[166]
Figure 2-32. Transmission spectra of the STMS configuration with increasing surrounding
refractive index [166]
A wide range of surrounding refractive index has been studied using a multimode-
coreless silica fiber (CSF)-multimode configuration. Y. Jung et al. have succeeded in
fabricating a refractive index sensor by splicing multimode-CSF-multimode fibers
together as seen in Figure 2-33. A unique aspect of this configuration is the ease of
coupling to a source or another fiber due to large core diameter. In this configuration, the
core modes from MMF1 are coupled to the cladding modes of the CSF and at the second
splice point, the cladding modes are recoupled to the core modes of MMF2 [167]. Y.
Jung et al. analyzed spectrum of the MCM configuration from wavelength of 400 nm to

50
1600 nm and categorized into two regions, where region I is from 700 nm to 1100 nm
and region II from 1200 nm to 1450 nm as shown in Figure 2-34. In the region I, Y. Jung
et al. did observed change of intensity with varying refractive index. The researchers
were able to sense change of refractive index using the intensity based MCM
configuration sensor. Interestingly, the sensitivity of the region I for MCM configuration
increased in the leaky mode. In the region II, the wavelength shift behavior with varying
surrounding refractive index was observed. As seen in Figure 2-34, the wavelength shifts
to the right with respect to the surrounding refractive index in the range of 1.30 < nSRI <
1.44. However, in the region II, as soon as the leaky configuration is achieved
(nSRI~1.45), the wavelength shift did not occur and there were no noticeable change in the
region II.
Figure 2-33. The schematic of multimode-coreless-multimode refractive index sensor [167]

51
Figure 2-34. The transmission spectra of the MSM configuration in region I and region II with
varying surrounding refractive index [167]
2.6. High refractive index sensors
As been discussed a number of times, fiber optic refractive index sensor encounters a
decrease in sensitivity when measuring surrounding refractive index that is higher than
that of the cladding (i.e. leaky configuration). In this section, a post process, mainly
coating, on fiber optic sensor to improve sensitivity in leaky configuration has been
reviewed. Since coating of the optical fiber is very complex and is a distinct field of
research, only the basic principles would be discussed in this section. It has been
investigated previously both experimentally and theoretically that LPG’s central
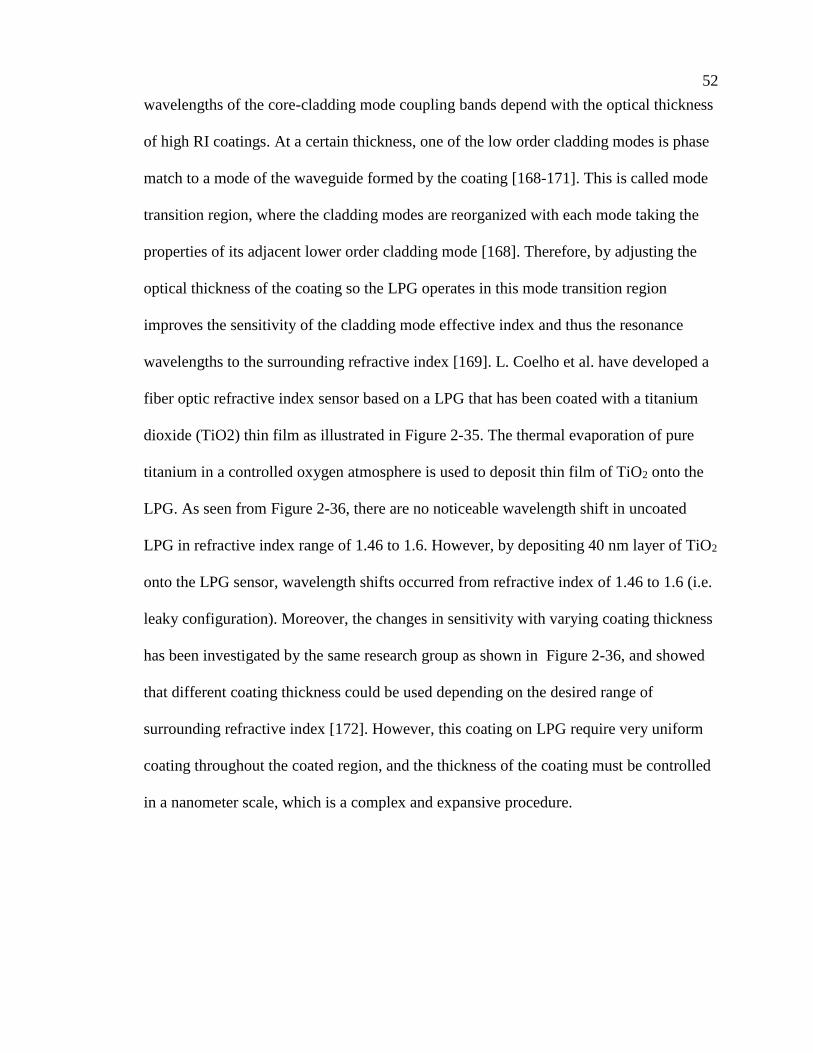
52
wavelengths of the core-cladding mode coupling bands depend with the optical thickness
of high RI coatings. At a certain thickness, one of the low order cladding modes is phase
match to a mode of the waveguide formed by the coating [168-171]. This is called mode
transition region, where the cladding modes are reorganized with each mode taking the
properties of its adjacent lower order cladding mode [168]. Therefore, by adjusting the
optical thickness of the coating so the LPG operates in this mode transition region
improves the sensitivity of the cladding mode effective index and thus the resonance
wavelengths to the surrounding refractive index [169]. L. Coelho et al. have developed a
fiber optic refractive index sensor based on a LPG that has been coated with a titanium
dioxide (TiO2) thin film as illustrated in Figure 2-35. The thermal evaporation of pure
titanium in a controlled oxygen atmosphere is used to deposit thin film of TiO2 onto the
LPG. As seen from Figure 2-36, there are no noticeable wavelength shift in uncoated
LPG in refractive index range of 1.46 to 1.6. However, by depositing 40 nm layer of TiO2
onto the LPG sensor, wavelength shifts occurred from refractive index of 1.46 to 1.6 (i.e.
leaky configuration). Moreover, the changes in sensitivity with varying coating thickness
has been investigated by the same research group as shown in Figure 2-36, and showed
that different coating thickness could be used depending on the desired range of
surrounding refractive index [172]. However, this coating on LPG require very uniform
coating throughout the coated region, and the thickness of the coating must be controlled
in a nanometer scale, which is a complex and expansive procedure.

53
Figure 2-35. A schematic of TiO2 coated LPG refractive index sensor developed by L. Coelho et
al. [172]
Figure 2-36. The effect of TiO2 coating on the measurement of refractive index. The plots on the
right shows the effect of varying thickness [172].
2.7. Conclusion
The measurement devices used for obtaining solubility and diffusivity of gas/SCF in
polymers are expansive, complex, and take a long experimental time. A new potential
solubility and diffusivity measurement sensor has been suggested using in fiber gratings

54
and fiber optic interferometers. In this chapter, most widely used solubility measurement
devices and diffusivity measurement devices reviewed. Then, the refractive index sensors
fabricated by in fiber gratings and in line interferometers are reviewed as well to validate
the feasibility of using fiber optic sensor for the measurement of solubility and diffusivity
of gas/SCF in polymers. Since refractive index of most polymers are higher than the
cladding, the fiber optic refractive index sensors must be capable of operating in leaky
configuration. Therefore, literature reviews on high refractive index sensors are also
included in this Chapter.

55
Chapter 3. Long period grating sensor for measuring high
surrounding refractive index solution
The LPG sensors are one of the most frequently used fiber optic sensor in measuring
refractive indices. As mentioned in Chapter 2, bare LPG sensors cannot be used when the
surrounding refractive index becomes higher than that of the cladding (i.e. the leaky
configuration). Hence, a high refractive index thin layer coating atop the LPG sensor
enables LPG sensors to operate even in the leaky mode. To improve the cost efficiency
and the sensitivity in the leaky mode, especially in the range of 1.48 to 1.55, for the
potential application of measuring solubility and diffusivity in polymers, a new type of
coated LPG sensor has been suggested. The LPG has been grated using the femtosecond
laser, and it is coated with silver nanoparticles using the atomization based coating
system. In this Chapter, the feasibility of silver nanoparticle coated LPG for measuring
solubility of gas/SCF in polymer is tested by experimenting the measurement of
refractive index in the leaky configuration.
3.1. Introduction to long period grating sensor
While FBGs have periods in the order of hundreds of nanometers, long period fiber
gratings (LPG or LPFG) offer periods in the order of 100 micrometers extending to a
millimeter. A typical long period grating schematic is illustrated in Figure 3-1 [17]. Due
to the gratings, the guided core mode couples to the forward propagating cladding modes,
where it is affected by the effect of absorption and scattering. The discovery of LPG, has
captured attentions from numerous researchers and have impacted the development of the
fiber sensing technology. Because coupled light from core mode into forward

56
propagating cladding mode is dependent to the surrounding environmental conditions, the
change in temperature, pressure, or refractive index cause change in the light propagation
properties of the long period gratings. Hence, LPG sensors are widely used by
researchers for different applications. A sample spectrum through LPG sensor can be
seen from Figure 3-2. The peak in the plot changes with respect to the environmental
conditions and therefore makes a very reliable sensor.
Figure 3-1. The schematic of a long period grating sensor [17]
Figure 3-2. A spectrum of the long period grating sensor

57
Different fiber optic sensors exist and they are used in numerous applications for
diverse purposes. As discussed above, in fiber gratings sensor and in line optical fiber
interferometers offer different configurations, and each have ability to sense different
measurand, such as temperature, strain, pressure, and refractive index. This final thesis
mainly focuses on the feasibility of fiber grating sensors and optical fiber interferometer
sensors as the high refractive index sensors because most of the refractive indices of the
polymers are higher than the refractive index of cladding, which is approximately 1.44.
In the LPG refractive index sensing, the main condition for phase matching between
the forward propagating core mode and cladding mode, which is known as phase
matching condition, can be described by the following equation [173]:
𝜆𝑀 = [𝑛𝑒𝑓𝑓𝑐𝑜𝑟𝑒(𝜆) − 𝑛𝑒𝑓𝑓
𝑐𝑙(𝑚)(𝜆)]𝛬𝐿
(3)
where 𝑛𝑒𝑓𝑓𝑐𝑜𝑟𝑒 represents the effective index of the core mode, 𝑛𝑒𝑓𝑓
𝑐𝑙(𝑚) represent the
effective index of the 𝑚𝑡ℎ order cladding mode, and 𝛬𝐿 represent the period of the
grating. Because the cladding interacts with the environment, the cladding modes can
move from the fiber into the environment due to absorption and scatterings. Therefore,
LPGs are used extensively as a tool for refractive index sensing. The coupling of
wavelengths for the fundamental core mode and forward propagating cladding modes, is
the refractive index sensing principle of the LPG sensor. From Equation (3), the coupling
resonant wavelength is a function of the effective indices of the guided core and cladding
modes and the grating period. The effective indices are dependent with the fiber core and
cladding indices and radii. Moreover, the effective indices of the cladding modes are
strongly dependent to the surrounding refractive index (n3). The change in surrounding
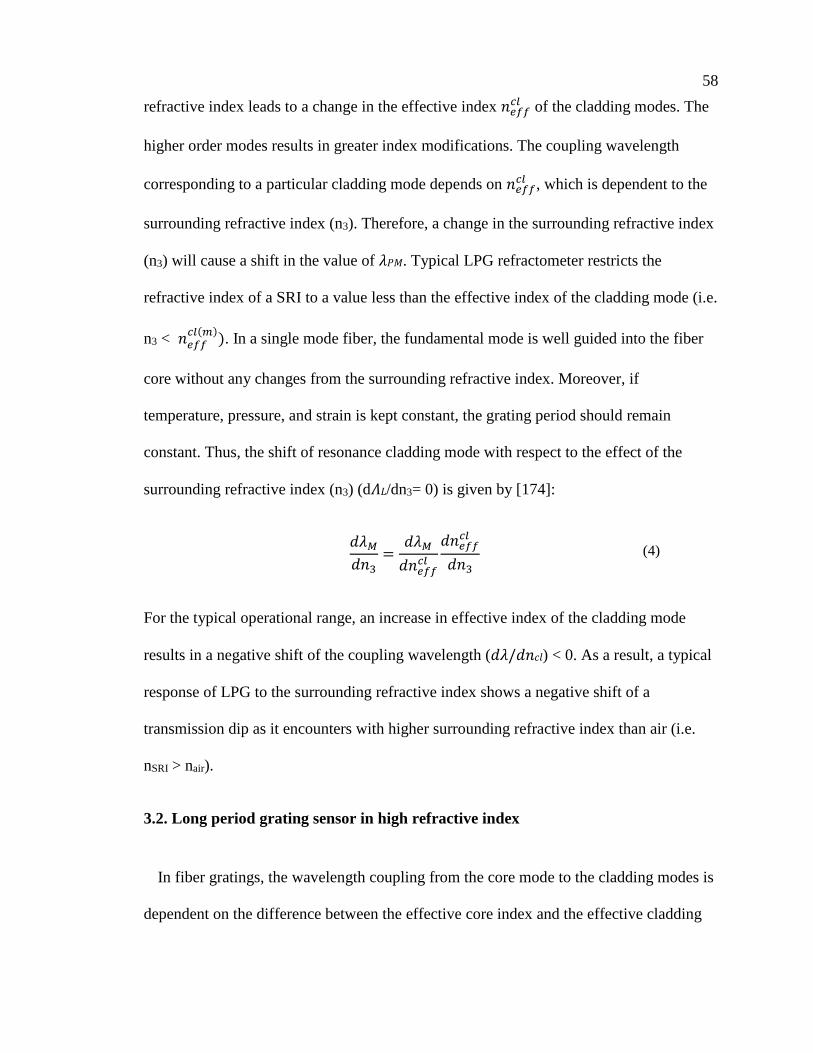
58
refractive index leads to a change in the effective index 𝑛𝑒𝑓𝑓𝑐𝑙 of the cladding modes. The
higher order modes results in greater index modifications. The coupling wavelength
corresponding to a particular cladding mode depends on 𝑛𝑒𝑓𝑓𝑐𝑙 , which is dependent to the
surrounding refractive index (n3). Therefore, a change in the surrounding refractive index
(n3) will cause a shift in the value of 𝜆𝑃𝑀. Typical LPG refractometer restricts the
refractive index of a SRI to a value less than the effective index of the cladding mode (i.e.
n3 < 𝑛𝑒𝑓𝑓𝑐𝑙(𝑚)
). In a single mode fiber, the fundamental mode is well guided into the fiber
core without any changes from the surrounding refractive index. Moreover, if
temperature, pressure, and strain is kept constant, the grating period should remain
constant. Thus, the shift of resonance cladding mode with respect to the effect of the
surrounding refractive index (n3) (d𝛬𝐿/dn3= 0) is given by [174]:
𝑑𝜆𝑀
𝑑𝑛3=
𝑑𝜆𝑀
𝑑𝑛𝑒𝑓𝑓𝑐𝑙
𝑑𝑛𝑒𝑓𝑓𝑐𝑙
𝑑𝑛3
(4)
For the typical operational range, an increase in effective index of the cladding mode
results in a negative shift of the coupling wavelength (𝑑𝜆/𝑑𝑛𝑐𝑙) < 0. As a result, a typical
response of LPG to the surrounding refractive index shows a negative shift of a
transmission dip as it encounters with higher surrounding refractive index than air (i.e.
nSRI > nair).
3.2. Long period grating sensor in high refractive index
In fiber gratings, the wavelength coupling from the core mode to the cladding modes is
dependent on the difference between the effective core index and the effective cladding

59
index, the radii of core and the cladding, and the grating period. Changing any of these
parameters cause shift in the transmission spectrum. According to R. Hou and the co-
investigators, the cladding mode profiles are also sensitive to changes in the surrounding
refractive index at leaky configuration. The published experimental data by H.J. Patrick,
A.D. Kersey, and F. Bucholtz show that LPG both transmission spectrum shifts and
intensity changes due to the effect of Fresnel reflection even in the range of 1.40 to 1.72
despite the fact that sensitivity is extremely low [19]. Although the aforementioned
literature data have not reported any analysis on spectral shifts, Hou and the researchers
have discussed the three cases of nSRI < ncl, nSRI ≈ ncl, and nSRI > ncl, and analyzed the
spectral shift in case of nSRI > ncl using their mathematical model. The simulated data by
Hou and the researchers are shown in Figure 3-3. Cladding modes are most accurate
when calculated using the three-layer model [175] but this is feasible only for the case of
nSRI < neff,cl < ncl. Therefore, the two-layer model is used by Hou and the researchers to
calculate the cladding modes in their simulations, which provided reasonably accurate
values. The two-layer model treats cladding and core as one multimode fiber and the
environment as the new cladding only in the LPG region [27]. In the Figure 3-3, the
wavelength shift in the nonlinear region of 1.475 < nSRI <1.54 is too small to be calculate
probably because of the transition from total internal reflection mode to a leaky
configuration mode. At nSRI = 2.666 the wavelength shifts become +1 nm. Even though
these spectral shifts are very small, they should be able to be measuring using a high
resolution optical spectrum analyser. However, the spectral shifts in the leaky mode is
very small and would still have limitation as a refractive index sensor in the region of the
nSRI > nclad.
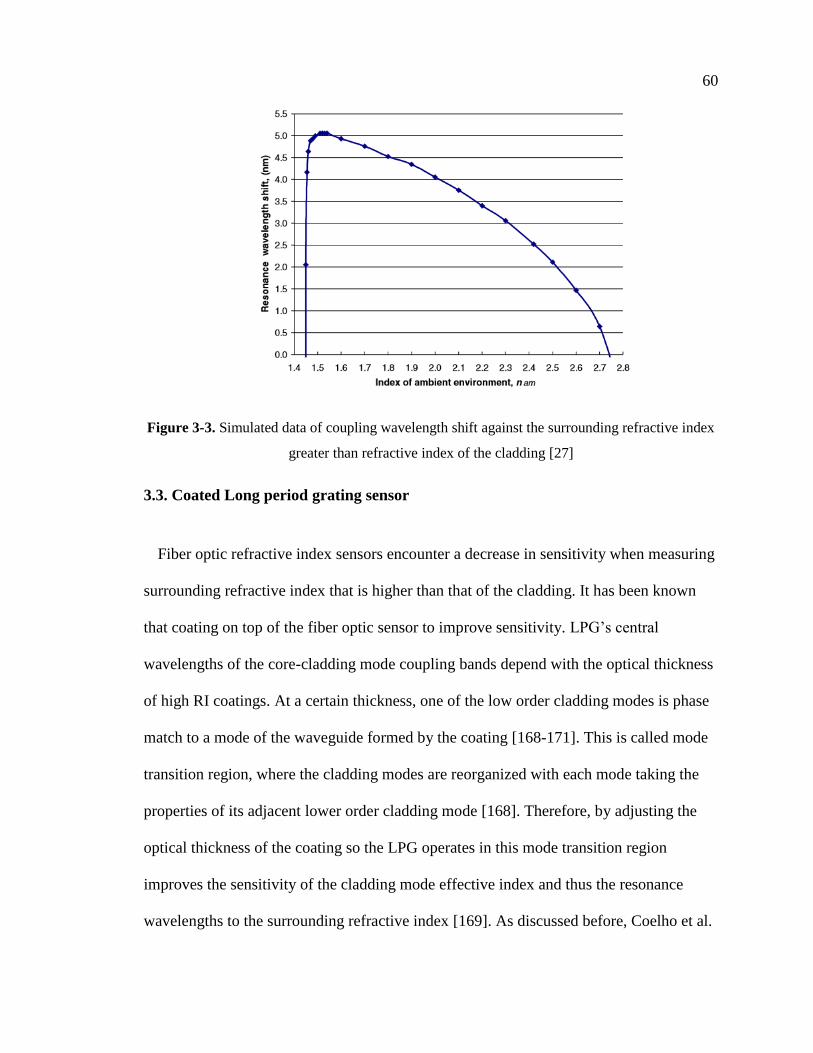
60
Figure 3-3. Simulated data of coupling wavelength shift against the surrounding refractive index
greater than refractive index of the cladding [27]
3.3. Coated Long period grating sensor
Fiber optic refractive index sensors encounter a decrease in sensitivity when measuring
surrounding refractive index that is higher than that of the cladding. It has been known
that coating on top of the fiber optic sensor to improve sensitivity. LPG’s central
wavelengths of the core-cladding mode coupling bands depend with the optical thickness
of high RI coatings. At a certain thickness, one of the low order cladding modes is phase
match to a mode of the waveguide formed by the coating [168-171]. This is called mode
transition region, where the cladding modes are reorganized with each mode taking the
properties of its adjacent lower order cladding mode [168]. Therefore, by adjusting the
optical thickness of the coating so the LPG operates in this mode transition region
improves the sensitivity of the cladding mode effective index and thus the resonance
wavelengths to the surrounding refractive index [169]. As discussed before, Coelho et al.

61
has successfully measured high refractive index using the nanolayer deposition of TiO2
on LPG sensors [172]. Nanoparticle coating on fiber optic sensors has been recently
investigated. The deposition of nanoporous TiO2/Polyion on LPG sensors have been
found to improve sensitivity of glucose solutions in comparison with uncoated LPG
sensors at a thickness of approximately 230 nm [176]. Similarly, the deposition of SiO2
nanoparticles and Au nanoparticles on LPG sensors are researched by Sergiy et al. and
Tang et al., respectively, and observed improvement in the refractive index sensitivity
[169, 177]. In this thesis, the effect of silver nanoparticles on LPG sensor is of interest.
3.4. Fabrication of long period grating sensor using the femtosecond laser
The femtosecond laser (Spectra-Physics ultrafast Ti: Sapphire laser) shown in Figure
3-4, was used to create RI change in the fiber core. The kilohertz ultrafast laser has a
pulse width of 120 femtosecond with the center wavelength of 800 nm. A computer
controlled 4-axis stage was used for aligning and scanning the fiber with laser radiation.
The schematic of experimental setup for the writing long period gratings in a single mode
fiber is illustrated in Figure 3-5. A set of neutral density (ND) filters was used to
primarily tune down the pulse energy. After the ND filters, a computer controlled
variable attenuator was used to set laser output power to the desired amount. A computer
controlled electronic shutter was used for turning on/off the laser beam selectively to
write index in the desired location at the fiber core. To obtain the beam diameter of 1.5
mm, an iris diaphragm was used. Then the laser beam was guided into a microscope and
focused by objective lens (Numerical aperture: o.55) into the core. The fabrication of
gratings with femtosecond pulses were observed through a CCD camera mounted above

62
the dichroic mirror. Fiber jacket was removed using a jacket stripper and was rinsed with
acetone in prior to writing LPGs in the bare fiber. The software, GOL3D was used to
generate scanning path of the laser head. The period of refractive index modulation is 433
µm. In the index modified area, the refractive index was written for a length of 100 µm
using the laser scanning (period: 2 µm) at the speed of 50 µm/sec. 42 periods are
fabricated over 18.186 mm with power of mW. The fiber was coupled with a broad band
light source (AFC BBS-1550) and an optical spectrum analyzer (PHOTONETICS
Walics) to monitor the process [127].
Figure 3-4. (a) The femtosecond laser system and (b) the computer controlled 4-axis stage used
for aligning fiber [127]
Figure 3-5. A schematic of the setting used for fabricating LPG [127]

63
3.5. Silver nano particle deposition using the atomization based coating system
Spray coating of silver nano particles was performed on femtosecond laser grated LPG
sensors. An ultrasonic atomizer was utilized to create a mist of fine droplets. The
ultrasonic atomizer is a very cost efficient method of coating because it converts the
electrical energy into vibrational energy by means of a piezoelectric crystal that generates
standing waves within the liquid layer that is present on its surface. When the amplitude
of waves is increased such that a critical height is attained, the waves become unstable
and fine droplets are detached from the crests and are carried to the nozzle by forcing air
into the enclosed chamber where they are generated. This leads to spray formation, which
achieves high velocity by second air stream flowing through nozzle. The nozzle is
connected to NC based machine to facilitate the coating process. The schematic of the
atomization based coating system is illustrated in Figure 3-6.

64
Figure 3-6. Atomization based coating system.
In this specific work, spray coating was performed with 42 inches per minute of feed
rate at a distance of 13 mm from surface, while the air pressure was 145 kPa. 20 cycles of
spray coating were performed on the LPG sensor. The resulted coating was then sintered
in the furnace at 250 °C for 150 minutes to prevent the coating from wearing off during
the refractive index experiment.
3.6. Experiment setup
Both uncoated and silver nanoparticle coated LPG sensors fabricated from the
femtosecond laser has been tested under high refractive index solutions of 1.4823,

65
1.4944, 1.5094, and 1.5365. The olive oil, with refractive index of 1.458, and the
cinnamon leaf oil, with refractive index of 1.5365, are mixed together to prepare a range
of high refractive index solutions of 1.4823, 1.4944, 1.5094, and 1.5365. Abbe
Refractometer is used for testing the refractive index of the solutions. The schematic of
the experiment is as shown in Figure 3-7. The broad band light source (AFC BBS-1550)
is connected to a FC/APC single mode fiber connecter which is fusion spliced onto a
LPG sensor. The other end of the LPG sensor is fusion spliced to another FC/APC single
mode fiber connector which is connected to the optical spectrum analyzer
(PHOTONETICS Walics). In air, at full configuration, the LPG peaks at 1550 nm with
about -22 dBm. The refractive index solution is introduced the region shown in Figure
3-7. At steady state, the spectrum is saved, and after, the LPG sensor is cleaned and
rinsed with acetone until the original spectrum is obtained in air.
Figure 3-7 A schematic of the refractive index experiment using LPG sensor.
3.7. Behavior of silver nanoparticle coated long period grating sensor at high
refractive index
The change in transmission spectrum of uncoated LPG in refractive index of 1.4944
and 1.5365, which is the refractive index of most polymers, has been observed in the
experiment setup discussed above. As expected, with uncoated LPG, there is no
noticeable wavelength shift from a transmission spectrum with the leaky configuration

66
(surrounding refractive index >1.45). As shown in Figure 3-8, with surrounding refractive
index of 1.5365, the transmission spectrum shows a dip of -9 dBm and at surrounding
refractive index of 1.4944, the transmission spectrum shows a dip of -7 dBm. Only the
amplitude of the transmission power increases by approximately 2dBm with the
refractive index increment of about 0.04.
Figure 3-8. A transmission spectrum for uncoated LPG in the leaky configuration. No noticeable
shift in wavelength is seen.
In order to investigate the effect of silver nanoparticle coating on high surrounding
refractive index, 7 and 20 passes of the silver nanoparticle coating deposited LPG sensor
has been tested in refractive index of 1.4823, 1.4944, 1.5094, and 1.5365. The
transmission spectrum of the 7 passes of coated LPG of coated LPG resulted as shown in
Figure 3-9. For 7 passes of coated LPG, no visible wavelength shifts occurred, similar to
the uncoated LPG. Only the transmission intensity changed from -4 dBm, -4.5 dBm, -
6.5dBm, and -7.5 dBm for refractive indices of 1.4823, 1.4944, 1.5094, and 1.5365,

67
respectively. After deposition of thin layers of silver nanoparticles, the transmission dip
decreased by about 3 dBm.
Figure 3-9. A transmission spectrum for 7 passes of silver nanoparticle coating deposited LPG in
the leaky configuration. No noticeable shift in wavelength is seen.
Interestingly, when 20 passes of silver nanoparticle is deposited to LPG sensor, the
wavelength shifted to the left with increasing value of surrounding refractive index. As
shown in Figure 3-10, about 0.7 nm wavelength shift occurred in refractive index ranges
of 1.4823 to 1.4944, 0.3 nm from 1.4944 to 1.5094, and about 0.3 nm shifts has been
observed from 1.5094 to 1.5365. There was approximately an overall wavelength shift of
1.3 nm towards to shorter wavelengths (i.e. shift to the left), which corresponds with the
literature, from surrounding refractive index range of 1.4823 to 1.5365. This value of
wavelength shift is significant considering back to the Figure 3-3, where no significant
wavelength shifts has occurred in the simulated transmission spectrum of LPG sensor in
leaky configuration. In case of the transmission intensity, not much change has occurred,
and the transmission dip plateaued out at 7.5 dBm. If sensitivity could be optimized

68
further with coating, the silver nanoparticle coated LPG sensors could be feasible for
obtaining solubility and diffusivity of gas/SCF in polymers.
Figure 3-10. About 0.7 nm wavelength shift occurred in refractive index ranges of 1.4823 to
1.4944, 0.3 nm from 1.4944 to 1.5094, and 0.3 nm from 1.5094 to 1.5365.
3.8. Conclusion
The behavior of femtosecond laser written LPG sensor in high refractive index has
been investigated through a series of experiments. The cost efficient coating method
based on the atomization coating system is implemented to deposit thin layers of the
silver nanoparticle to the LPG sensor. The first test is done with uncoated LPG, which
showed no noticeable wavelength shift. Similarly, 7 passes of silver nanoparticle coated
LPG did not have any wavelength shifts. However, with 20 passes of silver nanoparticle
coating on the LPG sensor, the transmission spectrum shifted towards shorter wavelength
with increasing wavelength. From the refractive index of 1.4823 to 1.5365,

69
approximately 1.3 nm wavelength shifted to the left. This is significant because the
wavelength shift occurred in the leaky configuration, where the total internal reflection is
lost in the propagation mode. With further optimization with the coatings, the silver
nanoparticle coated LPG could be used as a simple and cost efficient method to measure
solubility and diffusivity of gas/SCF in polymers.
70
Chapter 4. Coated Mach-Zehnder Interferometer for measuring
high surrounding refractive index solution
The numerous investigations on Mach-Zehnder interferometers as refractive index
sensors in different configurations have been conducted by many researchers, as
mentioned in Chapter 2. In MZI, the optical path differences between two modes, one
reference arm and the other sensing arm, in the optical fiber eventually recombines and
gives different interference patterns with the environment. In this Chapter, attempts to
sense the refractive index in the range of 1.48 to 1.55, for the potential application of
measuring solubility and diffusivity in polymers, has been made using a smaller core
MZI configuration, PCF MZI, and silver nanoparticle coated PCF MZI configuration.
The same atomization based coating system used for coating LPG was utilized to deposit
thin layers of silver nanoparticles. The validity of the aforementioned MZI for measuring
solubility of gas/SCF in polymers is tested by sensing for the measurement of refractive
index in the leaky configuration.
4.1 Mach-Zehnder interferometer sensor
The fiber optic interferometric sensors offer distinctive properties such as a miniature
sized configuration, immunity to electromagnetic wave, and high sensitivity detection.
Therefore, interferometric sensors have become popular over conventional sensors for
applications such as environmental monitoring [127]. In-fiber Mach-Zehnder
interferometers, in particular, offer high sensitivity not only to temperature, strain and
pressure, but also to surrounding refractive index changes. In all types of fiber optic
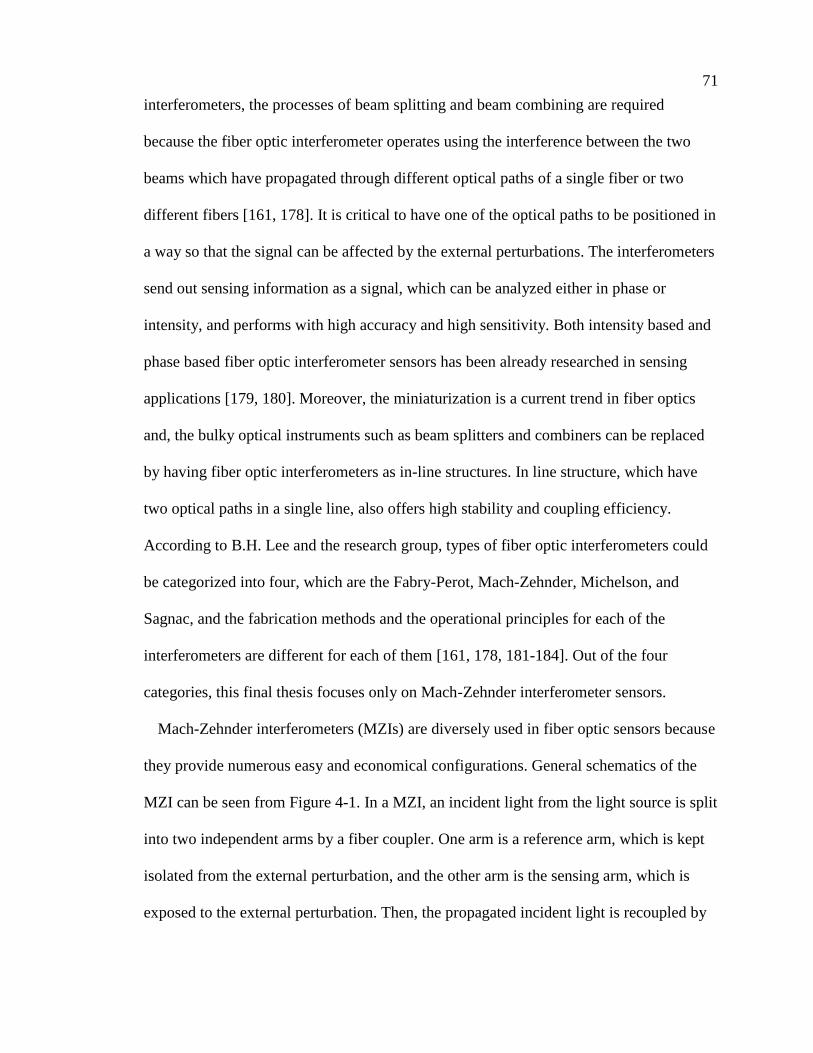
71
interferometers, the processes of beam splitting and beam combining are required
because the fiber optic interferometer operates using the interference between the two
beams which have propagated through different optical paths of a single fiber or two
different fibers [161, 178]. It is critical to have one of the optical paths to be positioned in
a way so that the signal can be affected by the external perturbations. The interferometers
send out sensing information as a signal, which can be analyzed either in phase or
intensity, and performs with high accuracy and high sensitivity. Both intensity based and
phase based fiber optic interferometer sensors has been already researched in sensing
applications [179, 180]. Moreover, the miniaturization is a current trend in fiber optics
and, the bulky optical instruments such as beam splitters and combiners can be replaced
by having fiber optic interferometers as in-line structures. In line structure, which have
two optical paths in a single line, also offers high stability and coupling efficiency.
According to B.H. Lee and the research group, types of fiber optic interferometers could
be categorized into four, which are the Fabry-Perot, Mach-Zehnder, Michelson, and
Sagnac, and the fabrication methods and the operational principles for each of the
interferometers are different for each of them [161, 178, 181-184]. Out of the four
categories, this final thesis focuses only on Mach-Zehnder interferometer sensors.
Mach-Zehnder interferometers (MZIs) are diversely used in fiber optic sensors because
they provide numerous easy and economical configurations. General schematics of the
MZI can be seen from Figure 4-1. In a MZI, an incident light from the light source is split
into two independent arms by a fiber coupler. One arm is a reference arm, which is kept
isolated from the external perturbation, and the other arm is the sensing arm, which is
exposed to the external perturbation. Then, the propagated incident light is recoupled by
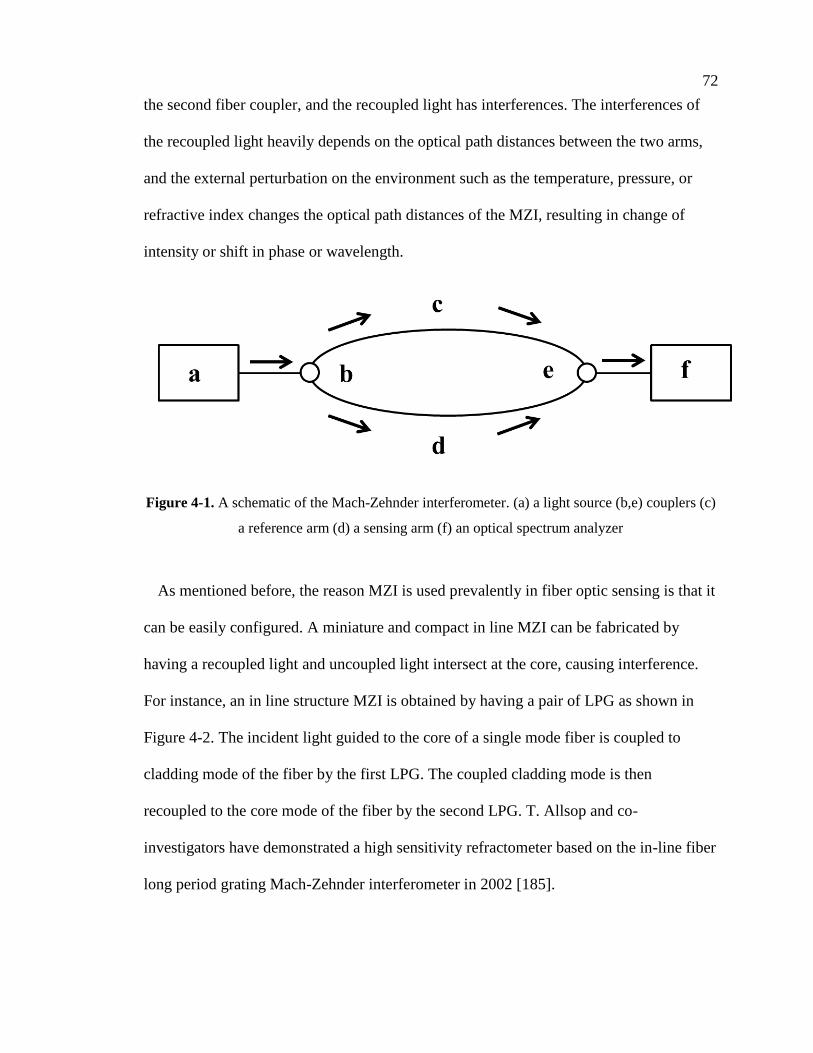
72
the second fiber coupler, and the recoupled light has interferences. The interferences of
the recoupled light heavily depends on the optical path distances between the two arms,
and the external perturbation on the environment such as the temperature, pressure, or
refractive index changes the optical path distances of the MZI, resulting in change of
intensity or shift in phase or wavelength.
Figure 4-1. A schematic of the Mach-Zehnder interferometer. (a) a light source (b,e) couplers (c)
a reference arm (d) a sensing arm (f) an optical spectrum analyzer
As mentioned before, the reason MZI is used prevalently in fiber optic sensing is that it
can be easily configured. A miniature and compact in line MZI can be fabricated by
having a recoupled light and uncoupled light intersect at the core, causing interference.
For instance, an in line structure MZI is obtained by having a pair of LPG as shown in
Figure 4-2. The incident light guided to the core of a single mode fiber is coupled to
cladding mode of the fiber by the first LPG. The coupled cladding mode is then
recoupled to the core mode of the fiber by the second LPG. T. Allsop and co-
investigators have demonstrated a high sensitivity refractometer based on the in-line fiber
long period grating Mach-Zehnder interferometer in 2002 [185].
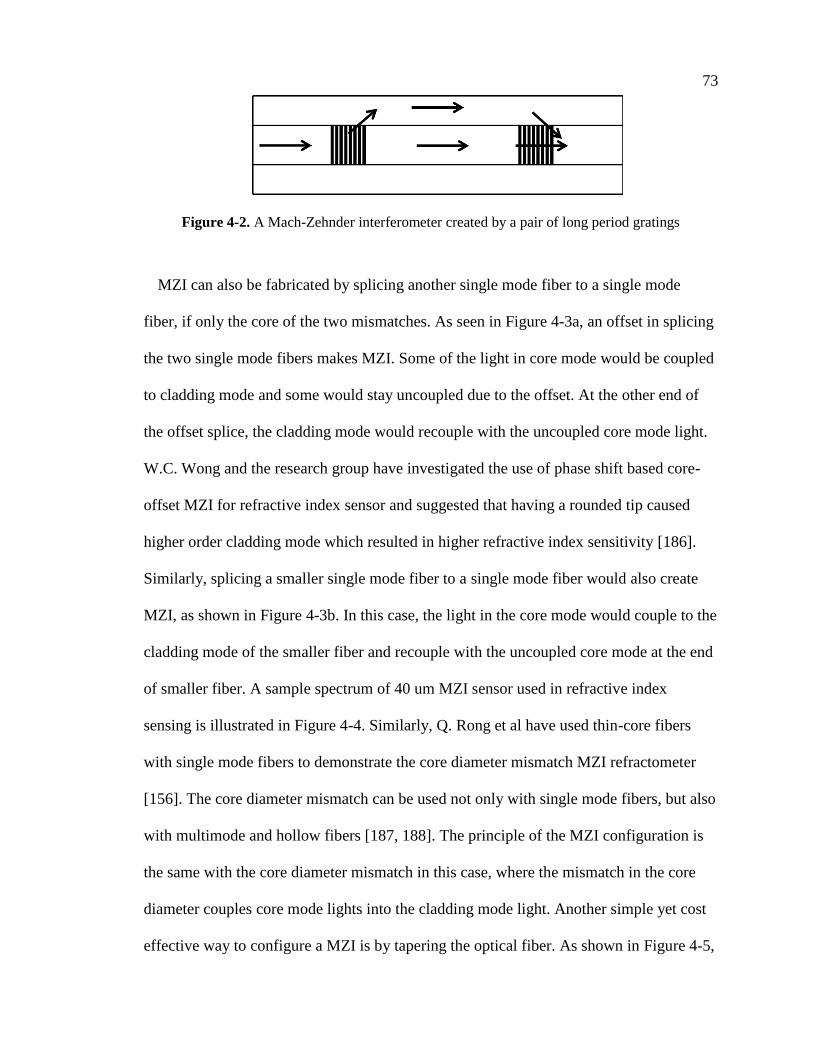
73
Figure 4-2. A Mach-Zehnder interferometer created by a pair of long period gratings
MZI can also be fabricated by splicing another single mode fiber to a single mode
fiber, if only the core of the two mismatches. As seen in Figure 4-3a, an offset in splicing
the two single mode fibers makes MZI. Some of the light in core mode would be coupled
to cladding mode and some would stay uncoupled due to the offset. At the other end of
the offset splice, the cladding mode would recouple with the uncoupled core mode light.
W.C. Wong and the research group have investigated the use of phase shift based core-
offset MZI for refractive index sensor and suggested that having a rounded tip caused
higher order cladding mode which resulted in higher refractive index sensitivity [186].
Similarly, splicing a smaller single mode fiber to a single mode fiber would also create
MZI, as shown in Figure 4-3b. In this case, the light in the core mode would couple to the
cladding mode of the smaller fiber and recouple with the uncoupled core mode at the end
of smaller fiber. A sample spectrum of 40 um MZI sensor used in refractive index
sensing is illustrated in Figure 4-4. Similarly, Q. Rong et al have used thin-core fibers
with single mode fibers to demonstrate the core diameter mismatch MZI refractometer
[156]. The core diameter mismatch can be used not only with single mode fibers, but also
with multimode and hollow fibers [187, 188]. The principle of the MZI configuration is
the same with the core diameter mismatch in this case, where the mismatch in the core
diameter couples core mode lights into the cladding mode light. Another simple yet cost
effective way to configure a MZI is by tapering the optical fiber. As shown in Figure 4-5,

74
the fiber tapering causes the change in the diameter of the core mode, and therefore,
portions of the core mode couples with the cladding mode. However, due to the fiber
tapering, the tapered MZI becomes very fragile near the taper. Tapering can be
implemented with different types of MZIs and even with in fiber gratings [18, 154, 189-
194].
Figure 4-3. A schematic of (a) core mismatch and (b) small single mode fiber Mach-Zehnder
interferometer
Figure 4-4. A sample spectrum of 40 um Mach-Zehnder interferometer sensor
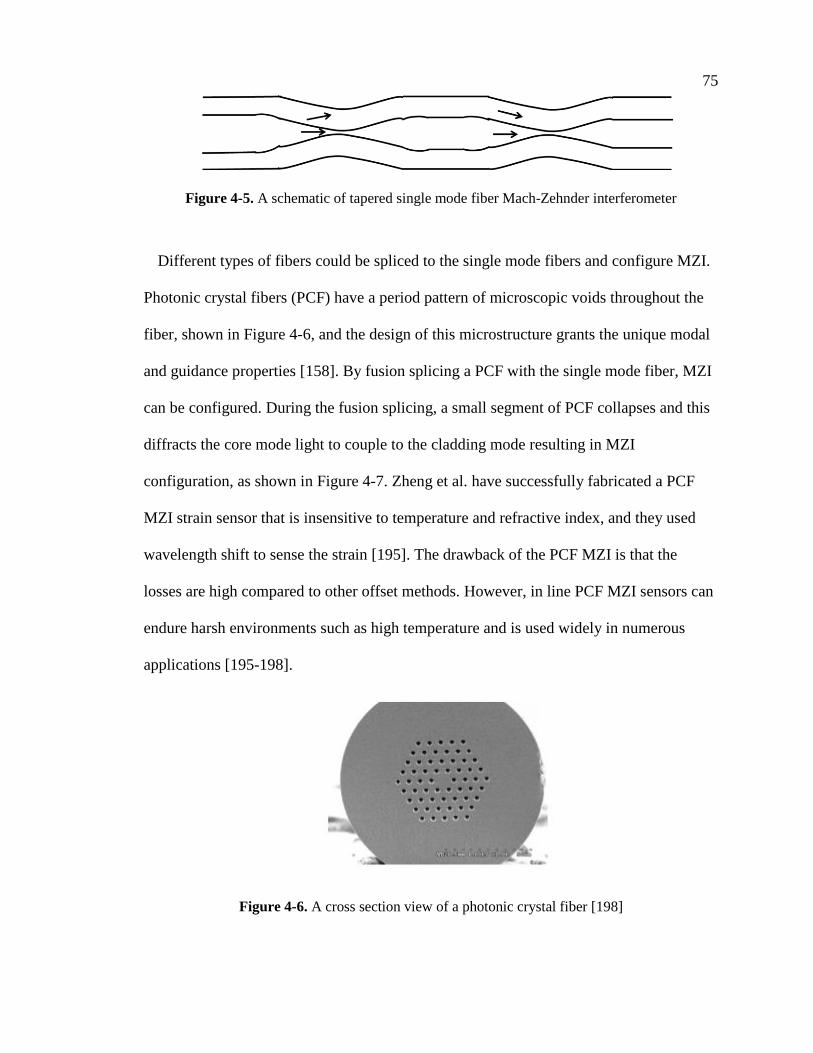
75
Figure 4-5. A schematic of tapered single mode fiber Mach-Zehnder interferometer
Different types of fibers could be spliced to the single mode fibers and configure MZI.
Photonic crystal fibers (PCF) have a period pattern of microscopic voids throughout the
fiber, shown in Figure 4-6, and the design of this microstructure grants the unique modal
and guidance properties [158]. By fusion splicing a PCF with the single mode fiber, MZI
can be configured. During the fusion splicing, a small segment of PCF collapses and this
diffracts the core mode light to couple to the cladding mode resulting in MZI
configuration, as shown in Figure 4-7. Zheng et al. have successfully fabricated a PCF
MZI strain sensor that is insensitive to temperature and refractive index, and they used
wavelength shift to sense the strain [195]. The drawback of the PCF MZI is that the
losses are high compared to other offset methods. However, in line PCF MZI sensors can
endure harsh environments such as high temperature and is used widely in numerous
applications [195-198].
Figure 4-6. A cross section view of a photonic crystal fiber [198]
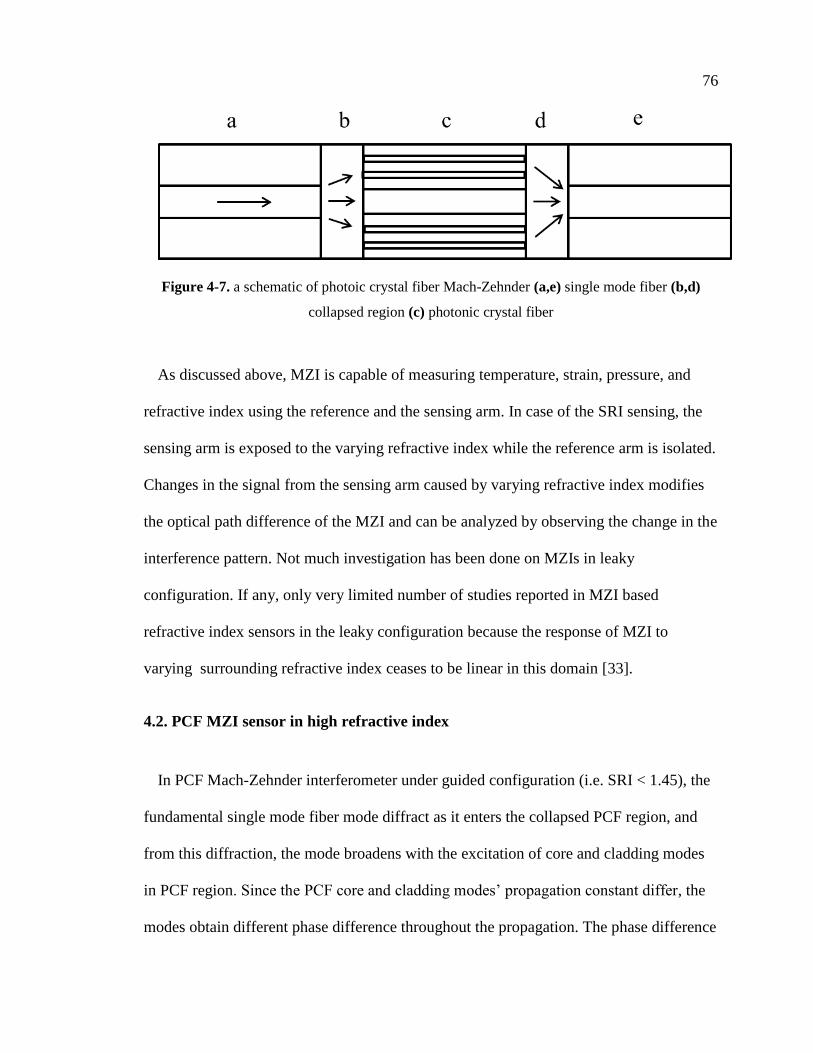
76
Figure 4-7. a schematic of photoic crystal fiber Mach-Zehnder (a,e) single mode fiber (b,d)
collapsed region (c) photonic crystal fiber
As discussed above, MZI is capable of measuring temperature, strain, pressure, and
refractive index using the reference and the sensing arm. In case of the SRI sensing, the
sensing arm is exposed to the varying refractive index while the reference arm is isolated.
Changes in the signal from the sensing arm caused by varying refractive index modifies
the optical path difference of the MZI and can be analyzed by observing the change in the
interference pattern. Not much investigation has been done on MZIs in leaky
configuration. If any, only very limited number of studies reported in MZI based
refractive index sensors in the leaky configuration because the response of MZI to
varying surrounding refractive index ceases to be linear in this domain [33].
4.2. PCF MZI sensor in high refractive index
In PCF Mach-Zehnder interferometer under guided configuration (i.e. SRI < 1.45), the
fundamental single mode fiber mode diffract as it enters the collapsed PCF region, and
from this diffraction, the mode broadens with the excitation of core and cladding modes
in PCF region. Since the PCF core and cladding modes’ propagation constant differ, the
modes obtain different phase difference throughout the propagation. The phase difference
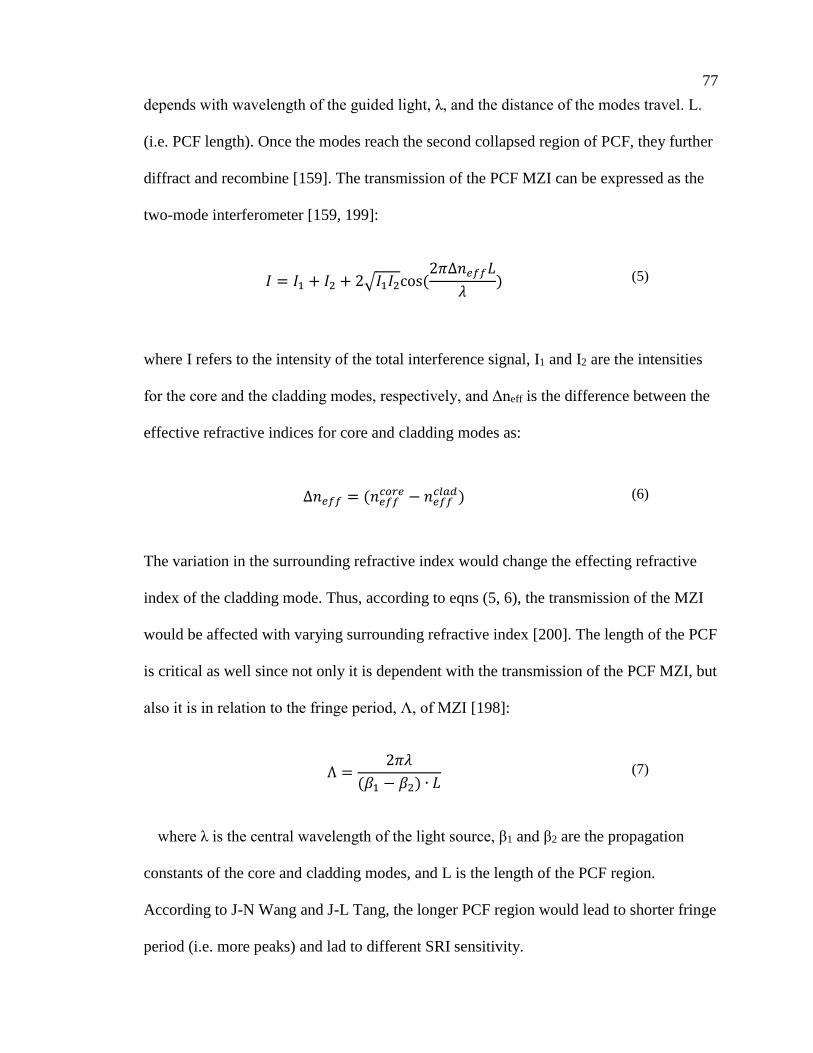
77
depends with wavelength of the guided light, λ, and the distance of the modes travel. L.
(i.e. PCF length). Once the modes reach the second collapsed region of PCF, they further
diffract and recombine [159]. The transmission of the PCF MZI can be expressed as the
two-mode interferometer [159, 199]:
𝐼 = 𝐼1 + 𝐼2 + 2√𝐼1𝐼2cos (2𝜋∆𝑛𝑒𝑓𝑓𝐿
𝜆)
(5)
where I refers to the intensity of the total interference signal, I1 and I2 are the intensities
for the core and the cladding modes, respectively, and Δneff is the difference between the
effective refractive indices for core and cladding modes as:
∆𝑛𝑒𝑓𝑓 = (𝑛𝑒𝑓𝑓𝑐𝑜𝑟𝑒 − 𝑛𝑒𝑓𝑓
𝑐𝑙𝑎𝑑)
(6)
The variation in the surrounding refractive index would change the effecting refractive
index of the cladding mode. Thus, according to eqns (5, 6), the transmission of the MZI
would be affected with varying surrounding refractive index [200]. The length of the PCF
is critical as well since not only it is dependent with the transmission of the PCF MZI, but
also it is in relation to the fringe period, Ʌ, of MZI [198]:
Ʌ =2𝜋𝜆
(𝛽1 − 𝛽2) ∙ 𝐿
(7)
where λ is the central wavelength of the light source, β1 and β2 are the propagation
constants of the core and cladding modes, and L is the length of the PCF region.
According to J-N Wang and J-L Tang, the longer PCF region would lead to shorter fringe
period (i.e. more peaks) and lad to different SRI sensitivity.
78
Once the MZI sensor becomes in the leaky configuration, the operation of the
interferometer changes. According to O. Duhem et al, the surrounding refractive index
higher than the cladding allows a part of energy to be reflected at the interface of external
medium and cladding and the other part of energy to be lost by Fresnel refraction. Fresnel
reflection becomes the main source for the leaky cladding modes and transforms the
guided cladding modes to leaky mode. O. Duhem et al. accounted for Fresnel losses by
considering that only γ of the coupled power is present at the end of the MZI region [34]:
𝛾 = exp [−𝑚𝑇𝐿]
(8)
where m is the number of Fresnel reflections per unity of length, T is the Fresnel
transmission coefficient, and L is the length of the MZI region.
In leaky mode configuration, the effective index of the leaky mode becomes a complex
number where real parts represent modal phase information in propagation and imaginary
parts represent modal attenuation. When surrounding refractive index changes in leaky
mode, the real part of the effective index for the leaky mode almost keeps constant, and
the imaginary part of the effective index changes [32]. Therefore, in the leaky mode
configuration, or at regions of refractive index greater than cladding, the transmission
intensity of the MZI sensors should be investigated. The leaky mode interference in the
cladding mode of MZI can be approximated using the quasi-leaky mode mentioned by
Yang et. Al [31]. Quasi-leaky mode is an equivalent closed numerical model that can be
used to represent radiation modes in open leaky waveguides [31]. Assuming that the
single mode fiber and the leaky mode region are perfectly aligned, the modes are
sufficient in the field expansion in the following investigation. At z = 0, which is the first

79
interface of single mode fiber and the leaky mode region, the electrical field can be
expanded in terms of equivalent leaky modes in the leaky mode region:
𝐸𝑖𝑛 = ∑ 𝜂𝑚𝐸𝑚
𝑚
(9)
where Ein is the electrical field of the fundamental mode from input single mode fiber, Em
is the mth leaky mode in leaky mode region, and ηm is the excitation coefficient of mth
leaky mode which can also be used as:
𝜂𝑚 =∫ 𝐸𝑖𝑛 ∙ 𝐸𝑚𝑑𝑠
∫ 𝐸𝑚 ∙ 𝐸𝑚𝑑𝑠
(10)
As the electrical field in leaky mode region is caused by the modal interference of all the
excited leaky modes with different propagation constants, at the certain distance z, it is:
𝐸(𝑧) = ∑ 𝜂𝑚𝐸𝑚𝑒𝑖𝛽𝑚𝑧𝑒−𝛼𝑚𝑧
𝑚
(11)
where β and α are phase constant and attenuation constant of mth excited leaky mode in
leaky mode region. At z = Length of leaky mode region (i.e. second interface between
leaky mode region and single mode fiber, or at the second splice point), the coupling of
leaky mode region and guided single mode fiber is established, and its normalized output
intensity can be approximated by:
𝐸𝑇𝑜𝑢𝑡 10𝑙𝑜𝑔10 (|∫ 𝐸(𝐿) ∙ 𝐸𝑜𝑢𝑡𝑑𝑠|2
|∫ 𝐸(𝐿)|2𝑑𝑠 ∫|𝐸𝑜𝑢𝑡|2𝑑𝑠) (𝑑𝐵)
(12)
80
where Eout is the electrical field of the fundamental mode in the output single mode fiber,
which should equal Ein if the input and output have use same single mode fiber.
4.3. Effect of coating on PCF MZI
As mentioned earlier in the Chapter, in the PCF MZI, effective refractive index of the
cladding mode in the PCF is sensitive to the surrounding refractive index in the
evanescent field where this cladding mode extends to. Recently, it has already been
studied that sensitivity of the PCF MZI refractive index sensors can be significantly
enhanced by applying a thin layer of coating with a material that has greater refractive
index than silica. The coating atop PCF region would shift the cladding mode’s light
distribution to near the cladding-SRI interface, which would result in an increase of the
energy density in this region [201, 202]. From the increase of energy density at the PCF
cladding-SRI interface, the intensity of the evanescent wave also increases, and thus
increasing the refractive index sensitivity. It is known that the coating thickness and
refractive index of coating is critically related with the PCF MZI sensitivity. In case of
thickness, the thickness of the coating in tens of nanometer, which is very difficult and
expansive to achieve, affects the sensitivity.
In this final thesis, the coating of nanoparticles on the fiber optics is an interest.
According to Urrutia et al. in their review paper in regards to nanoparticle coating with
fiber optic sensors mentioned that usage of nanoparticle coatings on MZI sensors are not
very common [203]. Therefore, the effect, if any, of silver nanoparticle coating on PCF
MZI would be investigated in this Chapter.

81
4.4. Fabrication of MZI refractive index sensors
All the MZI refractive index sensors used for the experiments were fabricated using the
splicing technique. The Fujikura (FSM 40PM) fusion splicer, shown in Figure 4-8, was used
for all splicing operations. For the fabrication of 40 um microfiber MZI, the standard single
mode fiber was spliced with a 40 um microfiber with an arc power of 10 bit exposed for 1000
milliseconds. For the fabrication of PCF MZI, the fusion splicer was used to splice standard
single mode fiber to a PCF with an arc power of 10 bit exposed for 1500 millisecond. As
illustrated in Figure 4-9, the splicing created the collapsed region, which allows the core
mode to diffract to the cladding modes, in the PCF portion. The length of PCF for the
PCF MZI was 16 mm. The PCF used for MZI fabrication is the endlessly single mode
LMA PCF (NKT Photonics A/S) as shown in Figure 4-10.
Figure 4-8. Fujikura FSM 40PM fusion splicer used for all splicing operations.
Figure 4-9. A schematic of a single mode fiber spliced to the photonic crystal fiber using
Fujikura FSM 40PM fusion splicer.

82
Figure 4-10. Endlessly single mode LMA PCF used for MZI configuration.
4.5. Experiment setup
Different MZI sensors are used to sense in high refractive index from 1.4823 to 1.5365,
similar to the Chapter 3. The 40 um microfiber MZI, uncoated PCF MZI, and silver
nanoparticle coated MZI are fabricated and are used for high refractive index sensing as
shown in Figure 4-11. The broad band light source (AFC BBS-1550) is connected to a
FC/APC single mode fiber connecter which is fusion spliced onto a MZI sensor. The
other end of the MZI sensor is fusion spliced to another FC/APC single mode fiber
connector which is connected to the optical spectrum analyzer (PHOTONETICS Walics).
Each MZI sensor has two fusion splices on the joints of PCF or 40 um micro fiber with
single mode fibers. Once all configuration has been setup, the transmission spectrum at
air is marked as reference point. Then, the high refractive index solution is introduced to
the regions shown in the schematic. Once the change in the spectrum has been saved, the
refractive index solution is washed away, and the MZI is cleaned and rinsed with acetone
until the reference spectrum is achieved in air.

83
Figure 4-11. A schematic of refractive index experiment using MZI sensors
4.6. 40 um MZI at high index
Similar to the LPG refractive index configuration, the transmission spectrum of 40 um
microfiber MZI has been observed using an optical spectrum analyzer (OSA) and a light
source. When MZI was connected to the optical spectrum analyzer, multiple peaks could
be seen in air, with transmission peaks having a value of about 5 dBm, as shown in
Figure 4-12. To test how the 40 um microfiber MZI behaves in refractive index below the
cladding (i.e. guided mode), the sensor was put in tap water, which has refractive index
of about 1.3. In water, the transmission peaks shifted to the left to the lower wavelength.
The intensity of the transmission dip decreased by approximately 0.5 dBm. A clear shift
to the left verified the fact the 40 um MZI functions properly as a refractive index sensor
in index regions below the cladding. However, when the sensor was inserted to a solution
with high refractive index (i.e. leaky mode), the intensity of the peaks substantially
decreased as shown in Figure 4-13. The intensity of the transmission dip has decreased to
about 1 dBm, and no visible wavelength shifts have occurred as shown in Figure 4-14.
Moreover, no visible trend in transmission intensity is seen as well. This experiment has
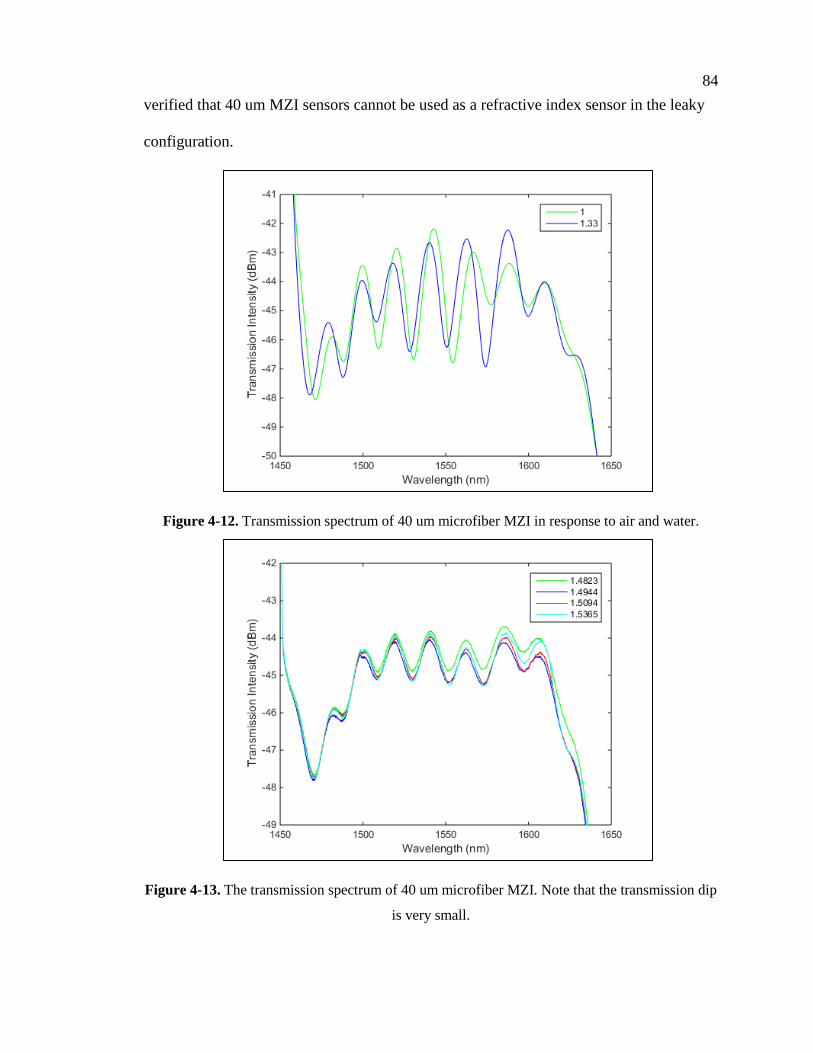
84
verified that 40 um MZI sensors cannot be used as a refractive index sensor in the leaky
configuration.
Figure 4-12. Transmission spectrum of 40 um microfiber MZI in response to air and water.
Figure 4-13. The transmission spectrum of 40 um microfiber MZI. Note that the transmission dip
is very small.

85
Figure 4-14. The transmission spectrum of 40 um microfiber MZI. No noticeable shift has been
observed.
4.7. PCF MZI at high surrounding refractive index
The transmission spectrum of PCF MZI in response to a variation in surrounding
refractive index greater than cladding has been observed through OSA and a light source.
First, the transmission wavelength shifts has been observed in the tap water, which has
refractive index about 1.3. Unlike the 40 um microfiber MZI sensor discussed in 4.4., the
transmission peak shifted to the right, towards the higher wavelengths. Then, the PCF
MZI is put in the high refractive solutions to observe its performance in the leaky
configuration. In comparison to the 40 um microfiber MZI, the PCF MZI sensor did have
a transmission wavelength shift trend in response to high refractive indices as shown in
Figure 4-15 and Figure 4-16. Although the achieved the transmission intensity in leaky
mode was low and the peaks were broad, the peak wavelengths have shifted to the higher
wavelengths towards the right. As seen in Figure 4-16, clearly, as the surrounding
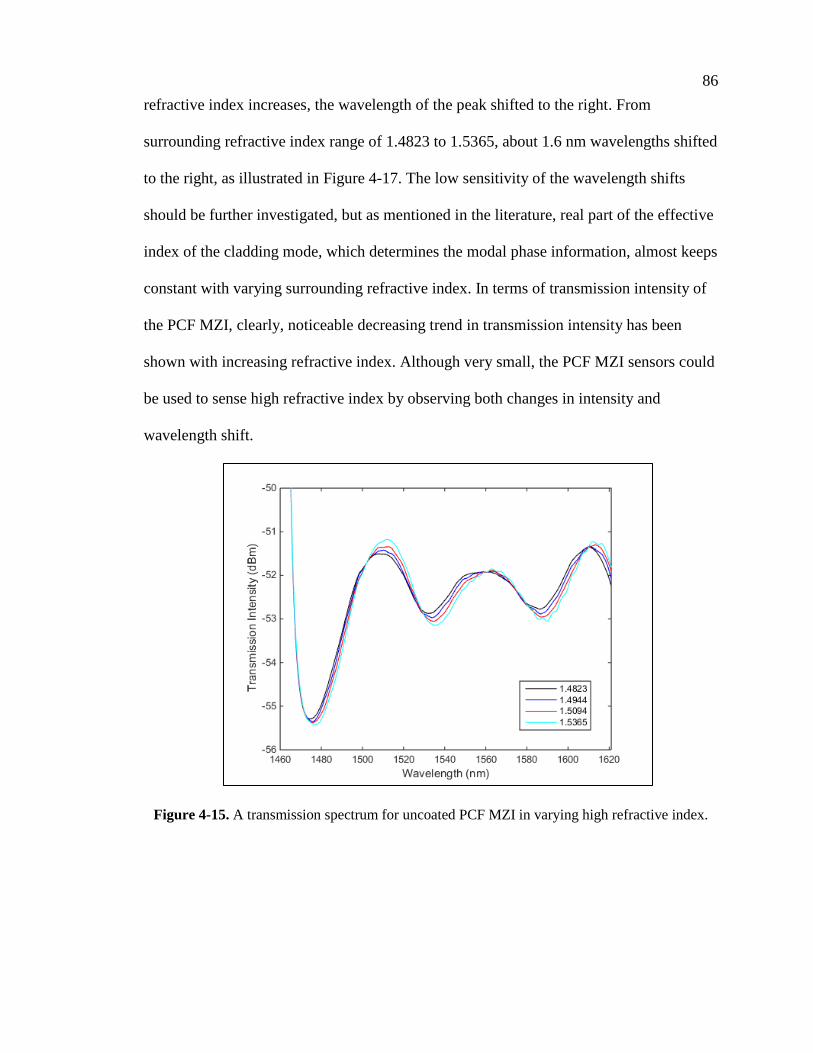
86
refractive index increases, the wavelength of the peak shifted to the right. From
surrounding refractive index range of 1.4823 to 1.5365, about 1.6 nm wavelengths shifted
to the right, as illustrated in Figure 4-17. The low sensitivity of the wavelength shifts
should be further investigated, but as mentioned in the literature, real part of the effective
index of the cladding mode, which determines the modal phase information, almost keeps
constant with varying surrounding refractive index. In terms of transmission intensity of
the PCF MZI, clearly, noticeable decreasing trend in transmission intensity has been
shown with increasing refractive index. Although very small, the PCF MZI sensors could
be used to sense high refractive index by observing both changes in intensity and
wavelength shift.
Figure 4-15. A transmission spectrum for uncoated PCF MZI in varying high refractive index.

87
Figure 4-16. A transmission spectrum for uncoated PCF MZI zoomed in at wavelength 1530 nm
to 1550 nm. Clearly, the wavelength shifts to the right while the transmission intensity decreases
increasing surrounding refractive index.
Figure 4-17. About 1.6 nm wavelength increased by increasing refractive index from 1.4823 to
1.5365.

88
4.8. Effect of PCF length in leaky configuration
In previous section, although very small, the wavelength has shifted to the right in 16
mm PCF MZI sensor. The literature mentions that the real part of the effective refractive
index of the cladding mode almost stays constant, which means that the change in the
modal phase information is very small. The transmission intensity of the PCF MZI sensor
also decreased with increasing surrounding refractive index. To investigate further in the
wavelength shift and transmission intensity, 3 different lengths of PCF region, 11mm, 20
mm, and 25 mm has been investigated. The fringe space in MZI is known to depend on
the length of the interferometer section. The longer interferometer, the more peaks are
observed in the PCF MZIs as shown in Figure 4-18. In leaky mode configuration, the
cladding mode loses most of its energy due to the Fresnel refraction, and only little
amount of cladding modes from Fresnel reflection is obtained at the end. According to
Duhem et al., the Fresnel losses depend with the length of MZI section as well [34], and
therefore, transmission spectrum of the longer PCF MZIs (20 mm and 25 mm) has much
more flat spectrum (smaller peaks). The 11 mm PCF MZI in leaky configuration had
more noticeable peaks as shown in Figure 4-18. For all three lengths of PCF MZIs, the
wavelength shifts to the right very slightly, but no noticeable trends were observed,
especially because the peaks are broad as well. However, it can be seen that they peaks
shift to the right. In terms of transmission intensity, the intensity decreases with
increasing refractive index for all three PCF MZIs (i.e. amplitude of the peaks get
greater). The smaller the PCF region are, the change in transmission with respect to the
varying surrounding refractive index increased (i.e. better sensitivity). The transmission
intensity change with varying SRI for PCF MZI behaved following the quasi-leaky mode

89
approximation mentioned by Yang et al. [31]. At the maximum of the peak, higher RI
had highest transmission intensity and lower RI resulted in lowest transmission while at
minimum of the peak, visa-versa. Comparing the simulated quasi-leaky mode of SMF-
core only fiber-SMF RI sensor with PCF MZI sensor as shown in Figure 4-19, the PCF
MZI sensor behaved similar to the quasi-leaky mode simulation. If the PCF MZI sensors
are used for high RI sensing, it should be used as intensity based sensors operating in
quasi-leaky mode.

90
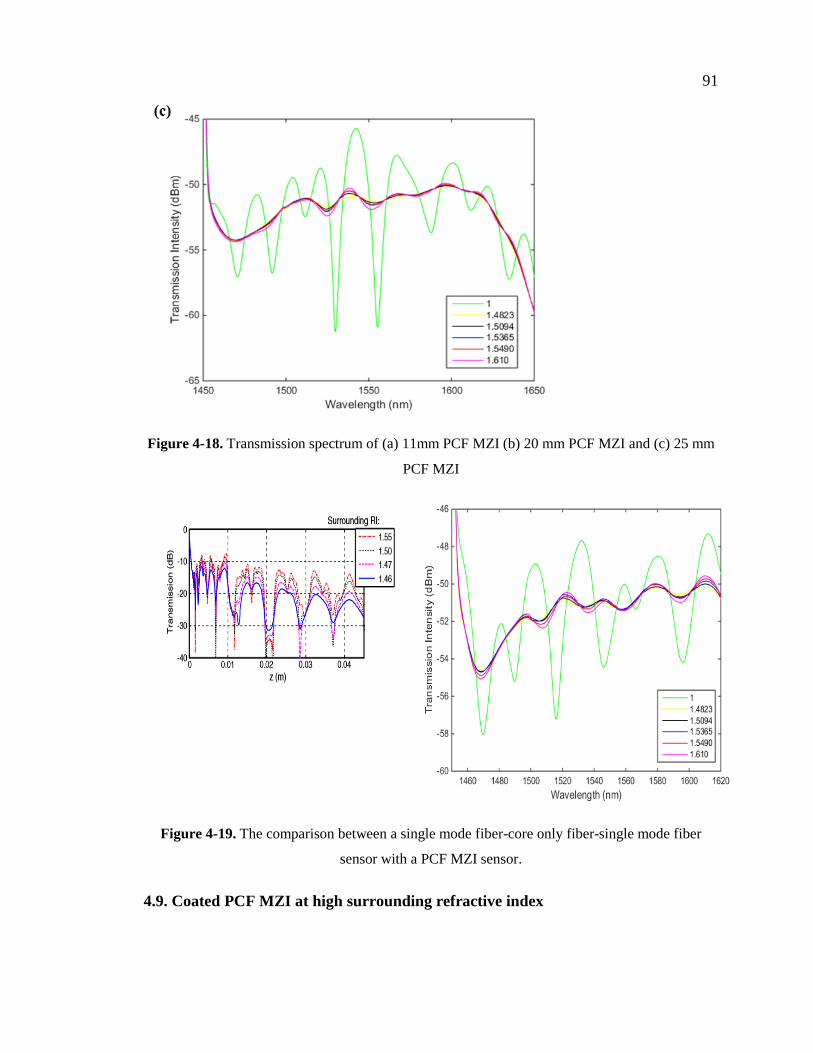
91
Figure 4-18. Transmission spectrum of (a) 11mm PCF MZI (b) 20 mm PCF MZI and (c) 25 mm
PCF MZI
Figure 4-19. The comparison between a single mode fiber-core only fiber-single mode fiber
sensor with a PCF MZI sensor.
4.9. Coated PCF MZI at high surrounding refractive index
92
The effect of thin layers of silver nanoparticle deposited at outer surface of PCF MZI in
high refractive index has also been studied. Since the coating has affected the
performance of the LPG sensor, similar phenomena are expected on the PCF MZI
sensors. Therefore, the 20 pass of silver nanoparticles were deposited into PCF region of
the sensors, for all 11 mm, 20 mm, 25 mm, respectively, and the refractive index
experiment was conducted as did in section 3.5. The comparison of the uncoated PCF MZI
and coated PCF MZI can be seen from Figure 4-20. Unlike the LPG sensor, the coating did not
critically affected in the performance of the PCF MZI sensors. The wavelength shift of the PCF
MZI sensors in leaky configuration is still almost negligible. However, for all lengths of the PCF
MZI sensors, the transmission intensity did increased very slightly. For instance, in Figure 4-21,
the sensitivity of the transmission intensity with respect to increasing surrounding refractive index
increased very slightly with the silver nanoparticle coating. The silver nanoparticle coating in
PCF MZI sensors are not as effective in leaky mode configuration refractive index sensing as the
LPG sensors.

93

94

95
Figure 4-20. The transmission spectrum in leaky mode configuration of (a) uncoated 11 mm PCF
MZI (b) coated 11 mm PCF MZI (c) uncoated 20 mm PCF MZI (d) coated 20 mm PCF MZI (e)
uncoated 25 mm PCF MZI (f) coated 25 mm PCF MZI
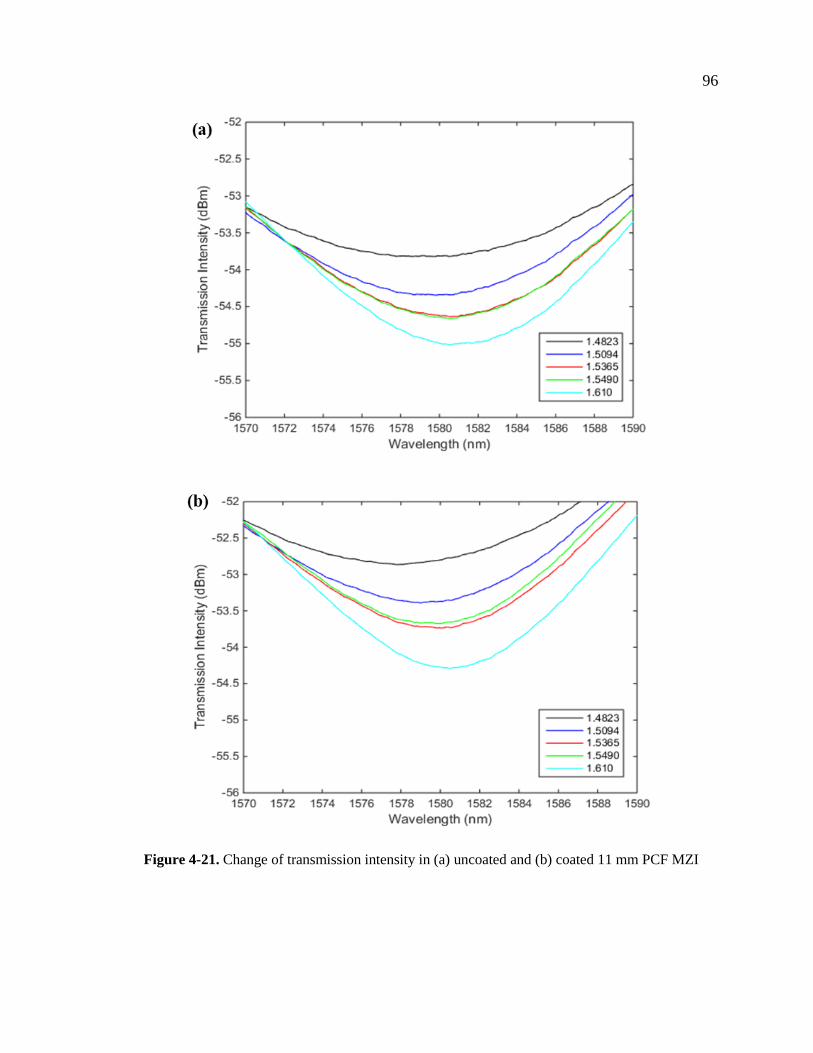
96
Figure 4-21. Change of transmission intensity in (a) uncoated and (b) coated 11 mm PCF MZI

97
4.10. Conclusion
The response of two different configurations of MZI sensors, 40 um microfiber MZI
and PCF MZI, has been experimented with varying refractive index in the leaky
configuration. The 40 um microfiber MZI sensor failed to sense high refractive index
solutions and PCF MZI sensors showed decreasing trend in transmission intensity with
increasing high refractive index values in leaky mode configurations. The sensitivity of
the wavelength shift in PCF MZI were almost negligible and thus could not be used.
Moreover, it was found that as the length of PCF region increased, the peaks became
smaller from higher Fresnel losses. Then, the effect of thin layer silver nanoparticle
coatings on the PCF MZI has been investigated. The deposition of silver nanoparticles
atop PCF MZI sensors did not have significant effects. The transmission intensity
decreased by very little and therefore the sensitivity based on transmission intensity
increased by little. If sensitivity optimizations could be done by adjusting coating
thickness and the PCF length, PCF MZI sensors based on transmission intensity could
potentially be used to measure the solubility and diffusivity of gas/SCF in polymers.

98
Chapter 5. Transmission intensity based gap sensor for
measuring high surrounding refractive index solution
The transmission intensity based fiber optic sensors are frequently used for measuring
the refractive index, especially in the region of high refractive indices. Commonly as
discussed in Chapter 2, intensity based fiber optic sensors have single mode-multimode-
single mode configurations or similar multimode configurations; but a new type of
intensity based sensor in transmission mode is introduced, based on a gap in between to
single mode fibers. In this Chapter, a simple and cost effective intensity based fiber optic
sensor is introduced and its potential to be used as a measurement technique for solubility
and diffusivity of gas/SCF in polymers is discussed. The change in transmission intensity
with increasing refractive index from 1 to 1.6 is observed. Moreover the parametric study
on the gap distance of the sensor to the transmission intensity has been conducted from
the 0 um to 2000 um.
5.1. Introduction
Transmission intensity based fiber optic sensors has been used to measure the
refractive index. C. Chen et al. has fabricated a novel class of multi-D- shaped optical
fiber refractive index sensor where they constructed several D-Sections in multimode
optical fiber using the femtosecond laser pulses[204]. As illustrated in Figure 5-1, regions
of the multimode fiber has been machined into a D-shape so the core is exposed to the
surrounding environment. The operating principle of the sensing bases on the attenuated
total internal reflection along the fiber and the changes of attenuated light intensity of the

99
multi D-shaped fiber with respect to surrounding refractive index. Similarly, Y. Wang et
al has fabricated a refractive index sensor based on a microhole in single-mode fiber
created by the use of femtosecond laser micromachining, which is also based on the
transmission intensity [205]. They discovered that if the hole diameter is close to the
diameter of the core, no light would be directly guided in the fiber core without passing
through the microhole. Therefore, the transmission behavior is critically dependent to the
refractive index of the hole (i.e. RI of the environment solution). At certain refractive
index, the refracted light would be guided to the core. However, at certain refractive
index, only the second refracted light, or even the third refracted light is guided in to the
core as shown in Figure 5-2. Since first refracted guided light would have less
transmission loss than the second and third refracted guided light, the transmission
intensity losses would be higher at certain refractive indices.
Figure 5-1. A schematic of D-shaped optical fiber refractive index sensor. Refractive index
solution would make direct contact with the core [204]

100
Figure 5-2. Light guiding of the femtosecond laser machined microhole refractive index
sensor [205]
Inspired by the transmission intensity based fiber optic sensors fabricated by both C.
Chen and Y. Wang, a new transmission intensity based fiber optic sensor has been
fabricated. Instead of partially introducing the core with the surrounding environment,
introducing a gap in between the transmission configuration has been investigated. At
one end of the gap (or at the first core to surrounding environment environment), the light
would be coupled to the surrounding refractive index. At the second surrounding
environment to core interface, some of the refracted light would be recoupled to the core
mode. As discussed by Y. Wang, depending on the refractive index values of the
surrounding environment, either first, second, third, and so on, refracted light would be
coupled back to the core mode, and this would have an effect in the transmission loss.
Therefore, the change in transmission intensity with respect to varying surrounding
refractive index solution would be investigated in this Chapter.

101
5.2. Fabrication of the gap sensor
Since typical LPG and MZI based refractive index sensors have low sensitivity when
the surrounding refractive index is greater than the refractive index of the cladding,
referred as leaky mode, a new type of sensor has been fabricated to sense changes in high
refractive index. As shown in Figure 5-3, the proposed gap sensor have very simple setup
and operates with two single mode optical fibers aligned on the fixed stage. The sensor
operates in transmission mode where one fiber tip receives the signal from the light
source and transmits to another fiber tip which sends the signal to the optical spectrum
analyzer. In between two optical fibers, a small gap exists, which creates a direct contact
point between the core and the surrounding material. Therefore, the light propagating the
core would couple to the surrounding environment, and only some would recouple back
at the other end. As the gap sensor does not depend on the total internal reflections, the
gap sensor should operate even in the leaky configuration. Theoretically, changes in
surrounding refractive index should change the amount of light coupled and recoupled at
the gap, and thus result in different transmission spectrum. The transmission losses
should vary depending on the surrounding refractive index because at certain refractive
index, first, second, and/or third refracted light would be guided back to the core mode.
(first refracted light would have the least amount of transmission losses)

102
Figure 5-3. A schematic of the gap sensor
5.3. Gap sensor at high surrounding refractive index
The change in light intensity with varying surrounding refractive index in the gap
sensor have been investigated. In the gap sensor, the alignment in between two optical

103
fibers are critical because the light propagates in the core, which is only about 8
micrometers. Two 8 micron cores must be aligned perfectly in all 3 axis to receive a full
transmission spectrum from one core to another. Even if the cores are misaligned very
slightly, the transmission intensity would be too low to observe any change in the
surrounding refractive index. For instance, the primary gap sensor experiment has been
conducted by placing two single mode fiber in a 125 um slot, aligning until the maximum
transmission spectrum is achieved. Then, in that alignment configuration, different
refractive index solutions, from 1.33 to 1.5365 has been tested. As illustrated in Figure
5-4, the transmission spectrum increases as the refractive index solution reaches 1.4823.
Once refractive index solution increases further, the transmission spectrum starts to
decrease again. However, obtaining the alignment of gap sensor in 125 um slot was very
difficult and required a long time. For the application of the solubility and diffusivity
measurement, more accurate and reliable method to measure refractive index is required
and therefore the pigtail fixture method has been implemented.
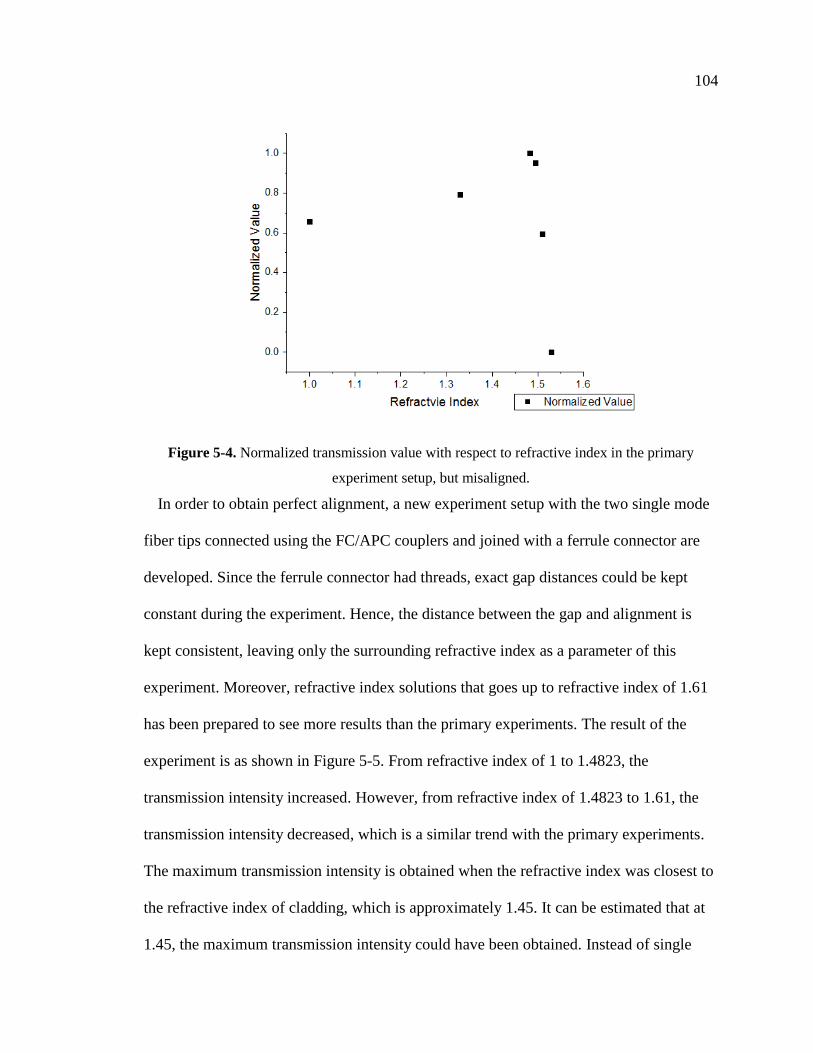
104
Figure 5-4. Normalized transmission value with respect to refractive index in the primary
experiment setup, but misaligned.
In order to obtain perfect alignment, a new experiment setup with the two single mode
fiber tips connected using the FC/APC couplers and joined with a ferrule connector are
developed. Since the ferrule connector had threads, exact gap distances could be kept
constant during the experiment. Hence, the distance between the gap and alignment is
kept consistent, leaving only the surrounding refractive index as a parameter of this
experiment. Moreover, refractive index solutions that goes up to refractive index of 1.61
has been prepared to see more results than the primary experiments. The result of the
experiment is as shown in Figure 5-5. From refractive index of 1 to 1.4823, the
transmission intensity increased. However, from refractive index of 1.4823 to 1.61, the
transmission intensity decreased, which is a similar trend with the primary experiments.
The maximum transmission intensity is obtained when the refractive index was closest to
the refractive index of cladding, which is approximately 1.45. It can be estimated that at
1.45, the maximum transmission intensity could have been obtained. Instead of single

105
mode fibers, which has about 8 um diameter core, 62.5 um core diameter multimode fiber
has been used to observe the transmission spectrum with varying refractive index.
Ideally, with larger core, there would be larger amount of light propagating through the
gap and more light receiving. However, a quick experiments using the multimode fiber
has shown that the transmission spectrum actually has become worst and, no noticeable
trends were obtained. Moreover, the gap sensor alignment was not easy even with the
multimode fibers, and this may have been caused by larger loss of the multimode fibers.
Figure 5-5. Normalized transmission spectrum of the gap sensor with increasing refractive index.
Note that the intensity increases up to about 1.45 and starts to decrease then. The general trend of
the sensor is similar to the primary experiment results.
5.4. Gap distance parameterization
To investigate the effect of the gap distance on the transmission intensity, a
parameterization experiment has been conducted. In air, which has refractive index
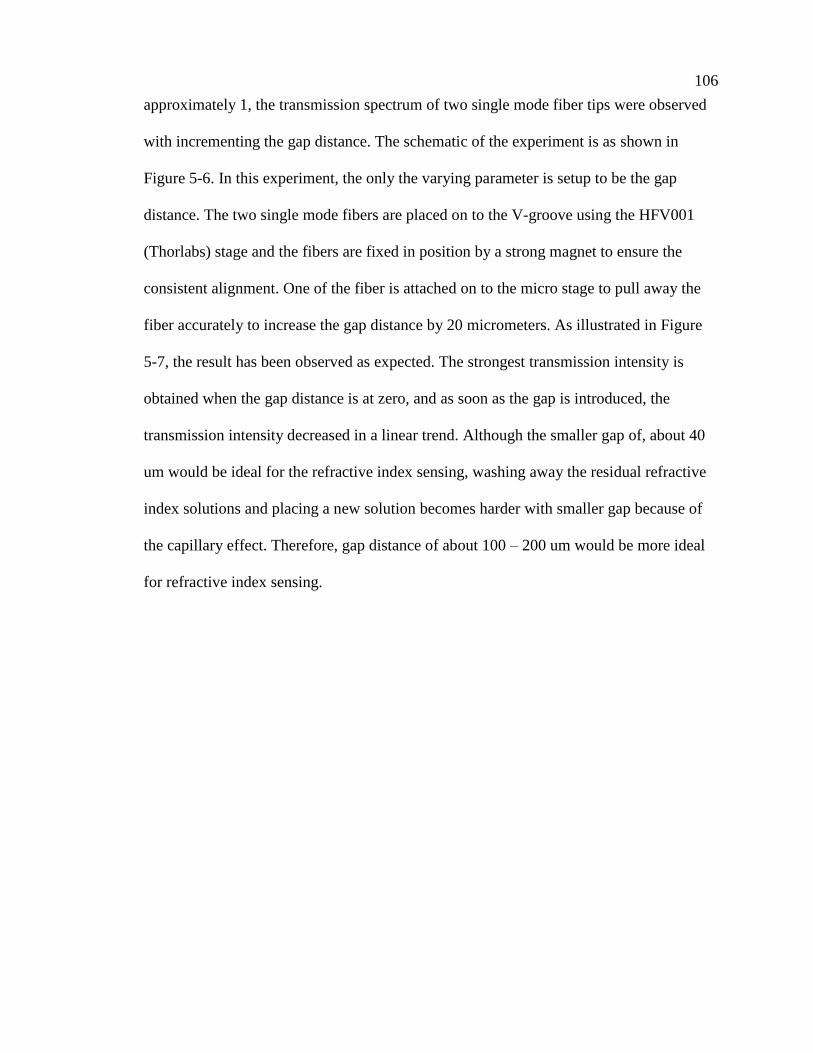
106
approximately 1, the transmission spectrum of two single mode fiber tips were observed
with incrementing the gap distance. The schematic of the experiment is as shown in
Figure 5-6. In this experiment, the only the varying parameter is setup to be the gap
distance. The two single mode fibers are placed on to the V-groove using the HFV001
(Thorlabs) stage and the fibers are fixed in position by a strong magnet to ensure the
consistent alignment. One of the fiber is attached on to the micro stage to pull away the
fiber accurately to increase the gap distance by 20 micrometers. As illustrated in Figure
5-7, the result has been observed as expected. The strongest transmission intensity is
obtained when the gap distance is at zero, and as soon as the gap is introduced, the
transmission intensity decreased in a linear trend. Although the smaller gap of, about 40
um would be ideal for the refractive index sensing, washing away the residual refractive
index solutions and placing a new solution becomes harder with smaller gap because of
the capillary effect. Therefore, gap distance of about 100 – 200 um would be more ideal
for refractive index sensing.
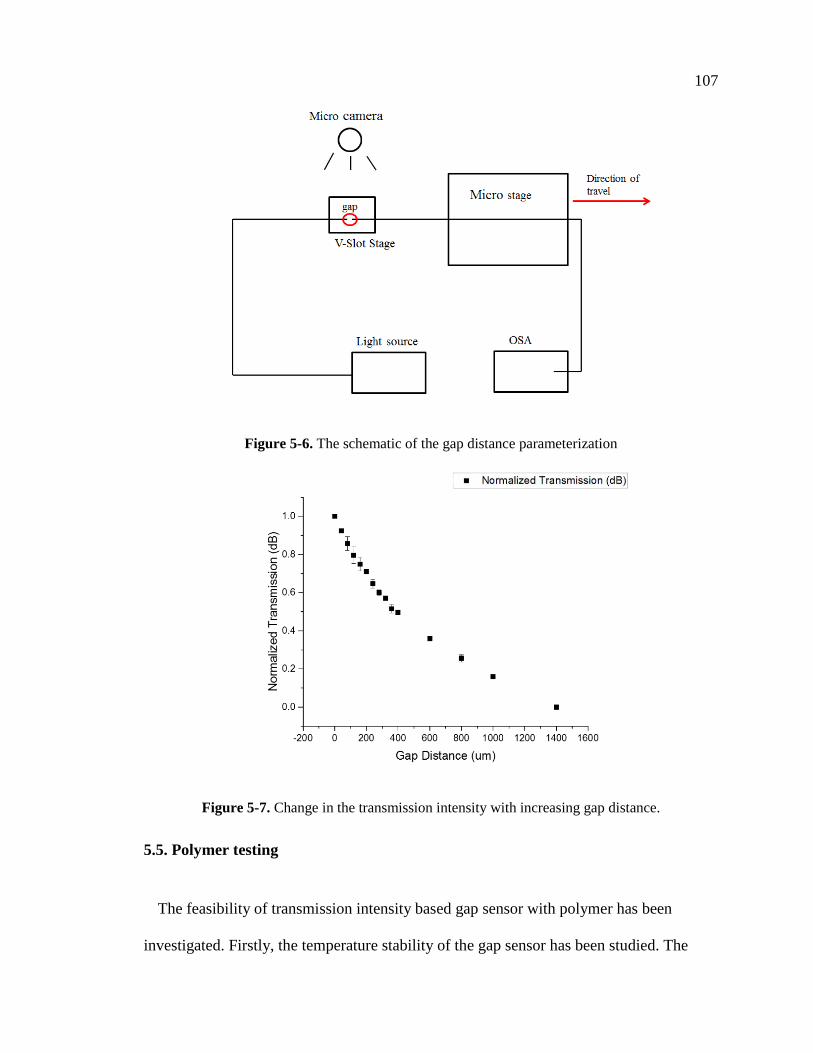
107
Figure 5-6. The schematic of the gap distance parameterization
Figure 5-7. Change in the transmission intensity with increasing gap distance.
5.5. Polymer testing
The feasibility of transmission intensity based gap sensor with polymer has been
investigated. Firstly, the temperature stability of the gap sensor has been studied. The

108
single mode pigtails are fitted into a fiber sleeve and is put in a temperature controlled
furnace. The transmission intensity of the gap sensor at every 10 ˚C is measured through
the OSA and the result is as seen in Figure 5-8. There are no noticeable changes in the
transmission intensity observed with varying temperature. Therefore, the proposed gap
sensor itself is insensitive to environment temperature.
Figure 5-8. The change in transmission intensity with response to temperature.
The change in transmission intensity with varying temperature with a polymer film
filling the gap has been investigated to test the feasibility of polymers with the gap
sensors. The polycaprolactone (PCL) 45k Mn has been fabricated as a film with 71 μm
and are inserted in between the fibers. 45k Mn PCL is white when it is in a solid form but
as it becomes in a polymer melt, its transparency changes as shown in Figure 5-9. The

109
change in transmission intensity as the polymer changes phases have been studied as
illustrated Figure 5-10. The melting point of PCL is 60˚ C and as shown in Figure 5-10,
as temperature increases, the transmission intensity increases gradually. When the
temperature approaches the melting temperature, significant changes in transmission
occur since the transparency changes with phase change.
Figure 5-9. Difference in transparency between solid and molten PCL.

110
30 40 50 60 70 80 90 100 110
-45.0
-44.5
-44.0
-43.5
-43.0
-42.5
-42.0
-41.5
-41.0
-40.5
-40.0
Transmission Intensity (dBm)
Tra
nsm
issio
n I
nte
nsity (
dB
m)
Temperature ( oC )
Figure 5-10. The transmission intensity of PCL film with varying temperature
Then, the change in transmission spectrum with three different polymer film has been
observed. Polymer films of fluorinated ethylene propylene, polypropylene, and PET with
refractive indices of 1.34, 1.49, and 1.64 respectively, have been placed at the gap to
measure the transmission as tabulated in Table 5-1. The thickness of the films were all 51
μm. The change in transmission intensity for the three polymer films have been obtained
as shown in Figure 5-11. The trend of the change in transmission with polymer films
matched with the trend from the RI solution test, where from FEP to PP (i.e. RI from 1.34
to 1.49) the transmission spectrum increased and from PP to PET (i.e. RI from 1.49 to
1.64), the transmission spectrum decreased. Although the spectrums obtained with

111
polymer films had higher intensities over all, this may be from the fact that the gap
distances were shorted with the films.
Table 5-1. Properties of the polymer films
Polymers
Refractive
Index (n)
FEP (Fluorinated ethylene
propylene)
1.34
PP (Polypropylene) 1.49
PET (Polyester) 1.64
Figure 5-11. The transmission spectrum of polymer films compared with the RI solutions.
112
5.6. Carbon dioxide desorption in a polycarbonate film
A desorption process where the transport of carbon dioxide (CO2) out of a CO2
saturated polymer has been observed using the transmission intensity gap sensor. The
PET film has been fabricated as a film and is put in a customized pressure chamber as
shown in Figure 5-13. A PET film with dimension of 1 mm by 1mm by 51 μm has been
machined using a femtosecond laser as shown in Figure 5-12. The machined PET film
has been placed in the sample chamber and have been pressurized with pressure of 1250
psi of CO2 at room temperature for 48 hours. Next, the sample is taken out and the
thickness has been measured before it is placed at the gap in a fiber sleeve between the
pigtails. The entire setup process has taken 3 minutes as the pressure is released. Once the
PC film is firmly placed at the gap, the transmission intensity is measured every 3
minutes. The change in transmission intensity over time has been plotted in Figure 5-14.
The thickness of the PET film before and after 90 minutes are measured to be 51 μm. The
transmission intensity decreased gradually until about 80 minutes until it reached plateau.
The increase in refractive index would cause decrease in transmission intensity according
to the experiment conducted in high refractive index. It is assumed that mixture of CO2
and polymer would have slightly lower RI than that of the pure polymer. Moreover, the
desorption plot obtained by the gap sensor had opposite trend from the CO2 sorption plot
obtained with weight change method in literature, as shown in Figure 5-15, which is an
interesting result considering that sorption is gas in taking of polymer and desorption is
gas leaving the polymer. Further experiments should be conducted to validate this
hypothesis.

113
Figure 5-12. 1 mm by 1 mm by 189 μm thick PET film machined using femtosecond laser.
Figure 5-13. A customized pressure chamber used t pressurize PET film. (A) a CO2 tank (B) a
high pressure regulator (C) a valve (D) a sample chamber (E) an exit valve.

114
Figure 5-14. The change in transmission intensity with time as the CO2 desorbs out of PET film.
Figure 5-15. The CO2 sorption film in PET using weight change method in literature.

115
5.7. Conclusion
The new intensity based fiber optic refractive index sensor has been introduced and the
change in transmission intensity with increasing surrounding refractive index has been
observed. The gap sensor consisted of very simple setup and operated with two single
mode optical fibers aligned on the fixed stage. The core diameter of the single mode fiber
was about 8 micrometers, and therefore, the aligning process is found to be difficult. The
refractive index experiment with single mode fiber gap sensor showed an increasing trend
until 1.428, then which started to decrease. The usage of multimode fibers have led to
higher losses and resulted in no noticeable trend in the refractive index experiment. Since
the single mode fiber gap sensor operated even in the leaky configuration, the gap sensor
could be used to measure the solubility and diffusivity of gas/SCF in polymers, if the
aligning process can be configured with polymer resins. Therefore, the transmission
intensity based gap sensor has been used to experiment behaviors with polymer films.
First, the temperature independence of the gap sensor has been experimented. Then, the
change of transmission intensity as the PCL film changes its phase has been observed. As
PCL changed its phase from solid to polymer melt, its transparency become clearer and
the transmission intensity has increased. The CO2 desorption test on PET film has
conducted as the increase in transmission intensity with time has been observed. Further
experiments should be conducted to verify that transparency change with CO2 injection
caused this result.

116
Chapter 6. Conclusion and future work
The overall conclusion of the final thesis along with the future works are presented in
this Chapter.
6.1. Conclusion
The solubility is a proportional ratio of a solute in a solvent, and diffusion can be
described as the process where a material is transported by the thermal motion of the
molecules in a fluid or a matrix. In many of polymer process applications, solubility and
diffusivity act as crucial parameters. Therefore, numerous measurement methods for
obtaining solubility and diffusivity of gas/SCF in polymers have been investigated. This
final thesis looks into detail of different methods for obtaining solubility and diffusivity.
Most of the solubility and diffusivity measurement devices discussed are very expansive,
complex to use, and require long experiment time. Hence, the potential availability of
fiber optic sensors as solubility and diffusivity of gas/SCF in polymers have been
discussed in this final thesis. Fiber optic sensors are widely used in many applications,
especially as refractometers because it is accurate, reliable, cost efficient, and simple. The
in fiber grating sensors, such as FBG and LPG, and the in line interferometer sensors,
mainly Mach-Zehnder interferometer, are introduced and have been researched to verify
that the fiber optic sensors could be used with polymers. Most of the refractive index
sensors based on fiber optics only operate in refractive index ranges of 1 to 1.44 because
once the surrounding refractive index becomes greater than that of cladding (i.e. 1.45),
the total internal reflection is lost and only small portion of the light propagation occurs

117
(i.e. leaky configuration). Since most of the polymers used for processing have refractive
index above 1.4, the fiber optic sensor must be overcome sensing limitations in the leaky
configuration. This final thesis suggests different fiber optic sensors, a silver nanoparticle
coated LPG sensor, a PCF MZI sensor, a silver nanoparticle coated PCF MZI sensor, and
a transmission intensity gap sensor, that could be used to sense refractive index in leaky
configuration.
The femtosecond laser written LPG sensor coated with silver nanoparticles is tested
for sensing refractive indices higher than that of cladding. For coating silver
nanoparticles, the cost efficient atomization based system is implemented to deposit thin
layers to the LPG sensor. With 20 passes of silver nanoparticle coating on the LPG
sensor, the transmission spectrum shifted towards shorter wavelength with increasing
wavelength. From the refractive index of 1.4823 to 1.5365, approximately 1.2 nm
wavelength shifted to the left.
The response of two different configurations of MZI sensors, 40 um microfiber MZI
and PCF MZI, has been experimented with varying refractive index in the leaky
configuration. The 40 um microfiber MZI sensor failed to sense high refractive index
solutions. PCF MZI sensors showed decreasing trend in transmission intensity with
increasing high refractive index values in leaky mode configurations. The sensitivity of
the wavelength shift in PCF MZI were almost negligible and thus could not be used.
Moreover, it was found that as the length of PCF region increased, the peaks became
smaller from higher Fresnel losses. Then, the effect of thin layer silver nanoparticle
coatings on the PCF MZI has been investigated. The deposition of silver nanoparticles
atop PCF MZI sensors did not have significant effects. The transmission intensity

118
decreased by very little and therefore the sensitivity based on transmission intensity
increased by little.
The new transmission intensity based fiber optic refractive index sensor has been
introduced. The gap sensor consisted of very cheap and simple setup, which operated
with two single mode optical fibers aligned on the fixed stage. The core diameter of the
single mode fiber was about 8 micrometers, and therefore, the aligning process is found
to be difficult. The change in transmission spectrum is observed even in the leaky
configuration using the gap sensor, and it has also been found that the distance of the gap
inversely affected the transmission spectrum. The polymer testing has been experimented
by observing transmission intensity changes of PCL, PET, FEP, and PP films. The
change in refractive index with polymer film resulted the similar trend with the RI
solution test. Moreover, a desorption test of CO2 in PET have opened up more possibility
of using fiber optic sensors for acquiring solubility and diffusivity of gas/SCFs in
polymers.
The proposed sensors are capable of sensing surrounding refractive index greater than
the cladding, even in regions from 1.4 to 1.6, where the most of polymer’s refractive
index is. Therefore, the fiber optic sensors potentially could be used to measure the
solubility and diffusivity of gas/SCF in polymers if the following future works could be
implemented.
6.2. Future work
In order to use fiber optic sensors as solubility and diffusivity measurement devices,
several more researches in the fiber optic sensors other than sensing in leaky

119
configuration must be conducted. First of all, the sensitivity of all, in fiber gratings
sensors, in line interferometer sensors, and transmission intensity based sensors must be
enhanced. The sensitivity of the proposed silver nanoparticle coated LPG sensor could be
improved by optimizing the number of passes coated onto the LPG sensor. Similarly, the
parametric study of coating passes and length of PCF segment in PCF MZI sensors would
contribute in improving the sensitivity of the PCF MZI sensors. Furthermore, it has been
known that having tapers in fiber optic sensor enhances the sensitivity. Therefore, adding
in fiber tapers along with the proposed sensors could cause an increase in sensitivity. In
case of the transmission intensity based gap sensor, varying the fiber tips would have an
effect in sensitivity. For example, having FC/PC pigtail instead of FC/APC would allow
more sensitivity because FC/APC has slight angle at the fiber tip to reduce Fresnel
reflection. Second, the fiber optic sensors must withstand harsh environment. Since the
measurement of solubility and diffusivity of gas/SCF in polymers require high
temperature and high pressure, only the robust sensors could be utilized for this
application. The fixtures that houses the sensor should prevent any gas/SCF leakages
while maintaining constant high temperature. Moreover, polymer resins are non-
Newtonian fluid, meaning that viscosity of polymer resin should be taken into account.
This may be more difficult as the fibers are small in size. However, by searching
literatures on harsh environment fiber optic sensors, solutions should be available.
Investigations on sapphire fibers would allow more flexibility in using fiber optics as
measurement device for measuring solubility because sapphire fibers offer unique
characteristics. As sapphire fibers have refractive index of about 1.73, measuring
refractive indices of most polymers with sapphire fiber sensors would not lead to leaky

120
configuration (i.e. would not lose total internal reflection if LPG sensor could be
fabricated using the sapphire fiber). Moreover, the melting point of sapphire is over 2000
˚C, and therefore, numerous studies have been investigated using sapphire fibers for
sensing in harsh environment [206]. Hence, sapphire fibers would be a perfect fit if
several limitations could be overcome. Being a hard crystal with high melting
temperature, splicing becomes a problem in sapphire fibers [207]. In order to fabricate in
fiber gratings sensors or in line interferometers, splicing is inevitable. In addition,
sapphire fibers are coreless fibers, which means that no cladding exists. Therefore,
cladding should be manually fabricated by modifying index with femtosecond laser, or
depositing thin layers of coating. Creating fiber gratings would be challenging as well as
not much studies have been done in literature on sapphire fibers due to the challenges and
expensive cost. However, the advantages that sapphire fibers offer are very attractive, and
have high potential. Thus, fabricating fiber optic sensors with sapphire fiber would be
beneficial in solubility and diffusivity measurement applications.

121
Bibliography
[1] Tadmor Z, Gogos CG. Principles of polymer processing: John Wiley & Sons; 2013.
[2] Melo L, Burton G, Davies B, Risk D, Wild P. Highly sensitive coated long period
grating sensor for CO2 detection at atmospheric pressure. Sensors and Actuators B:
Chemical. 2014;202:294-300.
[3] Tang J, Yin G, Liu S, Zhong X, Liao C, Li Z, et al. Gas Pressure Sensor Based on CO
<sub>2</sub>-Laser-Induced Long-Period Fiber Grating in Air-Core Photonic Bandgap
Fiber. IEEE Photonics Journal. 2015;7:1-7.
[4] McNaught AD, McNaught AD. Compendium of chemical terminology: Blackwell
Science Oxford; 1997.
[5] Li G, Wang J, Park CB, Simha R. Measurement of gas solubility in linear/branched
PP melts. Journal of Polymer Science Part B: Polymer Physics. 2007;45:2497-508.
[6] Kikic I, Vecchione F. Supercritical impregnation of polymers. Current Opinion in
Solid State and Materials Science. 2003;7:399-405.
[7] Lee M, Tzoganakis C, Park CB. Extrusion of PE/PS blends with supercritical carbon
dioxide. Polymer Engineering & Science. 1998;38:1112-20.
[8] Knez Ž, Markočič E, Leitgeb M, Primožič M, Knez Hrnčič M, Škerget M. Industrial
applications of supercritical fluids: A review. Energy. 2014;77:235-43.
[9] Shariati A, Peters CJ. Recent developments in particle design using supercritical
fluids. Current Opinion in Solid State and Materials Science. 2003;7:371-83.
[10] Fages J, Lochard H, Letourneau J-J, Sauceau M, Rodier E. Particle generation for
pharmaceutical applications using supercritical fluid technology. Powder Technology.
2004;141:219-26.
[11] Pathak P, Meziani MJ, Desai T, Sun Y-P. Nanosizing Drug Particles in Supercritical
Fluid Processing. Journal of the American Chemical Society. 2004;126:10842-3.
[12] Park CB, Behravesh AH, Venter RD. Low density microcellular foam processing in
extrusion using CO2. Polymer Engineering & Science. 1998;38:1812-23.
[13] Keshtkar M, Nofar M, Park CB, Carreau PJ. Extruded PLA/clay nanocomposite
foams blown with supercritical CO2. Polymer. 2014;55:4077-90.
[14] Dai X, Liu Z, Han B, Yang G, Zhang X, He J, et al. Preparation of Poly(vinyl
chloride)/Polystyrene Miscible Blends Using Supercritical CO2 as a Swelling Agent.
Macromolecular Rapid Communications. 2002;23:626-9.
[15] Lecler S, Meyrueis P. Intrinsic optical fiber sensor: INTECH Open Access
Publisher; 2012.
[16] Chen S, Palmer AW, Grattan KTV, Meggitt BT. Extrinsic optical-fiber
interferometric sensor that uses multimode optical fibers: system and sensing-head design
for low-noise operation. Opt Lett. 1992;17:701-3.
[17] Stephen WJ, Ralph PT. Optical fibre long-period grating sensors: characteristics and
application. Measurement Science and Technology. 2003;14:R49.
[18] Liao CR, Wang Y, Wang DN, Yang MW. Fiber In-Line Mach–Zehnder
Interferometer Embedded in FBG for Simultaneous Refractive Index and Temperature
Measurement. IEEE Photonics Technology Letters. 2010;22:1686-8.

122
[19] Patrick HJ, Kersey AD, Bucholtz F. Analysis of the Response of Long Period Fiber
Gratings to External Index of Refraction. Journal of Lightwave Technology.
1998;16:1606.
[20] Tsai W-H, Lin C-J. A Novel Structure for the Intrinsic Fabry-Perot Fiber-Optic
Temperature Sensor. Journal of Lightwave Technology. 2001;19:682.
[21] Kersey AD, Davis MA, Patrick HJ, LeBlanc M, Koo K, Askins C, et al. Fiber
grating sensors. Journal of lightwave technology. 1997;15:1442-63.
[22] Zhang AP, Li-Yang S, Jin-Fei D, Sailing H. Sandwiched long-period gratings for
simultaneous measurement of refractive index and temperature. IEEE Photonics
Technology Letters. 2005;17:2397-9.
[23] Sarfraz K, Stephen WJ, Ralph PT. Enhanced sensitivity fibre optic long period
grating temperature sensor. Measurement Science and Technology. 2002;13:792.
[24] Wang Y, Li Y, Liao C, Wang DN, Yang M, Lu P. High-Temperature Sensing Using
Miniaturized Fiber In-Line Mach–Zehnder Interferometer. IEEE Photonics
Technology Letters. 2010;22:39-41.
[25] Li Y, Harris E, Chen L, Bao X. Application of spectrum differential integration
method in an in-line fiber Mach-Zehnder refractive index sensor. Opt Express.
2010;18:8135-43.
[26] St-Gelais R, Mackey G, Saunders J, Zhou J, Leblanc-Hotte A, Poulin A, et al. Gas
sensing using polymer-functionalized deformable Fabry–Perot interferometers. Sensors
and Actuators B: Chemical. 2013;182:45-52.
[27] Hou R, Ghassemlooy Z, Hassan A, Lu C, Dowker KP. Modelling of long-period
fibre grating response to refractive index higher than that of cladding. Measurement
Science and Technology. 2001;12:1709.
[28] Bhatia V, Vengsarkar AM. Optical fiber long-period grating sensors. Opt Lett.
1996;21:692-4.
[29] Lee BH, Liu Y, Lee SB, Choi SS, Jang JN. Displacements of the resonant peaks of a
long-period fiber grating induced by a change of ambient refractive index. Opt Lett.
1997;22:1769-71.
[30] Wang P, Brambilla G, Ding M, Semenova Y, Wu Q, Farrell G. Investigation of
single-mode–multimode–single-mode and single-
mode–tapered-multimode–single-mode fiber structures and their
application for refractive index sensing. J Opt Soc Am B. 2011;28:1180-6.
[31] Stegall DB, Erdogan T. Leaky cladding mode propagation in long-period fiber
grating devices. IEEE Photonics Technology Letters. 1999;11:343-5.
[32] Yang L, Xue L, Che D, Qian J. Guided-mode-leaky-mode-guided-mode fiber
structure and its application to high refractive index sensing. Opt Lett. 2012;37:587-9.
[33] Harris J, Lu P, Larocque H, Chen L, Bao X. In-fiber Mach–Zehnder interferometric
refractive index sensors with guided and leaky modes. Sensors and Actuators B:
Chemical. 2015;206:246-51.
[34] Duhem O, Henninot JF, Douay M. Study of in fiber Mach–Zehnder interferometer
based on two spaced 3-dB long period gratings surrounded by a refractive index higher
than that of silica. Optics Communications. 2000;180:255-62.
[35] Lee C-L, Lin K-H, Lin Y, Hsu J-M. Widely tunable and ultrasensitive leaky-guided
multimode fiber interferometer based on refractive-index-matched coupling. Opt Lett.
2012;37:302-4.

123
[36] Yampolskii Y, Paterson R. Solubility of Gases in Polymers. The Experimental
Determination of Solubilities. 2003:151.
[37] Wissinger R, Paulaitis M. Swelling and sorption in polymer–CO2 mixtures at
elevated pressures. Journal of Polymer Science Part B: Polymer Physics. 1987;25:2497-
510.
[38] Ender D. Elastomeric seals. Chemtech. 1986;16:52-6.
[39] Buckley DJ, Berger M. The swelling of polymer systems in solvents. II.
Mathematics of diffusion. Journal of Polymer Science. 1962;56:175-88.
[40] Tomasko DL, Li H, Liu D, Han X, Wingert MJ, Lee LJ, et al. A Review of CO2
Applications in the Processing of Polymers. Industrial & Engineering Chemistry
Research. 2003;42:6431-56.
[41] Zhang Y, Gangwani KK, Lemert RM. Sorption and swelling of block copolymers in
the presence of supercritical fluid carbon dioxide. The Journal of Supercritical Fluids.
1997;11:115-34.
[42] McBain JW, Bakr AM. A NEW SORPTION BALANCE1. Journal of the American
Chemical Society. 1926;48:690-5.
[43] Volkov V, Bokarev A, Durgaryan S. SORPTION-DESORPTION ISOTHERMS OF
SULFUR-DIOXIDE IN POLYMERS. VYSOKOMOLEKULYARNYE SOEDINENIYA
SERIYA A. 1984;26:1294-9.
[44] Sarakhov A. Balance in Physiochemical Studies. Nauka, Moscow; 1968.
[45] Duda JL, Kimmerly GK, Sigelko WL, Vrentas JS. Sorption Apparatus for Diffusion
Studies with Molten Polymers. Industrial & Engineering Chemistry Fundamentals.
1973;12:133-6.
[46] Serad GE, Freeman BD, Stewart ME, Hill AJ. Gas and vapor sorption and diffusion
in poly(ethylene terephthalate). Polymer. 2001;42:6929-43.
[47] Lequin S, Chassagne D, Karbowiak T, Gougeon R, Brachais L, Bellat J-P.
Adsorption Equilibria of Water Vapor on Cork. Journal of Agricultural and Food
Chemistry. 2010;58:3438-45.
[48] Iwai Y, Arai Y. Measurement and Prediction of Solubilities of Hydrocarbon Vapors
in Molten Polymers. JOURNAL OF CHEMICAL ENGINEERING OF JAPAN.
1989;22:155-61.
[49] Volkov V, Bokarev A. Temperature dependences of equilibrium gas sorption by
poly [1-(trimethylsily)-1-propyne] and poly (vinyl trimethylsilane). Polymer science.
1992;34:1069-73.
[50] Felder R, Huvard G. 17. Permeation, Diffusion, and Sorption of Gases and Vapors.
Methods of experimental physics. 1980;16:315-77.
[51] Egerton T, Stone F. Adsorption of carbon monoxide by zeolite Y exchanged with
different cations. Journal of the Chemical Society, Faraday Transactions 1: Physical
Chemistry in Condensed Phases. 1973;69:22-38.
[52] Kadam AA, Karbowiak T, Voilley A, Debeaufort F. Techniques to measure sorption
and migration between small molecules and packaging. A critical review. Journal of the
Science of Food and Agriculture. 2015;95:1395-407.
[53] Kamiya Y, Hirose T, Mizoguchi K, Naito Y. Gravimetric study of high-pressure
sorption of gases in polymers. Journal of Polymer Science Part B: Polymer Physics.
1986;24:1525-39.
124
[54] Kamiya Y, Mizoguchi K, Hirose T, Naito Y. Sorption and dilation in poly(ethyl
methacrylate)–carbon dioxide system. Journal of Polymer Science Part B: Polymer
Physics. 1989;27:879-92.
[55] Kamiya Y, Naito Y, Bourbon D. Sorption and partial molar volumes of gases in
poly(ethylene-co-vinyl acetate). Journal of Polymer Science Part B: Polymer Physics.
1994;32:281-6.
[56] Kamiya Y, Mizoguchi K, Naito Y, Hirose T. Gas sorption in poly(vinyl benzoate).
Journal of Polymer Science Part B: Polymer Physics. 1986;24:535-47.
[57] Wong B, Zhang Z, Handa YP. High-precision gravimetric technique for determining
the solubility and diffusivity of gases in polymers. Journal of Polymer Science Part B:
Polymer Physics. 1998;36:2025-32.
[58] Kamiya Y, Mizoguchi K, Terada K, Fujiwara Y, Wang J-S. CO2 Sorption and
Dilation of Poly(methyl methacrylate). Macromolecules. 1998;31:472-8.
[59] Phan Thuy L, Springer J. CO2 sorption in poly(butylene terephthalate). Colloid &
Polymer Sci. 1988;266:614-9.
[60] Von Solms N, Nielsen JK, Hassager O, Rubin A, Dandekar AY, Andersen SI, et al.
Direct measurement of gas solubilities in polymers with a high-pressure microbalance.
Journal of Applied Polymer Science. 2004;91:1476-88.
[61] Berens AR, Huvard GS, Korsmeyer RW, Kunig FW. Application of compressed
carbon dioxide in the incorporation of additives into polymers. Journal of Applied
Polymer Science. 1992;46:231-42.
[62] Watkins JJ, McCarthy TJ. Polymerization in Supercritical Fluid-Swollen Polymers:
A New Route to Polymer Blends. Macromolecules. 1994;27:4845-7.
[63] Watkins JJ, McCarthy TJ. Polymerization of Styrene in Supercritical CO2-Swollen
Poly(chlorotrifluoroethylene). Macromolecules. 1995;28:4067-74.
[64] Webb KF, Teja AS. Solubility and diffusion of carbon dioxide in polymers. Fluid
Phase Equilibria. 1999;158–160:1029-34.
[65] Gutiérrez C, Rodríguez JF, Gracia I, de Lucas A, García MT. Modification of
polystyrene properties by CO2: Experimental study and correlation. Journal of Applied
Polymer Science. 2015;132:n/a-n/a.
[66] Li G, Gunkel F, Wang J, Park CB, Altstädt V. Solubility measurements of N2 and
CO2 in polypropylene and ethene/octene copolymer. Journal of Applied Polymer
Science. 2007;103:2945-53.
[67] Sato Y, Takikawa T, Yamane M, Takishima S, Masuoka H. Solubility of carbon
dioxide in PPO and PPO/PS blends. Fluid Phase Equilibria. 2002;194–197:847-58.
[68] Chaudhary BI, Johns AI. Solubilities of Nitrogen, Isobutane and Carbon Dioxide in
Polyethylene. Journal of Cellular Plastics. 1998;34:312-28.
[69] Sato Y, Takikawa T, Sorakubo A, Takishima S, Masuoka H, Imaizumi M. Solubility
and Diffusion Coefficient of Carbon Dioxide in Biodegradable Polymers. Industrial &
Engineering Chemistry Research. 2000;39:4813-9.
[70] Sato Y, Takikawa T, Takishima S, Masuoka H. Solubilities and diffusion
coefficients of carbon dioxide in poly(vinyl acetate) and polystyrene. The Journal of
Supercritical Fluids. 2001;19:187-98.
[71] Areerat S, Funami E, Hayata Y, Nakagawa D, Ohshima M. Measurement and
prediction of diffusion coefficients of supercritical CO2 in molten polymers. Polymer
Engineering & Science. 2004;44:1915-24.

125
[72] Areerat S, Hayata Y, Katsumoto R, Kegasawa T, Egami H, Ohshima M. Solubility
of carbon dioxide in polyethylene/titanium dioxide composite under high pressure and
temperature. Journal of Applied Polymer Science. 2002;86:282-8.
[73] Lei Z, Ohyabu H, Sato Y, Inomata H, Smith Jr RL. Solubility, swelling degree and
crystallinity of carbon dioxide–polypropylene system. The Journal of Supercritical
Fluids. 2007;40:452-61.
[74] Aionicesei E, Škerget M, Knez Ž. Measurement and Modeling of the CO2 Solubility
in Poly(ethylene glycol) of Different Molecular Weights. Journal of Chemical &
Engineering Data. 2008;53:185-8.
[75] Aionicesei E, Škerget M, Knez Ž. Measurement of CO2 solubility and diffusivity in
poly(l-lactide) and poly(d,l-lactide-co-glycolide) by magnetic suspension balance. The
Journal of Supercritical Fluids. 2008;47:296-301.
[76] Trupej N, Hrnčič MK, Škerget M, Knez Ž. Solubility and binary diffusion
coefficient of argon in polyethylene glycols of different molecular weights. The Journal
of Supercritical Fluids. 2015;103:10-7.
[77] Bonner DC, Cheng Y-l. A new method for determination of equilibrium sorption of
gases by polymers at elevated temperatures and pressures. Journal of Polymer Science:
Polymer Letters Edition. 1975;13:259-64.
[78] Briscoe BJ, Kelly CT. The effect of structure on gas solubility and gas induced
dilation in a series of poly(urethane) elastomers. Polymer. 1996;37:3405-10.
[79] Briscoe BJ, Lorge O, Wajs A, Dang P. Carbon dioxide–poly(vinylidene fluoride)
interactions at high pressure. Journal of Polymer Science Part B: Polymer Physics.
1998;36:2435-47.
[80] Briscoe BJ, Zakaria S. Interaction of CO2 gas with silicone elastomer at high
ambient pressures. Journal of Polymer Science Part B: Polymer Physics. 1991;29:989-99.
[81] Miura K-i, Otake K, Kurosawa S, Sako T, Sugeta T, Nakane T, et al. Solubility and
adsorption of high pressure carbon dioxide to poly(styrene). Fluid Phase Equilibria.
1998;144:181-9.
[82] Wibawa G, Takahashi M, Sato Y, Takishima S, Masuoka H. Solubility of Seven
Nonpolar Organic Solvents in Four Polymers Using the Piezoelectric−Quartz Sorption
Method. Journal of Chemical & Engineering Data. 2002;47:518-24.
[83] Wong HC, Campbell SW, Bhethanabotla VR. Sorption of benzene, toluene and
chloroform by poly(styrene) at 298.15 K and 323.15 K using a quartz crystal balance.
Fluid Phase Equilibria. 1997;139:371-89.
[84] Krüger K-M, Sadowski G. Fickian and Non-Fickian Sorption Kinetics of Toluene in
Glassy Polystyrene. Macromolecules. 2005;38:8408-17.
[85] Aubert JH. Solubility of carbon dioxide in polymers by the quartz crystal
microbalance technique. The Journal of Supercritical Fluids. 1998;11:163-72.
[86] Boudouris D, Prinos J, Bridakis M, Pantoula M, Panayiotou C. Measurement of
HCFC-22 and HFC-152a sorption by polymers using a quartz crystal microbalance.
Industrial & engineering chemistry research. 2001;40:604-11.
[87] Pantoula M, Panayiotou C. Sorption and swelling in glassy polymer/carbon dioxide
systems: Part I. Sorption. The Journal of Supercritical Fluids. 2006;37:254-62.
[88] Oliveira NS, Oliveira J, Gomes T, Ferreira A, Dorgan J, Marrucho IM. Gas sorption
in poly(lactic acid) and packaging materials. Fluid Phase Equilibria. 2004;222–223:317-
24.

126
[89] Herrán F, Le Guet C, Favre A, Gaillard F. Validation, improvement and
implementation of sorption mathematical models using a quartz crystal microbalance
(QCM). Microelectronic Engineering. 2016;149:106-12.
[90] Smith AL, Shirazi HM. Principles of quartz crystal microbalance/heat conduction
calorimetry: Measurement of the sorption enthalpy of hydrogen in palladium.
Thermochimica Acta. 2005;432:202-11.
[91] v. Wroblewski S. Ueber die Natur der Absorption der Gase. Annalen der Physik.
1879;244:29-52.
[92] Reychler A. Absorption of Carbon Dioxide and Sulphur Dioxide by
Caoutchouc and by Blood Charcoa. Journal of the Chemical Society, Abstracts.
1911;100:ii1-ii35.
[93] Venable CS, Fuwa T. The Solubility of Gases in Rubber and Rubber Stock and
Effect of Solubility on Penetrability. Journal of Industrial & Engineering Chemistry.
1922;14:139-42.
[94] Odani H, Taira K, Tamaguchi T, Nemoto N, Murata M. Solubilities of Inert Gases in
Styrene-Butadiene-Styrene Block Copolymers (Special Issue on Polymer Chemistry XI).
1975.
[95] Michaels AS, Parker RB. The Determination of Solubility Constants for Gases in
Polymers. The Journal of Physical Chemistry. 1958;62:1604-.
[96] Nalawade SP, Picchioni F, Janssen LPBM. Supercritical carbon dioxide as a green
solvent for processing polymer melts: Processing aspects and applications. Progress in
Polymer Science. 2006;31:19-43.
[97] Daneshvar M, Kim S, Gulari E. High-pressure phase equilibria of polyethylene
glycol-carbon dioxide systems. The Journal of Physical Chemistry. 1990;94:2124-8.
[98] Garg A, Gulari E, Manke CW. Thermodynamics of Polymer Melts Swollen with
Supercritical Gases. Macromolecules. 1994;27:5643-53.
[99] Weidner E, Wiesmet V, Knez Ž, Škerget M. Phase equilibrium (solid-liquid-gas) in
polyethyleneglycol-carbon dioxide systems. The Journal of Supercritical Fluids.
1997;10:139-47.
[100] Wiesmet V, Weidner E, Behme S, Sadowski G, Arlt W. Measurement and
modelling of high-pressure phase equilibria in the systems polyethyleneglycol (PEG)–
propane, PEG–nitrogen and PEG–carbon dioxide. The Journal of Supercritical Fluids.
2000;17:1-12.
[101] Newitt DM, Weale KE. 310. Solution and diffusion of gases in polystyrene at high
pressures. Journal of the Chemical Society (Resumed). 1948:1541-9.
[102] Lundberg JL, Wilk MB, Huyett MJ. Estimation of diffusivities and solubilities
from sorption studies. Journal of Polymer Science. 1962;57:275-99.
[103] Lundberg JL, Wilk MB, Huyett MJ. Sorption Studies Using Automation and
Computation. Industrial & Engineering Chemistry Fundamentals. 1963;2:37-43.
[104] Shah VM, Hardy BJ, Stern SA. Solubility of carbon dioxide, methane, and propane
in silicone polymers. Effect of polymer backbone chains. Journal of Polymer Science Part
B: Polymer Physics. 1993;31:313-7.
[105] Stern SA, De Meringo AH. Solubility of carbon dioxide in cellulose acetate at
elevated pressures. Journal of Polymer Science: Polymer Physics Edition. 1978;16:735-
51.
[106] Hopfenberg HB. Permeability of plastic films and coatings: Springer; 1974.

127
[107] Koros WJ, Chan AH, Paul DR. Sorption and transport of various gases in
polycarbonate. Journal of Membrane Science. 1977;2:165-90.
[108] Sato Y, Fujiwara K, Takikawa T, Sumarno, Takishima S, Masuoka H. Solubilities
and diffusion coefficients of carbon dioxide and nitrogen in polypropylene, high-density
polyethylene, and polystyrene under high pressures and temperatures. Fluid Phase
Equilibria. 1999;162:261-76.
[109] Sato Y, Wang M, Takishima S, Masuoka H, Watanabe T, Fukasawa Y. Solubility
of butane and isobutane in molten polypropylene and polystyrene. Polymer Engineering
& Science. 2004;44:2083-9.
[110] Sato Y, Yurugi M, Fujiwara K, Takishima S, Masuoka H. Solubilities of carbon
dioxide and nitrogen in polystyrene under high temperature and pressure. Fluid Phase
Equilibria. 1996;125:129-38.
[111] Sato Y, Yurugi M, Yamabiki T, Takishima S, Masuoka H. Solubility of propylene
in semicrystalline polypropylene. Journal of Applied Polymer Science. 2001;79:1134-43.
[112] Bondar VI, Freeman BD, Pinnau I. Gas sorption and characterization of poly(ether-
b-amide) segmented block copolymers. Journal of Polymer Science Part B: Polymer
Physics. 1999;37:2463-75.
[113] Lin H, Freeman BD. Gas solubility, diffusivity and permeability in poly(ethylene
oxide). Journal of Membrane Science. 2004;239:105-17.
[114] Boyer SAE, Grolier J-PE. Simultaneous measurement of the concentration of a
supercritical gas absorbed in a polymer and of the concomitant change in volume of the
polymer. The coupled VW-pVT technique revisited. Polymer. 2005;46:3737-47.
[115] Grolier J-PE. Advanced experimental techniques in polymer thermodynamics. The
Journal of Chemical Thermodynamics. 2005;37:1226-38.
[116] Li D-c, Liu T, Zhao L, Yuan W-k. Solubility and Diffusivity of Carbon Dioxide in
Solid-State Isotactic Polypropylene by the Pressure−Decay Method. Industrial &
Engineering Chemistry Research. 2009;48:7117-24.
[117] Kim S, Seong JG, Do YS, Lee YM. Gas sorption and transport in thermally
rearranged polybenzoxazole membranes derived from polyhydroxylamides. Journal of
Membrane Science. 2015;474:122-31.
[118] Rezende CGF, Borges CP, Habert AC. Sorption of propylene and propane in
polyurethane membranes containing silver nanoparticles. Journal of Applied Polymer
Science. 2015:n/a-n/a.
[119] Sato Y, Takikawa T, Takishima S, Masuoka H. Solubilities and diffusion
coefficients of carbon dioxide in poly (vinyl acetate) and polystyrene. The journal of
Supercritical fluids. 2001;19:187-98.
[120] Kundra P, Upreti SR, Lohi A, Wu J. Experimental determination of composition-
dependent diffusivity of carbon dioxide in polypropylene. Journal of Chemical &
Engineering Data. 2010;56:21-6.
[121] Choudalakis G, Gotsis A. Permeability of polymer/clay nanocomposites: a review.
European Polymer Journal. 2009;45:967-84.
[122] Tendulkar J, Upreti S, Lohi A. Experimental determination of concentration‐dependent carbon dioxide diffusivity in LDPE. Journal of applied polymer science.
2009;111:380-7.

128
[123] Etminan SR, Maini BB, Chen Z, Hassanzadeh H. Constant-pressure technique for
gas diffusivity and solubility measurements in heavy oil and bitumen. Energy & Fuels.
2010;24:533-49.
[124] Lundberg J, Mooney E, Rogers C. Diffusion and solubility of methane in
polyisobutylene. Journal of Polymer Science Part A‐2: Polymer Physics. 1969;7:947-62.
[125] Hao M, Song Y, Su B, Zhao Y. Diffusion of CO 2 in n-hexadecane determined
from NMR relaxometry measurements. Physics Letters A. 2015;379:1197-201.
[126] Liang W, Huang Y, Xu Y, Lee RK, Yariv A. Highly sensitive fiber Bragg grating
refractive index sensors. Applied Physics Letters. 2005;86:151122.
[127] Ahmed F. Development of Fiber Optic Sensors using Femtosecond Laser for
Refractive Index and Temperature Measurements: University of Victoria; 2015.
[128] Ugale SP, Mishra V. Modeling and characterization of fiber Bragg grating for
maximum reflectivity. Optik - International Journal for Light and Electron Optics.
2011;122:1990-3.
[129] Chen J, Liu B, Zhang H. Review of fiber Bragg grating sensor technology.
Frontiers of Optoelectronics in China. 2011;4:204-12.
[130] Jung J, Nam H, Lee B, Byun JO, Kim NS. Fiber Bragg grating temperature sensor
with controllable sensitivity. Appl Opt. 1999;38:2752-4.
[131] Tian K, Liu Y, Wang Q. Temperature-independent fiber Bragg grating strain sensor
using bimetal cantilever. Optical Fiber Technology. 2005;11:370-7.
[132] Caucheteur C, Lhommé F, Chah K, Blondel M, Mégret P. Simultaneous strain and
temperature sensor based on the numerical reconstruction of polarization maintaining
fiber Bragg gratings. Optics and Lasers in Engineering. 2006;44:411-22.
[133] Fernández-Valdivielso C, Matı́as IR, Arregui FJ. Simultaneous measurement of
strain and temperature using a fiber Bragg grating and a thermochromic material. Sensors
and Actuators A: Physical. 2002;101:107-16.
[134] Hill KO, Fujii Y, Johnson DC, Kawasaki BS. Photosensitivity in optical fiber
waveguides: Application to reflection filter fabrication. Applied Physics Letters.
1978;32:647-9.
[135] Hill KO, Meltz G. Fiber Bragg grating technology fundamentals and overview.
Journal of lightwave technology. 1997;15:1263-76.
[136] Chan C-F, Chen C, Jafari A, Laronche A, Thomson DJ, Albert J. Optical fiber
refractometer using narrowband cladding-mode resonance shifts. Appl Opt.
2007;46:1142-9.
[137] Miao Y-p, Liu B, Zhao Q-d. Refractive index sensor based on measuring the
transmission power of tilted fiber Bragg grating. Optical Fiber Technology. 2009;15:233-
6.
[138] Iadicicco A, Campopiano S, Cutolo A, Giordano M, Cusano A. Self temperature
referenced refractive index sensor by non-uniform thinned fiber Bragg gratings. Sensors
and Actuators B: Chemical. 2006;120:231-7.
[139] Iadicicco A, Cusano A, Cutolo A, Bernini R, Giordano M. Thinned fiber Bragg
gratings as high sensitivity refractive index sensor. IEEE Photonics Technology Letters.
2004;16:1149-51.
[140] Guo T, Tam H-Y, Krug PA, Albert J. Reflective tilted fiber Bragg grating
refractometer based on strong cladding to core recoupling. Opt Express. 2009;17:5736-
42.

129
[141] Huy MCP, Laffont G, Frignac Y, Dewynter-Marty V, Ferdinand P, Roy P, et al.
Fibre Bragg grating photowriting in microstructured optical fibres for refractive index
measurement. Measurement Science and Technology. 2006;17:992.
[142] Zhou K, Lai Y, Chen X, Sugden K, Zhang L, Bennion I. A refractometer based on
a micro-slot in a fiber Bragg grating formed by chemically assisted femtosecond laser
processing. Opt Express. 2007;15:15848-53.
[143] Chong JH, Shum P, Haryono H, Yohana A, Rao MK, Lu C, et al. Measurements of
refractive index sensitivity using long-period grating refractometer. Optics
Communications. 2004;229:65-9.
[144] Kin Seng C, Yunqi L, Mei Nar N, Xiaoyi D. Analysis of etched long-period fibre
grating and its response to external refractive index. Electronics Letters. 2000;36:966-7.
[145] Vasiliev SA, Varelas D, Limberger HG, Dianov EM, Salathé RP. Postfabrication
resonance peak positioning of long-period cladding-mode-coupled gratings. Opt Lett.
1996;21:1830-2.
[146] Petrovic JS, Dobb H, Mezentsev VK, Kalli K, Webb DJ, Bennion I. Sensitivity of
LPGs in PCFs Fabricated by an Electric Arc to Temperature, Strain, and External
Refractive Index. Journal of Lightwave Technology. 2007;25:1306-12.
[147] Rindorf L, Jensen JB, Dufva M, Pedersen LH, Høiby PE, Bang O. Photonic crystal
fiber long-period gratings for biochemical sensing. Opt Express. 2006;14:8224-31.
[148] Eggleton BJ, Westbrook PS, Windeler RS, Spälter S, Strasser TA. Grating
resonances in air–silica microstructured optical fibers. Opt Lett. 1999;24:1460-2.
[149] Espindola RP, Windeler RS, Abramov AA, Eggleton BJ, Strasser TA, DiGiovanni
DJ. External refractive index insensitive air-clad long period fibre grating. Electronics
Letters. 1999;35:327-8.
[150] Kakarantzas G, Birks TA, Russell PSJ. Structural long-period gratings in photonic
crystal fibers. Opt Lett. 2002;27:1013-5.
[151] Humbert G, Malki A, Février S, Roy P, Pagnoux D. Characterizations at high
temperatures of long-period gratings written in germanium-free air–silica microstructure
fiber. Opt Lett. 2004;29:38-40.
[152] Zhu Y, He Z, Du H. Detection of external refractive index change with high
sensitivity using long-period gratings in photonic crystal fiber. Sensors and Actuators B:
Chemical. 2008;131:265-9.
[153] Dobb H, Kalli K, Webb DJ. Measured sensitivity of arc-induced long-period
grating sensors in photonic crystal fibre. Optics Communications. 2006;260:184-91.
[154] Jin-Fei D, Zhang AP, Li-Yang S, Jin-Hua Y, Sailing H. Fiber-taper seeded long-
period grating pair as a highly sensitive refractive-index sensor. IEEE Photonics
Technology Letters. 2005;17:1247-9.
[155] Yang J, Jiang L, Wang S, Li B, Wang M, Xiao H, et al. High sensitivity of taper-
based Mach–Zehnder interferometer embedded in a thinned optical fiber for refractive
index sensing. Appl Opt. 2011;50:5503-7.
[156] Rong Q, Qiao X, Wang R, Sun H, Hu M, Feng Z. High-Sensitive Fiber-Optic
Refractometer Based on a Core-Diameter-Mismatch Mach–Zehnder
Interferometer. IEEE Sensors Journal. 2012;12:2501-5.
[157] Yao Q, Meng H, Wang W, Xue H, Xiong R, Huang B, et al. Simultaneous
measurement of refractive index and temperature based on a core-offset Mach–Zehnder
130
interferometer combined with a fiber Bragg grating. Sensors and Actuators A: Physical.
2014;209:73-7.
[158] Jha R, Villatoro J, Badenes G. Ultrastable in reflection photonic crystal fiber modal
interferometer for accurate refractive index sensing. Applied Physics Letters.
2008;93:191106.
[159] Jha R, Villatoro J, Badenes G, Pruneri V. Refractometry based on a photonic
crystal fiber interferometer. Opt Lett. 2009;34:617-9.
[160] Deng M, Sun X, Huang W, Wei H, Li J. Photonic crystal fiber based modal
interferometer for refractive index sensing. 2014. p. 915785--4.
[161] Lee BH, Kim YH, Park KS, Eom JB, Kim MJ, Rho BS, et al. Interferometric fiber
optic sensors. Sensors. 2012;12:2467-86.
[162] Choi HY, Park KS, Lee BH. Photonic crystal fiber interferometer composed of a
long period fiber grating and one point collapsing of air holes. Opt Lett. 2008;33:812-4.
[163] Villatoro J, Monzon-Hernandez D. Low-cost optical fiber refractive-index sensor
based on core diameter mismatch. Journal of Lightwave Technology. 2006;24:1409-13.
[164] Wang P, Brambilla G, Ding M, Semenova Y, Wu Q, Farrell G. High-sensitivity,
evanescent field refractometric sensor based on a tapered, multimode fiber interference.
Opt Lett. 2011;36:2233-5.
[165] Wu Q, Semenova Y, Wang P, Farrell G. High sensitivity SMS fiber structure based
refractometer – analysis and experiment. Opt Express. 2011;19:7937-44.
[166] Shao M, Qiao X, Fu H, Li H, Jia Z, Zhou H. Refractive Index Sensing of SMS
Fiber Structure Based Mach-Zehnder Interferometer. IEEE Photonics Technology
Letters. 2014;26:437-9.
[167] Jung Y, Soan K, Lee D, Oh K. Compact three segmented multimode fibre modal
interferometer for high sensitivity refractive-index measurement. Measurement Science
and Technology. 2006;17:1129.
[168] Cusano A, Iadicicco A, Pilla P, Contessa L, Campopiano S, Cutolo A, et al. Mode
transition in high refractive index coated long period gratings. Opt Express. 2006;14:19-
34.
[169] Sergiy K, Seung-Woo L, Stephen WJ, Ralph PT. Refractive index sensitivity of
fibre-optic long period gratings coated with SiO 2 nanoparticle mesoporous thin films.
Measurement Science and Technology. 2011;22:075208.
[170] Villar ID, Matías IR, Arregui FJ, Lalanne P. Optimization of sensitivity in Long
Period Fiber Gratings with overlay deposition. Opt Express. 2005;13:56-69.
[171] Wang Z, Heflin JR, Stolen RH, Ramachandran S. Analysis of optical response of
long period fiber gratings to nm-thick thin-film coatings. Opt Express. 2005;13:2808-13.
[172] Coelho L, Viegas D, Santos JL, Almeida JMMMd. Enhanced refractive index
sensing characteristics of optical fibre long period grating coated with titanium dioxide
thin films. Sensors and Actuators B: Chemical. 2014;202:929-34.
[173] Bhatia V, Campbell DK, Sherr D, D’Alberto TG, Zabaronick NA, Ten Eyck GA, et
al. Temperature-insensitive and strain-insensitive long-period grating sensors for smart
structures. OPTICE. 1997;36:1872-6.
[174] Bhatia V. Properties and sensing applications of long-period gratings. 1996.
[175] Erdogan T. Cladding-mode resonances in short- and long-period fiber grating
filters. J Opt Soc Am A. 1997;14:1760-73.
131
[176] Yang R-Z, Dong W-F, Meng X, Zhang X-L, Sun Y-L, Hao Y-W, et al. Nanoporous
TiO2/Polyion Thin-Film-Coated Long-Period Grating Sensors for the Direct
Measurement of Low-Molecular-Weight Analytes. Langmuir. 2012;28:8814-21.
[177] Tang J-L, Wang J-N. Chemical Sensing Sensitivity of Long-Period Grating Sensor
Enhanced by Colloidal Gold Nanoparticles. Sensors. 2008;8:171.
[178] Lee B-H, Eom J-B, Park K-S, Park S-J, Ju M-J. Specialty Fiber Coupler:
Fabrications and Applications. J Opt Soc Korea. 2010;14:326-32.
[179] Wang A, Xiao H, Wang J, Wang Z, Zhao W, May RG. Self-Calibrated
Interferometric-Intensity-Based Optical Fiber Sensors. Journal of Lightwave Technology.
2001;19:1495.
[180] Tian Z, Yam SSH, Loock H-P. Refractive index sensor based on an abrupt taper
Michelson interferometer in a single-mode fiber. Opt Lett. 2008;33:1105-7.
[181] Wei T, Han Y, Li Y, Tsai H-L, Xiao H. Temperature-insensitive miniaturized fiber
inline Fabry-Perot interferometer for highly sensitive refractive index measurement. Opt
Express. 2008;16:5764-9.
[182] Hua P, Jonathan Luff B, Quigley GR, Wilkinson JS, Kawaguchi K. Integrated
optical dual Mach–Zehnder interferometer sensor. Sensors and Actuators B: Chemical.
2002;87:250-7.
[183] Pieter LS. Long-period grating Michelson refractometric sensor. Measurement
Science and Technology. 2004;15:1576.
[184] Wu C, Tse M-LV, Liu Z, Guan B-O, Lu C, Tam H-Y. In-line microfluidic
refractometer based on C-shaped fiber assisted photonic crystal fiber Sagnac
interferometer. Opt Lett. 2013;38:3283-6.
[185] Allsop T, Reeves R, Webb DJ, Bennion I, Neal R. A high sensitivity refractometer
based upon a long period grating Mach–Zehnder interferometer. Review of Scientific
Instruments. 2002;73:1702-5.
[186] Wong WC, Chan CC, Zhang YF, Leong KC. Miniature Single-Mode Fiber
Refractive Index Interferometer Sensor Based on High Order Cladding Mode and Core-
Offset. IEEE Photonics Technology Letters. 2012;24:359-61.
[187] Jung Y-m, Choi HY, Kim MJ, Lee BH, Oh K. Ultra-Compact Mach-Zehnder
Interferometer Using Hollow Optical Fiber for High Temperature Sensing. Optical Fiber
Communication Conference/National Fiber Optic Engineers Conference. San Diego,
California: Optical Society of America; 2008. p. JThA10.
[188] Viet Nguyen L, Hwang D, Moon S, Seung Moon D, Chung Y. High temperature
fiber sensor with high sensitivity based on core diameter mismatch. Opt Express.
2008;16:11369-75.
[189] Cárdenas-Sevilla GA, Monzón-Hernández D, Torres-Gómez I, Martínez-Ríos A.
Tapered Mach–Zehnder interferometer based on two mechanically induced long-period
fiber gratings as refractive index sensor. Optics & Laser Technology. 2012;44:1516-20.
[190] Wu D, Zhu T, Deng M, Duan D-W, Shi L-L, Yao J, et al. Refractive index sensing
based on Mach–Zehnder interferometer formed by three cascaded single-mode fiber
tapers. Appl Opt. 2011;50:1548-53.
[191] Yin G, Lou S, Zou H. Refractive index sensor with asymmetrical fiber Mach–
Zehnder interferometer based on concatenating single-mode abrupt taper and core-offset
section. Optics & Laser Technology. 2013;45:294-300.
132
[192] Li Y, Chen L, Harris E, Bao X. Double-Pass In-Line Fiber Taper
Mach–Zehnder Interferometer Sensor. IEEE Photonics Technology Letters.
2010;22:1750-2.
[193] Wu D, Zhu T, Chiang KS, Deng M. All Single-Mode Fiber Mach–Zehnder
Interferometer Based on Two Peanut-Shape Structures. Journal of Lightwave
Technology. 2012;30:805-10.
[194] Zhang S, Zhang W, Geng P, Gao S. Fiber Mach-Zehnder interferometer based on
concatenated down- and up-tapers for refractive index sensing applications. Optics
Communications. 2013;288:47-51.
[195] Zheng J, Yan P, Yu Y, Ou Z, Wang J, Chen X, et al. Temperature and index
insensitive strain sensor based on a photonic crystal fiber in line Mach–Zehnder
interferometer. Optics Communications. 2013;297:7-11.
[196] Deng M, Tang C-P, Zhu T, Rao Y-J. Highly sensitive bend sensor based on Mach–
Zehnder interferometer using photonic crystal fiber. Optics Communications.
2011;284:2849-53.
[197] Kim B, Kim T-H, Cui L, Chung Y. Twin core photonic crystal fiber for in-line
Mach-Zehnder interferometric sensing applications. Opt Express. 2009;17:15502-7.
[198] Wang J-N, Tang J-L. Photonic crystal fiber Mach-Zehnder interferometer for
refractive index sensing. Sensors. 2012;12:2983-95.
[199] Zhao Y, Wu D, Wang Q. All-fiber Mach-Zehnder interferometer using a tapered
photonic crystal fiber for refractive index measurement. IEEE SENSORS 2014
Proceedings2014. p. 1080-3.
[200] Wong WC, Zhou W, Chan CC, Dong X, Leong KC. Cavity ringdown refractive
index sensor using photonic crystal fiber interferometer. Sensors and Actuators B:
Chemical. 2012;161:108-13.
[201] Melo L, Burton G, Kubik P, Wild P. Refractive index sensor based on inline Mach-
Zehnder interferometer coated with hafnium oxide by atomic layer deposition. Sensors
and Actuators B: Chemical. 2016;236:537-45.
[202] Smietana M, Brabant D, Bock WJ, Mikulic P, Eftimov T. Refractive-Index Sensing
With Inline Core-Cladding Intermodal Interferometer Based on Silicon Nitride Nano-
Coated Photonic Crystal Fiber. Journal of Lightwave Technology. 2012;30:1185-9.
[203] Urrutia A, Goicoechea J, Arregui FJ. Optical Fiber Sensors Based on Nanoparticle-
Embedded Coatings. Journal of Sensors. 2015;2015:18.
[204] Chen C-H, Tsao T-C, Tang J-L, Wu W-T. A multi-D-shaped optical fiber for
refractive index sensing. Sensors. 2010;10:4794-804.
[205] Wang Y, Wang DN, Yang M, Hong W, Lu P. Refractive index sensor based on a
microhole in single-mode fiber created by the use of femtosecond laser micromachining.
Opt Lett. 2009;34:3328-30.
[206] Zhang Y. Novel Optical Sensors for High Temperature Measurement in Harsh
Environments. 2003.
[207] Barnes AE, May RG, Gollapudi S, Claus RO. Sapphire fibers: optical attenuation
and splicing techniques. Appl Opt. 1995;34:6855-8.
[208] Durrill PL, Griskey RG. Diffusion and solution of gases in thermally softened or
molten polymers: Part I. Development of technique and determination of data. AIChE
Journal. 1966;12:1147-51.

133
[209] Durrill PL, Griskey RG. Diffusion and solution of gases into thermally softened or
molten polymers: Part II. Relation of diffusivities and solubilities with temperature
pressure and structural characteristics. AIChE Journal. 1969;15:106-10.
[210] Lee M, Park CB, Tzoganakis C. Measurements and modeling of PS/supercritical
CO2 solution viscosities. Polymer Engineering & Science. 1999;39:99-109.
[211] Lundberg JL, Mooney EJ, Rogers CE. Diffusion and solubility of methane in
polyisobutylene. Journal of Polymer Science Part A-2: Polymer Physics. 1969;7:947-62.
[212] Eslami H, Müller-Plathe F. Molecular Dynamics Simulation of Sorption of Gases
in Polystyrene. Macromolecules. 2007;40:6413-21.
[213] Michaels AS, Vieth WR, Barrie JA. Solution of Gases in Polyethylene
Terephthalate. Journal of Applied Physics. 1963;34:1-12.
[214] Fleming GK, Koros WJ. Dilation of polymers by sorption of carbon dioxide at
elevated pressures. 1. Silicone rubber and unconditioned polycarbonate. Macromolecules.
1986;19:2285-91.
[215] Li G. PhD Thesis, University of Toronto.
[216] Cheng YL, Bonner DC. Solubility of ethylene in liquid, low-density polyethylene
to 69 atmospheres. Journal of Polymer Science: Polymer Physics Edition. 1977;15:593-
603.
[217] Maloney DP, Prausnitz JM. Solubility of Ethylene in Liquid, Low-Density
Polyethylene at Industrial-Separation Pressures. Industrial & Engineering Chemistry
Process Design and Development. 1976;15:216-20.
[218] Panayiotou C, Sanchez IC. Statistical thermodynamics of associated polymer
solutions. Macromolecules. 1991;24:6231-7.
[219] Simha R, Somcynsky T. On the Statistical Thermodynamics of Spherical and Chain
Molecule Fluids. Macromolecules. 1969;2:342-50.
[220] Jain RK, Simha R. Statistical thermodynamics of multicomponent fluids. 2.
Equation of state and phase relations. Macromolecules. 1984;17:2663-8.
[221] Guo Q, Park CB, Xu X, Wang J. Relationship of Fractional Free Volumes Derived
from the Equations of State (EOS) and the Doolittle Equation. Journal of Cellular
Plastics. 2007;43:69-82.
[222] Chapman WG, Gubbins KE, Jackson G, Radosz M. SAFT: Equation-of-state
solution model for associating fluids. Fluid Phase Equilibria. 1989;52:31-8.
[223] Huang SH, Radosz M. Equation of state for small, large, polydisperse, and
associating molecules. Industrial & Engineering Chemistry Research. 1990;29:2284-94.
[224] Huang SH, Radosz M. Equation of state for small, large, polydisperse, and
associating molecules: extension to fluid mixtures. Industrial & Engineering Chemistry
Research. 1991;30:1994-2005.
[225] Barrer R, Rideal EK. Permeation, diffusion and solution of gases in organic
polymers. Transactions of the Faraday Society. 1939;35:628-43.
[226] Crank J. The Mathematics of Diffusion: 2d Ed: Clarendon Press; 1975.
[227] Vieth WR, Sladek KJ. A model for diffusion in a glassy polymer. Journal of
Colloid Science. 1965;20:1014-33.
[228] Kloppfer M, B. F. Transport Properties of Gases in Polymers: Bibliographic
Review B. Flaconneche. Oil & Gas Science and Technology, Rev IFP. 2001;56:3.

134
[229] Paul DR, Koros WJ. Effect of partially immobilizing sorption on permeability and
the diffusion time lag. Journal of Polymer Science: Polymer Physics Edition.
1976;14:675-85.
[230] Barbari TA, Koros WJ, Paul DR. Gas sorption in polymers based on bisphenol‐A.
Journal of Polymer Science Part B: Polymer Physics. 1988;26:729-44.
[231] Fujita H, Kishimoto A. Diffusion‐controlled stress relaxation in polymers. II. Stress
relaxation in swollen polymers. Journal of Polymer Science. 1958;28:547-67.
[232] Comyn J. Polymer Permeability. London: Elsevier Applied Science Publishers;
1985.
[233] Peterlin A. Dependence of diffusive transport on morphology of crystalline
polymers. Journal of Macromolecular Science, Part B: Physics. 1975;11:57-87.
[234] Fujita H. Organic vapors above the glass transition temperature. Diffusion in
polymers. 1968:75-105.
[235] Cohen MH, Turnbull D. Molecular Transport in Liquids and Glasses. The Journal
of Chemical Physics. 1959;31:1164-9.
[236] Kundra P, Upreti S, Lohi A, Wu J. Experimental determination of concentration
dependence of nitrogen diffusivity in polypropylene. Journal of Applied Polymer
Science. 2011;121:2828-34.
[237] Grandidier J-C, Baudet C, Boyer SA, Klopffer M-H, Cangémi L. Diffuso-Kinetics
and Diffuso-Mechanics of Carbon Dioxide/Polyvinylidene Fluoride System under
Explosive Gas Decompression: Identification of Key Diffuso-Elastic Couplings by
Numerical and Experimental Confrontation. Oil & Gas Science and Technology–Revue
d’IFP Energies nouvelles. 2015;70:251-66.
[238] Prager S, Long F. Diffusion of Hydrocarbons in Polyisobutylene1. Journal of the
American Chemical Society. 1951;73:4072-5.
[239] Crank J. A theoretical investigation of the influence of molecular relaxation and
internal stress on diffusion in polymers. Journal of Polymer Science. 1953;11:151-68.
[240] Pant PVK, Boyd RH. Molecular-dynamics simulation of diffusion of small
penetrants in polymers. Macromolecules. 1993;26:679-86.

135
Appendix A – Theoretical approaches for solubility study
Many thermodynamic models are developed to study polymer melts and multi-
component polymer blend systems. These theoretical thermodynamic models have been
utilized by researchers to study the phase equilibrium behaviors between a gas/SCF and a
polymer. Theoretical thermodynamic models can be useful tools to study many
fundamental properties such as solubility and diffusivity of polymer/gas mixture systems.
The basic theories and various equations of states (EOSs) are briefly discussed in this
section..
An EOS is a mathematical relation among volume, pressure, temperature, and the
composition of a closed system. In general, EOSs can be categorized into two types:
empirical and theoretical models. The empirical EOSs are used more in the interpolation
of obtained data, and thus result in poor predictions when extrapolated to high
temperature or pressure conditions much beyond the ranges of experimental data.
Furthermore, the empirical EOSs are difficult to use in systems with strong polar
molecules or supercritical components. In contrast, the theoretical methods based on
statistical thermodynamics offer many advantages over the empirical approaches. These
models require less mixture data for the parameter fitting, allowing more reliability in the
extrapolation at high temperatures and pressures, and simplifying the calculations of
multi-component mixtures or systems with supercritical components. The following
sections describe the theoretical approaches based on statistical thermodynamics.
136
A.1. Henry’s law
Henry’s law is not considered as an EOS model but it is a relation to estimate gas/SCF
solubility in a polymer. According to Durill et al. Henry’s law is reliable only at low
pressures [96, 208]. These researchers tested up to 30 MPa assuming that a Henry’s law
constant is independent of pressure [209, 210]. However, at high pressures, a gas sorption
isotherm has deviated significantly from the Henry’s law [96]. This deviation has been
improved through the Langmuir type isotherm which accounts for gas solubility in
interstitial spaces and micro-voids [211, 212]. Michaels et al. correlated the solubility of
He, N2, O2, Ar, CH4, CO2, and ethane in polyethylene terephthalate (PET) and studied the
deviations of gas sorption isotherms from the Henry’s law [213]. The Henry’s law
represents reliable data in low pressures below 2 MPa and thus is commonly used in
many solubility studies [107, 214]. The relation between a Henry’s law constant and a
temperature can be described as: H1=H0exp(-Es/RT), where H0 and H1 are the Henry’s
law constants, Es is the heat of solution, and T is the temperature [210].
A.2. Flory-Huggins Theory (Cell Model)
The classical Flory-Huggins theory is based on a lattice model for describing
polymer/solvent or polymer/polymer mixture systems. In a lattice model, all the cells are
occupied with segments (i.e., solvent molecule or segment of a long polymer chain). The
volume among different segments (segments of a long polymer chain or small solvent
molecules) is assumed to be the same. Moreover, an assumption is made where a polymer
segment and a solvent molecule could replace one another in the liquid lattice. The

137
energy of mixing for a mixture system is from both enthalpy of mixing and entropy of
mixing.
The Flory-Huggins theory is a special model of the general cell model where all the
cells are occupied by either the polymer chain segments or the small solvent molecules.
This cell model demonstrates that the thermodynamic properties of a mixture strongly
depend on the thermodynamic properties (volume, compressibility, etc.) of each pure
component.
Schematic of a Flory-Huggins thermodynamic model [215]. Black circles and white
circles represent polymer molecule chains and small solvent molecules, respectively.
Y. L. Cheng et al. first used the Flory-Huggins theory to study gas solubility in a
polymer [216]. The Flory-Huggins theory is useful to investigate solubility and phase
equilibrium within limited pressure and dissolved gas concentration ranges, but the
concern is that this theory fails to predict isothermal data at high pressure and high
dissolved gas concentration ranges as it ignores the volumetric changes of a polymer/gas
mixture system by pressure, temperature, and mixing [217].
A.3. Sanchez-Lacombe Theory (Lattice Fluid Model)
To overcome the limitations of the Flory-Huggins theory, Sanchez and Lacombe
proposed a dimensionless theoretical model based on a fluid-lattice theory (i.e., the SL
EOS). Vacant cells are adopted in Sanchez-Lacombe theory, and these cells are
introduced in the lattice to illustrate the extra entropy change in the system as a function

138
of volume and temperature of the polymer/gas mixture system. The changes in volume
only occur when new holes or vacant sites occur on the lattice because the lattice size, or
cell volume (i.e., occupied volume), is fixed. To obtain a pure component, SL EOS
requires three EOS parameters such as a characteristic temperature T*, a characteristic
pressure p*, and a characteristic specific volume v*sp, similar to the Flory-Huggins
theory.
The SL EOS is a quantitative theory and it is applicable for both gaseous and liquid
states. The chemical potential of a gas component can be calculated the same way as that
of a liquid phase. Therefore, the SL EOS is not required to define a standard state for a
gas (i.e., gas standard state fugacity) unlike the Flory theory. The SL EOS model is the
most widely used EOS model, and C. Panyaiotou extended this SL EOS further by
accounting for the strong interactions (i.e., hydrogen bonding) between the polymer and
the solvent [218]. The SL EOS model is simple while being capable of extrapolating the
available experimental data to high temperatures and pressures and thus is used widely to
investigate gas solubility in polymers [37, 41, 108-111].
A.4. Simha-Somcynsky Theory (Hole Model)
To improve the Flory-Huggins thoery for the liquid state (i.e., polymer melts), Simha
and his co-workers proposed the SS theory based on the lattice-hole theory [219, 220].
The lattice-hole model considers a lattice of cells, each of which can accommodate either
a small molecule or a chain segment. Also, similar to the lattice fluid model, the hole
model improves the liquid state cell model by introducing the vacancies in the lattice,
which can describe the thermal expansion [219]. In obtaining the characteristic

139
parameters of SS EOS, it uses the “square well” approximation to the cell potential and
the nearest neighbor contributions to the lattice energy are not included. The resulting
coupled equation of states must be solved simultaneously with an expression minimizing
the partition function with respect to the fraction of occupied sites. Unlike SL EOS, in the
SS theory, the change in a cell volume, or the occupied volume, is also allowed with
temperature and pressure. According to Q. Gao, C.B Park, X. Xu, and J. Wang, SL EOS
better fits for the data of gas while SS EOS better fits for data of polymers [221].
A.5. Statistical Association Fluid Theory (SAFT)
Statistical Association Fluid Theory or SAFT, is an EOS based on the lattice theory
[222] where it assumes that real fluids exist in a continuous space rather than in a lattice
[96]. The SAFT EOS has been proven to successfully forecast the thermodynamic
properties of small molecules over a wide density range, and has also been applied
effectively to polymeric fluids and their mixtures. Instead of using a hard sphere
reference fluid as in many other engineering EOS, the SAFT is developed from an idea of
a reference fluid incorporating both the molecular geometry and molecular association
effects. In the SAFT model, the fluids (molecules) are described as equi-sized spherical
segments interacting according to a square-well potential. Therefore, the component
(molecules) is well described with the following three component parameters: m, υ00, and
u0/k, where m is the number of segments per molecule, υ00 is the segment molar volume
in a close-packed arrangement in milliliters per mole of segments, and u0/k is the segment
energy or the well depth, a temperature-independent energy parameter, in kelvin.
140
The SAFT EOS can be used for various gas/SCF polymer systems at high pressures
[100, 223]. S.H. Huang et al. extended the SAFT EOS theory to study the mixtures of
real, molecular, and macromolecular fluids over a wide density range to investigate gas
solubility in a polymer [223, 224]. This model is more complex than the SL EOS but it
accounts for the specific interaction such as hydrogen bonding among the segments of
polymer molecules [40].
141
Appendix B – Theoretical approaches for diffusivity study
Two kinds of diffusion, steady and unsteady diffusion, are discussed here. The
diffusivity values of these two types of diffusion are always obtained by applying
mathematic models with the corresponding experimental data. Common equations and
models are described below..
B.1. Steady Diffusion
For steady diffusion, a flux does not change with time but with space. It is expressed
as:
𝐽 = −𝐷∇𝐶 (13)
where J is the fluxes of atoms in atoms/(m2 s), D is a diffusion coefficient in m2/s, and
C is a concentration gradient in atoms/m4. It is called a Fick’s first law. Considering a
unidirectional case, this equation can be simplified as:
𝐽𝑥 = −𝐷𝑑𝐶
𝑑𝑥 (14)
This simplification is valid in a membrane diffusion case when the thickness of a
membrane is much smaller than the other dimensions. The mean diffusion coefficient
over the entire range of concentrations can be obtained by the “time lag” method
developed by R. M. Barrer and E. K. Rideal in 1939 [225]. In a steady state, the mean
diffusion coefficient is directly proportional to time:

142
𝐷 =𝑙2
6𝜃 (15)
Where D is the diffusion coefficient, 𝑙 is the length of a polymer sample which a gas
travels through, and 𝜃 is the time lag which is the intercept of the time axis with the
extrapolated linear steady state portion of the pressure-time curve.
B.2. Unsteady Diffusion
This is the case where a gas flux changes with respect to time before a diffusion
process reaches equilibrium. Many different models are used to describe this type of
diffusion: Crank’s model, Dual mode model, Gas-Polymer Matrix Model, Free Volume
Model, Mass Transfer Model, and some Empirical Models. Some of these models have
very limited applications. For example, a Dual mode model and a Gas-Polymer Matrix
Model are only used for glassy polymers. The detailed descriptions on each of these
models are described below.
1) Crank’s model
Crank’s model developed by J. Crank and G. S. Park is most used, since this model is
easy to understand, and suitable for various experimental geometries, accommodating
different boundary conditions. A sample shape has a great effect on gas transport
behaviors. In 1968, Crank and Park derived several equations based on the sample
geometries. The following equation was used to describe unsteady gas diffusion through
a polymer film[226]:

143
Mt
M∞= 2 (
Dt
πL2)
12 (16)
where Mt and M∞ represent the mass uptakes of a penetrant at time t and at a long
time, respectively. L is a diffusion length. This model is mostly used in pressure decay
experiments. This equation can also be applied to diffusion cases along a cylindrical rod
or tube with a length of L, where one end of its surface is sealed and the other end is
maintained at a constant concentration [226].
Although the simplified model is widely used, the original model (Mt
M∞=
2(Dt
l2 )1/2 {π−1/2 + 2 ∑ (−1)nierfcnl
√(Dt)
∞n=1 }) gives more comprehensive descriptions of
solubility and diffusivity calculations [227].
2) Dual-mode Sorption Model
This model divides diffusing molecules into two different populations: (i) the
molecules dissolved by an ordinary dissolution process whose concentration is CD, and
(ii) the molecules trapped in micro-voids which do not diffuse whose concentration is CH.
The dissolved gas molecules obey The Henry’s law:
𝐶𝐷 = 𝑘𝐷𝑝 (17)
The concentration of the trapped gas molecules in micro-voids is given by the equation
of Langmuir [228]:
𝐶𝐻 =𝐶′𝐻𝑏𝑝
1+𝑏𝑝 (18)
where C’H is a Langmuir saturation constant, which is directly related to the global
volume of a specific site (i.e., micro-voids), and b is an affinity constant for these sites, p
is the pressure.

144
These two populations have their own constant diffusion coefficients (𝐷𝐷,𝐷𝐻) [229]
and J is the total flux.
𝐽 = 𝐽𝐷 + 𝐽𝐻 = −𝐷𝐷
𝜕𝐶𝐷
𝜕𝑥− 𝐷𝐻
𝜕𝐶𝐻
𝜕𝑥 (19)
3) Gas-Polymer Matrix Model
Different from the dual mode model described in the previous section, this gas-polymer
matrix model is based on the assumption that there is only one population of a penetrant
but with an interaction between a solute and a polymer matrix. The basic concept
involves an activation energy which represents the necessary energy for the separation of
macromolecular chains by cooperative motions of sufficient amplitudes to allow a
penetrant to execute its diffusional jump. This model assumes that the presence of a
penetrant reduces the intermolecular forces between the polymer chains, resulting in a
smaller necessary activation energy for the separation of chains. The increase in a
penetrant concentration leads to a higher diffusion coefficient due to an enhanced
segmental mobility of the chains. From a mathematical viewpoint, this theory proposes
the following relation to express the interaction between a penetrant and a polymer [229]:
𝐷 = 𝐷0(1 + 𝛽𝐶)exp (𝛽𝐶) (20)
where 𝐷0 is a diffusion coefficient in a zero-concentration limit, 𝛽 is a constant
relating the excess activation energy of chain separation to the depression of the glass-
transition temperature of the polymer by a gas, and 𝐶 is a gas concentration. As for the
concentration, it can be expressed as:
𝐶 = 𝜎0𝑝exp(−𝛼𝐶) (21)
where σ0 is a solubility coefficient at infinite dilution, 𝑝 is pressure, and α is a
constant describing the effect of gas-polymer interactions on solubility changes. The
145
smaller α is, the less effect a penetrant has on solubility [230]. This model gives a better
understanding of molecular interactions, gas perturbation, and thermodynamics than the
dual-mode sorption model.
4) Free Volume Model
The basic idea of this theory is that a gas molecule can move from an original position
to another when a local free volume exceeds a certain free volume fraction limit. This
model explains the relationship among a diffusion coefficient and parameters such as a
glass transition temperature, a penetrant shape and size, a temperature, and a
concentration.
A free volume fraction, 𝑓, is one of the most important parameters for solubility and
diffusivity definitions. It is defined as:
𝑓 =𝑉𝑓
𝑉𝑇𝑜𝑡=
𝑉𝑇𝑜𝑡 − 𝑉𝑜𝑐𝑐
𝑉𝑇𝑜𝑡 (22)
where 𝑉𝑇𝑜𝑡 is a total volume, 𝑉𝑜𝑐𝑐 is an occupied molecules volume and 𝑉𝑓 is a free
volume.
A thermodynamic diffusion coefficient, 𝐷𝑇 , is given by H. Fujita and K. Kishimoto
[231] as:
𝐷𝑇 = 𝑅𝑇𝐴𝑑 exp (−𝐵𝑑
𝑓) = 𝑅𝑇𝑚𝑑 (23)
where 𝑅 is a gas constant, T is a temperature, 𝐴𝑑 is a parameter related to a penetrant
size and shape, 𝐵𝑑 is a characteristic parameter of an available free volume fraction, and
𝑚𝑑is a mobility of diffusing molecules relative to a polymer. The combined free volume
fraction, 𝑓,is defined as:

146
𝑓 = 𝜙1𝑓1 + 𝜙2𝑓2 (24)
where 𝜙𝑖 𝑎𝑛𝑑 𝑓𝑖 are corresponding volume fraction and the free volume fraction for a
component 𝑖. The index 1 refers to the diffusing molecule and the index 2 to the
polymer. Defined by J. Comyn [232], 𝐷𝑇 can also be expressed as:
𝐷𝑇 = 𝐴𝑒𝑥𝑝(𝜕𝑙𝑛𝐶
𝜕𝑙𝑛𝑎) (25)
where C is a penetrant concentration, and 𝑎 is a penetrant activity parameter.
Based on the J. Comyn’s research, A. Peterlin modified the equation (11) and
proposed the following equation [233]:
𝐷 = 𝐷(0)exp (𝛼𝑑𝐶) (26)
where,
𝛼𝑑 =𝐵𝑑𝑓1
(ϕ2 𝑓2)2 (27)
𝐷(0) = 𝑅𝑇𝐴𝑑exp (−𝐵𝑑
𝜙2𝑓2) (28)
Here, index 1 refers to the diffusing molecule and index 2 to the polymer.
However, this model is considered inappropriate for diffusion of small molecules.
Therefore, correction for a free volume fraction was applied to the model. The free
volume fraction depends on three thermodynamic variables as shown below [233-235]:
𝑓(T, p, C)=fref(Tref, pref, 0) + 𝛼(T − Tref) − 𝛽(p − pref) + 𝛾𝐶 (29)
The first term describes a standard fractional free volume in a reference state; the
second term shows the increase of a free volume with thermal dilation where is a
thermal expansion coefficient of the free volume; the third term indicates free volume
shrinking during a hydrostatic compression (is compressibility); and the forth term
weighs the influence of a gas concentration on a free volume.
147
5) Mass Transfer Model
This theory is based on the Fick’s second law. This model can determine a diffusion
coefficient by measure a gas concentration in the polymer phase. The basic procedure of
this model is to fit experimental gas concentration data with a predicted function.
In a transient state, a penetrant concentration could be expressed by functions of gas
location in the sample and time. A diffusion coefficient is an optimization parameter in
this function.
The fundamental equation for this model is:
𝜕𝑐
𝜕𝑡= 𝐷
𝜕2𝑐
𝜕𝑧2 (30)
Where 𝑐 is a penetrant concentration, 𝑡 is time, and 𝑧 is a gas travel direction in the
sample, and 𝐷 is a diffusion coefficient. This equation was modified by many researchers
[120, 122, 236]. An initial condition is given as below, describing no gas concentration
in a polymer sample at time t = 0 [226]:
𝑐(𝑧, 0) = 0 0 < 𝑧 ≤ 𝐿 (31)
For gravimetric experiments with the samples with one sealed end, the boundary
conditions for 𝑧 = 0 are as below with no gas concentration change at the sealed end:
𝑐(0, 𝑡) = 𝑐(𝑡) 0 ≤ 𝑡 ≤ 𝑇 (32)
𝜕𝑐
𝜕𝑧|
𝑧=𝐿= 0 0 ≤ 𝑡 ≤ 𝑇
𝜕𝑐
𝜕𝑡= 𝐷
𝜕2𝑐
𝜕𝑧2 (33)
This model can also be approached with an iterative algorithm with an initial guess
value for a diffusivity coefficient. The value for a diffusivity coefficient keeps changing
until the difference between calculated and experimental data are within the tolerance
limit.
148
6) Empirical Model
For gas/polymer systems in which gas solubility essentially obeys The Henry’s law
(e.g., hydrocarbons in elastomers), the dependence of a diffusion coefficient on the
absorbed penetrant concentration has been empirically represented at a given temperature
by the equations shown below [237]:
Linear model [238]:
𝐷(𝐶) = 𝐷0(1 + 𝛽𝐶) (34)
Exponent model [234, 239]:
𝐷(𝐶) = 𝐷0𝑒𝛽𝐶𝑐(𝑧, 0) = 0 0 < 𝑧 ≤ 𝐿 (35)
Concentration and pressure dependent model [240]:
𝐷(𝐶, 𝑝) = 𝐷(0,0)𝑒(𝛽𝑝+𝛼𝐶) (36)
Where 𝐷 is a diffusion coefficient, C is a penetrant concentration, 𝑝 is a pressure, 𝐷0 is
a diffusion coefficient when 𝐶 is zero, 𝛽 is a temperature dependent constant, and 𝛼 is a
constant related to plasticization.
The equations (21) and (22) obey the Henry’s law. In equation (22), the diffusion
coefficient shows a stronger dependence on the concentration. Equation (23) takes
hydrostatic constraint and plasticization into account[237].