Fiber Optic Sensing System (FOSS) Technology n · n Fiber Optic Sensing System (FOSS) Technology A...
62
National Aeronautics and Space Administration National Aeronautics and Space Administration Fiber Optic Sensing System (FOSS) Technology A New Sensor Paradigm for Comprehensive Structural Monitoring and Model Validation throughout the Vehicle Life - Cycle Francisco Peña , Dr . Lance Richards, Allen. R. Parker, Jr., Anthony Piazza, Patrick Chan, and Phil Hamory NASA Armstrong Flight Research Center Edwards, CA January 20 th , 2015 https://ntrs.nasa.gov/search.jsp?R=20160001157 2019-12-28T05:32:46+00:00Z
Transcript of Fiber Optic Sensing System (FOSS) Technology n · n Fiber Optic Sensing System (FOSS) Technology A...
National A
ero
nautics a
nd S
pace A
dm
inis
tration
National A
ero
nautics a
nd S
pace A
dm
inis
tration Fiber Optic Sensing System (FOSS)
Technology
A New Sensor Paradigm for Comprehensive Structural
Monitoring and Model Validation throughout the Vehicle
Life-Cycle
Francisco Peña, Dr. Lance Richards, Allen. R. Parker, Jr.,
Anthony Piazza, Patrick Chan, and Phil Hamory
NASA Armstrong Flight Research Center
Edwards, CA
January 20th, 2015
https://ntrs.nasa.gov/search.jsp?R=20160001157 2019-12-28T05:32:46+00:00Z
National A
ero
nautics a
nd S
pace A
dm
inis
tration
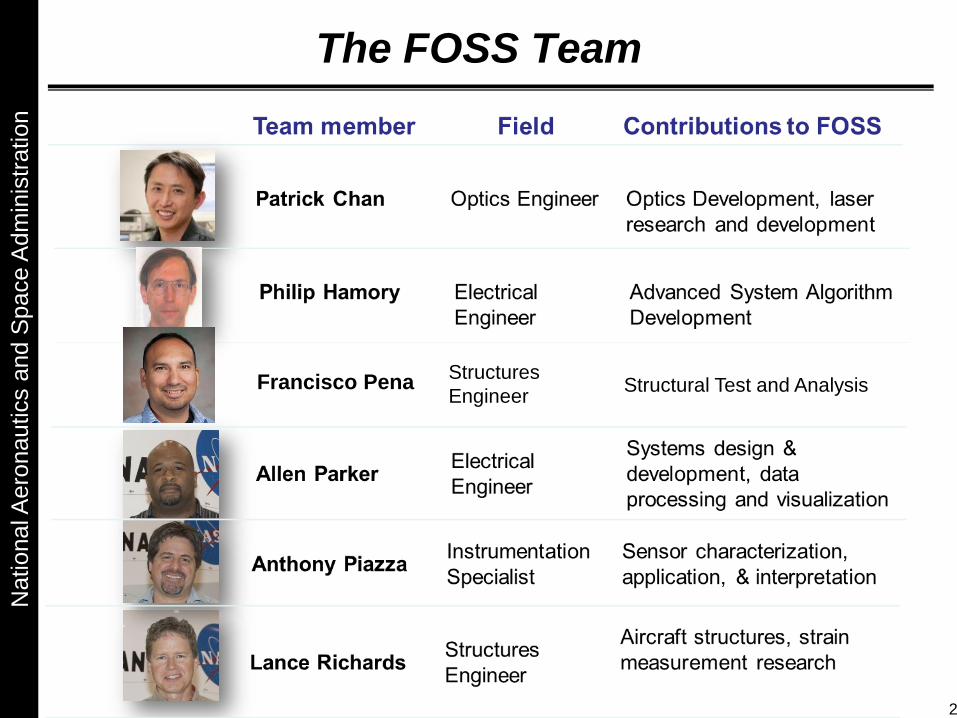
The FOSS Team
Francisco PenaStructures
EngineerStructural Test and Analysis
2
National A
ero
nautics a
nd S
pace A
dm
inis
tration
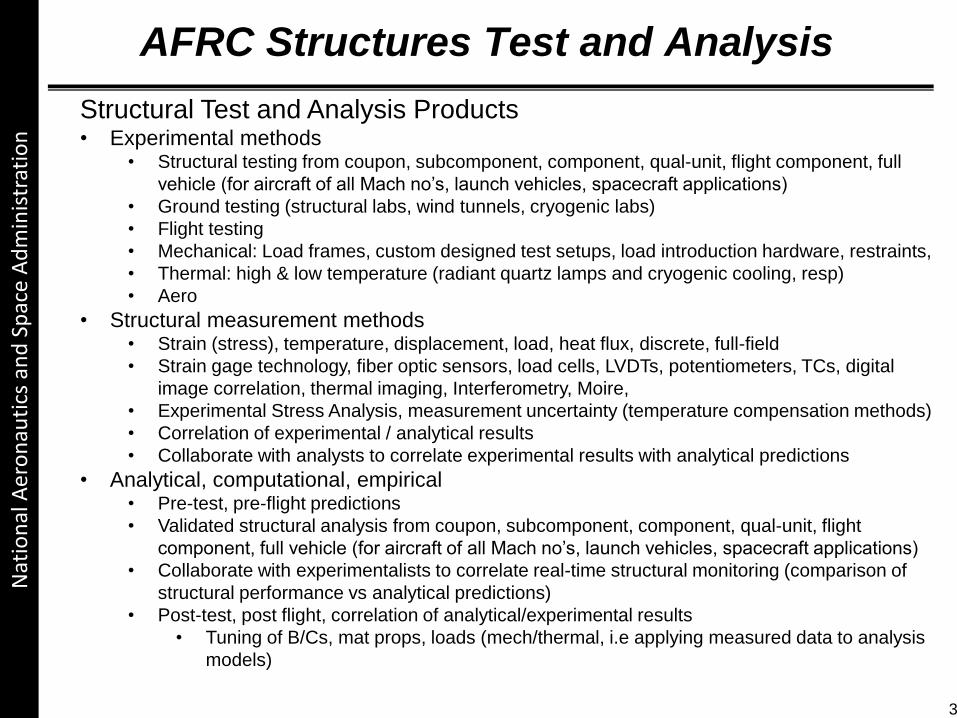
AFRC Structures Test and Analysis
Structural Test and Analysis Products• Experimental methods
• Structural testing from coupon, subcomponent, component, qual-unit, flight component, full
vehicle (for aircraft of all Mach no’s, launch vehicles, spacecraft applications)
• Ground testing (structural labs, wind tunnels, cryogenic labs)
• Flight testing
• Mechanical: Load frames, custom designed test setups, load introduction hardware, restraints,
• Thermal: high & low temperature (radiant quartz lamps and cryogenic cooling, resp)
• Aero
• Structural measurement methods• Strain (stress), temperature, displacement, load, heat flux, discrete, full-field
• Strain gage technology, fiber optic sensors, load cells, LVDTs, potentiometers, TCs, digital
image correlation, thermal imaging, Interferometry, Moire,
• Experimental Stress Analysis, measurement uncertainty (temperature compensation methods)
• Correlation of experimental / analytical results
• Collaborate with analysts to correlate experimental results with analytical predictions
• Analytical, computational, empirical• Pre-test, pre-flight predictions
• Validated structural analysis from coupon, subcomponent, component, qual-unit, flight
component, full vehicle (for aircraft of all Mach no’s, launch vehicles, spacecraft applications)
• Collaborate with experimentalists to correlate real-time structural monitoring (comparison of
structural performance vs analytical predictions)
• Post-test, post flight, correlation of analytical/experimental results
• Tuning of B/Cs, mat props, loads (mech/thermal, i.e applying measured data to analysis
models)
Nat
ion
al A
ero
nau
tics
an
d S
pac
e A
dm
inis
trat
ion
3

National A
ero
nautics a
nd S
pace A
dm
inis
tration
NASA Focused Structural Health Monitoring
Structures
Materials
SHM
NDE
Key DriversVehicle-focused
Real-time,
decision-making
Online processing
Onboard systems
Lightweight,
Small size,
Low power,
System solutions
Enabling
TechnologiesAdvanced Sensing
- Multi-parameter
- Sensor arrays
Advanced Systems
and Processing
- Solid state
- Rugged
- High Speed
Ultra-Efficient
Algorithms
4
National A
ero
nautics a
nd S
pace A
dm
inis
tration
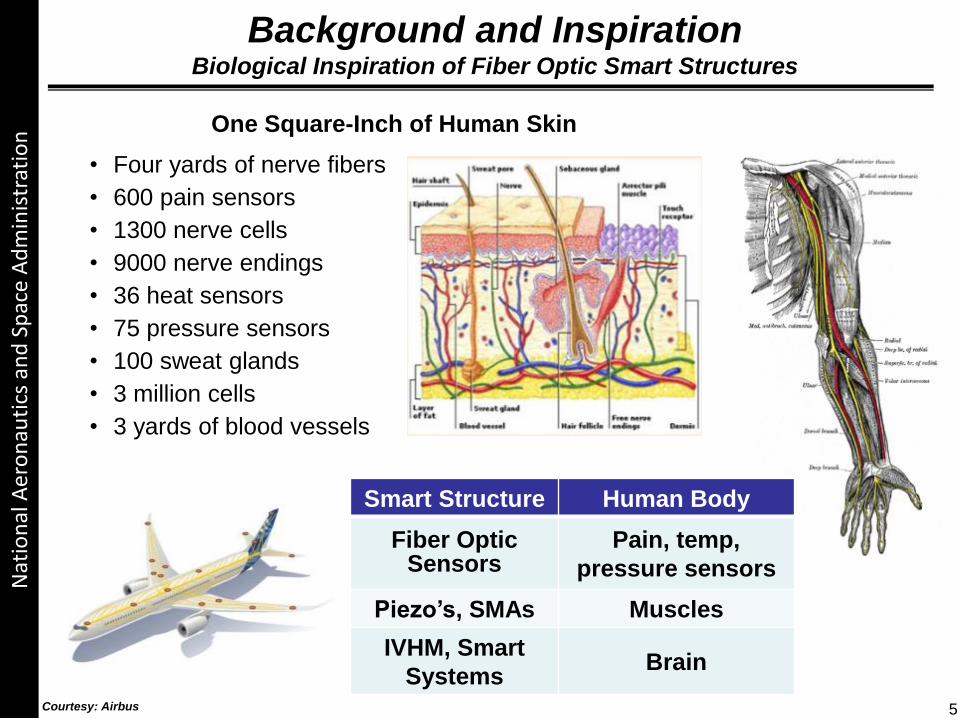
Background and InspirationBiological Inspiration of Fiber Optic Smart Structures
• Four yards of nerve fibers
• 600 pain sensors
• 1300 nerve cells
• 9000 nerve endings
• 36 heat sensors
• 75 pressure sensors
• 100 sweat glands
• 3 million cells
• 3 yards of blood vessels
One Square-Inch of Human Skin
Smart Structure Human Body
Fiber OpticSensors
Pain, temp,
pressure sensors
Piezo’s, SMAs Muscles
IVHM, Smart
SystemsBrain
Nat
ion
al A
ero
nau
tics
an
d S
pac
e A
dm
inis
trat
ion
Courtesy: Airbus 5

National A
ero
nautics a
nd S
pace A
dm
inis
tration
Why Fiber Optic Sensors?
(Complex)
(Heavy) (Big)
(Light, small, easy)
One Of These Things (is Not Like The Others)
Nat
ion
al A
ero
nau
tics
an
d S
pac
e A
dm
inis
trat
ion
6
National A
ero
nautics a
nd S
pace A
dm
inis
tration
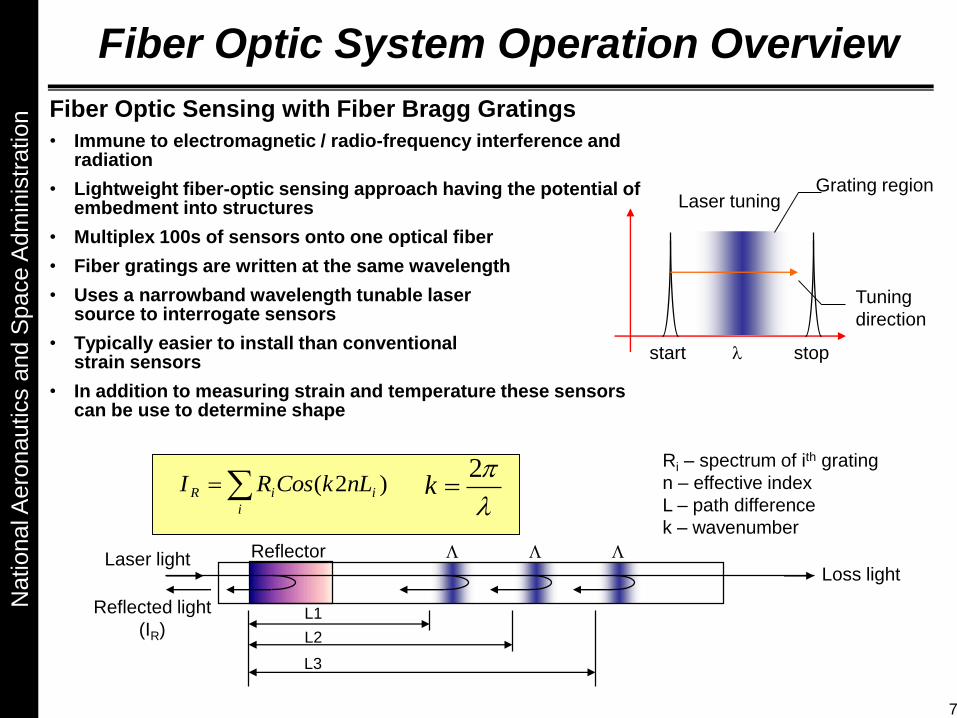
Fiber Optic System Operation Overview
Fiber Optic Sensing with Fiber Bragg Gratings
• Immune to electromagnetic / radio-frequency interference and radiation
• Lightweight fiber-optic sensing approach having the potential of embedment into structures
• Multiplex 100s of sensors onto one optical fiber
• Fiber gratings are written at the same wavelength
• Uses a narrowband wavelength tunable laser source to interrogate sensors
• Typically easier to install than conventionalstrain sensors
• In addition to measuring strain and temperature these sensors can be use to determine shape
Reflector L L L
L1
L3
L2
Laser lightLoss light
Reflected light
(IR)
Laser tuning
start stopl
i
iiR nLkCosRI )2(Ri – spectrum of ith grating
n – effective index
L – path difference
k – wavenumberl
2k
Grating region
Tuning
direction
7
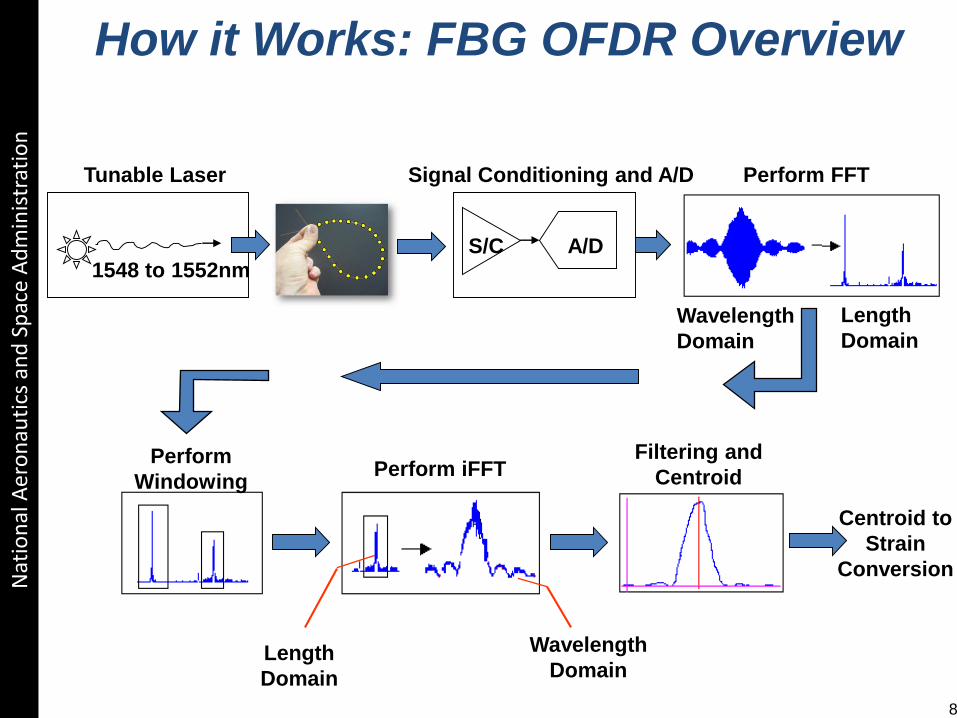
How it Works: FBG OFDR Overview
1548 to 1552nm
Tunable Laser Perform FFT
Perform
WindowingPerform iFFT
Filtering and
Centroid
S/C A/D
Signal Conditioning and A/D
Centroid to
Strain
Conversion
Wavelength
Domain
Length
Domain
Wavelength
DomainLength
Domain
Nat
ion
al A
ero
nau
tics
an
d S
pac
e A
dm
inis
trat
ion
8
National A
ero
nautics a
nd S
pace A
dm
inis
tration
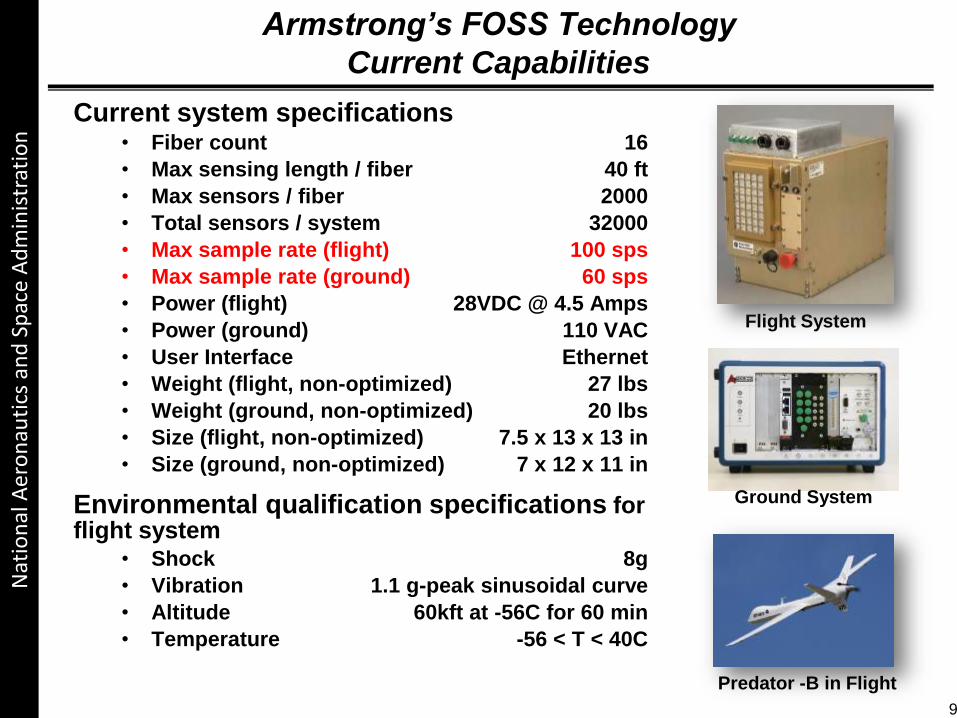
Armstrong’s FOSS Technology
Current Capabilities
Flight System
Predator -B in Flight
Current system specifications• Fiber count 16
• Max sensing length / fiber 40 ft
• Max sensors / fiber 2000
• Total sensors / system 32000
• Max sample rate (flight) 100 sps
• Max sample rate (ground) 60 sps
• Power (flight) 28VDC @ 4.5 Amps
• Power (ground) 110 VAC
• User Interface Ethernet
• Weight (flight, non-optimized) 27 lbs
• Weight (ground, non-optimized) 20 lbs
• Size (flight, non-optimized) 7.5 x 13 x 13 in
• Size (ground, non-optimized) 7 x 12 x 11 in
Environmental qualification specifications for flight system
• Shock 8g
• Vibration 1.1 g-peak sinusoidal curve
• Altitude 60kft at -56C for 60 min
• Temperature -56 < T < 40C
Ground System
Nat
ion
al A
ero
nau
tics
an
d S
pac
e A
dm
inis
trat
ion
9
National A
ero
nautics a
nd S
pace A
dm
inis
tration
Fiber Bragg Grating (FBG)
Optical Frequency Domain Reflectometry (OFDR)
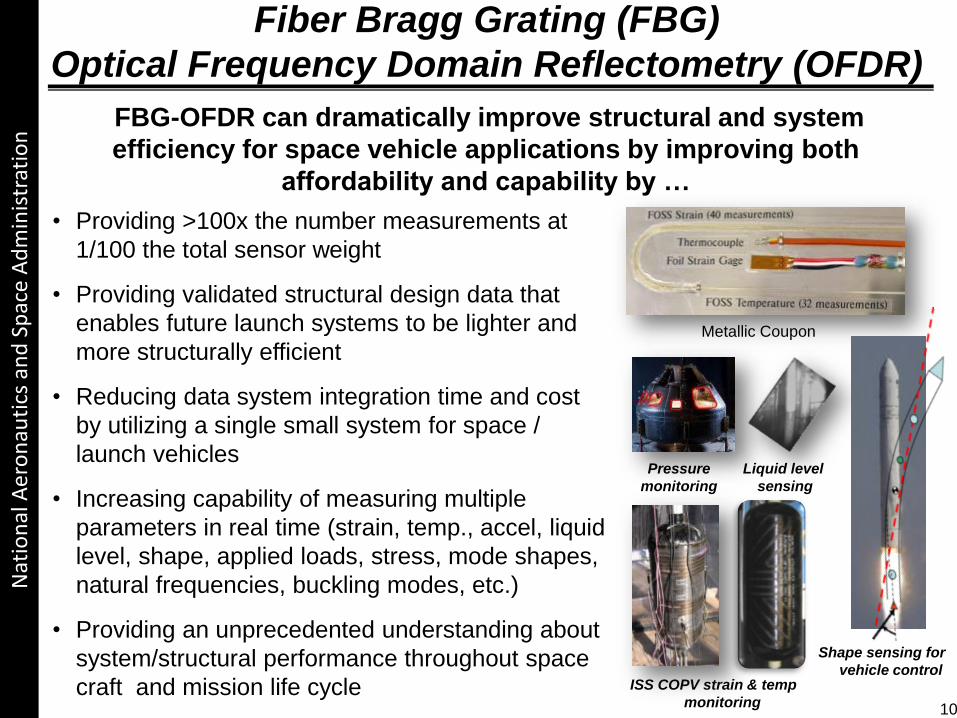
FBG-OFDR can dramatically improve structural and system
efficiency for space vehicle applications by improving both
affordability and capability by …
• Providing >100x the number measurements at
1/100 the total sensor weight
• Providing validated structural design data that
enables future launch systems to be lighter and
more structurally efficient
• Reducing data system integration time and cost
by utilizing a single small system for space /
launch vehicles
• Increasing capability of measuring multiple
parameters in real time (strain, temp., accel, liquid
level, shape, applied loads, stress, mode shapes,
natural frequencies, buckling modes, etc.)
• Providing an unprecedented understanding about
system/structural performance throughout space
craft and mission life cycle
Metallic Coupon
ISS COPV strain & temp
monitoring
Liquid level
sensing
Shape sensing for
vehicle control
Pressure
monitoring
Nat
ion
al A
ero
nau
tics
an
d S
pac
e A
dm
inis
trat
ion
10
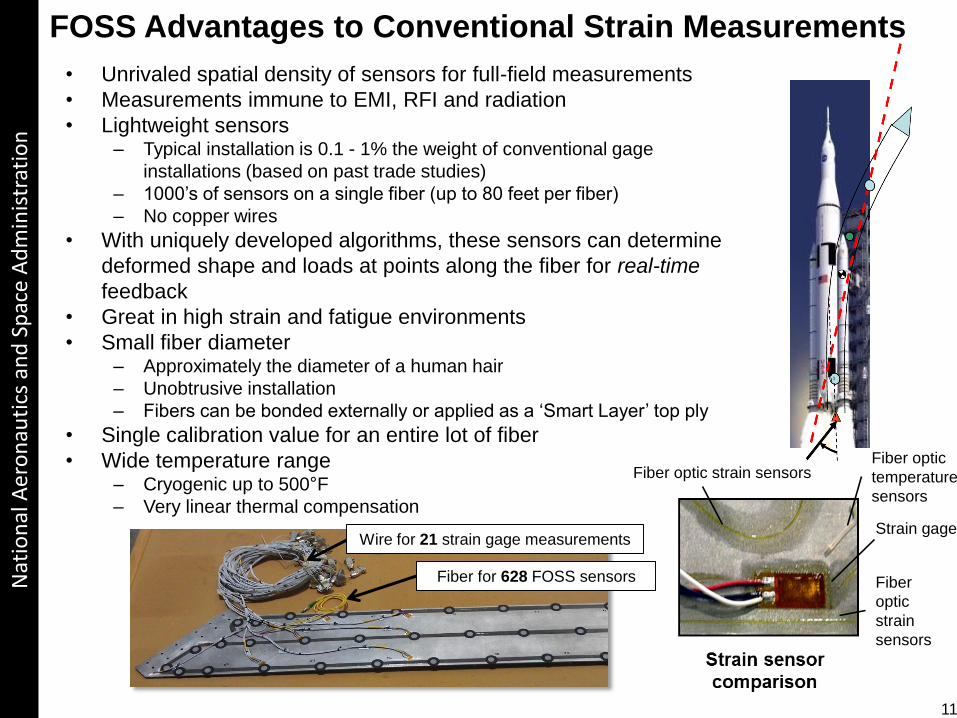
FOSS Advantages to Conventional Strain Measurements
• Unrivaled spatial density of sensors for full-field measurements
• Measurements immune to EMI, RFI and radiation
• Lightweight sensors– Typical installation is 0.1 - 1% the weight of conventional gage
installations (based on past trade studies)
– 1000’s of sensors on a single fiber (up to 80 feet per fiber)
– No copper wires
• With uniquely developed algorithms, these sensors can determine
deformed shape and loads at points along the fiber for real-time
feedback
• Great in high strain and fatigue environments
• Small fiber diameter– Approximately the diameter of a human hair
– Unobtrusive installation
– Fibers can be bonded externally or applied as a ‘Smart Layer’ top ply
• Single calibration value for an entire lot of fiber
• Wide temperature range– Cryogenic up to 500°F
– Very linear thermal compensation
Wire for 21 strain gage measurements
Fiber for 628 FOSS sensors
Strain gage
Fiber
optic
strain
sensors
Fiber optic strain sensorsFiber optic
temperature
sensors
Nat
ion
al A
ero
nau
tics
an
d S
pac
e A
dm
inis
trat
ion
11

FOSS Sensor Technology Comparison
Stresses 2-D Shape
Strains
FOSS
Pressure
Buckling Modes and Shapes
Natural Frequencies
Mode ShapesCrack Growth
Fatigue Life
Operational Loads
12
National A
ero
nautics a
nd S
pace A
dm
inis
tration
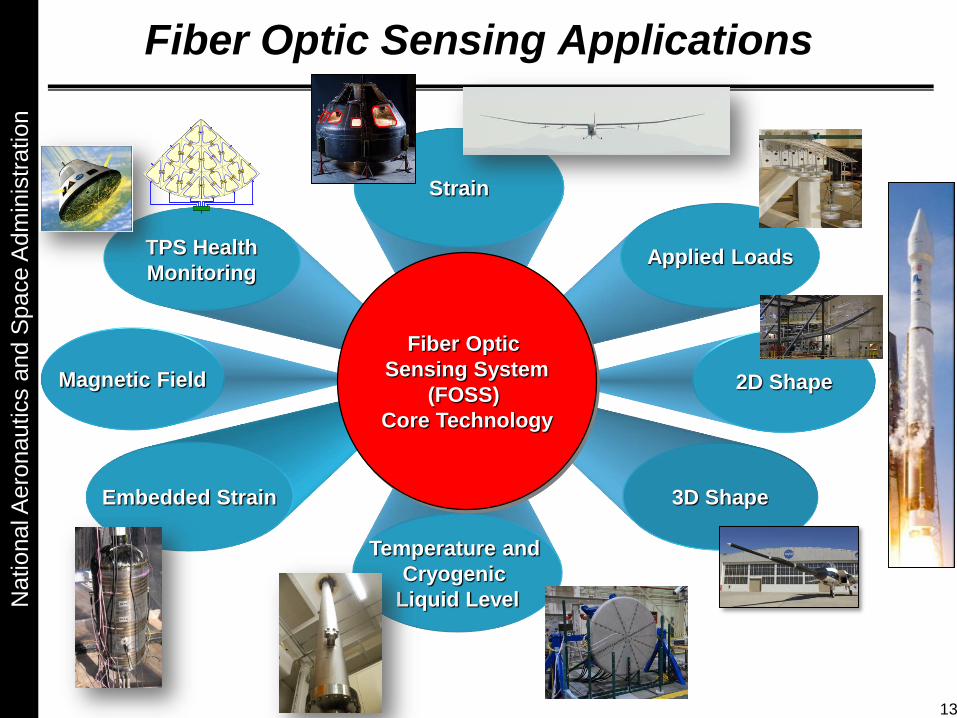
Embedded Strain
Magnetic Field 2D Shape
Applied LoadsTPS Health
Monitoring
Temperature and
Cryogenic
Liquid Level
3D Shape
Strain
Fiber Optic
Sensing System
(FOSS)
Core Technology
Fiber Optic Sensing Applications
13
National A
ero
nautics a
nd S
pace A
dm
inis
tration
Strain Sensing Applications
14
National A
ero
nautics a
nd S
pace A
dm
inis
tration
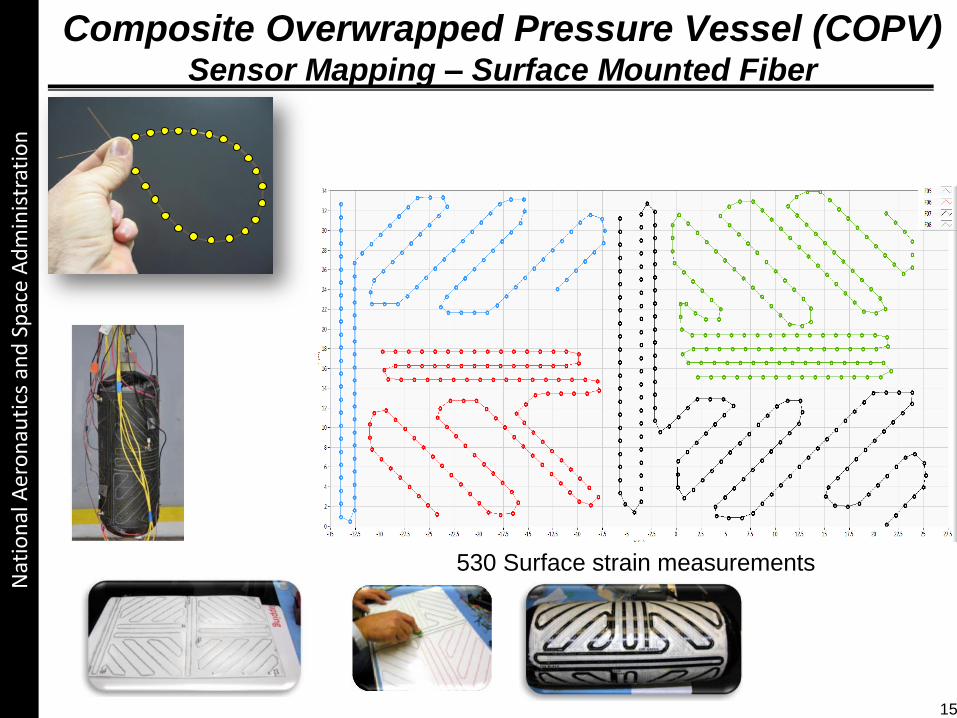
Composite Overwrapped Pressure Vessel (COPV) Sensor Mapping – Surface Mounted Fiber
530 Surface strain measurements
Nat
ion
al A
ero
nau
tics
an
d S
pac
e A
dm
inis
trat
ion
15
National A
ero
nautics a
nd S
pace A
dm
inis
tration
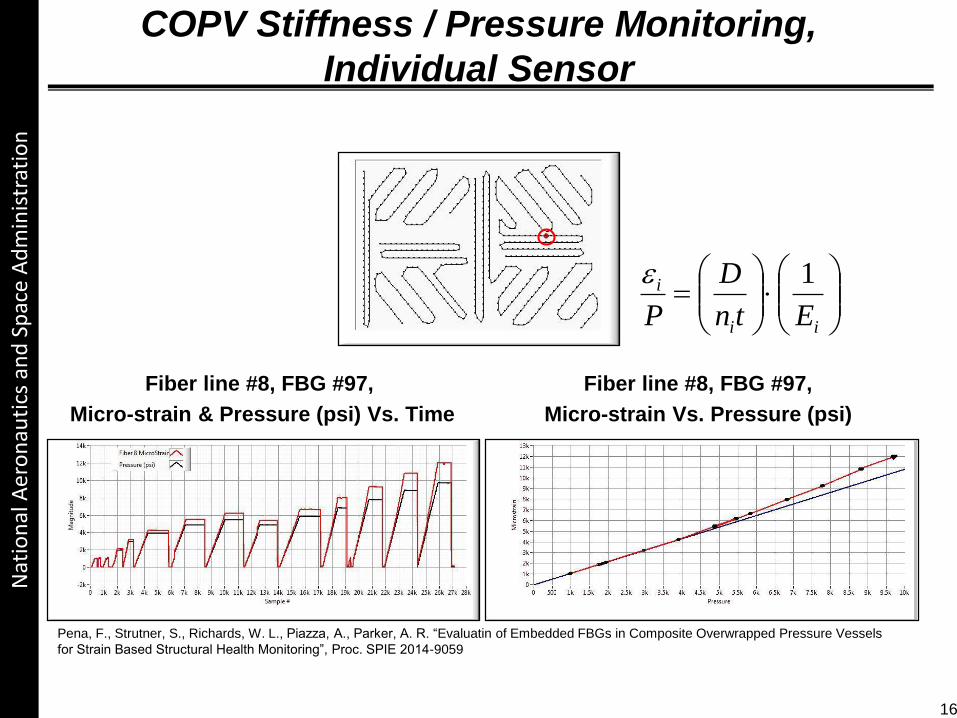
COPV Stiffness / Pressure Monitoring,
Individual Sensor
Fiber line #8, FBG #97,
Micro-strain & Pressure (psi) Vs. Time
Fiber line #8, FBG #97,
Micro-strain Vs. Pressure (psi)
ii
i
Etn
D
P
1
Nat
ion
al A
ero
nau
tics
an
d S
pac
e A
dm
inis
trat
ion
Pena, F., Strutner, S., Richards, W. L., Piazza, A., Parker, A. R. “Evaluatin of Embedded FBGs in Composite Overwrapped Pressure Vessels
for Strain Based Structural Health Monitoring”, Proc. SPIE 2014-9059
16

National A
ero
nautics a
nd S
pace A
dm
inis
tration
Stiffness / Pressure Monitoring
COPV Stiffness / Pressure Monitoring
• Expands previous studies performed by
the Armstrong NNWG on the structural
health monitoring techniques
• Implementation of real-time finite-
element-like fringe plots
• Further studies into stiffness/pressure
monitoring as SHM parameter
Strain Plot
Nat
ion
al A
ero
nau
tics
an
d S
pac
e A
dm
inis
trat
ion
17
Pena, F., Strutner, S., Richards, W. L., Piazza, A., Parker, A. R. “Evaluatin of Embedded FBGs in Composite Overwrapped Pressure Vessels
for Strain Based Structural Health Monitoring”, Proc. SPIE 2014-9059
National A
ero
nautics a
nd S
pace A
dm
inis
tration
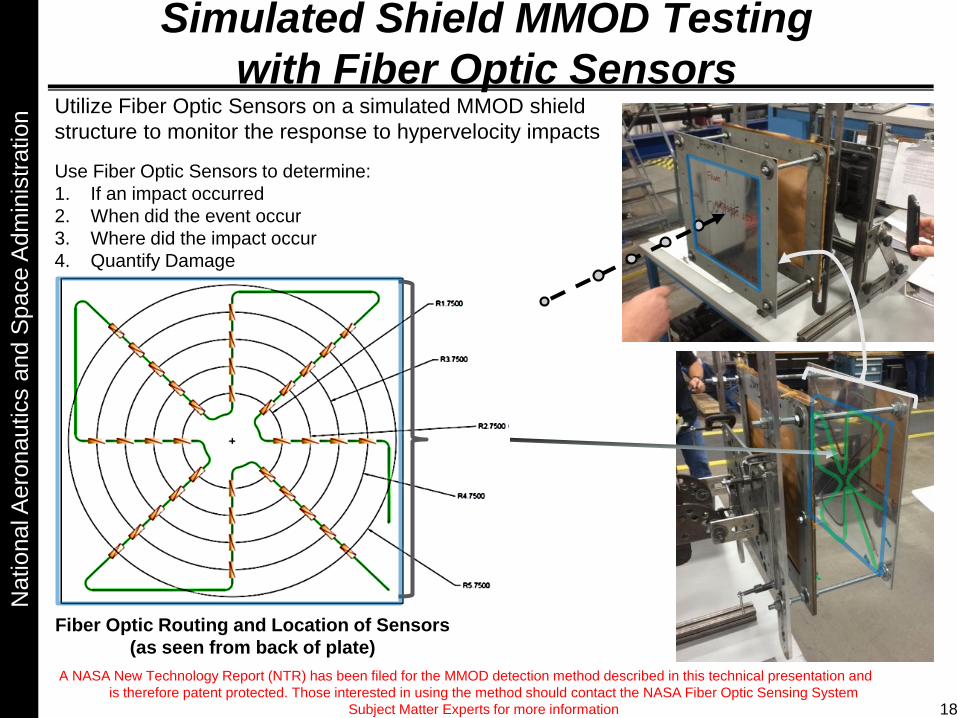
Simulated Shield MMOD Testing
with Fiber Optic Sensors
Fiber Optic Routing and Location of Sensors
(as seen from back of plate)
Utilize Fiber Optic Sensors on a simulated MMOD shield
structure to monitor the response to hypervelocity impacts
Use Fiber Optic Sensors to determine:
1. If an impact occurred
2. When did the event occur
3. Where did the impact occur
4. Quantify Damage
A NASA New Technology Report (NTR) has been filed for the MMOD detection method described in this technical presentation and
is therefore patent protected. Those interested in using the method should contact the NASA Fiber Optic Sensing System
Subject Matter Experts for more information 18
National A
ero
nautics a
nd S
pace A
dm
inis
tration
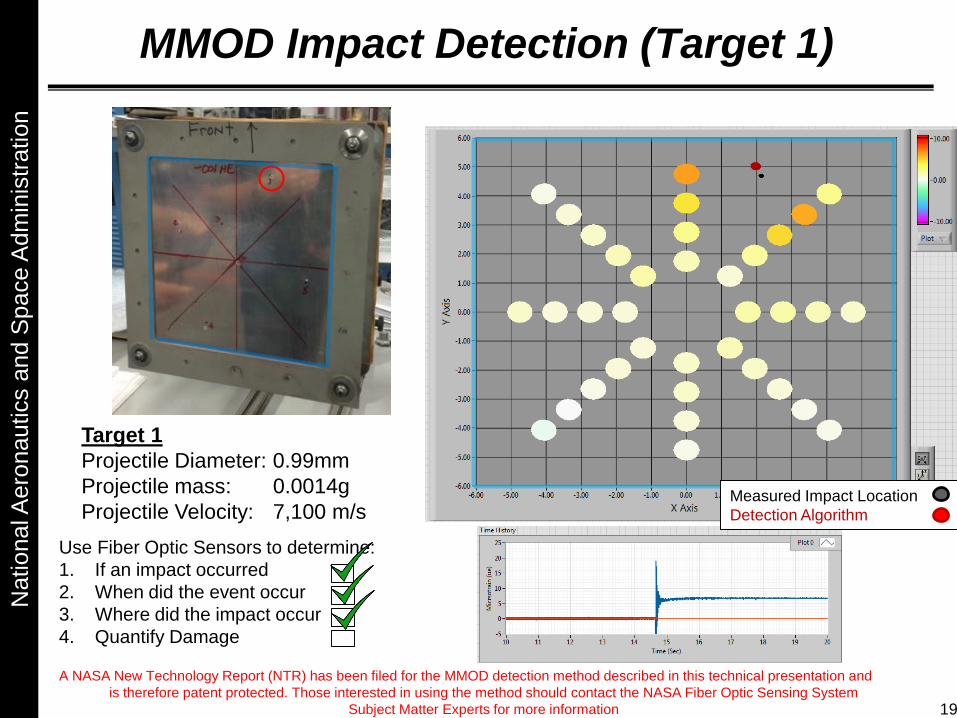
MMOD Impact Detection (Target 1)
Target 1
Projectile Diameter: 0.99mm
Projectile mass: 0.0014g
Projectile Velocity: 7,100 m/s Measured Impact Location
Detection Algorithm
Use Fiber Optic Sensors to determine:
1. If an impact occurred
2. When did the event occur
3. Where did the impact occur
4. Quantify Damage
A NASA New Technology Report (NTR) has been filed for the MMOD detection method described in this technical presentation and
is therefore patent protected. Those interested in using the method should contact the NASA Fiber Optic Sensing System
Subject Matter Experts for more information 19

National A
ero
nautics a
nd S
pace A
dm
inis
tration
MMOD Impact Detection (Target 2)
Target 2
Projectile Diameter: 0.49mm
Projectile mass: 0.00017g
Projectile Velocity: 6,980 m/s Measured Impact Location
Detection Algorithm
Use Fiber Optic Sensors to determine:
1. If an impact occurred
2. When did the event occur
3. Where did the impact occur
4. Quantify Damage
A NASA New Technology Report (NTR) has been filed for the MMOD detection method described in this technical presentation and
is therefore patent protected. Those interested in using the method should contact the NASA Fiber Optic Sensing System
Subject Matter Experts for more information 20

National A
ero
nautics a
nd S
pace A
dm
inis
tration
Strain SensingNESC Composite Crew Module
• Four fibers were installed
around the module’s three
windows and one hatch
• 3300 real-time strain
measurements were collected at
30Hz as the module underwent
200%DLL pressurization testing
• Measured strains were
compared and matched well to
predicted model results
• Project concluded:
• “Fiber optics real-time
monitoring of test results
against analytical
predictions was essential in
the success of the full-scale
test program.”
• “In areas of high strain
gradients these techniques
were invaluable.” Inner Hatch FBG Strains, Max Pressure
Mic
rostr
ain
(m
in/i
n)
Predicted
-2000
FBG
0
2000
4000
21

National A
ero
nautics a
nd S
pace A
dm
inis
tration
In-Flight Strain SensingSmall Scaled UAV
22
• Four Fibers were installed on the aircraft wings on top and
bottom of the Left and Right wing
• 2000 time strain measurements were collected at 20Hz during
flight

National A
ero
nautics a
nd S
pace A
dm
inis
tration
Current Project:
NESC Shell Buckling Knockdown Factor (SBKF)
0° 45° 90° 135° 180°
8 ft
23
National A
ero
nautics a
nd S
pace A
dm
inis
tration
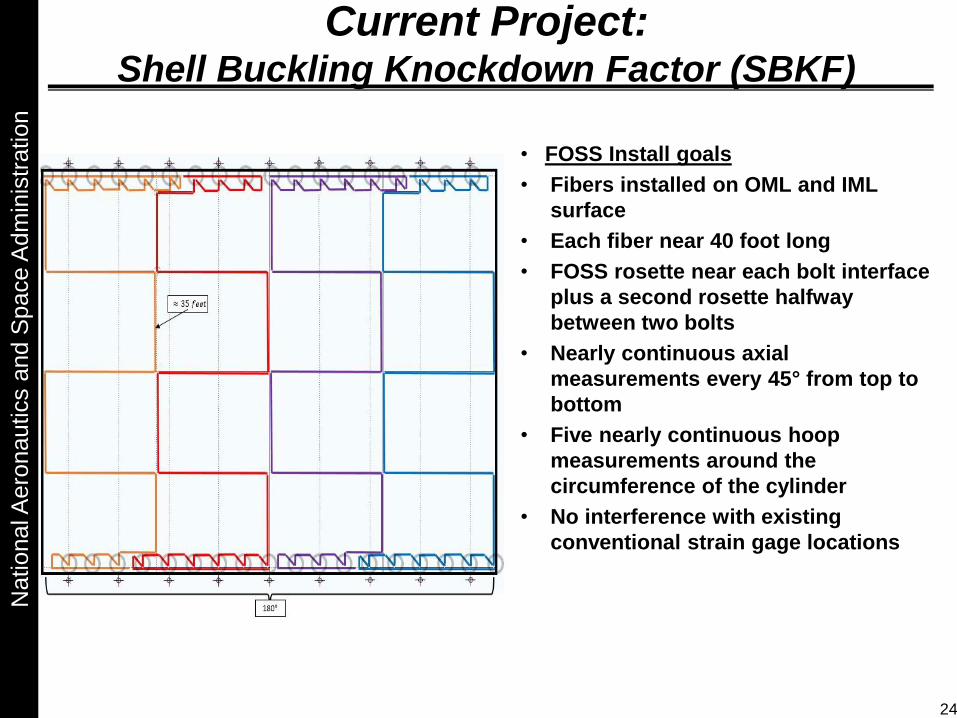
Current Project: Shell Buckling Knockdown Factor (SBKF)
• FOSS Install goals
• Fibers installed on OML and IML
surface
• Each fiber near 40 foot long
• FOSS rosette near each bolt interface
plus a second rosette halfway
between two bolts
• Nearly continuous axial
measurements every 45° from top to
bottom
• Five nearly continuous hoop
measurements around the
circumference of the cylinder
• No interference with existing
conventional strain gage locations
24
National A
ero
nautics a
nd S
pace A
dm
inis
tration
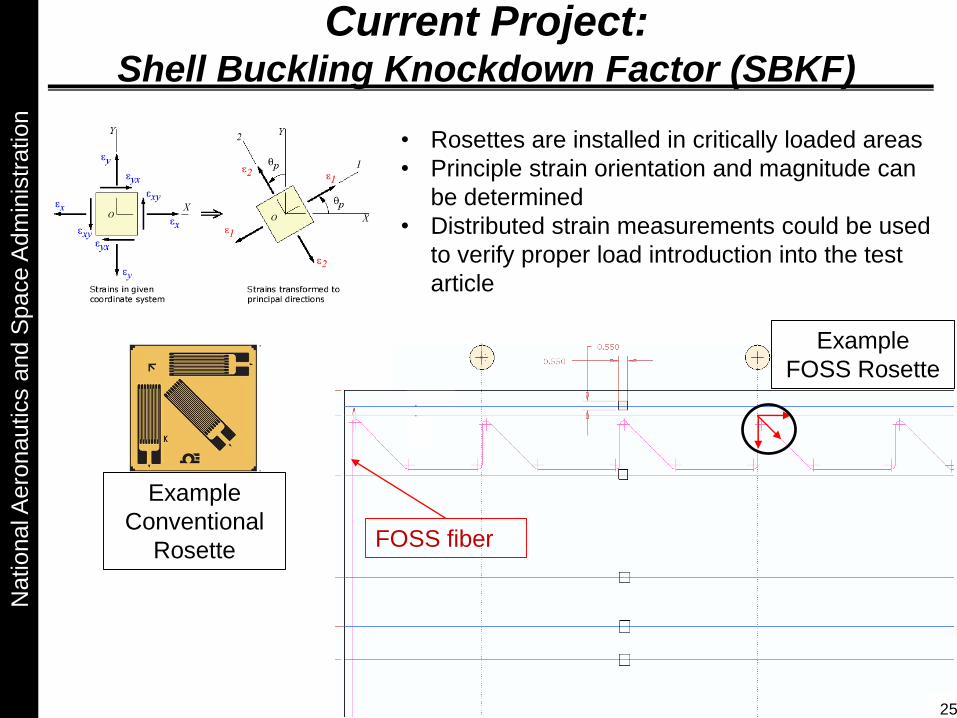
Current Project: Shell Buckling Knockdown Factor (SBKF)
Example
Conventional
Rosette
Example
FOSS Rosette
FOSS fiber
• Rosettes are installed in critically loaded areas
• Principle strain orientation and magnitude can
be determined
• Distributed strain measurements could be used
to verify proper load introduction into the test
article
25
National A
ero
nautics a
nd S
pace A
dm
inis
tration
Shape Sensing Applications
26
National A
ero
nautics a
nd S
pace A
dm
inis
tration
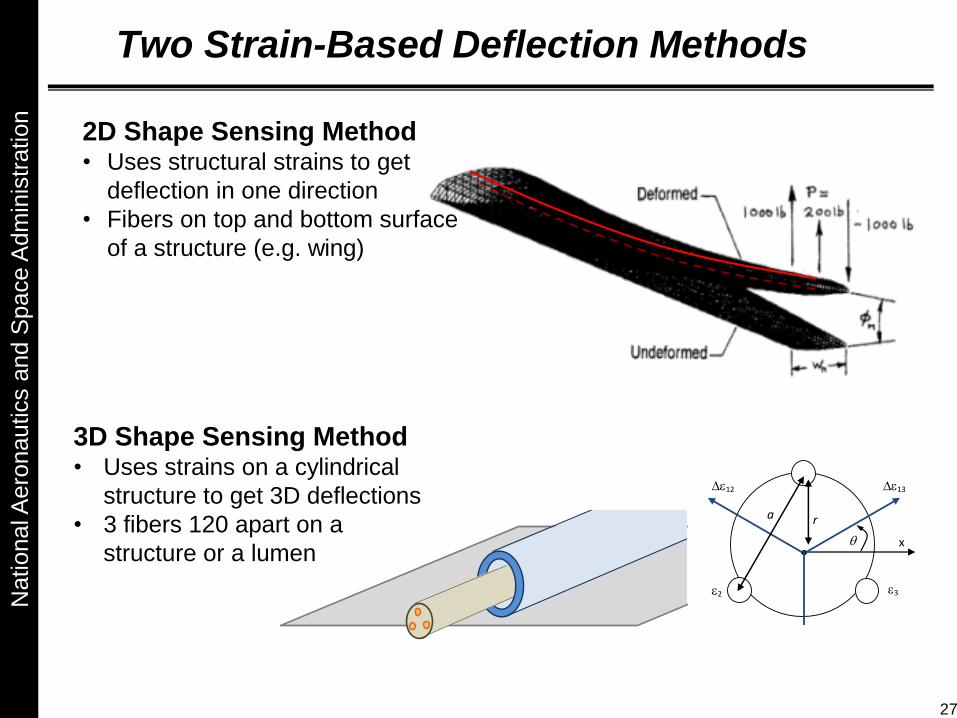
Two Strain-Based Deflection Methods
2D Shape Sensing Method• Uses structural strains to get
deflection in one direction
• Fibers on top and bottom surface
of a structure (e.g. wing)
x
d
2 3
12
23
13
a r
3D Shape Sensing Method• Uses strains on a cylindrical
structure to get 3D deflections
• 3 fibers 120 apart on a
structure or a lumen
27

National A
ero
nautics a
nd S
pace A
dm
inis
tration
Uninhabited Aerial VehiclesGlobal Observer UAS - Aerovironment
• Proof-load testing of components and large-scale structures
Wing Span: 175 ftGlobal Observer Wing Loads Test
Whiffletree
Loading System
28

National A
ero
nautics a
nd S
pace A
dm
inis
tration
2D Shape Sensing ResultsGlobal Observer UAS
0 0.1 0.2 0.3 0.4 0.5 0.6 0.7 0.8 0.9 1-0.2
0
0.2
0.4
0.6
0.8
1
1.2Predicted vertical wing displacement (Fiber 3) vs. Actual displacement
Wing Span (normalized)
Dis
pla
cem
ent
(norm
aliz
ed)
Predicted vertical wing displacement
Actual: Photogrammetry in GRF
Actual: Photogrammetry in RRF100% DLL
0% DLL
50% DLL
80% DLL
30% DLL
Over the entire wing span, the predicted displacements of
fiber 3 closely match the actual for every load condition.
1 2
3 4FWD AFT
29

National A
ero
nautics a
nd S
pace A
dm
inis
tration
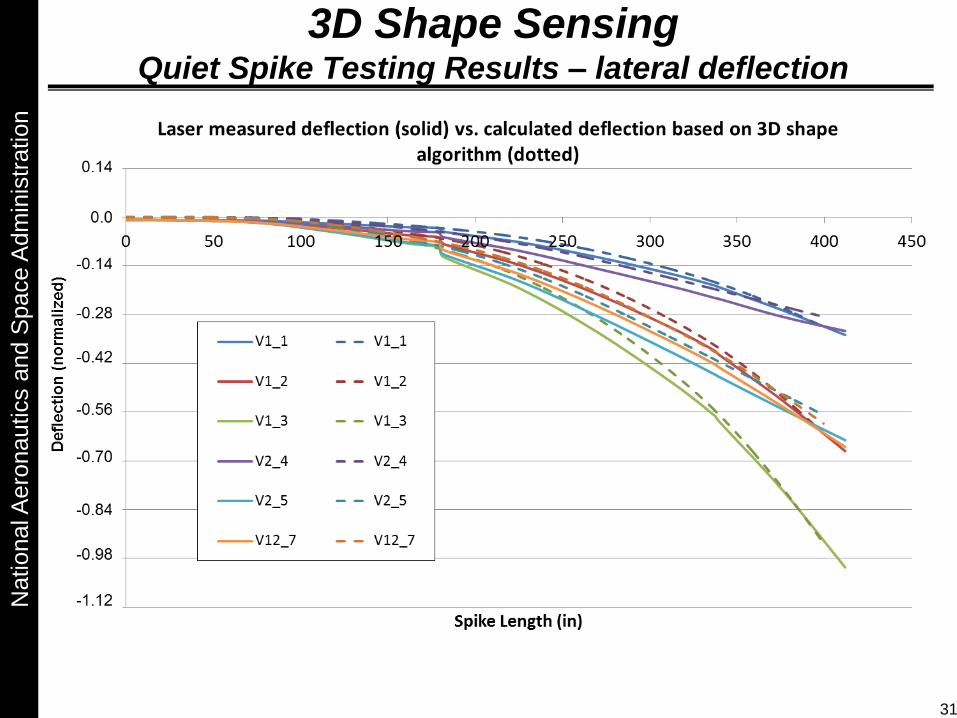
3D Shape SensingPrototype Quiet Spike Testing
• Fibers are installed on the prototype of 35ft quiet
spike at Gulfstream in Savannah GA
• Performed tests to determined benefits of
deploying FOSS on Low Boom Experimental
Vehicle
• Installed a total of 5 fibers measuring strain at
½” increments (2,570 strain sensors)
• Deflection shape of the Quiet Spike evaluated
through the 3D shape algorithm
x
d
2 3
12
23
13
a r
Fixture
Aft Segment Mid Segment Fwd Segment
30
National A
ero
nautics a
nd S
pace A
dm
inis
tration
3D Shape SensingQuiet Spike Testing Results – lateral deflection
31

National A
ero
nautics a
nd S
pace A
dm
inis
tration
2D Shape + Twist Sensing
• Real-time algorithms enable vertical deflection and
twist to be obtained from distributed strain
measurements
• LabVIEW user interface allows the user to visualize
an estimate of the full filed deformation
• A digital inclinometer is used to verify twist
estimates
A NASA New Technology Report (NTR) has been filed for the Twist Sensing Method described in this technical presentation
and is therefore patent protected. Those interested in using the method should contact the NASA Technology Transfer
Program Office at NASA Armstrong Flight Research Center for more information

National A
ero
nautics a
nd S
pace A
dm
inis
tration
Load Sensing
33
National A
ero
nautics a
nd S
pace A
dm
inis
tration
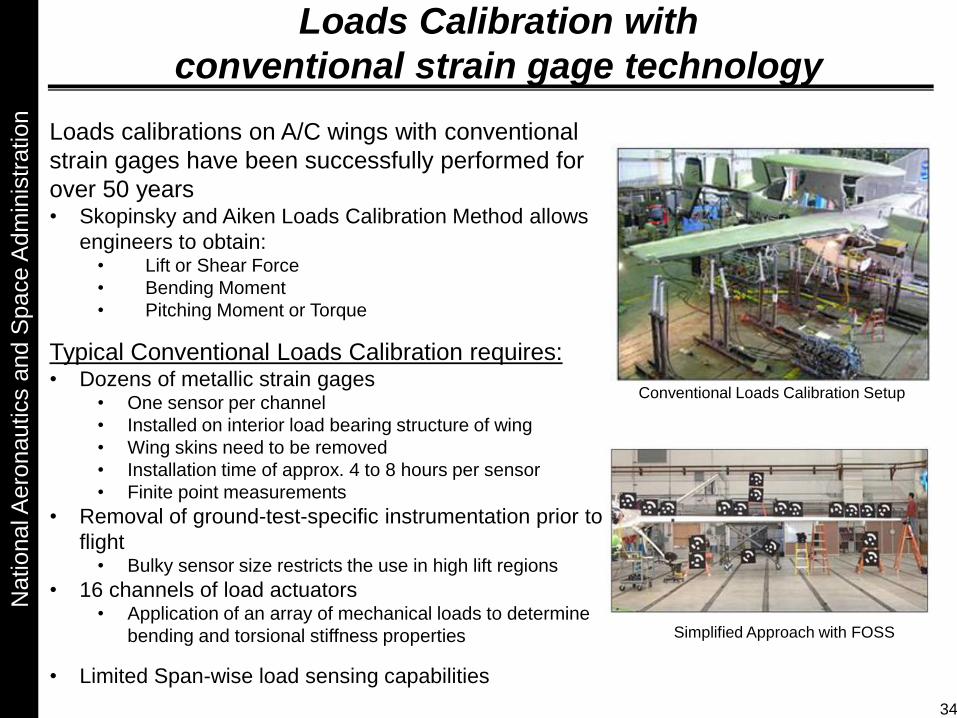
Loads Calibration with
conventional strain gage technology
Conventional Loads Calibration Setup
Simplified Approach with FOSS
Loads calibrations on A/C wings with conventional
strain gages have been successfully performed for
over 50 years• Skopinsky and Aiken Loads Calibration Method allows
engineers to obtain:• Lift or Shear Force
• Bending Moment
• Pitching Moment or Torque
Typical Conventional Loads Calibration requires:• Dozens of metallic strain gages
• One sensor per channel
• Installed on interior load bearing structure of wing
• Wing skins need to be removed
• Installation time of approx. 4 to 8 hours per sensor
• Finite point measurements
• Removal of ground-test-specific instrumentation prior to
flight• Bulky sensor size restricts the use in high lift regions
• 16 channels of load actuators• Application of an array of mechanical loads to determine
bending and torsional stiffness properties
• Limited Span-wise load sensing capabilities
34
National A
ero
nautics a
nd S
pace A
dm
inis
tration
35
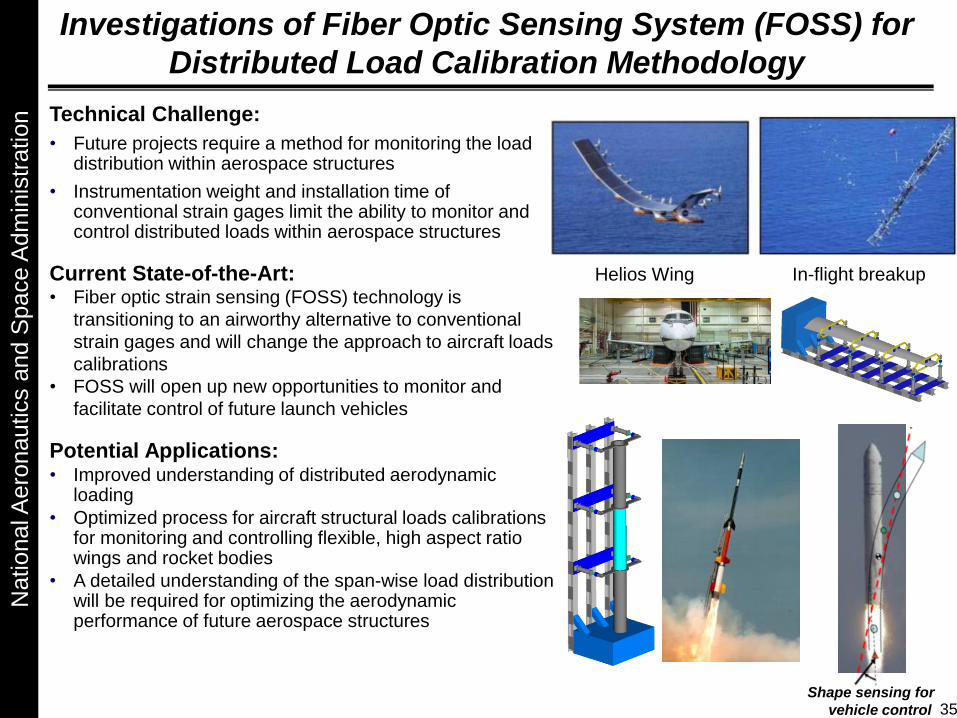
Investigations of Fiber Optic Sensing System (FOSS) for
Distributed Load Calibration Methodology
Technical Challenge:
• Future projects require a method for monitoring the load distribution within aerospace structures
• Instrumentation weight and installation time of conventional strain gages limit the ability to monitor and control distributed loads within aerospace structures
Current State-of-the-Art:• Fiber optic strain sensing (FOSS) technology is
transitioning to an airworthy alternative to conventional
strain gages and will change the approach to aircraft loads
calibrations
• FOSS will open up new opportunities to monitor and
facilitate control of future launch vehicles
Potential Applications:• Improved understanding of distributed aerodynamic
loading
• Optimized process for aircraft structural loads calibrations for monitoring and controlling flexible, high aspect ratio wings and rocket bodies
• A detailed understanding of the span-wise load distribution will be required for optimizing the aerodynamic performance of future aerospace structures
Helios Wing In-flight breakup
Shape sensing for
vehicle control
National A
ero
nautics a
nd S
pace A
dm
inis
tration
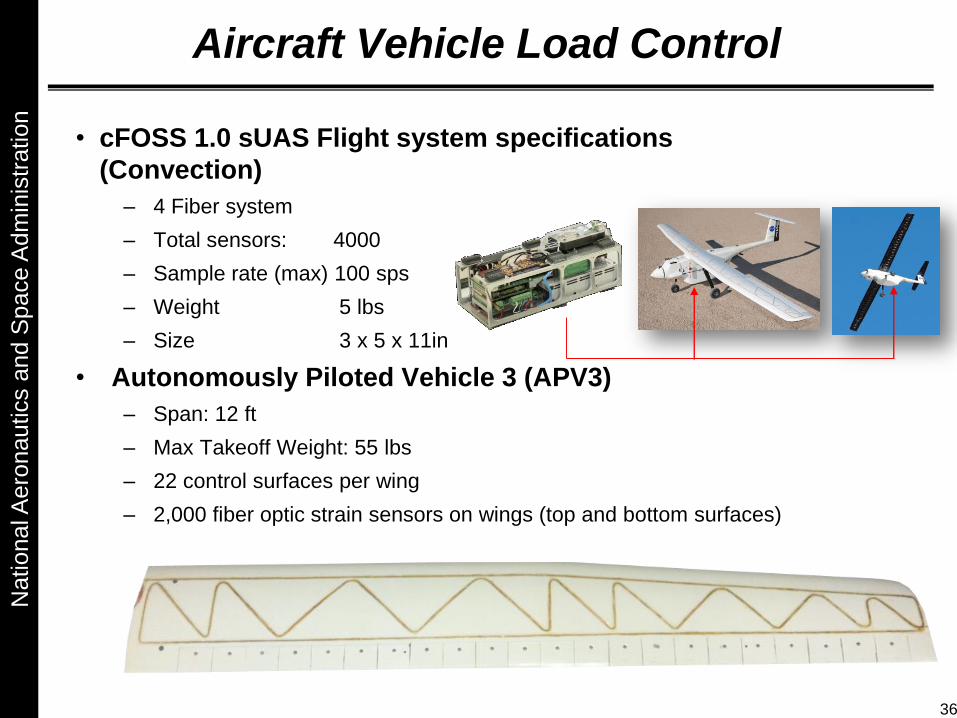
Aircraft Vehicle Load Control
• cFOSS 1.0 sUAS Flight system specifications
(Convection)
– 4 Fiber system
– Total sensors: 4000
– Sample rate (max) 100 sps
– Weight 5 lbs
– Size 3 x 5 x 11in
• Autonomously Piloted Vehicle 3 (APV3)
– Span: 12 ft
– Max Takeoff Weight: 55 lbs
– 22 control surfaces per wing
– 2,000 fiber optic strain sensors on wings (top and bottom surfaces)
36

National A
ero
nautics a
nd S
pace A
dm
inis
tration
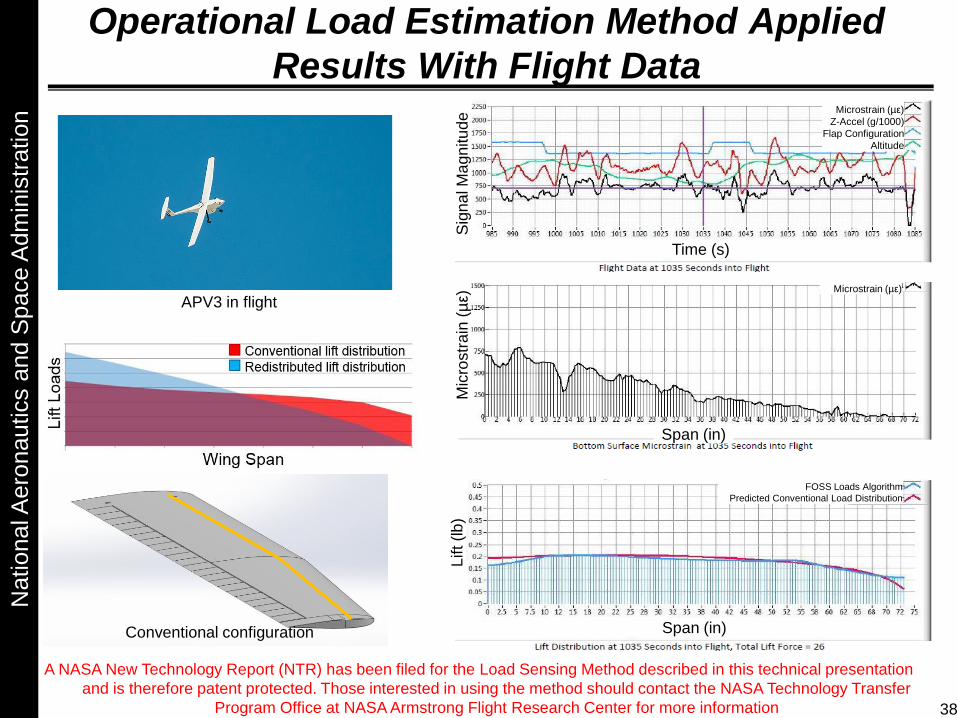
APV3 Segmented Control Surfaces
• Segmented Control Surfaces
(SCS) can be utilized to
redistribute load in-board to reduce
loads during high-g maneuvers
• FOSS strain and/or deflection
measurements could be used with
a flight controller to provide load
alleviation controlconventional configuration
load alleviation configuration
37
National A
ero
nautics a
nd S
pace A
dm
inis
tration
Operational Load Estimation Method Applied
Results With Flight Data
Conventional configuration
APV3 in flight
38
Microstrain (µε)
Z-Accel (g/1000)
Flap Configuration
Altitude
Time (s)
Span (in)
Span (in)
FOSS Loads Algorithm
Predicted Conventional Load Distribution
Lift (lb
)M
icro
str
ain
(µ
ε)
Microstrain (µε)
Sig
na
l M
agn
itu
de
A NASA New Technology Report (NTR) has been filed for the Load Sensing Method described in this technical presentation
and is therefore patent protected. Those interested in using the method should contact the NASA Technology Transfer
Program Office at NASA Armstrong Flight Research Center for more information

National A
ero
nautics a
nd S
pace A
dm
inis
tration
Operational Load Estimation Method Applied
Results With Flight Data
APV3 in flight
39
Microstrain (µε)
Z-Accel (g/1000)
Flap Configuration
Altitude
Microstrain (µε)
FOSS Loads Algorithm
Predicted Conventional Load Distribution
Time (s)
Span (in)
Span (in)
Sig
na
l M
agn
itu
de
Mic
rostr
ain
(µ
ε)L
ift (lb
)
A NASA New Technology Report (NTR) has been filed for the Load Sensing Method described in this technical presentation
and is therefore patent protected. Those interested in using the method should contact the NASA Technology Transfer
Program Office at NASA Armstrong Flight Research Center for more information
Redistributed configuration
National A
ero
nautics a
nd S
pace A
dm
inis
tration
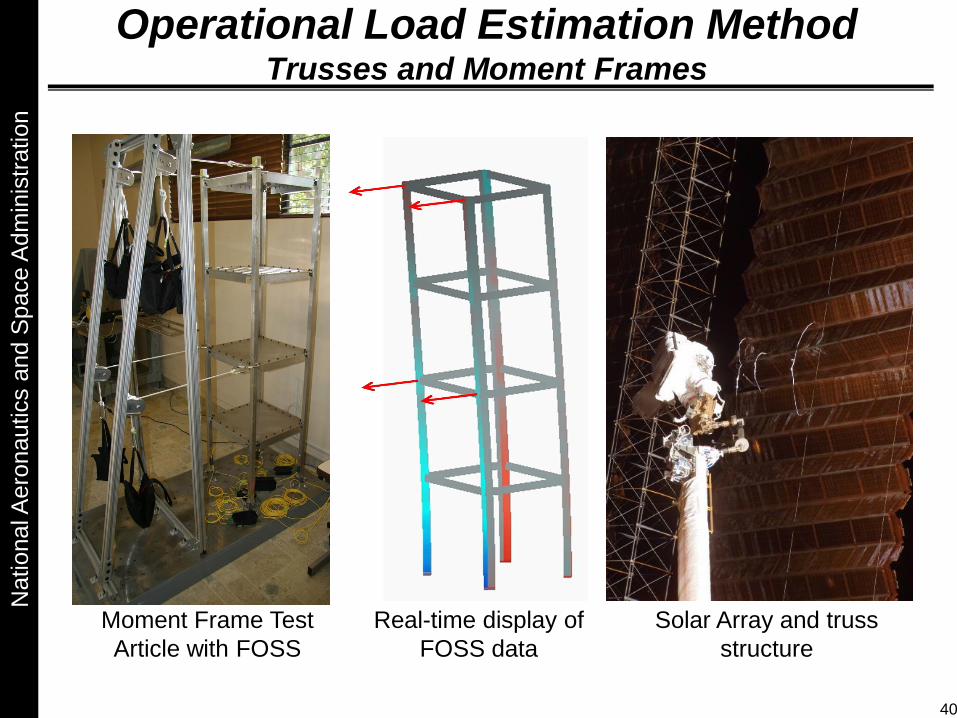
Operational Load Estimation MethodTrusses and Moment Frames
Moment Frame Test
Article with FOSS
Real-time display of
FOSS data
Solar Array and truss
structure
40

National A
ero
nautics a
nd S
pace A
dm
inis
tration
Operational Load Estimation MethodTruss and Moment Frames
41
National A
ero
nautics a
nd S
pace A
dm
inis
tration
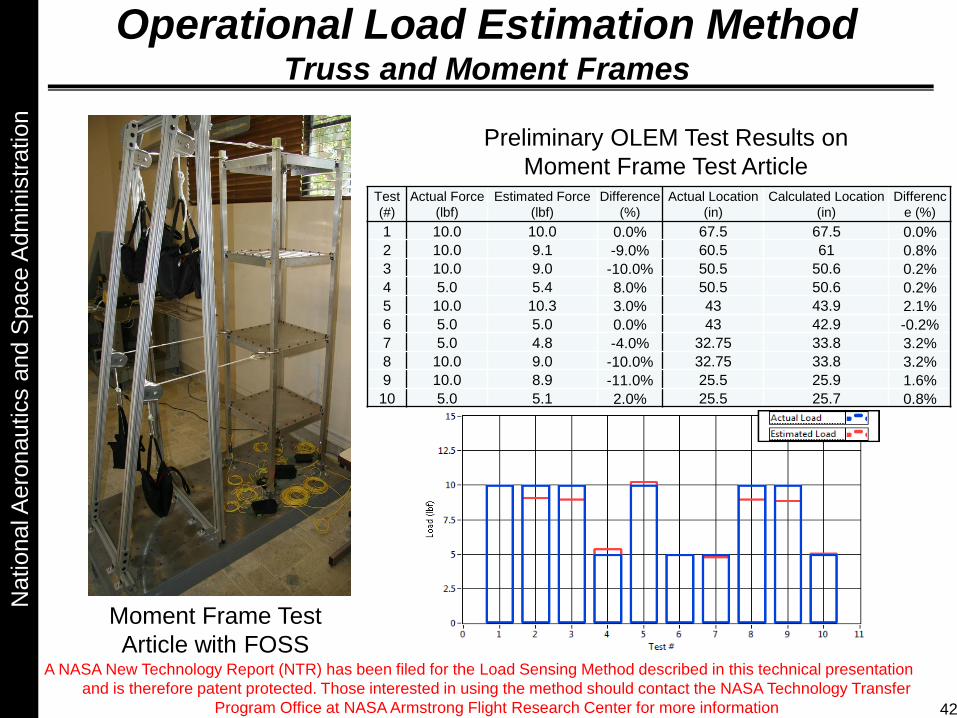
Operational Load Estimation MethodTruss and Moment Frames
Test
(#)
Actual Force
(lbf)
Estimated Force
(lbf)
Difference
(%)
Actual Location
(in)
Calculated Location
(in)
Differenc
e (%)
1 10.0 10.0 0.0% 67.5 67.5 0.0%
2 10.0 9.1 -9.0% 60.5 61 0.8%
3 10.0 9.0 -10.0% 50.5 50.6 0.2%
4 5.0 5.4 8.0% 50.5 50.6 0.2%
5 10.0 10.3 3.0% 43 43.9 2.1%
6 5.0 5.0 0.0% 43 42.9 -0.2%
7 5.0 4.8 -4.0% 32.75 33.8 3.2%
8 10.0 9.0 -10.0% 32.75 33.8 3.2%
9 10.0 8.9 -11.0% 25.5 25.9 1.6%
10 5.0 5.1 2.0% 25.5 25.7 0.8%
Preliminary OLEM Test Results on
Moment Frame Test Article
Moment Frame Test
Article with FOSS
42
A NASA New Technology Report (NTR) has been filed for the Load Sensing Method described in this technical presentation
and is therefore patent protected. Those interested in using the method should contact the NASA Technology Transfer
Program Office at NASA Armstrong Flight Research Center for more information
National A
ero
nautics a
nd S
pace A
dm
inis
tration
HyFOSS
43
National A
ero
nautics a
nd S
pace A
dm
inis
tration
HyFOSS: What The Technology Does
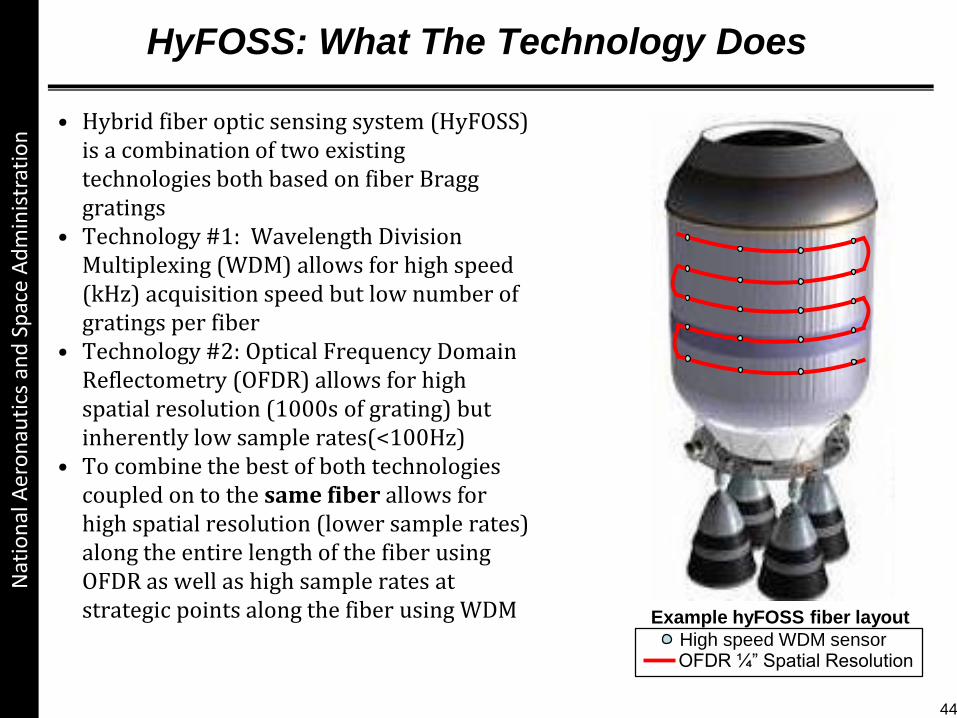
• Hybrid fiber optic sensing system (HyFOSS) is a combination of two existing technologies both based on fiber Bragg gratings
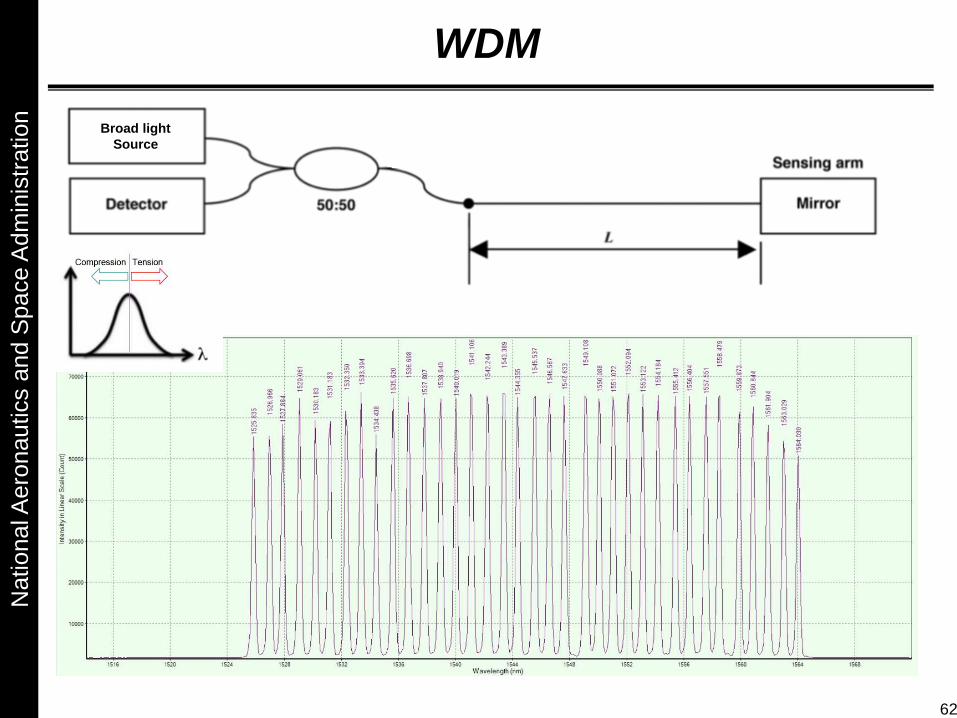
• Technology #1: Wavelength Division Multiplexing (WDM) allows for high speed (kHz) acquisition speed but low number of gratings per fiber
• Technology #2: Optical Frequency Domain Reflectometry (OFDR) allows for high spatial resolution (1000s of grating) but inherently low sample rates(<100Hz)
• To combine the best of both technologies coupled on to the same fiber allows for high spatial resolution (lower sample rates) along the entire length of the fiber using OFDR as well as high sample rates at strategic points along the fiber using WDM Example hyFOSS fiber layout
OFDR ¼” Spatial ResolutionHigh speed WDM sensor
Nat
ion
al A
ero
nau
tics
an
d S
pac
e A
dm
inis
trat
ion
44
National A
ero
nautics a
nd S
pace A
dm
inis
tration
HyFOSS, Frequency Sweep Vibration TestingN
atio
nal
Aer
on
auti
cs a
nd
Sp
ace
Ad
min
istr
atio
n
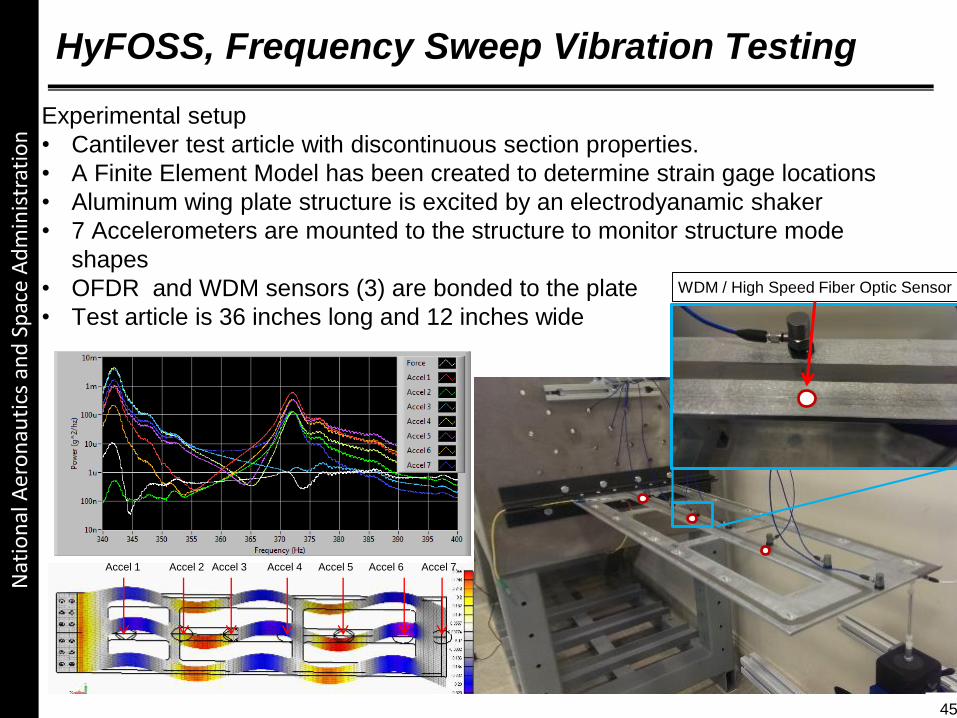
Experimental setup
• Cantilever test article with discontinuous section properties.
• A Finite Element Model has been created to determine strain gage locations
• Aluminum wing plate structure is excited by an electrodyanamic shaker
• 7 Accelerometers are mounted to the structure to monitor structure mode
shapes
• OFDR and WDM sensors (3) are bonded to the plate
• Test article is 36 inches long and 12 inches wide
WDM / High Speed Fiber Optic Sensor
Accel 1 Accel 2 Accel 3 Accel 4 Accel 5 Accel 6 Accel 7
45
National A
ero
nautics a
nd S
pace A
dm
inis
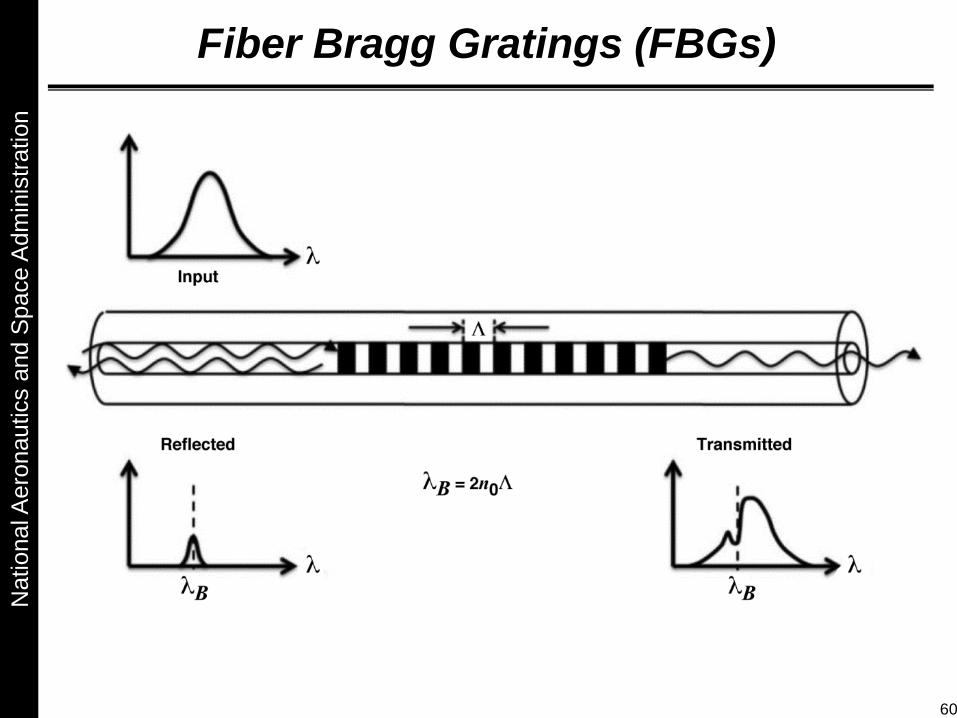
tration
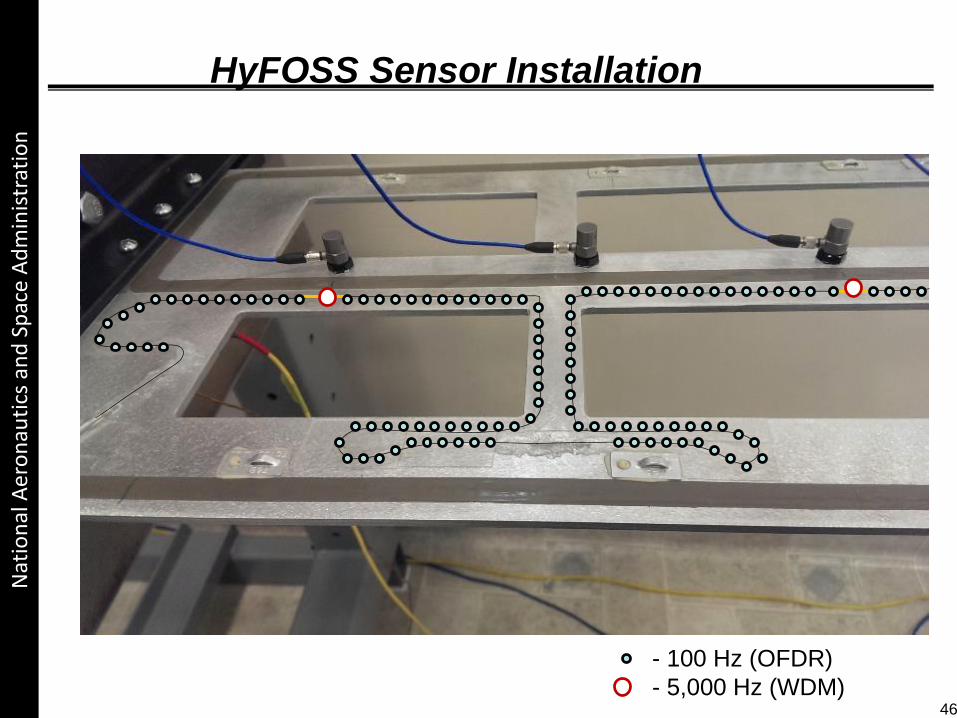
HyFOSS Sensor Installation
Cut Top Dome to be Re-Welded
Nat
ion
al A
ero
nau
tics
an
d S
pac
e A
dm
inis
trat
ion
- 100 Hz (OFDR)
- 5,000 Hz (WDM)46
National A
ero
nautics a
nd S
pace A
dm
inis
tration
Acce
lera
tio
n (
g)
mircro
str
ain
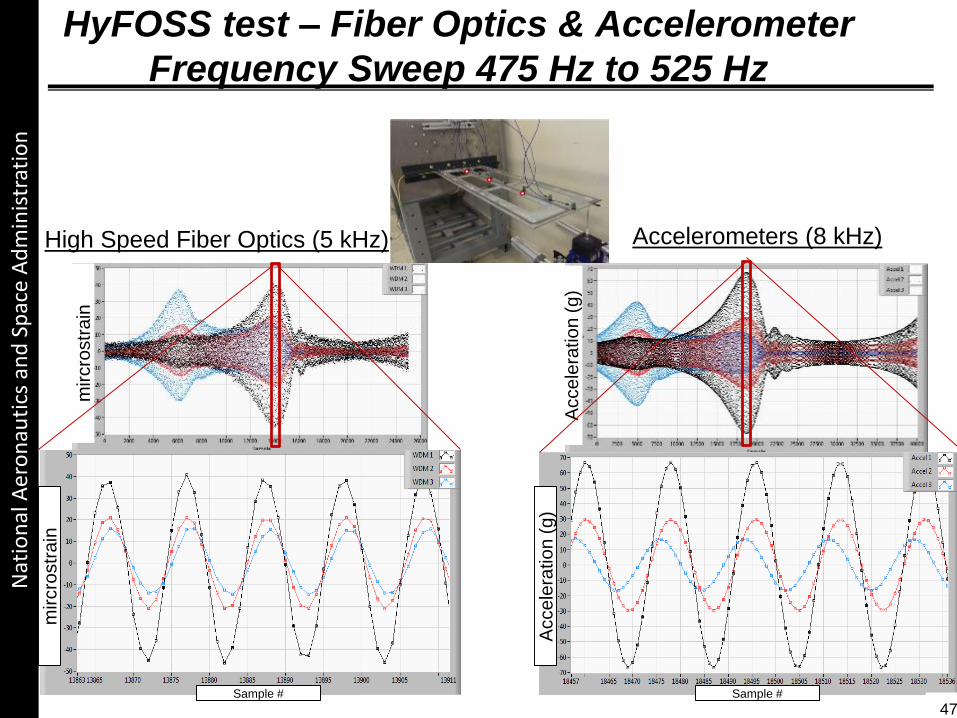
HyFOSS test – Fiber Optics & Accelerometer
Frequency Sweep 475 Hz to 525 Hz
Nat
ion
al A
ero
nau
tics
an
d S
pac
e A
dm
inis
trat
ion
High Speed Fiber Optics (5 kHz) Accelerometers (8 kHz)
mircro
str
ain
Acce
lera
tio
n (
g)
47Sample # Sample #
National A
ero
nautics a
nd S
pace A
dm
inis
tration
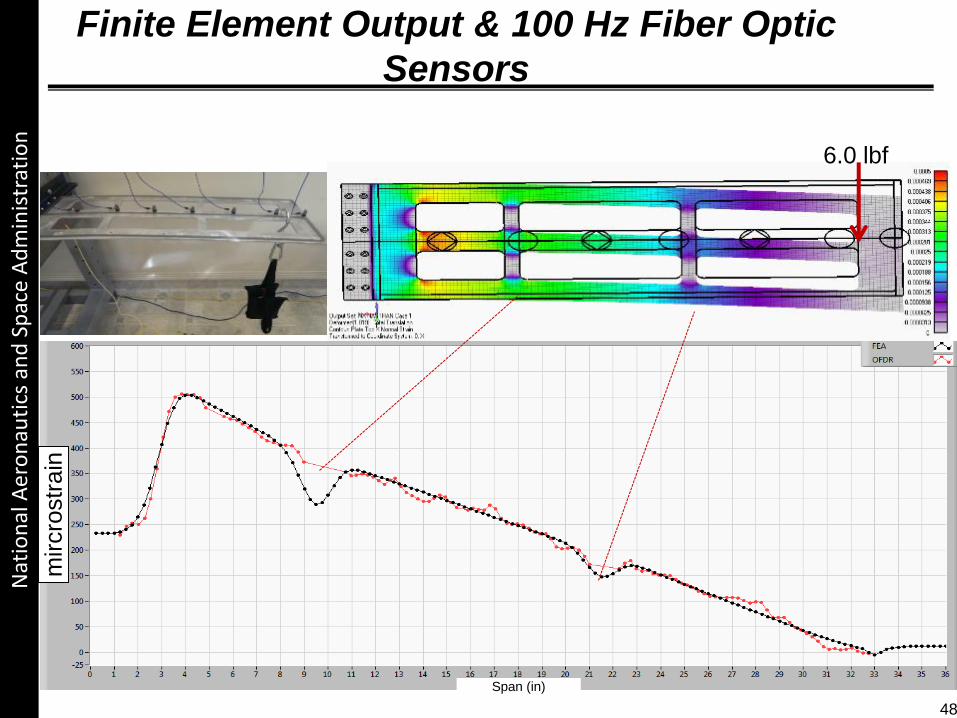
Finite Element Output & 100 Hz Fiber Optic
Sensors
Nat
ion
al A
ero
nau
tics
an
d S
pac
e A
dm
inis
trat
ion
mircro
str
ain
6.0 lbf
48
Span (in)
National A
ero
nautics a
nd S
pace A
dm
inis
tration
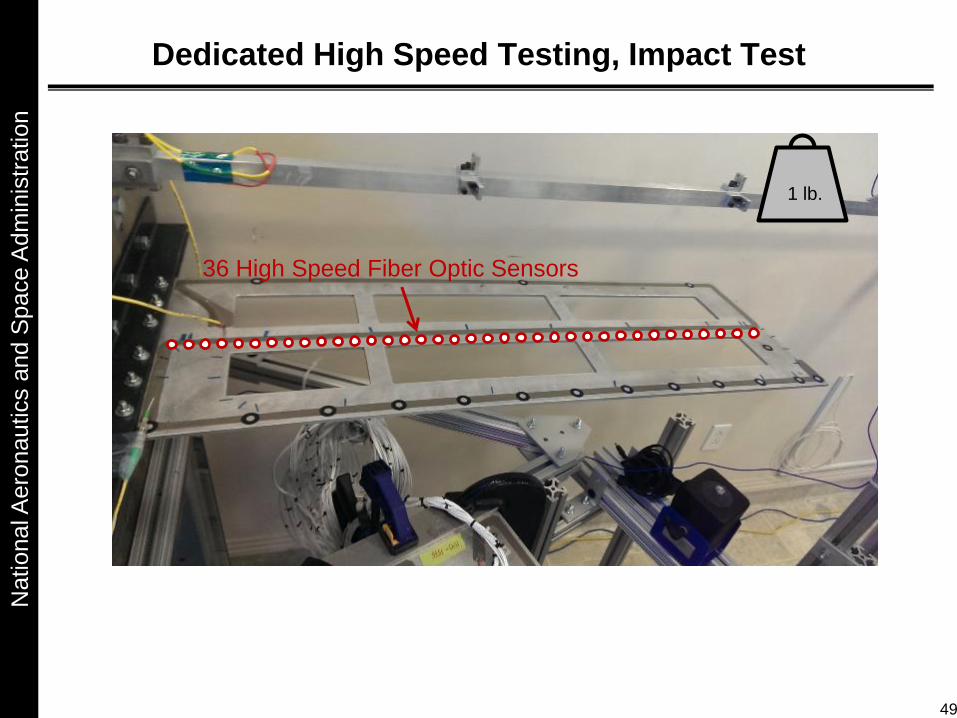
Dedicated High Speed Testing, Impact Test
36 High Speed Fiber Optic Sensors
1 lb.
49
National A
ero
nautics a
nd S
pace A
dm
inis
tration
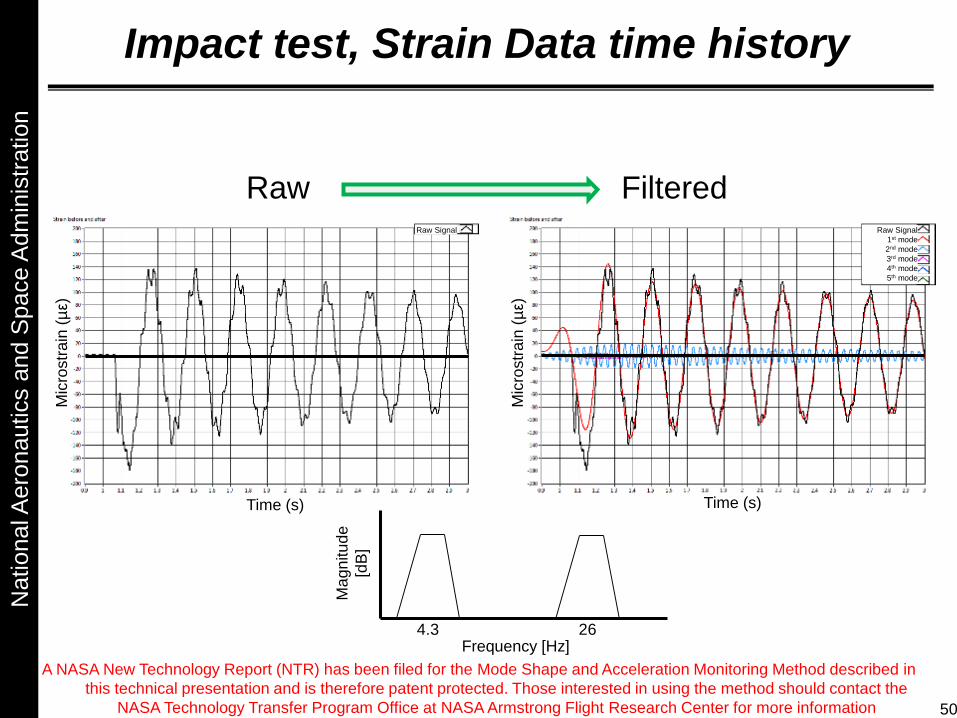
Impact test, Strain Data time history
4.3 26Frequency [Hz]
Ma
gn
itu
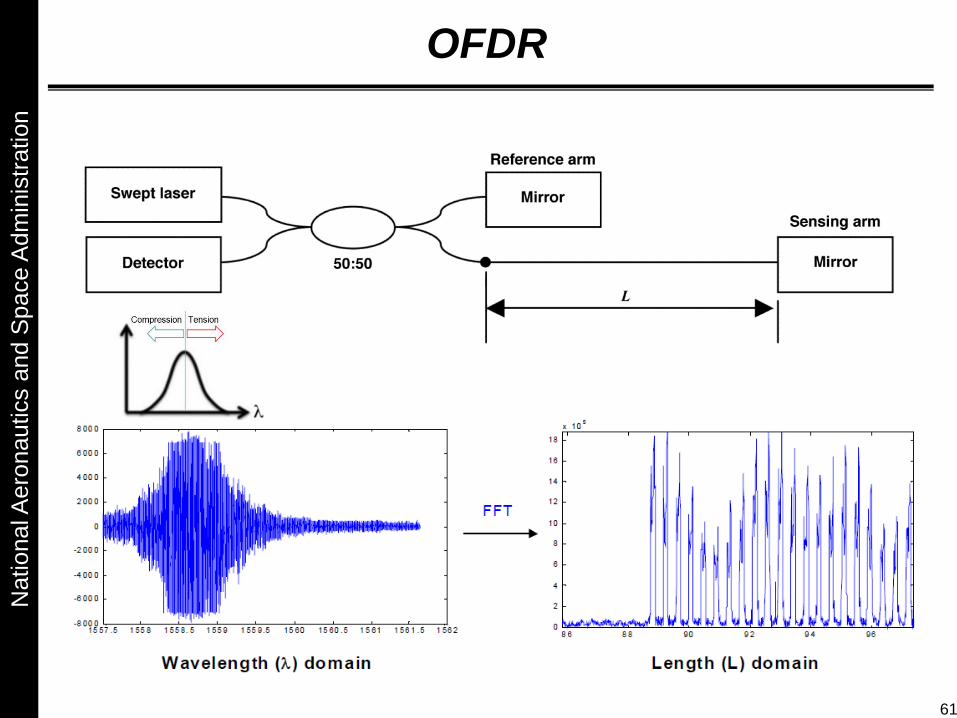
de
[dB
]
Raw Filtered
50
Time (s)Time (s)M
icro
str
ain
(µ
ε)
Mic
rostr
ain
(µ
ε)
Raw Signal
1st mode
2nd mode
3rd mode
4th mode
5th mode
Raw Signal
A NASA New Technology Report (NTR) has been filed for the Mode Shape and Acceleration Monitoring Method described in
this technical presentation and is therefore patent protected. Those interested in using the method should contact the
NASA Technology Transfer Program Office at NASA Armstrong Flight Research Center for more information

National A
ero
nautics a
nd S
pace A
dm
inis
tration
Isolating Mode Shapes
@ 4.3 Hz
@ 26.1 Hz
4.3 26
Frequency [Hz]
Ma
gn
itu
de
[d
B]
51
Mic
rostr
ain
(µ
ε)
Mic
rostr
ain
(µ
ε)
Mic
rostr
ain
(µ
ε)
Span (in)
Span (in)
Span (in)
A NASA New Technology Report (NTR) has been filed for the Mode Shape and Acceleration Monitoring Method described in
this technical presentation and is therefore patent protected. Those interested in using the method should contact the
NASA Technology Transfer Program Office at NASA Armstrong Flight Research Center for more information
National A
ero
nautics a
nd S
pace A
dm
inis
tration
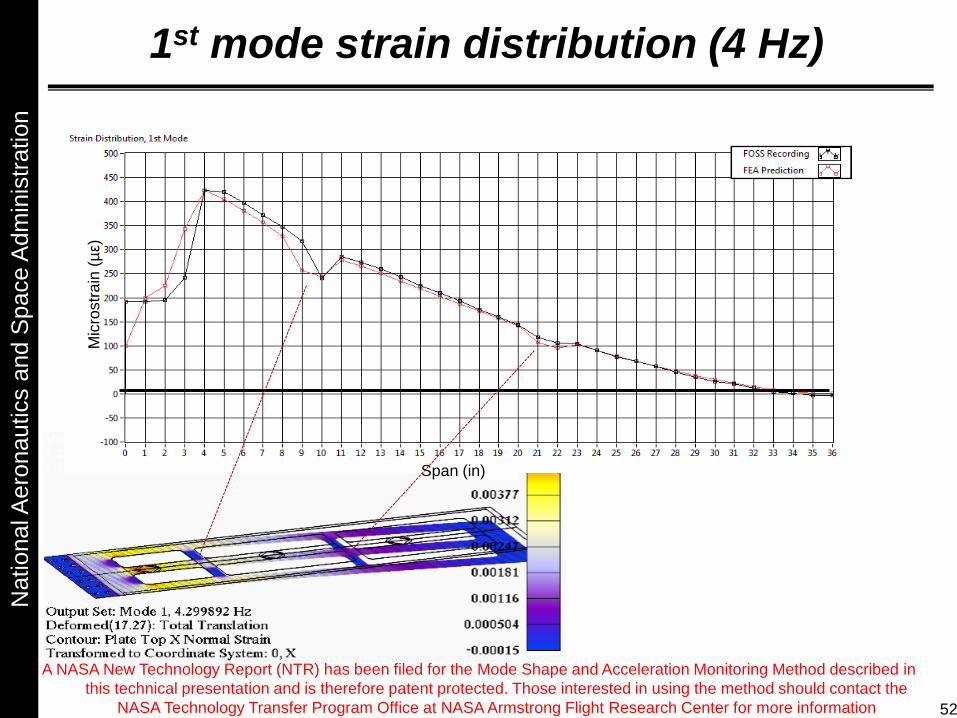
1st mode strain distribution (4 Hz)
Span (in)
52
Mic
rostr
ain
(µ
ε)
A NASA New Technology Report (NTR) has been filed for the Mode Shape and Acceleration Monitoring Method described in
this technical presentation and is therefore patent protected. Those interested in using the method should contact the
NASA Technology Transfer Program Office at NASA Armstrong Flight Research Center for more information
National A
ero
nautics a
nd S
pace A
dm
inis
tration
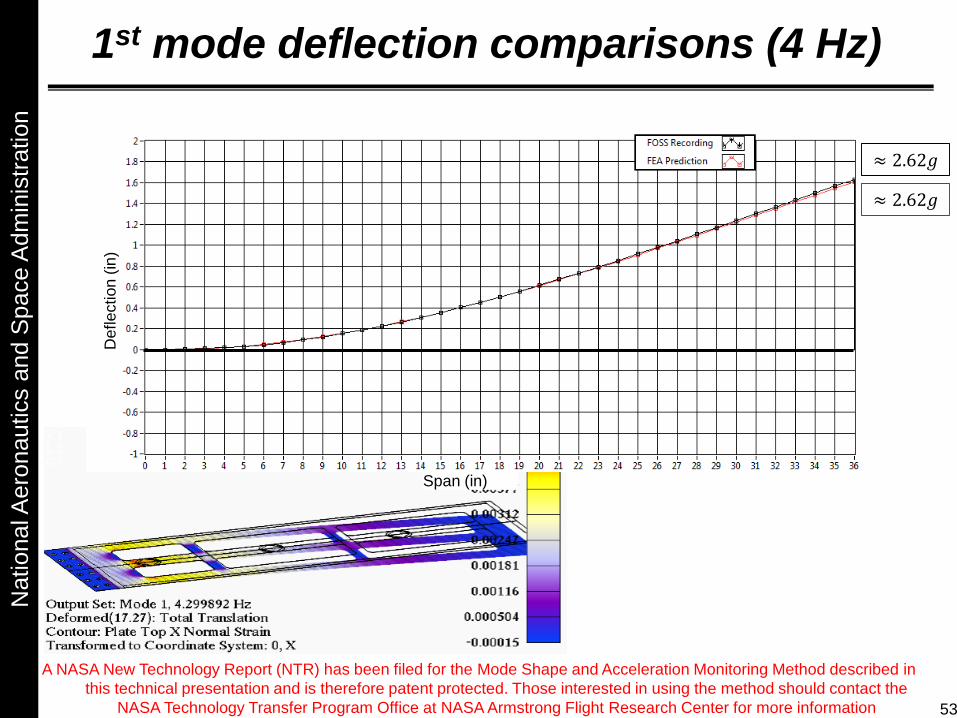
1st mode deflection comparisons (4 Hz)
Span (in)
≈ 2.62𝑔
≈ 2.62𝑔
53
Deflection
(in
)
A NASA New Technology Report (NTR) has been filed for the Mode Shape and Acceleration Monitoring Method described in
this technical presentation and is therefore patent protected. Those interested in using the method should contact the
NASA Technology Transfer Program Office at NASA Armstrong Flight Research Center for more information
National A
ero
nautics a
nd S
pace A
dm
inis
tration
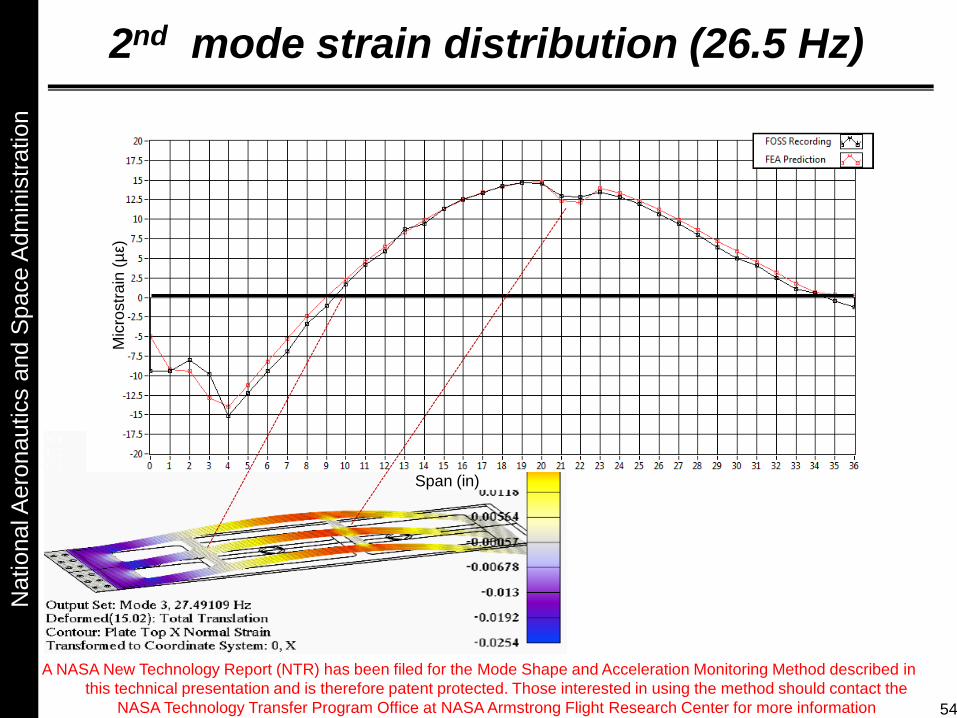
2nd mode strain distribution (26.5 Hz)
Span (in)
54
Mic
rostr
ain
(µ
ε)
A NASA New Technology Report (NTR) has been filed for the Mode Shape and Acceleration Monitoring Method described in
this technical presentation and is therefore patent protected. Those interested in using the method should contact the
NASA Technology Transfer Program Office at NASA Armstrong Flight Research Center for more information
National A
ero
nautics a
nd S
pace A
dm
inis
tration
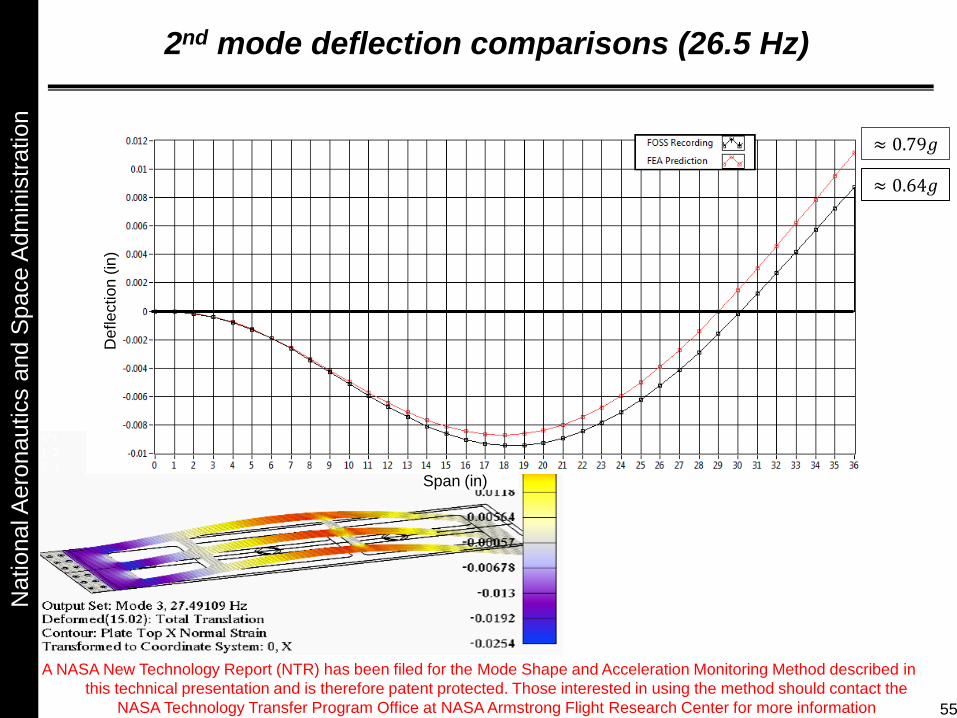
2nd mode deflection comparisons (26.5 Hz)
Span (in)
≈ 0.79𝑔
≈ 0.64𝑔
55
Deflection
(in
)
A NASA New Technology Report (NTR) has been filed for the Mode Shape and Acceleration Monitoring Method described in
this technical presentation and is therefore patent protected. Those interested in using the method should contact the
NASA Technology Transfer Program Office at NASA Armstrong Flight Research Center for more information
National A
ero
nautics a
nd S
pace A
dm
inis
tration
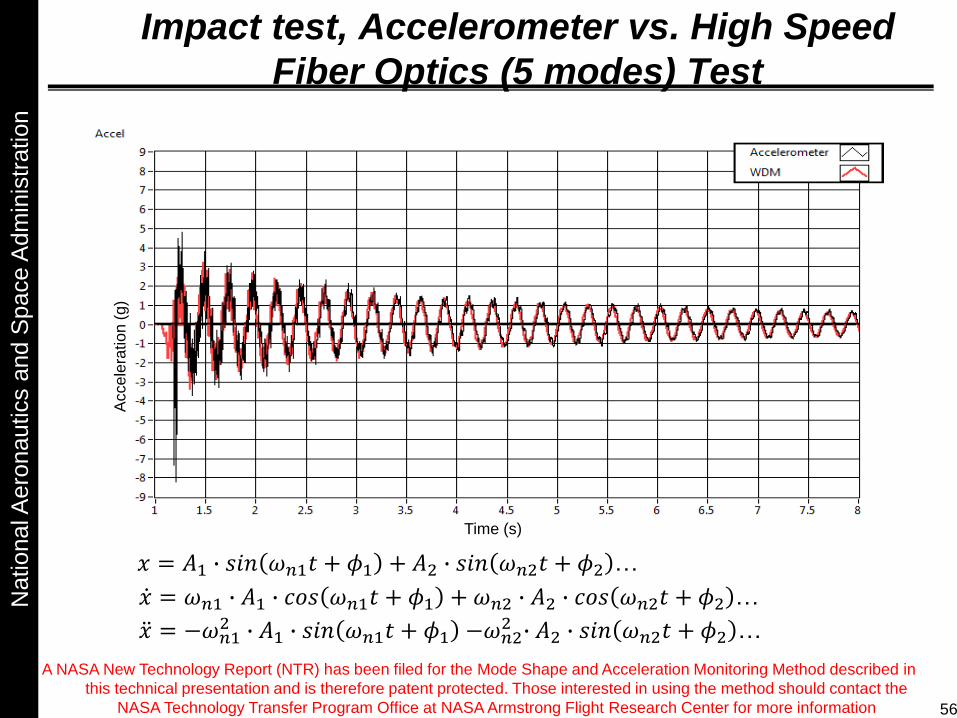
Impact test, Accelerometer vs. High Speed
Fiber Optics (5 modes) Test
𝑥 = 𝐴1 ∙ 𝑠𝑖𝑛 𝜔𝑛1𝑡 + 𝜙1 + 𝐴2 ∙ 𝑠𝑖𝑛 𝜔𝑛2𝑡 + 𝜙2 …
𝑥 = −𝜔𝑛12 ∙ 𝐴1 ∙ 𝑠𝑖𝑛 𝜔𝑛1𝑡 + 𝜙1 −𝜔𝑛2
2 ∙ 𝐴2 ∙ 𝑠𝑖𝑛 𝜔𝑛2𝑡 + 𝜙2 …
𝑥 = 𝜔𝑛1 ∙ 𝐴1 ∙ 𝑐𝑜𝑠 𝜔𝑛1𝑡 + 𝜙1 +𝜔𝑛2 ∙ 𝐴2 ∙ 𝑐𝑜𝑠 𝜔𝑛2𝑡 + 𝜙2 …
56
Time (s)
Acce
lera
tio
n (
g)
A NASA New Technology Report (NTR) has been filed for the Mode Shape and Acceleration Monitoring Method described in
this technical presentation and is therefore patent protected. Those interested in using the method should contact the
NASA Technology Transfer Program Office at NASA Armstrong Flight Research Center for more information
National A
ero
nautics a
nd S
pace A
dm
inis
tration
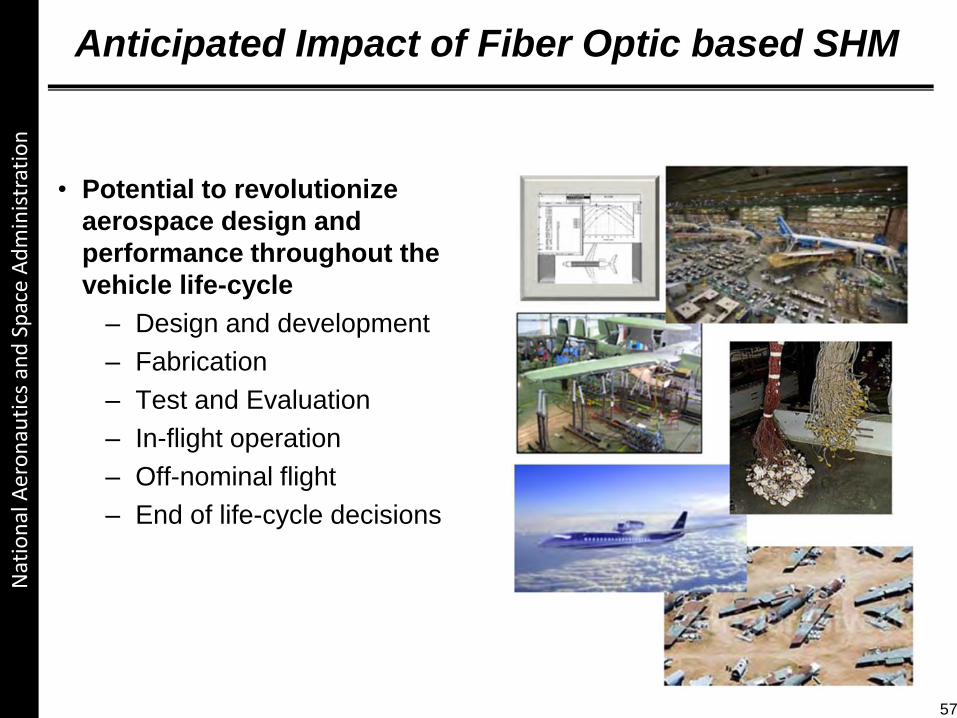
Anticipated Impact of Fiber Optic based SHM
• Potential to revolutionize
aerospace design and
performance throughout the
vehicle life-cycle
– Design and development
– Fabrication
– Test and Evaluation
– In-flight operation
– Off-nominal flight
– End of life-cycle decisions
Nat
ion
al A
ero
nau
tics
an
d S
pac
e A
dm
inis
trat
ion
57
National A
ero
nautics a
nd S
pace A
dm
inis
tration
Concluding Remarks
• FOSS Benefits
• Provides >100x the number measurements at 1/100 the total sensor weight
• Increases capability of measuring multiple parameters in real time (strain, temp.,
accel, liquid level, shape, applied loads, stress, mode shapes, natural frequencies,
buckling modes, etc.)
• Provides comprehensive datasets to validate loads / dynamics models
• For most full-scale structural dynamics applications, FOSS sample rates
(16,000 sensors at 100sps) are sufficient
• A single hybrid interrogation scheme that gleans the benefits of two
different FBG sensing technologies, WDM and OFDR, has been
developed and demonstrated
• OFDR acquires higher density FOSS measurements (16,000) and lower speed
(100Hz)
• WDM acquires FOSS measurements at higher speed (35kHz) and lower density
(~80/fiber)
• FOSS has the potential to “break the rules” for DFI; it can be used
throughout loads/dynamics modeling effort (from ground to flight) by
providing an unprecedented understanding about system/structural
performance of LV/SC throughout the vehicle life cycle
Nat
ion
al A
ero
nau
tics
an
d S
pac
e A
dm
inis
trat
ion
58

National A
ero
nautics a
nd S
pace A
dm
inis
tration
Extra Slides
59
National A
ero
nautics a
nd S
pace A
dm
inis
tration
Fiber Bragg Gratings (FBGs)
60
National A
ero
nautics a
nd S
pace A
dm
inis
tration
OFDR
61
National A
ero
nautics a
nd S
pace A
dm
inis
tration
WDM
Broad light
Source
62