
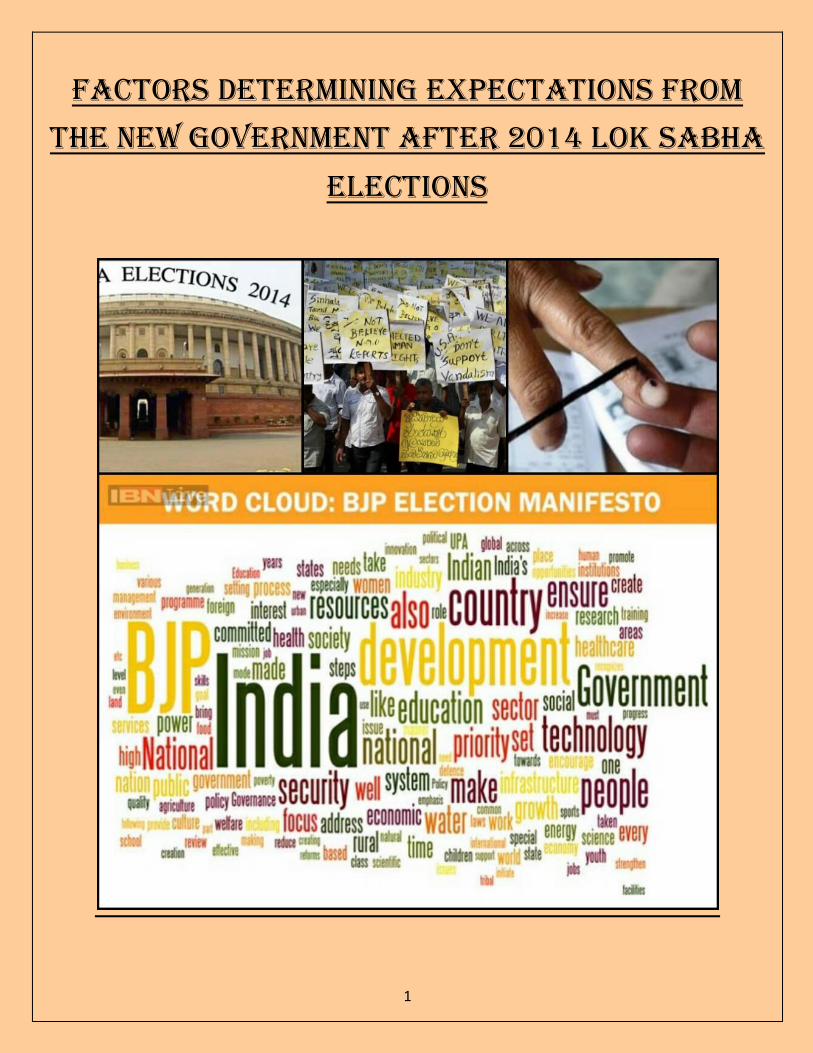
factors determining expectations from the new government after 2014 lok sabha elections
42
1 factors determining expectations from the new government after 2014 lok sabha elections
-
Upload
sharoni-goswami -
Category
Documents
-
view
20 -
download
0
Transcript of factors determining expectations from the new government after 2014 lok sabha elections
1
factors determining expectations from
the new government after 2014 lok sabha
elections
2
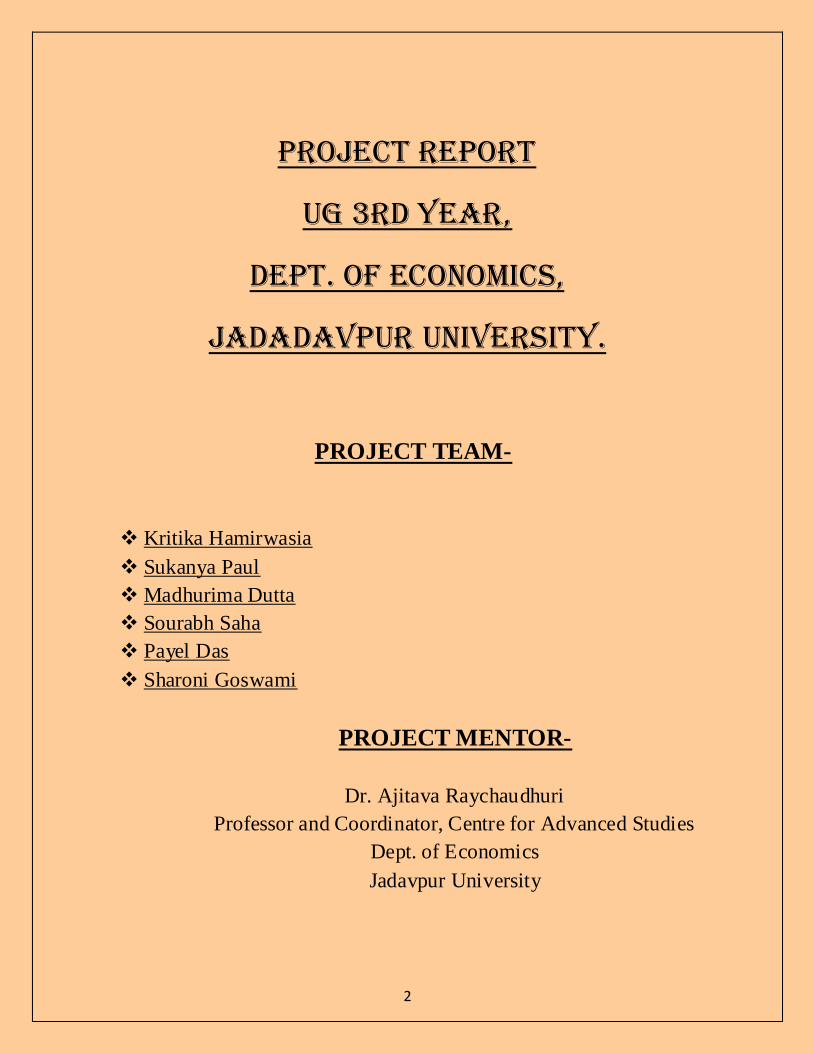
project report
ug 3rd year,
dept. of economics,
jadadavpur university.
PROJECT TEAM-
Kritika Hamirwasia
Sukanya Paul
Madhurima Dutta
Sourabh Saha
Payel Das
Sharoni Goswami
PROJECT MENTOR-
Dr. Ajitava Raychaudhuri
Professor and Coordinator, Centre for Advanced Studies
Dept. of Economics
Jadavpur University

3
abstract
This project deals with factors determining the expectation of
individuals from the new government after 2014 Lok Sabha elections. We
have tried to assess the various factors that influence the expectations on
citizens before casting their votes. We have studied a few articles in
which similar surveys were conducted and have tried to incorporate a
few other things which we have merged into our project. For this purpose
we have prepared a questionnaire in which respondents were asked
about the basic information and questions related to the study that
influence their expectation regarding the new governance.
A regression analysis, using the Software STATA 11, has been used to
derive the results. These results are found to vary with socio-economic
factors, such as, respondents' age, gender, annual family income and
educational qualification. This is the subject matter of the project.

4
ACKNOWLEDGEMENTS
This project is a final product of a year-long effort of various individuals. It would
have been impossible for the group to have completed the project without significant
contributions from various people. Hence the project is incomplete without extending
our heartfelt regards and gratitude for the same to all of them.
Firstly, we would like to acknowledge the Department of Economics, Jadavpur
University, the Head of Department- Prof. S. Mitra and all other professors in the
department for giving us the opportunity and exposure of compiling such a study as a
part of the undergraduate programme.
Words are inadequate to express our gratitude to Prof. Ajitava Raychaudhuri
whose vast knowledge and experience were instrumental in our comprehension of the
methodology and analysis of this project. This study would not have been possible
without his immense contribution and patient explanations.
Lastly, we acknowledge the effort and time spared by the respondents to fill in
the questionnaire so as to enable us to gather the data required for the analysis of the
project and attainment of our objectives. We are indebted to them, for without their
co-operation, this project would never have materialized into a reality.
5
CONTENTS
INTRODUCTION PAGE:6
REFERENCES AND RELATED STUDIES PAGE:8
DATA COLLECTION AND METHODOLOGY PAGE:11
DATA ANALYSIS AND INFERENCES PAGE:16
CONCLUSION PAGE:36
BIBLIOGRAPHY AND REFERENCES PAGE:39
SPECIMEN QUESTIONNAIRE PAGE:40

6
introduction

7
The Lok Sabha elections of 2014 was predicted to be a new wave of change in the
political scenario of the country. It was expected to bring with it a new regime of
governance and policies under the umbrella term "Achhe Din" or "Good Days". As
expected, the people of India brought in a new tide of change through their choices and
there was a change in the government after a period of ten years. However, along with
great power, comes great responsibility. Having received an overwhelming majority in
Parliament, the new government is, was and shall probably continue to be under certain
amount of pressure to fulfill promises made to the people. Nonetheless, they will strive
to live up to the expectations of the masses who are the invisible hand behind their
landslide victory.
Governance under different political scenario is one of the primary factors that
influence the socio-economic structure of India. It is one of the most basic building
blocks of the social structure and economic framework of the country during the
minimum five year governance period. Thus a drastic change in the same is not only
followed by major after effects but is also pre-empted by a large number of factors.
The objectives of this project are-
To study the factors that influenced the expectations of individuals from the New
Government elected in 2014 General elections.
To analyze the differences in expectations from the new government of different
people across six regions across the city of Kolkata.

8
references
and
related studies
9
Voting is the main form of political participation in liberal democratic societies. From a
sociological perspective, the study of voting behavior focuses primarily on explaining who
votes and how they vote. The analysis of voting patterns invariably dwells upon the
determinants of why people vote as they do and how they arrive at the decisions they make.
Early research pioneered by Paul F. Lazarsfeld and others (1967) concluded that voting
depends primarily on socio-economic factors or people’s location in social systems—their
social class, occupation, gender, race, age, religion, ethnicity, family history of voting behavior
(political socialization) and membership in voluntary associations such as trade unions,
recreational clubs, political parties and civic organizations.
Political scientists have concentrated on the influence of political factors such as issues,
political programmes, electoral campaigns, party loyalty (people’s sense of identification with
particular political parties) and voter’s feelings about particular candidates, etc.
A number of different (not mutually exclusive) approaches (models) have been used to
explain voting behavior. The major approaches may be distinguished as structural, ecological,
social-psychological, rational-choice and radical.
This approach has suggested two main sources of influence which structure political
alignments:
Sectoral cleavages which separate people into groups with different interests and
priorities, e.g., public sector and private sector, and
Dominant ideological messages which are conveyed mainly through the media and
form ‘political consciousnesses’.
SOURCE- Survey by London School of Economics
Accessed on- 1/4/15
The International Foundation for Electoral Systems conducted a poll in Ukraine before
the 2014 elections to find out the opinions of the voters and their expectations from the
various leaders. These included questions on expected government stability(58% expected
10
instability), unemployment (50% expected unemployment), poverty(51% expected
poverty),inflation (56% expected inflation) and corruption (47% expected corruption). There
were also questions pertaining to expectation of Ukraine joining EU as well as comparative
expectations of performance of various electoral candidates such as Viktor Yanukovych and
Yulia Tymoshenko.
Source-International Foundation for Electoral Systems
Accessed on- 7/4/2015
Similar polls were conducted about the possibility of having an Obama government in
USA . Nearly two thirds of those questioned in a CNN/ Opinion Research Corp. survey said that
Obama would be able to change the country for the better, 25% saying he wouldn’t be able to
change it at all and 9% indicating that the change would be for the worse. Also, 76% said that
conditions in the country would improve in the following four years with the remaining 24%
saying that it would not be likely.
SOURCE-CNN Opinion Research Corp.
ACCESSED ON- 7/4/15
It should also be noted that opinion polls were conducted about expectations from the
new government after 2014 general elections by organizations like CNN-IBN, who took calls of
voters from across the city to ask their opinions who expressed expectations regarding various
factors including price stability and job opportunities.
SOURCE- CNN IBN
ACCESSED ON- 7/4/15

11
data collection
and
methodology
12
Data for this study has been collected from an average of approximately forty five
individuals per region across six regions of Kolkata. The questionnaire for the collection of data
was designed in a manner to capture the factors influencing the votes of individuals for the
2014 elections and expectations from the new governance. It consisted of primary questions
regarding the said individuals as well as specifically directed questions pertaining to the area of
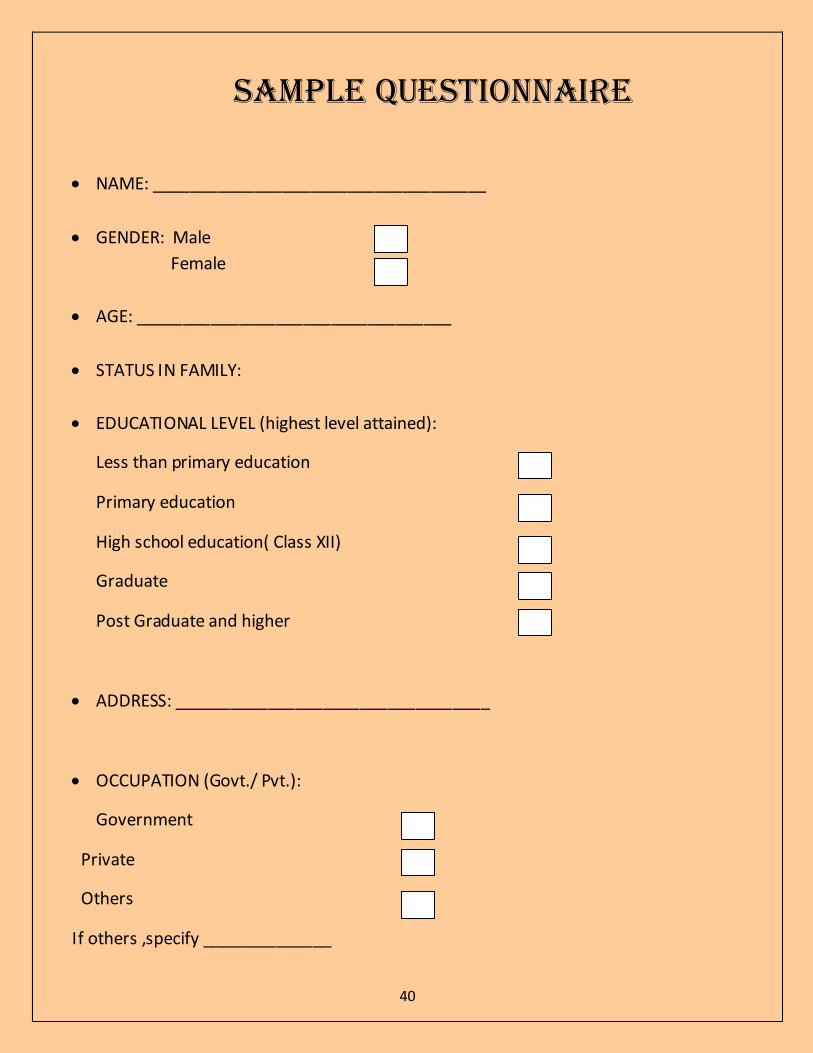
study. The data collection(survey) period extended over two months, from 1st December,2014
to 30th January, 2015. A specimen questionnaire has been attached to this project at the end.
The method used for analyzing this data is ordered probit regression . Ordered probit is
a generalization of the popular probit analysis to the case of more than two outcomes of an
ordinal dependent variable. The respondents were asked to rate each category on a scale of 1
to 5, where 1 denoted the least importance and 5 denoted the highest importance. The levels
1 to 5, which express the degree of importance, are called order of the categorical variable. In
other words, it is not only a categorical variable, but it is also an ordered categorical variable.
Here, we have regressed various independent variables such as annual family income,
gender, number of family members, number of voting members etc on various dependent
variables such as growth & development, decrease in crime rate, rapid construction of
infrastructural facilities, stronger rupee against dollar etc. Thus we have a regression model,
Yi*= β0 + ∑k
j=1 βj xi j + ui
Where yi* is not observed. It is commonly called a “latent” variable. What can be
observed is an ordered variable yi* defined by
Yi = 1 if yi* ≤ ϒ 1
= 2 if ϒ 2 ≤ yi* ≤ ϒ 1
=…..
=5 if yi* ≤ ϒ 4
This can be further illustrated as follows-
Assume Y has more than two ordered categories (for instance, Low, Medium, High)

13
FIG 1: CUMULATIVE DENSITY FUNCTION OF THE VARIABLE Y
We now need two cut-points to divide the curve into three sections
Stata will estimate these as µ1 and µ2 by the maximum likelihood procedure
FIG 2: CUT POINTS µ1 AND µ2 MARKED OUT ON THE CURVE
14
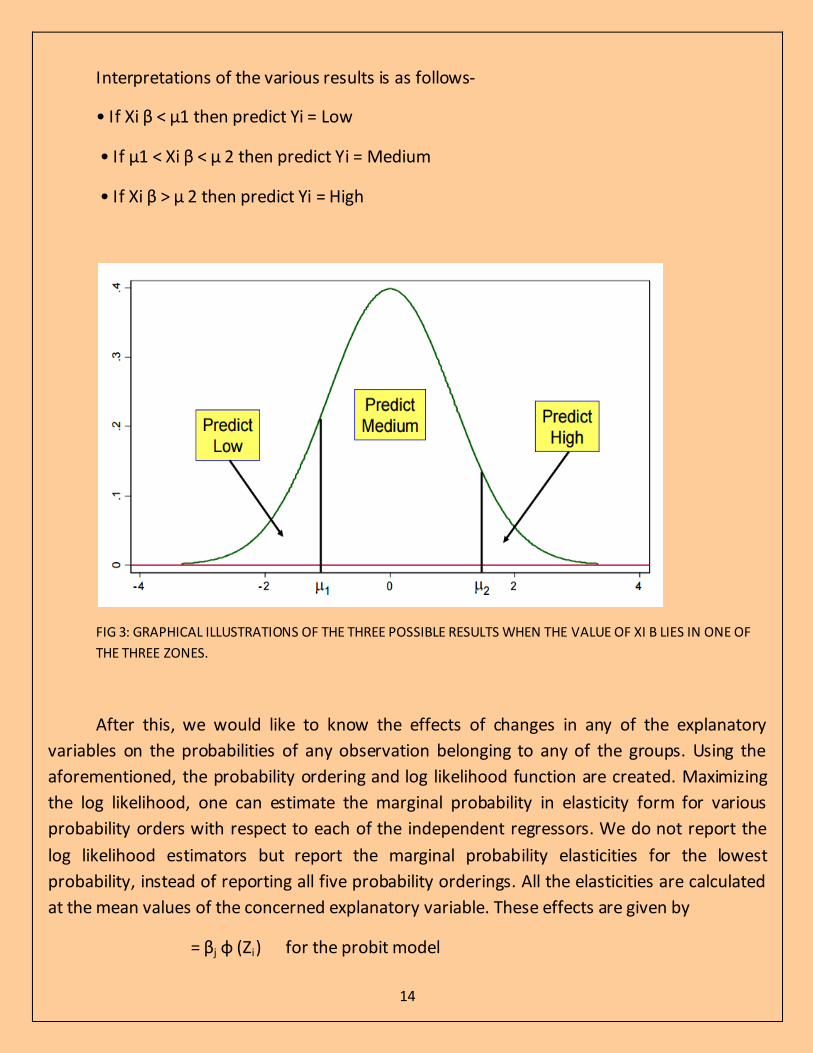
Interpretations of the various results is as follows-
• If Xi β < µ1 then predict Yi = Low
• If µ1 < Xi β < µ 2 then predict Yi = Medium
• If Xi β > µ 2 then predict Yi = High
FIG 3: GRAPHICAL ILLUSTRATIONS OF THE THREE POSSIBLE RESULTS WHEN THE VALUE OF XI Β LIES IN ONE OF
THE THREE ZONES.
After this, we would like to know the effects of changes in any of the explanatory
variables on the probabilities of any observation belonging to any of the groups. Using the
aforementioned, the probability ordering and log likelihood function are created. Maximizing
the log likelihood, one can estimate the marginal probability in elasticity form for various
probability orders with respect to each of the independent regressors. We do not report the
log likelihood estimators but report the marginal probability elasticities for the lowest
probability, instead of reporting all five probability orderings. All the elasticities are calculated
at the mean values of the concerned explanatory variable. These effects are given by
= βj φ (Zi) for the probit model
15
Where Zi = β0 + ∑kj=1 βj xi j
and φ (.) is the density function of the standard normal.
In this project we have however used marginal effect analysis instead of marginal
elasticity analysis, though they are based on similar concepts. Marginal effect shows the
change in probability of giving lowest rank to the dependent variable with respect to change in
the independent variable, that is when independent variable changes by one unit over the
mean value, there is a higher probability of people to lowest rank(rank 1, displaying least
expectation) to the dependent variable if the sign is positive and lower probability of people to
give lowest rank to the dependent variable when the sign is negative.

16
data analysis
and
inferences
17
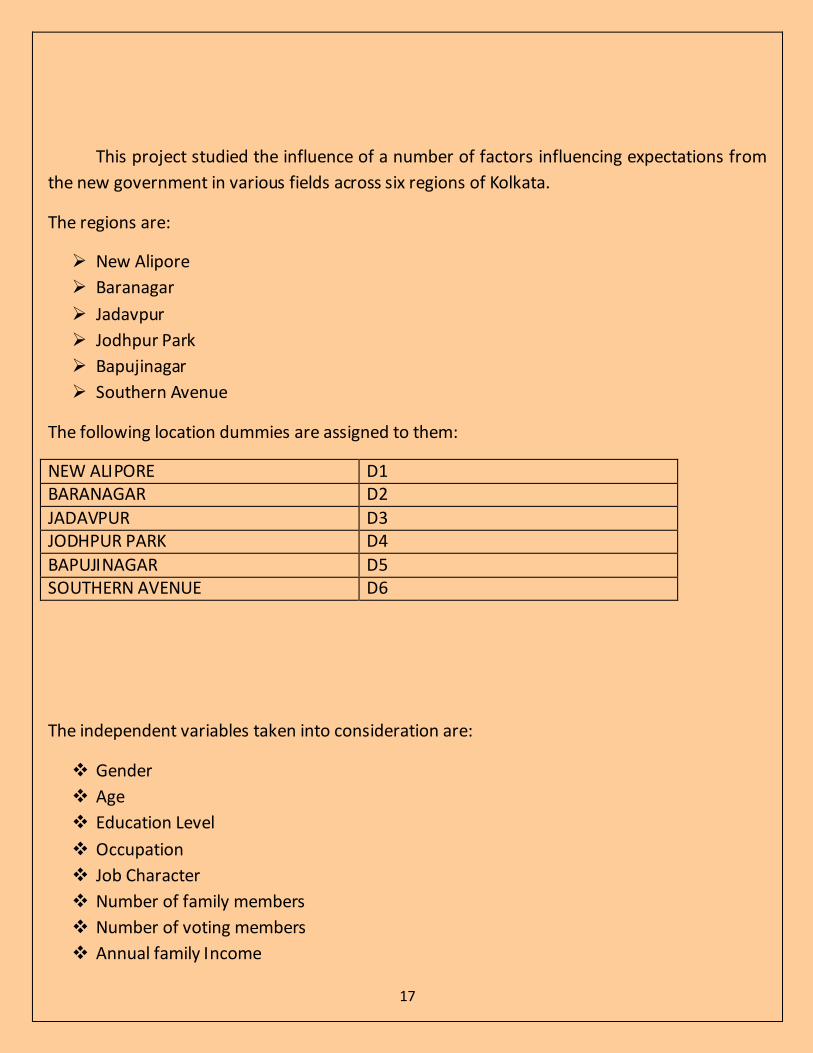
This project studied the influence of a number of factors influencing expectations from
the new government in various fields across six regions of Kolkata.
The regions are:
New Alipore
Baranagar
Jadavpur
Jodhpur Park
Bapujinagar
Southern Avenue
The following location dummies are assigned to them:
NEW ALIPORE D1 BARANAGAR D2
JADAVPUR D3 JODHPUR PARK D4
BAPUJINAGAR D5 SOUTHERN AVENUE D6
The independent variables taken into consideration are:
Gender
Age
Education Level
Occupation
Job Character
Number of family members
Number of voting members
Annual family Income

18
Possession of Voter ID
Casting of vote in 2014
These independent variables were cardinally measured as follows:
GENDER Female-0, Male-1
AGE Numerically measured in number of years
EDUCATION LEVEL Less than primary education-1, Primary education-2, High school education(class XII)-3, Graduate-4 and Post graduate and higher-5
OCCUPATION Private sector-0, Govt. sector-1 NO. OF FAMILY MEMBERS Numerically measured NO. OF VOTING MEMBERS Numerically measured
ANNUAL FAMILY INCOME Less than 20,000-1; 20,001 to 50,000-2; 50,001 to 1,00,000-3;1,00,001 to 2,00,000-4; 2,00,001 to 5,00,000-5;5,00001 to 10,00,000-6; 10,00,001 to 20,00,001-7; more than 20,00,001-8
POSSESSION OF VOTER ID No- 0, Yes-1 CASTING OF VOTE IN 2014 No- 0, Yes-1
We have studied the expectations from the new 2014 Government in the following
fields. The abbreviations used for them for the remainder of the project are mentioned
alongside:
Growth and Development GD
Larger Job Opportunities LO Stability in Prices SP
Decrease in Crime Rate CR Better Government Health facilities at Cheap Cost
HF
Quality Education at all Levels QE More Schemes for the Elderly ES Fall in Undesirable Delays in Decision DM

19
Making
Rapid Construction of Infrastructure (like roads, flyovers, rail networks, ports, power plants, etc)
CI
Better relations with India's Neighbours PR Stronger Rupee against Dollar RD
Less Corruption in the Government CG
ANALYSIS OF MOST IMPORTANT FACTORS AFFECTING THE SURVEY AND A
COMPARATIVE STUDY OF THEIR AVERAGES ACROSS THE SAMPLED AREAS:
MEAN OF INDEPENDENT VARIABLES
NEWALIPORE
BARANAGAR AREA
JADAVPUR AREA
JODHPUR PARK AREA
BAPUJINAGAR AREA
SOUTHERN AVENUE AREA
OVERALL
AGE 33.08 41.97826 27.25641 49.06977 34 45.16667 38.43396
EDUCATION LEVEL
4.02 4.152174 2.74359 4.534884 3.733333 3.809524 3.856604
NO. OF FAMILY MEMBERS
4.74 4.369565 4.153846 3.465116 3.422222 3.904762 4.026415
NO. OF VOTING MEMEBERS
4.22 3.652174 3.794872 2.744186 2.911111 3.166667 3.430189
ANNUAL FAMILY INCOME
5.54 5.021739 4.717949 6.72093 6.177778 5.5 5.622642
TABLE 1 :MEAN VALUES OF VARIABLES ACROSS SIX REGIONS
The table shows the mean values across the sampled regions. The following inferences
can be drawn about the same:
20
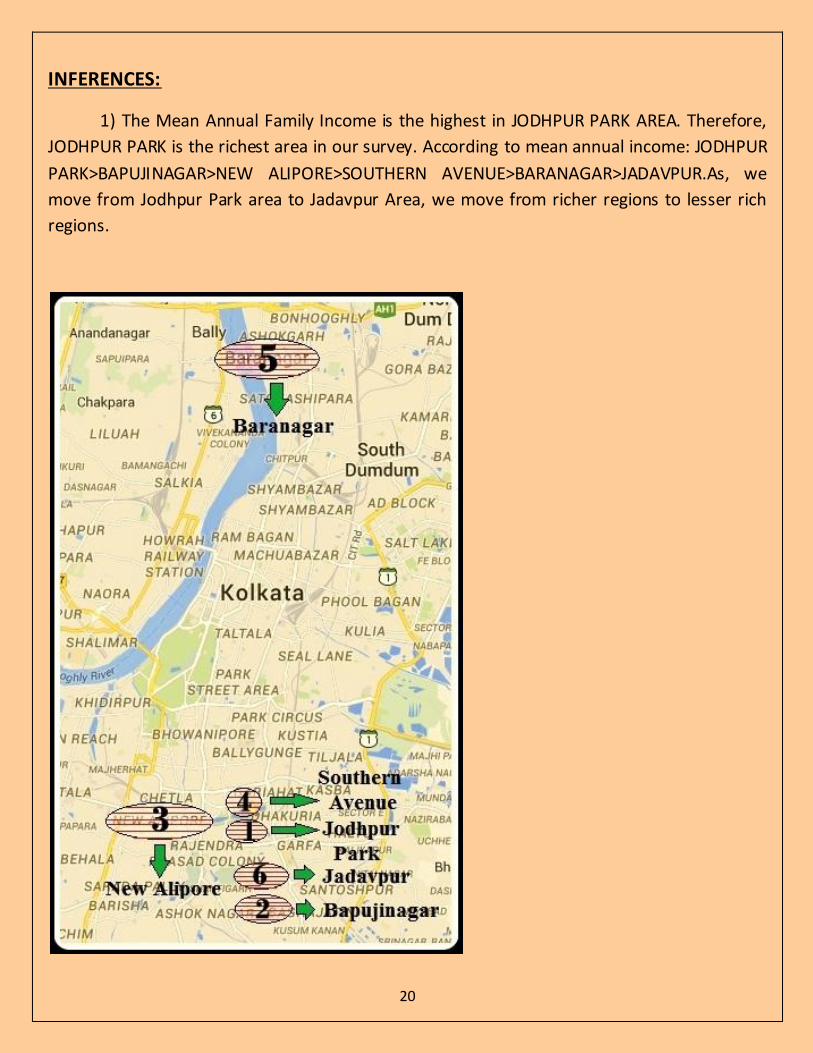
INFERENCES:
1) The Mean Annual Family Income is the highest in JODHPUR PARK AREA. Therefore,
JODHPUR PARK is the richest area in our survey. According to mean annual income: JODHPUR
PARK>BAPUJINAGAR>NEW ALIPORE>SOUTHERN AVENUE>BARANAGAR>JADAVPUR.As, we
move from Jodhpur Park area to Jadavpur Area, we move from richer regions to lesser rich
regions.
21
MAP 1: AVERAGE ANNUAL FAMILY INCOME IN THE SIX REGIONS
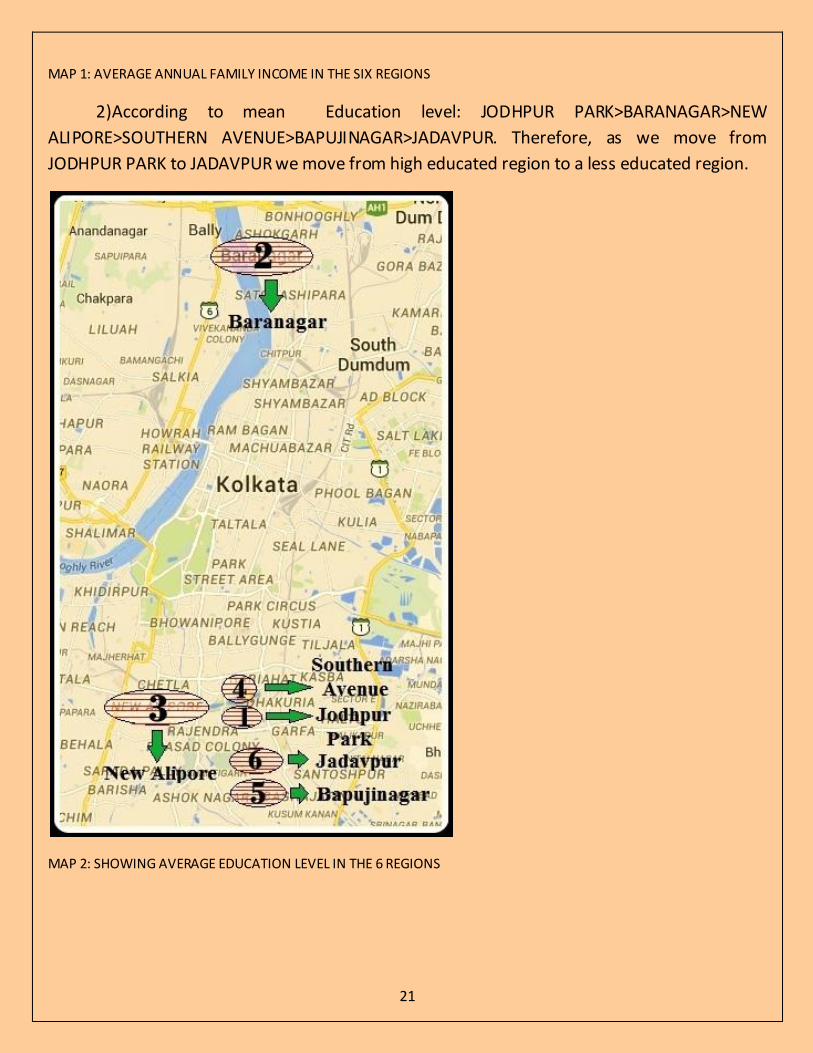
2)According to mean Education level: JODHPUR PARK>BARANAGAR>NEW
ALIPORE>SOUTHERN AVENUE>BAPUJINAGAR>JADAVPUR. Therefore, as we move from
JODHPUR PARK to JADAVPUR we move from high educated region to a less educated region.
MAP 2: SHOWING AVERAGE EDUCATION LEVEL IN THE 6 REGIONS

22
3)According to mean Age: JODHPUR PARK>SOUTHERN AVENUE> BARANAGAR>
BAPUJINAGAR>NEWALIPORE>JADAVPUR. Therefore, in our sample JODHPUR PARK has more
aged people than the rest and JADAVPUR region has the least mean age in our sample, so
JADAVPUR consists of less aged people.
MAP 3: AVERAGE AGE IN THE 6 REGIONS
23
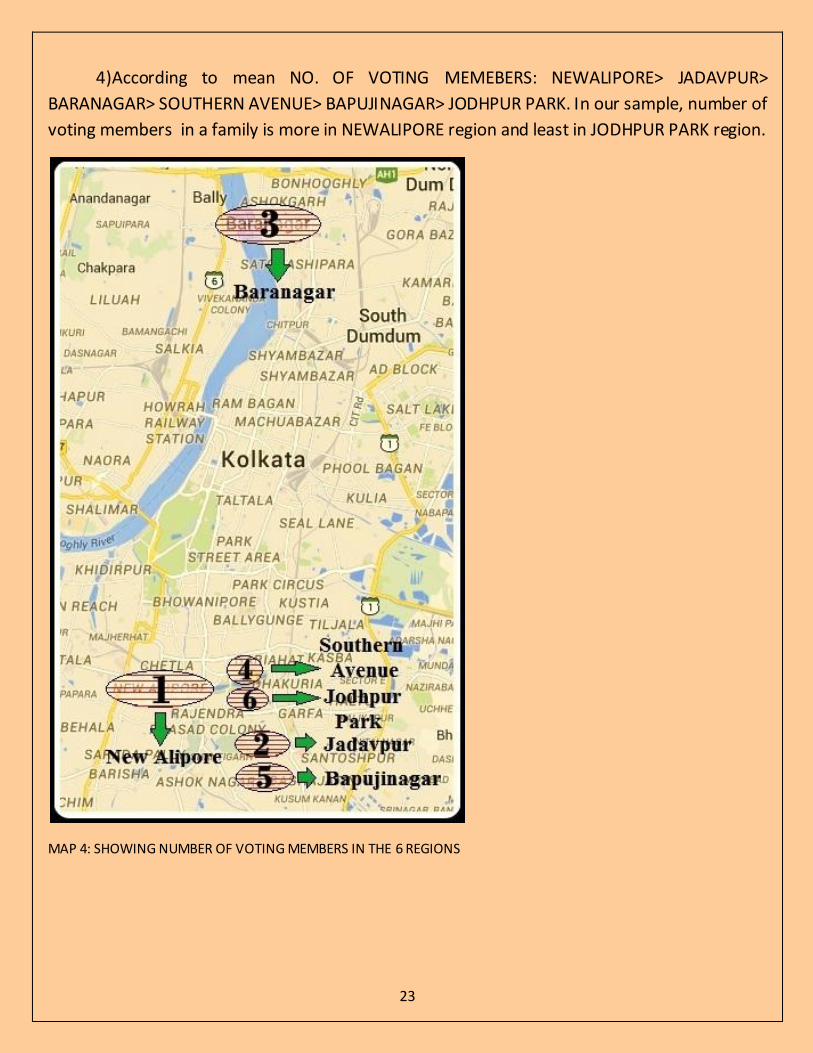
4)According to mean NO. OF VOTING MEMEBERS: NEWALIPORE> JADAVPUR>
BARANAGAR> SOUTHERN AVENUE> BAPUJINAGAR> JODHPUR PARK. In our sample, number of
voting members in a family is more in NEWALIPORE region and least in JODHPUR PARK region.
MAP 4: SHOWING NUMBER OF VOTING MEMBERS IN THE 6 REGIONS

24
CORRELATION CO-EFFICIENTS OF THE INDEPENDENT VARIBLES:
The following table shows the co –efficient of correlation between the independent
variables (not location dummies).
gender age status educat~l jobcha~r nooffa~r noofvo~s annual~e voterid vot~2014
gender 1
age 0.0607 1
s tatus -0.3148
-0.5588
1
educationl~l 0.0269 0.3707 -0.2182
1
jobcharacter -
0.2215
-0.108 0.0802 -0.2462 1
nooffamily~r -0.0659
-0.2262
0.4034 0.0051 0.0229 1
noofvoting~s 0.0127 -0.2347
0.4768 -0.0646 -0.0152 0.8243 1
annualfami~e -0.1106
0.0653 -0.0206
0.3926 -0.0045 0.1401 0.0512 1
voterid 0.2454 0.0825 -0.0519
0.1116 -0.1239 0.0951 0.2014 -0.1046 1
votedin2014 0.1163 0.0383 0.0392 -0.076 -0.0366 0.1149 0.1755 -0.2254 0.4274 1
TABLE 2: CORRELATION CO-EFFICIENTS OF THE INDEPENDENT VARIABLES
It suggests that either number of voting members or number of family members be
dropped while running regressions as the high correlation would lead to a problem of multi
collinearity.
25
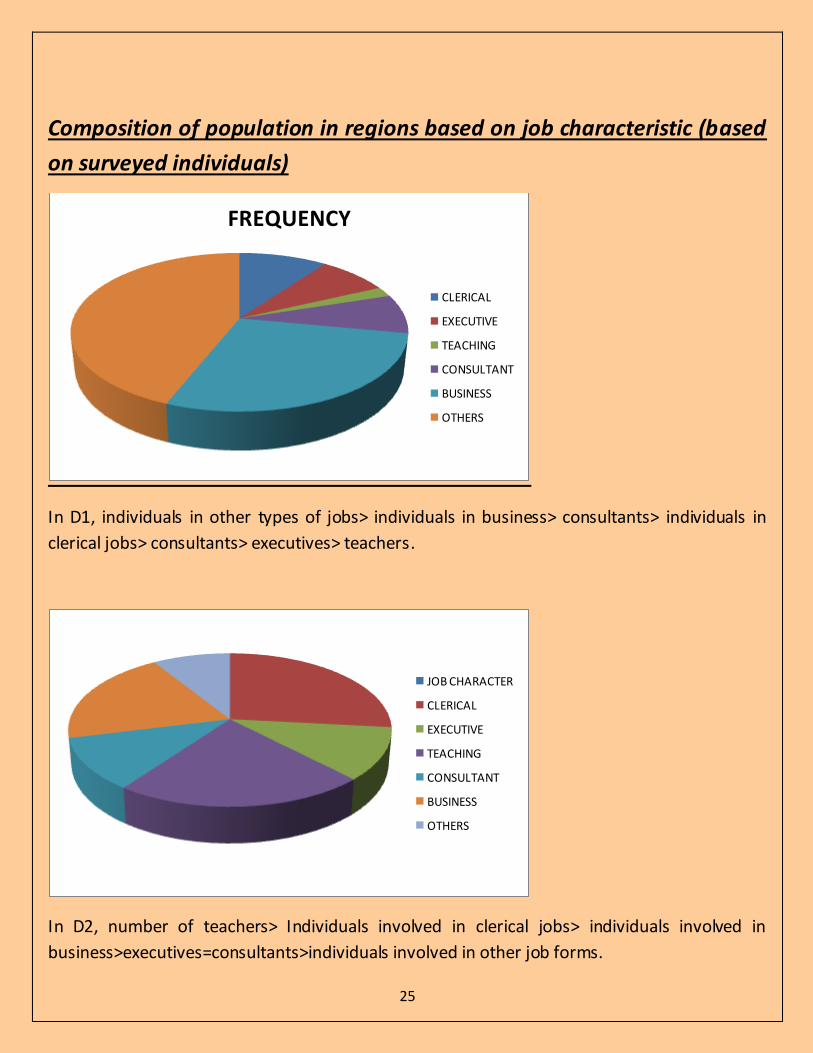
Composition of population in regions based on job characteristic (based
on surveyed individuals)
In D1, individuals in other types of jobs> individuals in business> consultants> individuals in
clerical jobs> consultants> executives> teachers.
In D2, number of teachers> Individuals involved in clerical jobs> individuals involved in
business>executives=consultants>individuals involved in other job forms.
FREQUENCY
CLERICAL
EXECUTIVE
TEACHING
CONSULTANT
BUSINESS
OTHERS
JOB CHARACTER
CLERICAL
EXECUTIVE
TEACHING
CONSULTANT
BUSINESS
OTHERS

26
In D3, number of individuals in other job forms> number of individuals in business>
executives> teachers> consultants.
In D4, Individuals involved in business> individuals in other business> consultants> teachers>
executives
JOB CHARACTER
CLERICAL
EXECUTIVE
TEACHING
CONSULTANT
BUSINESS
OTHERS
CLERICAL
EXECUTIVE
TEACHING
CONSULTANT
BUSINESS
OTHERS

27
In D5, number of individuals in other job forms> individuals involved in business>
teachers>executives> individuals involved in clerical work.
In D6, number of individuals in other job forms> number of individuals in business> teachers>
executives> number of individuals involved in clerical work.
CLERICAL
EXECUTIVE
TEACHING
CONSULTANT
BUSINESS
OTHERS
CLERICAL
EXECUTIVE
TEACHING
CONSULTANT
BUSINESS
OTHERS
28
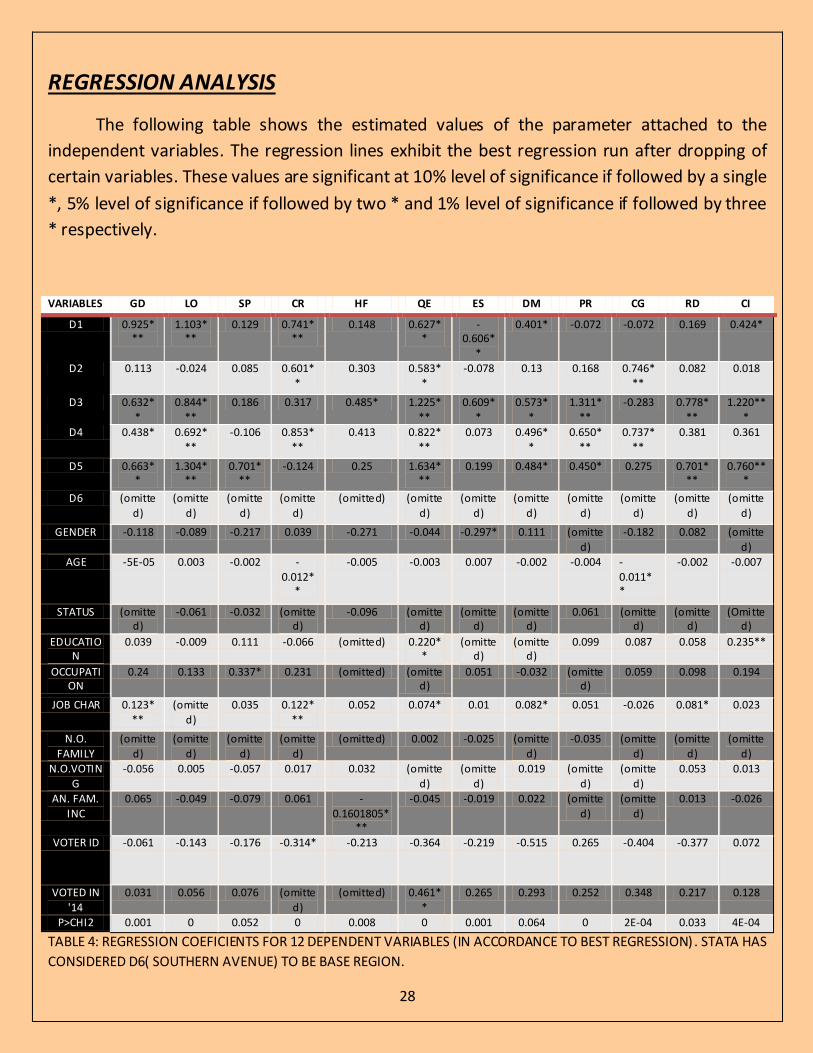
REGRESSION ANALYSIS
The following table shows the estimated values of the parameter attached to the
independent variables. The regression lines exhibit the best regression run after dropping of
certain variables. These values are significant at 10% level of significance if followed by a single
*, 5% level of significance if followed by two * and 1% level of significance if followed by three
* respectively.
VARIABLES GD LO SP CR HF QE ES DM PR CG RD CI
D1 0.925***
1.103***
0.129 0.741***
0.148 0.627**
-0.606*
*
0.401* -0.072 -0.072 0.169 0.424*
D2 0.113 -0.024 0.085 0.601*
*
0.303 0.583*
*
-0.078 0.13 0.168 0.746*
**
0.082 0.018
D3 0.632*
*
0.844*
**
0.186 0.317 0.485* 1.225*
**
0.609*
*
0.573*
*
1.311*
**
-0.283 0.778*
**
1.220**
* D4 0.438* 0.692*
**
-0.106 0.853*
**
0.413 0.822*
**
0.073 0.496*
*
0.650*
**
0.737*
**
0.381 0.361
D5 0.663**
1.304***
0.701***
-0.124 0.25 1.634***
0.199 0.484* 0.450* 0.275 0.701***
0.760***
D6 (omitte
d)
(omitte
d)
(omitte
d)
(omitte
d)
(omitted) (omitte
d)
(omitte
d)
(omitte
d)
(omitte
d)
(omitte
d)
(omitte
d)
(omitte
d)
GENDER -0.118 -0.089 -0.217 0.039 -0.271 -0.044 -0.297* 0.111 (omitte
d)
-0.182 0.082 (omitte
d) AGE -5E-05 0.003 -0.002 -
0.012**
-0.005 -0.003 0.007 -0.002 -0.004 -0.011**
-0.002 -0.007
STATUS (omitted)
-0.061 -0.032 (omitted)
-0.096 (omitted)
(omitted)
(omitted)
0.061 (omitted)
(omitted)
(Omitted)
EDUCATION
0.039 -0.009 0.111 -0.066 (omitted) 0.220**
(omitted)
(omitted)
0.099 0.087 0.058 0.235**
OCCUPATION
0.24 0.133 0.337* 0.231 (omitted) (omitted)
0.051 -0.032 (omitted)
0.059 0.098 0.194
JOB CHAR 0.123***
(omitted)
0.035 0.122***
0.052 0.074* 0.01 0.082* 0.051 -0.026 0.081* 0.023
N.O. FAMILY
(omitted)
(omitted)
(omitted)
(omitted)
(omitted) 0.002 -0.025 (omitted)
-0.035 (omitted)
(omitted)
(omitted)
N.O.VOTING
-0.056 0.005 -0.057 0.017 0.032 (omitted)
(omitted)
0.019 (omitted)
(omitted)
0.053 0.013
AN. FAM. INC
0.065 -0.049 -0.079 0.061 -0.1601805*
**
-0.045 -0.019 0.022 (omitted)
(omitted)
0.013 -0.026
VOTER ID -0.061 -0.143 -0.176 -0.314* -0.213 -0.364 -0.219 -0.515 0.265 -0.404 -0.377 0.072
VOTED IN
'14
0.031 0.056 0.076 (omitte
d)
(omitted) 0.461*
*
0.265 0.293 0.252 0.348 0.217 0.128
P>CHI2 0.001 0 0.052 0 0.008 0 0.001 0.064 0 2E-04 0.033 4E-04
TABLE 4: REGRESSION COEFICIENTS FOR 12 DEPENDENT VARIABLES (IN ACCORDANCE TO BEST REGRESSION) . STATA HAS
CONSIDERED D6( SOUTHERN AVENUE) TO BE BASE REGION.

29
INFERENCES Difference in location: In the area D5, that is, in Bapuji Nagar, as compared to the base region D6 (Southern
Avenue), people have higher expectation about improved Growth & Development (GD), Larger
job opportunities (LO), Stability in Prices (SP), Better Health facilities at cheaper cost (HF),
Quality education all levels (QE), More Schemes for Elderly (ES), Fall in Undesirable Delays in
Decision Making (DM), Better Foreign Relations (PR), Less Corruption in Government (CG),
Strong Rupee against Dollar (RD), Construction of Infrastructure (CI) {as indicated by the
positive sign of the co-efficient}, whereas lower expectation is noticed regarding Decrease in
crime rate (CR) {indicated by the negative sign of the co-efficient}.
Similarly, in comparison to the base region D6, for other areas, like D1, lower
expectations have been recorded relating to ES, PR and CG; in D2, people have lower
expectation about LO and ES ; in D3, lower expectation has been shown about CG; in D4, less
expectation has been seen about SP, whereas higher expectation has been seen about all
other factors.
Education:
Looking through the details of each of the parameters, the mean educational level is the
second lowest in the Bapuji Nagar area and lower than that of the base region too. Hence the
people here have higher expectation about Quality education at all levels. It must be noted
that this is only an attempt to explain the results and the existence of other reasons for such
results is highly possible.
Gender:
On the basis of gender, men have higher expectations about Growth & Development
(GD), larger job opportunities (LO), Stability in Prices (SP), Better health facilities at cheaper
cost (HF), Quality education at all levels (QE), More Schemes for Elderly (ES), Less Corruption in
Government (CG) as compared to women but less to Decrease in crime rate (CR), Fall in
Undesirable Delays in Decision Making (DM), Strong Rupee against Dollar (RD) than women.
Consequently, it can be added that women have higher expectation about decrease in crime
rate(CR) which seems quite logical especially considering the present high level of crime rate
against women.

30
Age:
Going on to age, younger individuals have higher expectations about GD, SP, HF, QE, CR,
DM, PR, CG, RD and CI; while older individuals are seen to have higher expectations regarding
LO and ES.
Educational Level:
Analyzing the educational level attained by an individual, a less educated person has
shown higher expectation about LO and CR, whereas, a more educated person has shown
higher expectations regarding to other parameters like, GD, SP, QE, PR, CG, RD and CI.
Occupation:
Moving to occupation of individuals, an individual associated with the government
sector show higher expectation relating to DM; while those associated with the private or
other sector have higher expectation about GD, LO, SP, CR, ES, CG, RD, CI.
Number of Family Members:
As number of members in family increase, higher expectation about QE is seen as
compared to smaller families, while families with less number of members have higher
expectation pertaining to ES and PR compared to larger families.
Number of Voting Members:
Looking to the number of voting members in family, as the number increases,
expectation regarding LO, CR, HF, DM, RD, CI is higher, while as it decreases, expectation
regarding GD and SP is higher.
Annual Family Income:
It can be seen that as annual family income rises, higher expectation is seen about
Growth& Development, Decrease in Crime rate, DM and RD as indicated by the sign of positive
coefficients. Moreover, with the rise of annual family income, people have shown lower
expectations about on Larger job opportunities (LO), SP, Better health facilities at cheaper cost

31
(HF), Quality education at all levels (QE), ES and CI. The reasons for these expectations cannot
be explained without carrying out a post analysis survey.
Possession of Voter ID Card:
People possessing voter id card have displayed higher expectation pertaining to PR and
CI; and lower expectation pertaining to GD, LO, SP, CR, HF, QE, ES, DM, CG and RD.
Voted in 2014:
If we consider voting in 2014 as a basis, we see that people who have not voted in 2014
have higher expectations regarding GD, LO, HF, QE, ES, DM, PR, CG, RD, CI than those who
have.
For the other regressions, where the variable isn’t mentioned, those variables have been
dropped.
MARGINAL EFFECT ANALYSIS
The following table shows marginal effects. It thus shows the change in probability of
giving lowest rank to the dependent variable with respect to change in the independent
variable. That is when independent variable changes by one unit over the mean value, there is
a higher probability of people to state least expectation(rank 1) pertaining to the dependent
variable (say GD) if the sign is positive and lower probability of people to display least
expectation relating to the dependent variable when the sign is negative.
The marginal effects have only been calculated for those independent variables for
which the regressions of the dependent variables have found to be significant. However,
conclusions drawn from this table is restricted to the sample and cannot said to be holding
true for the population as they are not found to be significant.
32
TABLE 5: MARGINAL EFFECTS ON EXPECTATIONS REGARDING 12 DEPENDENT VARIABLES FOR UNIT CHANGE OF
PARAMETERS ABOUT THEIR MEAN
INFERENCES
The marginal effects have only been calculated for those independent variables for
which the regressions of the dependent variables have found to be significant. However,
conclusions drawn from this table is restricted to the sample and cannot said to be holding
true for the population as they are not found to be significant.
We can now analyze the effects as follows-
DIFFERENCE IN LOCATION:
Stata by default has taken D6 to be the base region. as we move from D6 to D1, we see-
people have less probability to have least expectation about GD, LO, CR and QE,DM and CI
(inferred from the negative sign of the marginal effect). Similarly, people have ,more
probability to have least expectation relating to ES (inferred from positive sign).
As we move from D6 to D2- people have less probability to put least importance on GD,
LO, CR, CG and QE, implying D2 people show higher expectations about these factors than
those in D6.
INDEPENDENT
VARIABLES
GD LO SP CR HF QE ES DM
PR CG RD CI
D1 -0.008 -0.019 -0.020 0.046 0.262 -0.244 -0.179
D2 -0.005 -0.015 -0.016 -0.043 -0.466
D3 -0.003 -0.012 -0.019 -0.090 -0.305 -0.287 -0.758 -0.366 -0.473
D4 -0.005 -0.023 -0.022 -0.061 -0.261 -0.334 -0.417
D5 -0.008 -0.121 -0.261 -0.233 -0.362 -0.303
AGE 0.001 1.388
OCCUPATION -0.003 0.593
EDUCATION LEVEL
0.016 -1.952
JOB CHARACTER
-0.001 -0.003 -0.005
ANNUAL FAMILY
INCOME
0.006 -1.130 -0.990
VOTER ID 0.011
VOTED IN 2014 -0.034

33
As we move from D6 to D3-people have lower probability to display least expectation
relating to GD, LO, HF, QE, ES, DM, PR, RD and CI implying people in D3 show higher
expectation about these factors than those in D6
As we move from D6 to D4- people have lower probability to show least expectation
about GD, LO, CR, QE, DM and PR implying people show higher expectation regarding these
factors in D4 than in D6. Similarly, people have higher probability to display least expectation
about CG.
As we move from D6 to D5- people have lower probability to show least expectation
about SP, QE, DM, PR, RD and CI implying that people in D5 display higher expectation
pertaining to these factors than those in D6.
AGE:
People of higher age have higher probability of giving higher rank to CR and CG, implying
higher expectations for decreased crime rate for older individuals.
OCCUPATION:
As we move from government to non- government sector, people have lower
probability to show least expectation for SP, implying non- government sector employees have
higher expectation for stability in prices. The converse holds true for ES.
EDUCATION LEVEL:
With rise in education people, people have higher probability to show least expectation
to QE.
ANNUAL FAMILY INCOME:
As annual family income rises, people have higher probability to display least
expectation about HF. Thus, richer people display lesser expectation about HF. The converse is
true for DM and RD.
VOTER ID :
People having a voter id card (number 1) have higher probability of having least
expectation to HF than those who do not have a voter ID ( number 0).

34
VOTED IN 2014:
People who have voted in 2014 (number 1) have lower probability to show least
expectation about QE than the ones who have not voted in 2014 (number 0).
Summary tables for regression and marginal analysis:
VARIABLE
S
GROWTH
AND DEVELPOM
ENT
(GD)
LARGER JOB
OPPORTUNITIES
(LO)
STABIL IT
Y IN PRICES
(SP)
DECRASE
IN CRIME RATE
(CR)
BETTER
HEATLTH FACIL ITIE
S AT
LOW COST
(HF)
QUAL ITY
EDUCATION AT
ALL
LEVELS
(QE)
MORE
SCHEM ES FOR THE ELDERLY
(ES)
FALL IN
UNDESIRABLE
DELAYS IN
DECISION MAKING
(DM)
BETTER
RELATION WITH
INDIA'S
NEIGHBOURS
(PR)
LESS
CORRUPTION IN
GOVERNM
ENT (CG)
STRONG
ER RUPEE
AGAINST
DOLLAR
(RD)
RAPID
CONSTRCUTION OF
INFRASTRUC T
URE
(CI)
D1 + + + + + + - + - - + +
D2 + - + + + + - + + + + +
D3 + + + + + + + + + - + + D4 + + - + + + + + + + + +
D5 + + + - + + + + + + + +
D6 (omitted) (omitted) (omitted)
(omitted)
(omitted)
(omitted)
(omitted)
(omitted)
(omitted)
(omitted)
(omitted)
(omitted)
GENDER
- - - + - - - + (omitted)
- + (omitted)
AGE - + - - - - + - - - - -
STATUS (omitted) - - (omitted)
- (omitted)
(omitted)
(omitted)
+ (omitted)
(omitted)
(Omitted)
EDUCA-
TION + - + - (omitte
d) + (omitte
d)
(omitted
) + + + +
OCCUP-ATION
+ + + + (omitted)
(omitted)
+ - (omitted)
+ + +
JOB CHAR
- (omitted) + + + + + + + - + +
N.O. FAMILY
(omitted) (omitted) (omitted)
(omitted)
(omitted)
+ - (omitted)
- (omitted)
(omitted)
(omitted)
N.O.VOTI-NG
- + - + + (omitted)
(omitted)
+ (omitted)
(omitted)
+ +
AN. FAM.
INC
+ - - + - - - + (omitted)
(omitted)
+ -
VOTER ID
- - - - - - - - + - - +
VOTED
IN '14 + + + (omitte
d)
(omitte
d) + + + + + + +
SUMMARY TABLE 1- CAUSAL RELATIONSHIP BETWEEN EXPECTATIONS AND INDEPENDENT VARIABLES

35
SUMMARY TABLE 2: CAUSAL RELATIONSHIP BETWEEN PROBABILITY OF HAVING LOWEST EXPECTATION (RANK 1)FROM
THE NEW GOVERNMENT ABOUT THE VARIOUS FACTOR FOR A UNIT CHANGE OF THE INDEPENDENT VARIABLES ABOUT
THEIR MEAN.
The above table shows the causal relationship between the higher or lower probability
of an individual of having lowest expectation (rank 1) regarding various factors from the new
government with a unit change in the independent variables about their mean. A '+' (plus) sign
implies that there is a higher probability of an individual to have least expectation(rank 1) from
the government about a said factor with a one unit increase in the independent variable. The
converse holds true for ' - ' (minus) sign.
VARIABLES GROWTH AND DEVELOPMENT (GD)
LARGER JOB OPPRTUNITIES (LO)
STABILITY IN PRICES (SP)
DECREASE IN CRIME RATE (CR)
BETTER HEALTH FACILITIES AT LOWER COST (HF)
QUALITY EDUCTAION AT ALL LEVELS (QE)
MORE SCHEMES FOR THE ELDERLY (ES)
FALL IM UNDESIRABLE DELAYS
IN DECISIO
N MAKING
(DM)
BETTER RELATIONS WITH INDIA'S NEIGHBOURS (PR)
LESS CORRUPTION IN GOVENRMENT (CG)
STRONGER RUPEE AGAINST DOLLAR (RD)
RAPID CONSTRUCT
ION OF INFRASTRUCTURE (CI)
D1 - - - + + - - D2 - - - - - D3 - - - - - - - - - D4 - - - - - - - D5 + - - - - - AGE + + OCCUPATION - + EDUCATION LEVEL
+ - JOB
CHARACTER - - -
ANNUAL
FAMILY INCOME
+ - -
VOTER ID + VOTED IN 2014 -
36
conclusion

37
This project deals with the varying expectations of individuals from the new
government. It aims to illustrate how these expectations vary not only due to demographic
factors like age and gender but are also influenced by other factors such as income and
possession of voter ID cards. It is most significantly noticed that even the geographical region
in which an individual resides plays an important influence in their expectations from the new
government and the relative weightage of importance given to these expectations.
Important inferences that we drew from this study is the following groups of individuals
have high expectations from the new government in various fields like GD, LO and PR-
men as compared to women,
younger individuals as compared to older ones,
those who did not vote in 2014 as compared to those who did.
It was also inferred that individuals living in all other surveyed regions except Southern
Avenue, showed a lower probability of having least expectation from the new government in
various field including QE, GD and LO. This may imply that individuals living in regions other
than Southern Avenue have higher expectations from the new government. It must however
be noted that these marginal results were not found to be significant, hence they hold true for
the sample but may not hold true for the population.
Significant results of the project include-
younger individuals have higher expectations from the new government than older
people (negative causality for all except LO and ES). This could be explained by the
overwhelming support that could be seen among the young generation for a change in
the Central government before the elections, in hope of improvement in governance.
female respondents have shown higher expectations from the new government than
male respondents (negative causality for all except LO and ES). Higher expectations
among women regarding factors like stability in prices and decrease in crime rate may
be as a result of hope of change in the problems faced by them directly in daily life.
people with higher levels of education seem to show higher expectations from the new
government than those with lower educational qualification (positive causality except
LO and CR). This may be because more educated individuals might have greater
awareness and better comprehension of the political and socio-economic situation of
the country as well as the manifesto promises by the various parties.
38
It must be noted that these justifications for the conclusions are merely
possibilities. The actual reasons cannot be unambiguously determined without a follow-
up post survey.
The analysis of this project suggests that slightly differentiated approaches should be
undertaken by political parties wishing to contest elections on the basis of factors including-
target geographical area,
target section of population,
target income group.
Such targeted policy formation or electoral campaigns would benefit the parties
involved as well as take a keener look into the actual requirements of the people instead of
having an umbrella policy or strategy cover for all individuals. This would allow the nation to
prosper and the government to live up to the requirements and expectations of the people
who voted them into power with exceedingly high trust, hope and optimism.

39
Bibliography and references
The following articles and material has been referred to in the analysis and study
of this project report:
http://www.ifes.org/~/media/Files/Publications/Survey/2012/Ukraine_2012_Su
mmary_of_Findings.pdf
Survey by London School of Economics, EACEA 2010/03, 2013, 234p.
http://www.yourarticlelibrary.com/essay/voting-behaviour-various-appro
http://ibnlive.in.com/videos/527482/its-counting-day-on-tuesday-what-are-your-
expectations-from-the-new-delhi-government.html
http://azdailysun.com/news/national/poll-finds-great-expectations-and-
optimism-await-obama/article_8ec6d0d3-e84c-59e8-ab8b-bcc18929126e.html
sites.google.com/site/eeconometrics-models/ordered-probit-and-logit-models
Introduction to Econometrics,3rd Edition- G.S. Maddala
An Analytical Study: India's Exports- Sugata Marjit and Ajitava Raychaudhuri
40
Sample questionnaire
NAME: ____________________________________
GENDER: Male
Female
AGE: __________________________________
STATUS IN FAMILY:
EDUCATIONAL LEVEL (highest level attained):
Less than primary education
Primary education
High school education( Class XII)
Graduate
Post Graduate and higher
ADDRESS: __________________________________
OCCUPATION (Govt./ Pvt.):
Government
Private
Others
If others ,specify ______________

41
IF PRIVATE SECTOR,TYPE OF JOB:
Clerical
Executive or Officer
Teaching
Consultant
Business
Others
If others ,specify ______________
IF GOVERNMENT/PUBLIC SECTOR, TYPE OF JOB:
Clerical
Executive or Officer
Teaching
Consultant
Others
If others ,specify ______________
NUMBER OF MEMBERS IN FAMILY: ______________
NUMBER OF VOTING MEMBERS IN FAMILY:_______
FAMILY INCOME (RANGE):
DO YOU HAVE A VOTER ID CARD (YES/NO):
Yes
No
DID YOU VOTE IN 2014 ELECTIONS? (YES/NO):

42
Yes
No
RANK YOUR EXPECTATIONS FROM THE NEW GOVERNMENT(CENTRAL GOVERNMENT) Circle one response for each of the following items:
Ranks Least Not much Somewhat High Almost certain
Growth and
development
1 2 3 4 5
larger job opportunities
1 2 3 4 5
stability in prices
1 2 3 4 5
Decrease in
Crime Rate
1 2 3 4 5
Better government
health facilities at cheap cost
1 2 3 4 5
Quality education at all
levels
1 2 3 4 5
More schemes for elderly
1 2 3 4 5
Fall in Red tapism
1 2 3 4 5
Rapid construction of infrastructure
(like roads, flyovers, rail network, ports, power plants
etc.)
1 2 3 4 5
Better relations with India’s neighbours
1 2 3 4 5
- A strong rupee against dollar
1 2 3 4 5