
Eye-Tracking Study Using Cellular Automaton Patterns as ...
27
Eye-Tracking Study Using Cellular Automaton Patterns as Visual Stimuli: Implications for Current Models of Stimulus-Driven Selection Processes Anirudh Tiwathia Cognitive Science Department, Vassar College, 124 Raymond Avenue, Poughkeepsie, New York, USA, 12604 Cristián Opazo-Castillo Physics and Astronomy Department, Vassar College, 124 Raymond Avenue, Poughkeepsie, New York, USA, 12604 This study examines goal-free viewing of cellular automaton (CA) im- ages to address the nature of the bottom-up process, the robustness of salience as a framework for explaining fixation points, and the particu- lar features that can characterize salience. The influence of familiarity on oculomotor strategy is also addressed. A qualitative study of the results show promising trends. Higher-level structural features such as pockets of regularity within randomness or localized structures within regularity were salient for most participants. These results raise inter- esting questions about the kinds of visual features that can be used to characterize salience. An unexpected result is that many fixations oc- cur in blank regions within images featuring nested (fractal) structures. Many of these findings escape current psychophysical models of oculo- motor strategy. Hence, future eye-tracking studies with CAs as stimuli could greatly improve our current understandings of the human visual system. 1. Introduction 1.1 Perception: Limiting and selecting information The human experience of the external world is enabled by the various methods of perception and analysis at our disposal. Thus to understand This paper is a result of research conducted at the New Kind of Science Summer School 2004 and was presented at the New Kind of Science Conference 2006. Present address: Apt 412, The Manor, 333 E 43rd Street, New York, NY, 10017 Electronic mail address: [email protected]. Complex Systems, 17 (2007) 183–209; 2007 Complex Systems Publications, Inc.
Transcript of Eye-Tracking Study Using Cellular Automaton Patterns as ...

Eye-Tracking Study Using Cellular AutomatonPatterns as Visual Stimuli: Implications forCurrent Models of Stimulus-Driven SelectionProcesses�
Anirudh Tiwathia�
Cognitive Science Department,Vassar College, 124 Raymond Avenue,Poughkeepsie, New York, USA, 12604
Cristián Opazo-Castillo
Physics and Astronomy Department,Vassar College, 124 Raymond Avenue,Poughkeepsie, New York, USA, 12604
This study examines goal-free viewing of cellular automaton (CA) im-ages to address the nature of the bottom-up process, the robustness ofsalience as a framework for explaining fixation points, and the particu-lar features that can characterize salience. The influence of familiarityon oculomotor strategy is also addressed. A qualitative study of theresults show promising trends. Higher-level structural features such aspockets of regularity within randomness or localized structures withinregularity were salient for most participants. These results raise inter-esting questions about the kinds of visual features that can be used tocharacterize salience. An unexpected result is that many fixations oc-cur in blank regions within images featuring nested (fractal) structures.Many of these findings escape current psychophysical models of oculo-motor strategy. Hence, future eye-tracking studies with CAs as stimulicould greatly improve our current understandings of the human visualsystem.
1. Introduction
1.1 Perception: Limiting and selecting information
The human experience of the external world is enabled by the variousmethods of perception and analysis at our disposal. Thus to understand
�This paper is a result of research conducted at the New Kind of Science SummerSchool 2004 and was presented at the New Kind of Science Conference 2006.�Present address: Apt 412, The Manor, 333 E 43rd Street, New York, NY, 10017
Electronic mail address: [email protected].
Complex Systems, 17 (2007) 183–209; � 2007 Complex Systems Publications, Inc.

184 A. Tiwathia and C. Opazo-Castillo
the human experience we must examine perception and determine theways in which it affects the information we receive.
Generally speaking, perception can be thought of as a mechanismthat limits and selects the information received by the agent from itsenvironment. Due to the design of the instruments of perception, onlya section of the global array of information is sampled and then only asegment of the information sampled is further analyzed as necessary.
Nowhere is the phenomenon of limiting and selecting informationmore evident than in the visual system. For example, the human eyeis composed of only three kinds of color-sensitive cells—one each forred, green, and blue. Thus only three regions of the light spectrumare sampled while the rest are ignored [1]. Similarly, the amount ofinformation coming down the optic nerve at any point is estimatedto be on the order of 108 bits per second—this much information isfar too large for the brain to process and assimilate into the consciousexperience [2]. Moreover, human eyes do not have a uniform visualresponse. The best visual acuity is limited to the central 5� of the visualfield (known as foveal vision). For nonfoveal parts of the visual field wemust rely on cruder representations, with acuity sharply falling off fromthe center. This loss in acuity is mainly due to decreasing retinal celldensity and increases in receptive-field center size as one moves awayfrom the retinal center [3].
Thus, contrary to common belief, we do not see a majority of thingsaround us. As the study of inattentional blindness demonstrates, evensalient or distinctive objects in clear sight will not necessarily be “seen”by an observer attending to another object in the scene. Though theobserver will have no trouble noticing the object once it is pointedout [4].
1.2 Perception: Mechanisms of selection
Since only a sliver of the available visual information is processed, theremust be efficient mechanisms in place to select the behaviorally rele-vant information. Two attentional selection mechanisms are thought tocontrol this process: bottom-up and top-down.
Bottom-up attentional selection is characterized by fast, saliency-based, stimulus-driven selection mechanisms. Support for the existenceof bottom-up mechanisms comes from data demonstrating that visualattention can be captured under the right stimulus condition, for ex-ample, highly salient feature singletons, such as a red symbol among agroup of blue symbols, will immediately capture attention [5].
Top-down attentional selection is characterized by slower, goal-directed selection mechanisms that are governed by the observer’s expec-tations or intentions. The simplest evidence for top-down mechanismsis the ability of an observer to volitionally allocate attention to specific
Complex Systems, 17 (2007) 183–209

Eye-Tracking Study Using CA Patterns as Visual Stimuli 185
objects or regions of space. Further evidence of top-down mechanismscomes from the effect of task instructions on both patterns of fixationand spatiotemporal dynamics of eye-movements [5].
The relationship between these two attentional selection mechanismsis poorly understood. A significant portion of the research addressingthis issue examines eye-movement patterns of observers viewing differ-ent scenes under different task conditions.
1.3 Methodology: Eye-tracking and attention
Eye-tracking is considered a valid method for studying visual attentionalmechanisms because it has been shown that eye-movement and atten-tion are generally related. Intuitively, this assumption seems reasonablegiven that both eye-movements and attention are involved in selectingthe most relevant region in the visual field. Moreover, even thoughthe attentional focus and fixation point can be at separate locations,there exists psychophysical evidence suggesting that focal attention atthe site of pending eye-movement is a necessary precursor for the com-pletion of that eye-movement [5]. Also, brain studies with monkeyshave shown that shifts in attention during different tasks are associ-ated with eye-movement preparations [6]. Other electrophysiologicaldata also indicate that the two mechanisms share some of the sameneurophysiology [7].
1.4 Methodology: Data collection with eye-tracking
Early work in eye-movement analysis showed that, when viewing avisual scene, observers do not scan the scene, but instead fixate oncertain locations and move between them.
Currently it is possible to categorized eye-movements into the fol-lowing: (a) saccadic—voluntary rapid eye-movement from one point toanother, (b) miniature—group of involuntary eye-movements that causethe eyes to waver, (c) pursuit—smooth involuntary eye-movement tokeep a moving object foveated, (d) compensatory—similar to pursuit butthe head moves while fixation is maintained, (e) vergence—relating tothe focusing on a near or far object, (f) optokinetic—involuntary zigzagmovement performed when observing repeated moving patterns [8].
Most studies concerning eye-movements concentrate on saccadicmovement and fixations. The main purpose of a saccade is to foveatea new region of interest so as to get higher-resolution input. After asaccade moves the gaze of the eye to a new region, the eye must dwellon this new region for at least 100 ms so as to minimize image blur andallow the visual system to process the new information. This point isknown as a fixation. For each fixation, an area around the point of fix-ation, the size of which depends on stimulus density, can be successfullyprocessed [9].
Complex Systems, 17 (2007) 183–209

186 A. Tiwathia and C. Opazo-Castillo
1.5 Models of oculomotor strategies
The factors that govern where fixations will occur in a given image arestill controversial. Some studies claim that fixation location is random,while others claim that stimulus factors are critical, and yet others placeemphasis on cognitive factors. Studies showing consistency in fixationlocations for different observers demonstrate that fixation locations arenot random, and that the human visual system is designed in sucha way that competent observers naturally utilize similar oculomotorstrategies [7].
As with most aspects of cognitive science, constructing a model ofoculomotor strategies has proven quite difficult. Most models of oculo-motor strategies have emerged from laboratory-based studies of visualsearch. These various models differ in their emphasis on bottom-up(stimulus based) and top-down (task based) factors.
In the 1980s, Triesman and Gelade introduced the feature integrationtheory (FIT) as a bottom-up model for visual search. The FIT consistedof two stages: a parallel and a serial search. In the parallel search, thetarget object was different enough from the distractors that all objectscould be processed in parallel to identify the target. In such a situation,the time taken to perform the search would be largely independent ofthe number of objects in the search space (set size), as cited in [8]. Forexample, a red 7 among a collection of blue 7s could be found witha parallel search. On the other hand, the serial search occurs whenthe target object is not fundamentally different from the distractors, forexample, a randomly oriented L among a group of randomly orientedTs. In this case, each item has to be considered and a decision must bemade whether it is a target or not—for a serial search the search time isdirectly correlated to the set size, as cited in [8].
In the FIT model, the presented scene is processed in parallel for eachindividual basic feature (color, orientation, etc.) and then the scene isencoded in feature maps. Feature maps encode the activity in responseto certain features whereas a “master map” encodes information aboutlocation, spatial distribution within a feature map, and the relationshipsbetween different feature maps. A parallel search is performed whenonly a single basic feature is necessary for detection; whereas a serialsearch is performed when relationship between features is necessary, ascited in [8].
A similar bottom-up oculomotor model, the visual salience model,suggests that people direct their gaze at the most visually salient locationin the retinal image. There is significant evidence to suggest that preat-tentive, parallel levels of processing do not represent all parts of a visualscene equally, but instead that a weighted representation is derived withcertain parts eliciting stronger responses than others [2]. Whether agiven part of the scene elicits a strong response is thought to be depen-
Complex Systems, 17 (2007) 183–209

Eye-Tracking Study Using CA Patterns as Visual Stimuli 187
dent on the “context” in which it is presented, that is, it is dependent onwhat other stimuli are present in the other parts of the visual field [2].
The visual salience model claims that to accomplish preattentive se-lection, an explicit two-dimensional map (known as the saliency map)encodes the saliency of objects in the visual environment. The saliencymap is similar to the master map in FIT, which is derived from the in-tegration of various feature maps. Competition among neurons withinthe saliency map gives rise to a single winning location that is consideredthe most salient location and chosen as the next target for saccade andfixation. If this location is inhibited due to prior fixation then the nextmost salient location is chosen and so on [2].
Many computational models have in some form or another acceptedthe idea of a saliency map to compute the next gaze location. Electro-physiological evidence also points to the existence of several neuronalmaps that appear to encode for saliency of a visual stimuli [2]. How-ever, some researchers oppose the idea of a topographic map in thebrain whose specific purpose is to represent salient stimuli. Desimoneand Duncan have suggested that selective attention results from the in-teraction between feature maps, each of which implicitly encodes thesaliency of a stimulus with respect to one given feature, as cited in [2].Although it remains debated whether or not saliency is expressed explic-itly in one or more visual field maps, most bottom-up models of visualsearch rely on some manifestation of a saliency-based decision makingprocess.
Unlike the FIT and the visual salience model, the guided search ocu-lomotor strategy includes a top-down approach. Here, the fundamentalidea is that information about the nature of the target can bestow greaterimportance to specific features and as a result bias the direction of gaze.Within the guided search model, there is an initial stage of parallel pro-cessing in which the visual field is evaluated with regard to similarity tothe expected target. The items that are considered similar enough to thetarget are then passed onto a serial phase where they are individuallyinspected in greater detail. Thus, gaze is directed to the item with thegreatest similarity to the expected target, after which gaze is successivelyshifted to items of decreasing similarity [7]. Experiments have shownthat observers can use features such as target color and shape to guideattention or gaze in visual search. Thus the search is only performedin a preselected subgroup [10]. Moreover, eye-movement data from areal-world task, such as tea making and sandwich preparation, providestrong evidence that, in such cases, the eyes are driven primarily by top-down information and rather little by the intrinsic salience of objects[11]. That being said, no experiments thus far have been shown torule out saliency maps as the mechanisms for selecting and prioritizinglocations for further processing.
Complex Systems, 17 (2007) 183–209

188 A. Tiwathia and C. Opazo-Castillo
1.6 Competing influences: Top-down and bottom-up
Parkhurst et al. performed a study examining the extent to whichbottom-up factors play a role in allocating attention by comparing ac-tual fixation locations to computed stimulus salience as determined bya biologically motivated, saliency-based, bottom-up model. They at-tained results that indicate the presence of stimulus-driven mechanismseven under natural viewing conditions where top-down mechanismswould be active [5].
Interestingly, Parkhurst et al. also found a greater correlation betweencalculated stimulus salience and measured fixation locations for fractalimages than for other kinds of images [5]. They put forth two possibleexplanations for why fractal images might give rise to a greater corre-lation between calculated salience values and measured fixation points.
Their first explanation suggests that the increased correlation forfractal images could be caused by differences in stimulus characteris-tics. They found that there was often a greater separation betweenthe salience of peaks and the average background level, that is, therewere fewer areas of high salience and the difference in salient points andbackground levels was higher than for other images [5]. Thus, the sharpcontrasts in fractal images with regard to certain features may increasethe influence for stimulus-driven mechanisms.
The second explanation motivates top-down influences by suggestingthat the eye movements could have been influenced by previously de-veloped attentional biases. For example, they found that, given imagesof home interiors, participants often scanned tabletops independent oftheir salience in the presented image. This behavior seems quite rea-sonable since scanning tabletops is most often the best place to findobjects of interest. Moreover, they argue that the influence of suchtop-down attentional biases should give rise to greater inter-participantvariability for fixation location than the influence of stimulus-drivenattentional allocation. Their data show exactly this result. The inter-participant variability for fixation locations was lower for fractals thanall other image types. This result agreeing with their earlier assertionthat bottom-up mechanisms play a greater role in fractal images [5].
1.7 Role of familiarity
In the Parkhurst et al. study, the difference in degree of top-down at-tentional bias between different image types could have resulted fromdifferences in levels of exposure. Besides fractal images, the other imagecategories in the study were: home interiors, buildings and city scenes,and natural landscapes. The exposure of most participants to scenesthat fall in those three categories is probably greater than their exposureto fractal images. However, the effect of familiarity with visual stimulion oculomotor strategy has not been fully disambiguated.
Complex Systems, 17 (2007) 183–209

Eye-Tracking Study Using CA Patterns as Visual Stimuli 189
Some studies do suggest that visual salience may be affected by rep-etition of stimuli [12] or by familiarity with stimuli [13]. In fact, somestudies have found results suggesting that if a global representation (e.g.,a line-figure of a face) is available then lower level representations of theconstituent parts (e.g., curvatures of lines) can possibly be suppressedeven if it would be quicker to process the stimulus-set using the low-levelfeatures [13]. These results are consistent with the assertion that limitedexposure to fractal images could allow for greater reliance on low-level,stimulus-driven oculomotor strategies. In fact, it seems commonsensicalthat extended exposure to a stimulus would facilitate the developmentof top-down, attentional biases towards that stimulus.
1.8 Present study: Examining bottom-up processes
The present experiment aims at examining the nature of bottom-upmechanisms in the human visual system using the eye-tracking paradigm.To achieve this goal, a two-pronged approach was taken to minimizethe influence of top-down mechanisms, and thereby allow for a betterexamination of the bottom-up mechanisms at work.
First, the task-instructions explicitly specified that all participantswere to engage in “spontaneous looking,” without any specific task,target, or goal in mind. This reduced observer expectations that couldhave been used by top-down mechanisms to determine a subset of fixa-tion locations within the presented stimuli.
Second, the stimuli chosen in this study were two-dimensional black-and-white abstract images generated by taking snapshots of the timeevolution of cellular automaton (CA) systems. This choice of stimuliheld numerous advantages in the context of reducing top-down influ-ences.
Images generated by CAs have limited exposure among the generalpopulace and thus it is unlikely for participants to have previouslydeveloped attentional biases. Also, although they possess structuralfeatures found in nature such as repetition, nesting, and randomness,CA-generated images are quite abstract in comparison to natural orrepresentational scenes. It agrees with intuition that abstract images,devoid of familiar features, would reduce the influence of top-down se-lection. The data about fractal images presented by Parkhurst et al., asdiscussed earlier, supports such an assertion. It thus seems reasonableto believe that the use of CA images would encourage greater influenceof bottom-up mechanisms on fixation patterns.
Moreover, the use of such images also allowed us to examine whether,given the minimization of other top-down influences, higher-level struc-tural features (e.g., nesting, randomness, or repetition) would directlyinfluence patterns of fixation.
Complex Systems, 17 (2007) 183–209

190 A. Tiwathia and C. Opazo-Castillo
Visual studies concerning CA images are also of interest to the newlydeveloping field of pure New Kind Of Science (NKS). Stephen Wolfram,in his descriptions of the methodologies of NKS, places significant im-portance in the ability of the human visual system to analyze, withinreasonable limitations, the outputs of different CAs [1]. It would beuseful to determine whether inexperienced eyes instinctively fixate onfeatures most commonly studied in CA images and also to examine,how—if so—previous exposure to CA-generated images changes fixa-tion patterns.
In summary, the goals of this study are: (a) to encourage and sub-sequently examine bottom-up mechanisms involved in guiding gaze-direction and selection of fixation points; (b) to examine the ways inwhich participants observe different CA images to notice if instinctivefixation points coincide with those features often studied in the fieldof NKS; (c) to determine if structural features such as nesting, repeti-tion, and randomness specifically influence oculomotor strategy; (d) toexamine the effect of past experience with CA images and CA theoryon fixation locations so as to comment on the relationship betweenfamiliarity and oculomotor strategy.
2. Methods
2.1 Participants
A total of 18 participants were tested: nine participants were naïveto the theory of CAs, NKS, and had little or no exposure to imagesgenerated by CAs; whereas the other nine participants were studentsof the NKS Summer School and had significant exposure to complexsystems theory, CA formalism, and NKS.
All participants had normal or corrected to normal vision, with nohandicaps such as dyslexia or color-blindness. All participants had littleor no prior exposure to an eye-tracking device or to theories resultingfrom research conducted using an eye-tracking device.
2.2 Stimulus
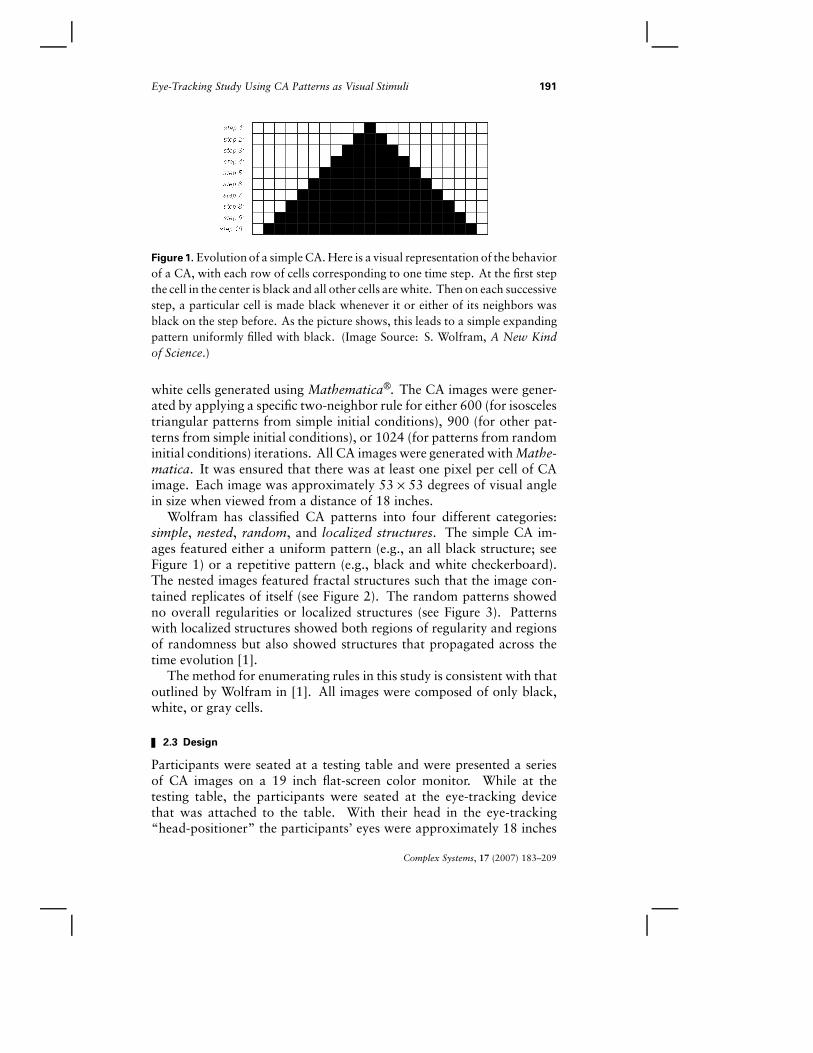
All the stimuli presented to the participants were images generated byone-dimensional (1-D) CAs. The CA images were generated by selectingan initial condition (a 1-D array of ones and zeroes depicted as black andwhite cells) and then applying a simple rule to the initial condition fora specific number of iterations. Thus each two-dimensional (2-D) CAimage actually represented the evolution of a 1-D CA over time—anyhorizontal line of the CA image at any given step represents the state ofthe 1-D CA at that point in time (see Figure 1).
The initial conditions chosen were either a row of white cells witha single black cell at the center, or a random distribution of black and
Complex Systems, 17 (2007) 183–209
Eye-Tracking Study Using CA Patterns as Visual Stimuli 191
Figure 1. Evolution of a simple CA. Here is a visual representation of the behaviorof a CA, with each row of cells corresponding to one time step. At the first stepthe cell in the center is black and all other cells are white. Then on each successivestep, a particular cell is made black whenever it or either of its neighbors wasblack on the step before. As the picture shows, this leads to a simple expandingpattern uniformly filled with black. (Image Source: S. Wolfram, A New Kindof Science.)
white cells generated using Mathematica�R. The CA images were gener-ated by applying a specific two-neighbor rule for either 600 (for isoscelestriangular patterns from simple initial conditions), 900 (for other pat-terns from simple initial conditions), or 1024 (for patterns from randominitial conditions) iterations. All CA images were generated with Mathe-matica. It was ensured that there was at least one pixel per cell of CAimage. Each image was approximately 53 � 53 degrees of visual anglein size when viewed from a distance of 18 inches.
Wolfram has classified CA patterns into four different categories:simple, nested, random, and localized structures. The simple CA im-ages featured either a uniform pattern (e.g., an all black structure; seeFigure 1) or a repetitive pattern (e.g., black and white checkerboard).The nested images featured fractal structures such that the image con-tained replicates of itself (see Figure 2). The random patterns showedno overall regularities or localized structures (see Figure 3). Patternswith localized structures showed both regions of regularity and regionsof randomness but also showed structures that propagated across thetime evolution [1].
The method for enumerating rules in this study is consistent with thatoutlined by Wolfram in [1]. All images were composed of only black,white, or gray cells.
2.3 Design
Participants were seated at a testing table and were presented a seriesof CA images on a 19 inch flat-screen color monitor. While at thetesting table, the participants were seated at the eye-tracking devicethat was attached to the table. With their head in the eye-tracking“head-positioner” the participants’ eyes were approximately 18 inches
Complex Systems, 17 (2007) 183–209

192 A. Tiwathia and C. Opazo-Castillo
Figure 2. A CA that generates a nested pattern. Each triangular section isessentially just a smaller copy of the whole pattern, with still smaller copiesnested inside it. Patterns with nested structure of this kind are often called“fractal” or “self-similar.” (Image Source: S. Wolfram, A New Kind of Science.)
Figure 3. A CA that generates a random pattern. This particular CA is knownas Rule 30. The transformation rule is shown at the bottom. (Image Source:S. Wolfram, A New Kind of Science.)
Complex Systems, 17 (2007) 183–209

Eye-Tracking Study Using CA Patterns as Visual Stimuli 193
away from the computer screen. When looking straight ahead, theparticipant’s gaze was horizontally centered and at approximately two-thirds of the screen height from the bottom of the screen.
All images presented were centered on the screen; when centered, allimages were large enough to leave at most an inch boundary from theedge of the screen. The stimuli presented were as follows (in order):four 2-D arrays of CA image thumbnails, 20 individual CA images withsimple initial conditions, and nine individual CA images with randominitial conditions. The four 2-D arrays were presented for 10 secondseach, both the individual CAs from simple and random initial conditionswere presented for 8.5 seconds each.
Each 2-D array had 20 thumbnails of CA images (five rows, fourcolumns). Out of the 20 individual CA images from simple initialconditions: five were simple, five were nested, six were random, andfour were considered to have localized structures. Out of the nineindividual CA images from random initial conditions: one was simple,one was nested, three were random, and four were considered to havelocalized structures.
Within each image set (array of images, simple initial conditions,random initial conditions) the distribution of images from the four CAcategories was performed randomly. The sequence of images was keptconstant for all participants (for concerns regarding order effects, seesection 5.1).
Calibration of the eye-tracker was performed before the start of theexperiment, and then a second time after the 20 CA images from simpleinitial conditions had been presented.
The eye-movement data were collected on a monocular “ViewPointEye-Tracker” designed by Arrington Research, Inc. The IR cameraalways focused on the right eye of the participant. All stimuli weredisplayed using the ViewPoint PC-60 (version 2.8.1) software. Thedata were collected using default settings with low resolution. The eye-tracker sampled eye position every 20 milliseconds.
2.4 Participant instructions
The participants were informed that they would be presented patternsgenerated by CAs and they were also informed of the order of the cate-gory of images (arrays of CA images first, CA images from simple initialconditions next, and finally CA images generated from random initialconditions). They were told that some of the patterns were relativelysimple while others were more complicated. Participants were instructedto observe each image as they saw fit. In order to remove expectationof later questions, they were explicitly told that they would be neitherasked to report nor explain any of their observations. It was empha-sized that the observations did not entail any kind of further analysis on
Complex Systems, 17 (2007) 183–209

194 A. Tiwathia and C. Opazo-Castillo
the part of the participant. This was done to remove any expectationsof a specific task or goal so as to bring the participant into a state of“spontaneous looking” and thereby reduce top-down influences.
The participants were also warned about the importance of minimiz-ing head-movements so as to prevent errors in data collection.
2.5 Procedure
Each participant was asked to view all three sets of images. After receiv-ing instructions, the participants were seated at the eye-tracker. Aftercalibration, they were presented the sequence of images and their eye-movement data was recorded for future analysis. There was no commu-nication with the participant for the duration of the image presentations.While the experiment was in progress, the researcher monitored the out-put from the eye-tracker on a secondary screen so as to enable greateraccuracy in data collection. The participants were offered the option totake a break before the second calibration, which was declined by allof them.
2.6 Data analysis
Due to the low number of participants and the particular constraints ofour experiment, the data was not subjected to standard statistical anal-ysis; instead, the paths of eye-movements were analyzed qualitatively.This was considered an adequate method of analysis since this studyaimed to discover interesting phenomena and motivate additional studyof these phenomena. We assert that any truly meaningful results shouldbe noticeable by careful qualitative visual analysis of oculomotor data.
3. Results
The trends mentioned here are meant to motivate future studies wherestatistical analysis of eye-movement data would be of greater use.
3.1 Simple or repetitive cellular automaton images
For simple or repetitive CA images, no distinct common points of fix-ation were observed. There was significant inter-participant variabilitywith regard to oculomotor strategy and the patterns of fixation seemedquite arbitrary.
3.2 Images with pockets of regularity
CA patterns that appear to be mostly random displayed no distinct com-mon points of fixation within the regions of randomness. However, inthe cases where random patterns had pockets of regularity, a majority ofparticipants did fixate on the regions that displayed regularity. Regions
Complex Systems, 17 (2007) 183–209

Eye-Tracking Study Using CA Patterns as Visual Stimuli 195
Figure 4. Eye-movement data when viewing Rule 101 from simple initial con-ditions. Though this rule shows random behavior in most regions, it alsopossesses regions of regularity (right-hand boundary of triangle). This regionenjoyed fixation from the majority of participants—thereby raising questionsabout the kind of higher-level features (e.g., regularity) that can be used by thevisual system to determine salience.
of regularity were defined as regions that showed an obvious underlyingorder. This behavior was noticed in eye-tracking data collected fromCA images generated by rules such as 30, 101, and 73 (see Figure 4).
3.3 Images with localized structures
For CA patterns classified as possessing localized structures, most partic-ipants demonstrated fixation patterns that loosely followed these local-ized structures. However, the selection of particular localized structuresto examine, the order of selection, and the specific manner in which thelocalized structures were examined all showed great inter-participantvariability and thus did not suggest any obvious common oculomotorstrategy.
3.4 Images with nested structure
The data collected from nested CA images also provides some interestingresults. To elucidate these results it is useful to separate the nested imagesinto two subgroups.
Complex Systems, 17 (2007) 183–209

196 A. Tiwathia and C. Opazo-Castillo
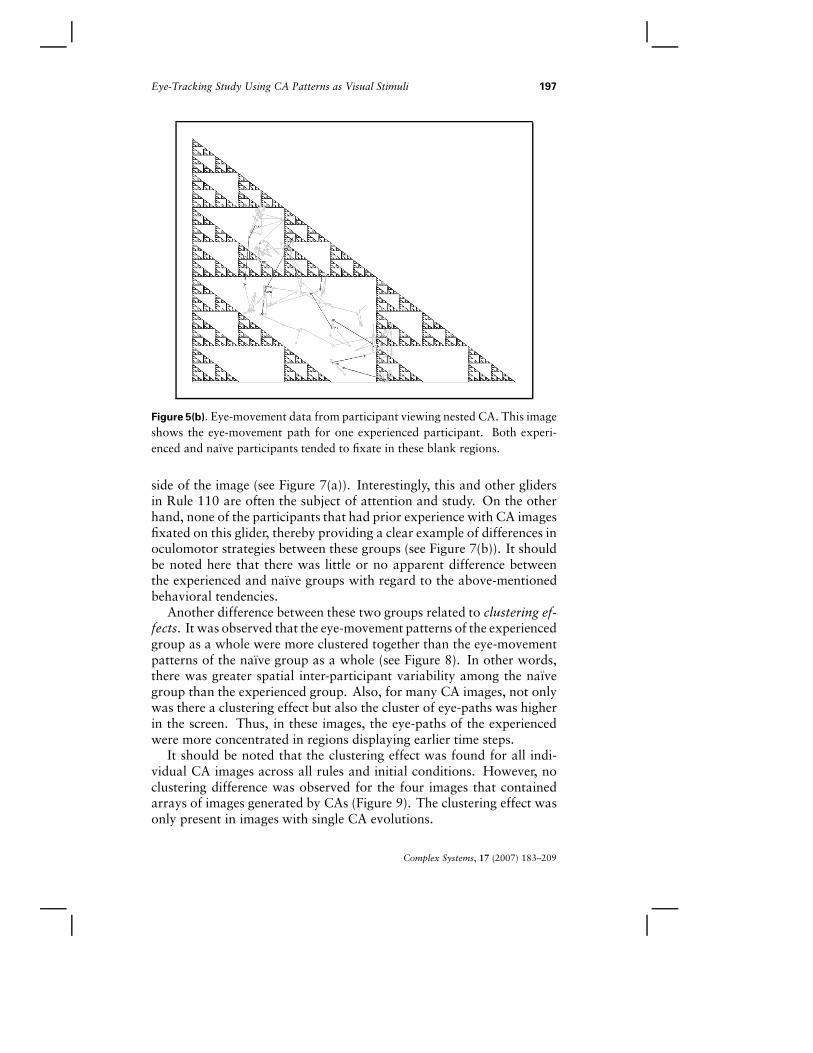
Figure 5(a). Data for all nine naïve participants when viewing Rule 60. Eye-tracking data from rules such as 60 showed that the majority of participantstended to fixate on the blank regions within the triangles.
In the first subgroup, rules such as 60, 90, and totalistic Rule 948,were categorized together strictly on the basis of nested structure. Withinthis first subgroup, eye-movement data showed that for most partici-pants a considerable number of fixations were in the large blank spaces(see Figures 5(a) and 5(b)).
The nested CA images rules such as 105 and 150 were categorized asa separate subgroup because they both share the following properties:nested structure, symmetry, and an explicit vertical axis of symmetry.Though both Rules 90 and 948 show symmetry, they do not have anexplicit axis of symmetry. In this second subgroup (Rules 105 and 150),eye-movement data fell into two broad categories: in one case partic-ipants tended to pick one side (left or right of the symmetry axis) andconstrain their visual search to this region exclusively (see Figure 6(a)).Some participants made short excursions to the other side but returnedquickly to the original side. In the other case, participants tended toshow quick, localized eye-movements that were concentrated on theregion around the symmetry axis and its immediate neighborhood (seeFigure 6(b)).
3.5 Effect of familiarity
For the CA image generated by Rule 110 (categorized with images pos-sessing localized structures) the majority of participants without priorexperience with CA images fixated on the “glider” at the right-hand
Complex Systems, 17 (2007) 183–209
Eye-Tracking Study Using CA Patterns as Visual Stimuli 197
Figure 5(b). Eye-movement data from participant viewing nested CA. This imageshows the eye-movement path for one experienced participant. Both experi-enced and naïve participants tended to fixate in these blank regions.
side of the image (see Figure 7(a)). Interestingly, this and other glidersin Rule 110 are often the subject of attention and study. On the otherhand, none of the participants that had prior experience with CA imagesfixated on this glider, thereby providing a clear example of differences inoculomotor strategies between these groups (see Figure 7(b)). It shouldbe noted here that there was little or no apparent difference betweenthe experienced and naïve groups with regard to the above-mentionedbehavioral tendencies.
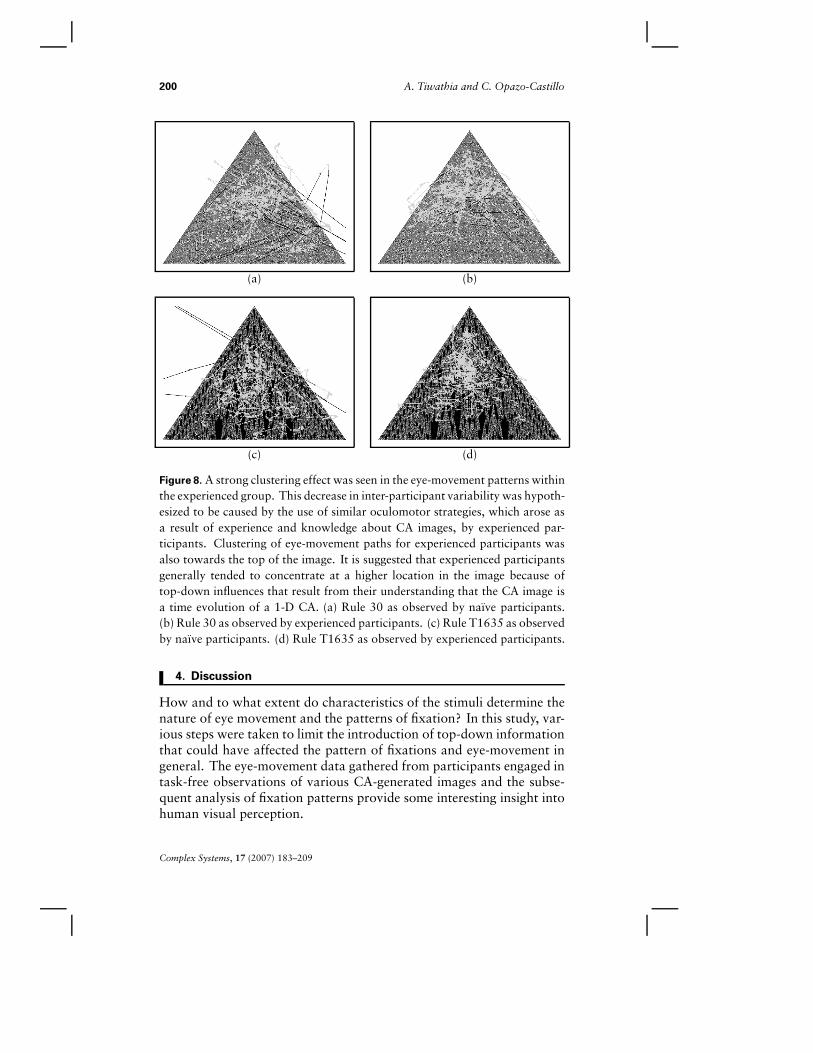
Another difference between these two groups related to clustering ef-fects. It was observed that the eye-movement patterns of the experiencedgroup as a whole were more clustered together than the eye-movementpatterns of the naïve group as a whole (see Figure 8). In other words,there was greater spatial inter-participant variability among the naïvegroup than the experienced group. Also, for many CA images, not onlywas there a clustering effect but also the cluster of eye-paths was higherin the screen. Thus, in these images, the eye-paths of the experiencedwere more concentrated in regions displaying earlier time steps.
It should be noted that the clustering effect was found for all indi-vidual CA images across all rules and initial conditions. However, noclustering difference was observed for the four images that containedarrays of images generated by CAs (Figure 9). The clustering effect wasonly present in images with single CA evolutions.
Complex Systems, 17 (2007) 183–209

198 A. Tiwathia and C. Opazo-Castillo
Figure 6(a). Participant showing side-picking behavior. This rule generates apattern which is nested, symmetric, and has an explicit line of reflection. Theeye-movement data from this rule, as well as from Rule 150, showed two kindsof behavior: affinity for the center column region and side-picking.
Figure 6(b). Participant showing affinity for the center column when viewingRule 105.
Complex Systems, 17 (2007) 183–209

Eye-Tracking Study Using CA Patterns as Visual Stimuli 199
Figure 7(a). Data from all naïve participants viewing Rule 110. The fact that,unlike the majority of naïve participants, experienced participants did not fixateon the glider in Rule 110 suggests that experience has an effect on salience andoculomotor strategies.
Figure 7(b). Data from all experienced observers viewing Rule 110. It is inter-esting to note that none of the experienced observers fixated on the glider onthe right-hand side.
Complex Systems, 17 (2007) 183–209
200 A. Tiwathia and C. Opazo-Castillo
(a) (b)
(c) (d)
Figure 8. A strong clustering effect was seen in the eye-movement patterns withinthe experienced group. This decrease in inter-participant variability was hypoth-esized to be caused by the use of similar oculomotor strategies, which arose asa result of experience and knowledge about CA images, by experienced par-ticipants. Clustering of eye-movement paths for experienced participants wasalso towards the top of the image. It is suggested that experienced participantsgenerally tended to concentrate at a higher location in the image because oftop-down influences that result from their understanding that the CA image isa time evolution of a 1-D CA. (a) Rule 30 as observed by naïve participants.(b) Rule 30 as observed by experienced participants. (c) Rule T1635 as observedby naïve participants. (d) Rule T1635 as observed by experienced participants.
4. Discussion
How and to what extent do characteristics of the stimuli determine thenature of eye movement and the patterns of fixation? In this study, var-ious steps were taken to limit the introduction of top-down informationthat could have affected the pattern of fixations and eye-movement ingeneral. The eye-movement data gathered from participants engaged intask-free observations of various CA-generated images and the subse-quent analysis of fixation patterns provide some interesting insight intohuman visual perception.
Complex Systems, 17 (2007) 183–209

Eye-Tracking Study Using CA Patterns as Visual Stimuli 201
4.1 Simple patterns
No common oculomotor strategies were discovered for simple or purelyrandom CA images. This result agrees with predictions from the visualsalience model [2, 5]. In such images, especially in the absence of aparticular goal, there is no means for a saliency map to consistentlydetermine a single, unique location that corresponds to the next mostsalient area. In such a case, the exact location of the next point offixation would probably be influenced by external, top-down factorsincluding previous attentional or oculomotor strategies, boredom, orthe diversion of attention to an inner thought. Such top-down influenceswould explain the greater inter-participant variability.
4.2 Pockets of regularity in randomness
For random CA images that have pockets of regularity, the regions ofregularity were common points of fixation for many participants. Theexact reason for this result is unclear, and two hypotheses emerge ascompeting explanations.
In such images, no lower-level features can be used to determineunique fixation locations in order of salience. It is possible that, inresponse to the failure of lower-level stimulus features, salience couldbe determined with other higher-level stimulus features such that smallstructures of regularity are compared with other regions of randomness.In such a case, the pockets of regularity would be highly salient in animage consisting mostly of regions of randomness.
On the other hand, a higher cognitive realization that randomness is adominant theme in such images could result in the top-down patronageof regions of regularity as areas of interest and hence points of fixation.A systematic examination of the exact relationship between higher-levelstimulus features, such as regularity or randomness, and the mechanismfor determining saliency is necessary. As of now, current computationalmodels cannot account for such a result. The subsequent investigationof this phenomenon will be necessary to allow us to update our modelsto account for such behavior.
4.3 Nested structures and economical fixations
The eye-movement data from nested CA images would also benefit fromthe examination of higher-level stimulus features as possible criteria fordetermining saliency. Within the first subgroup (Rules 60, 90, and 948),many points of fixation occurred on the blank regions inside the nestedCA patterns. Fixations on blank areas are not a commonly reportedphenomenon in eye-tracking studies. In fact, some studies explicitlyreported the absence of such fixations [9].
Complex Systems, 17 (2007) 183–209

202 A. Tiwathia and C. Opazo-Castillo
While this study found fixations on blank regions outside the CApattern to be extremely rare, fixations on blank regions within the CApattern were common for the nested CA patterns. This difference infixation frequency for blank regions inside and outside the CA patterndemonstrates that the visual system distinguishes between blank spaceswithin and outside of the outermost fractal structure. That being said,it is quite unclear why there were such a large number of fixations onblank areas inside the CA pattern.
It is reasonable to assume that low-level features are not guidingthe pattern of fixation towards the blank areas. Since this behavior isseen for Rule 60, which is not symmetric, it is also plausible to ignoresymmetry as a potential cause.
Two hypotheses are discussed below as explanations for the unex-pected fixation patterns.
One possible explanation is the presence of large, empty geometricfigures. Processing the geometric figure as a whole might lead the visualsystem to search central fixations. The central point lies within theblank regions for each nested geometric structure.
Since this behavior is seen to some degree in all nested CA imagespresented, another possible explanation is that the nested structure ofthe image is taken into account by the visual system. One could arguethat, due to the nested nature of the image, by fixating inside the blankareas the observer attains a strategic position that allows for a quickevaluation of the information contained in the image as a whole.
This claim is quite reasonable considering earlier work. For any givenfixation point, there is an area surrounding the fixation point withinwhich information can be successfully extracted. This area around thefixation point can be referred to as the conspicuity area [14].
Motter and Belky suggest that all stimuli present in the conspicuityarea are processed in parallel along with the information at the fixationpoint. They claim that focal attention is spread as widely as possible inthe conspicuity area and that the conspicuity area can be thought of asthe maximum region of focal attention for any given stimuli condition.Their study also asserts that such a view of conspicuity area agrees withearlier research [14]. Moreover, their study provides evidence that thesize of the conspicuity area depends strongly on the stimulus densitysurrounding the point of fixation and that in general the conspicuityarea has a radius of approximately twice the average nearest neighbordistance (minimum inter-stimulus distance) [14].
By fixating in the center of the elementary nested structures, par-ticipants might be gaining large conspicuity areas that allow them toquickly process the information present in that section in parallel. Ifthis is actually what is happening then the mechanism guiding the pat-tern of fixation would have to be able to determine which locations aremost economical with regards to conspicuity area. Although there is
Complex Systems, 17 (2007) 183–209

Eye-Tracking Study Using CA Patterns as Visual Stimuli 203
reason to believe that visual engagement is extremely economical, noevidence clearly demonstrates how or what mechanisms guide fixationpatterns to locations that are most economical [11]. There is also noclear evidence that shows conspicuity area to be a central criterion fordetermining what is economical.
Further studies with nested images should be conducted to determinehow much, if any, influence the nested structure has on the patterns offixation. At this point, however, no sound explanation can be put forth.
As a side point, it would be quite interesting to compare the fixationlocations observed in this study for images such as Rule 90 with pre-dicted fixation locations generated by current computational models ofoculomotor strategy. Given the current description of their behavior,a revision of computational models should be necessary to account forfixation on blank locations.
The second subgroup of nested CA images (Rules 105 and 150) alsogave rise to two other patterns of fixation. The first fixation pattern wasan affinity for the region around the axis of symmetry, and the secondwas the concentration of fixation points on one selected side of the axisof symmetry. Both patterns are discussed below within the context ofan economical visual system.
The affinity for the region around the axis of symmetry is attributedto a combination of two stimuli characteristics: symmetry with an ex-plicit mirror (axis of reflection), and nested structures down the centercolumn. It is hypothesized that the observer stays in the center regiondue to economical considerations. By fixating on just that region alone,for such images, the observer can obtain all the information about theimage with the fewest eye-movements.
Similarly, economical considerations could cause the participants topick and stick to just one side of the CA pattern. By fixation on just onehalf of the pattern, the observer can obtain all the information aboutthe pattern with minimal eye-movement.
It is important to note that just symmetry in itself could not beresponsible for this behavior since it is not exhibited in other symmetricpatterns that do not have an explicit line of reflection. The explicit linemust play some role in the recognition of the symmetric characteristicsof the pattern. One could argue that simply the presence of an explicitline that separates the two halves of the image could also be responsiblefor influencing participant’s fixations to stay on one side of the symmetryaxis. However, this would not explain the affinity for the center column.
It seems reasonable that observers stay on one side of the imagebecause of an implicit realization that, due to the evident symmetry ofthe image, all the information about it is available on one side; and thatthe presence of an explicit line of reflection aids that implicit realization.Similarly, by staying at the center column, observers can also gain allthe information about the image with the fewest eye-movements.
Complex Systems, 17 (2007) 183–209

204 A. Tiwathia and C. Opazo-Castillo
Future study should be conducted to determine the degree to whichthe economical constraints of the visual system influence oculomotorstrategy. Also, it must be determined what factors are taken into con-sideration when making economical choices. Moreover, the economicalconstraints on oculomotor strategy should be included in our currentcomputational models of the human visual system.
4.4 Familiarity and fixation patterns
Besides stimulus-based results, the results also showed evidence for dif-ferences in fixation patterns between the naïve group of participantsand those tested from the NKS Summer School 2004. Two main differ-ences were found: frequency of fixation on the glider in Rule 110, andclustering.
The case of the glider in Rule 110 is a striking example of the potentialdifferences between naïve observers and experienced ones. The majorityof the naïve group found the glider to be salient. Interestingly, thatglider in Rule 110 is in a sense the inverse of the pocket of regularity inrandom images, discussed earlier. The glider is conspicuous because itsirregularity contrasts against a regular background. It seems reasonablethat the mechanisms that find randomness salient among regularity arerelated to the mechanisms, discussed earlier, that find regularity salientamong randomness.
Surprisingly, not a single experienced participant fixated on the glider.This result agrees with previous findings that suggest that visual saliencecan be affected by stimulus familiarity [5, 13]. This disinterest couldpossibly arise due to an over-exposure of the NKS Summer School 2004participants to that particular structure. The over-exposure could in-crease the calculated salience for other less characteristic structures.
At this point, it is possible to ask why a similar effect was not seenamong experienced participants with regard to pockets of regularity inimages featuring random patterns. Two explanations are hypothesized.First, the exposure to and emphasis on pockets of regularity is signif-icantly lower than for the glider in Rule 110. Second, asymmetries insearch tasks have been demonstrated. When targets and nontargets areexchanged the nature of visual search performance also changes (e.g., itis easier to search for curved lines among many straight distractors butit is much harder to search for a straight line among many curved dis-tractors) [2]. Similarly, pockets of randomness on a regular backgroundare not necessarily as salient as pockets of regularity on a random back-ground.
It still remains open to question whether pockets of regularity amongrandomness or pockets of randomness among regularity is more salient—however, the complete disregard for the glider by the experienced par-ticipants hints that patches of regularity among randomness might be
Complex Systems, 17 (2007) 183–209

Eye-Tracking Study Using CA Patterns as Visual Stimuli 205
considered more salient and hence less susceptible to top-down inhibi-tion.
The general difference between the oculomotor strategies of naïveand experienced participants was witnessed in the clustering effect foundfor many CA images. This clustering effect could be caused by manypotential factors.
First of all, the NKS Summer School 2004 participants were fromsimilar academic backgrounds as opposed to the large variety foundamong the naïve participants. The similar academic backgrounds couldlead to the development of similar general and oculomotor strategies(there is no reason to believe this to be a strong effect). Moreover,considering the large variety in their nationalities and cultures, the com-mon academic backgrounds among the NKS participants probably hasa limited influence on the development of oculomotor strategies.
Second, the NKS participants generally know the rules and thus prob-ably feel a smaller inclination to explore them. Though this couldpossibly be a factor with influence, it does not explain why there is clus-tering in eye-movement data across participants. In fact, the decreasedinter-participant variability among experienced observers suggests thata common strategy was utilized. It is quite likely that studying NKSand CA images biased the experienced observers to notice similar prop-erties in CA images. Moreover, having prior knowledge about whatkinds of images will be presented probably adds some level of top-downexpectations.
One such top-down attentional bias among experienced observers isthat all of their eye-movement data is not only clustered but also is closerto the top of the screen. Since the experienced participants know thatthe CA images are actually time-evolutions of 1-D CAs, there is a bias tostart at the top and examine the earlier time steps. This attentional biasemerges due to prior knowledge and experience. Such attentional biasesand other common strategies that emerge due to a similar knowledgebase can account for the decrease in inter-participant variability withinthe experienced group. Moreover, the fact that the clustering did nottake place in images containing an array of CA images suggests that theclustering effect was a consequence of previously developed top-downbiases towards CAs (see Figure 9).
5. Conclusion
In conclusion, analysis of eye-tracking data from cellular automaton(CA) images provided many interesting results. For simple and randomimages it was noticed that a lack of an obvious hierarchy of salienceleads to greater levels of inter-participant variability and subsequentlyimplies greater top-down or extraneous influence.
Complex Systems, 17 (2007) 183–209

206 A. Tiwathia and C. Opazo-Castillo
(a)
(b)
Figure 9. The clustering effect was not noticed for any of the four arrays of CAimages. The fact that clustering was specifically limited to individual CA imagessuggests that the source of the clustering is due to top-down factors resultingfrom previously developed attentional biases towards CA images rather than dueto other extraneous confounds such as their common academic backgrounds.
Complex Systems, 17 (2007) 183–209
Eye-Tracking Study Using CA Patterns as Visual Stimuli 207
For random images with pockets of regularity, it was noticed thatthose pockets enjoyed fixation from the majority of participants. Thisfinding raised questions about the exact relationship between higher-level structural features such as randomness or regularity, and questionsabout the kinds of visual features that can be used for discerning salience.The answers to these questions still remain unclear and thereby providean interesting avenue for further work.
The eye-movement data collected for nested images were quite sur-prising, and escaped explanation within current oculomotor models.The hypotheses presented in this paper as explanations of the findingsgreatly relied upon the idea of the economical nature of the visual sys-tem. The extent to which the “economical” nature plays a role indetermining patterns of fixation is quite unclear. Moreover, the kindsof features that such an economical system would take into considera-tion are currently based on speculation. Significant future explorationis required to explain the eye-movement data from nested images.
Finally, differences in oculomotor strategies between the naïve groupand the experienced group not only confirmed previous results regardingthe impact of familiarity on visual salience, but also reaffirmed the easeand subtlety with which top-down factors become relevant and also thesharp influence on oculomotor strategy that they can have. These dataalso suggest the difficulty experienced in creating situations where onecan be entirely sure that the top-down and bottom-up mechanisms werecompletely isolated. Whether this is even possible, still remains open todebate.
In the end, it is clear that most of the above mentioned results do notmatch predictions from known models of human oculomotor strategy.Hence, the main assertion of this study is that further eye-tracking exper-iments using CA images could greatly benefit our current understandingof the human visual perceptual system.
5.1 Limitations of this study
There were a few concerns about the design of this study. First, thetwo groups of participants were not balanced for sex or handedness.However, there is no evidence in the literature suggesting that sex orhandedness affects oculomotor strategy.
Second, there was concern that, without any specific task to perform,the participants might not stay interested. This concern was addressedby selecting images that would provide features to capture visual at-tention. Moreover, even though the experienced participants had seenimages of similar type with similar characteristics, there was an explicitattempt to ensure that a large number of the CA images were novel evento the experienced group.
Complex Systems, 17 (2007) 183–209

208 A. Tiwathia and C. Opazo-Castillo
Third, the fact that all images were presented in the same order to allparticipants raised some concerns about order effects. It is possible thatimages presented later were treated with greater impatience and lackof interest. However, since the different types of CA images (simple,nested, random, and localized structures) were presented in randomorder, any potential order effects should have minimal impact on theobservations presented here.
Finally, though this study was conducted specifically with the inten-tion of discovering trends that would motivate future research stud-ies, the lack of statistical data makes it difficult to make strong asser-tions.
5.2 Areas of future interest
As stated before, an examination of the exact relationship betweenhigher-level stimuli features such as regularity or randomness and themechanism for determining saliency is required.
Such investigations would allow speculations on how stimulus fea-tures such as randomness and regularity are represented, recognized,and chosen to be relevant features. Moreover, given the visual saliencymodel’s assumption of a single saliency map, such studies would shedmore light on which visual criteria can be used to determine saliency ina given situation.
It would also be useful to examine the extent and manner in whichthe nested structure of an image influences the resulting patterns of fix-ation. Further investigations should emphasize providing a defensibleexplanation for the occurrence of fixation points in blank regions. Onepossible way to test the above-proposed explanation based on conspicu-ity area is to determine if the saccades are systematically longer after afixation in a blank region. If so, that would support the argument thatfixation in blank regions allowed for the parallel processing of a largeramount of information.
It seems that any truly plausible explanation for this phenomenonwould also have to give rise to a better understanding of how fixationpatterns emerge. More specifically, it would have to illuminate thedegree to which the economical nature of visual perception affects thepatterns of fixations and the choice of fixation locations.
If there is no evidence for an economical visual system that guidesfixation patterns, then different motivating factors need to be put forthso as to provide a plausible explanation for the results described here.
Acknowledgments
This research opportunity was supported by the Undergraduate Re-search Summer Institute (URSI) at Vassar College and uniquely moti-
Complex Systems, 17 (2007) 183–209

Eye-Tracking Study Using CA Patterns as Visual Stimuli 209
vated by the New Kind of Science Summer School 2004. Special thanksare extended to Stephen Wolfram for his insight and encouragement.
References
[1] S. Wolfram, A New Kind of Science (Wolfram Media, Inc., Champaign,IL, 2002).
[2] L. Itti and C. Koch, “A Saliency-based Search Mechanism for Overt andCovert Shifts of Visual Attention,” Vision Research, 40 (2000) 1489–1506.
[3] W. S. Geisler and K. L. Chou, “Separation of Low-level and High-levelFactors in Complex Tasks: Visual Search,” Psychological Review, 102(2)(1995) 356–378.
[4] M. M. Chun and R. Marois, “The Dark Side of Visual Attention,” CurrentOpinion in Neurobiology, 12 (2002) 184–189.
[5] D. Parkhurst, K. Law, and E. Niebur, “Modelling the Role of Saliencein the Allocation of Overt Visual Attention,” Vision Research, 42 (2002)107–123.
[6] A. A. Kustov and D. L. Robinson, “Shared Neural Control of AttentionalShifts and Eye Movements,” Nature, 384 (1996) 74–77.
[7] K. A. Turano, D. R. Geruschat, and F. H. Baker, “Oculomotor Strate-gies for the Direction of Gaze Tested with a Real-world Activity,” VisionResearch, 43 (2003) 333–346.
[8] G. Z. Yang, L. Dempere-Marco, X. P. Hu, and A. Rowe, “Visual Search:Psychophysical Models and Practical Applications,” Image and VisionComputing, 20 (2002) 291–305.
[9] B. C. Motter and E. J. Belky, “The Guidance of Eye Movements DuringActive Visual Search,” Vision Research, 38 (1998) 1805–1815.
[10] F. H. Hamker, “A Dynamic Model of How Feature Cues Guide SpatialAttention,” Vision Research, 44 (2004) 501–521.
[11] M. F. Land and M. Hayhoe, “In What Ways Do Eye Movements Con-tribute to Everyday Activities?” Vision Research, 41 (2001) 3559–3565.
[12] R. M. McPeek and E. L. Keller, “Short-term Priming, Concurrent Pro-cessing, and Saccade Curvature During a Target Selection Task in theMonkey,” Vision Research, 41 (2001) 785–800.
[13] S. Suzuki and P. Cavanagh, “Facial Organisation Blocks Access to Low-level Features: An Object Inferiority Effect,” Journal of ExperimentalPsychology: Human Perception and Performance, 21(4) (1995) 901–913.
[14] B. C. Motter and E. J. Belky, “The Zone of Focal Attention During ActiveVisual Search,” Vision Research, 38(7) (1998) 1007–1022.
Complex Systems, 17 (2007) 183–209