EXPANDING CHINESE PCB INDUSTRY AND … Presentation for...©Prismark Partners LLC 1 PRISMARK...
25
© Prismark Partners LLC 1 PRISMARK PRESENTATION PREPARED FOR: CPCA Shenzhen, China July 27, 2015 EXPANDING CHINESE PCB INDUSTRY AND GLOBAL MARKET UPDATE PREPARED BY: PRISMARK PARTNERS LLC 130 Main Street Cold Spring Harbor NY 11724 Tel: 631 367-9187 Fax: 631 367-9223 e-mail: [email protected] www.prismark.com
Transcript of EXPANDING CHINESE PCB INDUSTRY AND … Presentation for...©Prismark Partners LLC 1 PRISMARK...

© Prismark Partners LLC 1
PRISMARK PRESENTATION
PREPARED FOR:
CPCA Shenzhen, China
July 27, 2015
EXPANDING CHINESE PCB INDUSTRY AND GLOBAL MARKET UPDATE
PREPARED BY: PRISMARK PARTNERS LLC
130 Main Street Cold Spring Harbor NY 11724 Tel: 631 367-9187 Fax: 631 367-9223
e-mail: [email protected] www.prismark.com
© Prismark Partners LLC 2
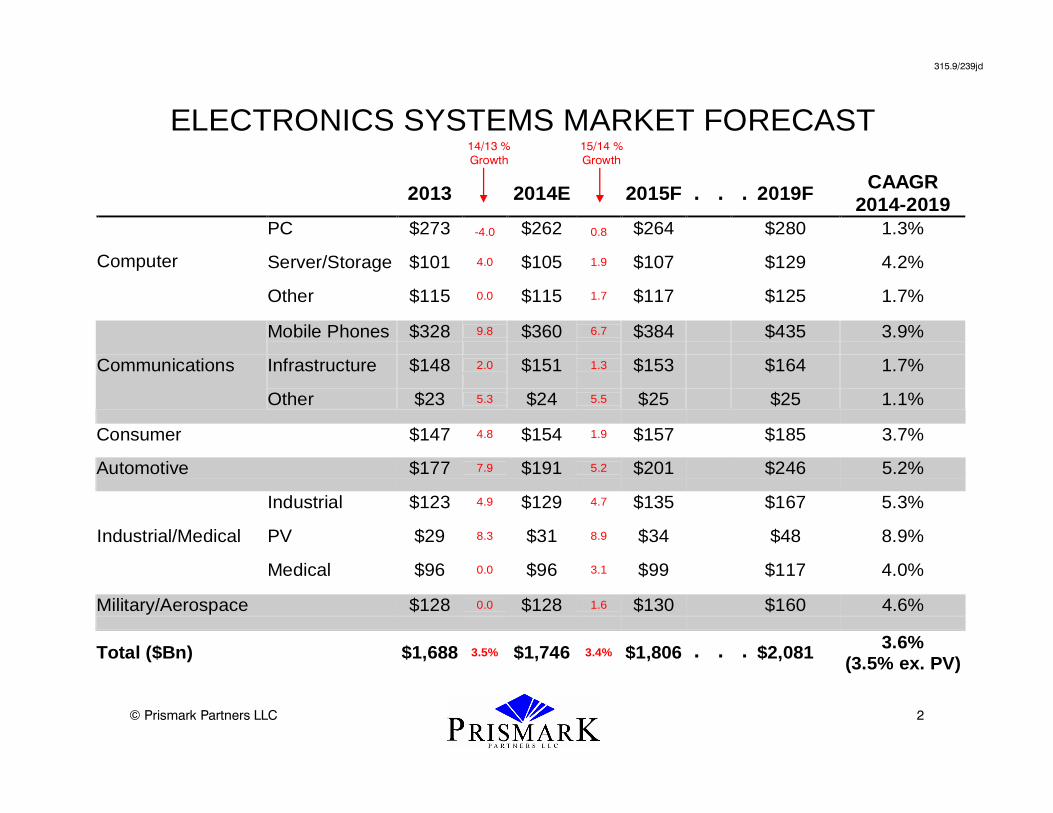
ELECTRONICS SYSTEMS MARKET FORECAST
2013 2014E 2015F 2019F CAAGR
2014-2019 PC $273 -4.0 $262 0.8 $264 $280 1.3%
Server/Storage $101 4.0 $105 1.9 $107 $129 4.2%
Computer
Other $115 0.0 $115 1.7 $117 $125 1.7%
Mobile Phones $328 9.8 $360 6.7 $384 $435 3.9%
Infrastructure $148 2.0 $151 1.3 $153 $164 1.7%
Communications
Other $23 5.3 $24 5.5 $25 $25 1.1%
Consumer $147 4.8 $154 1.9 $157 $185 3.7%
Automotive $177 7.9 $191 5.2 $201 $246 5.2%
Industrial $123 4.9 $129 4.7 $135 $167 5.3%
PV $29 8.3 $31 8.9 $34 $48 8.9%
Industrial/Medical
Medical $96 0.0 $96 3.1 $99 $117 4.0%
Military/Aerospace $128 0.0 $128 1.6 $130 $160 4.6%
Total ($Bn) $1,688 3.5% $1,746 3.4% $1,806 $2,081 3.6% (3.5% ex. PV)
15/14 %
Growth
14/13 %
Growth
315.9/239jd
. . .
. . .
© Prismark Partners LLC 3
715.9/239bp
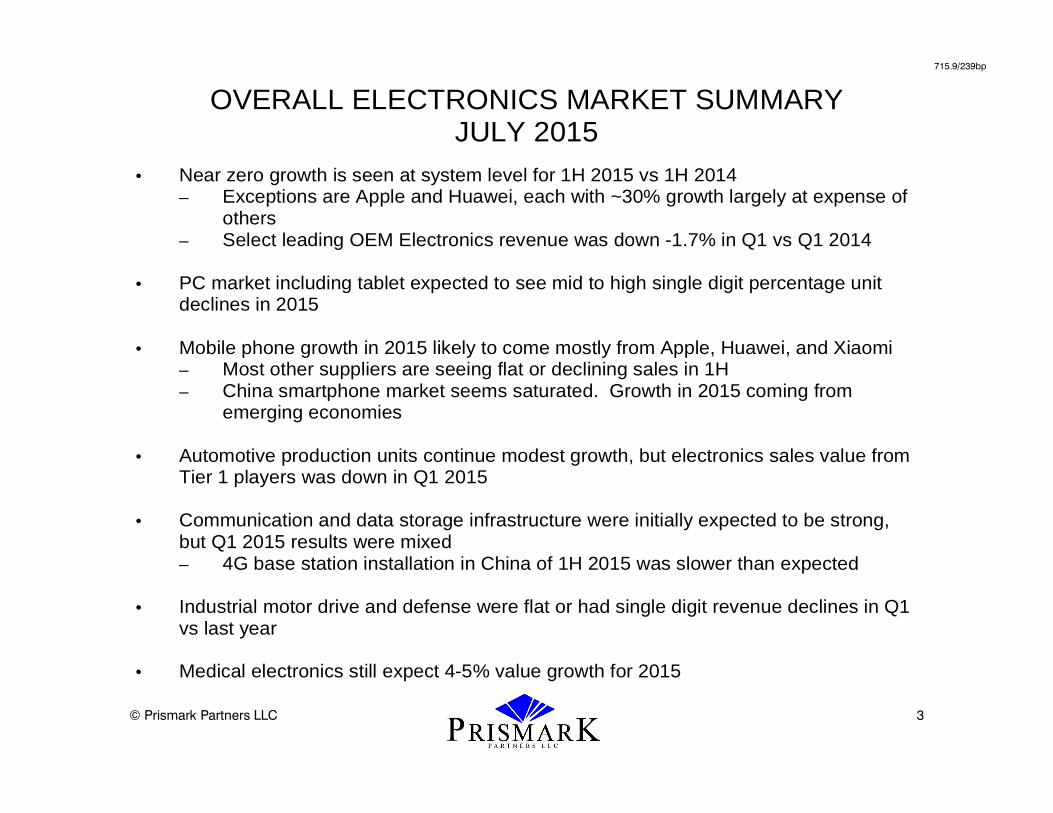
OVERALL ELECTRONICS MARKET SUMMARY JULY 2015
• Near zero growth is seen at system level for 1H 2015 vs 1H 2014 – Exceptions are Apple and Huawei, each with ~30% growth largely at expense of
others – Select leading OEM Electronics revenue was down -1.7% in Q1 vs Q1 2014
• PC market including tablet expected to see mid to high single digit percentage unit
declines in 2015 • Mobile phone growth in 2015 likely to come mostly from Apple, Huawei, and Xiaomi
– Most other suppliers are seeing flat or declining sales in 1H – China smartphone market seems saturated. Growth in 2015 coming from
emerging economies • Automotive production units continue modest growth, but electronics sales value from
Tier 1 players was down in Q1 2015 • Communication and data storage infrastructure were initially expected to be strong,
but Q1 2015 results were mixed – 4G base station installation in China of 1H 2015 was slower than expected
• Industrial motor drive and defense were flat or had single digit revenue declines in Q1
vs last year • Medical electronics still expect 4-5% value growth for 2015
© Prismark Partners LLC 4© Prismark Partners LLC 4
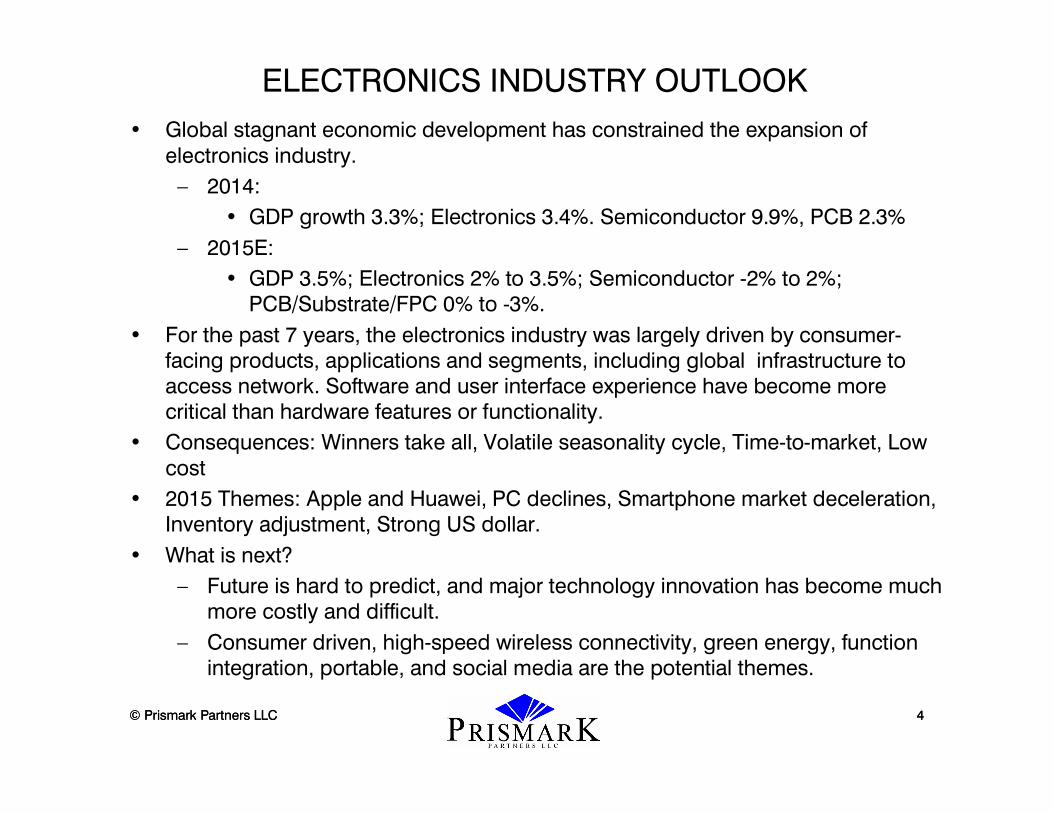
ELECTRONICS INDUSTRY OUTLOOK
• Global stagnant economic development has constrained the expansion of
electronics industry.
– 2014:
• GDP growth 3.3%; Electronics 3.4%. Semiconductor 9.9%, PCB 2.3%
– 2015E:
• GDP 3.5%; Electronics 2% to 3.5%; Semiconductor -2% to 2%; PCB/Substrate/FPC 0% to -3%.
• For the past 7 years, the electronics industry was largely driven by consumer-facing products, applications and segments, including global infrastructure to access network. Software and user interface experience have become more critical than hardware features or functionality.
• Consequences: Winners take all, Volatile seasonality cycle, Time-to-market, Low
cost
• 2015 Themes: Apple and Huawei, PC declines, Smartphone market deceleration, Inventory adjustment, Strong US dollar.
• What is next?
– Future is hard to predict, and major technology innovation has become much more costly and difficult.
– Consumer driven, high-speed wireless connectivity, green energy, function integration, portable, and social media are the potential themes.

© Prismark Partners LLC 5
715.9/239bp
PCB MARKET OUTLOOK – JULY 2015
• PCB demand was weak from April onward – Potential recovery from August to November – Expect market decline of 0% to -3% in dollars for full year – PCB supply chain in Korea remains weak in 1H 2015 – CCL (Copper Clad Laminate) demand was mostly weak in 1H 2015. Recovery in
August is expected • Multilayer PCB down across most end segments. Automotive and aerospace only
stable ones so far – Google among others are pushing out PCB orders by 1 to 2 months
• Apple and Huawei are drivers of HDI and FPC boards. Supply chains for other
smartphone companies were either flat or slow • Packaging substrate market was weak in 1H 2015
– Declining in PC demand and weak networking market – Qualcomm, NVIDIA, AMD, and MediaTek have been soft – Inventory adjustment

© Prismark Partners LLC 6
2014 2014 2014 2014 20142019F 2019F 2019F 2019F 2019F0
$5
$10
$15
$20
$25
$30
$35
2014/2019 PCB PRODUCTION PROFILES GROWTH
Commodity (Paper, Composite,
Rigid Glass)
Multilayers MicroviaPCBs
*PackageSubstrates
Flex
$Bn
kc31
5.04
4kk
-gro
wth
2
$9.5
$25.5
$21.8
$8.3 $7.6$8.1
$10.0$11.5
$13.82.8%
CAAGR
3.1%CAAGR
3.8%CAAGR 1.3%
CAAGR
3.8%CAAGR
March 2015
Japan
China
Asia (Ex. Japan,Ex. China)
Americas
Europe
$8.2

© Prismark Partners LLC 7
315.3/044kk
PCB PRODUCTION FORECAST BY PRODUCT TYPE
2013 2014/ 2013 2014
2015E/ 2014 2015E 2019F
CAAGR 2014-2019
Commodity $8,074 2.1% $8,242 0% to -5% $8,425 $9,454 2.8% Multilayer $21,014 3.9% $21,833 0% to -5% $22,511 $25,463 3.1% Microvia $8,121 2.1% $8,288 0% to 2% $8,552 $9,997 3.8% Silicon Platform $7,658 -0.8% $7,598 0% to -5% $7,638 $8,122 1.3% Flex $11,284 1.7% $11,476 2% to 5% $11,878 $13,832 3.8% TOTAL $56,151 2.3% $57,437 1% to -3% $59,005 $66,868 3.1% June 2015
© Prismark Partners LLC 8
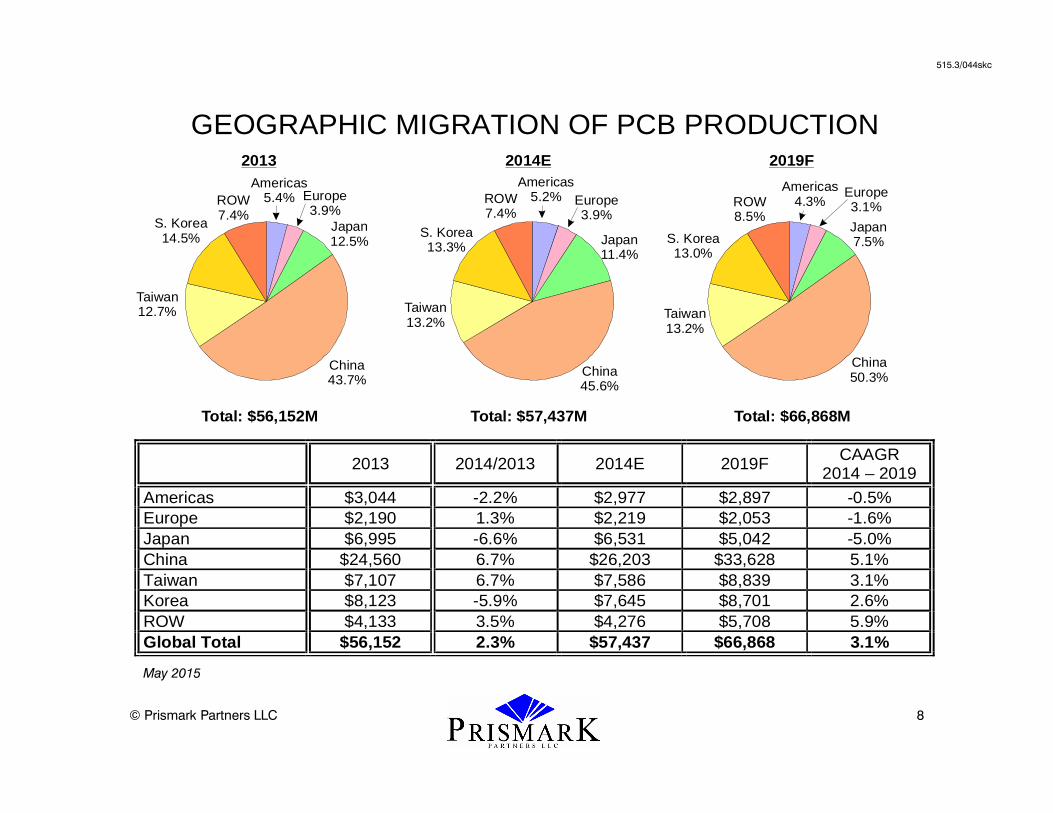
GEOGRAPHIC MIGRATION OF PCB PRODUCTION
2013 2014/2013 2014E 2019F CAAGR
2014 – 2019
Americas $3,044 -2.2% $2,977 $2,897 -0.5% Europe $2,190 1.3% $2,219 $2,053 -1.6% Japan $6,995 -6.6% $6,531 $5,042 -5.0% China $24,560 6.7% $26,203 $33,628 5.1% Taiwan $7,107 6.7% $7,586 $8,839 3.1% Korea $8,123 -5.9% $7,645 $8,701 2.6% ROW $4,133 3.5% $4,276 $5,708 5.9% Global Total $56,152 2.3% $57,437 $66,868 3.1%
515.3/044skc
May 2015
Americas5.4% Europe
3.9%Japan12.5%
Taiwan12.7%
S. Korea14.5%
China43.7%
ROW7.4%
2013
Americas4.3%
Americas5.2% Europe
3.1%Europe3.9%
Japan7.5%Japan
11.4%
Taiwan13.2%
Taiwan13.2%
S. Korea13.0%
S. Korea13.3%
China50.3%China
45.6%
ROW8.5%
ROW7.4%
Total: $66,868MTotal: $57,437MTotal: $56,152M
2019F2014E
© Prismark Partners LLC 9
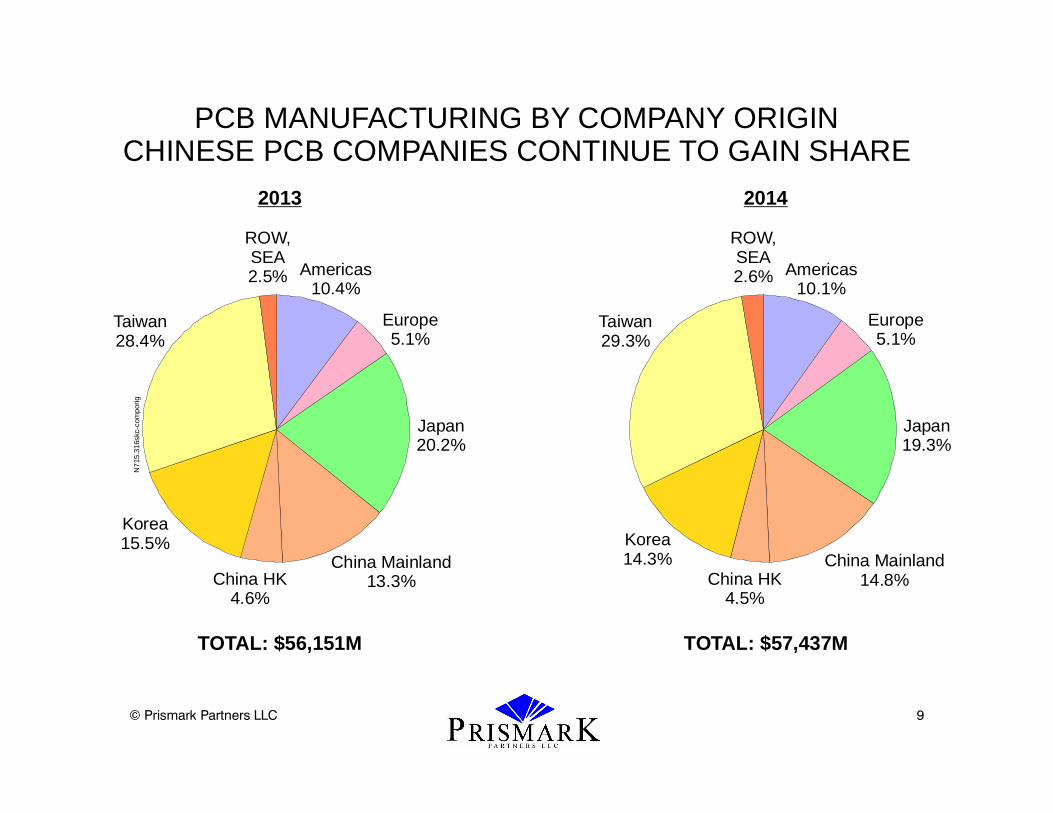
Americas10.4%
Americas10.1%
Europe5.1%
Europe5.1%
Japan20.2%
Japan19.3%
China Mainland13.3%
China Mainland14.8%China HK
4.6%China HK
4.5%
N71
5.31
6skc
-com
porig
TOTAL: $56,151M
2013
TOTAL: $57,437M
2014
PCB MANUFACTURING BY COMPANY ORIGINCHINESE PCB COMPANIES CONTINUE TO GAIN SHARE
Korea15.5% Korea
14.3%
Taiwan28.4%
Taiwan29.3%
ROW,SEA2.5%
ROW,SEA2.6%
© Prismark Partners LLC 10
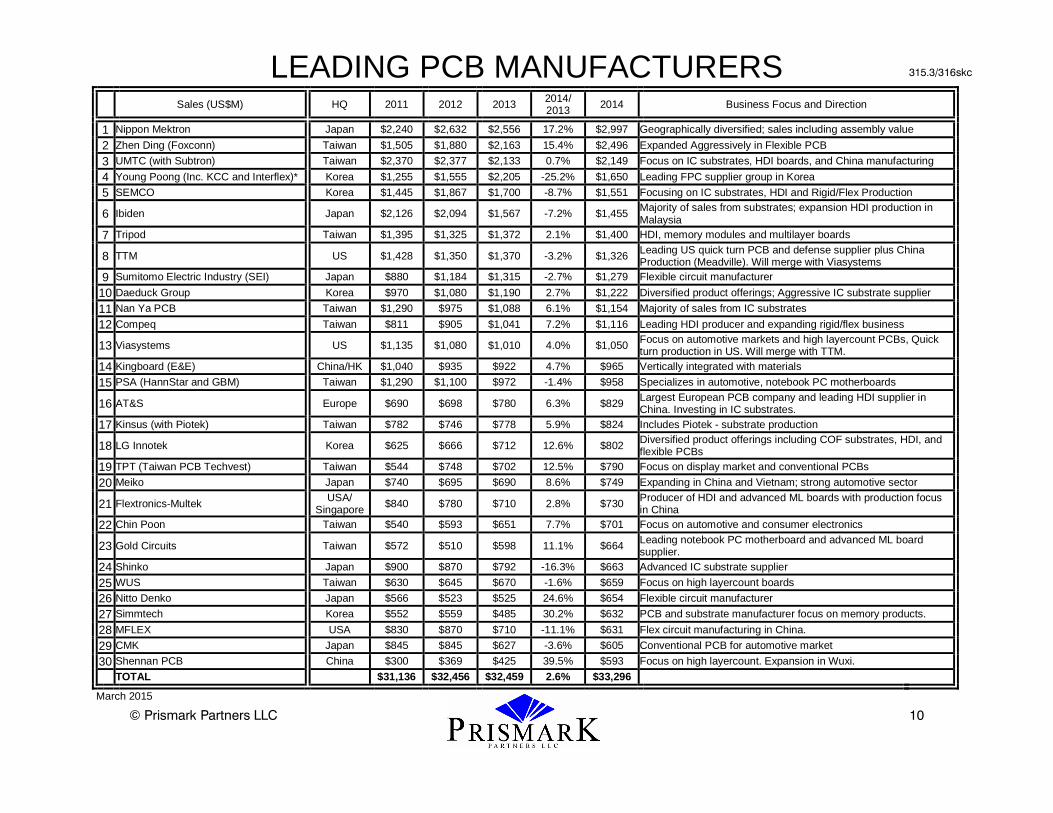
LEADING PCB MANUFACTURERS
Sales (US$M) HQ 2011 2012 2013 2014/ 2013 2014 Business Focus and Direction
1 Nippon Mektron Japan $2,240 $2,632 $2,556 17.2% $2,997 Geographically diversified; sales including assembly value
2 Zhen Ding (Foxconn) Taiwan $1,505 $1,880 $2,163 15.4% $2,496 Expanded Aggressively in Flexible PCB
3 UMTC (with Subtron) Taiwan $2,370 $2,377 $2,133 0.7% $2,149 Focus on IC substrates, HDI boards, and China manufacturing
4 Young Poong (Inc. KCC and Interflex)* Korea $1,255 $1,555 $2,205 -25.2% $1,650 Leading FPC supplier group in Korea
5 SEMCO Korea $1,445 $1,867 $1,700 -8.7% $1,551 Focusing on IC substrates, HDI and Rigid/Flex Production
6 Ibiden Japan $2,126 $2,094 $1,567 -7.2% $1,455 Majority of sales from substrates; expansion HDI production in Malaysia
7 Tripod Taiwan $1,395 $1,325 $1,372 2.1% $1,400 HDI, memory modules and multilayer boards
8 TTM US $1,428 $1,350 $1,370 -3.2% $1,326 Leading US quick turn PCB and defense supplier plus China Production (Meadville). Will merge with Viasystems
9 Sumitomo Electric Industry (SEI) Japan $880 $1,184 $1,315 -2.7% $1,279 Flexible circuit manufacturer
10 Daeduck Group Korea $970 $1,080 $1,190 2.7% $1,222 Diversified product offerings; Aggressive IC substrate supplier
11 Nan Ya PCB Taiwan $1,290 $975 $1,088 6.1% $1,154 Majority of sales from IC substrates
12 Compeq Taiwan $811 $905 $1,041 7.2% $1,116 Leading HDI producer and expanding rigid/flex business
13 Viasystems US $1,135 $1,080 $1,010 4.0% $1,050 Focus on automotive markets and high layercount PCBs, Quick turn production in US. Will merge with TTM.
14 Kingboard (E&E) China/HK $1,040 $935 $922 4.7% $965 Vertically integrated with materials
15 PSA (HannStar and GBM) Taiwan $1,290 $1,100 $972 -1.4% $958 Specializes in automotive, notebook PC motherboards
16 AT&S Europe $690 $698 $780 6.3% $829 Largest European PCB company and leading HDI supplier in China. Investing in IC substrates.
17 Kinsus (with Piotek) Taiwan $782 $746 $778 5.9% $824 Includes Piotek - substrate production
18 LG Innotek Korea $625 $666 $712 12.6% $802 Diversified product offerings including COF substrates, HDI, and flexible PCBs
19 TPT (Taiwan PCB Techvest) Taiwan $544 $748 $702 12.5% $790 Focus on display market and conventional PCBs
20 Meiko Japan $740 $695 $690 8.6% $749 Expanding in China and Vietnam; strong automotive sector
21 Flextronics-Multek USA/ Singapore $840 $780 $710 2.8% $730 Producer of HDI and advanced ML boards with production focus
in China
22 Chin Poon Taiwan $540 $593 $651 7.7% $701 Focus on automotive and consumer electronics
23 Gold Circuits Taiwan $572 $510 $598 11.1% $664 Leading notebook PC motherboard and advanced ML board supplier.
24 Shinko Japan $900 $870 $792 -16.3% $663 Advanced IC substrate supplier
25 WUS Taiwan $630 $645 $670 -1.6% $659 Focus on high layercount boards
26 Nitto Denko Japan $566 $523 $525 24.6% $654 Flexible circuit manufacturer
27 Simmtech Korea $552 $559 $485 30.2% $632 PCB and substrate manufacturer focus on memory products.
28 MFLEX USA $830 $870 $710 -11.1% $631 Flex circuit manufacturing in China.
29 CMK Japan $845 $845 $627 -3.6% $605 Conventional PCB for automotive market
30 Shennan PCB China $300 $369 $425 39.5% $593 Focus on high layercount. Expansion in Wuxi.
TOTAL $31,136 $32,456 $32,459 2.6% $33,296
March 2015
315.3/316skc
© Prismark Partners LLC 11
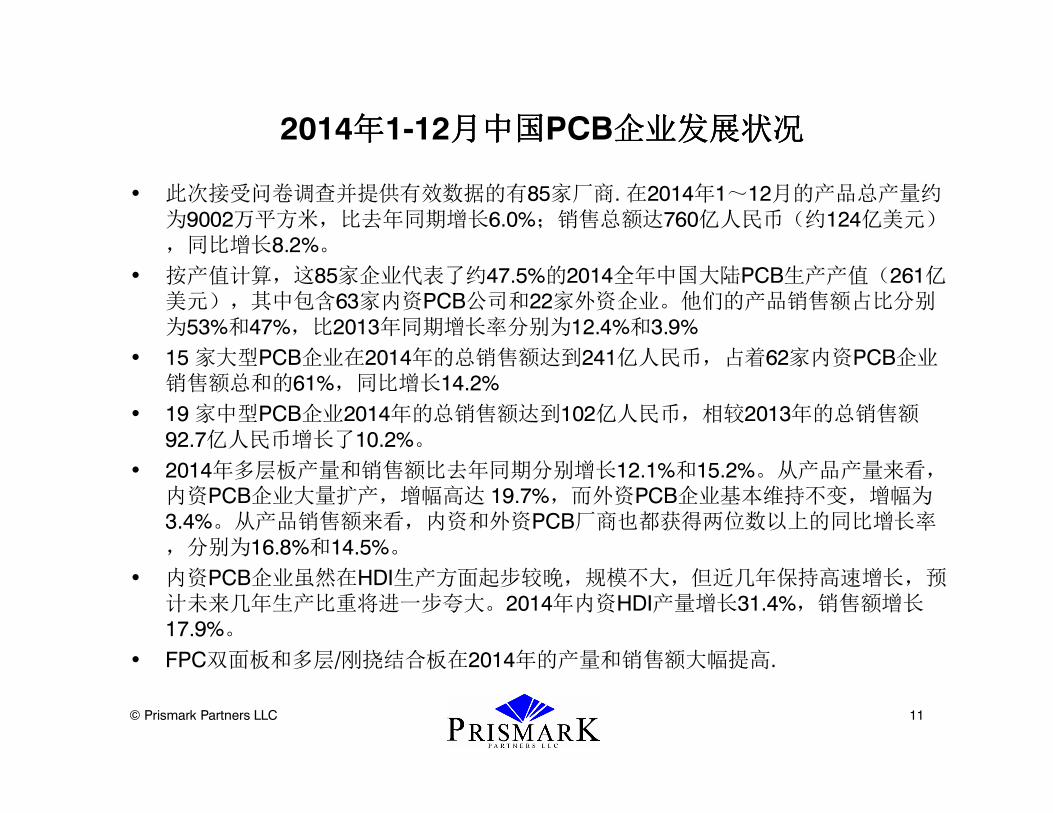
2014年年年年1-12月中国月中国月中国月中国PCB企业发展状况企业发展状况企业发展状况企业发展状况
• 此次接受问卷调查并提供有效数据的有85家厂商. 在2014年1~12月的产品总产量约为9002万平方米,比去年同期增长6.0%;销售总额达760亿人民币(约124亿美元),同比增长8.2%。
• 按产值计算,这85家企业代表了约47.5%的2014全年中国大陆PCB生产产值(261亿美元),其中包含63家内资PCB公司和22家外资企业。他们的产品销售额占比分别为53%和47%,比2013年同期增长率分别为12.4%和3.9%
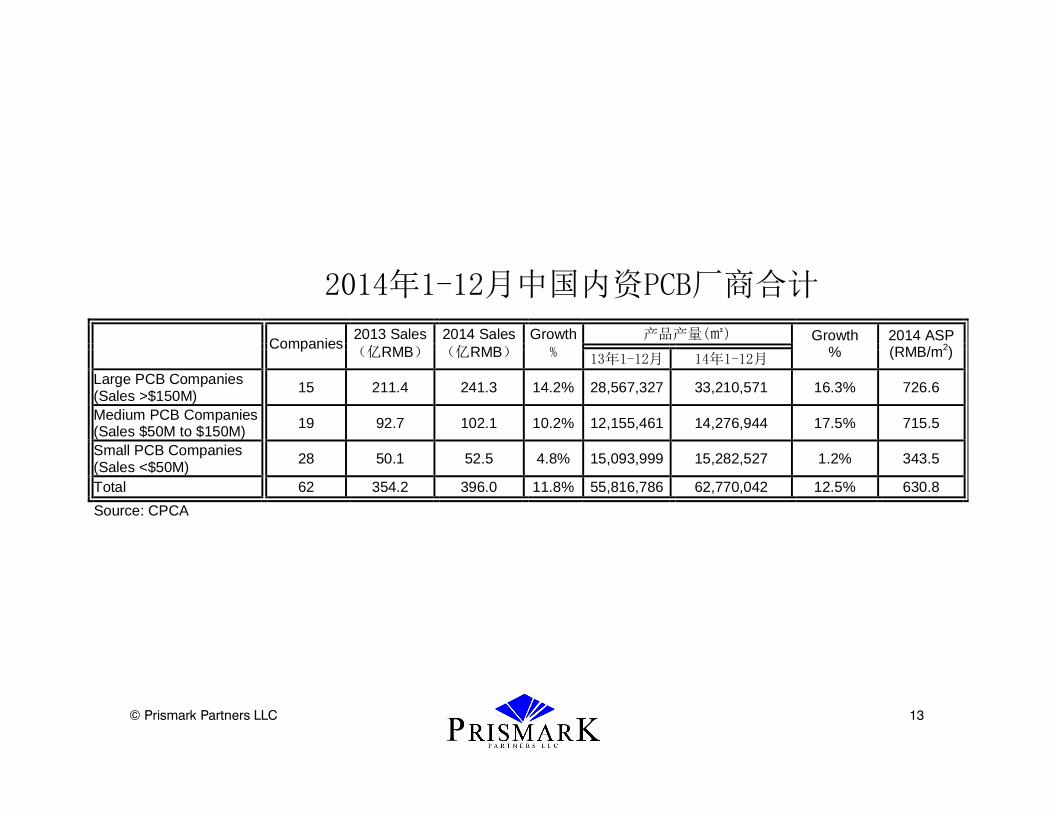
• 15 家大型PCB企业在2014年的总销售额达到241亿人民币,占着62家内资PCB企业销售额总和的61%,同比增长14.2%
• 19 家中型PCB企业2014年的总销售额达到102亿人民币,相较2013年的总销售额92.7亿人民币增长了10.2%。
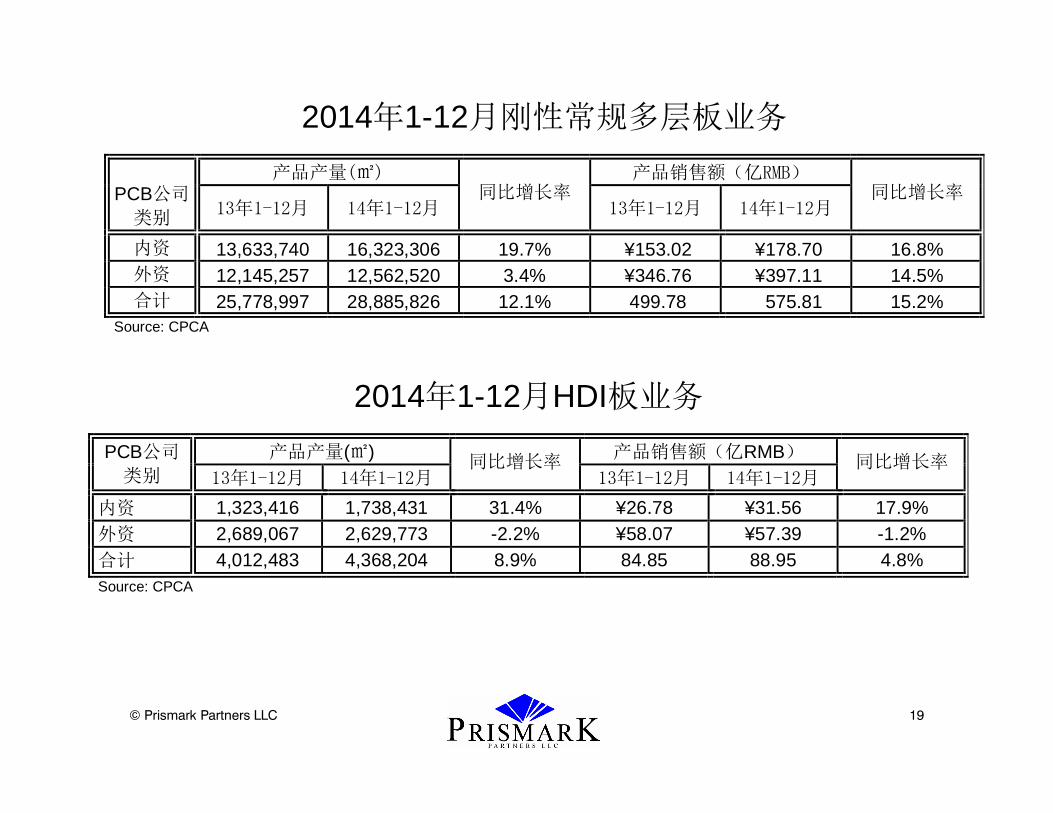
• 2014年多层板产量和销售额比去年同期分别增长12.1%和15.2%。从产品产量来看,内资PCB企业大量扩产,增幅高达 19.7%,而外资PCB企业基本维持不变,增幅为3.4%。从产品销售额来看,内资和外资PCB厂商也都获得两位数以上的同比增长率,分别为16.8%和14.5%。
• 内资PCB企业虽然在HDI生产方面起步较晚,规模不大,但近几年保持高速增长,预计未来几年生产比重将进一步夸大。2014年内资HDI产量增长31.4%,销售额增长17.9%。
• FPC双面板和多层/刚挠结合板在2014年的产量和销售额大幅提高.

© Prismark Partners LLC 12
2014年1-12月中国PCB厂商合计
产品产量(㎡) 产品销售额(亿RMB) PCB公司
类别 13年1-12月 14年1-12月
同比增长率 13年1-12月 14年1-12月
同比增长率
内资 55,872,889 62,974,942 12.7% ¥356.86 ¥401.22 12.4% 外资 29,087,071 27,051,319 -7.0% ¥348.11 ¥361.67 3.9% 合计 84,959,961 90,026,261 6.0% ¥704.97 ¥762.89 8.2% Source: CPCA
© Prismark Partners LLC 13
2014年1-12月中国内资PCB厂商合计
产品产量(㎡)
Companies
2013 Sales (亿RMB)
2014 Sales (亿RMB)
Growth % 13年1-12月 14年1-12月
Growth %
2014 ASP (RMB/m2)
Large PCB Companies (Sales >$150M)
15 211.4 241.3 14.2% 28,567,327 33,210,571 16.3% 726.6
Medium PCB Companies (Sales $50M to $150M) 19 92.7 102.1 10.2% 12,155,461 14,276,944 17.5% 715.5
Small PCB Companies (Sales <$50M)
28 50.1 52.5 4.8% 15,093,999 15,282,527 1.2% 343.5
Total 62 354.2 396.0 11.8% 55,816,786 62,770,042 12.5% 630.8
Source: CPCA
© Prismark Partners LLC 14
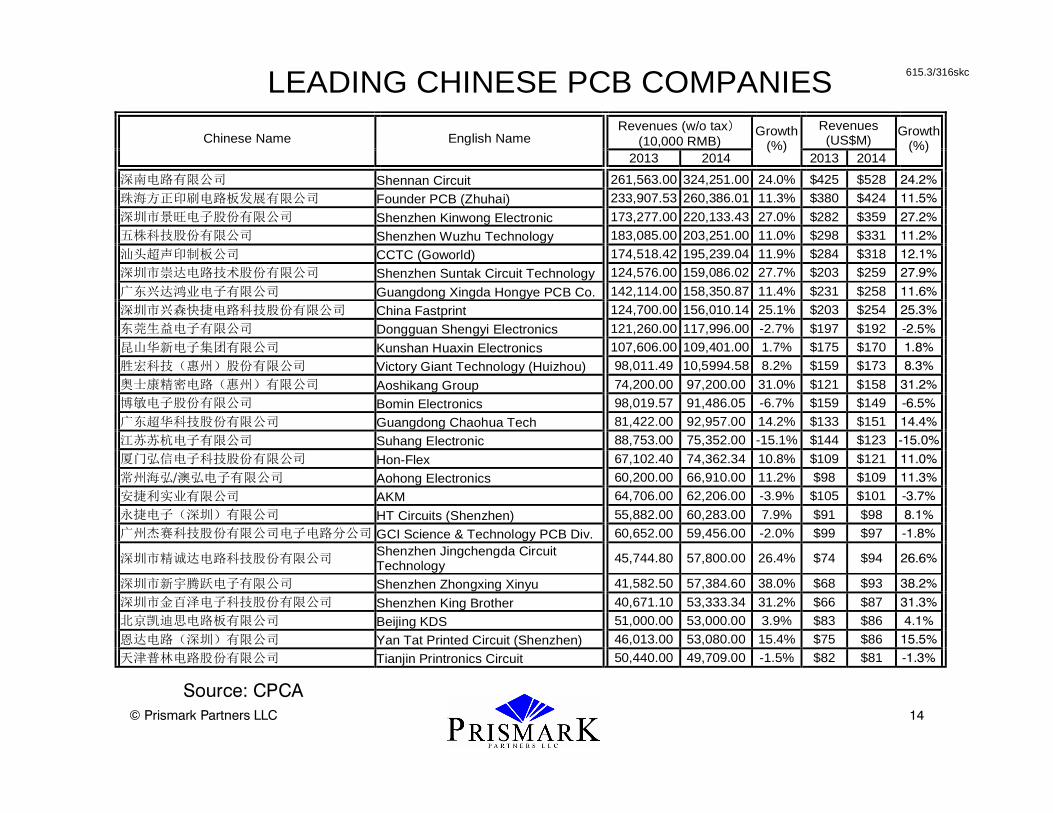
LEADING CHINESE PCB COMPANIES
Revenues (w/o tax)(10,000 RMB)
Revenues (US$M) Chinese Name English Name
2013 2014
Growth (%)
2013 2014
Growth (%)
深南电路有限公司 Shennan Circuit 261,563.00 324,251.00 24.0% $425 $528 24.2%
珠海方正印刷电路板发展有限公司 Founder PCB (Zhuhai) 233,907.53 260,386.01 11.3% $380 $424 11.5%
深圳市景旺电子股份有限公司 Shenzhen Kinwong Electronic 173,277.00 220,133.43 27.0% $282 $359 27.2%
五株科技股份有限公司 Shenzhen Wuzhu Technology 183,085.00 203,251.00 11.0% $298 $331 11.2%
汕头超声印制板公司 CCTC (Goworld) 174,518.42 195,239.04 11.9% $284 $318 12.1%
深圳市崇达电路技术股份有限公司 Shenzhen Suntak Circuit Technology 124,576.00 159,086.02 27.7% $203 $259 27.9%
广东兴达鸿业电子有限公司 Guangdong Xingda Hongye PCB Co. 142,114.00 158,350.87 11.4% $231 $258 11.6%
深圳市兴森快捷电路科技股份有限公司 China Fastprint 124,700.00 156,010.14 25.1% $203 $254 25.3%
东莞生益电子有限公司 Dongguan Shengyi Electronics 121,260.00 117,996.00 -2.7% $197 $192 -2.5%
昆山华新电子集团有限公司 Kunshan Huaxin Electronics 107,606.00 109,401.00 1.7% $175 $170 1.8%
胜宏科技(惠州)股份有限公司 Victory Giant Technology (Huizhou) 98,011.49 10,5994.58 8.2% $159 $173 8.3%
奥士康精密电路(惠州)有限公司 Aoshikang Group 74,200.00 97,200.00 31.0% $121 $158 31.2%
博敏电子股份有限公司 Bomin Electronics 98,019.57 91,486.05 -6.7% $159 $149 -6.5%
广东超华科技股份有限公司 Guangdong Chaohua Tech 81,422.00 92,957.00 14.2% $133 $151 14.4%
江苏苏杭电子有限公司 Suhang Electronic 88,753.00 75,352.00 -15.1% $144 $123 -15.0%
厦门弘信电子科技股份有限公司 Hon-Flex 67,102.40 74,362.34 10.8% $109 $121 11.0%
常州海弘/澳弘电子有限公司 Aohong Electronics 60,200.00 66,910.00 11.2% $98 $109 11.3%
安捷利实业有限公司 AKM 64,706.00 62,206.00 -3.9% $105 $101 -3.7%
永捷电子(深圳)有限公司 HT Circuits (Shenzhen) 55,882.00 60,283.00 7.9% $91 $98 8.1%
广州杰赛科技股份有限公司电子电路分公司 GCI Science & Technology PCB Div. 60,652.00 59,456.00 -2.0% $99 $97 -1.8%
深圳市精诚达电路科技股份有限公司 Shenzhen Jingchengda Circuit Technology
45,744.80 57,800.00 26.4% $74 $94 26.6%
深圳市新宇腾跃电子有限公司 Shenzhen Zhongxing Xinyu 41,582.50 57,384.60 38.0% $68 $93 38.2%
深圳市金百泽电子科技股份有限公司 Shenzhen King Brother 40,671.10 53,333.34 31.2% $66 $87 31.3%
北京凯迪思电路板有限公司 Beijing KDS 51,000.00 53,000.00 3.9% $83 $86 4.1%
恩达电路(深圳)有限公司 Yan Tat Printed Circuit (Shenzhen) 46,013.00 53,080.00 15.4% $75 $86 15.5%
天津普林电路股份有限公司 Tianjin Printronics Circuit 50,440.00 49,709.00 -1.5% $82 $81 -1.3%
615.3/316skc
Source: CPCA

© Prismark Partners LLC 15
PRODUCTION VALUE GROWTH OF CHINESE PCB COMPANIES
Sales (亿RMB)
Inputs: Number of Companies 13年1-12月 14年1-12月
Growth (%)
2014 Share
(%)
SS Rigid Board 34 28.09 27.98 -0.4% 7.3% DS Rigid Board 47 84.28 91.62 8.7% 23.8% Multilayer Rigid Board 39 153.02 178.70 16.8% 46.4% HDI Board 11 26.78 31.56 17.9% 8.2% IC Substrate 3 5.65 7.61 34.7% 2.0% SS FPC Board 15 6.01 4.62 -23.1% 1.2% DS FPC Board 17 27.06 33.50 23.8% 8.7% Multilayer/Rigid-Flex Board 14 6.22 9.28 49.2% 2.4% Total 337.11 384.87 14.2% 100.0%
Source: CPCA

© Prismark Partners LLC 16
PRODUCTION VOLUME EXPANSION OF CHINESE PCB COMPANIES
产品产量(㎡)
Inputs: Number of Companies 13年1-12月 14年1-12月
Growth (%)
2014 Share
(%)
SS Rigid Board 34 20,782,576 19,922,587 -4.1% 33.7% DS Rigid Board 47 17,127,446 17,974,648 4.9% 30.4% Multilayer Rigid Board 39 13,633,740 16,323,306 19.7% 27.6% HDI Board 11 1,323,416 1,738,431 31.4% 2.9% IC Substrate 3 51,315 96,886 88.8% 0.2% SS FPC Board 15 908,912 667,557 -26.6% 1.1% DS FPC Board 17 1,654,650 2,150,275 30.0% 3.6% Multilayer/Rigid-Flex Board 14 185,207 231,143 24.8% 0.4% Total 55,667,262 59,104,833 6.2% 100.0%
Source: CPCA
© Prismark Partners LLC 17
0.0%
10.0%
20.0%
30.0%
40.0%
50.0%
60.0%
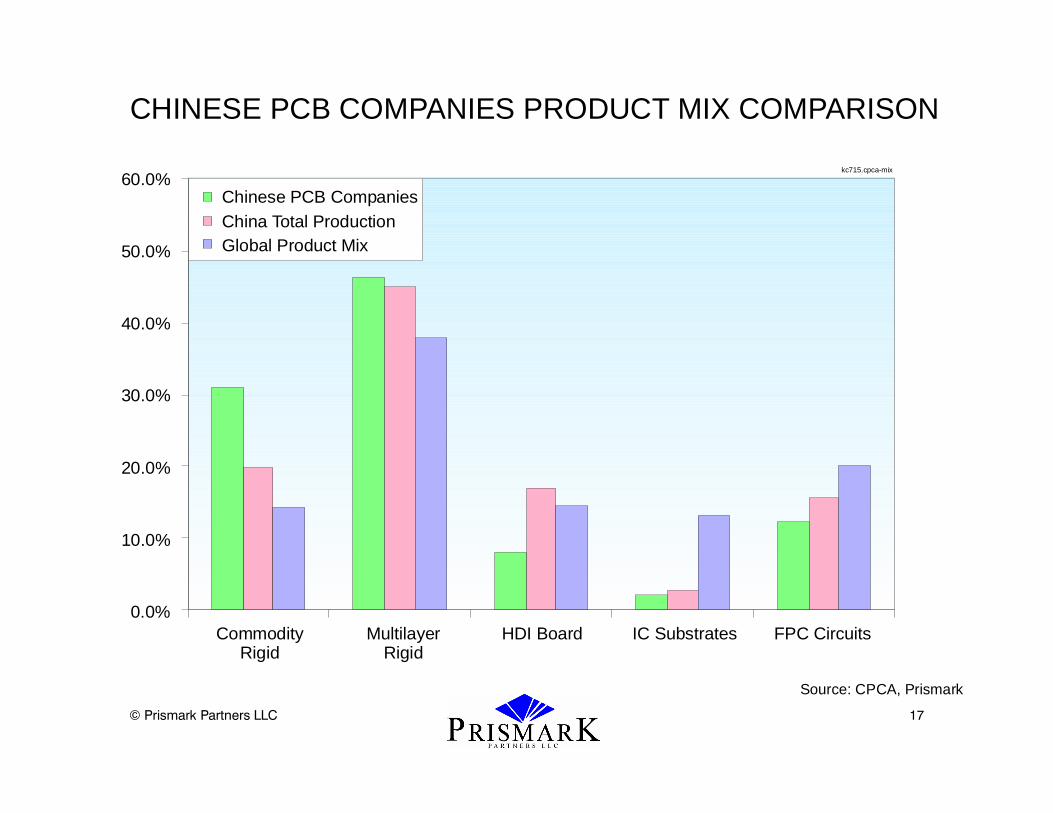
CHINESE PCB COMPANIES PRODUCT MIX COMPARISON
kc715.cpca-mix
CommodityRigid
Source: CPCA, Prismark
MultilayerRigid
HDI Board IC Substrates FPC Circuits
Chinese PCB CompaniesChina Total ProductionGlobal Product Mix

© Prismark Partners LLC 18
2014年1-12月刚性单面板业务
产品产量(㎡) 产品销售额(亿RMB) PCB公司
类别 13年1-12月 14年1-12月 同比增长率
13年1-12月 14年1-12月 同比增长率
内资 20,782,576 19,922,587 -4.1% ¥28.09 ¥27.98 -0.4% 外资 3,401,863 3,468,983 2.0% ¥5.52 ¥5.06 -8.3% 合计 4,184,439 23,391,570 -3.3% ¥33.62 ¥33.05 -1.7% Source: CPCA
2014年1-12月刚性双面板业务
产品产量(㎡) 产品销售额(亿RMB) PCB公司
类别 13年1-12月 14年1-12月 同比增长率
13年1-12月 14年1-12月 同比增长率
内资 17,127,446 17,974,648 4.9% ¥84.28 ¥91.62 8.7% 外资 4,266,439 4,498,419 5.4% ¥24.63 ¥26.11 6.0% 合计 21,393,885 22,473,067 5.0% 108.91 117.73 8.1%
Source: CPCA
© Prismark Partners LLC 19
2014年1-12月刚性常规多层板业务
产品产量(㎡) 产品销售额(亿RMB) PCB公司
类别 13年1-12月 14年1-12月
同比增长率 13年1-12月 14年1-12月
同比增长率
内资 13,633,740 16,323,306 19.7% ¥153.02 ¥178.70 16.8% 外资 12,145,257 12,562,520 3.4% ¥346.76 ¥397.11 14.5% 合计 25,778,997 28,885,826 12.1% 499.78 575.81 15.2%
Source: CPCA
2014年1-12月HDI板业务
产品产量(㎡) 产品销售额(亿RMB) PCB公司
类别 13年1-12月 14年1-12月 同比增长率
13年1-12月 14年1-12月 同比增长率
内资 1,323,416 1,738,431 31.4% ¥26.78 ¥31.56 17.9% 外资 2,689,067 2,629,773 -2.2% ¥58.07 ¥57.39 -1.2% 合计 4,012,483 4,368,204 8.9% 84.85 88.95 4.8% Source: CPCA

© Prismark Partners LLC 20
2014年1-6月FPC单面板业务
产品产量(㎡) 产品销售额(亿RMB) PCB公司
类别 13年1-12月 14年1-12月 同比增长率
13年1-12月 14年1-12月 同比增长率
内资 908,912 667,557 -26.6% ¥6.01 ¥4.62 -23.1% 外资 1,059,200 882,900 -16.6% ¥10.51 ¥9.45 -10.1% 合计 1,968,112 1,550,457 -21.2% 16.52 14.07 -14.8% Source: CPCA
2014年1-6月FPC双面板业务
产品产量(㎡) 产品销售额(亿RMB) PCB公司
类别 13年1-12月 14年1-12月 同比增长率
13年1-12月 14年1-12月 同比增长率
内资 1,654,650 2,150,275 30.0% ¥27.06 ¥33.50 23.8%
外资 577,000 690,300 19.6% ¥26.61 ¥23.62 -11.2%
合计 2,231,650 2,840,575 27.3% 53.67 57.12 6.4%
Source: CPCA

© Prismark Partners LLC 21
2014年1-2月FPC多层/刚挠结合板业务
产品产量(㎡) 产品销售额(亿RMB) PCB公司
类别 13年1-12月 14年1-12月 同比增长率
13年1-12月 14年1-12月 同比增长率
内资 185,207 231,143 24.8% ¥6.22 ¥9.28 49.2% 外资 140,449 209,224 49.0% ¥9.69 ¥17.08 76.3% 合计 325,656 440,367 35.2% 15.91 26.37 65.7% Source: CPCA
2014年1-12月IC载板业务
产品产量(㎡) 产品销售额(亿RMB) PCB公司
类别 13年1-12月 14年1-12月 同比增长率
13年1-12月 14年1-12月 同比增长率
内资 51,315 96,886 88.8% ¥5.65 ¥7.61 34.7% 外资 合计 51,315 96,886 88.8% 5.65 7.61 34.7% Source: CPCA

© Prismark Partners LLC 22
2014年1-12月PCB和相关公司人工和管理费用占比
人工费用占比 管理费用占比 PCB公司
类别 13年1-12月 14年1-12月
同比增长率
13年1-12月 14年1-12月
同比增长率
内资 14.7% 14.9% 0.2% 8.9% 8.5% -0.4% 外资 14.7% 15.5% 0.9% 7.1% 7.5% 0.4% 合计 14.7% 15.2% 0.4% 8.3% 8.2% -0.1% 相关公司 6.1% 7.2% 1.0% 4.8% 5.4% 0.5% Source: CPCA
2014年1-12月PCB和相关公司利润率和人均产值
毛利润率 净利润率 人均产值(RMB) PCB公司
类别 13年1-12月 14年1-12月 同比增长率
13年1-12月 14年1-12月 同比增长率
13年1-12月 14年1-12月 同比增长率
内资 18.7% 18.4% -0.3% 7.0% 7.2% 0.2% ¥394,533 ¥416,726 5.6% 外资 16.4% 14.9% -1.5% 5.1% 4.1% -1.0% ¥395,803 ¥378,719 -4.3% 合计 17.9% 17.3% -0.6% 6.3% 6.1% -0.2% ¥ 394,997 ¥402,867 2.0% 相关公司 8.2% 9.0% 0.8% 4.6% 4.3% -0.3% ¥1,147,381 ¥085,561 -5.4%
Source: CPCA

© Prismark Partners LLC 23
2014年1-12月CCL业务
产品产量(㎡) 产品销售额(亿RMB) Products 13年1-12月 14年1-12月
同比增长率 13年1-12月 14年1-12月
同比增长率
Composite CCL 12,781,532 13,370,041 4.6% ¥12.45 ¥12.08 -2.9% FR-4 CCL 42,998,823 47,093,902 9.5% ¥36.17 ¥36.58 1.1% Halogen-free CCL 6,892,428 6,966,759 1.1% 5.57 6.09 9.5% High Tg CCL 5,777,624 6,637,892 14.9% 5.91 6.52 10.4% Specialty CCL 1,294,020 900,952 -30.4% 0.87 1.35 55.5% CCL Total 168,495,378 183,085,214 8.7% 134.03 132.20 -1.4% Prepreg 107,299,971 112,595,934 4.9% 13.46 13.99 3.9%
Source: CPCA

© Prismark Partners LLC 24
Outlook of PCB Industry in China
• China will continue to be the leading production site of the PCB industry in the next few years.
• Capacity expansion in China by multinational companies has become more cautious and selective, Chinese PCB suppliers, on the other hand, are expected to grow aggressively in coming years.
• Local Chinese PCB companies are likely to expand by leveraging growing local demands and supporting equity market along with their competitive advantages in management, cost control and close proximity of established supply chain to gain global production share.
• High labor cost will force both local and multinational companies to adjust their product mix and to implement more automated processing.
• Chinese companies need to place more capital, technology and man power investments in HDI, substrate, and advanced flexible boards.
• There are challenges, however:
– Increasing labor cost
– Risky technology investment
– Challenging process and quality control of advanced products
– Customers relationship
© Prismark Partners LLC 25© Prismark Partners LLC 25
THANK YOUTHANK YOU