Executive Directors’ Remuneration Practices and Trends · PDF fileExecutive...
96
Executive Directors’ Remuneration Practices and Trends Report Fifth Edition South Africa – July 2013 http://www.pwc.co.za/executive-directors-report
Transcript of Executive Directors’ Remuneration Practices and Trends · PDF fileExecutive...
Executive Directors’ RemunerationPractices and Trends Report
Fifth Edition South Africa – July 2013
http://www.pwc.co.za/executive-directors-report

PwC

Executive Directors’ Remuneration – Practices and Trends Report
Executive Summary 2
Information 4
PwC CEO Survey 7
Executive Pay Model – “Sense at last” 9
The Ethics of Pay – Executive Pay Disclosure 20
Governance Update 27
Mind the Wage Gap 32
Gender – the Other Gap 43
Profile of an Executive Director 52
Executive Directors’ Total Guaranteed Package – JSE Trends 56
Executive Directors’ Total Short-Term Incentives – JSE Trends 85
Appendices
South African market place 90
About PwC 92
Acknowledgements 93
Contents

2 PwC
Executive Summary
It gives us great pleasure once again to share our fifth edition of the Executive Directors – Practices and Remuneration Trends Report: South Africa 2013 with all our clients. This bumper edition not only reports, as before, on our research on key trends in the executive remuneration space. It also gives some clarity on the very topical issue of the ‘pay gap’, and then it goes on to discuss the merits of a new remuneration model based on work done by our colleagues in the United Kingdom (UK).
Gerald Seegers
2 PwC

Executive Directors’ Remuneration – Practices and Trends Report 3
Our 16th Annual Global CEO Survey found that attracting and retaining talent is still high on the CEO’s business agenda. Executive remuneration is being scrutinised from all angles, and CEOs have come to recognise that the pay-for-performance models are not always working as well as expected. There is a general consensus that the current situation cannot continue. Our report indeed confirms that in many cases there has been some level of restraint recently, but probably not at the pace or level that we expected.
South African executives must lead the way, and there is a genuine intent on the part of our business leaders to make a difference. One of the avenues being considered is to forgo a pay increase and redistribute the funds to lower-paid employees to close the pay gap and kick-start the monitoring process going forward. The onus is on executives to act first and ensure that regulatory intervention is avoided.
Disclosure of executive remuneration has improved, but this has not
curtailed the actual figures. The concept of a two-tier remuneration report is gaining traction amongst shareholders, as this will allow them to have some say on pay in the future. Investors and other key stakeholders are demanding more details on how actual pay and share awards are made and paid.
We trust that you will find this trends publication of interest and that the issues and challenges we raise will shed more light on the way corporates in South Africa approach executive remuneration.
Gerald Seegers Director: Human Resources Services

4 PwC
Information

Executive Directors’ Remuneration – Practices and Trends Report 5
Sources of Information
The data set out in this publication was drawn from information publicly available for the 12-month reporting period ended 30 April 2013. The information was taken from the annual reports of 373 companies listed on the Johannesburg Securities Exchange (JSE), with a total market capitalisation of around 7.860 trillion Rand.
Format of Information and Definitions
Remuneration levels rarely follow a normal distribution curve – rather, these levels tend to fluctuate quite a bit. For this reason we have used a quartile/percentile range rather than giving averages and standard deviations that assume normality.
These quartiles/percentiles are defined as:
• Lower quartile (25th percentile)
75% of the sample earn more than this level and 25% earn less;
• Median (50th percentile)
50% of the sample earn more than this level and 50% of the sample earn less; and
• Upper quartile (75th percentile)
25% of the sample earn more than this level and 75% earn less.
Since the introduction of this annual publication in June 2009, we have held that there is no direct correlation between market capitalisation – calculated by reference to the number of shares in issue and the prevailing share price – and the remuneration of executive directors. However, we believe that market capitalisation gives a good indication of size and complexity, and is an appropriate metric to set peer groups and for benchmarking purposes. It is against this backdrop that data is analysed in terms of:
• Large-cap
The top 40 JSE-listed companies, measured against market capitalisation1;
• Medium-cap
41 to 100 of the JSE-listed companies, using the same metric; and
• Small-cap
101 to 373 of the JSE-listed companies.
1 Market capitalisation is an estimation of the deemed value of a business obtained by multiplying the number of ordinary shares outstanding by the current price of a share at a specific point in time.
Those companies that are listed on the AltX (a division of the JSE that offers an alternative exchange for smaller companies) have been aggregated into the above valuations. Where the AltX is evaluated as a standalone group, it refers to 55 companies with a total market value of R10.249 billion.
In addition to analysing the remuneration paid to executive directors across the JSE as a whole, we have also analysed the remuneration paid according to four main sectors (in addition to AltX) – Basic Resources, Financial Services, Industrial and Services. For each industry, we have split the data in accordance with the market cap of the companies and the AltX. Further details about each industry and the sectors which make up that industry are set out in the annexure to this publication.
Except where indicated elsewhere under separate headings, the remuneration values that we analysed refer to the total guaranteed package paid to directors. This is the total cash value that a director will receive annually. The values are expressed in thousands converted, where necessary, to South African Rand at the interbank spot rate published at midnight on the cut-off date. The guaranteed value is normally the aggregate of basic salary, benefits and allowances as well as other recurring emoluments.

6 PwC
Terms used
The terms used throughout this publication are as set out below:
• Total guaranteed package (‘TGP’) – refers to all components of remuneration that are guaranteed, including base salary and benefits that typically accrue on a monthly basis (retirement, medical, travel allowance, etc.);
• Short-term incentive (‘STI’) – refers to all cash-based payments that are paid to an individual based on company and individual performance for a 12-month period. STI differs from the target STI, which is reflective of the company’s policy regarding the potential STI earnings;
• Long-term incentive (‘LTI’) – refers to all cash and equity-based awards that accrue to an individual based on company performance over a period longer than 12 months; and
• Variable pay – refers to short-term incentives and long-term incentives.

Executive Directors’ Remuneration – Practices and Trends Report 7
PwC CEO Survey
8 PwC
A time for extraordinary leadership
PwC’s 16th Annual Global CEO Survey found that issues around talent are once again high on the business agenda.
The world’s business leaders are facing market conditions which are as challenging as many can recall; only one in five CEOs believes that the global economy will improve over the coming year and 70% are committed to cutting costs. CEOs’ confidence over the short term is down on last year. This brings with it a more cautious approach to the hunt for growth, with CEOs being most focused on the markets they are already in. CEOs must also work in an environment where trust in the world’s businesses (and their leaders) has hit an all-time low. Actions to reduce costs or shift headcount often run counter to efforts to build enduring trust and create growth. This year’s survey brings some interesting findings around the actions CEOs are (and are not) taking to develop their leadership pipelines.
While the skills shortage remains a significant challenge, no fewer than 89% of South African CEOs plan to make some changes to their strategies for managing talent over the next 12 months, with 25% contemplating major changes.
As if these challenges were not enough, the close scrutiny of executive pay has added a compelling need to revisit the approach to the entire ‘pay
strategy’. While remuneration is of course an important part of motivating employees, in the current climate of seemingly relentless cost-cutting, perhaps it is time for a more thoughtful approach.
When asked about reward, 69% of CEOs agreed that they felt they needed to match the pay and conditions offered by their peers in order to retain talent (this increased to 88% of CEOs in the Middle East). A third of the CEOs felt that the ‘pay for performance’ models were not working as well as expected, and 31% felt that executive pay models had become far too complex. This complexity has resulted in many executive models having become impossible to understand (and by extension, to compare to other organisations), and this has also affected their effectiveness as a means of incentivising workers.
This was a key finding of our recent Psychology of Incentives Study2, which looked in detail at how executives think about pay and incentivised reward. Another important finding of that report was that executives were motivated by more than money. Of course people work for pay and benefits, but they also work for recognition and because they find it personally rewarding. The report showed clearly that companies have to pay their executives more in order to
2 Psychology of Incentives, PwC 2012
compensate for the intrinsic motivation that is lost when they are doing a job that they do not find particularly fulfilling.
Organisations have much to gain by looking beyond pure reward to the wider employee value proposition. This means an approach that balances financial and non-financial rewards, and pays attention to career development, international experience (strongly valued by millennials) and training. It also means sustaining a corporate culture that reflects the vision for the business and defines the right behaviours, and which is reinforced at every stage of the people process, from development to performance management and reward.
It can be done, of course – but it requires extraordinary leadership.

Executive Directors’ Remuneration – Practices and Trends Report 9
Executive Pay Model – “Sense at last”
10 PwC
The theory underpinning the agency model of executive pay suggests that executive pay should encourage the executive to act as the agent of the shareholder and provide monetary reward aligned to shareholder returns. This has meant that performance pay has grown in prominence, complexity and quantum over the years. However, there is growing disquiet among shareholders and the public around executive pay models and a sense that current pay-for-performance models are not working.
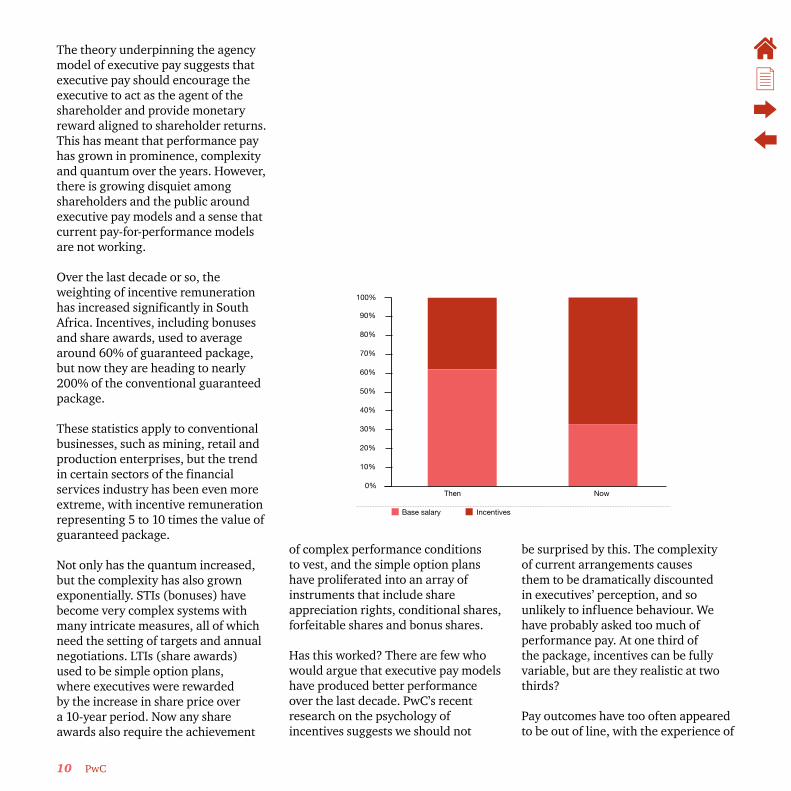
Over the last decade or so, the weighting of incentive remuneration has increased significantly in South Africa. Incentives, including bonuses and share awards, used to average around 60% of guaranteed package, but now they are heading to nearly 200% of the conventional guaranteed package.
These statistics apply to conventional businesses, such as mining, retail and production enterprises, but the trend in certain sectors of the financial services industry has been even more extreme, with incentive remuneration representing 5 to 10 times the value of guaranteed package.
Not only has the quantum increased, but the complexity has also grown exponentially. STIs (bonuses) have become very complex systems with many intricate measures, all of which need the setting of targets and annual negotiations. LTIs (share awards) used to be simple option plans, where executives were rewarded by the increase in share price over a 10-year period. Now any share awards also require the achievement
0%
10%
20%
30%
40%
50%
60%
70%
80%
90%
100%
Then Now
IncentivesBase salary
of complex performance conditions to vest, and the simple option plans have proliferated into an array of instruments that include share appreciation rights, conditional shares, forfeitable shares and bonus shares.
Has this worked? There are few who would argue that executive pay models have produced better performance over the last decade. PwC’s recent research on the psychology of incentives suggests we should not
be surprised by this. The complexity of current arrangements causes them to be dramatically discounted in executives’ perception, and so unlikely to influence behaviour. We have probably asked too much of performance pay. At one third of the package, incentives can be fully variable, but are they realistic at two thirds?
Pay outcomes have too often appeared to be out of line, with the experience of

Executive Directors’ Remuneration – Practices and Trends Report 11
investors leading to open distrust being expressed by shareholders, politicians and the media. Many companies are spending money on pay arrangements that are not valued by executives and attract criticism from all sides.
There is a growing consensus around the need for simplification. There could even be an opportunity for a ‘grand bargain’ between shareholders and companies on executive pay. This could involve:
• greater certainty for executives through lower pay volatility and more predictable performance measurement,
in exchange for
• reduced maximum quantum, and
• extended vesting or holding periods and shareholding requirements.
These features would increase transparency and alignment while at the same time reducing complexity and quantum. If implemented correctly, they represent a significant win for management and shareholders alike. One size does not fit all, but this approach merits consideration in a number of circumstances.
The Limitations of the Current Executive Pay Model
The awareness that the complexity of executive pay is dysfunctional has been with us for a while. In the 2006 PwC Executive Compensation Review we stated that:
“[Long-term incentive] plans are just too complex. Additionally, the performance conditions demanded by shareholders and the ‘market’ do not always provide a robust link between reward and the creation of superior shareholder returns over a sustained period. Payments from long-term incentives can be infrequent and seemingly erratic. As a result, the value executives place on long-term incentives is far below the fair value calculated for accounting purposes.
Lovers of irony will appreciate the fact that performance conditions intended to enhance alignment between reward and performance in some respects achieve the opposite. Is this yet another manifestation of the law of unintended consequences? It certainly seems that the combined goals of alignment, simplification and improved motivation can be achieved by changing long-term incentive designs.
In a mature business…the annual measurement approach arguably works better, with long-term alignment achieved through stock ownership and deferral of annual awards into stock.”
12 PwC
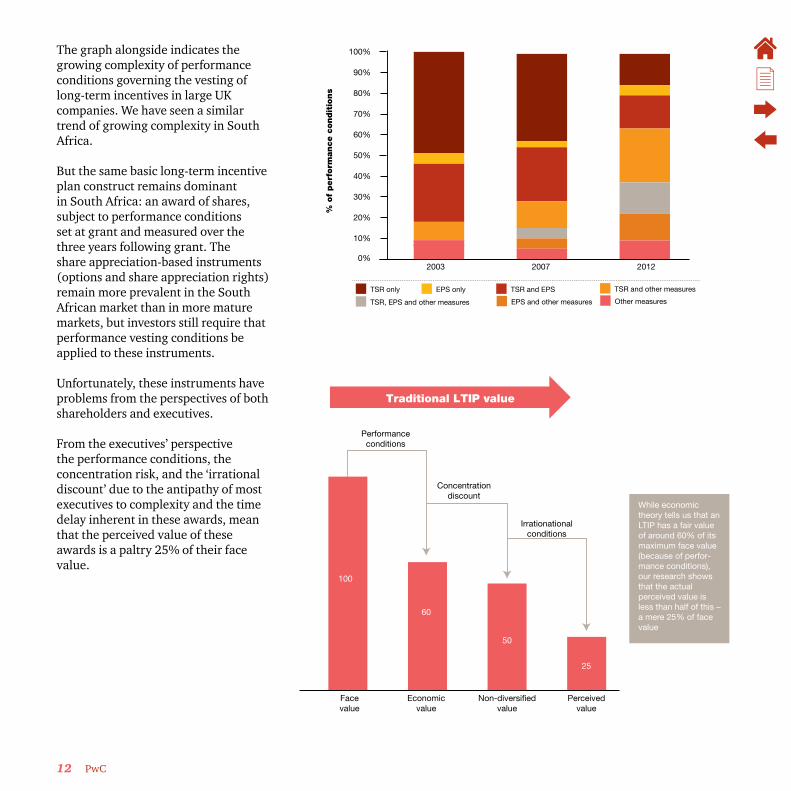
The graph alongside indicates the growing complexity of performance conditions governing the vesting of long-term incentives in large UK companies. We have seen a similar trend of growing complexity in South Africa.
But the same basic long-term incentive plan construct remains dominant in South Africa: an award of shares, subject to performance conditions set at grant and measured over the three years following grant. The share appreciation-based instruments (options and share appreciation rights) remain more prevalent in the South African market than in more mature markets, but investors still require that performance vesting conditions be applied to these instruments.
Unfortunately, these instruments have problems from the perspectives of both shareholders and executives.
From the executives’ perspective the performance conditions, the concentration risk, and the ‘irrational discount’ due to the antipathy of most executives to complexity and the time delay inherent in these awards, mean that the perceived value of these awards is a paltry 25% of their face value.
0%
10%
20%
% o
f perf
orm
ance c
ondit
ions
30%
40%
50%
60%
70%
80%
90%
100%
2003 20122007
TSR only EPS only TSR and EPS TSR and other measures
TSR, EPS and other measures EPS and other measures Other measures
Facevalue
Performanceconditions
Concentrationdiscount
Economicvalue
Non-diversifiedvalue
Perceivedvalue
100
60
50
25
Irrationationalconditions
Traditional LTIP value
While economic theory tells us that an LTIP has a fair value of around 60% of its maximum face value (because of perfor-mance conditions), our research shows that the actual perceived value is less than half of this – a mere 25% of face value

Executive Directors’ Remuneration – Practices and Trends Report 13
From the shareholders’ point of view, the difficulty in calibrating and setting forward performance conditions has been an issue, yielding some conditions that rapidly become impossible to reach with concomitant executive disillusionment or some that turn out to be too easy to reach and yield gratuitous over-payment.
In summary, the case against traditional LTI plans may be based on the following:
• Poor track record of aligning reward with shareholder returns;
• Volatility of performance being rewarded rather than strong sustained performance;
• Impossible to calibrate reliably;
• Perceived as a lottery by participants; and
• Has led to irrational discounting by executives, so valued at a fraction of their economic cost.
Increasingly, the market is subscribing to the view that all this complexity is not worth it, and a simpler LTI model is needed. Fidelity, Hermes, and the Kay Review have argued for a model based on long-term shareholding to generate alignment. Such a model was most famously adopted by HSBC in 2011.
Although executive shareholding requirements are not yet common in South Africa, there is a growing trend to adopt such measures.
These requirements focus on the holding of vested, unencumbered shares in the company. The quantum is usually measured as a percentage of the executive’s guaranteed package with ranges from 50% to 200% being common. The required percentage increases with seniority, with the CEO being required to hold the highest value as a percentage of guaranteed package.

14 PwC
Features of the New Model
The chart below illustrates the key features of an emerging alternative model for senior executive pay. LTI awards are granted based on pre-grant criteria, probably against a balanced scorecard. Awards are then made in shares, which vest after an extended period, perhaps five years. Over this period, no further performance conditions apply, beyond a clawback condition. At the end of five years shares vest, but possibly with a further holding requirement.
The Pre-Grant Allocation Method
2
+1 +2 +3 +4 +7 +8 +9
BalancedScorecard 1year STImetrics
0
LTI
Bonus
Subject to malus/clawback overvesting period
Retirement
Salary
Award basedon pre-grantperformance
criteria
+5 +6
Vesting Period Subsequent holding period
1
3 4
1 Pre-grant allocation method
2 Quantum
3 Longer vesting period
4 Holding requirement
5 Disclosure
5
Disclosure
1
Three main approaches are being considered by companies for deciding the size of the LTI to be awarded:
• Performance scorecard,
• Fixed grant value, and
• Fixed grant number.
A performance scorecard would typically operate over one year, but could also operate over a three-year look-back period. Normally, a balanced scorecard would apply, with measures based on factors driving long-term sustainable performance, for example:
Financial performance (but with a long-term view on underlying trends),
• Customer,
• People, and
• Risk, compliance, and behaviour.
Typically, a single group scorecard would apply for all participants in the plan, but it would be possible to include, say, a divisional component also, albeit at the cost of greater complexity.
However, some organisations are exploring the idea that, for the most senior people, the performance linkage should be purely through the share price. Under this model, it is viewed as somewhat arbitrary for the board to attempt to make annual performance assessments, at least of executive directors, whose decisions play out over a much longer timeframe. Under this model, a share award is set at a level to deliver an appropriate competitive package, which then adjusts up or down over time with performance as the shares (which are subject to deferral and holding requirements) move in value.
Executive Directors’ Remuneration – Practices and Trends Report 15
A further performance ratchet can be introduced by awarding a fixed number of shares, set for perhaps three to five years, so that the grant value moves in line with the share price. So a fall in share price automatically scales back future compensation as well as awards already made.
Quantum2
Each of the approaches has its merits. However, we believe that many organisations will wish to retain some direct incentive and performance linkage, and that a performance-scorecard approach may well be most common and will generally be favoured by shareholders. Although multi-year scorecards (e.g. look-back over three years) have attractions, in our experience most organisations exploring this model revert to a
one-year scorecard, for the following reasons:
• Avoids the confusion of over-lapping and potentially conflicting scorecards and so is much simpler;
• Avoids transition problems with new joiners being held accountable for performance to which they have not contributed; and
• A single-year scorecard maximises remuneration committee control over the total pay outcome for the year.
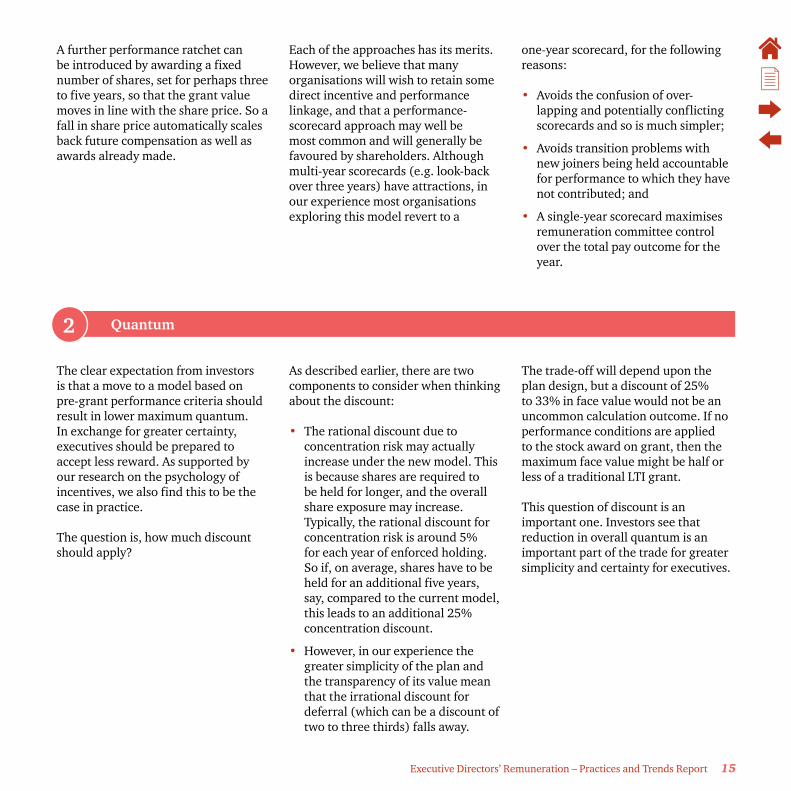
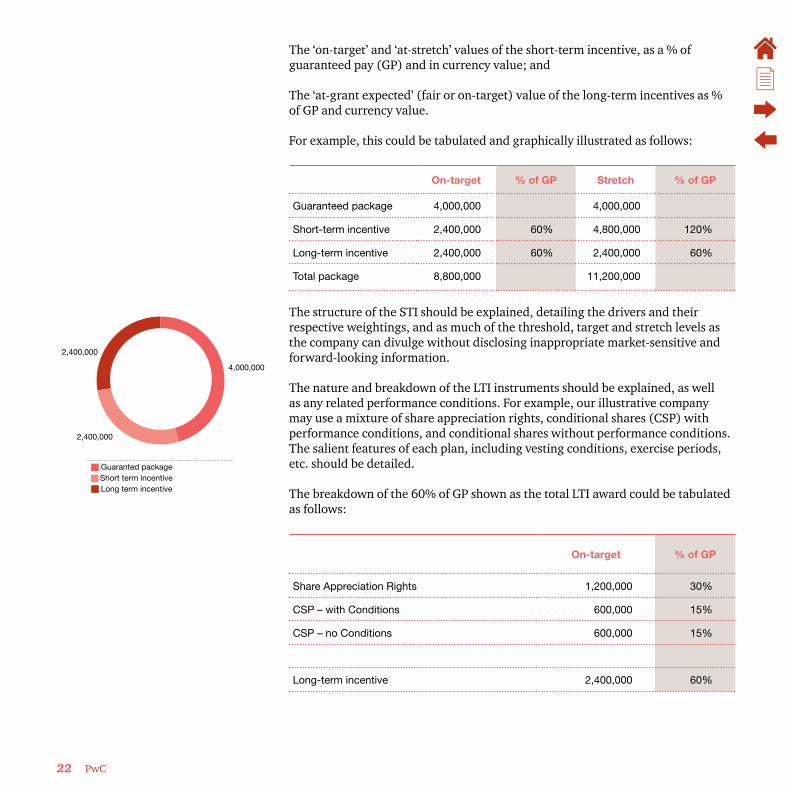
The clear expectation from investors is that a move to a model based on pre-grant performance criteria should result in lower maximum quantum. In exchange for greater certainty, executives should be prepared to accept less reward. As supported by our research on the psychology of incentives, we also find this to be the case in practice.
The question is, how much discount should apply?
As described earlier, there are two components to consider when thinking about the discount:
• The rational discount due to concentration risk may actually increase under the new model. This is because shares are required to be held for longer, and the overall share exposure may increase. Typically, the rational discount for concentration risk is around 5% for each year of enforced holding. So if, on average, shares have to be held for an additional five years, say, compared to the current model, this leads to an additional 25% concentration discount.
• However, in our experience the greater simplicity of the plan and the transparency of its value mean that the irrational discount for deferral (which can be a discount of two to three thirds) falls away.
The trade-off will depend upon the plan design, but a discount of 25% to 33% in face value would not be an uncommon calculation outcome. If no performance conditions are applied to the stock award on grant, then the maximum face value might be half or less of a traditional LTI grant.
This question of discount is an important one. Investors see that reduction in overall quantum is an important part of the trade for greater simplicity and certainty for executives.
16 PwC
Longer Vesting Period
Facevalue
Performanceconditions
Concentrationdiscount
Economicvalue
Non-diversifiedvalue
Perceivedvalue
100
60
50
25
Irrationationalconditions
Facevalue
Performanceconditions
Concentrationdiscount
Economicvalue
Non-diversifiedvalue
Perceivedvalue
35 35
50
100
Irrationationalconditions
Traditional LTIP value New model
Suggests the face value under new model might be circa one-quarter to one-third lower than under traditional model
3
Five is the new three. For the past decade, three years have emerged as the shortest period that investors will accept as long-term, thus proving the appearance of compromise between investors and executives. There is now an increasing consensus among investors that three years are not long enough for the consequences of senior management decisions to play out fully and that some form of performance accountability should be retained for a five-year period.
This does not necessarily mean five-year performance periods, but in shareholders’ minds it does mean that exposure to share price, and possibly claw-back, should extend for five years.
While executives might feel that five years are a long time, at the most senior levels our view is that five-year vesting is a reasonable trade for the certainty and transparency provided by performance on grant, provided that forfeiture requirements during the vesting period are not too onerous.
One key design question is whether a performance underpin should apply during the five-year vesting period, beyond a general claw-back clause. Investors have pushed for underpins such as:
• Minimum level of dividend growth,
• Positive economic profit,
• Credit quality underpin,
• Minimum profitability requirement, and
• Minimum share price.
Our view is that this type of performance underpinning should not apply (or if there must be an underpin, it should take the form of a non-formulaic ‘sense check’ by the remuneration committee). Claw-back should apply in extreme cases, but having a formulaic underpinning measure undermines the point of the entire model. The model creates alignment through shareholding, and its simplicity and transparency enable a materially reduced maximum quantum.

Executive Directors’ Remuneration – Practices and Trends Report 17
In particular, our research into the psychology of incentives increasingly persuades us that complexity, uncertainty, and ambiguity can combine to create a tipping point into irrational discounting, at which point executives write down the value of awards quite drastically. If this tipping point is passed, then the entire construct of the new model falls apart. Where the tipping point sits will vary by organisation and executive population – but cross it at your peril.
In our view it is better to award less in the first place (so reducing maximum quantum) and, if necessary, to address
the underpin issue by having elements of the scorecard on grant that are only triggered when certain minimum standards apply, such as zero economic profit.
A final observation: We believe that with five-year vesting and reduced quantum, there should be no pro-rating for time for good leavers. With five-year vesting, time pro-rating results in the loss of the equivalent of two full years’ LTI awards, which is too drasticin our view. Second, pro-rating for time results in LTI playing a declining role in the package as retirement is approached. Yet this is
exactly the point at which you want senior leaders to be focused on their long-term legacy.
Philosophically we are of the view that under this model the purpose of deferral is to create accountability (through share linkage and claw-back) for the long-term consequences of decisions made today.
The long-term incentive is part of current-year compensation and should not be pro-rated on retirement, so that executives reap the fruits of their legacy, good or bad.
Holding Requirements4
The objective of the new model is to create large shareholdings, held for an appropriate period of accountability. This is the basis of alignment with performance and with shareholders.
‘Hold-to-retirement’ has become a popular way of referring to this. Under this model all vested shares, or a portion thereof, have to be held until the individual leaves the business. However, if interpreted literally, the approach does have disadvantages:
• Hold-to-retirement treats people differently according to their age and career profile, and has more far-reaching consequences for a 40-year-old executive, for example, than for a 60-year-old one.
• The build-up of stock may create excessive concentration risk with unintended consequences – people may feel forced to retire just to
create liquidity and reduce risk.
• Allowing the sale of all shares on retirement has the consequence that individuals can ‘retire away from a problem’ that they see emerging.
The phased release of shares may have benefits in this regard. For example, 20% of shares could be released each year after vesting, regardless of whether the individual has retired or not. This still guarantees a long period of linkage to the share price, and in particular ensures greater holding after the executive has left the business. But it also enables some liquidity during employment and ensures that people are not treated differently based on age or whether or not they retire. An alternative but similar model is that vested shares could go into a bank, with a portion thereof being released each year.
Some companies have suggested, in their shareholder guidelines, that there should be no share sales for 10 years and thereafter only 5% per annum while in employment. Sale, if so desired, should be structured into three tranches ending four years after departing as a good leaver. We believe that this approach will prove too burdensome for executives and results in too great a concentration risk discount. Greater liquidity is required for executives.
As an alternative, a strictly enforced shareholding requirement could be adopted. Under this regime, the executive would not be allowed to sell any shares until the shareholding requirement has been met, and the requirement would be substantially higher than is currently typical – perhaps four to six times the guaranteed package.

18 PwC
Disclosure5
One concern of shareholders is that the performance-on-grant model places significant discretion in the hands of remuneration committees. Shareholders feel that this discretion has not always been exercised robustly, such as in the case of annual bonuses, where we have seen a gradual increase in the percentage of maximum that is typically paid out.
As a result, investors, reasonably, demand a high degree of disclosure when LTIs are moved to a performance-on-grant model. When
adopting such a model, remuneration committees should ensure that the following criteria are complied with:
• There should be clarity about the metrics (and, where possible, the targets) that are used to assess grant levels.
• This transparency should apply both prospectively for the year ahead and retrospectively for the year just gone.
• Any decision made on performance should be supported by an extensive explanation, including the description of any discretion that was exercised.
• For the sake of shareholder comfort, it is likely that at least part of the scorecard will need to be based on explicit financial measures with an absolute performance standard so shareholders can be confident about the link between pay and performance.
With this degree of disclosure, the model actually facilitates a very open dialogue with shareholders about how the remuneration committee has assessed performance. This can result in sufficiently transparent disclosure about the link between pay and performance.
If shareholders are concerned about the quality of disclosure, they will have more opportunity than ever to register any discontent – not only will they be able to vote separately on remuneration policy and outcomes, they could also vote against the re-election of individual directors. Remuneration committees need to earn the necessary trust before adopting a model that gives them more control.

Executive Directors’ Remuneration – Practices and Trends Report 19
Extending the Model
For executive directors, it could be argued that there is no need for both bonuses and LTIs under the new model, particularly if the long-term incentive is measured on an annual scorecard. One radical approach could therefore be to remove the bonus component entirely and award all incentives through the new LTI structure. Alternatively, the bonus could be replaced by a fixed award of shares vesting over five years, so that the share award has both fixed and performance-on-grant components.
Such an extension could remove some of the angst that currently exists around bonus assessments. And it can certainly be argued that annual bonuses do not extend over a long enough timeframe for remuneration committees to assess the performance of executive directors properly.
Below board level it is likely that companies may wish to retain the flexibility to make different short- and long-term performance decisions, particularly when short-term performance might relate more to an individual’s area of accountability (their division for example), with the long-term plan providing alignment to group performance.
What Will Shareholders Think?
We believe that there is widespread support among shareholders for the principles underlying this type of plan – and indeed the general level of acceptance is higher now than it was when HSBC introduced their version of this model in 2011. That said, investors are not a homogenous body – views are not uniform and they are still evolving. To some extent, shareholders’ reaction to the model will depend on their experience with the company introducing it – do they trust the remuneration committee to operate a balanced scorecard robustly and with sufficiently flexible targets?
The crucial features that we believe shareholders will be looking for and that will be needed to get a strong level of shareholder support are as follows:
• There should be a meaningful reduction in quantum.
• Most investors are supportive of the use of a balanced scorecard to determine quantum (though a small number object to balanced scorecards on principle).
• The scorecard needs to be rigorous and flexible, with a higher quantum requiring greater stretch.
• The vesting period should be at least five years, with either a further holding period beyond that or a significant shareholding requirement.
• A number of investors may want to see a performance underpin during the vesting period (perhaps based on dividends or economic profit).
Above all, investors’ views will be coloured by the level of trust they have in the remuneration committee – do they trust them to set appropriate targets, measure them robustly, apply their discretion appropriately and then explain openly and honestly why they reached their decisions? If they do, they should support this type of pay model.
Conclusion
One size does not fit all, but we do believe that a performance-on-grant model combined with longer vesting and enhanced shareholding requirements creates a significantly better norm than the current model.
What would the new model lead to in many companies?
• Reduced complexity;
• Higher perceived value in the hands of executives;
• Improved control for remuneration committees;
• More transparency for investors;
• Lower executive pay; and
• Less work for pay consultants.
Now who can argue with that?
[Adapted from “Sense at Last – Executive Pay Models for the Long Term”, January 2013 – www.pwc.co.uk]

20 PwC
The Ethics of Pay – Executive Pay Disclosure

Executive Directors’ Remuneration – Practices and Trends Report 21
There is still a great deal of emotion and controversy surrounding executive pay, with payments to executives amounting to many multiples of workers’ pay. Yet countervailing market forces appear to make it difficult to implement substantial reductions in executive remuneration.
Shareholder focus remains on ensuring:
• Pay for performance and alignment with shareholder goals, and
• Enhanced disclosure, so that shareholders can understand the quantum, rationale and drivers of executive awards and payments.
The other chapters in this publication focus on the correlation between executive pay and performance, and on a new executive pay model which aspires to provide better alignment with shareholder goals. To complete the picture, this article examines enhancements to executive pay disclosure. In particular, we will focus on:
• Communication of the design of the package in both the first and second parts of the remuneration report, where the first part deals with policy and the second with outcomes;
• Better disclosure of the drivers of STI payouts and inclusion of a scenario analysis of potential outcomes, and their correlation with related profits and other outcomes; and
• An approach to the disclosure of LTI awards which allows the reader to follow the value of share awards through their full (and complex) life cycle, and judge their correlation with the performance of the company.
The Two-Part Remuneration Report
The practice of separating the remuneration report into two parts, where the first part articulates the company’s reward policy and the second documents the outcomes of the policy for this year in line with actual performance, is gaining traction. The first section is the subject of the annual non-binding vote on the remuneration policy in South Africa. In the UK and other jurisdictions the vote is becoming binding, and the remuneration committee is required to operate within the structures and parameters it has communicated in advance to shareholders.
Part 1 - Explaining the Package Design
One of the important aspects that a company should communicate in the first section of its remuneration report is the design of its executive packages. This section should document the structure of the package and specify the following:
The annualised value of the guaranteed package – this is usually the monthly package during the last month of the financial year times 12. This may well differ from the actual amount paid if a CEO was appointed during the year, and if the increase took place partway through the year;
22 PwC
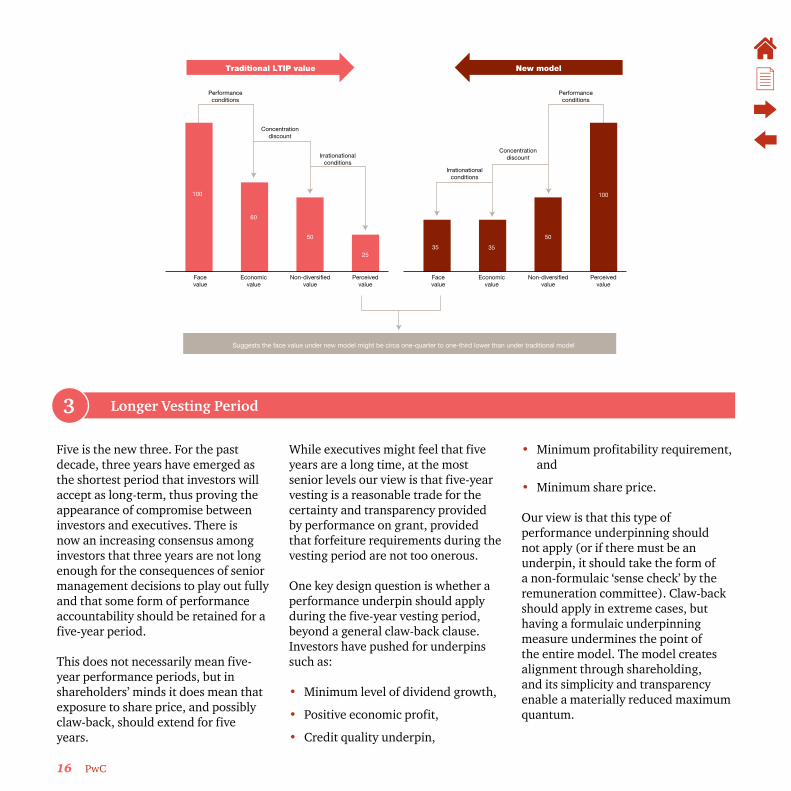
The ‘on-target’ and ‘at-stretch’ values of the short-term incentive, as a % of guaranteed pay (GP) and in currency value; and
The ‘at-grant expected’ (fair or on-target) value of the long-term incentives as % of GP and currency value.
For example, this could be tabulated and graphically illustrated as follows:
On-target % of GP Stretch % of GP
Guaranteed package 4,000,000 4,000,000
Short-term incentive 2,400,000 60% 4,800,000 120%
Long-term incentive 2,400,000 60% 2,400,000 60%
Total package 8,800,000 11,200,000
The structure of the STI should be explained, detailing the drivers and their respective weightings, and as much of the threshold, target and stretch levels as the company can divulge without disclosing inappropriate market-sensitive and forward-looking information.
The nature and breakdown of the LTI instruments should be explained, as well as any related performance conditions. For example, our illustrative company may use a mixture of share appreciation rights, conditional shares (CSP) with performance conditions, and conditional shares without performance conditions. The salient features of each plan, including vesting conditions, exercise periods, etc. should be detailed.
The breakdown of the 60% of GP shown as the total LTI award could be tabulated as follows:
On-target % of GP
Share Appreciation Rights 1,200,000 30%
CSP – with Conditions 600,000 15%
CSP – no Conditions 600,000 15%
Long-term incentive 2,400,000 60%
2,400,000
2,400,000
4,000,000
Guaranted package
Long term incentiveShort term incentive
Executive Directors’ Remuneration – Practices and Trends Report 23
One further missing link is the ratio between the on-target value and the face value of awards made, which allows the reader to track how the policy turned into an actual grant. For example, if the company discloses that the on-target value of the performance share is 60% of the face value of the award, then the reader can work out that:
On-target value of the performance shares = On-target grant value x GP = 15% x R4,000,000 = R600,000
Given the disclosed on-target value of 60% and a share price at grant of R10, the number of performance shares awarded is:
Number of performance shares = On-target value/(60% x R 10) = R600,000 / R6 = 100,000 shares
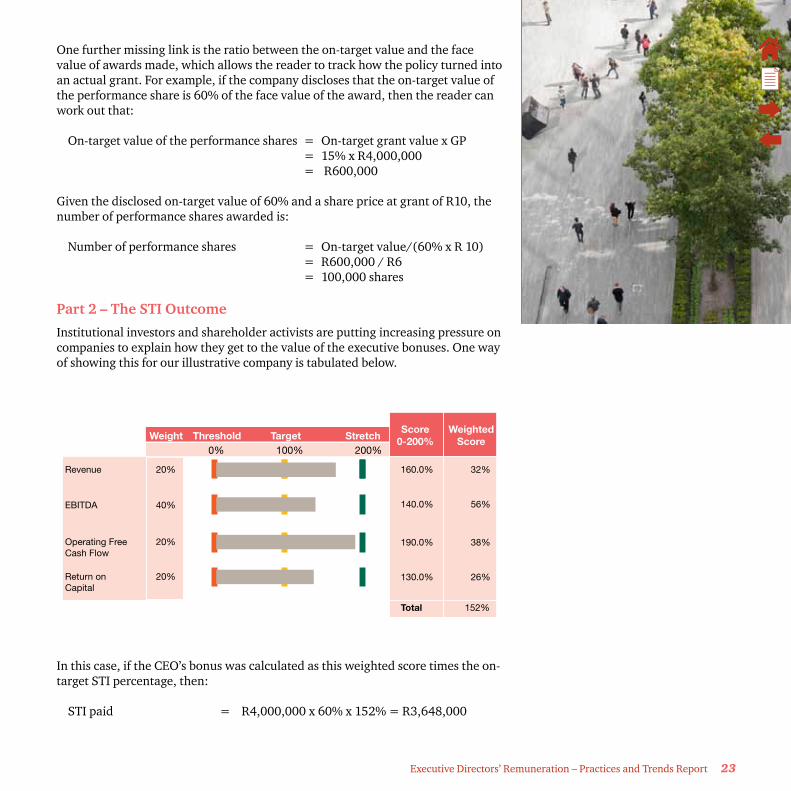
Part 2 – The STI Outcome
Institutional investors and shareholder activists are putting increasing pressure on companies to explain how they get to the value of the executive bonuses. One way of showing this for our illustrative company is tabulated below.
In this case, if the CEO’s bonus was calculated as this weighted score times the on-target STI percentage, then:
STI paid = R4,000,000 x 60% x 152% = R3,648,000
Weight
Revenue 20% 160.0% 32%
140.0% 56%
190.0% 38%
130.0% 26%
Total 152%
EBITDA 40%
Operating FreeCash Flow
20%
Return onCapital
20%
Threshold Target StretchScore
0-200%Weighted
Score100%0% 200%
24 PwC
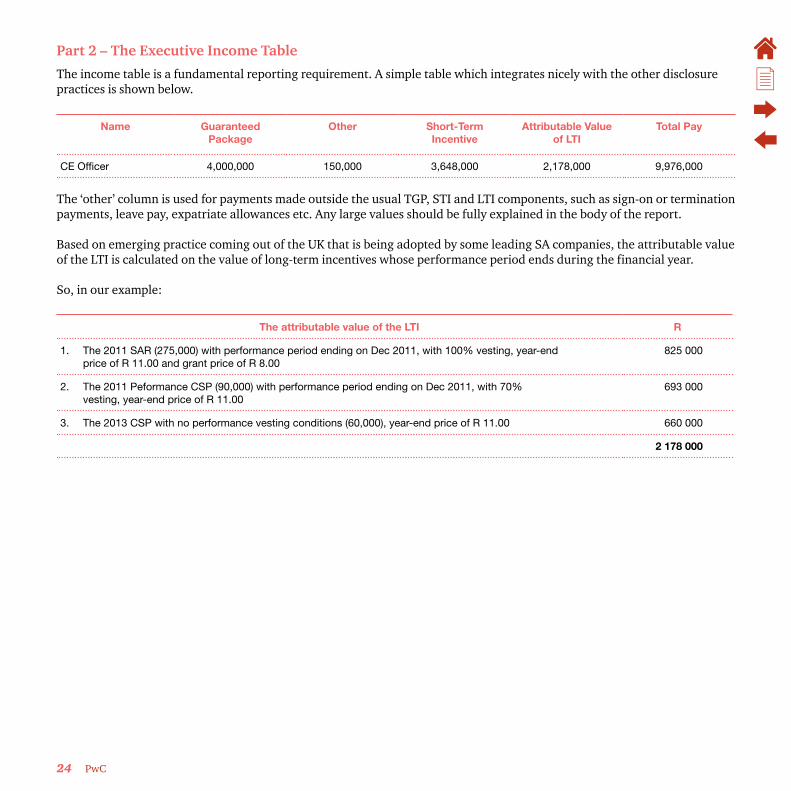
Part 2 – The Executive Income Table
The income table is a fundamental reporting requirement. A simple table which integrates nicely with the other disclosure practices is shown below.
Name Guaranteed Package
Other Short-Term Incentive
Attributable Value of LTI
Total Pay
CE Officer 4,000,000 150,000 3,648,000 2,178,000 9,976,000
The ‘other’ column is used for payments made outside the usual TGP, STI and LTI components, such as sign-on or termination payments, leave pay, expatriate allowances etc. Any large values should be fully explained in the body of the report.
Based on emerging practice coming out of the UK that is being adopted by some leading SA companies, the attributable value of the LTI is calculated on the value of long-term incentives whose performance period ends during the financial year.
So, in our example:
The attributable value of the LTI R
1. The 2011 SAR (275,000) with performance period ending on Dec 2011, with 100% vesting, year-end price of R 11.00 and grant price of R 8.00
825 000
2. The 2011 Peformance CSP (90,000) with performance period ending on Dec 2011, with 70% vesting, year-end price of R 11.00
693 000
3. The 2013 CSP with no performance vesting conditions (60,000), year-end price of R 11.00 660 000
2 178 000
25Executive Directors’ Remuneration – Practices and Trends Report 25
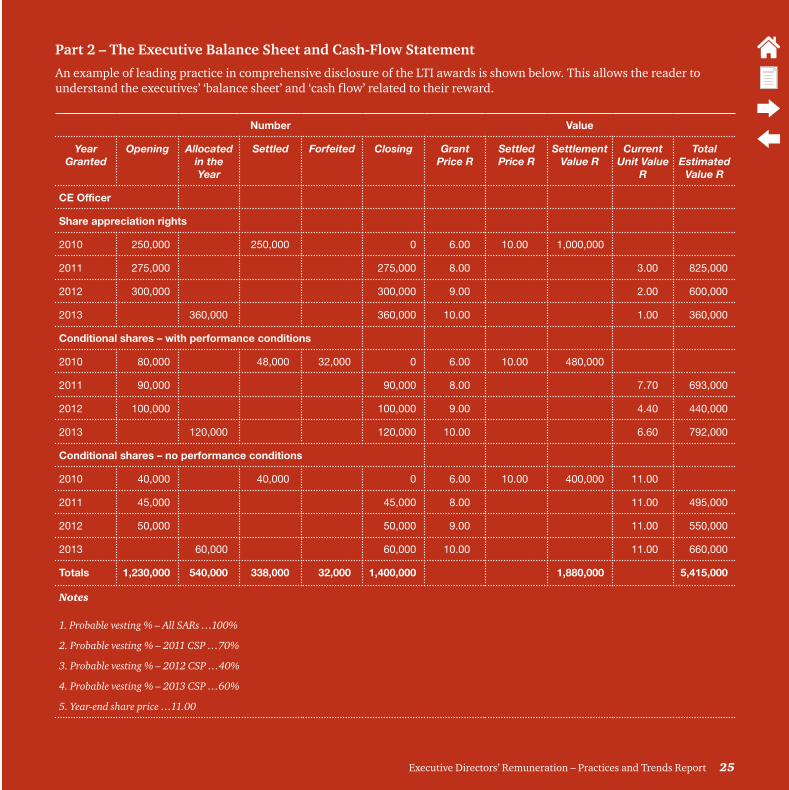
Part 2 – The Executive Balance Sheet and Cash-Flow Statement
An example of leading practice in comprehensive disclosure of the LTI awards is shown below. This allows the reader to understand the executives’ ‘balance sheet’ and ‘cash flow’ related to their reward.
Number Value
Year Granted
Opening Allocated in the Year
Settled Forfeited Closing Grant Price R
Settled Price R
Settlement Value R
Current Unit Value
R
Total Estimated
Value R
CE Officer
Share appreciation rights
2010 250,000 250,000 0 6.00 10.00 1,000,000
2011 275,000 275,000 8.00 3.00 825,000
2012 300,000 300,000 9.00 2.00 600,000
2013 360,000 360,000 10.00 1.00 360,000
Conditional shares – with performance conditions
2010 80,000 48,000 32,000 0 6.00 10.00 480,000
2011 90,000 90,000 8.00 7.70 693,000
2012 100,000 100,000 9.00 4.40 440,000
2013 120,000 120,000 10.00 6.60 792,000
Conditional shares – no performance conditions
2010 40,000 40,000 0 6.00 10.00 400,000 11.00
2011 45,000 45,000 8.00 11.00 495,000
2012 50,000 50,000 9.00 11.00 550,000
2013 60,000 60,000 10.00 11.00 660,000
Totals 1,230,000 540,000 338,000 32,000 1,400,000 1,880,000 5,415,000
Notes
1. Probable vesting % – All SARs …100%
2. Probable vesting % – 2011 CSP …70%
3. Probable vesting % – 2012 CSP …40%
4. Probable vesting % – 2013 CSP …60%
5. Year-end share price …11.00
26 PwC
The major points to note from this simple-looking table are that:
• All numbers and values associated with all outstanding instruments are summarised per incumbent, rather than having one table for share appreciation rights, another for performance shares and so on. This is viewed as good practice, because it gives the full picture in terms of grants, cash flows and total outstanding value for each executive.
• The table gives the reader a good understanding of both the ‘balance sheet’ and ‘cash-flow statement’ of the CEO. The year-end balance of estimated value at the bottom right is a great indicator of the net value of all outstanding awards that will turn into cash value within the next few years. This is very similar to a total reward statement for the CEO, without some of the more personal figures such as their pension or provident fund balances.
• The total of the ‘settlement value’ column shows the cash flow to the CEO as a result of the settlement of vested awards. This generally occurs in the year following the recording of the accrual of these awards in the ‘income table’. For example, the 2010 instruments that are settled this year were recorded as income in prior years, but the 2011 SARS and performance shares remain on the ‘balance sheet’ at year-end even though they are recorded as income this year.
• The value of the performance shares is based on the updated probable vesting percentages and the year-end share price.
• The value of the share appreciation rights is based on the grant price, the updated probable vesting percentages and the year-end share price.
• You can easily track the numbers of instruments granted, forfeited and settled in the year.
Conclusion
The emerging remuneration disclosure practices that we have discussed are helpful in addressing the ethics of executive pay. These practices include:
• The two-part remuneration report, with the first part explaining the reward policy and the package design, and the second explaining what was paid based on performance in the financial year;
• A clear explanation of the package design for each disclosed executive, including the quantum of TGP, the on-target percentages for STI and LTI, and the structure of and performance conditions for the STI and all LTI instruments granted; and
• A detailed and defensible tabulation of the ‘income statement’, ‘balance sheet’ and ‘cash flow’ resulting from the actual application of the reward policy based on performance in the year. We have provided examples of disclosure practices we believe to be helpful.

Executive Directors’ Remuneration – Practices and Trends Report 27
Governance Update
28 PwC
South African Perspective
The Institute of Directors (‘IOD’) recently issued updated practice notes on King III remuneration principles (King III Remuneration Practice Notes 2013 – ‘the Practice Notes’). The Practice Notes mostly provide more detail on the interpretation and application of existing recommended practice. However, in limited instances they provide guidance on areas where it did not exist before, for example the terms of reference of remuneration committees, and they also contain a template that remuneration committees can use to draft their own Terms of Reference. In terms of the responsibilities of remuneration committees, the Practice Notes provide that they are required to –
• Review at least annually the terms and conditions of service agreements for executives and determine the policy for and scope of service agreements for executives;
• Enter into dialogue with shareholders; and
• Oversee advice from management for onward recommendation to the board.
It is interesting to note that considerable focus has been placed on executives’ terms of employment, as this was addressed in the context of remuneration committees’ terms of reference as well as in the context of termination payments. The Practice Notes namely provide that –
• Employment contracts should be so worded that companies are not obliged to pay special severance or compensation on termination of employment contracts arising out of either failure to perform or underperformance against contracted objectives;
• Employment contracts should provide differentiated notice periods for different reasons for termination, for example incapacity, dismissal, resignation, retirement, retrenchment or redundancy, and link appropriate notice periods to the different reasons for termination of service; and
• Where standard employment contracts commit companies to extended notice periods in the event of termination through disciplinary action, consideration should be given to amending the contract templates.
It is therefore anticipated that companies which do not already have formalised terms of reference for remuneration committees will make this a priority. The review and amendment of executives’ employment agreements to fit within the parameters set for termination payments, notice periods, restraint of trade etc. is also expected to receive attention from remuneration committees. Termination payments to executives remain a heated topic in the press, and in South Africa the practice of making termination payments is still quite common.
Other additions in terms of the King III Remuneration Practice Notes 2013 are –
• In finalising bonus payments, an element of discretion should be considered to mitigate unintended consequences.
• It is advised that ‘stress testing’ of likely payouts be introduced to ensure affordability and alignment with shareholder value creation.
• The retention element of long-term incentives (i.e. the part of the reward not subject to performance conditions) should be distinguished from the rest of the award and properly disclosed. At senior levels the weighting should favour performance awards rather than retention awards.

Executive Directors’ Remuneration – Practices and Trends Report 29
Financial Services
The financial services industry remains the most regulated industry with regard to executive remuneration. This is due partly to the higher earning potential for managers and executives with regard to variable pay and partly to the aftermath of the global financial crisis and the governance structures put in place in response thereto.
Banking
The European Commission’s Fourth Capital Requirements Directive (‘CRD IV’) may be applicable to some South African financial institutions. CRD IV proposals carry over the existing provisions of the current Capital Requirements Directive relating to remuneration, but they also introduce additional transparency and disclosure requirements for certain individuals that earn more than EUR 1 million per year.
In addition, the CRD IV includes provisions for a cap on variable pay as a portion of fixed pay. The provisions will apply to payments relating to services provided as from 1 January 2014, with the capping of variable pay provisions applying to ‘code staff’ only. Code staff are defined in terms of the Financial Services Authority’s (‘FSA’) Code on Remuneration as any employee who has a significant influence function. It includes senior staff, all staff whose remuneration takes them into the same bracket as senior managers and risk takers whose professional activities have a material impact on the company’s risk profile.
• Long-term incentive awards should be disclosed as value at grant, value of all unvested/unexercised historical awards at current expected value, and value realised from all awards vested or exercised during the year under review.
• The long-term incentive plan rules will apply with regard to vesting of shares in the event of change of control. Therefore, these rules have to be worded correctly to not provide for automatic vesting of long-term incentives.
It is clear that the updated Practice Notes are aimed at taking remuneration governance and disclosure to the next level in South Africa, without introducing legislation as is the case in the United Kingdom.
For many companies the updates are merely a confirmation of their current practice. However, for companies still falling short of these guidelines, increased visibility of institutional investors’ policy on voting, as disclosed in terms of the Code for Responsible Investing in South Africa (‘CRISA’), may result in negative shareholder sentiment and press coverage which could have been avoided with timely planning and shareholder engagement.
It is proposed that:
• Variable pay be capped at 100% of fixed pay, unless shareholder resolution is obtained to increase the individual cap to 200% of fixed pay;
• Such a resolution must be passed by a super-majority of 66% of shareholders, unless fewer than 50% of the shares are voted, in which case a 75% majority is needed; and
• For purposes of calculating the maximum ratio, the use of deferred and long-term form instruments (like restricted shares) is encouraged by providing a notional discount factor up to 25% of total variable remuneration, provided it is paid in instruments which are deferred for more than five years.
The European Banking Authority (‘EBA’) is in the process of producing guidance on the appropriate discounted valuation that regulators may apply in relation to this discount. At best, this is only likely to increase the effective maximum ratio to between 200% and 250%.
Also, the EBA is developing draft regulatory standards with respect to appropriate criteria to identify the staff to which these capping provisions are applicable.

30 PwC
Banks are considering a wide range of designs for pay in response to CRD IV. However, we expect some of the responses to be –
• More fixed pay, partly or wholly paid in shares;
• Lengthened deferral of the variable pay that remains; and
• Greater use of claw-back rights over deferred pay in situations where performance only warrants pay below the increased fixed pay component.
Asset Management
In March 2013, a European Parliamentary committee proposed that fund managers’ bonuses be limited to no more than base salaries. Although the spokesperson for the European Parliament agreed that the bonus cap might push up fixed pay, he contended that such an increase would have to be justified to investors. Therefore, total pay would certainly shrink.
However, concern was expressed by industry analysts in this regard. The feeling is that such a cap could create the risk of companies developing unstable cost structures as they may have to double fixed salaries to sidestep the proposed European Parliament’s bonus caps. Also, it may cause a bidding war for the industry’s best-performing employees, increasing fixed costs and making the industry more vulnerable to market downturns.
Initial proposals also indicated that the variable-to-fixed-pay ratio may be expanded to 2 to 1 if investors voted to approve awards larger than fixed pay, mirroring the planned rules on bankers’ bonuses.
Currently the European Parliament is still wrestling with the issue of bonus caps for fund managers. Opposition from German and United Kingdom members has stayed a vote to cap fund managers’ bonuses, but this proposal remains on the table. Developments in this area should be watched closely, as they may have consequences for South African asset managers as well.
Other Global Developments
UK Sales Commission
At the end of last year, the UK Financial Services Authority (‘FSA’) issued a paper on the risk to customers from incentives earned in selling financial services products. The review was conducted across a variety of authorised firms, including banks, building societies, insurance companies and investment firms.
The main finding of the review was that most firms do not properly identify how their incentive schemes might encourage staff to mis-sell. This suggests that they had not sufficiently thought about the risks to their customers or had turned a blind eye to them.
The paper identified various triggers for mis-selling, for example accelerators or inappropriately leveraged schemes, and disproportionate rewards for cross-selling of, for example, protection products, regardless of clients’ needs.
The effective controls and governance principles provided by the FSA to curb mis-selling are:
• Robust risk-based business quality monitoring and adequate controls to mitigate the risk of inappropriate behaviour during sales conversations;
• Sufficient management information to identify, and act upon, trends or patterns in the activities of individual sales staff that could indicate an increased risk of mis-selling;
• Proper management of sales managers’ conflicts of interest;
• Effective oversight of incentive schemes by appropriate senior management, including approval of the incentive schemes; and
• An effective risk identification and mitigation process, including regular reviews of incentive schemes and the effectiveness of controls, taking into account customers’ interests.
Recourse in terms of this regulation includes referring companies to the FSA Enforcement and Financial Crime Division.

Executive Directors’ Remuneration – Practices and Trends Report 31
Minder Initiative
On 3 March 2013, the Swiss public voted in favour of the ‘Minder Initiative’ by a majority vote of 68%. As a result of the Minder Initiative, Switzerland will be introducing what is one of the strictest regulations on executive remuneration and corporate governance in the world.
The companies affected by this are:
• All Swiss companies whose shares are quoted on a Swiss or overseas stock exchange;
• Their governing bodies (board of directors, executive management and advisory board); and
• Their shareholders (including approximately 2,000 pension funds).
The major changes can be summarised as follows:
• Shareholders will have a vote in the annual general meeting on the total remuneration of the company’s governing bodies.
• Members of the governing bodies may not receive any sign-on bonuses (‘golden hello’), transactional bonuses, severance, change in control or similar payments.
• Pension funds with a direct investment in Swiss companies must vote in their beneficiaries’ best interests and disclose their voting behaviour.
The sanctions for failure to comply with any of the 24 requirements contained in this regulation are harsh: imprisonment (up to three years) and a fine (up to six times the annual remuneration bill of the company).
It should be noted that although the Minder Initiative gives shareholders significant power in executive remuneration matters, it does not stipulate any caps on executive pay, nor does it affect the remuneration of middle management.
Looking ahead, many of the detailed requirements remain unclear at this stage. The Swiss Federal Council will have one year in which to draft a ‘transitional ordinance’, which will be applicable until the Swiss Parliament passes the new law. It is very likely that the Swiss Parliament will take into account aspects from Parliament’s counter-proposal, which still provides for a prohibition on sign-on bonuses, transactional bonuses and severance, but allows for situations in which shareholders may agree to exceptions. Also, in terms of the counter-proposal the regulation on the ‘say on pay’ shareholder vote is less strict.

32 PwC
Mind the Wage Gap
Executive Directors’ Remuneration – Practices and Trends Report 33
Introduction
This important issue is gaining momentum both locally and globally, with the risk that if not properly understood and dealt with, it could result in regulatory intervention that could have undesired consequences. Employers still need to have flexibility in managing their pay structure, and it would be detrimental to have government or any regulatory body dictating to business how much they should pay their employees. Arguably there is no right or wrong answer, but there are a number of contributing factors that need to be addressed to ultimately achieve a fairer system.
We will not address all these contributing factors as they often relate to political, economic and/or social imbalances that require major intervention. Nevertheless, in this chapter we will at least look at the principles used to calculate the gap and whether or not there is any meaningful comparison to be made in measuring the gap.
In today’s economy and society, inequality is a major cause of suffering, and this is compounded where there is poor government service delivery. Inequality has social as well as economic effects. It has a big impact on community cohesion, and when it reaches extreme levels it creates social unrest. Those at the bottom no longer feel like they have a stake in society and start pursuing their economic objectives outside of the mainstream3.
3 High Pay Commission (2012) Cheques with Balances
It is this state that we need to avoid, and whilst we argue that the gap itself is not the cause, it may be a barometer of where we are.
It is fair to say that the gap between the high-income and low-income earners has widened, and it is worth reviewing this to establish at what level the gap can be tolerated in today’s society – if at all.
To measure the gap, at least two reference points are needed. Below, we look at these two respective reference points separately, namely executive pay and the lowest-paid earner.
Executive Pay
The new Companies Act does not address how directors should be remunerated. Only the approval and disclosure of directors’ remuneration are dealt with in the Act. King III, on the other hand, goes a little further and states that companies should remunerate directors and executives “fairly and reasonably”.
Shareholder activism and institutional investors have once again over the past year been active in lobbying against any excessive payments being made to executive directors. But is this working? The regulatory environment has been busy all over the world over the past decade. Shareholder ‘say-on-pay’, for example, is mandatory for all US-listed companies, following the enactment of the Dodd-Frank Wall Street Reform and Consumer
Protection Act on 21 July 2010. Some companies had already adopted it on a voluntary basis (Hewlett Packard, American Express, et cetera), and banks receiving the American government’s emergency assistance (the Troubled Asset Relief Program) had been subject to it as of the fiscal year 2009.
In 2004, executive pay disclosure was introduced in South Africa, Ireland and Australia. During this ‘greater transparency phase’, in May 2003, the European Union (EU) Commission issued an action plan that recommended that listed companies in the EU should report details on individual executives’ compensation. By 2006, only eight EU members had mandated CEO-level disclosure4. At that time, non-EU members Norway and Switzerland demanded similar disclosure, but only for the highest-paid executive.
While this approach resulted in better disclosure of executive remuneration, globally it has not automatically translated into lower levels of executive remuneration. As a result, the pressure is slowly shifting to the shrinking of the ‘pay gap’ as a means of addressing this issue.
At the executive level (being our first reference point), we believe the objective is to ensure that executive remuneration is pinned at a “fair and equitable level of pay”. Firstly, we will measure the CEO’s level of
4 UK, Ireland, Belgium, France, Germany, Italy, Netherlands, and Sweden
34 PwC
than many people think, and 2012 has seen a material reallocation of returns from employees to shareholders. The report found that this has been in achieved in part because UK investors have well established mechanisms and procedures (either directly or through shareholder bodies) for engaging with bank boards and making their views known on remuneration. Over the last year they have engaged with banks on this issue vigorously and with significant effect.
In South Africa, the median pay for the large-cap CEO in the financial services sector increased by roughly 4.4% in 2012 (R6,247m) compared to 2011 (R5,983m). There is some movement in the right direction, however, in that the rate of increase is generally lower than the average salary increase over the same period. The medium-cap CEO’s pay showed the greatest shift, with the median TGP reducing by 35.1% from R4,712m in 2011 to R3,059m in 2012.
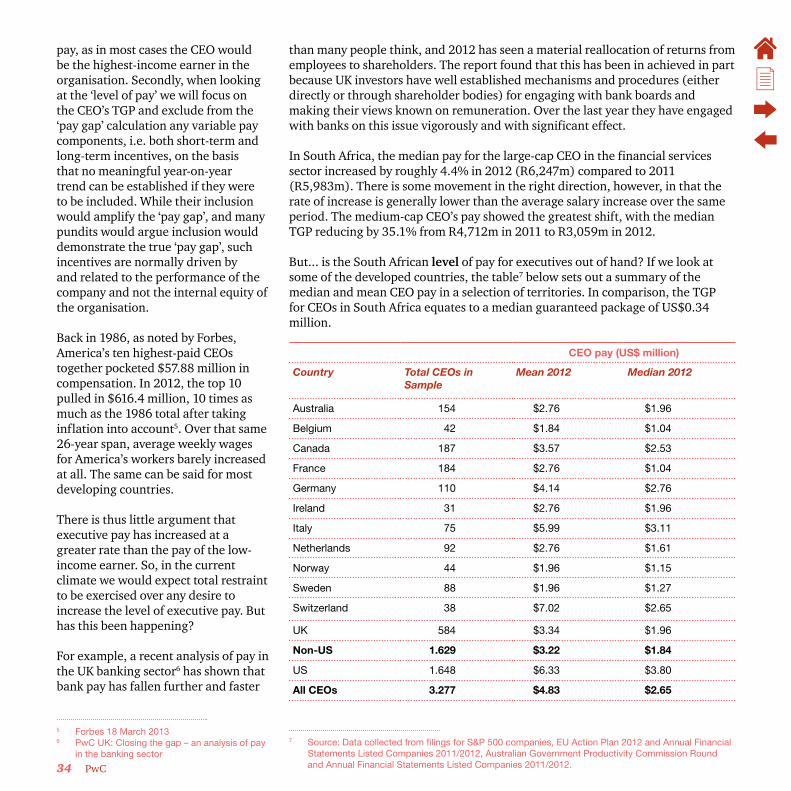
But... is the South African level of pay for executives out of hand? If we look at some of the developed countries, the table7 below sets out a summary of the median and mean CEO pay in a selection of territories. In comparison, the TGP for CEOs in South Africa equates to a median guaranteed package of US$0.34 million.
CEO pay (US$ million)
Country Total CEOs in Sample
Mean 2012 Median 2012
Australia 154 $2.76 $1.96
Belgium 42 $1.84 $1.04
Canada 187 $3.57 $2.53
France 184 $2.76 $1.04
Germany 110 $4.14 $2.76
Ireland 31 $2.76 $1.96
Italy 75 $5.99 $3.11
Netherlands 92 $2.76 $1.61
Norway 44 $1.96 $1.15
Sweden 88 $1.96 $1.27
Switzerland 38 $7.02 $2.65
UK 584 $3.34 $1.96
Non-US 1.629 $3.22 $1.84
US 1.648 $6.33 $3.80
All CEOs 3.277 $4.83 $2.65
7 Source: Data collected from filings for S&P 500 companies, EU Action Plan 2012 and Annual Financial Statements Listed Companies 2011/2012, Australian Government Productivity Commission Round and Annual Financial Statements Listed Companies 2011/2012.
pay, as in most cases the CEO would be the highest-income earner in the organisation. Secondly, when looking at the ‘level of pay’ we will focus on the CEO’s TGP and exclude from the ‘pay gap’ calculation any variable pay components, i.e. both short-term and long-term incentives, on the basis that no meaningful year-on-year trend can be established if they were to be included. While their inclusion would amplify the ‘pay gap’, and many pundits would argue inclusion would demonstrate the true ‘pay gap’, such incentives are normally driven by and related to the performance of the company and not the internal equity of the organisation.
Back in 1986, as noted by Forbes, America’s ten highest-paid CEOs together pocketed $57.88 million in compensation. In 2012, the top 10 pulled in $616.4 million, 10 times as much as the 1986 total after taking inflation into account5. Over that same 26-year span, average weekly wages for America’s workers barely increased at all. The same can be said for most developing countries.
There is thus little argument that executive pay has increased at a greater rate than the pay of the low-income earner. So, in the current climate we would expect total restraint to be exercised over any desire to increase the level of executive pay. But has this been happening?
For example, a recent analysis of pay in the UK banking sector6 has shown that bank pay has fallen further and faster
5 Forbes 18 March 20136 PwC UK: Closing the gap – an analysis of pay
in the banking sector
Executive Directors’ Remuneration – Practices and Trends Report 35
At a median of $2,65m and if converted to ZAR at a rate of, say, US$1 = ZAR10, there are not too many CEOs in South Africa who come even close to earning a guaranteed package of R26,5m.
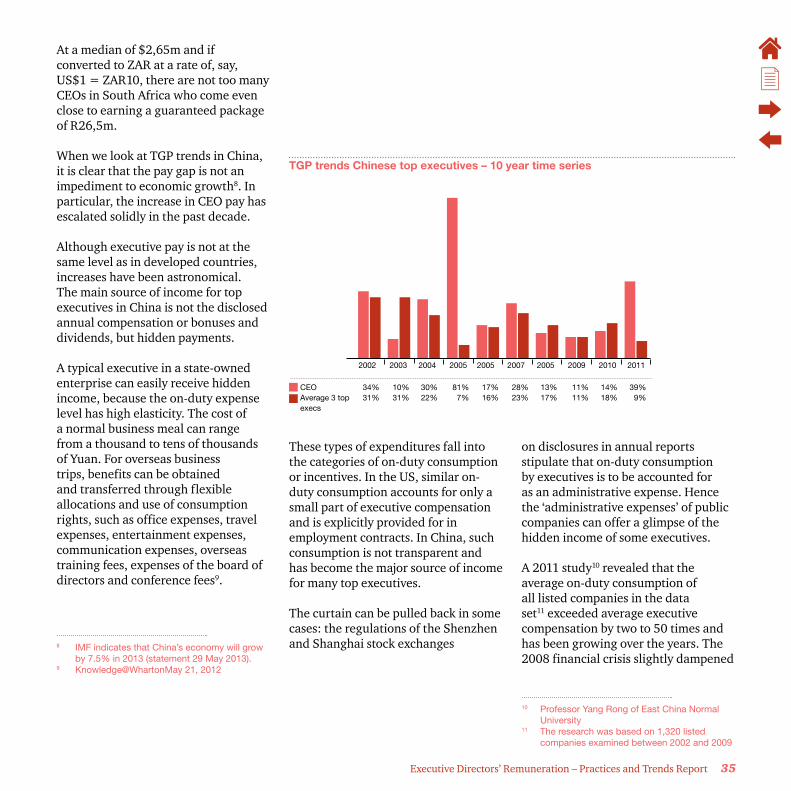
When we look at TGP trends in China, it is clear that the pay gap is not an impediment to economic growth8. In particular, the increase in CEO pay has escalated solidly in the past decade.
Although executive pay is not at the same level as in developed countries, increases have been astronomical. The main source of income for top executives in China is not the disclosed annual compensation or bonuses and dividends, but hidden payments.
A typical executive in a state-owned enterprise can easily receive hidden income, because the on-duty expense level has high elasticity. The cost of a normal business meal can range from a thousand to tens of thousands of Yuan. For overseas business trips, benefits can be obtained and transferred through flexible allocations and use of consumption rights, such as office expenses, travel expenses, entertainment expenses, communication expenses, overseas training fees, expenses of the board of directors and conference fees9.
8 IMF indicates that China’s economy will grow by 7.5% in 2013 (statement 29 May 2013).
9 Knowledge@WhartonMay 21, 2012
TGP trends Chinese top executives – 10 year time series
2002 2003 2004 2005 2005 20052007 2009 2010 2011
CEO 34% 10% 30% 81% 17% 28% 13% 11% 14% 39%Average 3 top 31% 31% 22% 7% 16% 23% 17% 11% 18% 9%execs
These types of expenditures fall into the categories of on-duty consumption or incentives. In the US, similar on-duty consumption accounts for only a small part of executive compensation and is explicitly provided for in employment contracts. In China, such consumption is not transparent and has become the major source of income for many top executives.
The curtain can be pulled back in some cases: the regulations of the Shenzhen and Shanghai stock exchanges
on disclosures in annual reports stipulate that on-duty consumption by executives is to be accounted for as an administrative expense. Hence the ‘administrative expenses’ of public companies can offer a glimpse of the hidden income of some executives.
A 2011 study10 revealed that the average on-duty consumption of all listed companies in the data set11 exceeded average executive compensation by two to 50 times and has been growing over the years. The 2008 financial crisis slightly dampened
10 Professor Yang Rong of East China Normal University
11 The research was based on 1,320 listed companies examined between 2002 and 2009
36 PwC
this expense, yet the growth curve for on-duty consumption at public companies in China soared between the years 2002 and 2009.
The same cannot be said for the 163 million Chinese migrant workers. They have no on-duty budget. Notwithstanding a surge in pay of 21.2% in 2011, the increase for 2012 deflated to 11.8%. These increases are from a very low average base of around 2,269 Yuan (R3,761).
What aggravates this situation is that the migrant workers, whose numbers increased by 3% in 2012, are better off than those who remain rural – here the statistics are not published and the facts cannot be determined. Benefits may be awarded to the lucky few who are prepared to leave their home province to go where the money is, by way of pensions (awarded to only 14.3%) and medical aid (awarded to only 16.9%)12.
In 2011, the average annual rate of pay for the fortunate migrant worker was around 25,000 Yuan (R40,600), while CEOs’ guaranteed pay hit an average of 495,427 (R825,100). This reflects a ratio of 20. Low by many standards, but well above what Switzerland is aiming for.
The sting in the tail is that the migrant worker’s pay increase halved, whereas the CEO’s increase was a whopping 39%. Another interesting observation is that CEO pay increased eightfold in
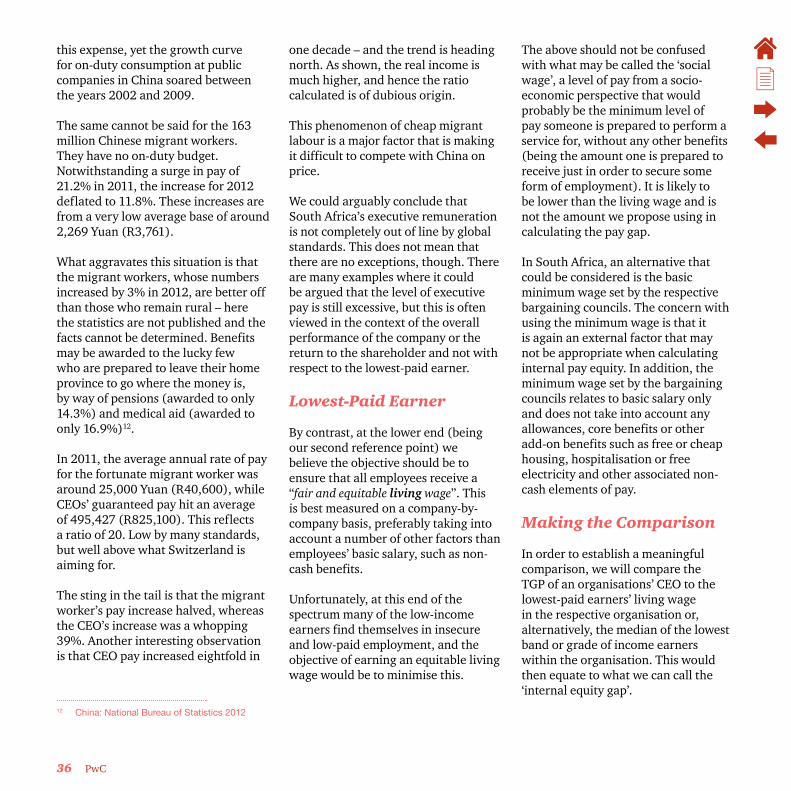
12 China: National Bureau of Statistics 2012
one decade – and the trend is heading north. As shown, the real income is much higher, and hence the ratio calculated is of dubious origin.
This phenomenon of cheap migrant labour is a major factor that is making it difficult to compete with China on price.
We could arguably conclude that South Africa’s executive remuneration is not completely out of line by global standards. This does not mean that there are no exceptions, though. There are many examples where it could be argued that the level of executive pay is still excessive, but this is often viewed in the context of the overall performance of the company or the return to the shareholder and not with respect to the lowest-paid earner.
Lowest-Paid Earner
By contrast, at the lower end (being our second reference point) we believe the objective should be to ensure that all employees receive a “fair and equitable living wage”. This is best measured on a company-by-company basis, preferably taking into account a number of other factors than employees’ basic salary, such as non-cash benefits.
Unfortunately, at this end of the spectrum many of the low-income earners find themselves in insecure and low-paid employment, and the objective of earning an equitable living wage would be to minimise this.
The above should not be confused with what may be called the ‘social wage’, a level of pay from a socio-economic perspective that would probably be the minimum level of pay someone is prepared to perform a service for, without any other benefits (being the amount one is prepared to receive just in order to secure some form of employment). It is likely to be lower than the living wage and is not the amount we propose using in calculating the pay gap.
In South Africa, an alternative that could be considered is the basic minimum wage set by the respective bargaining councils. The concern with using the minimum wage is that it is again an external factor that may not be appropriate when calculating internal pay equity. In addition, the minimum wage set by the bargaining councils relates to basic salary only and does not take into account any allowances, core benefits or other add-on benefits such as free or cheap housing, hospitalisation or free electricity and other associated non-cash elements of pay.
Making the Comparison
In order to establish a meaningful comparison, we will compare the TGP of an organisations’ CEO to the lowest-paid earners’ living wage in the respective organisation or, alternatively, the median of the lowest band or grade of income earners within the organisation. This would then equate to what we can call the ‘internal equity gap’.
Executive Directors’ Remuneration – Practices and Trends Report 37
As briefly discussed above, when computing the ‘living wage’ of an organisation’s employee, where possible all benefits should be computed and included in the calculation. Those benefits offered on a ‘use it or lose it’ basis, such as bursaries, can be excluded. Companies will often provide many other non-cash
benefits to its employees in the form of discounts on clothing, free or cheap accommodation, subsidised canteens and so forth, all of which should be valued or taken into consideration when looking at the ‘living wage’ of its employees.
Trying to use external data to determine the pay gap quickly shows that, because of too many variable input factors, the actual gap can yield different results depending on what is used.
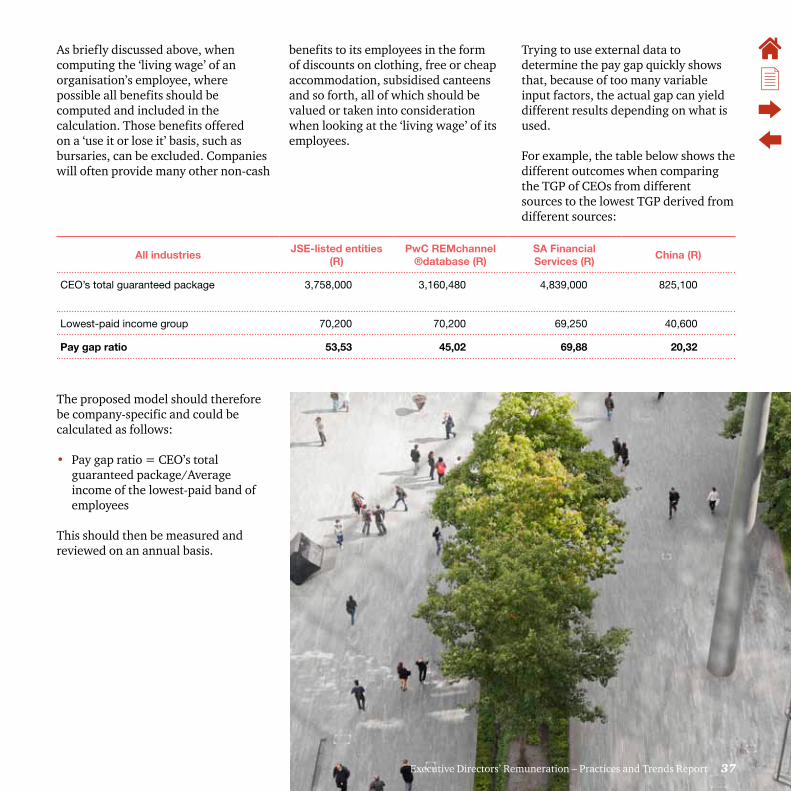
For example, the table below shows the different outcomes when comparing the TGP of CEOs from different sources to the lowest TGP derived from different sources:
All industries JSE-listed entities
(R)PwC REMchannel
®database (R)SA Financial Services (R)
China (R)
CEO’s total guaranteed package 3,758,000 3,160,480 4,839,000 825,100
Lowest-paid income group 70,200 70,200 69,250 40,600
Pay gap ratio 53,53 45,02 69,88 20,32
The proposed model should therefore be company-specific and could be calculated as follows:
• Pay gap ratio = CEO’s total guaranteed package/Average income of the lowest-paid band of employees
This should then be measured and reviewed on an annual basis.
Executive Directors’ Remuneration – Practices and Trends Report 37

38 PwC
S&P500 pay gap average ratio worker vs, CEO 1950 – 2012
Source: US Government data and S&P500 SEC proxy statements (PwC chart)
United States
In the US, for example, a burger flipper employed at one of the household names in the fast-food industry would need to work about one million work hours – which is more than a century on the clock – to earn the R81m that the company’s CEO was paid in 2012. The average minimum wage in the State of Illinois is R77 an hour. Calculated at a 40-hour work week, the CEO of this fast-food company would earn R38,945 an hour, which on these parameters converts to a ratio of 1:506. This is high because of the population of low-skill workers employed in the fast-food industry, but when the sample is spread to the S&P 500 companies, the ratio lowers to 1:204 (see table below for the period 1950 to 2012).13
13 Based on an average of lowest-paid employees as reported by S&P companies
1950
20
42
120
204
1980 2000 2012
Switzerland
On 3 March 2013, Swiss citizens voted in a referendum to impose some severe restrictions on executive compensation. In doing so, they ignored a warning from the business lobby that such curbs would undermine the country’s investor-friendly image.
The latest effort to govern corporate compensation in a country that recently approved some of the world’s strictest say-on-pay rules has in principle allowed the Swiss to have their say on pegging the pay gap. The benchmark level is 12 times that of a company’s lowest-paid employee, measured against executive pay.
The top 100 Swiss companies, boasting household names like Glencore, Nestlé, Novartis, Roche, ABB, Adecco, Migros, Holcim, Cargill International SA, Coop, Kühne + Nagel, Mercuria Energy Trading, Syngenta and Xstrata, will find it difficult to accept such a massive paradigm shift.
These companies have a total of 350,000 employees – many of whom are in the lowest category of wage earners. It will be interesting to observe the aftermath of this bold step, since 12 times is a very low ratio.
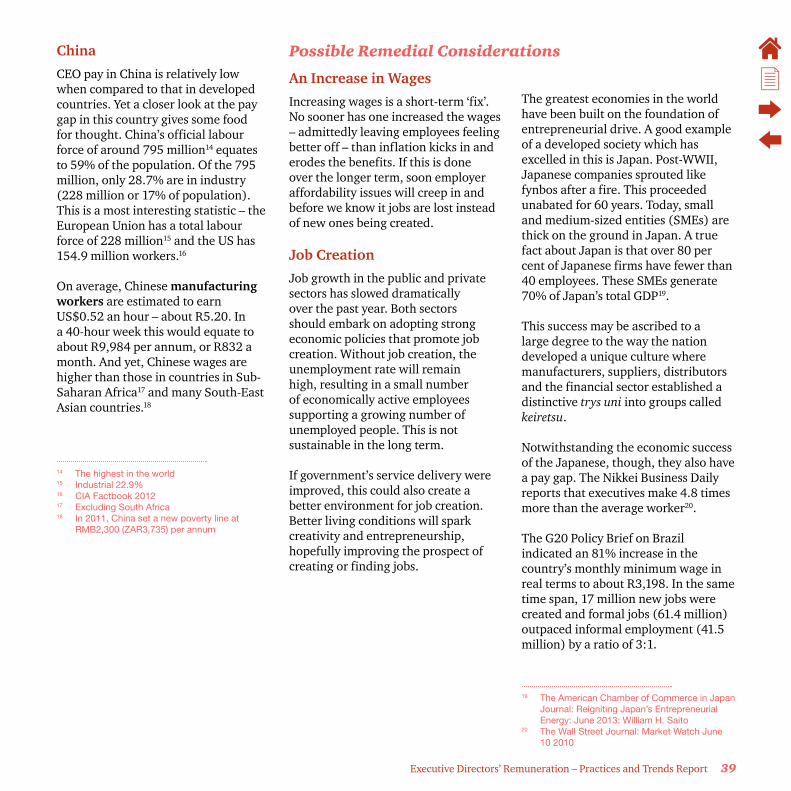
Executive Directors’ Remuneration – Practices and Trends Report 39
China
CEO pay in China is relatively low when compared to that in developed countries. Yet a closer look at the pay gap in this country gives some food for thought. China’s official labour force of around 795 million14 equates to 59% of the population. Of the 795 million, only 28.7% are in industry (228 million or 17% of population). This is a most interesting statistic – the European Union has a total labour force of 228 million15 and the US has 154.9 million workers.16
On average, Chinese manufacturing workers are estimated to earn US$0.52 an hour – about R5.20. In a 40-hour week this would equate to about R9,984 per annum, or R832 a month. And yet, Chinese wages are higher than those in countries in Sub-Saharan Africa17 and many South-East Asian countries.18
14 The highest in the world15 Industrial 22.9%16 CIA Factbook 201217 Excluding South Africa18 In 2011, China set a new poverty line at
RMB2,300 (ZAR3,735) per annum
Possible Remedial Considerations
An Increase in Wages
Increasing wages is a short-term ‘fix’. No sooner has one increased the wages – admittedly leaving employees feeling better off – than inflation kicks in and erodes the benefits. If this is done over the longer term, soon employer affordability issues will creep in and before we know it jobs are lost instead of new ones being created.
Job Creation
Job growth in the public and private sectors has slowed dramatically over the past year. Both sectors should embark on adopting strong economic policies that promote job creation. Without job creation, the unemployment rate will remain high, resulting in a small number of economically active employees supporting a growing number of unemployed people. This is not sustainable in the long term.
If government’s service delivery were improved, this could also create a better environment for job creation. Better living conditions will spark creativity and entrepreneurship, hopefully improving the prospect of creating or finding jobs.
The greatest economies in the world have been built on the foundation of entrepreneurial drive. A good example of a developed society which has excelled in this is Japan. Post-WWII, Japanese companies sprouted like fynbos after a fire. This proceeded unabated for 60 years. Today, small and medium-sized entities (SMEs) are thick on the ground in Japan. A true fact about Japan is that over 80 per cent of Japanese firms have fewer than 40 employees. These SMEs generate 70% of Japan’s total GDP19.
This success may be ascribed to a large degree to the way the nation developed a unique culture where manufacturers, suppliers, distributors and the financial sector established a distinctive trys uni into groups called keiretsu.
Notwithstanding the economic success of the Japanese, though, they also have a pay gap. The Nikkei Business Daily reports that executives make 4.8 times more than the average worker20.
The G20 Policy Brief on Brazil indicated an 81% increase in the country’s monthly minimum wage in real terms to about R3,198. In the same time span, 17 million new jobs were created and formal jobs (61.4 million) outpaced informal employment (41.5 million) by a ratio of 3:1.
19 The American Chamber of Commerce in Japan Journal: Reigniting Japan’s Entrepreneurial Energy: June 2013: William H. Saito
20 The Wall Street Journal: Market Watch June 10 2010

40 PwC
Brazil proved that a fall in inequality by two thirds could be directly ascribed to an increase in wages. Labour inspection has improved compliance.
Labour statistics show that regularly employed workers have increased from 28.7 million to 45.6 million (2002 – 2011)21, and unemployment has shrunk from 12.3% to 6.1%22.
Interventions by government and unions in Brazil have played a major part in improving living standards, as depicted in the following chart:
Brazil’s results can only be achieved if productive jobs are created through planned infrastructure and private participation.
21 Source: MTE Brasil22 Source: IBGE
Service Delivery
Poor government service delivery is a widespread problem that is most severe in the majority of South African townships. The lack of government service delivery in relation to sanitation, water and the provision of low-cost housing, to name a few, curbs the prospects for an economic solution, the more so when coupled with issues such as the demand for higher wages.
Brazil: Intervention and policy changes
19971996 1998 1999 2000 2001 2002 2003 2004 2005 2006 2007 2008 2009 2010 2011
Above inflation 52% 39% 44% 35% 52% 43% 26% 19% 55% 72% 86% 88% 77% 79% 88% 85%Equal to inflation 4% 16% 20% 15% 15% 20% 28% 23% 26% 16% 11% 8% 12% 12% 8% 8%Lower than inflation 44% 45% 37% 50% 33% 37% 47% 58% 19% 12% 3% 4% 11% 9% 4% 7%
– wage increase scenario
Education
Business leaders are calling for government to prioritise initiatives that will help foster a skilled workforce, with more than half of CEOs around the world saying that a lack of key skills is hampering their growth prospects. The skills shortage is particularly acute in fast-growing markets such as Africa, where 82% of CEOs say availability is a problem.
A global survey23 of over 1,300 CEOs disclosed that business leaders see the availability of key skills as the second biggest threat to their business growth, directly after the increasing tax burden (63%).
23 PwC’s 16th Annual Global CEO survey
Businesses are struggling with a widening mismatch between the skills of their workforce and the skills they need to achieve strong growth. There needs to be a joint approach to addressing the problem, with businesses and governments working together to plug the skills gap. At a time when growth is at the top of all businesses’ agenda, investment in employee training and development should be a key priority for CEOs for the year ahead.
The research shows that businesses are looking to government to help them plug the skills gap. More than half of CEOs (57%) said that creating and
Executive Directors’ Remuneration – Practices and Trends Report 41
encouraging a skilled workforce should be the government’s highest priority for the year ahead. This is an area where the government could do much better, according to the CEOs that were surveyed.
Socially Responsible Companies
In many cases, because of poor government service delivery, the private sector will step in and provide these services. Possibly, not enough pressure is being put on government by the private sector to provide some of the basic amenities. Public transport is a good example, where too often unreliable or no public transport is provided, resulting in employers having to provide alternative means of transport.
Redistribution
Some interesting new research recently published by the High Pay Centre24 in the UK reveals that even a modest level of wealth redistribution could make a substantial difference in the standard of living of low-pay earners and would not be greatly missed by those at the top. We are not suggesting that this is a viable solution in South Africa, but nevertheless share some of their key findings below to illustrate where the focus should be.
• The share of national income going to the top 1 per cent of income distribution has more than doubled since 1979 to 14.5 per cent from 6 per cent.
24 High Pay Centre : Top to Bottom – understanding fairer pay
• There are 29,000 people in the UK (the top 0.11 per cent of the income scale) who earn more than £500,000 a year. They already take home £21,500 a month after tax. That is more in a month than someone on an average salary earns in a year (£20,500, after tax).
• There are 6.75 million people (the bottom 25 per cent of earners) who take home less than £800 a month. Five million of these are full-time employees.
• Wages for most of the population have stagnated, barely keeping up with inflation.
• If those earning more than £150,000 took a 10 per cent pay cut and it went directly to the bottom 25 per cent, they would get a 55p per hour pay rise to £7.35, taking them closer to the national living wage of £7.45.
• If those earning over £300,000 (the top 0.25 per cent) gave up 10 per cent of their pay, the lowest paid 25 per cent would get a rise of £40 a month.
• These changes would not be fiscally neutral, but would inject some spending power into the economy at the bottom, where it is needed.
The report highlights the urgent need for business leaders, bankers and others at the top end of the income scale to engage in the debate about
what constitutes a fair reward, and whether existing levels of poverty and inequality are acceptable in an advanced economy such as that of the UK.
Responsibility and Control
King III specifically recommends that the board appoint a remuneration committee to assist the board with its responsibility for setting and administering remuneration policies in the company’s long-term interests.
Whilst the new Companies Act does not require the appointment of a remuneration committee, section 72 permits the board to appoint such a committee, except to the extent that the MOI provides otherwise.
The board represents the shareholders, and the question is whether or not the board – operating through its remuneration committee – has lost its sense of responsibility when it comes to the level of executive remuneration and the social and moral issues that are connected thereto.
According to King III, the remuneration committee should perform all functions necessary to fulfill its role in assisting the board to ensure that directors and executives are remunerated fairly and reasonably. Part of this responsibility is to consider and recommend remuneration polices for all levels of employees in the company and approve the cost of annual general salary increases
42 PwC
and mandates for negotiations with trade unions. Historically, the concern and focus of the committee have been predominantly around the remuneration of senior executives, but this trend has changed drastically with the focus turning to the internal equity between executives and the lowest paid in the company.
As a result, remuneration committees will need to work hard in the coming months to re-establish the trust between shareholders and the board and to ensure that the committee is fulfilling its role and responsibility in ensuring ‘fair and reasonable pay’ at both ends of the spectrum.
Summary and Conclusion
There is little doubt that if we can reduce pay inequality, it would also be a catalyst for economic growth. If the objective is to ensure that inequity is managed by ensuring that the pay gap is at least maintained or even reduced, there are a number of actions that entities can take.
• The shareholders of all companies, as represented by their respective boards, should take responsibility for ensuring that our corporations deal with internal equity.
• Government should improve service delivery.
• The necessary actions should be taken to promote job creation within the public and private sector.
• Our education system should be improved.
• It should be accepted that there is a parallel ‘social wage’ system in operation.
So is measuring the pay gap meaningful?
The pay gap is a measure of the wealth of those who are affluent and those who are not. The pay gap should be earned and not given. This takes time. It also requires resolve by leadership to improve the lot of the poor.
Responsible management carries a burden. This burden has a price. Every individual in an organisation carries some responsibility, and should be fairly rewarded accordingly. Yet nowhere in the world has there ever been equality of pay. With many exceptions, we see that a highly productive country like Japan has highly skilled people in the workforce – and their pay gap is not very large. The entrepreneurs who are indirectly involved in the overall pay-for-work calculation and who make up the majority of the ‘working class’ are in the money for themselves, but are not counted when the pay gap calculation is done. So we have a serious conundrum when discussing the pay gap under this scenario.
Conversely, developing countries display a high pay gap. Lack of education and lack of experience typically contribute to this gap. History plays a part too, and past mistakes cannot be rectified by narrowing the pay gap without a quid pro quo. The social problem of the poor and needy being unable to compete in broader society in developing countries is a global reality. But the pay gap is unfortunately not a philanthropic switch. History has proved the folly of a baseless system as a proxy for production.

Executive Directors’ Remuneration – Practices and Trends Report 43
Gender – the Other Gap
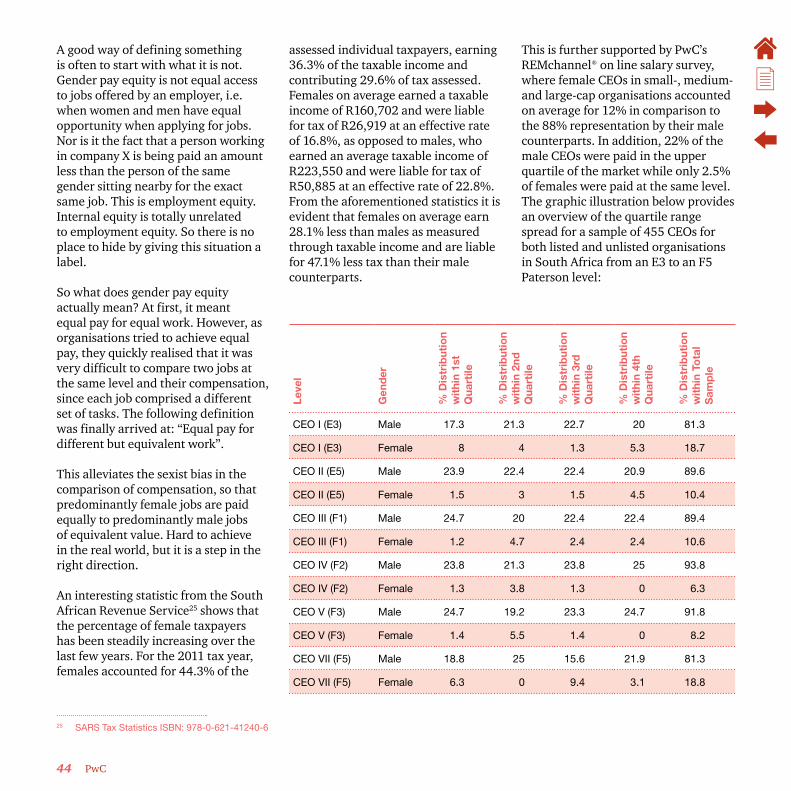
44 PwC
A good way of defining something is often to start with what it is not. Gender pay equity is not equal access to jobs offered by an employer, i.e. when women and men have equal opportunity when applying for jobs. Nor is it the fact that a person working in company X is being paid an amount less than the person of the same gender sitting nearby for the exact same job. This is employment equity. Internal equity is totally unrelated to employment equity. So there is no place to hide by giving this situation a label.
So what does gender pay equity actually mean? At first, it meant equal pay for equal work. However, as organisations tried to achieve equal pay, they quickly realised that it was very difficult to compare two jobs at the same level and their compensation, since each job comprised a different set of tasks. The following definition was finally arrived at: “Equal pay for different but equivalent work”.
This alleviates the sexist bias in the comparison of compensation, so that predominantly female jobs are paid equally to predominantly male jobs of equivalent value. Hard to achieve in the real world, but it is a step in the right direction.
An interesting statistic from the South African Revenue Service25 shows that the percentage of female taxpayers has been steadily increasing over the last few years. For the 2011 tax year, females accounted for 44.3% of the
25 SARS Tax Statistics ISBN: 978-0-621-41240-6
assessed individual taxpayers, earning 36.3% of the taxable income and contributing 29.6% of tax assessed. Females on average earned a taxable income of R160,702 and were liable for tax of R26,919 at an effective rate of 16.8%, as opposed to males, who earned an average taxable income of R223,550 and were liable for tax of R50,885 at an effective rate of 22.8%. From the aforementioned statistics it is evident that females on average earn 28.1% less than males as measured through taxable income and are liable for 47.1% less tax than their male counterparts.
This is further supported by PwC’s REMchannel® on line salary survey, where female CEOs in small-, medium- and large-cap organisations accounted on average for 12% in comparison to the 88% representation by their male counterparts. In addition, 22% of the male CEOs were paid in the upper quartile of the market while only 2.5% of females were paid at the same level. The graphic illustration below provides an overview of the quartile range spread for a sample of 455 CEOs for both listed and unlisted organisations in South Africa from an E3 to an F5 Paterson level:
Leve
l
Gen
der
% D
istr
ibut
ion
wit
hin
1st
Qua
rtile
% D
istr
ibut
ion
wit
hin
2nd
Q
uart
ile
% D
istr
ibut
ion
wit
hin
3rd
Q
uart
ile
% D
istr
ibut
ion
wit
hin
4th
Qua
rtile
% D
istr
ibut
ion
wit
hin
Tota
l S
amp
le
CEO I (E3) Male 17.3 21.3 22.7 20 81.3
CEO I (E3) Female 8 4 1.3 5.3 18.7
CEO II (E5) Male 23.9 22.4 22.4 20.9 89.6
CEO II (E5) Female 1.5 3 1.5 4.5 10.4
CEO III (F1) Male 24.7 20 22.4 22.4 89.4
CEO III (F1) Female 1.2 4.7 2.4 2.4 10.6
CEO IV (F2) Male 23.8 21.3 23.8 25 93.8
CEO IV (F2) Female 1.3 3.8 1.3 0 6.3
CEO V (F3) Male 24.7 19.2 23.3 24.7 91.8
CEO V (F3) Female 1.4 5.5 1.4 0 8.2
CEO VII (F5) Male 18.8 25 15.6 21.9 81.3
CEO VII (F5) Female 6.3 0 9.4 3.1 18.8

Executive Directors’ Remuneration – Practices and Trends Report 45
We concede that rules are often just talk and that fixing a handle to the challenge may just exacerbate the problem. Surely, women should receive equal treatment in all circumstances? How many times is it not evident that deep discrimination exists when a reality test is given to equality? In Canada, The Pay Equity Commission26 has created a ‘map’ to help guide parties towards drafting a mandate to achieve the requirement. Here are the four basic steps:
• The identification of predominantly female and male job classes;
• The selection of a job class evaluation method and tools;
• An evaluation procedure based on the following four dimensions:
• Qualifications required
• Responsibilities assumed
• Effort required
• Working conditions; and
• The evaluation and comparison of job classes, an estimate of differences in compensation and the calculation of adjustments in compensation, to achieve equity.
Ethnic considerations do not figure – it was found that they just muddy the water. Globally, racial and religious biases prevail. The greatest democracies suffer from this evil.
26 Source: McGill University is a public research university located in Montreal, Quebec, Canada, founded in 1821.
Moving away from gender pay equity, below we take a look at gender diversity as it currently stands in the boardroom. This is a hot topic internationally, with many regulatory bodies and women’s interest groups all over the world calling for greater gender diversity on boards.
The South African top management distribution gap may be represented as follows:27
South African top management gender distribution trends
The gender gap trend in the boardroom is depicted by industry in the following chart:
South African gender gap JSE listed companies
27 Employment Equity Annual Report 2013 page 19
2002 2004 2006 2008 2010 2012
Male 86.2% 84.9% 78.4% 81.9% 81.1% 80.1%Female 13.7% 15.1% 21.6% 18.2% 19.0% 19.8%
AltX BasicResources
Financial Industrial Services
Male 89% 92% 89% 88% 91%Female 11% 8% 11% 12% 8%

46 PwC
Last year, average female representation on the JSE was 8%, up from the prior year’s 4.2%, and this year it has improved to 10%.
So, is global gender diversity real or not?
We take a look first at five continents, then the top ten and bottom ten countries, twelve selected economies and finally the various industries.
Global employment statistics extracted from published data28 reveal the following at board and management level:
28 Published accounts of listed companies trading on 56 regulated securities exchanges globally, United Nations Human Development Reports, Gender Inequality Index and other gender in the workplace documentation.
Gender gap by continent – board and management
NorthAmerica
EuropeAfricaOceaniaAsiaLatinAmerica
Male 90% 89% 85% 84% 84% 82%Female 10% 11% 15% 16% 16% 18%
At board level, it gets worse:
Gender gap by continent – board of directors
NorthAmerica
EuropeAfricaOceaniaAsiaLatinAmerica
Male 93% 90% 88% 87% 86% 83%Female 7% 10% 12% 13% 14% 17%
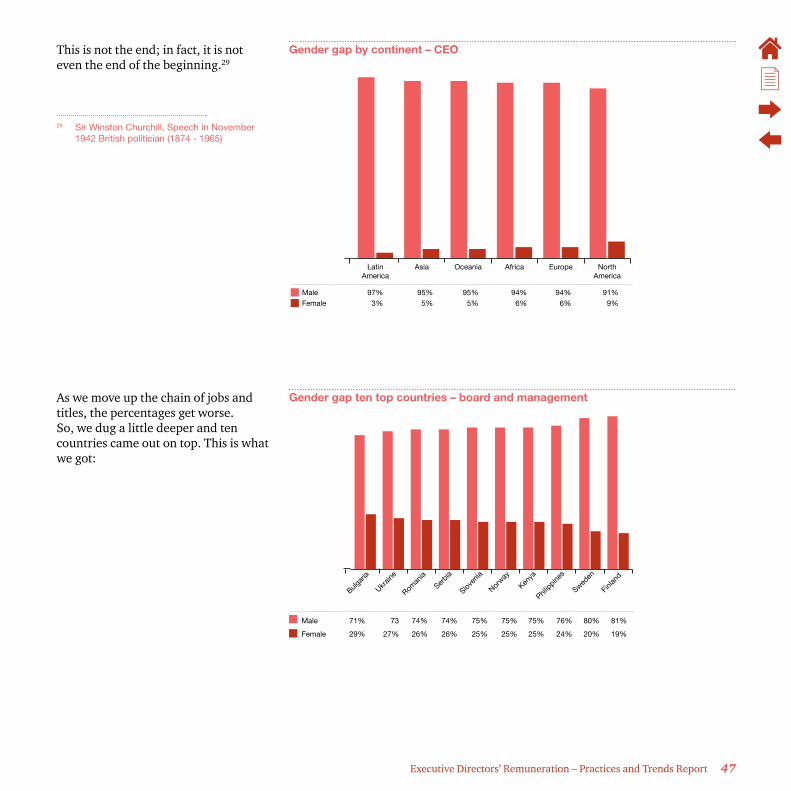
Executive Directors’ Remuneration – Practices and Trends Report 47
This is not the end; in fact, it is not even the end of the beginning.29
29 Sir Winston Churchill, Speech in November 1942 British politician (1874 - 1965)
As we move up the chain of jobs and titles, the percentages get worse. So, we dug a little deeper and ten countries came out on top. This is what we got:
Gender gap ten top countries – board and management
Finlan
d
Sweden
Philippine
s
Kenya
Norway
Sloven
ia
Serbia
Roman
ia
Ukrain
e
Bulgar
ia
Male 71% 73 74% 74% 75% 75% 75% 76% 80% 81%
Female 29% 27% 26% 26% 25% 25% 25% 24% 20% 19%
Gender gap by continent – CEO
NorthAmerica
EuropeAfricaOceaniaAsiaLatinAmerica
Male 97% 95% 95% 94% 94% 91%Female 3% 5% 5% 6% 6% 9%
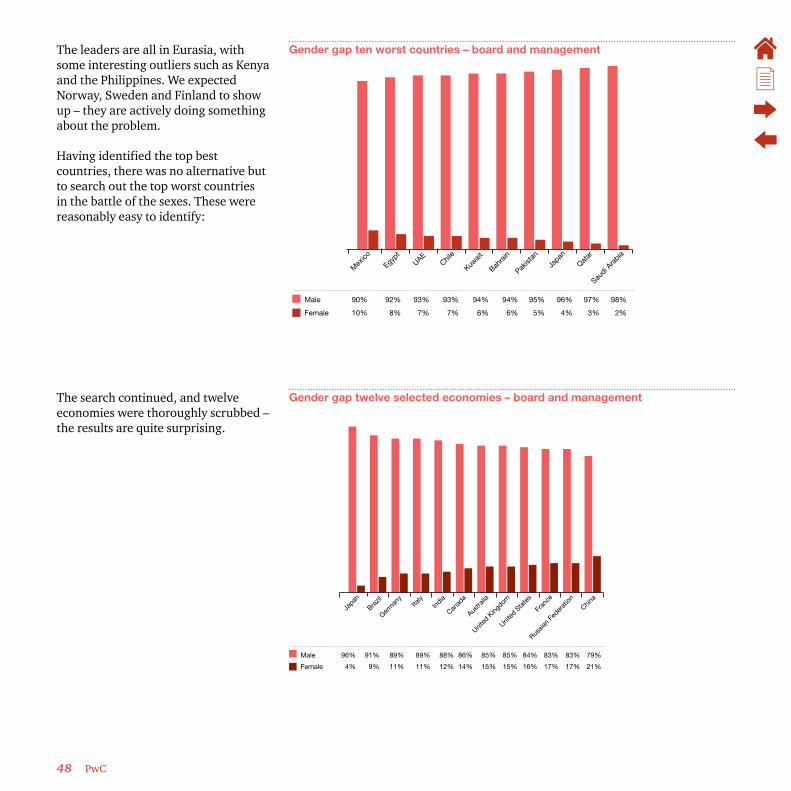
48 PwC
The leaders are all in Eurasia, with some interesting outliers such as Kenya and the Philippines. We expected Norway, Sweden and Finland to show up – they are actively doing something about the problem.
Having identified the top best countries, there was no alternative but to search out the top worst countries in the battle of the sexes. These were reasonably easy to identify:
Gender gap ten worst countries – board and management
Saudi A
rabia
Qatar
Japan
Pakist
an
Bahra
in
Kuwait
Chile
UAEEgy
pt
Mex
ico
Male 90% 92% 93% 93% 94% 94% 95% 96% 97% 98%
Female 10% 8% 7% 7% 6% 6% 5% 4% 3% 2%
The search continued, and twelve economies were thoroughly scrubbed – the results are quite surprising.
Gender gap twelve selected economies – board and management
China
Russia
n Fe
derat
ion
Fran
ce
United
Sta
tes
United
King
dom
Austra
lia
Canad
aInd
iaIta
ly
Germ
any
Brazil
Japan
Male 96% 91% 89% 89% 88% 86% 85% 85% 84% 83% 83% 79%
Female 4% 9% 11% 11% 12% 14% 15% 15% 16% 17% 17% 21%
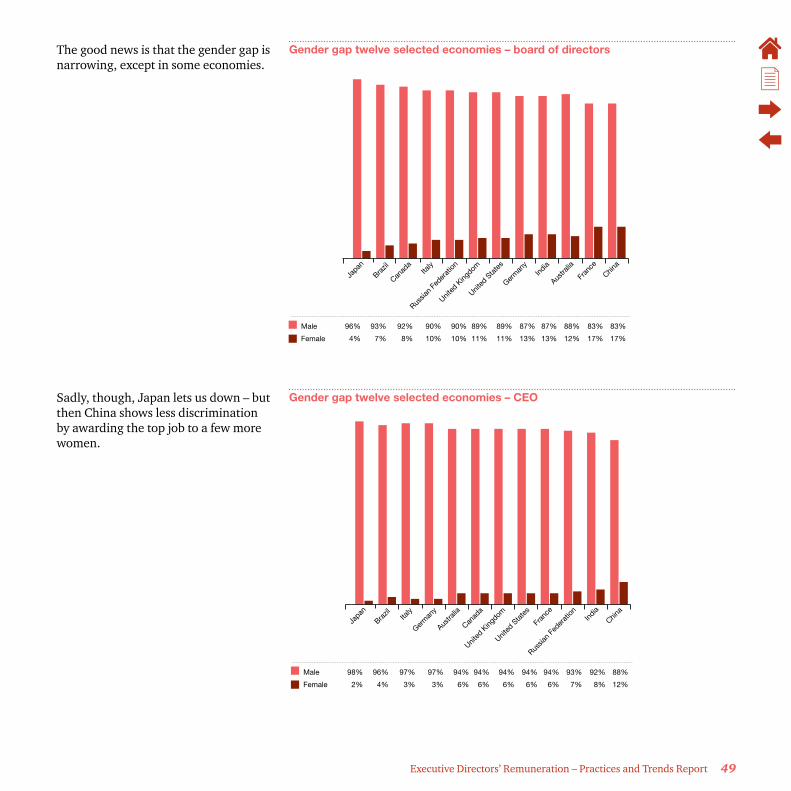
Executive Directors’ Remuneration – Practices and Trends Report 49
The good news is that the gender gap is narrowing, except in some economies.
Gender gap twelve selected economies – board of directors
China
Fran
ce
Austra
liaInd
ia
Germ
any
United
Sta
tes
United
King
dom
Russia
n Fe
derat
ionItaly
Canad
a
Brazil
Japan
Male 96% 93% 92% 90% 90% 89% 89% 87% 87% 88% 83% 83%
Female 4% 7% 8% 10% 10% 11% 11% 13% 13% 12% 17% 17%
Sadly, though, Japan lets us down – but then China shows less discrimination by awarding the top job to a few more women.
Gender gap twelve selected economies – CEO
China
India
Russia
n Fe
derat
ion
Fran
ce
United
Sta
tes
United
King
dom
Canad
a
Austra
lia
Germ
any
Italy
Brazil
Japan
Male 98% 96% 97% 97% 94% 94% 94% 94% 94% 93% 92% 88%
Female 2% 4% 3% 3% 6% 6% 6% 6% 6% 7% 8% 12%

50 PwC
For the purposes of this report, the focus fell on industries. It was considered prudent to view the gender split in similar industries.
Gender gap by industry type board and management
Med
ia
Servic
es
Health
care
Consu
mer
goo
ds
Finan
cial
Trave
l
Agricu
lture
Tech
nolog
y
Indus
trial
Male 89% 87% 86% 85% 84% 83% 82% 82% 75%
Female 11% 13% 14% 15% 16% 17% 18% 18% 25%
At board level, the gap widens: Gender gap by industry type board of direectors
Med
ia
Servic
es
Consu
mer
goo
ds
Agricu
lture
Finan
cial
Trave
l
Health
care
Tech
nolog
y
Indus
trial
Male 90% 89% 88% 87% 87% 86% 86% 84% 82%
Female 10% 11% 12% 13% 13% 14% 14% 16% 18%

Executive Directors’ Remuneration – Practices and Trends Report 51
Then at CEO level it widens some more.
Gender gap by industry type – CEO
There is no doubt that female representation is still growing and that board representation is improving, albeit still relatively slow.
Med
ia
Servic
es
Consu
mer
goo
ds
Health
care
Finan
cial
Tech
nolog
y
Trave
l
Indus
trial
Agricu
lture
Male 97% 96% 95% 94% 93% 92% 91% 91% 86%
Female 3% 4% 5% 6% 7% 8% 9% 9% 14%

52 PwC
Profile of an Executive Director

Executive Directors’ Remuneration – Practices and Trends Report 53
Responsibility
The executive director is responsible for successful leadership and management within the organisation according to the strategic direction set by the board of directors. Checking the results from a decision against its expectations shows executives what their strengths are, where they need to improve, and where they lack knowledge or information.
An executive director’s primary duties would include attendance of and participation in board meetings. Participation in this role is many-faceted. The executive director is the catalyst between the shareholder, management and employees.
The days of running one’s empire from behind closed doors are past – outside contact is king. In the context of an executive director’s duties, this takes preference to the other king – King III – that is vaunted throughout this publication as the control mechanism. But in management, leadership comes first.
In reality, it is not what the shareholder dictates that moulds a superior company, but what the market dictates. The end user of product – the customer – is the real force behind correct action.
Today, access to those charged with fiduciary responsibility is a given. Successful companies know this, and this primary function drafts the executive diary to be available when required.
As at 30 April 2013, there were a total of 373 active companies listed on the Johannesburg Securities Exchange (JSE).25
25 Suspended companies and companies valued by preference shares are excluded.
Directing these companies are 1,024 executives, which translates to an 11 per cent decrease in the number of executives listed as directors in 2012. Except for the basic resources and services sectors, reasonable decreases were shown in the number of executive directors (see table below).
Number of directors JSE companies by sector
0 50 100 150 200 250 300 350 400 450
AltX
BasicResources
Financial
Industrial
Services182
175
348
411
188
202
155
149
151
214
2012: Total 1 151 2013: Total 1 024
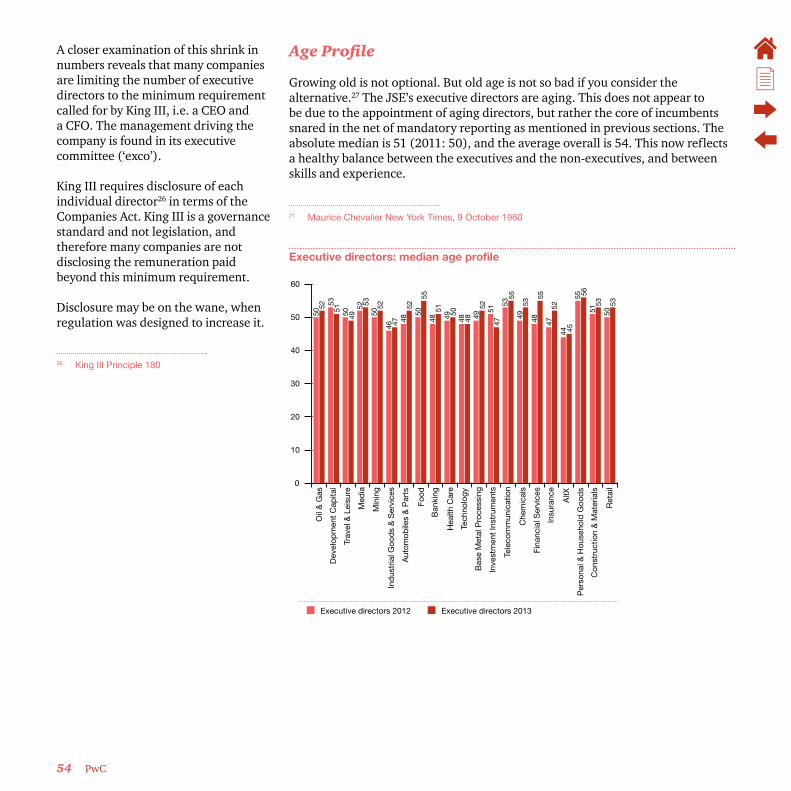
54 PwC
A closer examination of this shrink in numbers reveals that many companies are limiting the number of executive directors to the minimum requirement called for by King III, i.e. a CEO and a CFO. The management driving the company is found in its executive committee (‘exco’).
King III requires disclosure of each individual director26 in terms of the Companies Act. King III is a governance standard and not legislation, and therefore many companies are not disclosing the remuneration paid beyond this minimum requirement.
Disclosure may be on the wane, when regulation was designed to increase it.
26 King III Principle 180
Age Profile
Growing old is not optional. But old age is not so bad if you consider the alternative.27 The JSE’s executive directors are aging. This does not appear to be due to the appointment of aging directors, but rather the core of incumbents snared in the net of mandatory reporting as mentioned in previous sections. The absolute median is 51 (2011: 50), and the average overall is 54. This now reflects a healthy balance between the executives and the non-executives, and between skills and experience.
27 Maurice Chevalier New York Times, 9 October 1960
Executive directors: median age profile
0
10
20
30
40
50
60
Ret
ail
Con
stru
ctio
n &
Mat
eria
ls
Per
sona
l & H
ouse
hold
Goo
ds
AltX
Insu
ranc
e
Fina
ncia
l Ser
vice
s
Che
mic
als
Tele
com
mun
icat
ion
Inve
stm
ent
Inst
rum
ents
Bas
e M
etal
Pro
cess
ing
Tech
nolo
gy
Hea
lth C
are
Ban
king
Food
Aut
omob
iles
& P
arts
Ind
ustr
ial G
ood
s &
Ser
vice
s
Min
ing
Med
ia
Trav
el &
Lei
sure
Dev
elop
men
t C
apita
l
Oil
& G
as50
52 5351 50 4952 53
5052
46 47 48 48 48 48 4952 51
4753 53
49 4855 55 56
4752 5153
5053
44 45
55
495152
50 50
55
Executive directors 2012 Executive directors 2013

Executive Directors’ Remuneration – Practices and Trends Report 55
ACI Representation
Statistics prior to 2002 regarding the ACI gap are rather vague, and are not included. However, the picture for top management at the helm of all companies in South Africa during the period 2002 to 2012 tells the real ACI distribution story.28
28 Commission for Employment Equity 2012 – 2013 ISBN No: 978-0-621-41728-9 – Page 10
Top management race
2002 2004 2006 2008 2010 2012
African 10.0% 11.8% 11.3% 13.6% 12.7% 12.3%Coloured 3.4% 3.7% 4.7% 4.7% 4.6% 4.6%Indian 5.0% 5.6% 6.2% 5.9% 6.8% 7.3%White 81.5% 78.9% 74.9% 72.8% 73.1% 72.6%Foreign 2.9% 3.1% 2.9% 3.1%
The chart shows fluctuations in the employment distribution of the various population groups in terms of their representation at the top management level. White representation decreased by 8.9% from 81.5% in 2002 to 72.6% in 2012, averaging a decrease of approximately 1% per annum. African representation increased slightly by 2.3% at this level over the same period from 10.0% to 12.3% in 2012. The representation of Coloureds increased by 1.2% from 3.4% in 2002 to 4.6% in 2012, and the representation of Indians increased by 2.3% from 5% in 2002 to 7.3% in 2012. The representation of foreign nationals has increased by 0.2% from 2.9% in 2006 to 3.1% in 2012.
The trend for our listed companies is improving slightly as indicated in the following chart.
Executive directors: ACI board representation by industry sector
0
50
100
150
200
250
300
350
400
ServicesIndustrialFinancialBasic ResourcesAltX
0%
5%
10%
15%
20%
25%
30%
ED total 151 155 188 348 182ACI total 38 42 38 47 23% ACI 25% 27% 20% 14% 13%
25%
13%
20%
27%
14%
Tota
l ED
% A
CI E
xecutive Directo
rs

56 PwC
Executive Directors’ Total Guaranteed Package – JSE Trends

Executive Directors’ Remuneration – Practices and Trends Report 57
Introduction
The analysis presented here was done according to industry classifications across the basic resources, financial services, industrial and services sectors. Within the industry analysis, companies have been separated into large-, medium-, and small-cap companies. The AltX was also included.
In line with our previous reports, the graphs below report on the 2013 reporting period (1 May 2012 to 30 April 2013), referred to as ‘2012 data’. The 2012 reporting period (1 May 2011 to 30 April 2012) is used for comparative purposes and is referred to as the ‘2011 data’. Similarly, the ‘2010 data’ refers to the period 1 May 2010 to 30 April 2011.
Annual reports are not coterminous. Different companies have varying financial year-ends. Remuneration data was extracted from audited annual reports and financial statements. Numbers are reported as stated, and no attempt has been made to annualise them, due to a mismatch in financial years. Therefore, the financial year-ends of annual reports from where data was sourced do not necessarily match the cut-off date of this publication. The remuneration upon which our data depends is in accordance with published data. No adjustment has been made for CPI or any metric which may theoretically alter the data. Data has, however, been annualised where incumbent directors were appointed during the year.
We included 373 active companies in the data analysis. The five sector distributions used are the same as those used for our previous publications. In the current data set, counting the directors in each sector, the following chart reflects the position:
Directors by sector
The remuneration by position, reflected as total guaranteed pay, is the basis of reporting. To control their investment of R7.8 trillion on the JSE, shareholders were prepared to guarantee annual executive remuneration to the tune of R3.2 billion, excluding any variable pay.
AltX151
Services182
BasicResources
155
Financial188
Industrial348

5858 PwC
Summary
Summaries of the average TGP for all JSE companies (across sectors) at the upper, median and lower quartile as well as for CEO, CFO and ED roles are shown below.
All of JSE TGP 2012 R’000 TGP 2011 R’000 TGP 2010 R’000 TGP 2012 Increase TGP 2011 Increase
Upper quartile 4 667 4 170 3 811 12% 9%
Median 2 973 2 854 2 647 4% 8%
Lower quartile 1 833 1 702 1 558 8% 9%
CEO All of JSE TGP 2012 R’000 TGP 2011 R’000 TGP 2010 R’000 TGP 2012 Increase TGP 2011 Increase
Upper quartile 5 966 5 983 5 459 0% 10%
Median 3 758 4 314 3 468 -13% 24%
Lower quartile 2 835 2 645 2 647 7% 0%
CFO All of JSE TGP 2012 R’000 TGP 2011 R’000 TGP 2010 R’000 TGP 2012 Increase TGP 2011 Increase
Upper quartile 3 434 3 613 3 577 -5% 1%
Median 3 066 2 554 1 801 20% 42%
Lower quartile 1 801 1 514 1 564 19% -3%
ED All of JSE TGP 2012 R’000 TGP 2011 R’000 TGP 2010 R’000 TGP 2012 Increase TGP 2011 Increase
Upper quartile 3 178 3 184 2 822 0% 13%
Median 2 333 2 724 2 427 -14% 12%
Lower quartile 1 731 1 696 1 544 2% 10%

Executive Directors’ Remuneration – Practices and Trends Report 59
Basic Resources
The basic resources category includes companies involved in the discovery, development and processing of raw materials. This sector includes the mining and refining of metals as well as forestry products. Shareholders valued this sector by investing R1.644 trillion. Average market cap is R29.9 billion. Historically, South Africa has an investment base in mining. Mining shares dominate this sector.
Basic Resources: Large-Cap
Percentage Increases
2012 2011
Basic Resources Large-Cap
CEO -4.2% 6.1%
CFO 18.5% -3.4%
ED 32.3% 4.1%
Chief Executive OfficerBasic resources: Large-cap CEO
7 700
7 800
7 900
8 000
8 100
8 200
8 300
8 400
8 500
8 600
2012 2011 2010
R’0
00
TGP – median 8 124 8 478 7 990
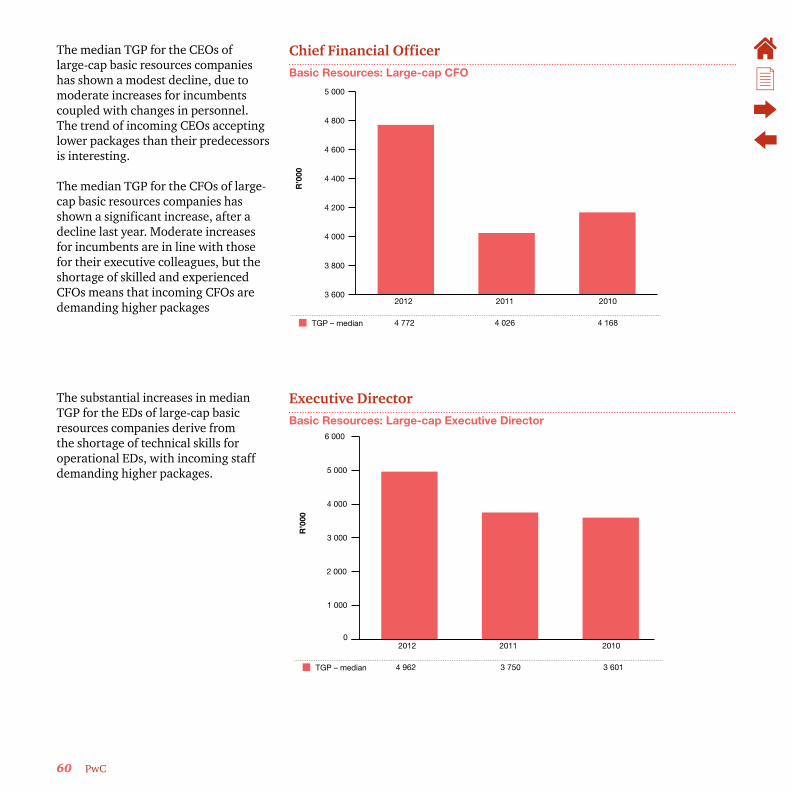
60 PwC
The median TGP for the CEOs of large-cap basic resources companies has shown a modest decline, due to moderate increases for incumbents coupled with changes in personnel. The trend of incoming CEOs accepting lower packages than their predecessors is interesting.
The median TGP for the CFOs of large-cap basic resources companies has shown a significant increase, after a decline last year. Moderate increases for incumbents are in line with those for their executive colleagues, but the shortage of skilled and experienced CFOs means that incoming CFOs are demanding higher packages
Chief Financial OfficerBasic Resources: Large-cap CFO
3 600
3 800
4 000
4 200
4 400
4 600
4 800
5 000
2012 2011 2010R
’000
TGP – median 4 772 4 026 4 168
The substantial increases in median TGP for the EDs of large-cap basic resources companies derive from the shortage of technical skills for operational EDs, with incoming staff demanding higher packages.
Executive DirectorBasic Resources: Large-cap Executive Director
0
1 000
2 000
3 000
4 000
5 000
6 000
2012 2011 2010
R’0
00
TGP – median 4 962 3 750 3 601

Executive Directors’ Remuneration – Practices and Trends Report 61
Basic Resources: Medium-Cap
Percentage Increases 2012 2011
Basic Resources Medium-Cap CEO 30.5% 37.5%
CFO 12.7% 9.0%
ED -27.7% 39.4%
Chief Executive OfficerBasic resources: Medium-cap CEO
0
1 000
2 000
3 000
4 000
5 000
6 000
7 000
2012 2011 2010
R’0
00
TGP – median 5 966 4 573 3 327
Medium-cap CEOs in the basic resources sector have bucked the trend of the leaders of their bigger brothers and have shown a substantial increase in TGP to nearly R6 million.

62 PwC
The more modest increase for the CFOs indicates some stability in the roles, with increases driven primarily by inflationary increases for incumbents.
Chief Financial OfficerBasic Resources: Medium-cap CFO
0
1 000
2 000
3 000
4 000
5 000
6 000
2012 2011 2010R
’000
TGP – median 5 154 4 573 4 197
There has been a significant drop in the TGP of EDs in the medium-cap sector which is based on a change in personnel. This is an opposite trend to that of their counterparts in large-cap mining companies. We may be seeing the buying power of the large companies being used to outbid the smaller industry players.
Executive DirectorBasic Resources: Medium-cap Executive Director
0
500
1 000
1 500
2 000
2 500
3 000
3 500
4 000
4 500
2012 2011 2010
R’0
00
TGP – median 2 876 3 980 2 856
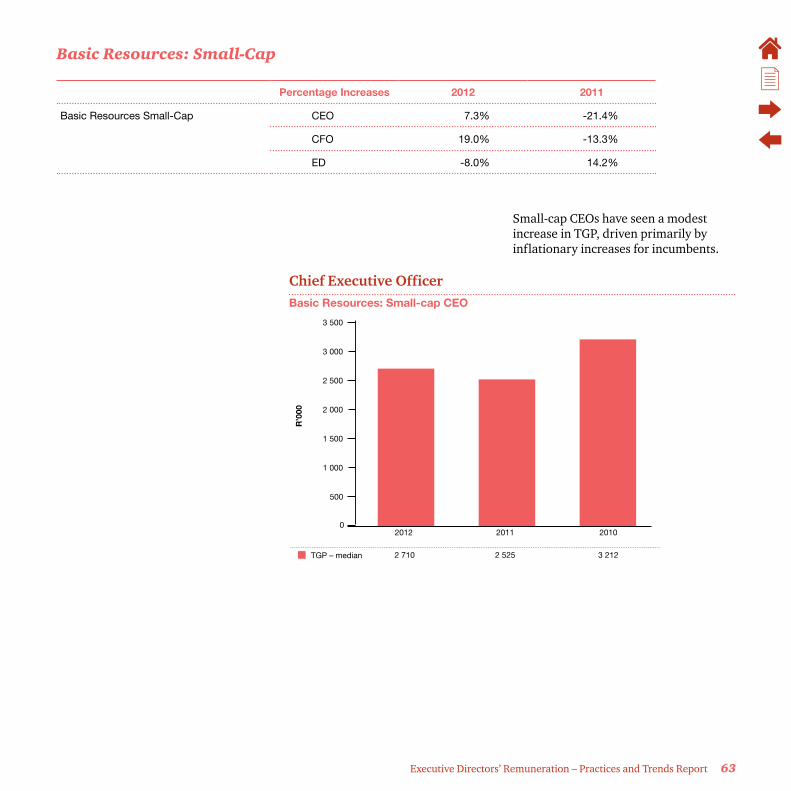
Executive Directors’ Remuneration – Practices and Trends Report 63
Basic Resources: Small-Cap
Percentage Increases 2012 2011
Basic Resources Small-Cap CEO 7.3% -21.4%
CFO 19.0% -13.3%
ED -8.0% 14.2%
Small-cap CEOs have seen a modest increase in TGP, driven primarily by inflationary increases for incumbents.
Chief Executive OfficerBasic Resources: Small-cap CEO
0
500
1 000
1 500
2 000
2 500
3 000
3 500
2012 2011 2010
R’0
00
TGP – median 2 710 2 525 3 212

64 PwC
A big increase in small-cap CFOs, again indicating the shortage of financial skills in this area.
Chief Financial OfficerBasic Resources: Small-cap CFO
1 350
1 400
1 450
1 500
1 550
1 600
1 650
1 700
1 750
1 800
1 850
2012 2011 2010R
’000
TGP – median 1 801 1 514 1 745
This reflects a similar trend to that for the median-cap EDs, indicating the buying power of the large-caps for these technical skills.
Executive DirectorBasic Resources: Small-cap Executive Director
1 450
1 500
1 550
1 600
1 650
1 700
1 750
1 800
1 850
2012 2011 2010
R’0
00
1 685 1 831 1 604 TGP – median
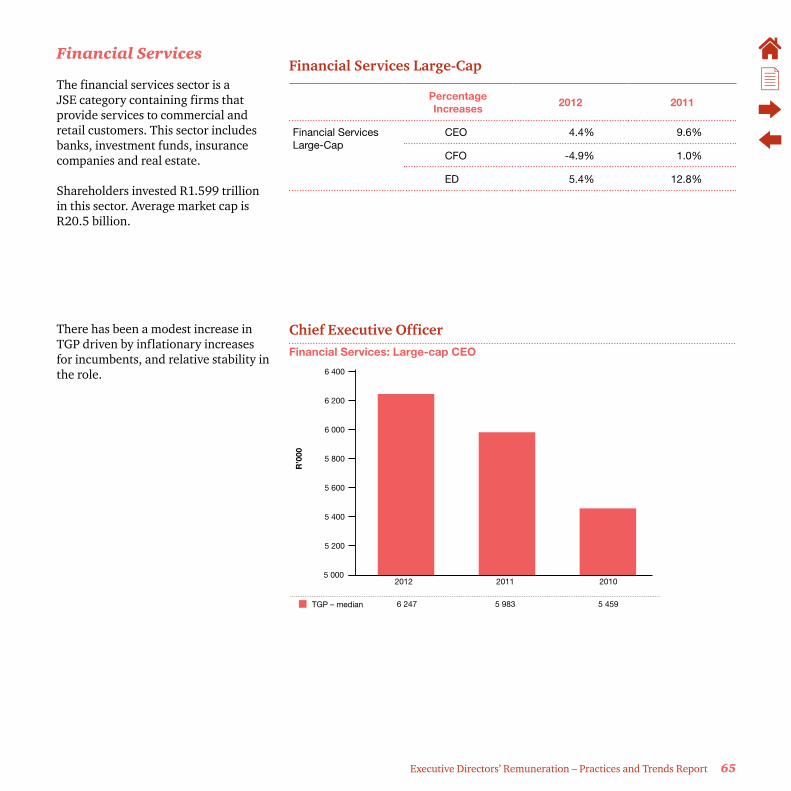
Executive Directors’ Remuneration – Practices and Trends Report 65
Financial Services
The financial services sector is a JSE category containing firms that provide services to commercial and retail customers. This sector includes banks, investment funds, insurance companies and real estate.
Shareholders invested R1.599 trillion in this sector. Average market cap is R20.5 billion.
Financial Services Large-Cap
Percentage Increases
2012 2011
Financial Services Large-Cap
CEO 4.4% 9.6%
CFO -4.9% 1.0%
ED 5.4% 12.8%
There has been a modest increase in TGP driven by inflationary increases for incumbents, and relative stability in the role.
Chief Executive OfficerFinancial Services: Large-cap CEO
5 000
5 200
5 400
5 600
5 800
6 000
6 200
6 400
2012 2011 2010
R’0
00
TGP – median 6 247 5 983 5 459
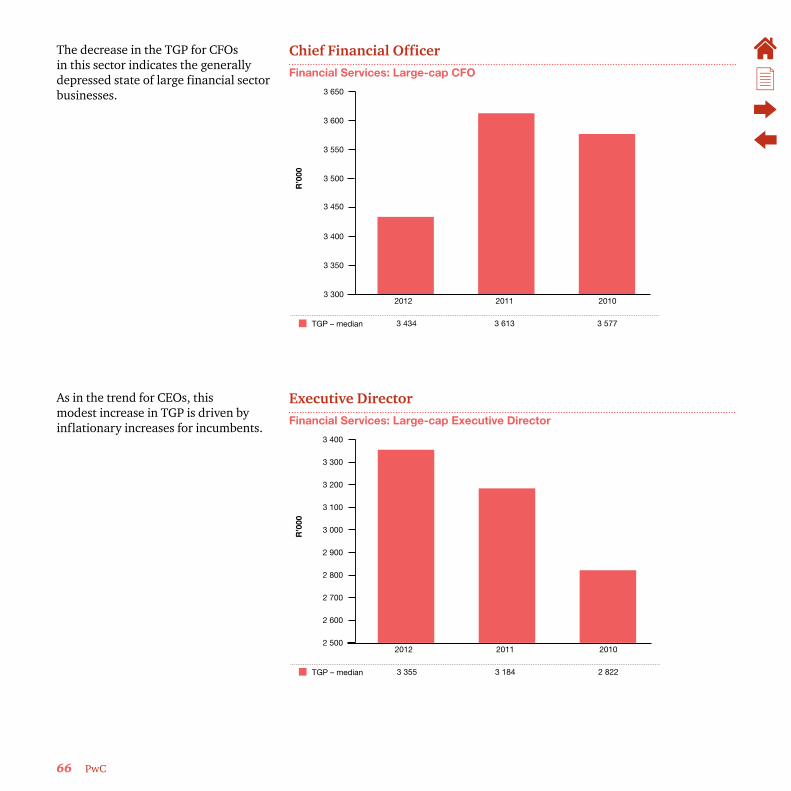
66 PwC
The decrease in the TGP for CFOs in this sector indicates the generally depressed state of large financial sector businesses.
Chief Financial OfficerFinancial Services: Large-cap CFO
3 300
3 350
3 400
3 450
3 500
3 550
3 600
3 650
2012 2011 2010R
’000
TGP – median 3 434 3 613 3 577
As in the trend for CEOs, this modest increase in TGP is driven by inflationary increases for incumbents.
Executive DirectorFinancial Services: Large-cap Executive Director
2 500
2 600
2 700
2 800
2 900
3 000
3 100
3 200
3 300
3 400
2012 2011 2010
R’0
00
TGP – median 3 355 3 184 2 822
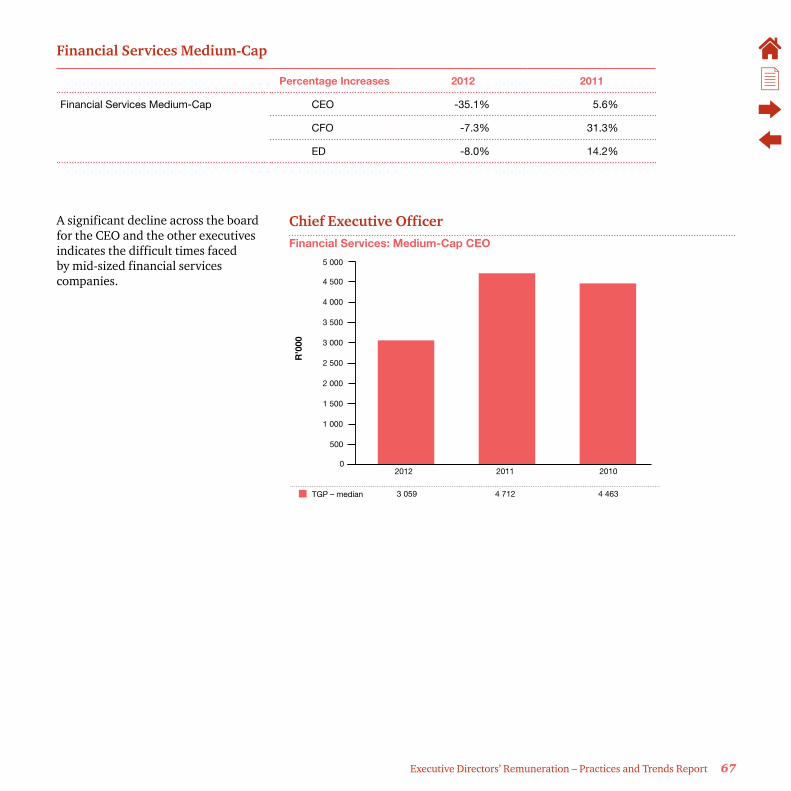
Executive Directors’ Remuneration – Practices and Trends Report 67
Financial Services Medium-Cap
Percentage Increases 2012 2011
Financial Services Medium-Cap CEO -35.1% 5.6%
CFO -7.3% 31.3%
ED -8.0% 14.2%
A significant decline across the board for the CEO and the other executives indicates the difficult times faced by mid-sized financial services companies.
Chief Executive OfficerFinancial Services: Medium-Cap CEO
0
500
1 000
1 500
2 000
2 500
3 000
3 500
4 000
4 500
5 000
2012 2011 2010
R’0
00
TGP – median 3 059 4 712 4 463
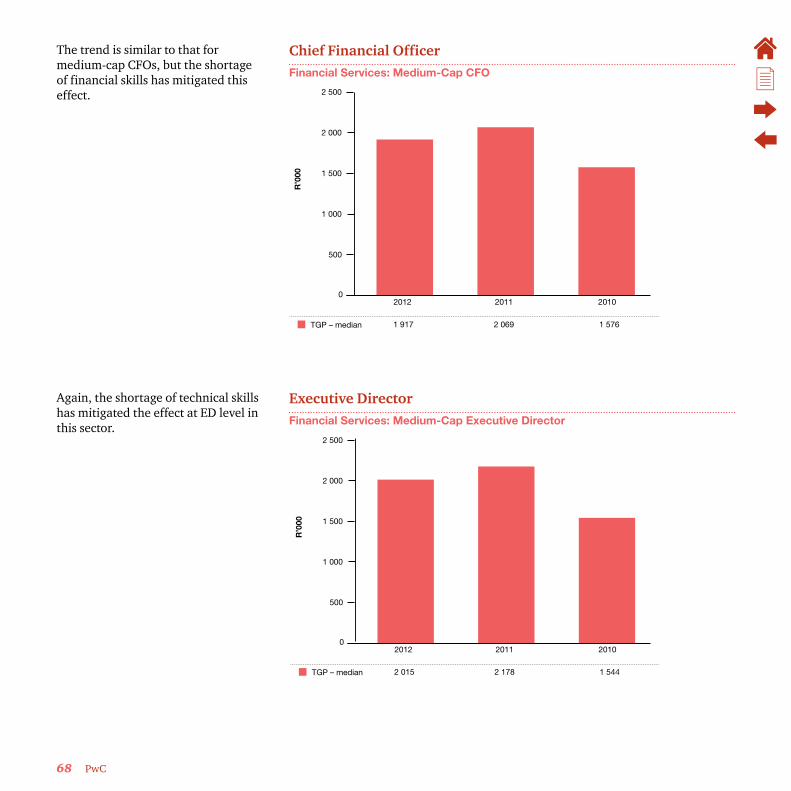
68 PwC
The trend is similar to that for medium-cap CFOs, but the shortage of financial skills has mitigated this effect.
Chief Financial OfficerFinancial Services: Medium-Cap CFO
0
500
1 000
1 500
2 000
2 500
2012 2011 2010R
’000
TGP – median 1 917 2 069 1 576
Again, the shortage of technical skills has mitigated the effect at ED level in this sector.
Executive Director Financial Services: Medium-Cap Executive Director
0
500
1 000
1 500
2 000
2 500
2012 2011 2010
R’0
00
TGP – median 2 015 2 178 1 544
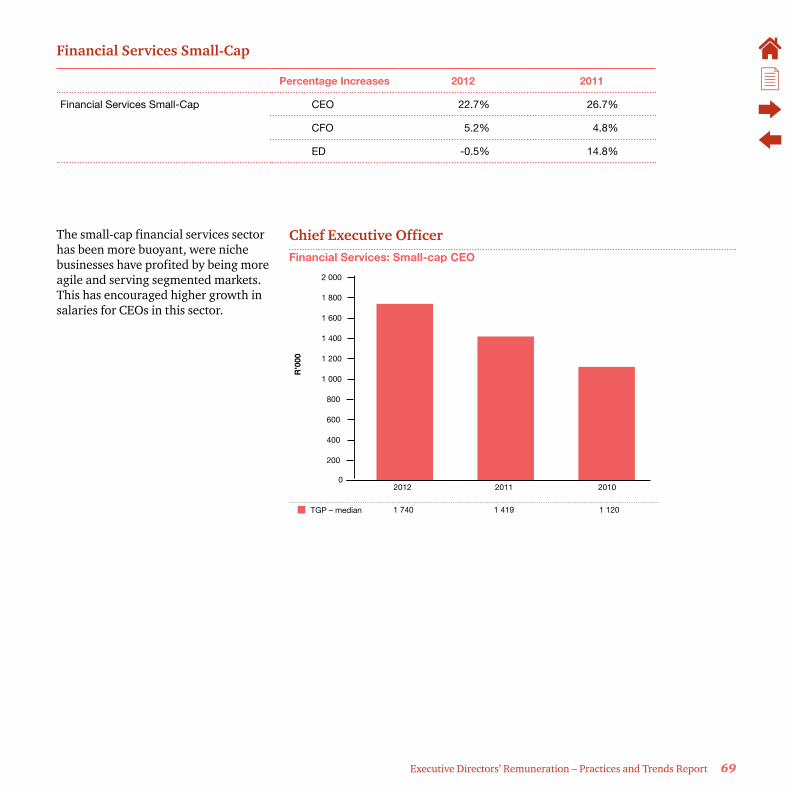
Executive Directors’ Remuneration – Practices and Trends Report 69
Financial Services Small-Cap
Percentage Increases 2012 2011
Financial Services Small-Cap CEO 22.7% 26.7%
CFO 5.2% 4.8%
ED -0.5% 14.8%
The small-cap financial services sector has been more buoyant, were niche businesses have profited by being more agile and serving segmented markets. This has encouraged higher growth in salaries for CEOs in this sector.
Chief Executive OfficerFinancial Services: Small-cap CEO
0
200
400
600
800
1 000
1 200
1 400
1 600
1 800
2 000
2012 2011 2010
R’0
00
TGP – median 1 740 1 419 1 120
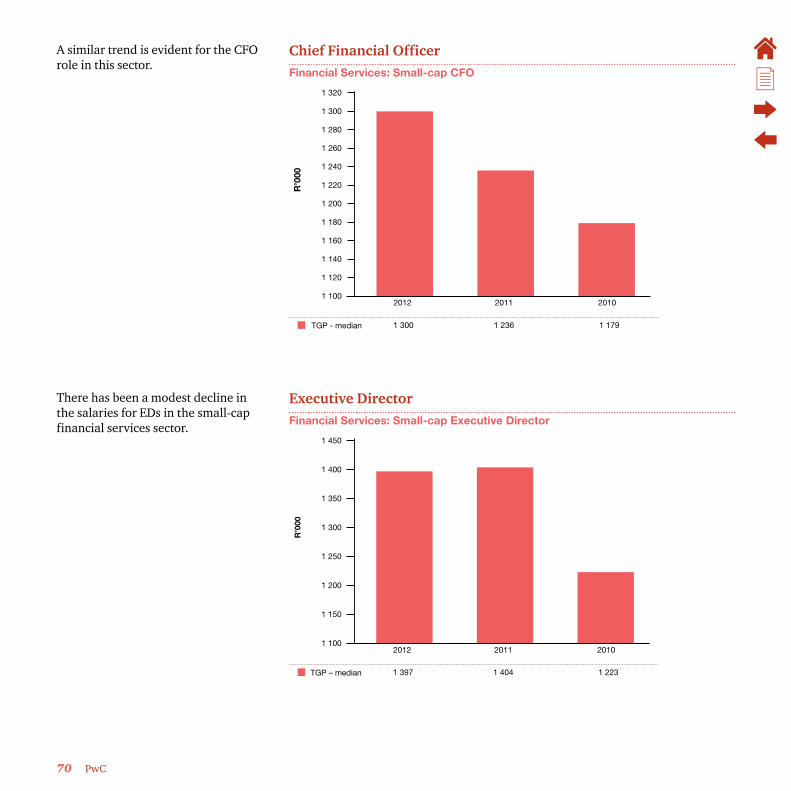
70 PwC
A similar trend is evident for the CFO role in this sector.
Chief Financial OfficerFinancial Services: Small-cap CFO
1 100
1 120
1 140
1 160
1 180
1 200
1 220
1 240
1 260
1 280
1 300
1 320
2012 2011 2010R
’000
TGP - median 1 300 1 236 1 179
There has been a modest decline in the salaries for EDs in the small-cap financial services sector.
Executive DirectorFinancial Services: Small-cap Executive Director
1 100
1 150
1 200
1 250
1 300
1 350
1 400
1 450
2012 2011 2010
R’0
00
TGP – median 1 397 1 404 1 223
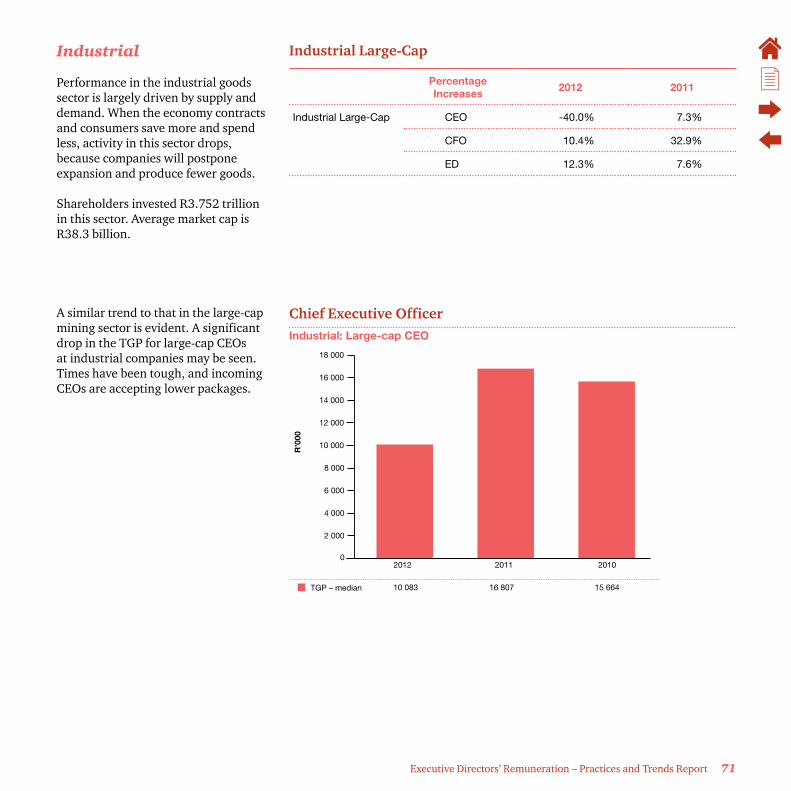
Executive Directors’ Remuneration – Practices and Trends Report 71
Industrial
Performance in the industrial goods sector is largely driven by supply and demand. When the economy contracts and consumers save more and spend less, activity in this sector drops, because companies will postpone expansion and produce fewer goods.
Shareholders invested R3.752 trillion in this sector. Average market cap is R38.3 billion.
Chief Executive OfficerIndustrial: Large-cap CEO
0
2 000
4 000
6 000
8 000
10 000
12 000
14 000
16 000
18 000
2012 2011 2010
R’0
00
TGP – median 10 083 16 807 15 664
Industrial Large-Cap
Percentage Increases
2012 2011
Industrial Large-Cap CEO -40.0% 7.3%
CFO 10.4% 32.9%
ED 12.3% 7.6%
A similar trend to that in the large-cap mining sector is evident. A significant drop in the TGP for large-cap CEOs at industrial companies may be seen. Times have been tough, and incoming CEOs are accepting lower packages.

72 PwC
The shortage of financial skills and experience required for CFOs of large-cap industrial companies has supported a modest increase in TGP.
Chief Financial OfficerIndustrial: Large-cap CFO
0
1 000
2 000
3 000
4 000
5 000
6 000
7 000
2012 2011 2010R
’000
TGP – median 5 937 5 378 4 048
A similar shortage of technical skills has supported the modest increase in TGP for the EDs in this sector.
Executive DirectorIndustrial: Large-cap Executive Director
0
1 000
2 000
3 000
4 000
5 000
6 000
2012 2011 2010
R’0
00
TGP – median 4 857 4 327 4 021

Executive Directors’ Remuneration – Practices and Trends Report 73
Industrial Medium-Cap
Percentage Increases 2012 2011
Industrial Medium-Cap CEO 5.7% 3.5%
CFO 4.9% 2.8%
ED 11.4% 7.9%
The fortunes of CEOs in the medium-cap industrial sector have been better, with reasonable stability within the role, and increases driven by inflationary increases for incumbents.
Chief Executive OfficerIndustrial: Medium-cap CEO
A similar trend is evident for the CFOs.
3 900
4 000
4 100
4 200
4 300
4 400
4 500
4 600
2012 2011 2010
R’0
00
TGP – median 4 562 4 314 4 167

74 PwC
A similar trend is evident for the CFOs. Chief Financial OfficerIndustrial: Medium-cap CFO
2 800
2 850
2 900
2 950
3 000
3 050
3 100
3 150
3 200
3 250
2012 2011 2010R
’000
TGP – median 3 188 3 040 2 958
Somewhat higher increases are observed for the EDs, indicating a further demand for their technical skills.
Executive DirectorIndustrial: Medium-cap Executive Director
0
500
1 000
1 500
2 000
2 500
3 000
3 500
2012 2011 2010
R’0
00
TGP – median 3 178 2 854 2 644
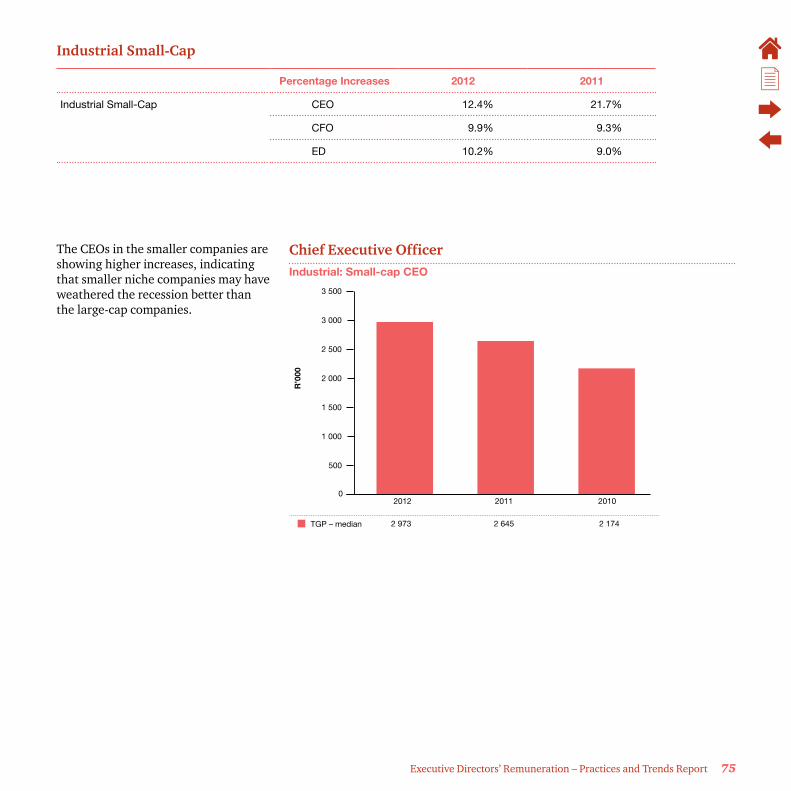
Executive Directors’ Remuneration – Practices and Trends Report 75
Industrial Small-Cap
Percentage Increases 2012 2011
Industrial Small-Cap CEO 12.4% 21.7%
CFO 9.9% 9.3%
ED 10.2% 9.0%
Chief Executive OfficerIndustrial: Small-cap CEO
0
500
1 000
1 500
2 000
2 500
3 000
3 500
2012 2011 2010
R’0
00
TGP – median 2 973 2 645 2 174
The CEOs in the smaller companies are showing higher increases, indicating that smaller niche companies may have weathered the recession better than the large-cap companies.
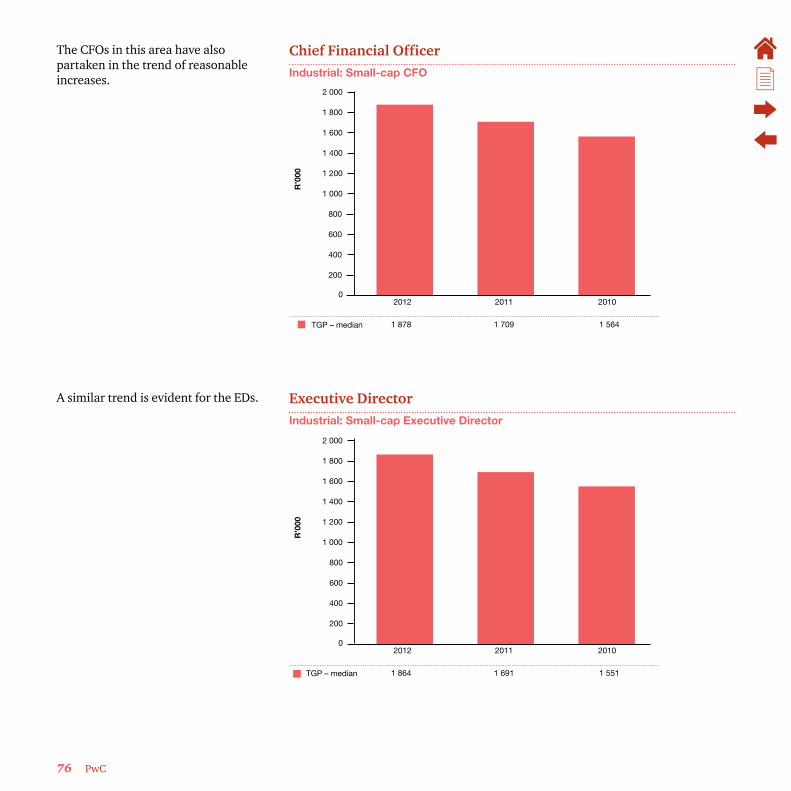
76 PwC
The CFOs in this area have also partaken in the trend of reasonable increases.
Chief Financial OfficerIndustrial: Small-cap CFO
0
200
400
600
800
1 000
1 200
1 400
1 600
1 800
2 000
2012 2011 2010R
’000
TGP – median 1 878 1 709 1 564
A similar trend is evident for the EDs. Executive DirectorIndustrial: Small-cap Executive Director
0
200
400
600
800
1 000
1 200
1 400
1 600
1 800
2 000
2012 2011 2010
R’0
00
TGP – median 1 864 1 691 1 551
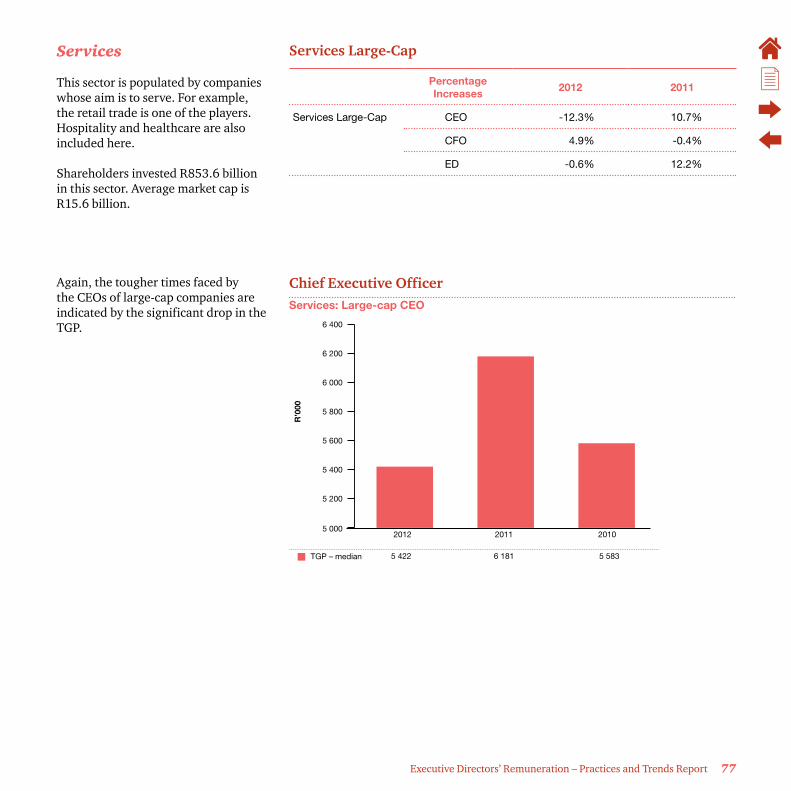
Executive Directors’ Remuneration – Practices and Trends Report 77
Services
This sector is populated by companies whose aim is to serve. For example, the retail trade is one of the players. Hospitality and healthcare are also included here.
Shareholders invested R853.6 billion in this sector. Average market cap is R15.6 billion.
Services Large-Cap
Percentage Increases
2012 2011
Services Large-Cap CEO -12.3% 10.7%
CFO 4.9% -0.4%
ED -0.6% 12.2%
Again, the tougher times faced by the CEOs of large-cap companies are indicated by the significant drop in the TGP.
Chief Executive OfficerServices: Large-cap CEO
5 000
5 200
5 400
5 600
5 800
6 000
6 200
6 400
2012 2011 2010
R’0
00
TGP – median 5 422 6 181 5 583

78 PwC
However, the demand for financial skills has meant that the CFO’s role has shown a substantial increase.
Chief Financial OfficerServices: Large-cap CFO
3 000
3 050
3 100
3 150
3 200
3 250
3 300
2012 2011 2010R
’000
TGP – median 3 239 3 087 3 100
The more generic skills of services EDs, compared to the EDs of mining and financial services, have meant that ED packages in the large-cap services area have declined.
Executive DirectorServices: Large-cap Executive Director
2 250
2 300
2 350
2 400
2 450
2 500
2 550
2 600
2 650
2 700
2 750
2012 2011 2010
R’0
00
TGP – median 2 708 2 724 2 427
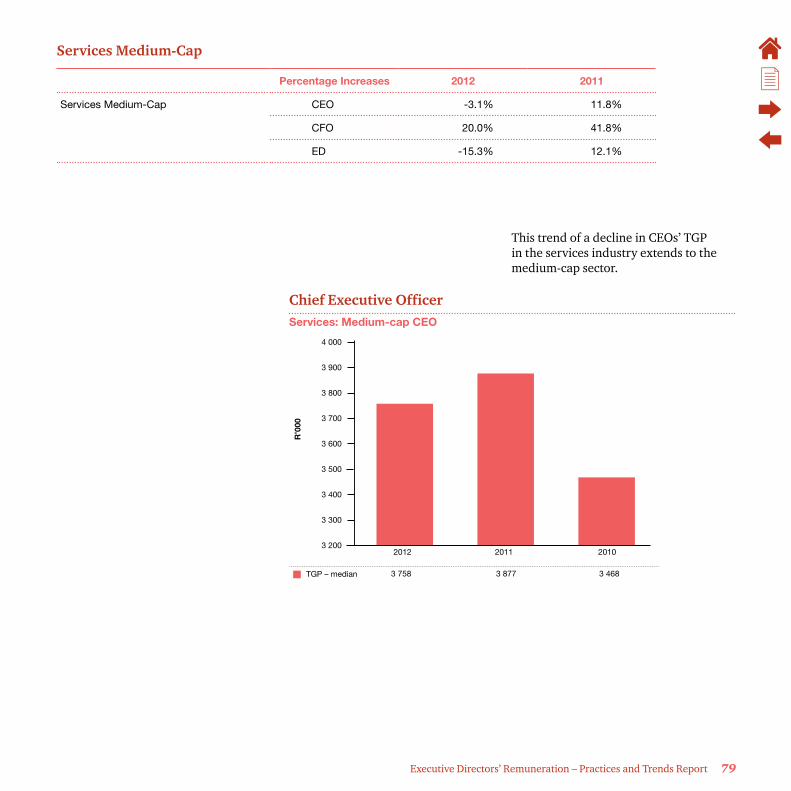
Executive Directors’ Remuneration – Practices and Trends Report 79
Services Medium-Cap
Percentage Increases 2012 2011
Services Medium-Cap CEO -3.1% 11.8%
CFO 20.0% 41.8%
ED -15.3% 12.1%
This trend of a decline in CEOs’ TGP in the services industry extends to the medium-cap sector.
Chief Executive OfficerServices: Medium-cap CEO
3 200
3 300
3 400
3 500
3 600
3 700
3 800
3 900
4 000
2012 2011 2010
R’0
00
TGP – median 3 758 3 877 3 468
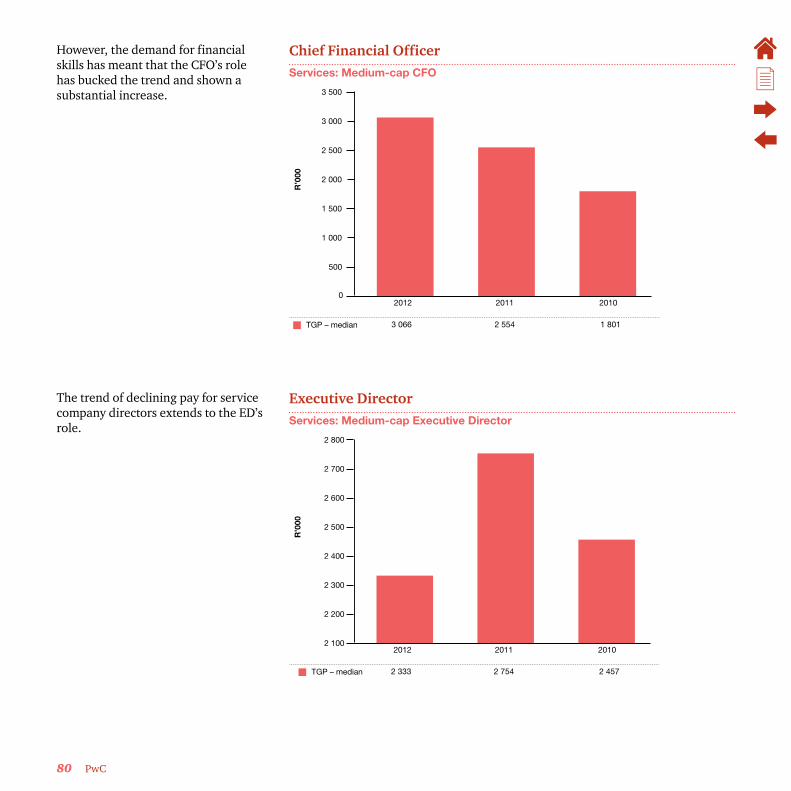
80 PwC
However, the demand for financial skills has meant that the CFO’s role has bucked the trend and shown a substantial increase.
Chief Financial OfficerServices: Medium-cap CFO
0
500
1 000
1 500
2 000
2 500
3 000
3 500
2012 2011 2010R
’000
TGP – median 3 066 2 554 1 801
The trend of declining pay for service company directors extends to the ED’s role.
Executive DirectorServices: Medium-cap Executive Director
2 100
2 200
2 300
2 400
2 500
2 600
2 700
2 800
2012 2011 2010
R’0
00
TGP – median 2 333 2 754 2 457

Executive Directors’ Remuneration – Practices and Trends Report 81
Services Small-Cap
Percentage Increases 2012 2011
Services Small-Cap CEO -4.1% 11.7%
CFO -3.0% -1.4%
ED 2.1% 10.4%
The small-cap segment of the services sector is also not immune to the trend of a declining TGP for this sector.
Chief Executive OfficerServices: Small-cap CEO
2 450
2 500
2 550
2 600
2 650
2 700
2 750
2 800
2 850
2 900
2 950
3 000
2012 2011 2010
R’0
00
TGP – median 2 835 2 957 2 647
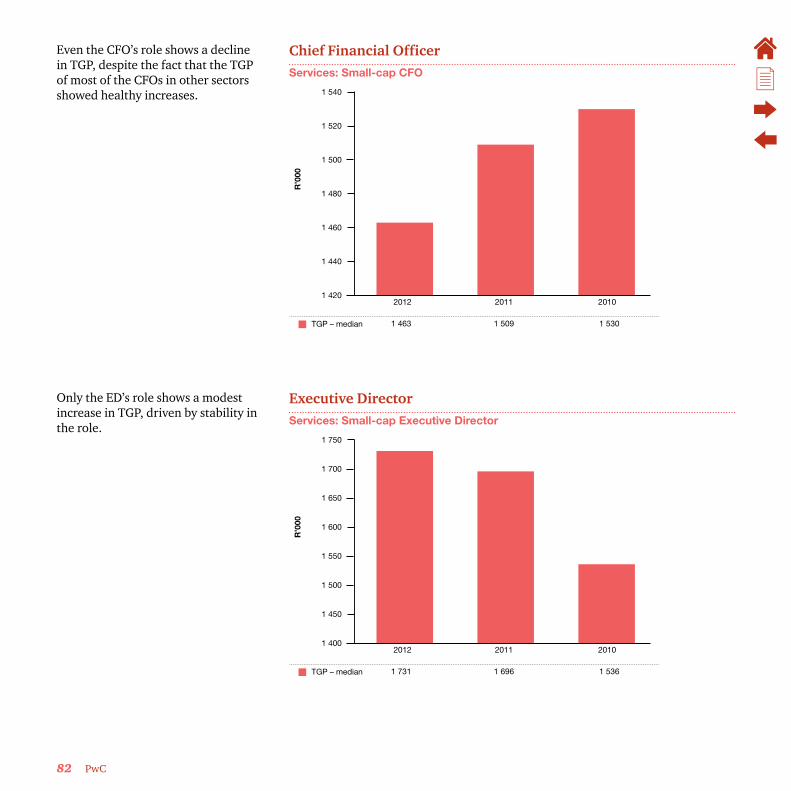
82 PwC
Even the CFO’s role shows a decline in TGP, despite the fact that the TGP of most of the CFOs in other sectors showed healthy increases.
Chief Financial OfficerServices: Small-cap CFO
1 420
1 440
1 460
1 480
1 500
1 520
1 540
2012 2011 2010R
’000
TGP – median 1 463 1 509 1 530
Only the ED’s role shows a modest increase in TGP, driven by stability in the role.
Executive DirectorServices: Small-cap Executive Director
1 400
1 450
1 500
1 550
1 600
1 650
1 700
1 750
2012 2011 2010
R’0
00
TGP – median 1 731 1 696 1 536

Executive Directors’ Remuneration – Practices and Trends Report 83
AltX Companies
The AltX market is the investment vehicle for small and medium-sized companies. AltX provides smaller companies with a clear growth path and access to capital. This sector has a similar intent to the AIM market of the London Stock Exchange.
AltX
Percentage Increases
2012 2011
AltX CEO 12.2% 9.0%
CFO 9.3% 12.5%
ED 26.4% 13.6%
The CEOs of AltX companies have fared better, with reasonable increases in their TGP.
Chief Executive OfficerAltX CEO
0
200
400
600
800
1 000
1 200
1 400
1 600
1 800
2 000
2012 2011 2010
R’0
00
TGP – median 1 717 1 530 1 404
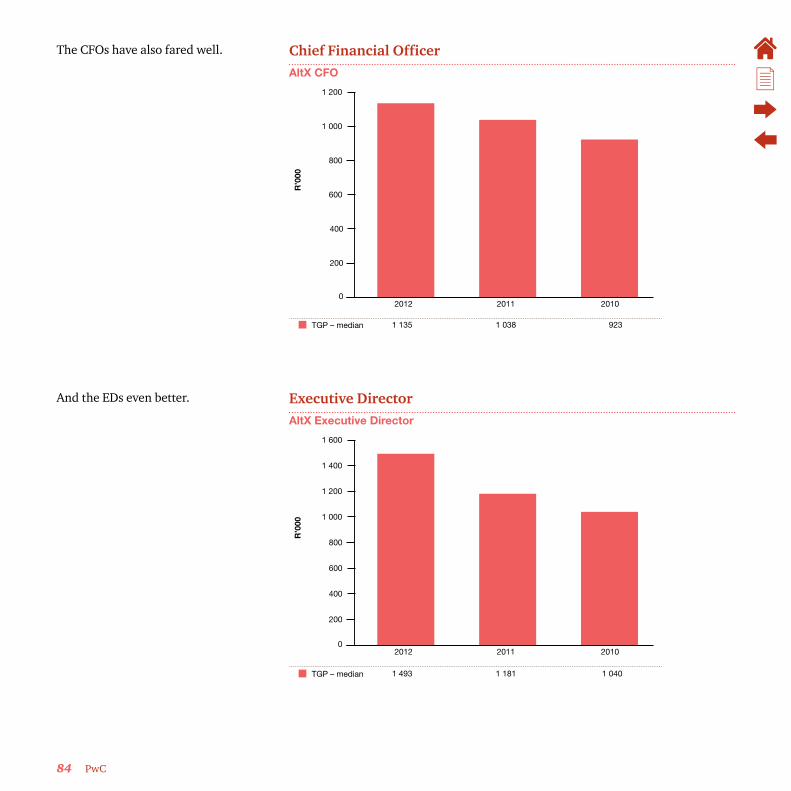
84 PwC
The CFOs have also fared well. Chief Financial OfficerAltX CFO
0
200
400
600
800
1 000
1 200
2012 2011 2010R
’000
TGP – median 1 135 1 038 923
And the EDs even better. Executive DirectorAltX Executive Director
0
200
400
600
800
1 000
1 200
1 400
1 600
2012 2011 2010
R’0
00
TGP – median 1 493 1 181 1 040

Executive Directors’ Remuneration – Practices and Trends Report 85
Executive Directors’ Total Short-Term Incentives – JSE Trends
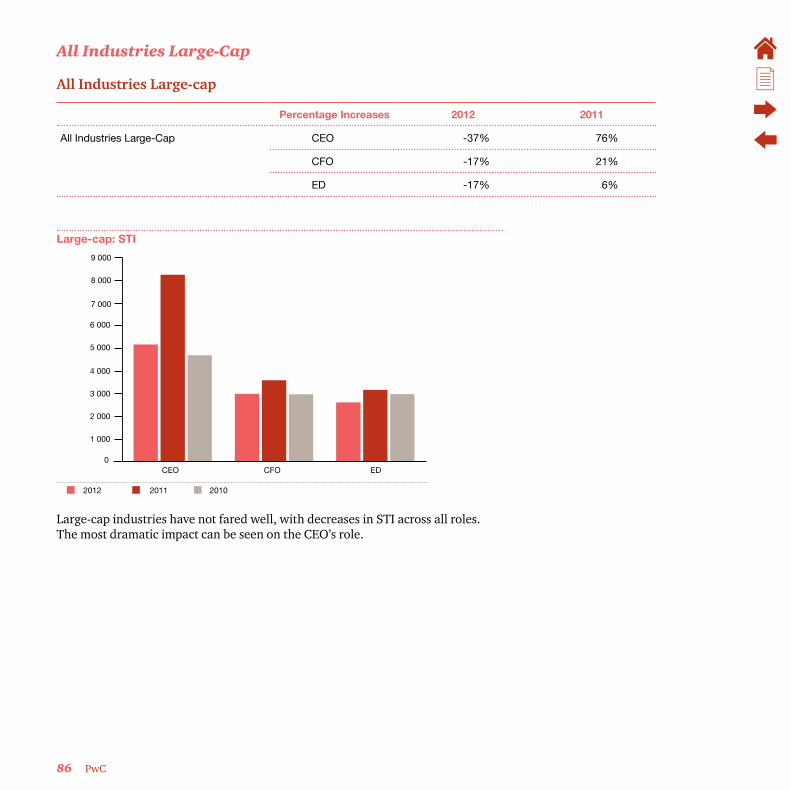
86 PwC
All Industries Large-Cap
All Industries Large-cap
Percentage Increases 2012 2011
All Industries Large-Cap CEO -37% 76%
CFO -17% 21%
ED -17% 6%
Large-cap: STI
Large-cap industries have not fared well, with decreases in STI across all roles. The most dramatic impact can be seen on the CEO’s role.
0
1 000
2 000
3 000
4 000
5 000
6 000
7 000
8 000
9 000
CEO CFO ED
2012 2011 2010
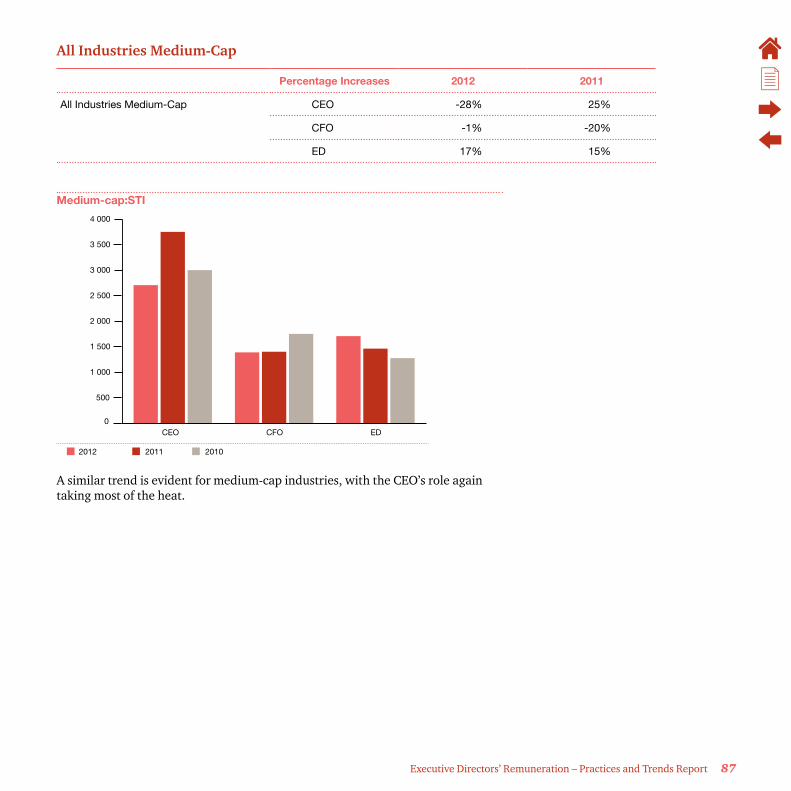
Executive Directors’ Remuneration – Practices and Trends Report 87
All Industries Medium-Cap
Percentage Increases 2012 2011
All Industries Medium-Cap CEO -28% 25%
CFO -1% -20%
ED 17% 15%
Medium-cap:STI
A similar trend is evident for medium-cap industries, with the CEO’s role again taking most of the heat.
0
500
1 000
1 500
2 000
2 500
3 000
3 500
4 000
CEO CFO ED
2012 2011 2010

88 PwC
All Industries Small-Cap
Percentage Increases 2012 2011
All Industries Small-Cap CEO 50% 1%
CFO 27% 18%
ED 27% 34%
Small-cap industries have fared much better, with adaptable niche businesses outperforming the large-cap companies. The CEO’s role has benefited most from this trend.
Small-cap: STI
0
200
400
600
800
1 000
1 200
1 400
1 600
CEO CFO ED
2012 2011 2010

Executive Directors’ Remuneration – Practices and Trends Report 89
Appendices
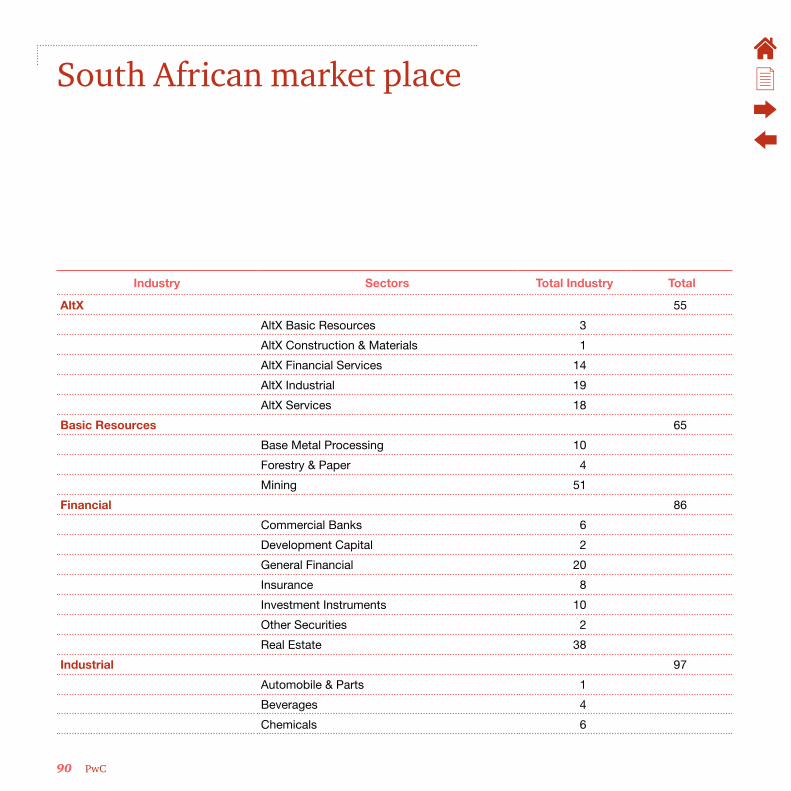
90 PwC
South African market place
Industry Sectors Total Industry Total
AltX 55
AltX Basic Resources 3
AltX Construction & Materials 1
AltX Financial Services 14
AltX Industrial 19
AltX Services 18
Basic Resources 65
Base Metal Processing 10
Forestry & Paper 4
Mining 51
Financial 86
Commercial Banks 6
Development Capital 2
General Financial 20
Insurance 8
Investment Instruments 10
Other Securities 2
Real Estate 38
Industrial 97
Automobile & Parts 1
Beverages 4
Chemicals 6

Executive Directors’ Remuneration – Practices and Trends Report 91
Industry Sectors Total Industry Total
Construction & Materials 17
Food 13
Industrial Goods & Services 25
Oil & Gas 3
Personal & Household Goods 6
Technology 21
Tobacco 1
JSE Africa 2
Financial Holdings 2
Services 65
Healthcare 8
Industrial Goods & Services 13
Media 5
Retail 23
Telecommunications 5
Travel & Leisure 11
Venture Capital 3
Venture Capital 3
Grand Total Grand Total 373 373

92 PwC
About PwC
At PwC we apply our industry knowledge and professional expertise to identify, report, protect, realise and create value for our clients and their stakeholders. The strength of this value proposition is based on the breadth and depth of the firm’s client relationships. Networks are built around clients to provide them with our collective knowledge and resources. Our international network, experience, industry knowledge and business understanding are used to build trust and create value for clients. We are committed to making PwC distinctive through consistent behaviours that enable the success of our clients and people. We call this the PwC Experience and it shapes the way in which we interact with clients, with one another and with the communities in which we operate. This, along with our core values of Teamwork, Leadership and Excellence – and our strong Code of Conduct – guides us in all that we do.

Executive Directors’ Remuneration – Practices and Trends Report 93
Acknowledgements
We would like to thank the following people for their valuable contribution to this report:
• Martin Hopkins – Director: PwC
• Julia Fourie – Senior Manager: PwC
• David Yzelle, Independent project researcher
If you would like more information on the issues raised in this report, please contact:
• Gerald Seegers + 27 11 797 4560 [email protected]
• Martin Hopkins + 27 11 797 5535 [email protected]
• Karen Crous +27 11 797 4616 [email protected]
• Julia Fourie +27 21 529 2170 [email protected]
For press enquiries, please contact:
• Sonja Nel +27 11 797 4207 [email protected]

The information contained in this publication is provided for general information purposes only, and does not constitute the provision of legal or professional advice in any way. Before making any decision or taking any action, a professional adviser should be consulted. No responsibility for loss to any person acting or refraining from action as a result of any material in this publication can be accepted by the author, copyright owner or publisher.
This publication has been prepared for general guidance on matters of interest only, and does not constitute professional advice. You should not act upon the information contained in this publication without obtaining specific professional advice. No representation or warranty (express or implied) is given as to the accuracy or completeness of the information contained in this publication, and, to the extent permitted by law, PricewaterhouseCoopers Inc, its subsidiary and associated companies and entities and their respective directors, employees agents and subcontractors do not accept or assume any liability, responsibility or duty of care for any consequences of you or anyone else acting, or refraining to act, in reliance on the information contained in this publication or for any decision based on it.
© 2013 PricewaterhouseCoopers (“PwC”), the South African firm. All rights reserved. In this document, “PwC” refers to PricewaterhouseCoopers in South Africa, which is a member firm of PricewaterhouseCoopers International Limited (PwCIL), each member firm of which is a separate legal entity and does not act as an agent of PwCIL. (13-13074)
Scan the QR code to download an electronic copy of this document