Guide to Directors’ Remuneration 2016 - KPMG · 300% 250% 250% Actual award ... • Job...
70
November 2016 Guide to Directors’ Remuneration 2016 kpmg.com/uk/remreport16 A wide-ranging overview of executive and non-executive directors’ remuneration trends in FTSE 350 companies
-
Upload
trinhkhanh -
Category
Documents
-
view
219 -
download
0
Transcript of Guide to Directors’ Remuneration 2016 - KPMG · 300% 250% 250% Actual award ... • Job...
November 2016
Guide to Directors’ Remuneration 2016
kpmg.com/uk/remreport16
A wide-ranging overview of executive and non-executive directors’ remuneration trends in FTSE 350 companies
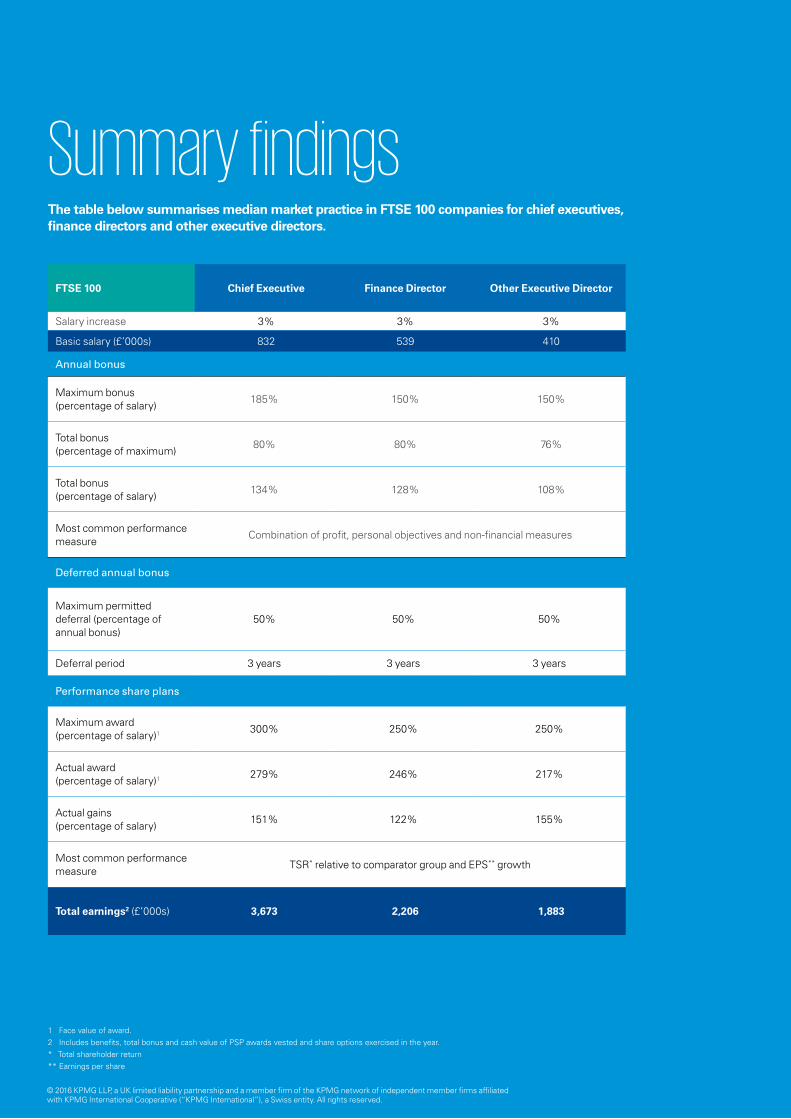
FTSE 100 Chief Executive Finance Director Other Executive Director
Salary increase 3% 3% 3%
Basic salary (£’000s) 832 539 410
Annual bonus
Maximum bonus (percentage of salary)
185% 150% 150%
Total bonus (percentage of maximum)
80% 80% 76%
Total bonus (percentage of salary)
134% 128% 108%
Most common performance measure
Combination of profit, personal objectives and non-financial measures
Deferred annual bonus
Maximum permitted deferral (percentage of annual bonus)
50% 50% 50%
Deferral period 3 years 3 years 3 years
Performance share plans
Maximum award (percentage of salary)1
300% 250% 250%
Actual award (percentage of salary)1 279% 246% 217%
Actual gains (percentage of salary)
151% 122% 155%
Most common performance measure
TSR* relative to comparator group and EPS** growth
Total earnings2 (£’000s) 3,673 2,206 1,883
The table below summarises median market practice in FTSE 100 companies for chief executives, finance directors and other executive directors.
Summary findings
1 Face value of award.2 Includes benefits, total bonus and cash value of PSP awards vested and share options exercised in the year.* Total shareholder return** Earnings per share
© 2016 KPMG LLP, a UK limited liability partnership and a member firm of the KPMG network of independent member firms affiliated with KPMG International Cooperative (“KPMG International”), a Swiss entity. All rights reserved.
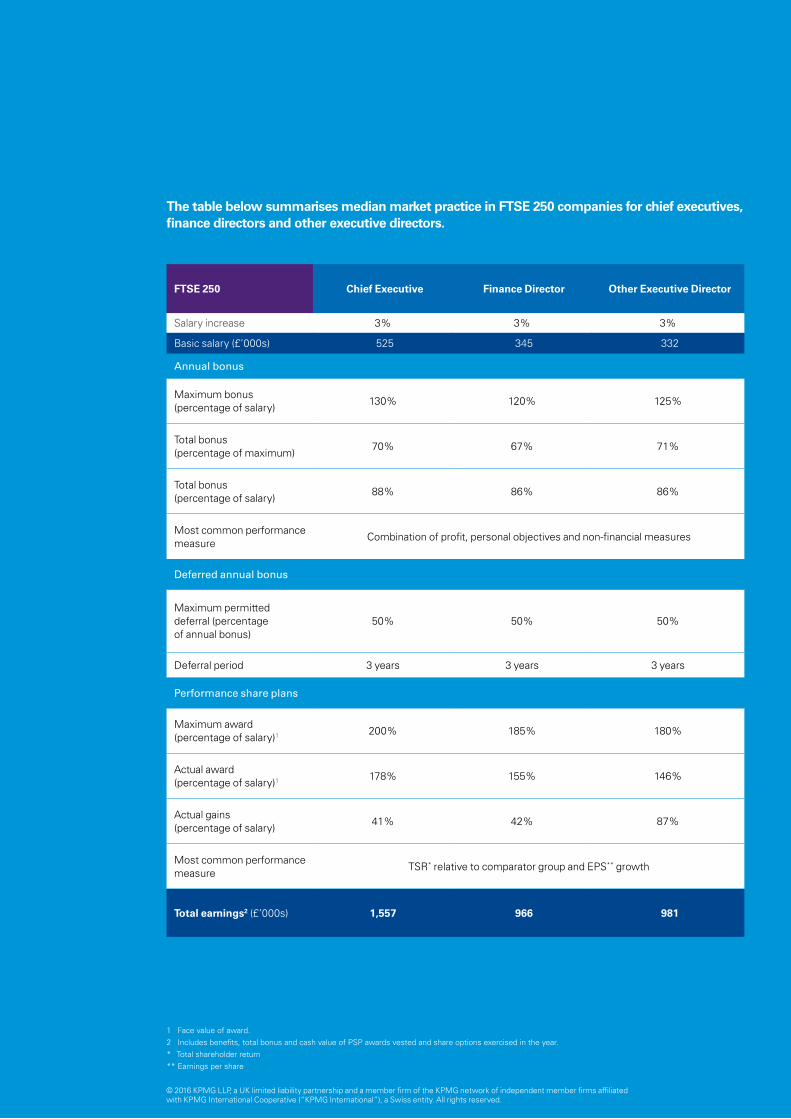
FTSE 250 Chief Executive Finance Director Other Executive Director
Salary increase 3% 3% 3%
Basic salary (£’000s) 525 345 332
Annual bonus
Maximum bonus (percentage of salary)
130% 120% 125%
Total bonus (percentage of maximum)
70% 67% 71%
Total bonus (percentage of salary)
88% 86% 86%
Most common performance measure
Combination of profit, personal objectives and non-financial measures
Deferred annual bonus
Maximum permitted deferral (percentage of annual bonus)
50% 50% 50%
Deferral period 3 years 3 years 3 years
Performance share plans
Maximum award (percentage of salary)1
200% 185% 180%
Actual award (percentage of salary)1 178% 155% 146%
Actual gains (percentage of salary)
41% 42% 87%
Most common performance measure
TSR* relative to comparator group and EPS** growth
Total earnings2 (£’000s) 1,557 966 981
The table below summarises median market practice in FTSE 250 companies for chief executives, finance directors and other executive directors.
1 Face value of award.2 Includes benefits, total bonus and cash value of PSP awards vested and share options exercised in the year.* Total shareholder return** Earnings per share
© 2016 KPMG LLP, a UK limited liability partnership and a member firm of the KPMG network of independent member firms affiliated with KPMG International Cooperative (“KPMG International”), a Swiss entity. All rights reserved.
Basic salary
Around 1 in 5 executive directors in the FTSE 350 received no salary increase, which is the lowest level of pay freezes in the last four years.
Shareholders
Average vote in favour of remuneration reports was 92%. 2016 was hardly the shareholder spring II headlined; nevertheless, the Government and investor bodies have increased their focus on executive pay.
Long term incentives
Median awards for executive directors of FTSE 100 companies were 250% of basic salary whilst awards were 165% of basic salary for executive directors of FTSE 250 companies. The use of some form of TSR measure, either as a single measure or in conjunction with another approach, continues to be the most popular measure across the FTSE 350.
Regulatory
There have not been any changes to remuneration rules affecting UK main market listed companies in 2016, but there has been a great amount of discussion and debate surrounding boardroom pay.
On the other hand, there have been a plethora of changes to the regulatory requirements around remuneration in the financial services sector.
Pensions
The value of pensions for executive directors has largely escaped shareholders’ focus. Pension is now equivalent to a quarter of basic salary for executive directors of FTSE 100 companies, and equivalent to a fifth for executive directors of FTSE 250 companies.
Annual bonus and deferred annual bonus
1 in 10 executive directors in the FTSE 350 received no annual bonus, a slightly lower fraction than last year.
More than a third of FTSE 350 companies paid their executive directors bonuses of over 80% of the maximum opportunity.
Highlights
© 2016 KPMG LLP, a UK limited liability partnership and a member firm of the KPMG network of independent member firms affiliated with KPMG International Cooperative (“KPMG International”), a Swiss entity. All rights reserved.
Contents01 Introduction 6
02 The remuneration landscape 8
03 Market data overview 18
04 Chief executive 26
05 Finance director 34
06 Other executive directors 42
07 Incentives 50
Annual bonus plans 51
Deferred annual bonus plans 54
Performance share plans 56
08 Pensions 58
09 Non-executive directors 62
10 Appendix 68
Methodology & assumptions 68
© 2016 KPMG LLP, a UK limited liability partnership and a member firm of the KPMG network of independent member firms affiliated with KPMG International Cooperative (“KPMG International”), a Swiss entity. All rights reserved.

01
Introduction
This guide analyses the latest trends in FTSE 350 directors’ pay. It covers basic salary, incentives and pensions. We also look at the wider factors that impact executive pay and how these have changed over the year.
© 2016 KPMG LLP, a UK limited liability partnership and a member firm of the KPMG network of independent member firms affiliated with KPMG International Cooperative (“KPMG International”), a Swiss entity. All rights reserved.
01 Introduction
Use of this guideThis publication is designed to be a wide-ranging guide to you as a director or policy maker to assist in remuneration planning at your company. Where possible we have broken down the data obtained from the FTSE 350 into groupings by market capitalisation and turnover, to increase the relevance to you.
We recommend that this guide is used in conjunction with other information and in consultation with your advisers to ensure the data is interpreted correctly and is relevant to your company.
While data provides a useful guide, it is important to note its historical nature, together with the personal circumstances that are attached to each role and benchmark.
This guide is designed to provide you with a wide-ranging picture of trends in market practice in remuneration for executive and non-executive directors in FTSE 350 companies.
The guide includes a detailed look at the market in terms of pay, together with information on the wider executive remuneration landscape, including analysis of shareholder activism and trends in new long term incentive plans.
This guide is structured to show information by position; namely chief executive, finance director, other executive directors and non-executive directors, to enable all the remuneration components of each position to be considered and discussed together.
Where we show total earnings figures we have based this on current disclosures, following the methodology for the single figure table for remuneration in Directors’ Remuneration Reports. Additional information on pensions and plan design for short and long term incentives is shown separately.
This guide is based on data gathered from external data providers (see methodology appendix for more information) and covers companies with financial year ends up to and including 31 March 2016. The analysis of long term incentive plans also includes information from shareholder communications on new plans, and amendments to existing plans put forward for approval at AGMs until 31 August 2016.
How KPMG can help KPMG is one of the UK’s leading advisers on employee incentives and executive remuneration. We are a member of the Remuneration Consultants Group (RCG) and signatory to its Code of Conduct.We have a multi-disciplinary team, able to advise on market practice, corporate governance, incentive plan design, tax, regulatory and accounting aspects of UK and global incentive plans.
We work regularly with clients ranging from Main Market and AIM listed companies to private equity-backed and larger unlisted companies, as well as multinational groups headquartered both in and out of the UK. We have significant experience in advising on all of the following matters:
• Reward strategy and approach.
• Mix of pay and remuneration benchmarking.
• Remuneration committee governance.
• Remuneration regulatory compliance.
• Design and implementation of incentive plans.
• Corporate transactions.
• Accounting, valuations and modelling.
• Ongoing operation of incentive plans.
• Job evaluation and grading.
• Directors’ Remuneration Reports.
7Guide to directors’ remuneration 2016© 2016 KPMG LLP, a UK limited liability partnership and a member firm of the KPMG network of independent member firms affiliated with KPMG International Cooperative (“KPMG International”), a Swiss entity. All rights reserved.
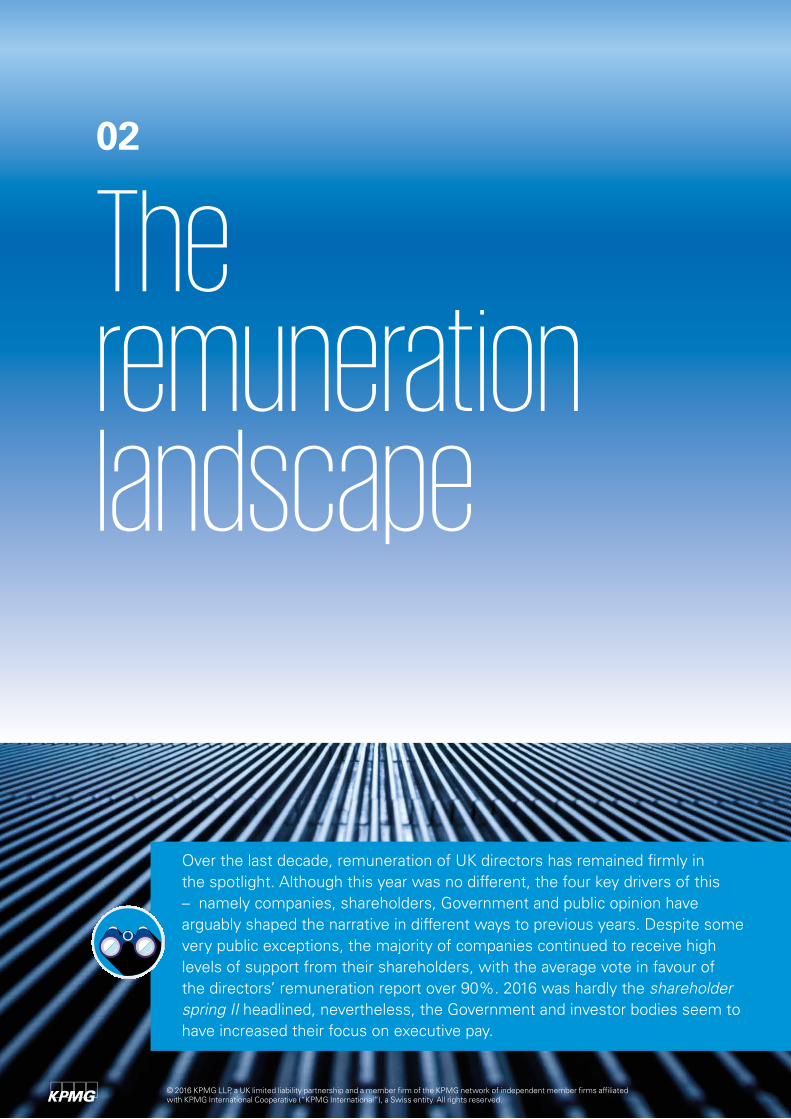
Over the last decade, remuneration of UK directors has remained firmly in the spotlight. Although this year was no different, the four key drivers of this – namely companies, shareholders, Government and public opinion have arguably shaped the narrative in different ways to previous years. Despite some very public exceptions, the majority of companies continued to receive high levels of support from their shareholders, with the average vote in favour of the directors’ remuneration report over 90%. 2016 was hardly the shareholder spring II headlined, nevertheless, the Government and investor bodies seem to have increased their focus on executive pay.
Theremunerationlandscape
02
© 2016 KPMG LLP, a UK limited liability partnership and a member firm of the KPMG network of independent member firms affiliated with KPMG International Cooperative (“KPMG International”), a Swiss entity. All rights reserved.
An overview of the key themes from the reporting season is shown below.
Directors’ remuneration reportingFor the majority of companies, 2016 was the last year of operating and reporting on the implementation of a remuneration policy approved in 2014. It was therefore unsurprising that less than a fifth of the companies took a revised remuneration policy to a shareholder vote this year. Looking closely at this small sample, and shareholding voting patterns in the directors’ remuneration reports across the FTSE 350, the key issues are clear.
Almost three years on from the introduction of the new disclosure and voting on directors’ pay, transparency and interaction between companies and shareholders remains of critical importance. Remuneration committees that have demonstrated on-going engagement with shareholders, particularly at the early stages of the remuneration strategy setting process, rather than simply at year-end, proved to be the ones which avoided surprises at their AGM.
However, engagement and dialogue is not a complete remedy. Shareholders still consider some issues as highly contentious, such as the use of upwards discretion, significant increases in remuneration quantum with less than robust rationale, and lack of transparency in disclosing the performance thresholds for assessing short and long performance. The exercise of discretion in particular is something of a vexed issue – shareholders appear to be interpreting this as downwards discretion is acceptable and upwards is not.
02 The remuneration landscape
Despite the media discussion of a second shareholder spring, the majority of FTSE 350 companies received a high level of support from their shareholders.
“”
Remuneration policy• 37% of companies included their whole
remuneration policy in the remuneration report, although they are not specifically required to do so.
• The link to strategy in the remuneration policy is an area where shareholders would like to see an improvement. This year 82% of companies referenced or provided extracts of their strategic report, and only 22% provided a high level explanation of the link between their strategy and remuneration policy.
• The majority of companies (96%) have clawback and/or malus provisions following the update to the Corporate Governance Code. For those that do not yet have such provisions, many have stated that they will be reviewing their malus/clawback arrangements either next year, or at the time of the next binding vote on policy (12%).
• Only 12% of the companies who received a significant vote against their policy last year, submitted a new policy to vote this year.
Annual remuneration report• There was generally improved disclosure on annual
bonus performance measures and their weightings this year, with 61% of companies disclosing this information in comparison to 49% last year.
• The same improvement was not seen in disclosure of specific annual bonus targets. More companies this year did not disclose this information, relying on the commercial sensitivity exemption (60% this year compared to 46% in 2015).
• The vast majority of these companies do not provide an indication of when annual bonus targets will cease to be commercially sensitive, and therefore when they will be disclosed.
• However, close to half of FTSE 350 companies continue to use commercial sensitivity as rationale for excluding retrospective annual bonus targets from their annual report on remuneration.
9Guide to directors’ remuneration 2016© 2016 KPMG LLP, a UK limited liability partnership and a member firm of the KPMG network of independent member firms affiliated with KPMG International Cooperative (“KPMG International”), a Swiss entity. All rights reserved.
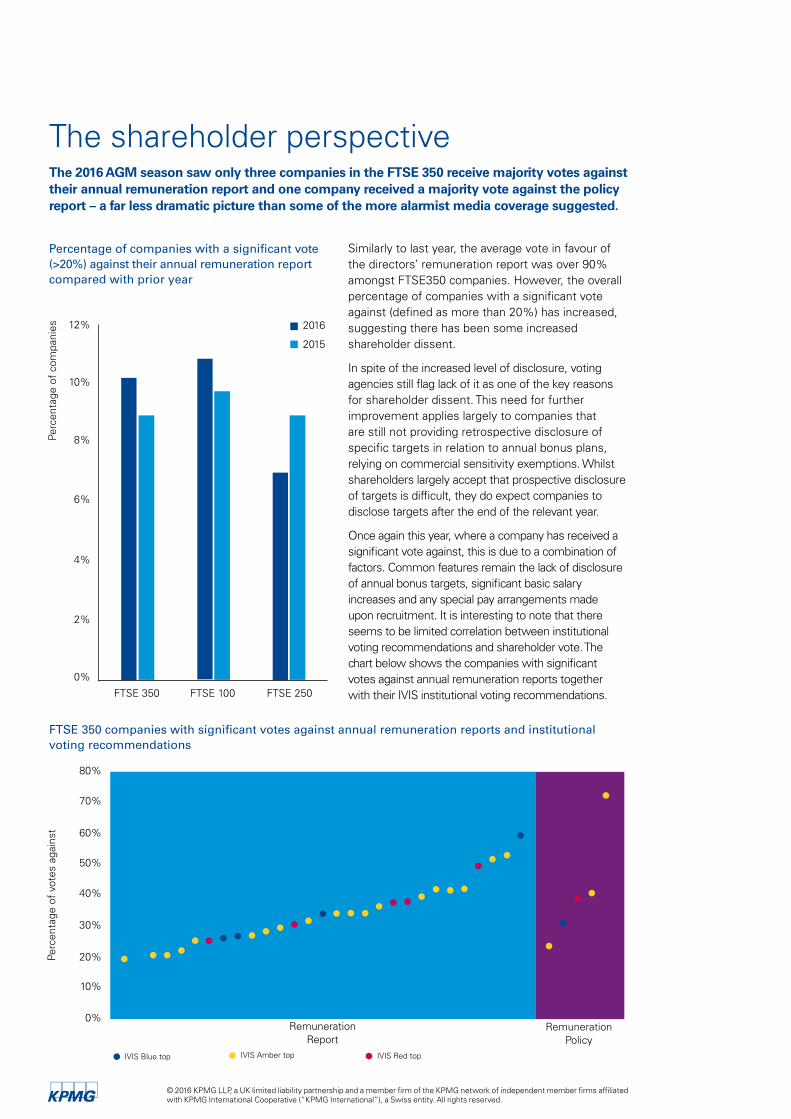
The shareholder perspective The 2016 AGM season saw only three companies in the FTSE 350 receive majority votes against their annual remuneration report and one company received a majority vote against the policy report – a far less dramatic picture than some of the more alarmist media coverage suggested.
IVIS Blue top IVIS Amber top IVIS Red top
FTSE 350 companies with significant votes against annual remuneration reports and institutional voting recommendations
Remuneration Policy
60%
70%
80%
50%
40%
30%
20%
10%
0%
Perc
enta
ge o
f vo
tes
agai
nst
Remuneration Report
Similarly to last year, the average vote in favour of the directors’ remuneration report was over 90% amongst FTSE350 companies. However, the overall percentage of companies with a significant vote against (defined as more than 20%) has increased, suggesting there has been some increased shareholder dissent.
In spite of the increased level of disclosure, voting agencies still flag lack of it as one of the key reasons for shareholder dissent. This need for further improvement applies largely to companies that are still not providing retrospective disclosure of specific targets in relation to annual bonus plans, relying on commercial sensitivity exemptions. Whilst shareholders largely accept that prospective disclosure of targets is difficult, they do expect companies to disclose targets after the end of the relevant year.
Once again this year, where a company has received a significant vote against, this is due to a combination of factors. Common features remain the lack of disclosure of annual bonus targets, significant basic salary increases and any special pay arrangements made upon recruitment. It is interesting to note that there seems to be limited correlation between institutional voting recommendations and shareholder vote. The chart below shows the companies with significant votes against annual remuneration reports together with their IVIS institutional voting recommendations.
Percentage of companies with a significant vote (>20%) against their annual remuneration report compared with prior year
FTSE 350 FTSE 100 FTSE 250
2016
2015
12%
10%
8%
6%
4%
2%
0%
Perc
enta
ge o
f co
mpa
nies
© 2016 KPMG LLP, a UK limited liability partnership and a member firm of the KPMG network of independent member firms affiliated with KPMG International Cooperative (“KPMG International”), a Swiss entity. All rights reserved.
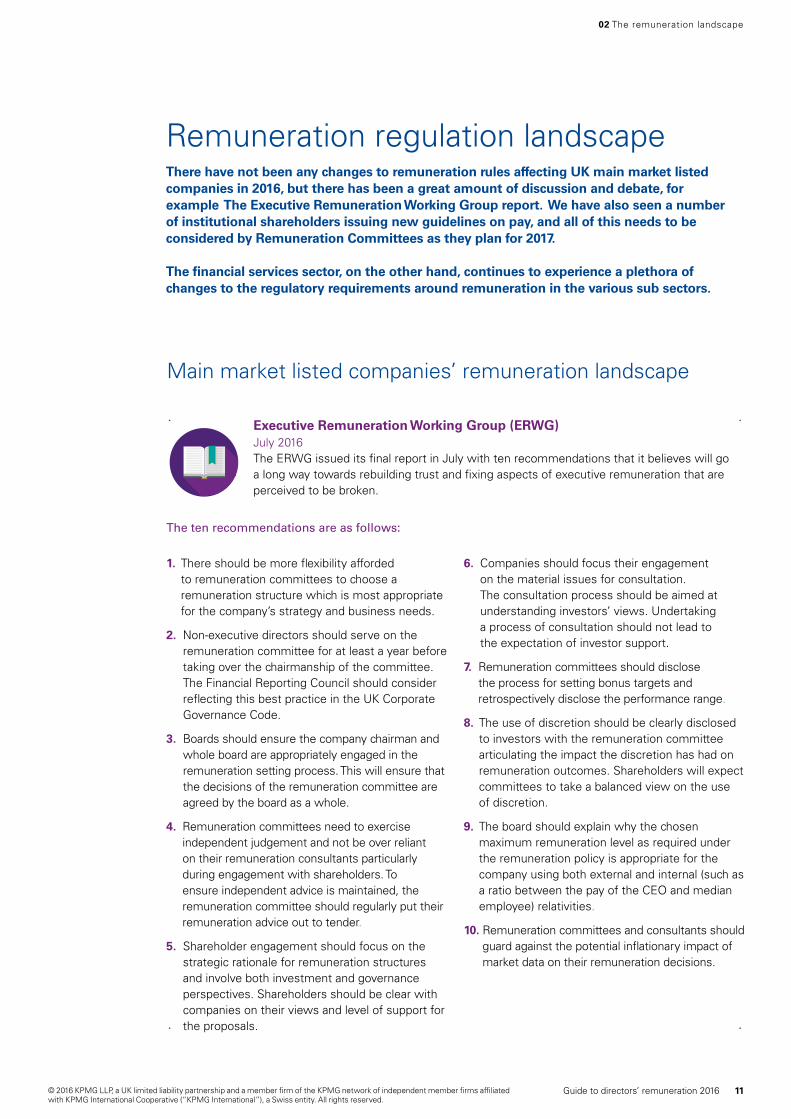
Remuneration regulation landscape There have not been any changes to remuneration rules affecting UK main market listed companies in 2016, but there has been a great amount of discussion and debate, for example The Executive Remuneration Working Group report. We have also seen a number of institutional shareholders issuing new guidelines on pay, and all of this needs to be considered by Remuneration Committees as they plan for 2017.
The financial services sector, on the other hand, continues to experience a plethora of changes to the regulatory requirements around remuneration in the various sub sectors.
Main market listed companies’ remuneration landscape
1. There should be more flexibility afforded to remuneration committees to choose a remuneration structure which is most appropriate for the company’s strategy and business needs.
2. Non-executive directors should serve on the remuneration committee for at least a year before taking over the chairmanship of the committee. The Financial Reporting Council should consider reflecting this best practice in the UK Corporate Governance Code.
3. Boards should ensure the company chairman and whole board are appropriately engaged in the remuneration setting process. This will ensure that the decisions of the remuneration committee are agreed by the board as a whole.
4. Remuneration committees need to exercise independent judgement and not be over reliant on their remuneration consultants particularly during engagement with shareholders. To ensure independent advice is maintained, the remuneration committee should regularly put their remuneration advice out to tender.
5. Shareholder engagement should focus on the strategic rationale for remuneration structures and involve both investment and governance perspectives. Shareholders should be clear with companies on their views and level of support for the proposals.
6. Companies should focus their engagement on the material issues for consultation. The consultation process should be aimed at understanding investors’ views. Undertaking a process of consultation should not lead to the expectation of investor support.
7. Remuneration committees should disclose the process for setting bonus targets and retrospectively disclose the performance range.
8. The use of discretion should be clearly disclosed to investors with the remuneration committee articulating the impact the discretion has had on remuneration outcomes. Shareholders will expect committees to take a balanced view on the use of discretion.
9. The board should explain why the chosen maximum remuneration level as required under the remuneration policy is appropriate for the company using both external and internal (such as a ratio between the pay of the CEO and median employee) relativities.
10. Remuneration committees and consultants should guard against the potential inflationary impact of market data on their remuneration decisions.
Executive Remuneration Working Group (ERWG) July 2016The ERWG issued its final report in July with ten recommendations that it believes will go a long way towards rebuilding trust and fixing aspects of executive remuneration that are perceived to be broken.
02 The remuneration landscape
The ten recommendations are as follows:
11Guide to directors’ remuneration 2016© 2016 KPMG LLP, a UK limited liability partnership and a member firm of the KPMG network of independent member firms affiliated with KPMG International Cooperative (“KPMG International”), a Swiss entity. All rights reserved.
Financial services regulation
• Expansion of guidance on the use of commercial sensitivity in relation to the disclosure of performance targets, providing that commercial sensitivity should generally be based on company specific circumstances.
• Clarification of the expectations on the exercise of discretion by the remuneration committee to ensure that remuneration outcomes balance both managements’ performance and shareholder experience.
• Expectation that a meaningful comparator group should be chosen when reporting on the percentage change in the CEO’s remuneration and not, for instance, a narrow group of senior managers.
• Expectation that the maximum salary, including each component of remuneration, should be disclosed and explained for each executive director in the future policy table.
• Expectation that where no payment to past directors or for loss of office has been made companies should consider including a statement in the remuneration report confirming this.
GC100 and Investor Group guidance August 2016The GC100 and Investor Group published a revised version of its Directors’ Remuneration Reporting Guidance to further assist companies and investors in the interpretation of the directors’ remuneration reporting regulations.
The revisions made to the guidance include:
EU Referendum/Brexit June 2016On 23 June, the UK voted to leave the EU, a result which will undoubtedly have profound implications for the financial services industry.
As things stand the UK remains in the EU and prior to any exit (“Brexit”) it is expected that there will be wide reaching negotiations which could see the UK position itself in a number of different ways in relation to the EU. There are many potential iterations of what a post Brexit regulatory environment might look like. There is no certainty that EU regulations will no longer apply once Brexit is finalised and even if they stop being directly applicable there is no certainty that the UK regulatory bodies will drop any of the existing regulatory requirements. Of all the remuneration regulations it is only the bonus cap under CRD IV that the UK regulatory bodies have not shown full support for. On that basis, UK firms are expected to continue to operate on the basis that the European remuneration regulations will continue to apply.
Alternative Investment Fund Managers Directive (AIFMD) March 2016
The European Securities and Markets Authority updated its Guidelines on ‘sound remuneration policies’ under AIFMD. The limited changes to the July 2013 established remuneration framework related to the application of remuneration policies to subsidiaries of a credit institution.
These guidelines will apply from 1 January 2017, subject to any transitional provisions.
© 2016 KPMG LLP, a UK limited liability partnership and a member firm of the KPMG network of independent member firms affiliated with KPMG International Cooperative (“KPMG International”), a Swiss entity. All rights reserved.
Markets in Financial Instruments Directive II (‘MiFID II’)
February 2016 The PRA and FCA notified the EBA of their intention to comply with all the provisions included in the EBA guidelines on sound remuneration policies under CRD IV, except for the bonus cap requirement. The UK regulators stated that smaller firms should be allowed to dis-apply the ‘Maximum Ratio Rule’. July 2016 The European Commission published its report assessing the CRD IV remuneration rules. Whilst the recent nature of some of the rules and the widespread application of proportionality have hampered the review exercise the EC still finds that the remuneration rules are generally effective in discouraging excessive risk taking and improving alignment of remuneration and performance.
The report does not make any recommendations on possible changes or clarifications to the remuneration rules but it does conclude that the cost of implementing the rules may sometimes outweigh the benefits. It highlights the requirements for deferral and payments in instruments in small and non-complex organisations or for low levels of variable remuneration as being examples of such cases. The EC will conduct an impact assessment to examine options around the application of proportionality.
September 2016The PRA published the final rules on buy-outs of variable remuneration following a consultation from January 2016, which addressed the practice of buying-out variable remuneration from previous employment in the context of hiring new staff. The new rules are intended to ensure that for
new hires who were ‘material risk takers’ in previous employment, any bought-out awards remained subject to clawback and malus in the new employment. In practice this would involve the old employer notifying the new employer of misconduct or failure of risk management and the corresponding amount by which variable remuneration should be reduced by the new employer.
January 2017 Application of the EBA Guidelines on sound remuneration policies is required from 1 January 2017.
The key changes include:
• Widening of the maximum Ratio Rule. Fixed to variable remuneration ratio of 1:1 (or 1:2 with shareholder approval) will apply to all firms that fall within the scope of the Capital Requirements Directive (CRD).
• Shareholder approval. Firms wanting to increase the fixed to variable remuneration ratio from 1:1 to 1:2 will need to seek approval from external shareholders as well as internal shareholders.
• Long-term incentives and carried interest payments. For the purpose of calculating the amounts subject to the bonus cap, the valuation of LTI and carried interest vehicles will take place at the time of award rather than vest, which is consistent with current practice.
• Dividend and interest payments. Dividend (including any equivalents) and interest payments will not be permitted to accrue as part of share awards or LTIs.
02 The remuneration landscape
The European Parliament and the Council of the European Union issued legislation postponing the formal implementation date of the MiFID II regime by a year, with a new implementation date of 3 January 2018. The implementation date was postponed because the European Securities and Markets Authority (ESMA) did not believe that competent authorities or market participants would have had the necessary systems in place by January 2017.
Investment firms will be required to establish, implement and maintain procedures and measures to ensure the manufacturing of financial instruments complies with the requirements on proper management of conflicts of interest, including remuneration.
The FCA is expected to issue a policy statement on the implementation of MiFID II in 2017.
Capital Requirements Directive IV (CRD IV)
13Guide to directors’ remuneration 2016© 2016 KPMG LLP, a UK limited liability partnership and a member firm of the KPMG network of independent member firms affiliated with KPMG International Cooperative (“KPMG International”), a Swiss entity. All rights reserved.
February 2016 The FCA published a policy statement on the implementation of the UCITS V directive, which set out the changes affecting managers and depositaries of UCITS and Alternative Investment Funds (AIFs). Minor clarifications to the wording of the proposed rules were suggested, the only change worth noting related to non-cash instruments. The wording of the statement clarified that a ‘substantial portion and at least 50% of any variable remuneration component had to consist of non-cash instruments.’ The directive provision clarified that the minimum of 50% did not apply if the management of UCITS was less than 50% of the total portfolio managed by the management company.
Managers of UCITS should be compliant with all of the remuneration requirements from the beginning of the first full performance period starting on or after 18 March 2016.
March 2016 ESMA published its final guidelines on what it deems to be ‘sound remuneration policies’ under the UCITS directive. This provides clarity on the requirements and the expectations on management companies when they are seeking to create and apply a remuneration policy for key staff.
The guidelines will apply from 1 January 2017, subject to transitional provisions.
The FCA has already implemented the remuneration requirements introduced under the UCITS directive in a new Code, the SYSC 19E UCITS Remuneration Code. The ESMA Guidelines provide a more detailed outlook on what management companies are expected to do in certain circumstances and seek to provide clarity on how the directive should be implemented correctly across the EU member states. In contrast, the FCA Code provides a set of prescriptive rules which should be adhered to in order to ensure compliance.
The FCA provisions came into force on 18 March 2016, therefore relevant firms must now be compliant with the remuneration requirements under UCITS V.
January 2016The Solvency II regime came into effect on 1 January 2016 across EU member states and third-party equivalent countries for the majority of insurance and reinsurance companies. The directive contains specific remuneration requirements for material risk takers and control functions that insurers must have in place for performance periods that start on or after 1 January 2016. These include the requirement to balance fixed and variable remuneration, maintaining a multi-year bonus deferral and the possibility of paying no variable remuneration component.
August 2016 The PRA published its Policy Statement and Supervisory Statement on the remuneration requirements under Solvency II. The remuneration requirements are broadly aligned with those already applicable under regulations like CRD IV and AIFMD. The remuneration rules include the requirement to defer at least 40% of variable remuneration over at least 3 years and subject the variable remuneration to malus provisions.
Full compliance is required from PRA category 1 and 2 firms. PRA category 3 to 5 firms are not allowed to disapply the remuneration requirements but can take a proportionate approach to applying the requirements.
Undertakings in Collective Investments in Transferable Securities V (‘UCITS V’)
Solvency II Directive
© 2016 KPMG LLP, a UK limited liability partnership and a member firm of the KPMG network of independent member firms affiliated with KPMG International Cooperative (“KPMG International”), a Swiss entity. All rights reserved.
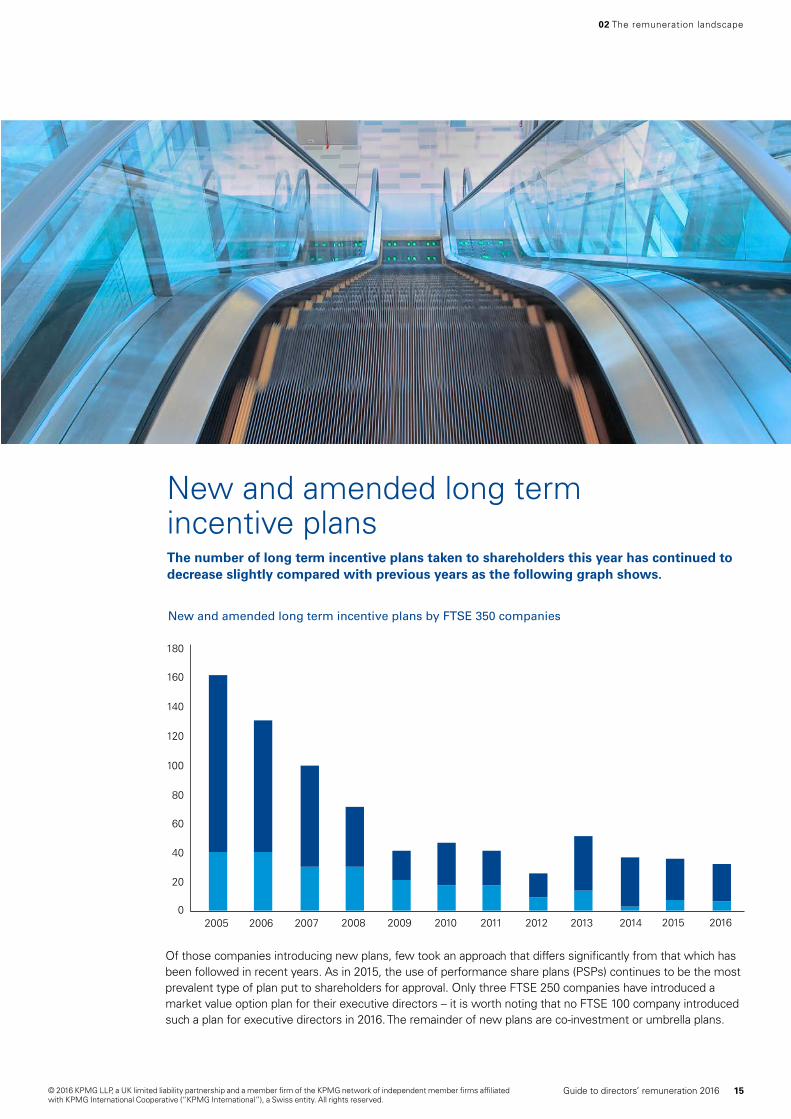
New and amended long term incentive plans The number of long term incentive plans taken to shareholders this year has continued to decrease slightly compared with previous years as the following graph shows.
Of those companies introducing new plans, few took an approach that differs significantly from that which has been followed in recent years. As in 2015, the use of performance share plans (PSPs) continues to be the most prevalent type of plan put to shareholders for approval. Only three FTSE 250 companies have introduced a market value option plan for their executive directors – it is worth noting that no FTSE 100 company introduced such a plan for executive directors in 2016. The remainder of new plans are co-investment or umbrella plans.
New Plans
Amended Plans
2005 2006 2007 2008 2009 2010 2011 2012 2013 2014
180
160
140
120
100
0
80
60
40
20
2015 2016
New and amended long term incentive plans by FTSE 350 companies
02 The remuneration landscape
15Guide to directors’ remuneration 2016© 2016 KPMG LLP, a UK limited liability partnership and a member firm of the KPMG network of independent member firms affiliated with KPMG International Cooperative (“KPMG International”), a Swiss entity. All rights reserved.
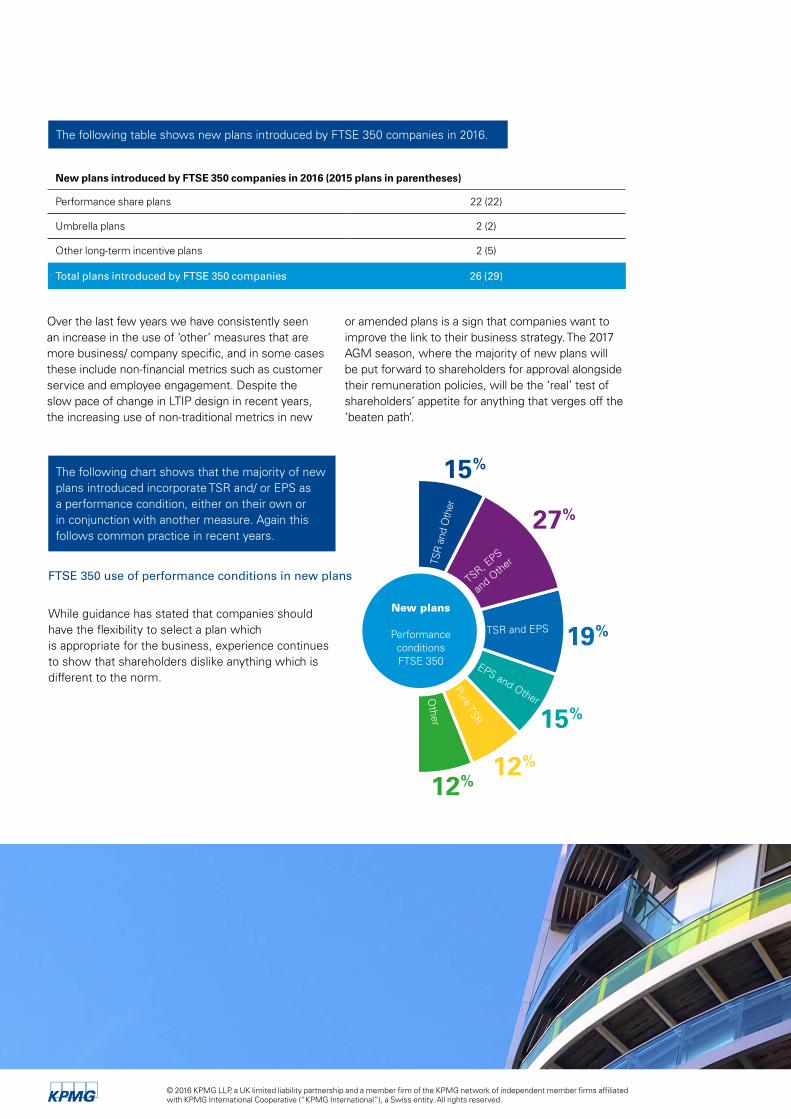
The following chart shows that the majority of new plans introduced incorporate TSR and/ or EPS as a performance condition, either on their own or in conjunction with another measure. Again this follows common practice in recent years.
FTSE 350 use of performance conditions in new plans
The following table shows new plans introduced by FTSE 350 companies in 2016.
New plans introduced by FTSE 350 companies in 2016 (2015 plans in parentheses)
Performance share plans 22 (22)
Umbrella plans 2 (2)
Other long-term incentive plans 2 (5)
Total plans introduced by FTSE 350 companies 26 (29)
15%
New plans
Performance conditions FTSE 350
27%
19%
15%
12%
12%
TSR
and
Oth
er
TSR, EPS
and O
ther
TSR and EPS
EPS and Other
Pure TSR
Other
Over the last few years we have consistently seen an increase in the use of ‘other’ measures that are more business/ company specific, and in some cases these include non-financial metrics such as customer service and employee engagement. Despite the slow pace of change in LTIP design in recent years, the increasing use of non-traditional metrics in new
or amended plans is a sign that companies want to improve the link to their business strategy. The 2017 AGM season, where the majority of new plans will be put forward to shareholders for approval alongside their remuneration policies, will be the ‘real’ test of shareholders’ appetite for anything that verges off the ‘beaten path’.
While guidance has stated that companies should have the flexibility to select a plan which is appropriate for the business, experience continues to show that shareholders dislike anything which is different to the norm.
© 2016 KPMG LLP, a UK limited liability partnership and a member firm of the KPMG network of independent member firms affiliated with KPMG International Cooperative (“KPMG International”), a Swiss entity. All rights reserved.
Looking aheadAlthough there have been no regulatory changes in 2016 the debate on executive pay has continued unabated. We have seen more interested parties entering the debate, with statements from the CBI, the Prime Minister and individual MPs, as well as the continued institutional shareholder focus. The interesting point to note is that while there are many voices agreeing that something is wrong, the view as to what needs to be done differently is more fragmented and there is no clear solution or change being put forward that will “solve” the problem.
Within this environment remuneration committees will be considering what approach to take in 2017, and for many this will mean taking the remuneration policy to shareholders for approval.
So what do we expect to see in the coming months?
The first point to reiterate is that the majority of companies have high levels of support from their shareholders for their policy and approach to pay. Therefore while it is sensible to review and confirm or make changes if required from a business standpoint, there is no need for wholesale change. It is true that shareholder attitudes on some issues have changed over the last three years, so prior approval should not lead a company to take for granted the same support if policy is unchanged, so care does need to be taken. For example if the LTIP remains fit for purpose from a business perspective but has a three-year performance period and no additional holding period, consider whether the link to the long term and alignment with shareholders is sufficient or whether this is an area where change should be considered. Are shareholding guidelines significant and have executives already met or exceeded them?
A second step for companies to take is to ensure an understanding of the shareholder base. Different institutions will have different views on particular issues, and some will be more activist than others. Each year we see examples of companies simply not understanding or being aware of the views of their own big shareholders. To avoid a surprise at the AGM it is imperative to understand this context and to take steps
to address any issues. Equally, start the dialogue early; do not leave it until just before the AGM notice is due to be published and expect shareholders to be supportive.
Companies should continue to focus on their own business context and factors important for future growth and success, rather than focusing on the external pay market. While the competitive pay market is one input to the debate it does not provide answers. In order to clearly demonstrate to shareholders the business rationale for a particular approach the debate has to start from the business strategy, not from what other companies are doing or paying.
While the debate around further changes such as disclosure of the CEO pay ratio, employee representation on boards and limits to variable pay continues it may be wise for companies to consider their response should particular questions be raised by shareholders. This can provide useful context for decisions which are made.
Taking these actions should help to ensure that remuneration committees agree an approach which is based on full information and evidence, which in turn should help the process of explaining this in a transparent fashion which clearly demonstrates the business rationale. It is unlikely the media interest will die down, but what is needed is a reasoned and evidence-led debate between each company and its shareholders to demonstrate that no further regulatory intervention is required. This is a point on which both parties seem to agree, so it is up to them to demonstrate the current governance environment works.
02 The remuneration landscape
17Guide to directors’ remuneration 2016© 2016 KPMG LLP, a UK limited liability partnership and a member firm of the KPMG network of independent member firms affiliated with KPMG International Cooperative (“KPMG International”), a Swiss entity. All rights reserved.
Market data overview
03
© 2016 KPMG LLP, a UK limited liability partnership and a member firm of the KPMG network of independent member firms affiliated with KPMG International Cooperative (“KPMG International”), a Swiss entity. All rights reserved.
Total earnings
Basic salary (£000s)
Total cash (£000s)
Total earnings (£000s)
FTSE 100
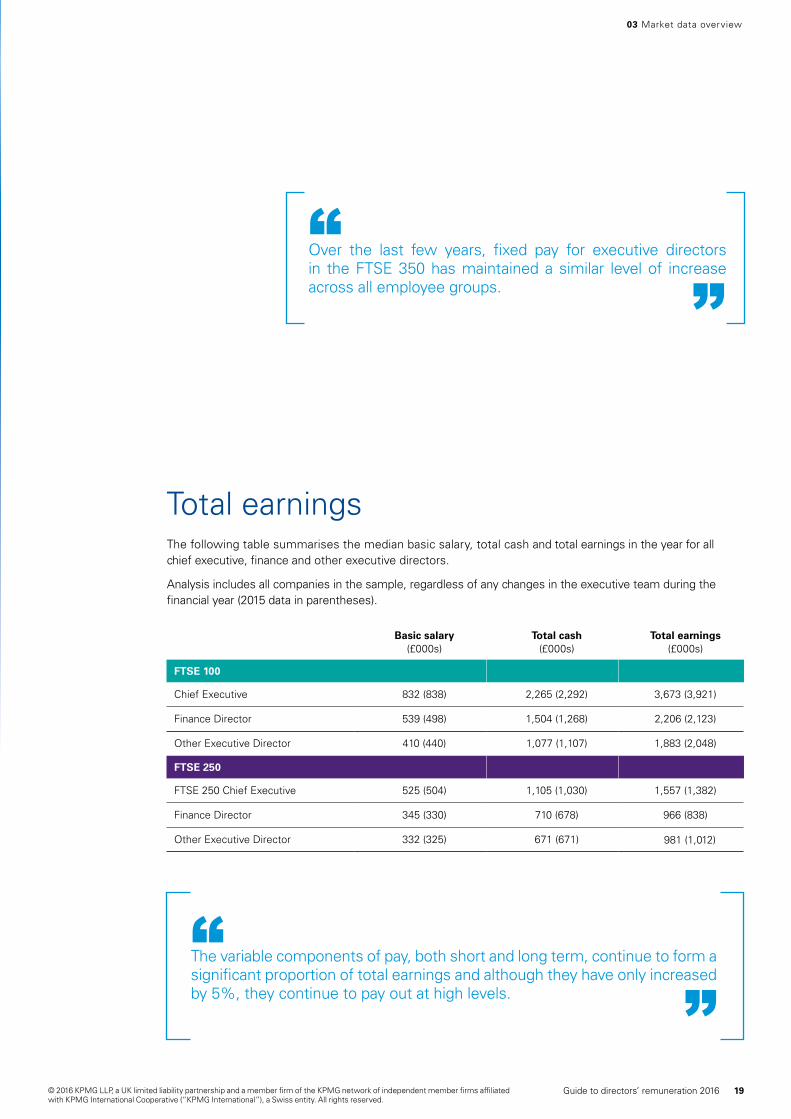
Chief Executive 832 (838) 2,265 (2,292) 3,673 (3,921)
Finance Director 539 (498) 1,504 (1,268) 2,206 (2,123)
Other Executive Director 410 (440) 1,077 (1,107) 1,883 (2,048)
FTSE 250
FTSE 250 Chief Executive 525 (504) 1,105 (1,030) 1,557 (1,382)
Finance Director 345 (330) 710 (678) 966 (838)
Other Executive Director 332 (325) 671 (671) 981 (1,012)
The following table summarises the median basic salary, total cash and total earnings in the year for all chief executive, finance and other executive directors.
Analysis includes all companies in the sample, regardless of any changes in the executive team during the financial year (2015 data in parentheses).
03 Market data overview
Over the last few years, fixed pay for executive directors in the FTSE 350 has maintained a similar level of increase across all employee groups.
“”
“”
The variable components of pay, both short and long term, continue to form a significant proportion of total earnings and although they have only increased by 5%, they continue to pay out at high levels.
19Guide to directors’ remuneration 2016© 2016 KPMG LLP, a UK limited liability partnership and a member firm of the KPMG network of independent member firms affiliated with KPMG International Cooperative (“KPMG International”), a Swiss entity. All rights reserved.
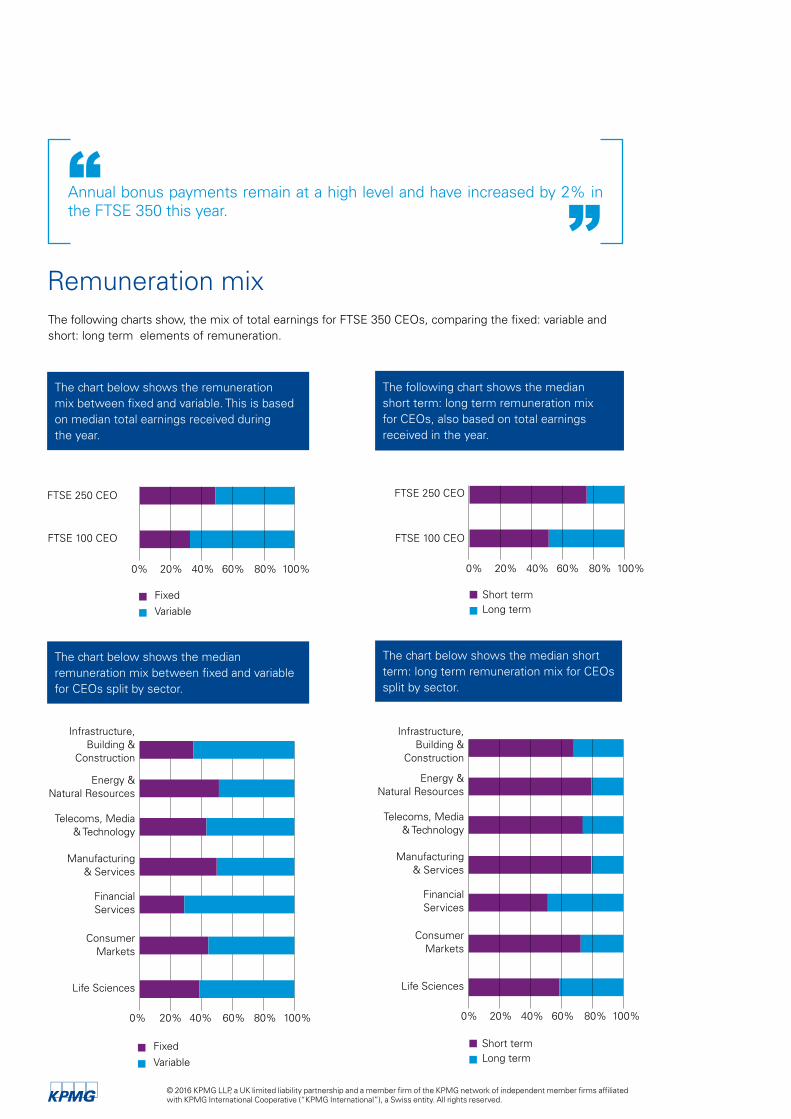
Remuneration mixThe following charts show, the mix of total earnings for FTSE 350 CEOs, comparing the fixed: variable and short: long term elements of remuneration.
The chart below shows the remuneration mix between fixed and variable. This is based on median total earnings received during the year.
The following chart shows the median short term: long term remuneration mix for CEOs, also based on total earnings received in the year.
The chart below shows the median remuneration mix between fixed and variable for CEOs split by sector.
The chart below shows the median short term: long term remuneration mix for CEOs split by sector.
Fixed
Variable
0% 20% 40% 60% 80% 100%
FTSE 100 CEO
FTSE 250 CEO
0% 20% 40% 60% 80% 100%
Short termLong term
FTSE 100 CEO
FTSE 250 CEO
0% 20% 40% 80% 100%
Life Sciences
Consumer Markets
Financial Services
Manufacturing & Services
Telecoms, Media & Technology
Energy & Natural Resources
Infrastructure, Building &
Construction
Fixed
Variable
0% 20% 40% 60%60% 80% 100%
Life Sciences
Consumer Markets
Financial Services
Manufacturing & Services
Telecoms, Media & Technology
Energy & Natural Resources
Infrastructure, Building &
Construction
Short termLong term
Annual bonus payments remain at a high level and have increased by 2% in the FTSE 350 this year.“
”
© 2016 KPMG LLP, a UK limited liability partnership and a member firm of the KPMG network of independent member firms affiliated with KPMG International Cooperative (“KPMG International”), a Swiss entity. All rights reserved.
03 Market data overview
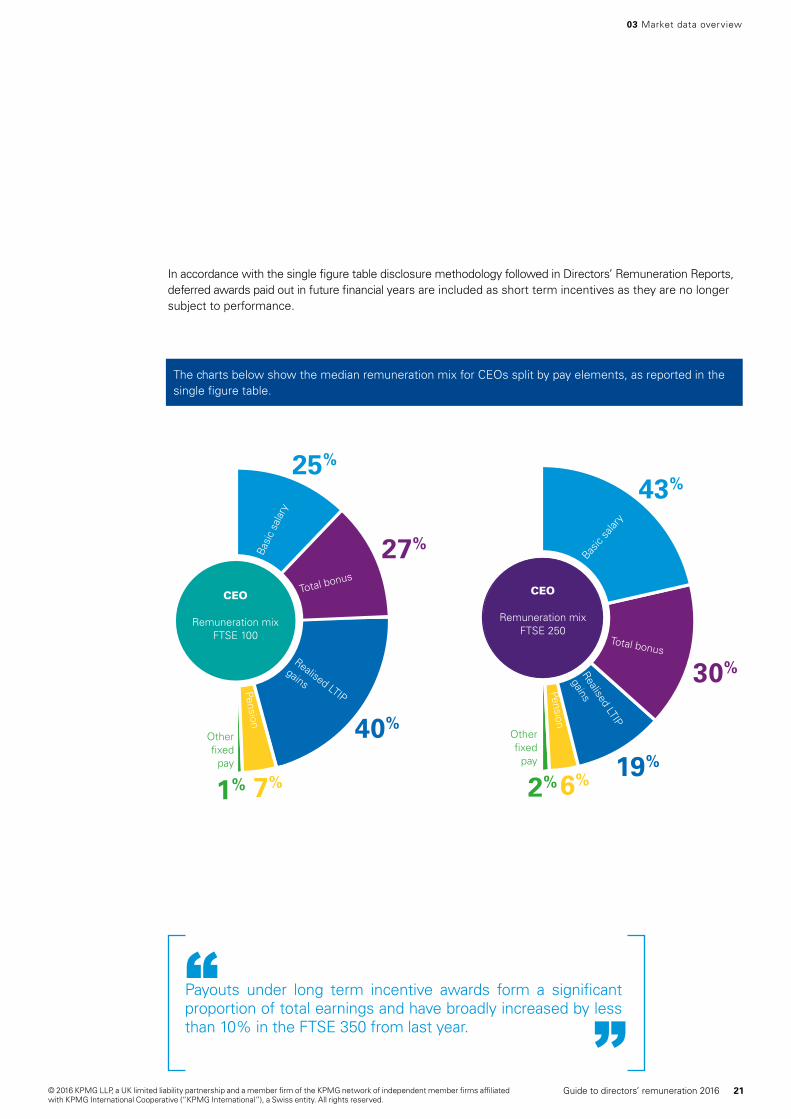
In accordance with the single figure table disclosure methodology followed in Directors’ Remuneration Reports, deferred awards paid out in future financial years are included as short term incentives as they are no longer subject to performance.
The charts below show the median remuneration mix for CEOs split by pay elements, as reported in the single figure table.
40%
27%
25%
7%1%
CEO
Remuneration mix FTSE 100
Basi
c sa
lary
Total bonus
Realised LTIP
gainsPension
Other fixed
pay 19%
30%
43%
6%2%
CEO
Remuneration mix FTSE 250
Other fixed
pay
Basic
salar
y
Total bonus
Realised LTIP
gainsPension
Payouts under long term incentive awards form a significant proportion of total earnings and have broadly increased by less than 10% in the FTSE 350 from last year.
“”
21Guide to directors’ remuneration 2016© 2016 KPMG LLP, a UK limited liability partnership and a member firm of the KPMG network of independent member firms affiliated with KPMG International Cooperative (“KPMG International”), a Swiss entity. All rights reserved.
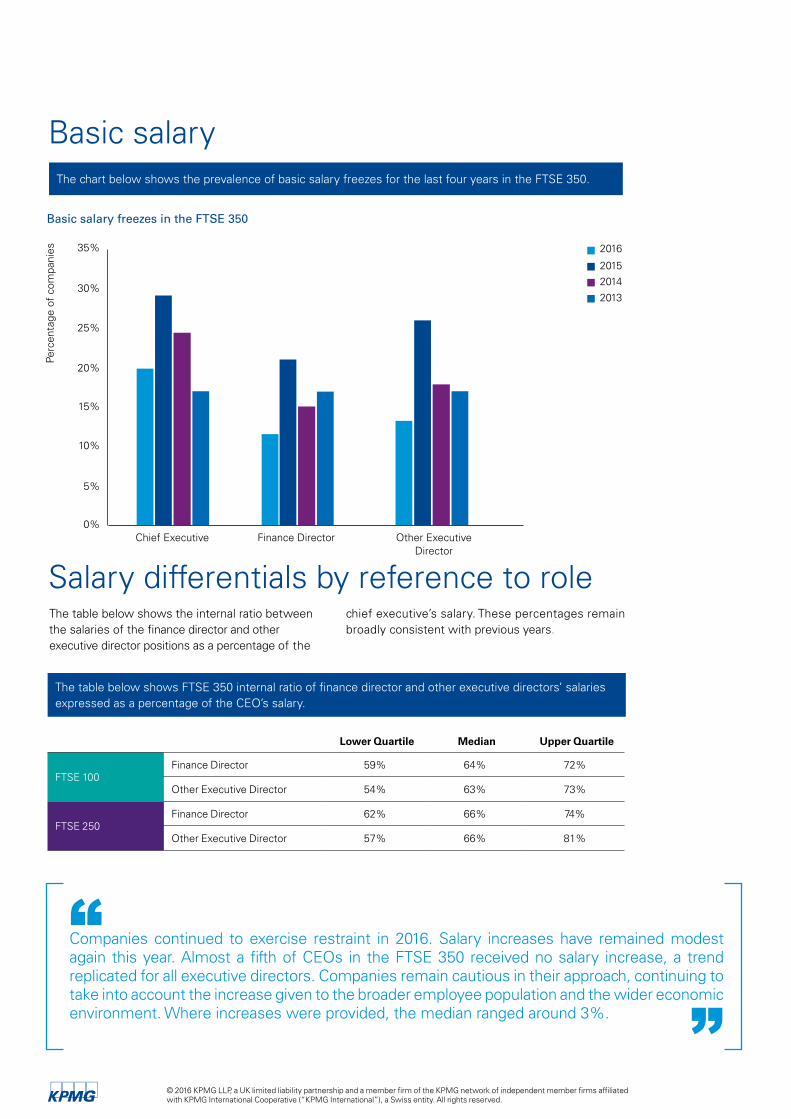
Basic salaryThe chart below shows the prevalence of basic salary freezes for the last four years in the FTSE 350.
The table below shows FTSE 350 internal ratio of finance director and other executive directors’ salaries expressed as a percentage of the CEO’s salary.
Lower Quartile Median Upper Quartile
FTSE 100Finance Director 59% 64% 72%
Other Executive Director 54% 63% 73%
FTSE 250Finance Director 62% 66% 74%
Other Executive Director 57% 66% 81%
Basic salary freezes in the FTSE 350
Chief Executive Finance Director Other Executive Director
2014
2016
2015
201330%
35%
25%
20%
15%
10%
0%
5%
Perc
enta
ge o
f co
mpa
nies
Salary differentials by reference to role The table below shows the internal ratio between the salaries of the finance director and other executive director positions as a percentage of the
chief executive’s salary. These percentages remain broadly consistent with previous years.
Companies continued to exercise restraint in 2016. Salary increases have remained modest again this year. Almost a fifth of CEOs in the FTSE 350 received no salary increase, a trend replicated for all executive directors. Companies remain cautious in their approach, continuing to take into account the increase given to the broader employee population and the wider economic environment. Where increases were provided, the median ranged around 3%.
“”
© 2016 KPMG LLP, a UK limited liability partnership and a member firm of the KPMG network of independent member firms affiliated with KPMG International Cooperative (“KPMG International”), a Swiss entity. All rights reserved.
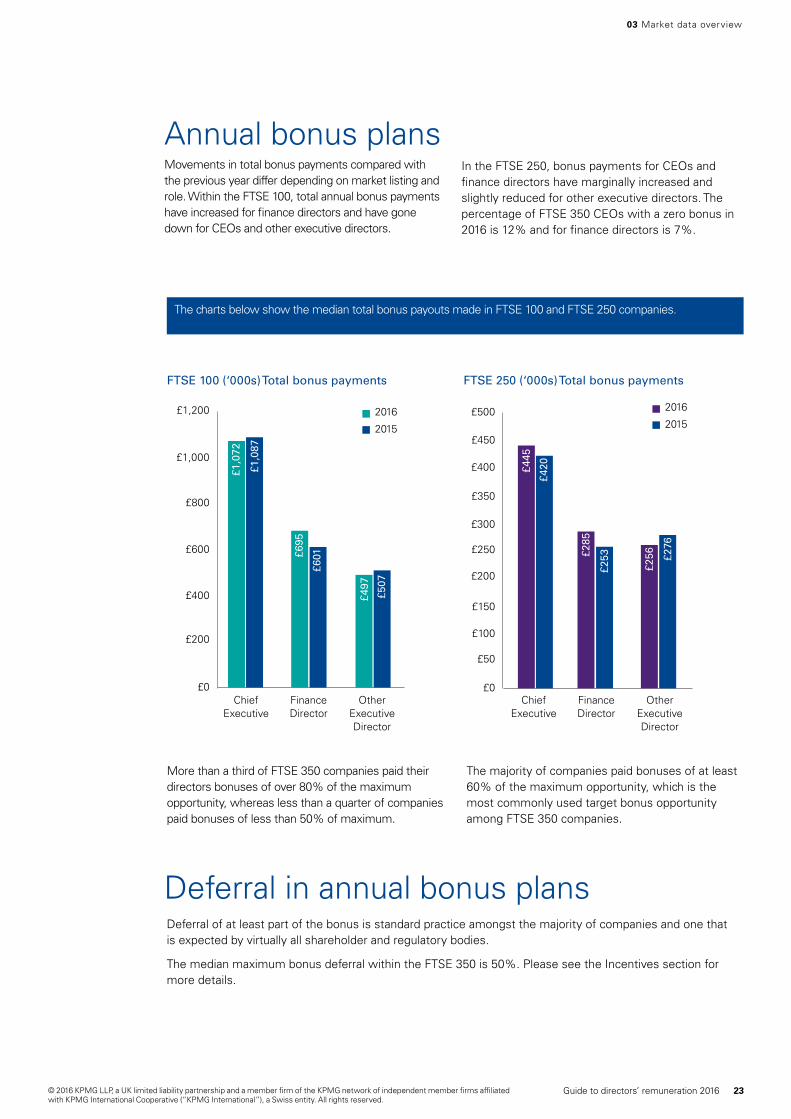
Annual bonus plansMovements in total bonus payments compared with the previous year differ depending on market listing and role. Within the FTSE 100, total annual bonus payments have increased for finance directors and have gone down for CEOs and other executive directors.
In the FTSE 250, bonus payments for CEOs and finance directors have marginally increased and slightly reduced for other executive directors. The percentage of FTSE 350 CEOs with a zero bonus in 2016 is 12% and for finance directors is 7%.
FTSE 100 (‘000s) Total bonus payments FTSE 250 (‘000s) Total bonus payments
More than a third of FTSE 350 companies paid their directors bonuses of over 80% of the maximum opportunity, whereas less than a quarter of companies paid bonuses of less than 50% of maximum.
The majority of companies paid bonuses of at least 60% of the maximum opportunity, which is the most commonly used target bonus opportunity among FTSE 350 companies.
The charts below show the median total bonus payouts made in FTSE 100 and FTSE 250 companies.
Chief Executive
Finance Director
Other Executive Director
£1,000
£1,200
£800
£600
£400
£200
£0
2016
2015
£1,0
87
£1,0
72
£695
£601
£497
£507
Chief Executive
Finance Director
Other Executive Director
£450
£500
£400
£350
£300
£250
£200
£150
£100
£50
£0
2016
2015
£445
£420
£285
£253
£256 £2
76
Deferral in annual bonus plansDeferral of at least part of the bonus is standard practice amongst the majority of companies and one that is expected by virtually all shareholder and regulatory bodies.
The median maximum bonus deferral within the FTSE 350 is 50%. Please see the Incentives section for more details.
03 Market data overview
23Guide to directors’ remuneration 2016© 2016 KPMG LLP, a UK limited liability partnership and a member firm of the KPMG network of independent member firms affiliated with KPMG International Cooperative (“KPMG International”), a Swiss entity. All rights reserved.
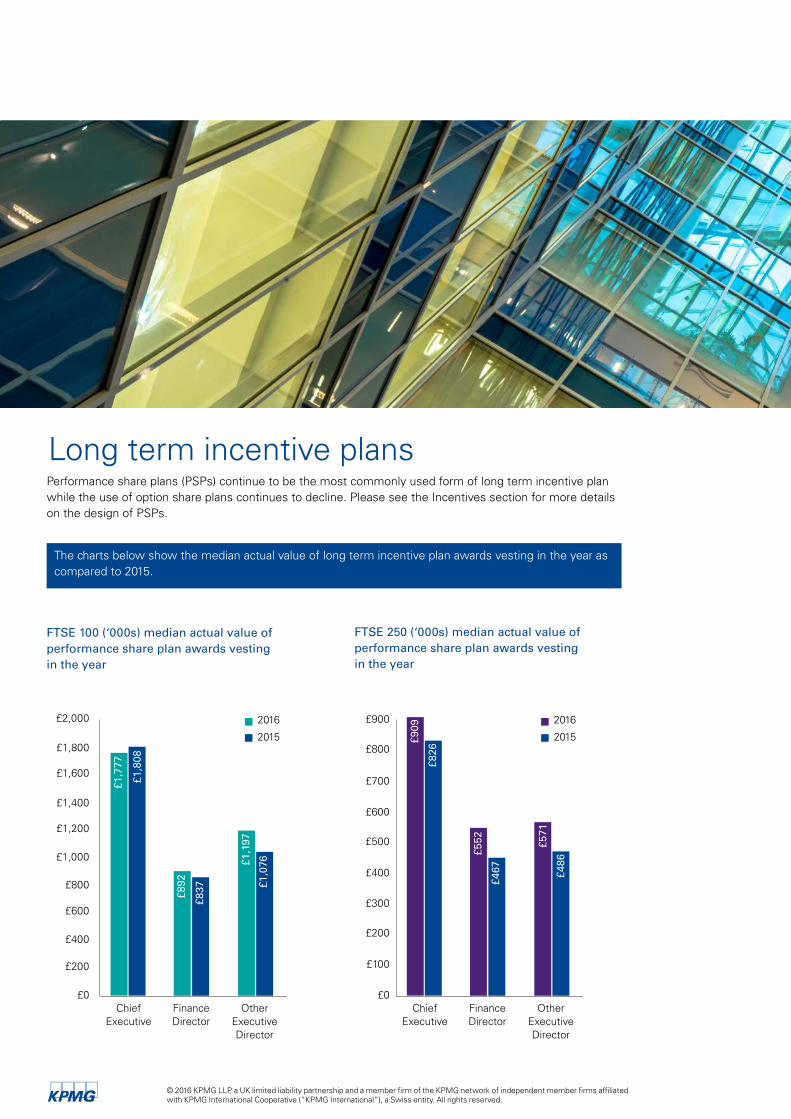
Performance share plans (PSPs) continue to be the most commonly used form of long term incentive plan while the use of option share plans continues to decline. Please see the Incentives section for more details on the design of PSPs.
The charts below show the median actual value of long term incentive plan awards vesting in the year as compared to 2015.
FTSE 250 (‘000s) median actual value of performance share plan awards vesting in the year
FTSE 100 (‘000s) median actual value of performance share plan awards vesting in the year
£1,800
£2,000
£1,600
£1,400
£1,200
£1,000
£800
£600
£400
£200
£0Chief
ExecutiveFinance Director
Other Executive Director
2016
2015
£1,8
08
£1,7
77
£892
£837
£1,1
97
£1,0
76
£800
£900
£700
£600
£500
£400
£300
£200
£100
£0Chief
ExecutiveFinance Director
Other Executive Director
2016
2015
£826
£909
£552
£467
£571
£486
Long term incentive plans
© 2016 KPMG LLP, a UK limited liability partnership and a member firm of the KPMG network of independent member firms affiliated with KPMG International Cooperative (“KPMG International”), a Swiss entity. All rights reserved.
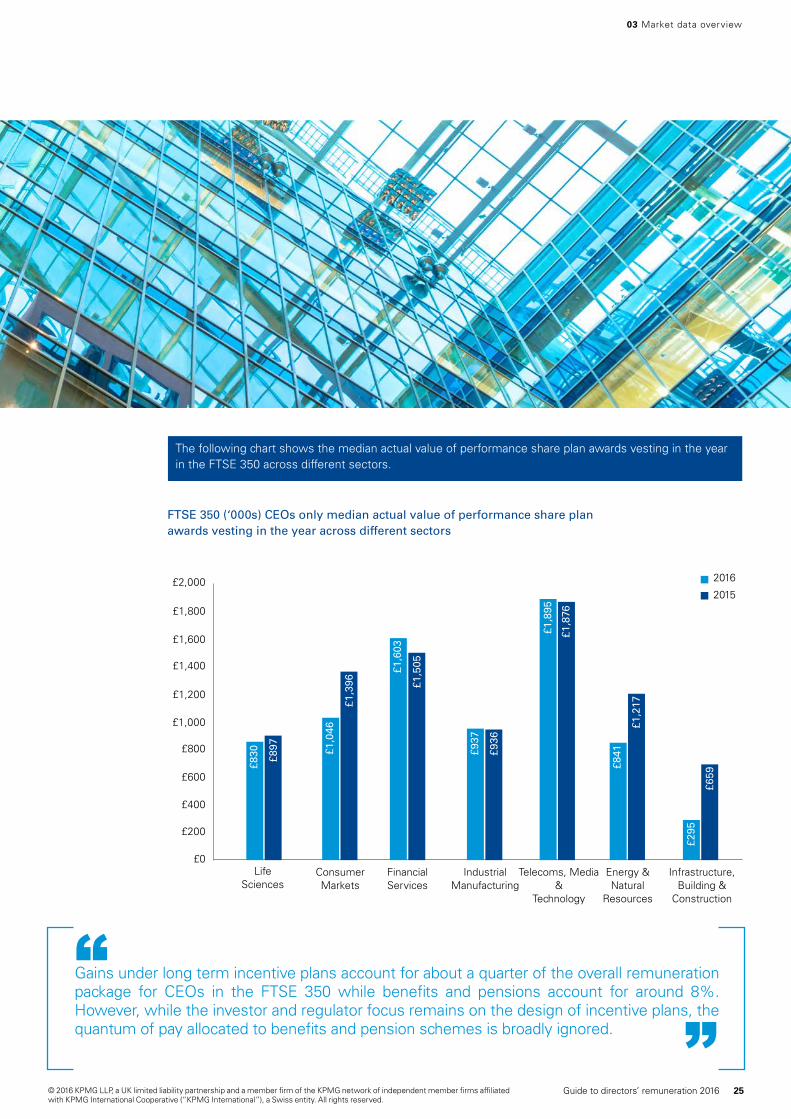
FTSE 350 (‘000s) CEOs only median actual value of performance share plan awards vesting in the year across different sectors
The following chart shows the median actual value of performance share plan awards vesting in the year in the FTSE 350 across different sectors.
Life Sciences
Consumer Markets
Financial Services
Industrial Manufacturing
Telecoms, Media &
Technology
Energy & Natural
Resources
Infrastructure, Building &
Construction
£1,800
£2,000
£1,600
£1,400
£1,200
£1,000
£0
£800
£600
£400
£200
2016
2015
£897
£830
£1,3
96
£1,0
46
£1,5
05£1,6
03
£936
£937
£1,8
76
£1,8
95
£1,2
17
£841
£659
£295
Gains under long term incentive plans account for about a quarter of the overall remuneration package for CEOs in the FTSE 350 while benefits and pensions account for around 8%. However, while the investor and regulator focus remains on the design of incentive plans, the quantum of pay allocated to benefits and pension schemes is broadly ignored.
“”
03 Market data overview
25Guide to directors’ remuneration 2016© 2016 KPMG LLP, a UK limited liability partnership and a member firm of the KPMG network of independent member firms affiliated with KPMG International Cooperative (“KPMG International”), a Swiss entity. All rights reserved.
This section provides information on the remuneration for the role of chief executive. This role represents the lead executive director at each company, so actual job titles included are chief executive officer, managing director, executive chairman and CEO, president and CEO.
04
Chief executive
© 2016 KPMG LLP, a UK limited liability partnership and a member firm of the KPMG network of independent member firms affiliated with KPMG International Cooperative (“KPMG International”), a Swiss entity. All rights reserved.
04 Chief executive
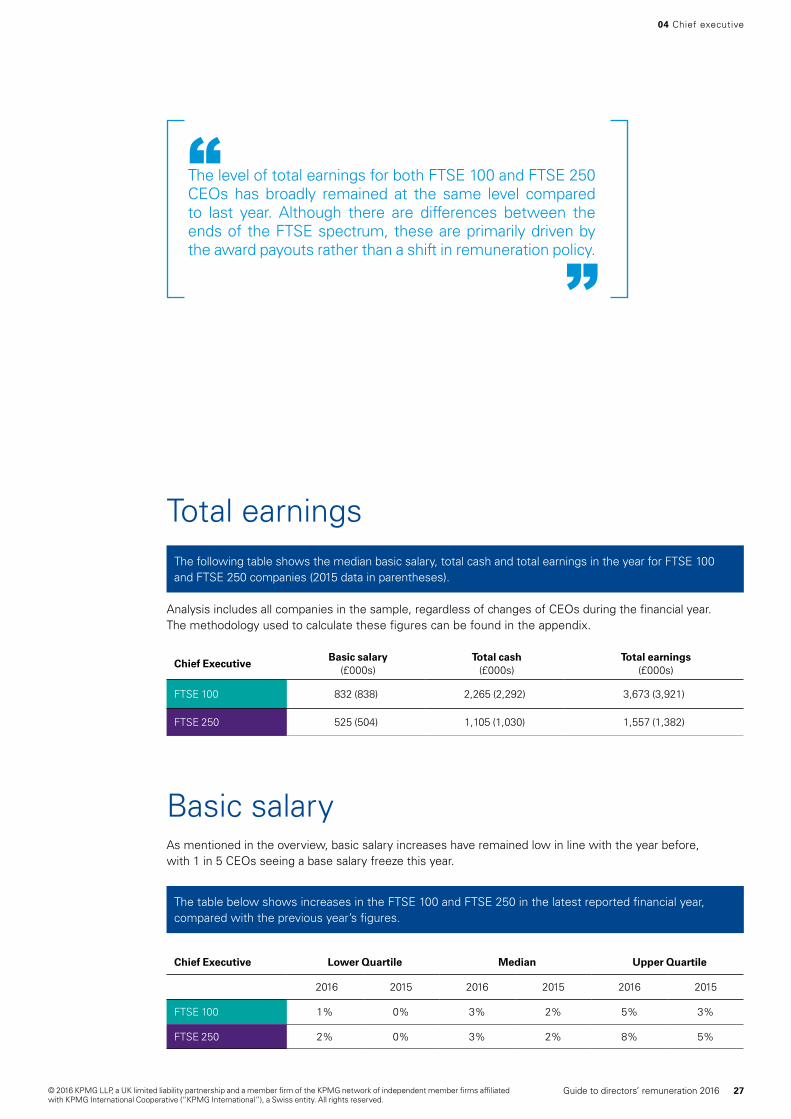
Analysis includes all companies in the sample, regardless of changes of CEOs during the financial year. The methodology used to calculate these figures can be found in the appendix.
The following table shows the median basic salary, total cash and total earnings in the year for FTSE 100 and FTSE 250 companies (2015 data in parentheses).
Chief ExecutiveBasic salary
(£000s)Total cash
(£000s)Total earnings
(£000s)
FTSE 100 832 (838) 2,265 (2,292) 3,673 (3,921)
FTSE 250 525 (504) 1,105 (1,030) 1,557 (1,382)
Basic salary
Total earnings
The table below shows increases in the FTSE 100 and FTSE 250 in the latest reported financial year, compared with the previous year’s figures.
Chief Executive Lower Quartile Median Upper Quartile
2016 2015 2016 2015 2016 2015
FTSE 100 1% 0% 3% 2% 5% 3%
FTSE 250 2% 0% 3% 2% 8% 5%
As mentioned in the overview, basic salary increases have remained low in line with the year before, with 1 in 5 CEOs seeing a base salary freeze this year.
The level of total earnings for both FTSE 100 and FTSE 250 CEOs has broadly remained at the same level compared to last year. Although there are differences between the ends of the FTSE spectrum, these are primarily driven by the award payouts rather than a shift in remuneration policy.
“
”
27Guide to directors’ remuneration 2016© 2016 KPMG LLP, a UK limited liability partnership and a member firm of the KPMG network of independent member firms affiliated with KPMG International Cooperative (“KPMG International”), a Swiss entity. All rights reserved.

Salary position and pay comparator groupsThere is an assumption that the size of a company is highly correlated with basic salary levels for executive directors. The data below, showing basic salary levels by market capitalisation and turnover bands, supports this assumption.
The tables below show basic salary levels by market capitalisation and turnover bands.
Many companies therefore use market capitalisation as a key factor when comparing salary levels, but the volatility in the stock markets has shown that this can lead to unintended consequences.
For example, if pay is benchmarked to a group of peer companies selected by market capitalisation in one year, subsequent falls in market capitalisation for the company concerned will then mean it appears out of line with current peers.
Turnover is generally a less volatile indicator and therefore a prudent approach would be to consider both when looking at salaries and in assessing whether the data is appropriate.
Basic salary by market capitalisation
Chief Executive
Market CapitalisationLower Quartile
(£’000s)Median(£’000s)
Upper Quartile(£’000s)
FTSE 100
>£15bn 967 1,017 1,150
£5bn - £15bn 611 747 855
<£5bn 551 589 848
All FTSE 100 614 832 995
FTSE 250
>£2bn 479 583 680
£1bn - £2bn 452 525 575
<£1bn 418 470 539
All FTSE 250 445 525 588
FTSE 350 All FTSE 350 473 561 748
© 2016 KPMG LLP, a UK limited liability partnership and a member firm of the KPMG network of independent member firms affiliated with KPMG International Cooperative (“KPMG International”), a Swiss entity. All rights reserved.
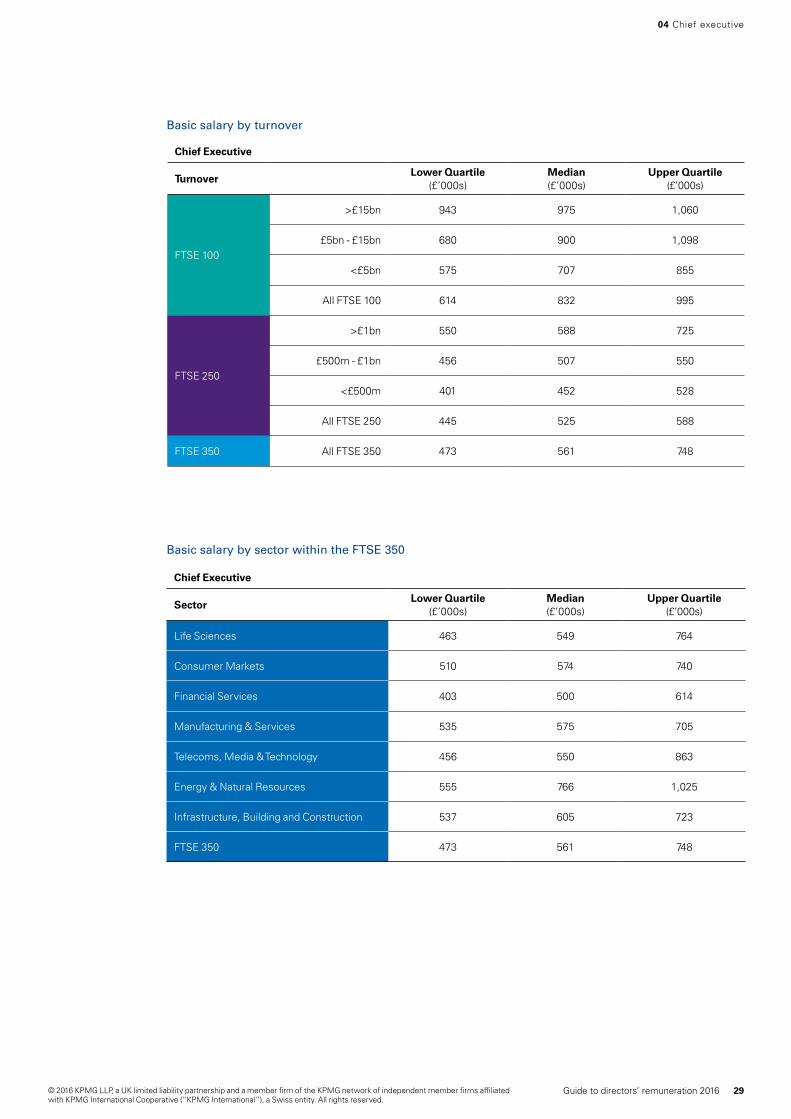
Basic salary by turnover
Chief Executive
TurnoverLower Quartile
(£’000s)Median(£’000s)
Upper Quartile(£’000s)
FTSE 100
>£15bn 943 975 1,060
£5bn - £15bn 680 900 1,098
<£5bn 575 707 855
All FTSE 100 614 832 995
FTSE 250
>£1bn 550 588 725
£500m - £1bn 456 507 550
<£500m 401 452 528
All FTSE 250 445 525 588
FTSE 350 All FTSE 350 473 561 748
Basic salary by sector within the FTSE 350
Chief Executive
SectorLower Quartile
(£’000s)Median(£’000s)
Upper Quartile(£’000s)
Life Sciences 463 549 764
Consumer Markets 510 574 740
Financial Services 403 500 614
Manufacturing & Services 535 575 705
Telecoms, Media & Technology 456 550 863
Energy & Natural Resources 555 766 1,025
Infrastructure, Building and Construction 537 605 723
FTSE 350 473 561 748
04 Chief executive
29Guide to directors’ remuneration 2016© 2016 KPMG LLP, a UK limited liability partnership and a member firm of the KPMG network of independent member firms affiliated with KPMG International Cooperative (“KPMG International”), a Swiss entity. All rights reserved.

© 2016 KPMG LLP, a UK limited liability partnership and a member firm of the KPMG network of independent member firms affiliated with KPMG International Cooperative (“KPMG International”), a Swiss entity. All rights reserved.
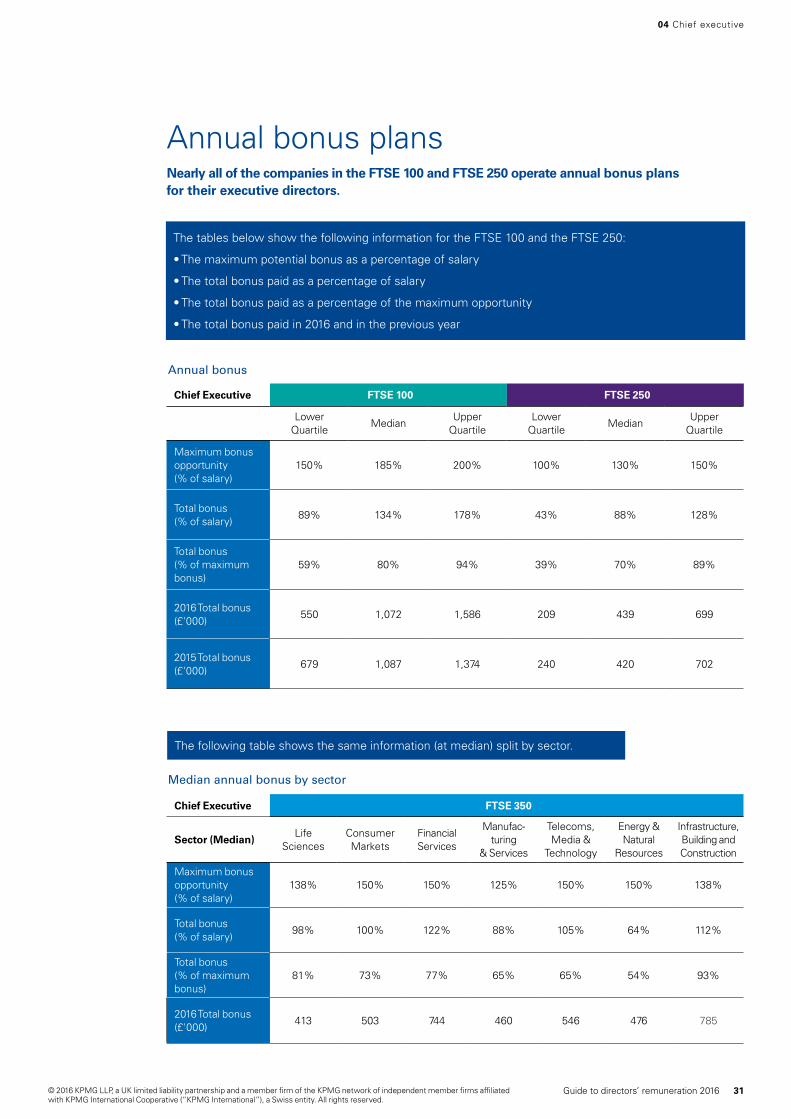
Median annual bonus by sector
Chief Executive FTSE 350
Sector (Median)Life
SciencesConsumer Markets
Financial Services
Manufac- turing
& Services
Telecoms, Media &
Technology
Energy & Natural
Resources
Infrastructure, Building and Construction
Maximum bonus opportunity (% of salary)
138% 150% 150% 125% 150% 150% 138%
Total bonus (% of salary)
98% 100% 122% 88% 105% 64% 112%
Total bonus (% of maximum bonus)
81% 73% 77% 65% 65% 54% 93%
2016 Total bonus (£'000)
413 503 744 460 546 476 785
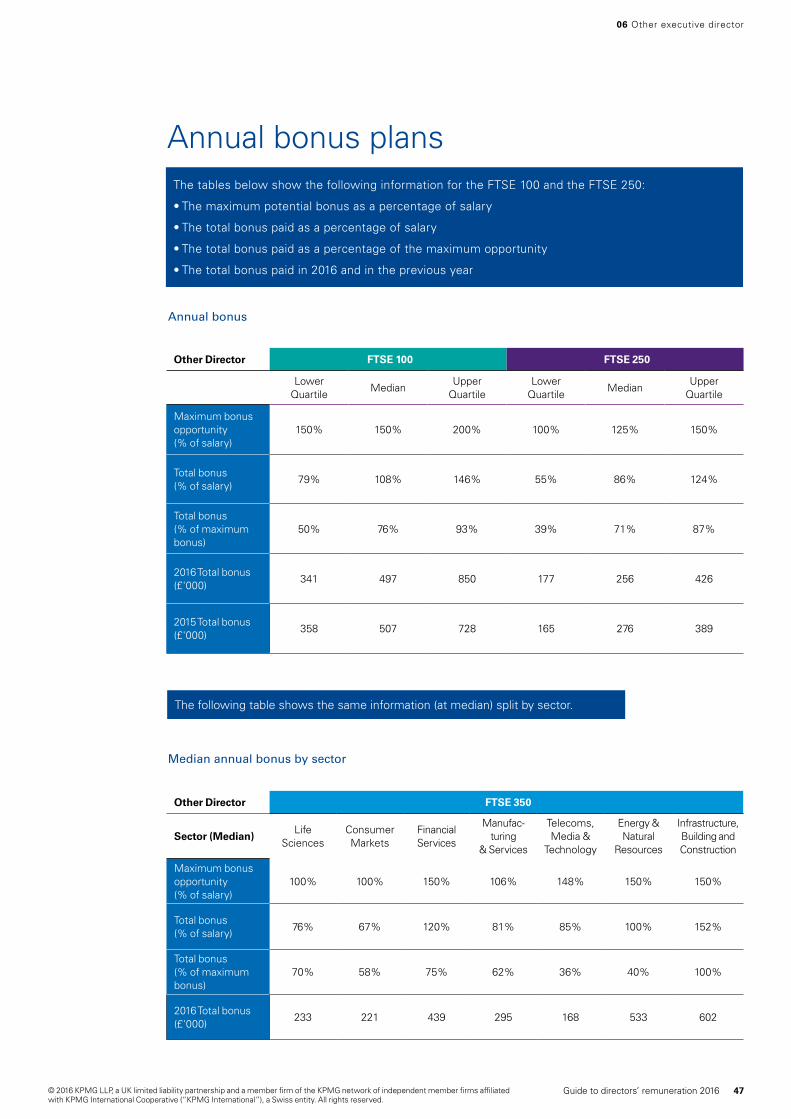
Annual bonus plansNearly all of the companies in the FTSE 100 and FTSE 250 operate annual bonus plans for their executive directors.
The tables below show the following information for the FTSE 100 and the FTSE 250:
• The maximum potential bonus as a percentage of salary
• The total bonus paid as a percentage of salary
• The total bonus paid as a percentage of the maximum opportunity
• The total bonus paid in 2016 and in the previous year
Annual bonus
Chief Executive FTSE 100 FTSE 250
Lower Quartile
MedianUpper
QuartileLower
QuartileMedian
Upper Quartile
Maximum bonus opportunity (% of salary)
150% 185% 200% 100% 130% 150%
Total bonus (% of salary)
89% 134% 178% 43% 88% 128%
Total bonus (% of maximum bonus)
59% 80% 94% 39% 70% 89%
2016 Total bonus (£'000)
550 1,072 1,586 209 439 699
2015 Total bonus (£'000)
679 1,087 1,374 240 420 702
The following table shows the same information (at median) split by sector.
04 Chief executive
31Guide to directors’ remuneration 2016© 2016 KPMG LLP, a UK limited liability partnership and a member firm of the KPMG network of independent member firms affiliated with KPMG International Cooperative (“KPMG International”), a Swiss entity. All rights reserved.
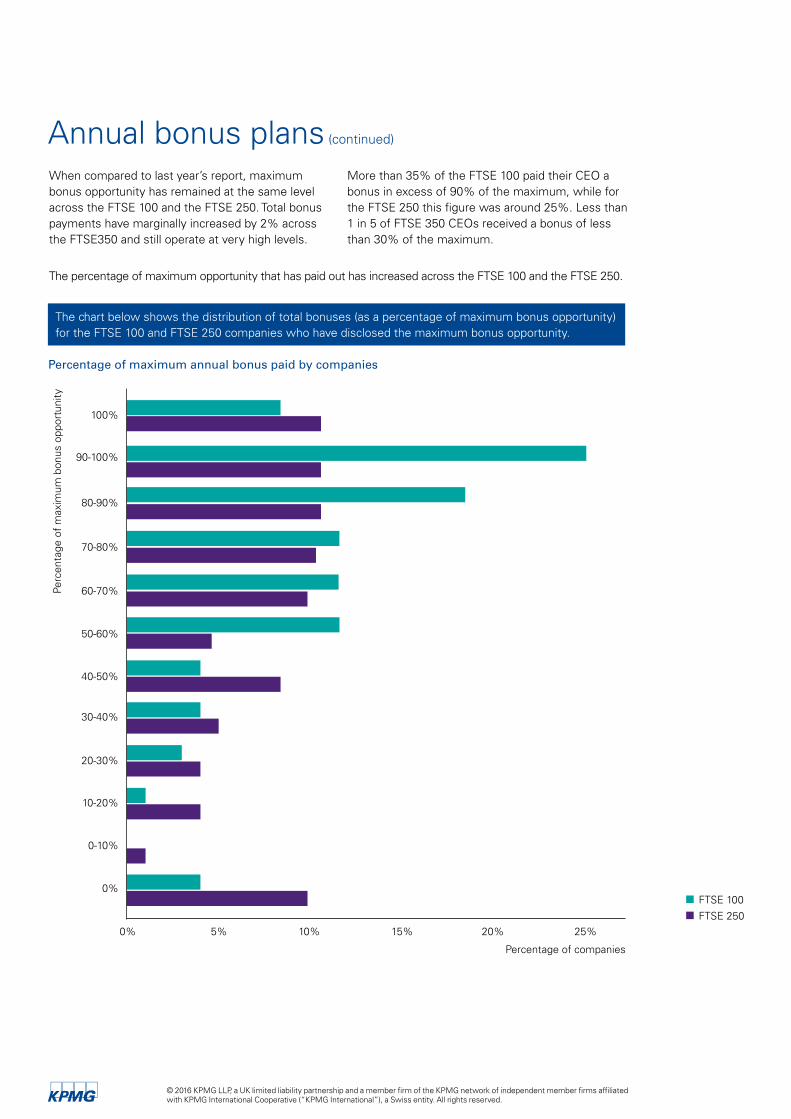
The chart below shows the distribution of total bonuses (as a percentage of maximum bonus opportunity) for the FTSE 100 and FTSE 250 companies who have disclosed the maximum bonus opportunity.
Annual bonus plans (continued)
Percentage of maximum annual bonus paid by companies
0% 5% 10% 15% 20% 25%
FTSE 100
FTSE 250
0%
0-10%
10-20%
20-30%
30-40%
40-50%
50-60%
60-70%
70-80%
80-90%
90-100%
100%
Percentage of companies
Perc
enta
ge o
f m
axim
um b
onus
opp
ortu
nity
The percentage of maximum opportunity that has paid out has increased across the FTSE 100 and the FTSE 250.
When compared to last year’s report, maximum bonus opportunity has remained at the same level across the FTSE 100 and the FTSE 250. Total bonus payments have marginally increased by 2% across the FTSE350 and still operate at very high levels.
More than 35% of the FTSE 100 paid their CEO a bonus in excess of 90% of the maximum, while for the FTSE 250 this figure was around 25%. Less than 1 in 5 of FTSE 350 CEOs received a bonus of less than 30% of the maximum.
© 2016 KPMG LLP, a UK limited liability partnership and a member firm of the KPMG network of independent member firms affiliated with KPMG International Cooperative (“KPMG International”), a Swiss entity. All rights reserved.
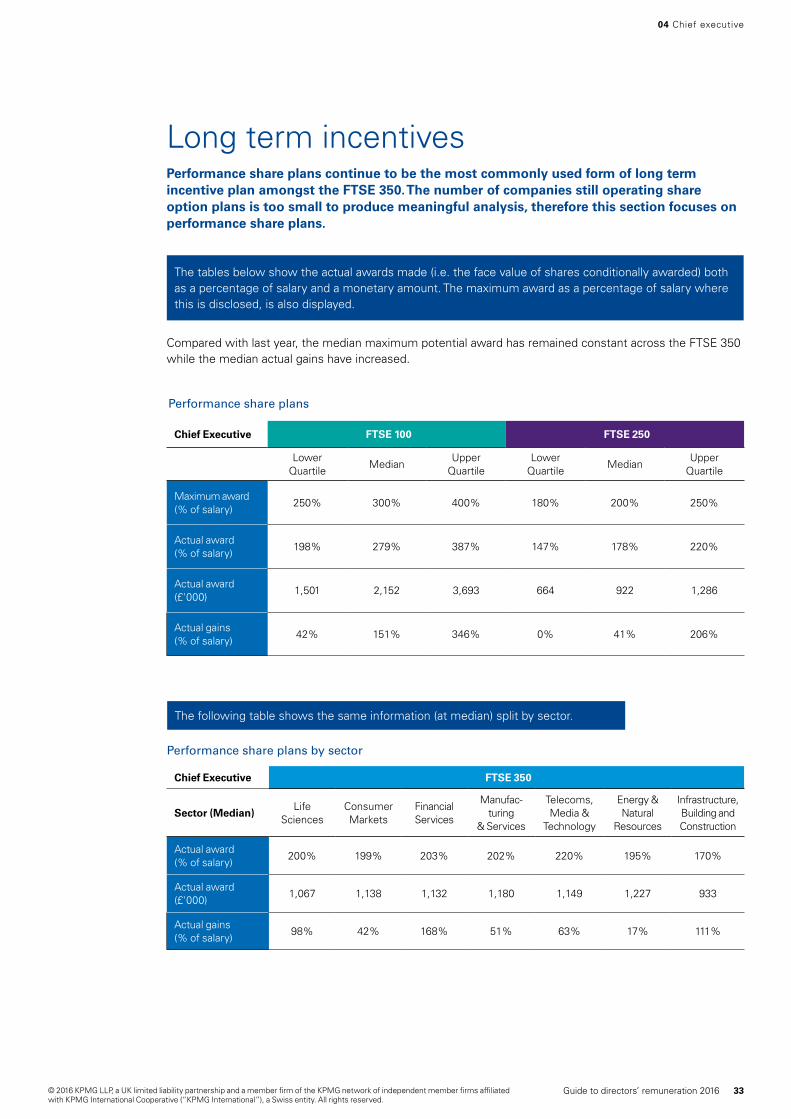
Long term incentives
Performance share plans
Performance share plans by sector
The following table shows the same information (at median) split by sector.
The tables below show the actual awards made (i.e. the face value of shares conditionally awarded) both as a percentage of salary and a monetary amount. The maximum award as a percentage of salary where this is disclosed, is also displayed.
Compared with last year, the median maximum potential award has remained constant across the FTSE 350 while the median actual gains have increased.
Performance share plans continue to be the most commonly used form of long term incentive plan amongst the FTSE 350. The number of companies still operating share option plans is too small to produce meaningful analysis, therefore this section focuses on performance share plans.
Chief Executive FTSE 100 FTSE 250
Lower Quartile
MedianUpper
QuartileLower
QuartileMedian
Upper Quartile
Maximum award (% of salary)
250% 300% 400% 180% 200% 250%
Actual award (% of salary)
198% 279% 387% 147% 178% 220%
Actual award (£'000)
1,501 2,152 3,693 664 922 1,286
Actual gains (% of salary)
42% 151% 346% 0% 41% 206%
Chief Executive FTSE 350
Sector (Median)Life
SciencesConsumer Markets
Financial Services
Manufac- turing
& Services
Telecoms, Media &
Technology
Energy & Natural
Resources
Infrastructure, Building and Construction
Actual award (% of salary)
200% 199% 203% 202% 220% 195% 170%
Actual award (£'000)
1,067 1,138 1,132 1,180 1,149 1,227 933
Actual gains (% of salary)
98% 42% 168% 51% 63% 17% 111%
04 Chief executive
33Guide to directors’ remuneration 2016© 2016 KPMG LLP, a UK limited liability partnership and a member firm of the KPMG network of independent member firms affiliated with KPMG International Cooperative (“KPMG International”), a Swiss entity. All rights reserved.
This section provides information on remuneration for the role of finance director.
Finance director
05
© 2016 KPMG LLP, a UK limited liability partnership and a member firm of the KPMG network of independent member firms affiliated with KPMG International Cooperative (“KPMG International”), a Swiss entity. All rights reserved.
05 Finance director
Analysis includes all companies in the sample, regardless of changes of finance directors during the financial year. The methodology used to calculate these figures can be found in the appendix.
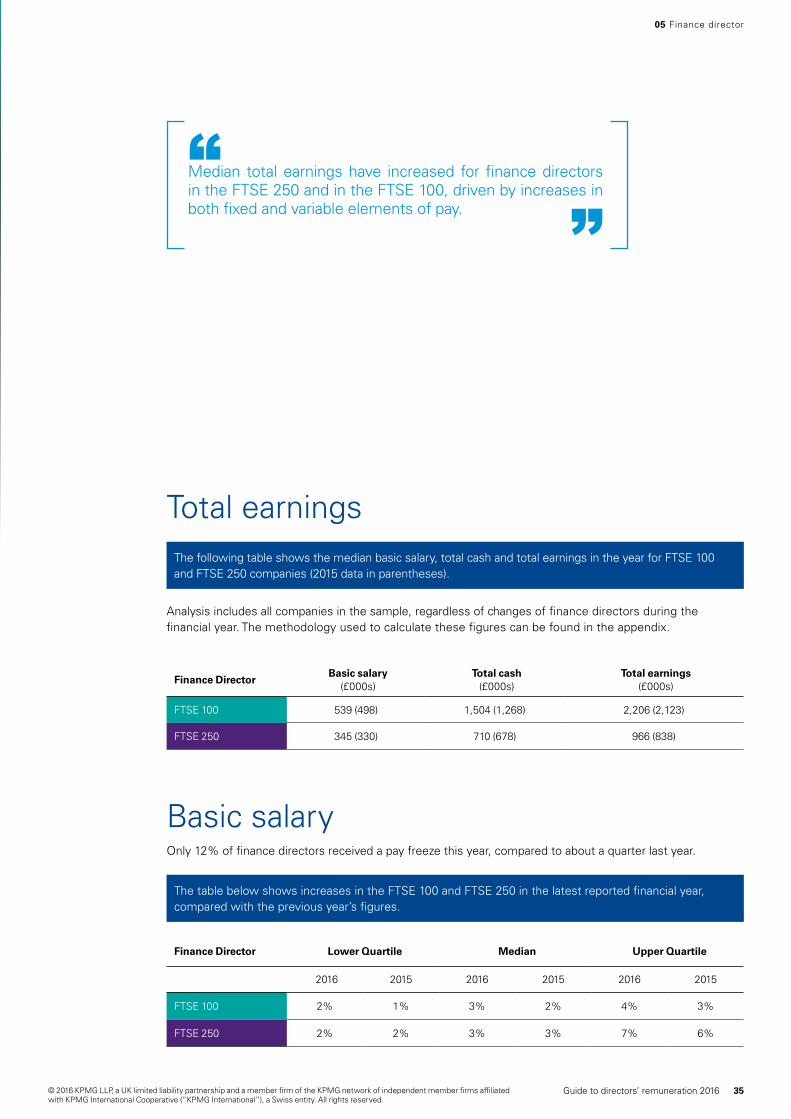
The following table shows the median basic salary, total cash and total earnings in the year for FTSE 100 and FTSE 250 companies (2015 data in parentheses).
Finance DirectorBasic salary
(£000s)Total cash
(£000s)Total earnings
(£000s)
FTSE 100 539 (498) 1,504 (1,268) 2,206 (2,123)
FTSE 250 345 (330) 710 (678) 966 (838)
Median total earnings have increased for finance directors in the FTSE 250 and in the FTSE 100, driven by increases in both fixed and variable elements of pay.
“”
Basic salary
The table below shows increases in the FTSE 100 and FTSE 250 in the latest reported financial year, compared with the previous year’s figures.
Finance Director Lower Quartile Median Upper Quartile
2016 2015 2016 2015 2016 2015
FTSE 100 2% 1% 3% 2% 4% 3%
FTSE 250 2% 2% 3% 3% 7% 6%
Only 12% of finance directors received a pay freeze this year, compared to about a quarter last year.
Total earnings
35Guide to directors’ remuneration 2016© 2016 KPMG LLP, a UK limited liability partnership and a member firm of the KPMG network of independent member firms affiliated with KPMG International Cooperative (“KPMG International”), a Swiss entity. All rights reserved.
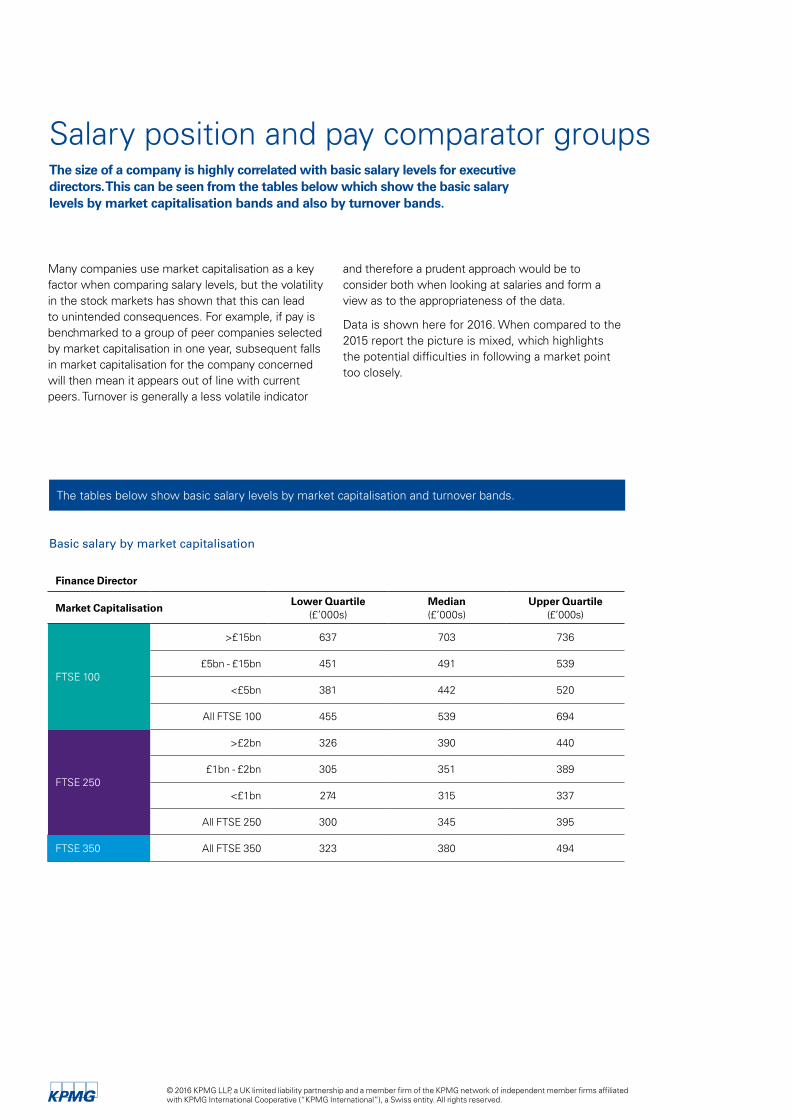
Salary position and pay comparator groupsThe size of a company is highly correlated with basic salary levels for executive directors. This can be seen from the tables below which show the basic salary levels by market capitalisation bands and also by turnover bands.
The tables below show basic salary levels by market capitalisation and turnover bands.
Many companies use market capitalisation as a key factor when comparing salary levels, but the volatility in the stock markets has shown that this can lead to unintended consequences. For example, if pay is benchmarked to a group of peer companies selected by market capitalisation in one year, subsequent falls in market capitalisation for the company concerned will then mean it appears out of line with current peers. Turnover is generally a less volatile indicator
and therefore a prudent approach would be to consider both when looking at salaries and form a view as to the appropriateness of the data.
Data is shown here for 2016. When compared to the 2015 report the picture is mixed, which highlights the potential difficulties in following a market point too closely.
Basic salary by market capitalisation
Finance Director
Market CapitalisationLower Quartile
(£’000s)Median(£’000s)
Upper Quartile(£’000s)
FTSE 100
>£15bn 637 703 736
£5bn - £15bn 451 491 539
<£5bn 381 442 520
All FTSE 100 455 539 694
FTSE 250
>£2bn 326 390 440
£1bn - £2bn 305 351 389
<£1bn 274 315 337
All FTSE 250 300 345 395
FTSE 350 All FTSE 350 323 380 494
© 2016 KPMG LLP, a UK limited liability partnership and a member firm of the KPMG network of independent member firms affiliated with KPMG International Cooperative (“KPMG International”), a Swiss entity. All rights reserved.

Basic salary by turnover
Basic salary by sector within the FTSE 350
05 Finance director
Finance Director
TurnoverLower Quartile
(£’000s)Median(£’000s)
Upper Quartile(£’000s)
FTSE 100
>£15bn 618 694 733
£5bn - £15bn 528 550 658
<£5bn 408 482 544
All FTSE 100 455 539 694
FTSE 250
>£1bn 350 400 452
£500m - £1bn 307 324 360
<£500m 274 310 355
All FTSE 250 300 345 395
FTSE 350 All FTSE 350 323 380 494
Finance Director
SectorLower Quartile
(£’000s)Median(£’000s)
Upper Quartile(£’000s)
Life Sciences 309 344 424
Consumer Markets 341 400 508
Financial Services 289 353 442
Manufacturing & Services 338 364 455
Telecoms, Media & Technology 352 457 591
Energy & Natural Resources 400 532 732
Infrastructure, Building and Construction 316 370 456
FTSE 350 323 380 494
37Guide to directors’ remuneration 2016© 2016 KPMG LLP, a UK limited liability partnership and a member firm of the KPMG network of independent member firms affiliated with KPMG International Cooperative (“KPMG International”), a Swiss entity. All rights reserved.

© 2016 KPMG LLP, a UK limited liability partnership and a member firm of the KPMG network of independent member firms affiliated with KPMG International Cooperative (“KPMG International”), a Swiss entity. All rights reserved.
Annual bonus
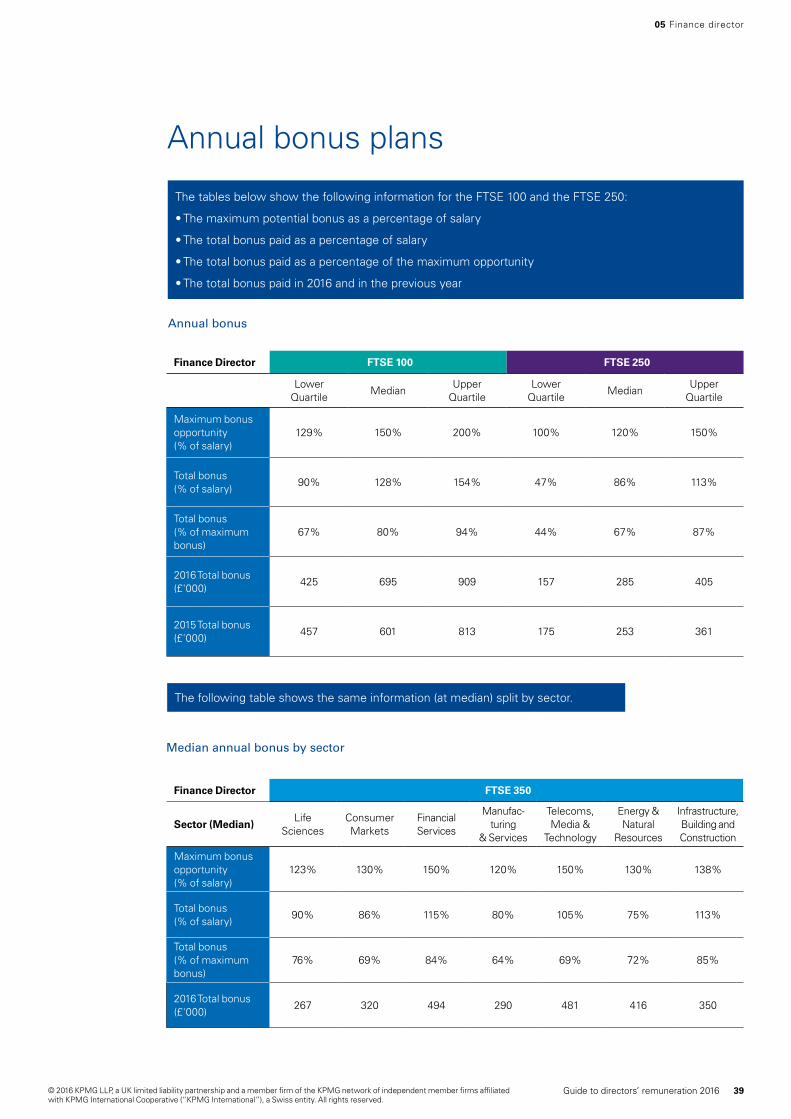
The following table shows the same information (at median) split by sector.
05 Finance director
Annual bonus plans
The tables below show the following information for the FTSE 100 and the FTSE 250:
• The maximum potential bonus as a percentage of salary
• The total bonus paid as a percentage of salary
• The total bonus paid as a percentage of the maximum opportunity
• The total bonus paid in 2016 and in the previous year
Finance Director FTSE 350
Sector (Median)Life
SciencesConsumer Markets
Financial Services
Manufac- turing
& Services
Telecoms, Media &
Technology
Energy & Natural
Resources
Infrastructure, Building and Construction
Maximum bonus opportunity (% of salary)
123% 130% 150% 120% 150% 130% 138%
Total bonus (% of salary)
90% 86% 115% 80% 105% 75% 113%
Total bonus (% of maximum bonus)
76% 69% 84% 64% 69% 72% 85%
2016 Total bonus (£'000)
267 320 494 290 481 416 350
Finance Director FTSE 100 FTSE 250
Lower Quartile
MedianUpper
QuartileLower
QuartileMedian
Upper Quartile
Maximum bonus opportunity (% of salary)
129% 150% 200% 100% 120% 150%
Total bonus (% of salary)
90% 128% 154% 47% 86% 113%
Total bonus (% of maximum bonus)
67% 80% 94% 44% 67% 87%
2016 Total bonus (£'000)
425 695 909 157 285 405
2015 Total bonus (£'000)
457 601 813 175 253 361
Median annual bonus by sector
39Guide to directors’ remuneration 2016© 2016 KPMG LLP, a UK limited liability partnership and a member firm of the KPMG network of independent member firms affiliated with KPMG International Cooperative (“KPMG International”), a Swiss entity. All rights reserved.
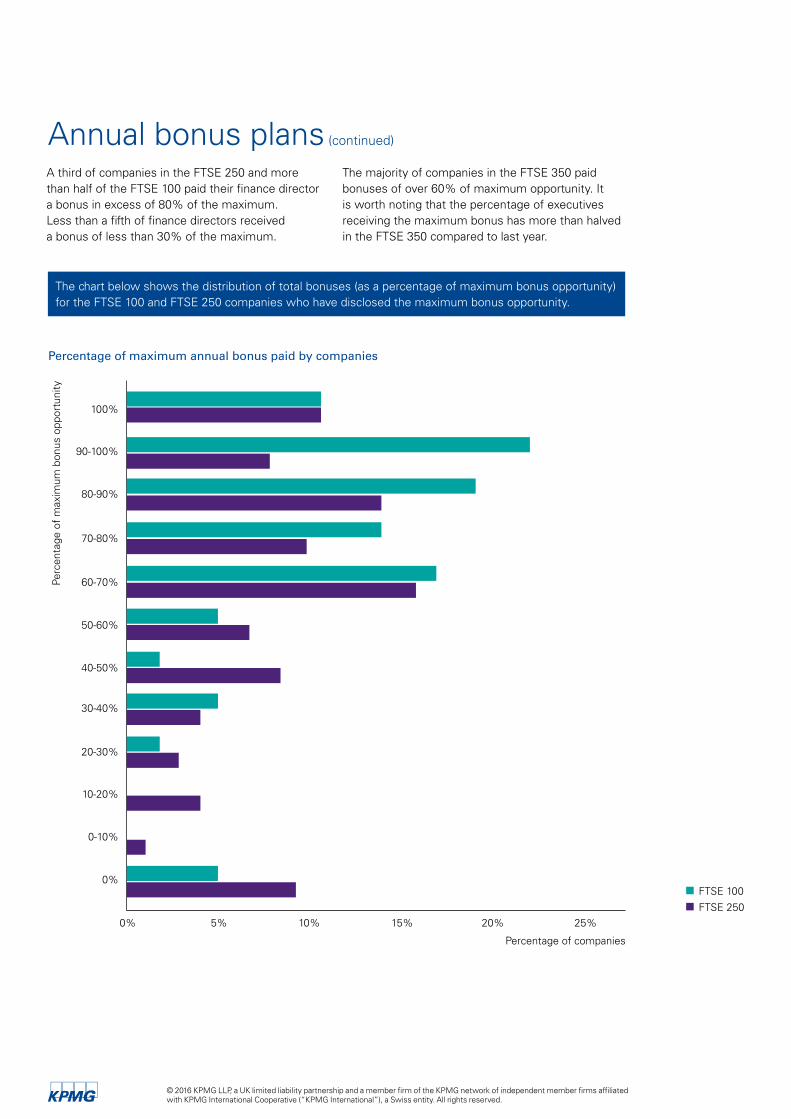
The chart below shows the distribution of total bonuses (as a percentage of maximum bonus opportunity) for the FTSE 100 and FTSE 250 companies who have disclosed the maximum bonus opportunity.
Annual bonus plans (continued)
Percentage of maximum annual bonus paid by companies
0% 5% 10% 15% 20% 25%
FTSE 100
FTSE 250
0%
0-10%
10-20%
20-30%
30-40%
40-50%
50-60%
60-70%
70-80%
80-90%
90-100%
100%
Percentage of companies
Perc
enta
ge o
f m
axim
um b
onus
opp
ortu
nity
A third of companies in the FTSE 250 and more than half of the FTSE 100 paid their finance director a bonus in excess of 80% of the maximum. Less than a fifth of finance directors received a bonus of less than 30% of the maximum.
The majority of companies in the FTSE 350 paid bonuses of over 60% of maximum opportunity. It is worth noting that the percentage of executives receiving the maximum bonus has more than halved in the FTSE 350 compared to last year.
© 2016 KPMG LLP, a UK limited liability partnership and a member firm of the KPMG network of independent member firms affiliated with KPMG International Cooperative (“KPMG International”), a Swiss entity. All rights reserved.

Long term incentives
Performance share plans
The tables below show the actual awards made (i.e. the face value of shares conditionally awarded) both as a percentage of salary and a monetary amount. The maximum award as a percentage of salary where this is disclosed, is also displayed.
Compared with last year, the median maximum potential award has remained constant across the FTSE 350 while the median actual gains have increased.
Performance share plans by sector
The following table shows the same information (at median) split by sector.
05 Finance director
Finance Director FTSE 100 FTSE 250
Lower Quartile
MedianUpper
QuartileLower
QuartileMedian
Upper Quartile
Maximum award (% of salary)
195% 250% 330% 150% 185% 200%
Actual award (% of salary)
180% 246% 301% 125% 155% 218%
Actual award (£'000)
780 1,239 2,144 389 552 885
Actual gains (% of salary)
0% 122% 275% 0% 42% 185%
Finance Director FTSE 350
Sector (Median)Life
SciencesConsumer Markets
Financial Services
Manufac- turing
& Services
Telecoms, Media &
Technology
Energy & Natural
Resources
Infrastructure, Building and Construction
Actual award (% of salary)
177% 172% 199% 173% 233% 237% 152%
Actual award (£'000)
672 728 702 653 1,239 1,181 614
Actual gains (% of salary)
83% 48% 152% 32% 12% 41% 138%
41Guide to directors’ remuneration 2016© 2016 KPMG LLP, a UK limited liability partnership and a member firm of the KPMG network of independent member firms affiliated with KPMG International Cooperative (“KPMG International”), a Swiss entity. All rights reserved.
This section provides information on remuneration for the role of other executive directors. Other executive directors include a variety of roles with different responsibilities, including functional and divisional directors.
Other executive director
06
© 2016 KPMG LLP, a UK limited liability partnership and a member firm of the KPMG network of independent member firms affiliated with KPMG International Cooperative (“KPMG International”), a Swiss entity. All rights reserved.
06 Other executive director
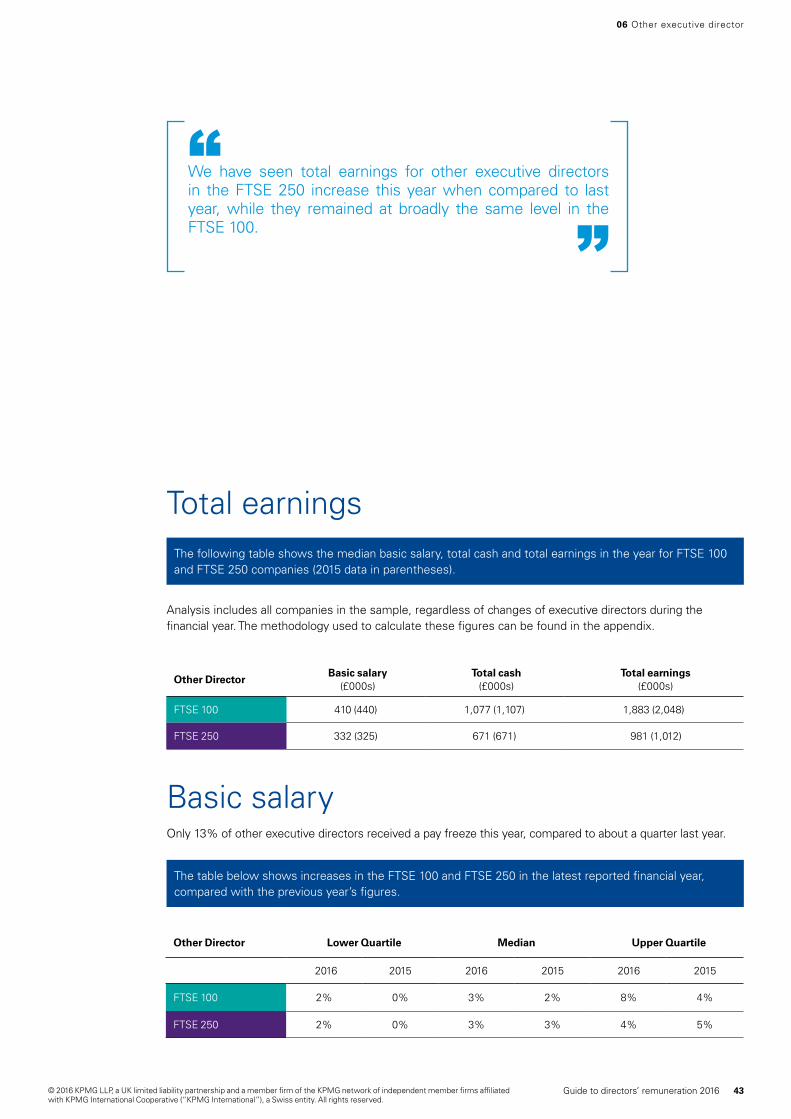
Analysis includes all companies in the sample, regardless of changes of executive directors during the financial year. The methodology used to calculate these figures can be found in the appendix.
The following table shows the median basic salary, total cash and total earnings in the year for FTSE 100 and FTSE 250 companies (2015 data in parentheses).
We have seen total earnings for other executive directors in the FTSE 250 increase this year when compared to last year, while they remained at broadly the same level in the FTSE 100.
“”
Basic salary
The table below shows increases in the FTSE 100 and FTSE 250 in the latest reported financial year, compared with the previous year’s figures.
Only 13% of other executive directors received a pay freeze this year, compared to about a quarter last year.
Total earnings
Other DirectorBasic salary
(£000s)Total cash
(£000s)Total earnings
(£000s)
FTSE 100 410 (440) 1,077 (1,107) 1,883 (2,048)
FTSE 250 332 (325) 671 (671) 981 (1,012)
Other Director Lower Quartile Median Upper Quartile
2016 2015 2016 2015 2016 2015
FTSE 100 2% 0% 3% 2% 8% 4%
FTSE 250 2% 0% 3% 3% 4% 5%
43Guide to directors’ remuneration 2016© 2016 KPMG LLP, a UK limited liability partnership and a member firm of the KPMG network of independent member firms affiliated with KPMG International Cooperative (“KPMG International”), a Swiss entity. All rights reserved.
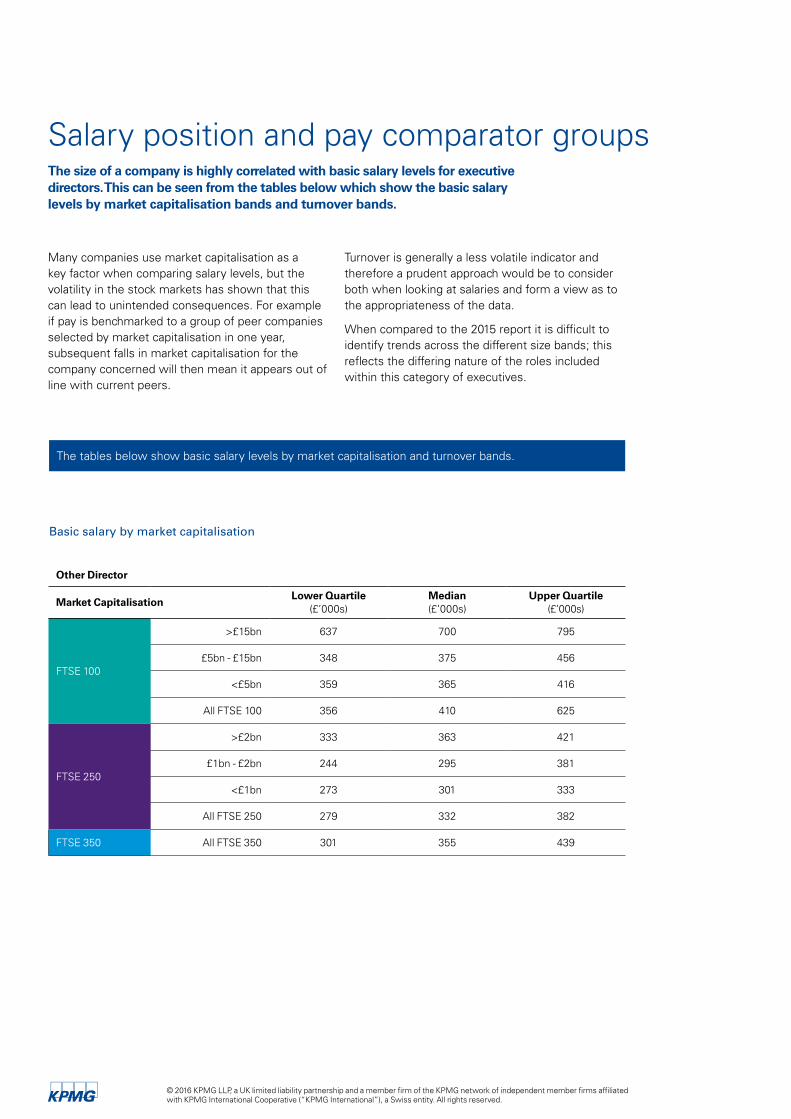
Salary position and pay comparator groupsThe size of a company is highly correlated with basic salary levels for executive directors. This can be seen from the tables below which show the basic salary levels by market capitalisation bands and turnover bands.
The tables below show basic salary levels by market capitalisation and turnover bands.
Many companies use market capitalisation as a key factor when comparing salary levels, but the volatility in the stock markets has shown that this can lead to unintended consequences. For example if pay is benchmarked to a group of peer companies selected by market capitalisation in one year, subsequent falls in market capitalisation for the company concerned will then mean it appears out of line with current peers.
Turnover is generally a less volatile indicator and therefore a prudent approach would be to consider both when looking at salaries and form a view as to the appropriateness of the data.
When compared to the 2015 report it is difficult to identify trends across the different size bands; this reflects the differing nature of the roles included within this category of executives.
Basic salary by market capitalisation
Other Director
Market CapitalisationLower Quartile
(£’000s)Median(£’000s)
Upper Quartile(£’000s)
FTSE 100
>£15bn 637 700 795
£5bn - £15bn 348 375 456
<£5bn 359 365 416
All FTSE 100 356 410 625
FTSE 250
>£2bn 333 363 421
£1bn - £2bn 244 295 381
<£1bn 273 301 333
All FTSE 250 279 332 382
FTSE 350 All FTSE 350 301 355 439
© 2016 KPMG LLP, a UK limited liability partnership and a member firm of the KPMG network of independent member firms affiliated with KPMG International Cooperative (“KPMG International”), a Swiss entity. All rights reserved.
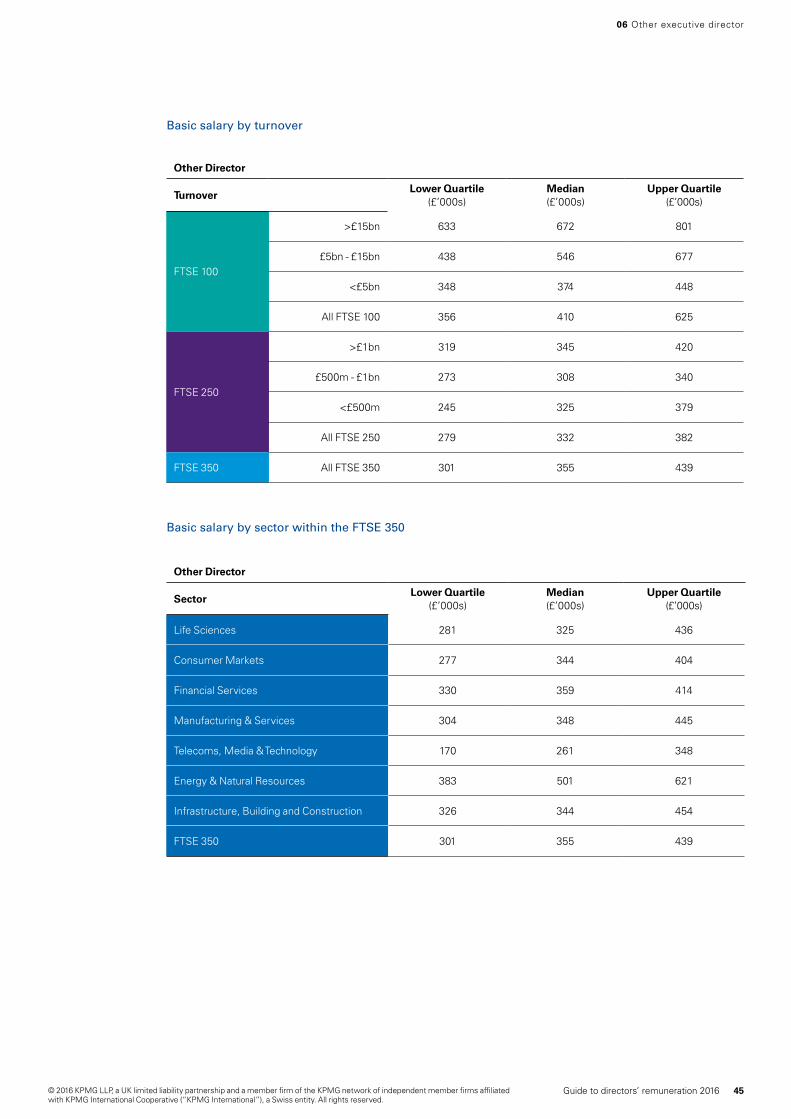
Basic salary by turnover
Basic salary by sector within the FTSE 350
06 Other executive director
Other Director
TurnoverLower Quartile
(£’000s)Median(£’000s)
Upper Quartile(£’000s)
FTSE 100
>£15bn 633 672 801
£5bn - £15bn 438 546 677
<£5bn 348 374 448
All FTSE 100 356 410 625
FTSE 250
>£1bn 319 345 420
£500m - £1bn 273 308 340
<£500m 245 325 379
All FTSE 250 279 332 382
FTSE 350 All FTSE 350 301 355 439
Other Director
SectorLower Quartile
(£’000s)Median(£’000s)
Upper Quartile(£’000s)
Life Sciences 281 325 436
Consumer Markets 277 344 404
Financial Services 330 359 414
Manufacturing & Services 304 348 445
Telecoms, Media & Technology 170 261 348
Energy & Natural Resources 383 501 621
Infrastructure, Building and Construction 326 344 454
FTSE 350 301 355 439
45Guide to directors’ remuneration 2016© 2016 KPMG LLP, a UK limited liability partnership and a member firm of the KPMG network of independent member firms affiliated with KPMG International Cooperative (“KPMG International”), a Swiss entity. All rights reserved.

© 2016 KPMG LLP, a UK limited liability partnership and a member firm of the KPMG network of independent member firms affiliated with KPMG International Cooperative (“KPMG International”), a Swiss entity. All rights reserved.
Median annual bonus by sector
Annual bonus plans
Annual bonus
The following table shows the same information (at median) split by sector.
06 Other executive director
The tables below show the following information for the FTSE 100 and the FTSE 250:
• The maximum potential bonus as a percentage of salary
• The total bonus paid as a percentage of salary
• The total bonus paid as a percentage of the maximum opportunity
• The total bonus paid in 2016 and in the previous year
Other Director FTSE 350
Sector (Median)Life
SciencesConsumer Markets
Financial Services
Manufac- turing
& Services
Telecoms, Media &
Technology
Energy & Natural
Resources
Infrastructure, Building and Construction
Maximum bonus opportunity (% of salary)
100% 100% 150% 106% 148% 150% 150%
Total bonus (% of salary)
76% 67% 120% 81% 85% 100% 152%
Total bonus (% of maximum bonus)
70% 58% 75% 62% 36% 40% 100%
2016 Total bonus (£'000)
233 221 439 295 168 533 602
Other Director FTSE 100 FTSE 250
Lower Quartile
MedianUpper
QuartileLower
QuartileMedian
Upper Quartile
Maximum bonus opportunity (% of salary)
150% 150% 200% 100% 125% 150%
Total bonus (% of salary)
79% 108% 146% 55% 86% 124%
Total bonus (% of maximum bonus)
50% 76% 93% 39% 71% 87%
2016 Total bonus (£'000)
341 497 850 177 256 426
2015 Total bonus (£'000)
358 507 728 165 276 389
47Guide to directors’ remuneration 2016© 2016 KPMG LLP, a UK limited liability partnership and a member firm of the KPMG network of independent member firms affiliated with KPMG International Cooperative (“KPMG International”), a Swiss entity. All rights reserved.
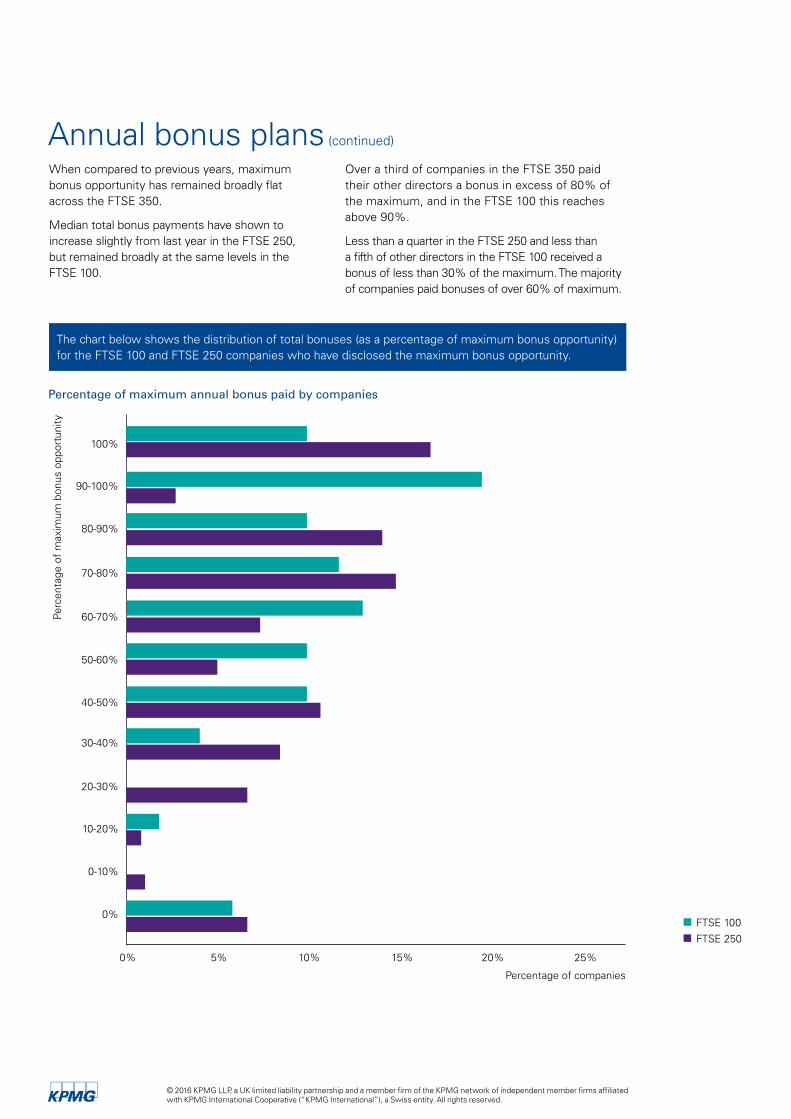
The chart below shows the distribution of total bonuses (as a percentage of maximum bonus opportunity) for the FTSE 100 and FTSE 250 companies who have disclosed the maximum bonus opportunity.
Annual bonus plans (continued)
Percentage of maximum annual bonus paid by companies
0% 5% 10% 15% 20% 25%
FTSE 100
FTSE 250
0%
0-10%
10-20%
20-30%
30-40%
40-50%
50-60%
60-70%
70-80%
80-90%
90-100%
100%
Percentage of companies
Perc
enta
ge o
f m
axim
um b
onus
opp
ortu
nity
When compared to previous years, maximum bonus opportunity has remained broadly flat across the FTSE 350.
Median total bonus payments have shown to increase slightly from last year in the FTSE 250, but remained broadly at the same levels in the FTSE 100.
Over a third of companies in the FTSE 350 paid their other directors a bonus in excess of 80% of the maximum, and in the FTSE 100 this reaches above 90%.
Less than a quarter in the FTSE 250 and less than a fifth of other directors in the FTSE 100 received a bonus of less than 30% of the maximum. The majority of companies paid bonuses of over 60% of maximum.
© 2016 KPMG LLP, a UK limited liability partnership and a member firm of the KPMG network of independent member firms affiliated with KPMG International Cooperative (“KPMG International”), a Swiss entity. All rights reserved.
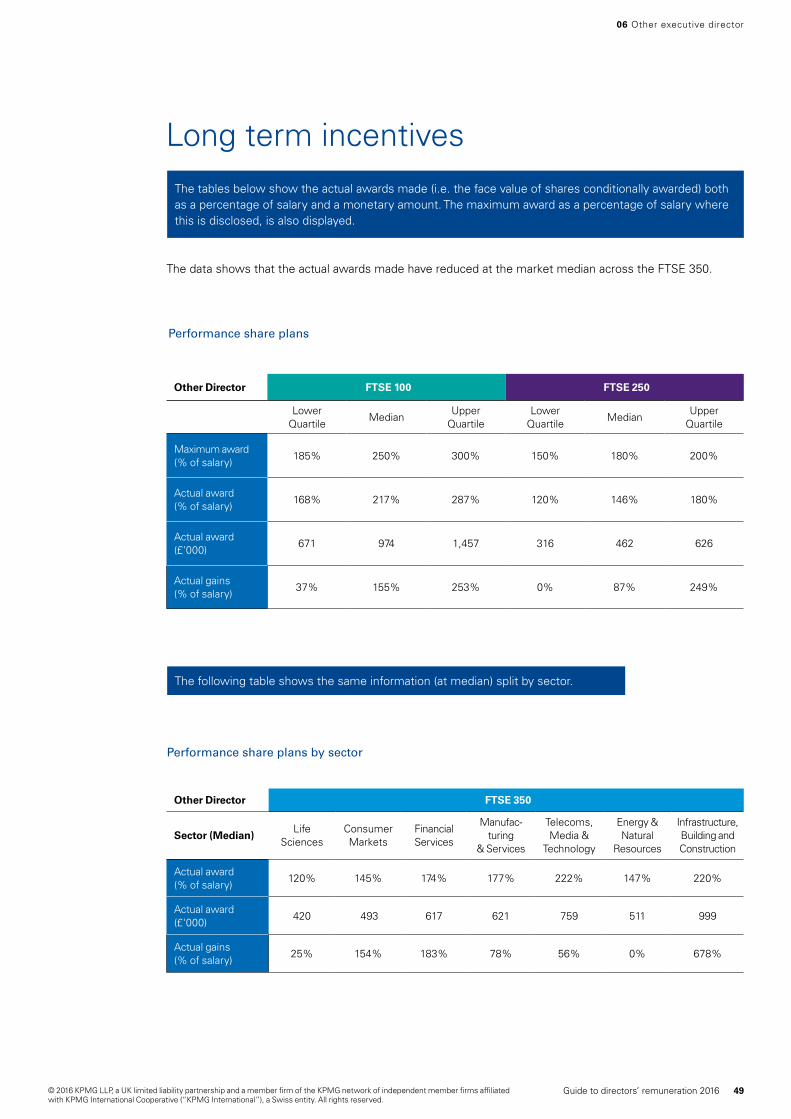
Long term incentives
Performance share plans
Performance share plans by sector
The following table shows the same information (at median) split by sector.
The tables below show the actual awards made (i.e. the face value of shares conditionally awarded) both as a percentage of salary and a monetary amount. The maximum award as a percentage of salary where this is disclosed, is also displayed.
The data shows that the actual awards made have reduced at the market median across the FTSE 350.
06 Other executive director
Other Director FTSE 100 FTSE 250
Lower Quartile
MedianUpper
QuartileLower
QuartileMedian
Upper Quartile
Maximum award (% of salary)
185% 250% 300% 150% 180% 200%
Actual award (% of salary)
168% 217% 287% 120% 146% 180%
Actual award (£'000)
671 974 1,457 316 462 626
Actual gains (% of salary)
37% 155% 253% 0% 87% 249%
Other Director FTSE 350
Sector (Median)Life
SciencesConsumer Markets
Financial Services
Manufac- turing
& Services
Telecoms, Media &
Technology
Energy & Natural
Resources
Infrastructure, Building and Construction
Actual award (% of salary)
120% 145% 174% 177% 222% 147% 220%
Actual award (£'000)
420 493 617 621 759 511 999
Actual gains (% of salary)
25% 154% 183% 78% 56% 0% 678%
49Guide to directors’ remuneration 2016© 2016 KPMG LLP, a UK limited liability partnership and a member firm of the KPMG network of independent member firms affiliated with KPMG International Cooperative (“KPMG International”), a Swiss entity. All rights reserved.
This section of the report discusses trends in incentives, specifically the structure of incentives and performance conditions attached to incentives. Market data relating to quantum and payouts for each executive director role is contained in the previous sections.
Incentives 07
© 2016 KPMG LLP, a UK limited liability partnership and a member firm of the KPMG network of independent member firms affiliated with KPMG International Cooperative (“KPMG International”), a Swiss entity. All rights reserved.
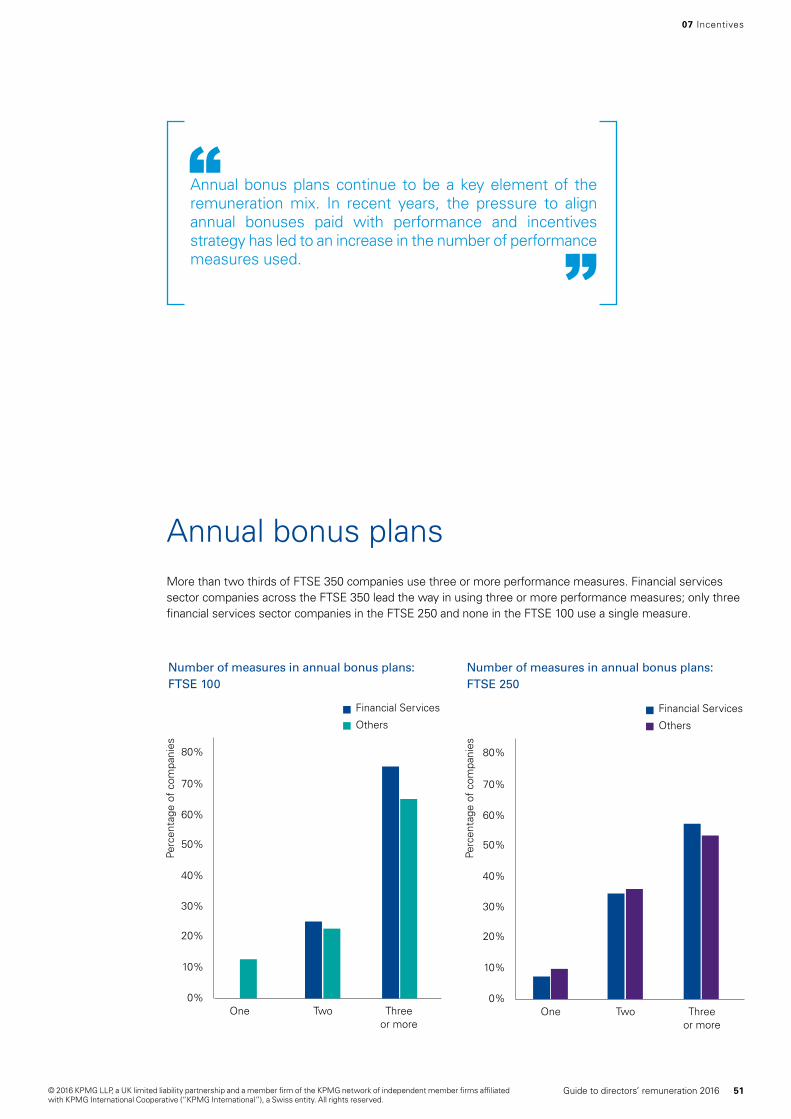
Annual bonus plans continue to be a key element of the remuneration mix. In recent years, the pressure to align annual bonuses paid with performance and incentives strategy has led to an increase in the number of performance measures used.
“”
More than two thirds of FTSE 350 companies use three or more performance measures. Financial services sector companies across the FTSE 350 lead the way in using three or more performance measures; only three financial services sector companies in the FTSE 250 and none in the FTSE 100 use a single measure.
Annual bonus plans
07 Incentives
Number of measures in annual bonus plans: FTSE 250
Number of measures in annual bonus plans: FTSE 100
Financial Services
Others
Financial Services
Others
80%
70%
60%
50%
40%
30%
20%
10%
0%Two Three
or moreOne
80%
70%
60%
50%
40%
30%
20%
10%
0%Two Three
or moreOne
Perc
enta
ge o
f co
mpa
nies
Perc
enta
ge o
f co
mpa
nies
51Guide to directors’ remuneration 2016© 2016 KPMG LLP, a UK limited liability partnership and a member firm of the KPMG network of independent member firms affiliated with KPMG International Cooperative (“KPMG International”), a Swiss entity. All rights reserved.

© 2016 KPMG LLP, a UK limited liability partnership and a member firm of the KPMG network of independent member firms affiliated with KPMG International Cooperative (“KPMG International”), a Swiss entity. All rights reserved.
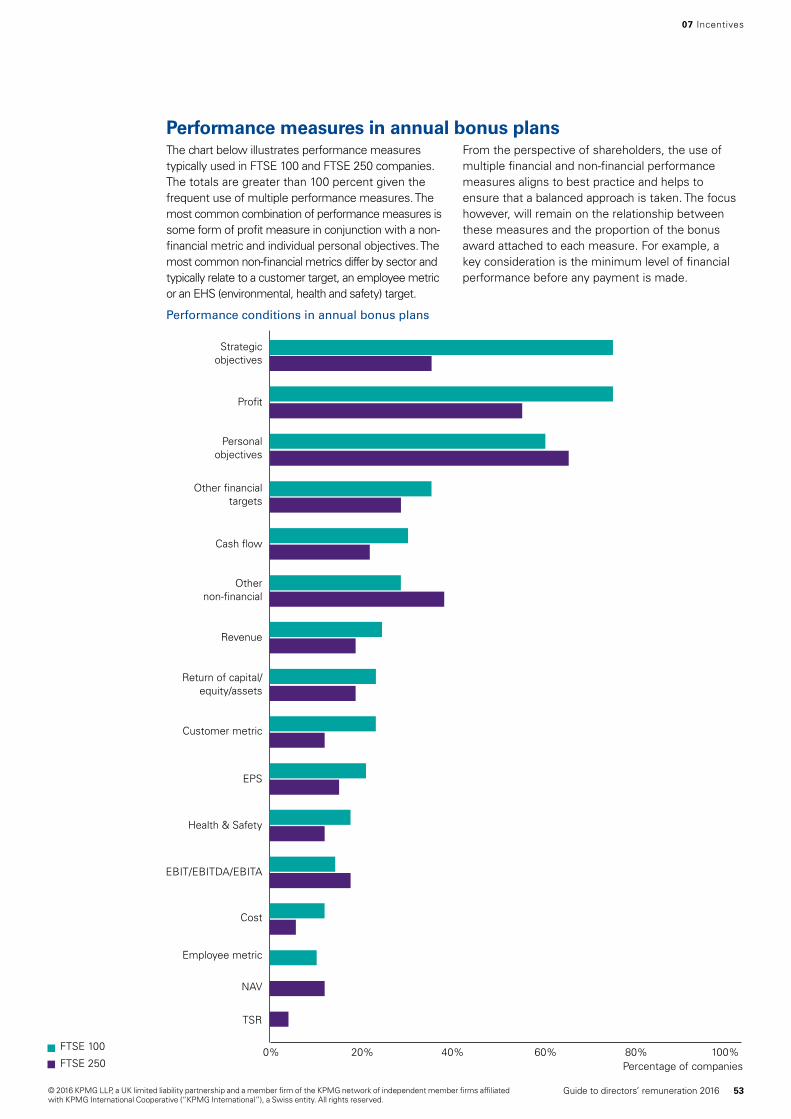
The chart below illustrates performance measures typically used in FTSE 100 and FTSE 250 companies. The totals are greater than 100 percent given the frequent use of multiple performance measures. The most common combination of performance measures is some form of profit measure in conjunction with a non-financial metric and individual personal objectives. The most common non-financial metrics differ by sector and typically relate to a customer target, an employee metric or an EHS (environmental, health and safety) target.
From the perspective of shareholders, the use of multiple financial and non-financial performance measures aligns to best practice and helps to ensure that a balanced approach is taken. The focus however, will remain on the relationship between these measures and the proportion of the bonus award attached to each measure. For example, a key consideration is the minimum level of financial performance before any payment is made.
Performance conditions in annual bonus plans
0% 20% 40% 60% 80% 100%
Revenue
Return of capital/ equity/assets
Profit
Personal objectives
Other non-financial
Other financial targets
NAV
Health & Safety
EPS
Employee metric
EBIT/EBITDA/EBITA
Customer metric
Cost
Cash flow
Strategic objectives
TSR
Percentage of companies
FTSE 100
FTSE 250
07 Incentives
Performance measures in annual bonus plans
53Guide to directors’ remuneration 2016© 2016 KPMG LLP, a UK limited liability partnership and a member firm of the KPMG network of independent member firms affiliated with KPMG International Cooperative (“KPMG International”), a Swiss entity. All rights reserved.
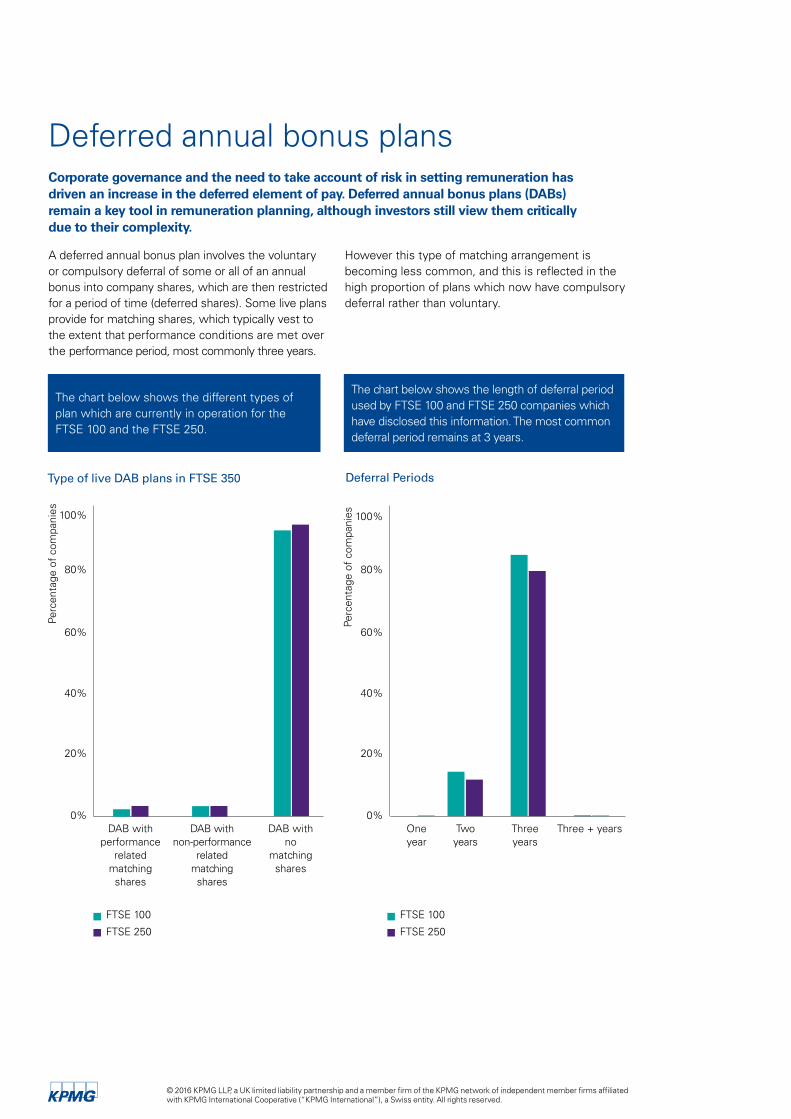
Deferred annual bonus plansCorporate governance and the need to take account of risk in setting remuneration has driven an increase in the deferred element of pay. Deferred annual bonus plans (DABs) remain a key tool in remuneration planning, although investors still view them critically due to their complexity.
A deferred annual bonus plan involves the voluntary or compulsory deferral of some or all of an annual bonus into company shares, which are then restricted for a period of time (deferred shares). Some live plans provide for matching shares, which typically vest to the extent that performance conditions are met over the performance period, most commonly three years.
However this type of matching arrangement is becoming less common, and this is reflected in the high proportion of plans which now have compulsory deferral rather than voluntary.
The chart below shows the different types of plan which are currently in operation for the FTSE 100 and the FTSE 250.
The chart below shows the length of deferral period used by FTSE 100 and FTSE 250 companies which have disclosed this information. The most common deferral period remains at 3 years.
Type of live DAB plans in FTSE 350
FTSE 100
FTSE 250
80%
60%
40%
20%
0%DAB with
performance related
matching shares
DAB with non-performance
related matching shares
DAB with no
matching shares
100%
Deferral Periods
FTSE 100
FTSE 250
80%
100%
60%
40%
20%
0%Three years
Two years
One year
Three + years
Perc
enta
ge o
f co
mpa
nies
Perc
enta
ge o
f co
mpa
nies
© 2016 KPMG LLP, a UK limited liability partnership and a member firm of the KPMG network of independent member firms affiliated with KPMG International Cooperative (“KPMG International”), a Swiss entity. All rights reserved.
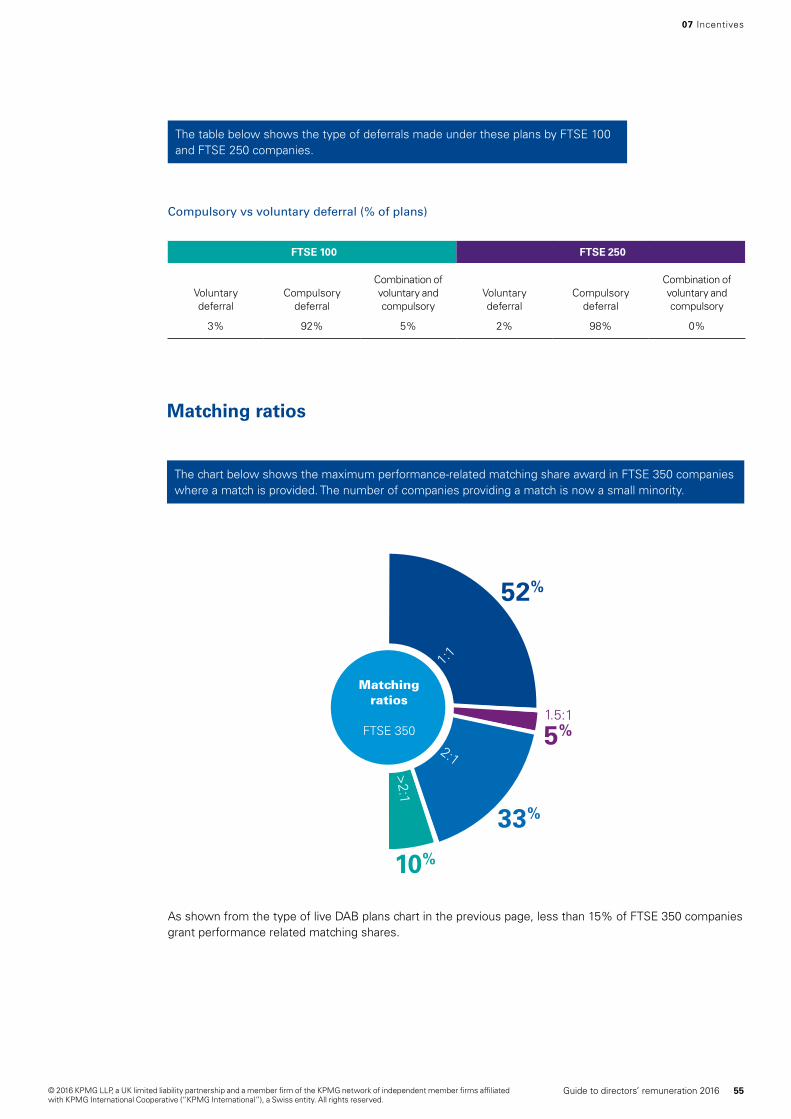
Matching ratios
The chart below shows the maximum performance-related matching share award in FTSE 350 companies where a match is provided. The number of companies providing a match is now a small minority.
As shown from the type of live DAB plans chart in the previous page, less than 15% of FTSE 350 companies grant performance related matching shares.
5%
33%
10%
Matching ratios
FTSE 350
1:1
52%
2:1
1.5:1
>2:1
FTSE 100 FTSE 250
Voluntarydeferral
Compulsorydeferral
Combination ofvoluntary andcompulsory
Voluntarydeferral
Compulsorydeferral
Combination ofvoluntary andcompulsory
3% 92% 5% 2% 98% 0%
Compulsory vs voluntary deferral (% of plans)
The table below shows the type of deferrals made under these plans by FTSE 100 and FTSE 250 companies.
07 Incentives
55Guide to directors’ remuneration 2016© 2016 KPMG LLP, a UK limited liability partnership and a member firm of the KPMG network of independent member firms affiliated with KPMG International Cooperative (“KPMG International”), a Swiss entity. All rights reserved.
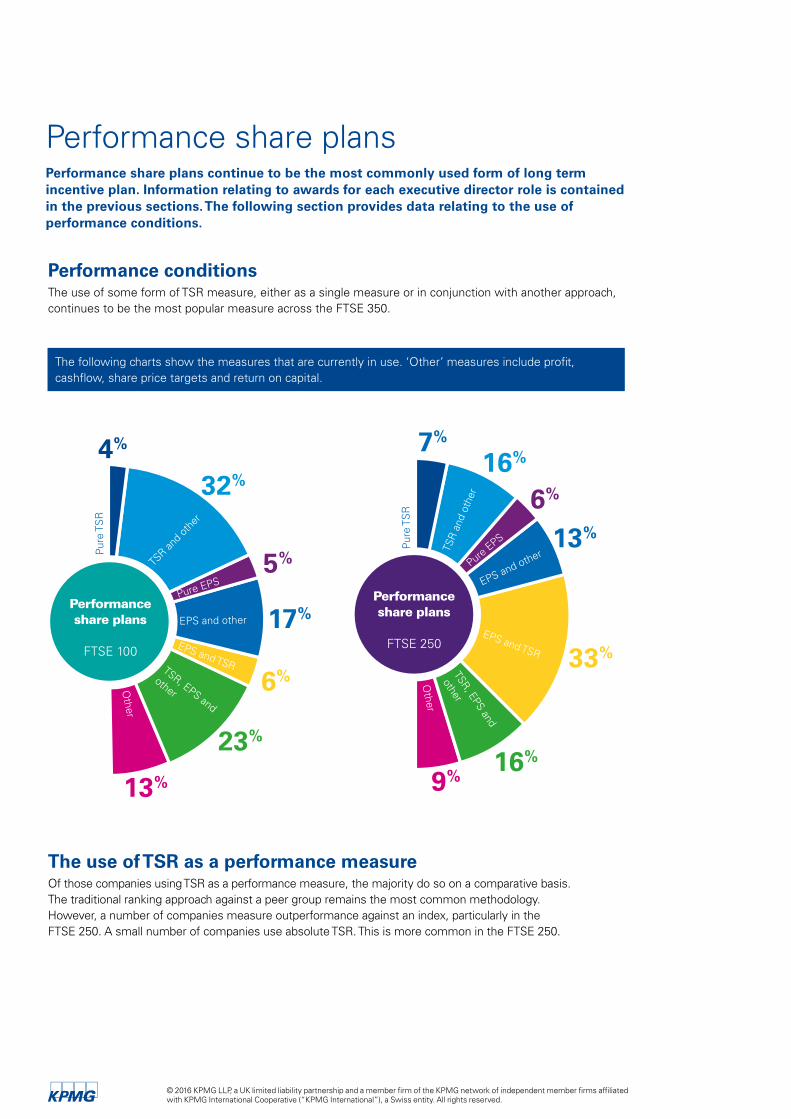
Performance share plansPerformance share plans continue to be the most commonly used form of long term incentive plan. Information relating to awards for each executive director role is contained in the previous sections. The following section provides data relating to the use of performance conditions.
Performance conditions The use of some form of TSR measure, either as a single measure or in conjunction with another approach, continues to be the most popular measure across the FTSE 350.
The use of TSR as a performance measureOf those companies using TSR as a performance measure, the majority do so on a comparative basis. The traditional ranking approach against a peer group remains the most common methodology. However, a number of companies measure outperformance against an index, particularly in the FTSE 250. A small number of companies use absolute TSR. This is more common in the FTSE 250.
The following charts show the measures that are currently in use. ‘Other’ measures include profit, cashflow, share price targets and return on capital.
Performance share plans
FTSE 100
TSR an
d oth
er
EPS and other
TSR, EPS and
otherOther
EPS and TSR
Pure
TS
R
Pure EPS
4%
32%
5%
17%
6%
23%
13%
Performance share plans
FTSE 250
Pure
TS
R
TSR
and
oth
er
Pure EPS
EPS and other
EPS and TSR
TSR, EPS and
other
Other
7%
16%
6%
13%
33%
16%
9%
© 2016 KPMG LLP, a UK limited liability partnership and a member firm of the KPMG network of independent member firms affiliated with KPMG International Cooperative (“KPMG International”), a Swiss entity. All rights reserved.
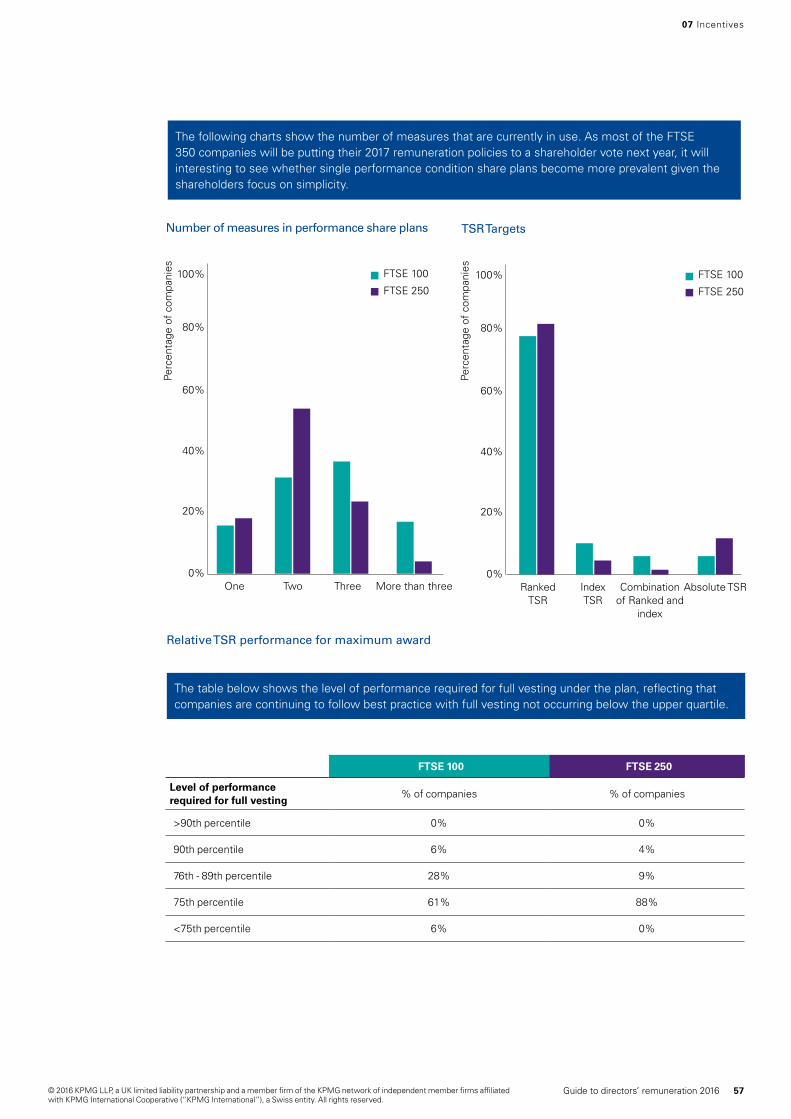
Relative TSR performance for maximum award
FTSE 100 FTSE 250
Level of performance required for full vesting
% of companies % of companies
>90th percentile 0% 0%
90th percentile 6% 4%
76th - 89th percentile 28% 9%
75th percentile 61% 88%
<75th percentile 6% 0%
Number of measures in performance share plans TSR Targets
The table below shows the level of performance required for full vesting under the plan, reflecting that companies are continuing to follow best practice with full vesting not occurring below the upper quartile.
The following charts show the number of measures that are currently in use. As most of the FTSE 350 companies will be putting their 2017 remuneration policies to a shareholder vote next year, it will interesting to see whether single performance condition share plans become more prevalent given the shareholders focus on simplicity.
07 Incentives
FTSE 100
FTSE 250
80%
100%
60%
40%
20%
0%Three Two One More than three
FTSE 100
FTSE 250
80%
100%
60%
40%
20%
0%Combination
of Ranked and index
Index TSR
Ranked TSR
Absolute TSR
Perc
enta
ge o
f co
mpa
nies
Perc
enta
ge o
f co
mpa
nies
57Guide to directors’ remuneration 2016© 2016 KPMG LLP, a UK limited liability partnership and a member firm of the KPMG network of independent member firms affiliated with KPMG International Cooperative (“KPMG International”), a Swiss entity. All rights reserved.

Pensions08
This section provides information on the pension arrangements of executive directors and their role in the total remuneration mix.
© 2016 KPMG LLP, a UK limited liability partnership and a member firm of the KPMG network of independent member firms affiliated with KPMG International Cooperative (“KPMG International”), a Swiss entity. All rights reserved.
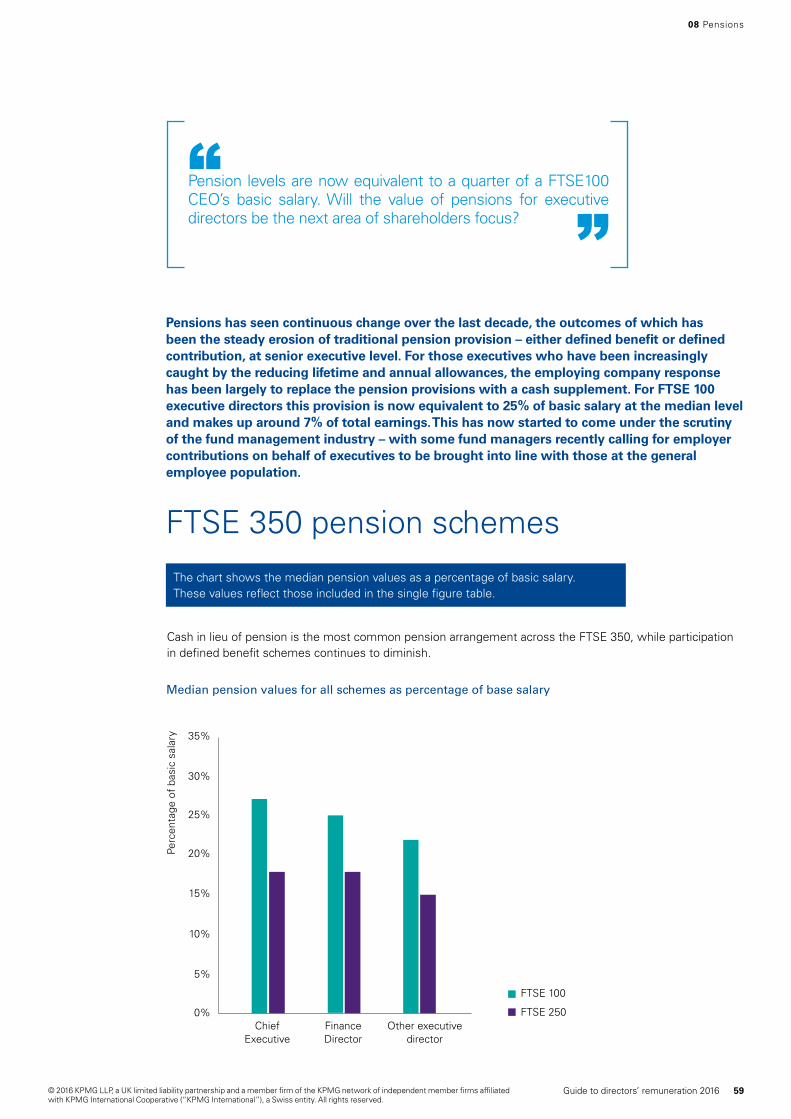
Pension levels are now equivalent to a quarter of a FTSE100 CEO’s basic salary. Will the value of pensions for executive directors be the next area of shareholders focus?
“”
08 Pensions
FTSE 350 pension schemes
Cash in lieu of pension is the most common pension arrangement across the FTSE 350, while participation in defined benefit schemes continues to diminish.
The chart shows the median pension values as a percentage of basic salary. These values reflect those included in the single figure table.
Median pension values for all schemes as percentage of base salary
Chief Executive
Finance Director
Other executive director
FTSE 100
FTSE 250
35%
30%
25%
20%
15%
10%
5%
0%
Perc
enta
ge o
f ba
sic
sala
ry
Pensions has seen continuous change over the last decade, the outcomes of which has been the steady erosion of traditional pension provision – either defined benefit or defined contribution, at senior executive level. For those executives who have been increasingly caught by the reducing lifetime and annual allowances, the employing company response has been largely to replace the pension provisions with a cash supplement. For FTSE 100 executive directors this provision is now equivalent to 25% of basic salary at the median level and makes up around 7% of total earnings. This has now started to come under the scrutiny of the fund management industry – with some fund managers recently calling for employer contributions on behalf of executives to be brought into line with those at the general employee population.
59Guide to directors’ remuneration 2016© 2016 KPMG LLP, a UK limited liability partnership and a member firm of the KPMG network of independent member firms affiliated with KPMG International Cooperative (“KPMG International”), a Swiss entity. All rights reserved.
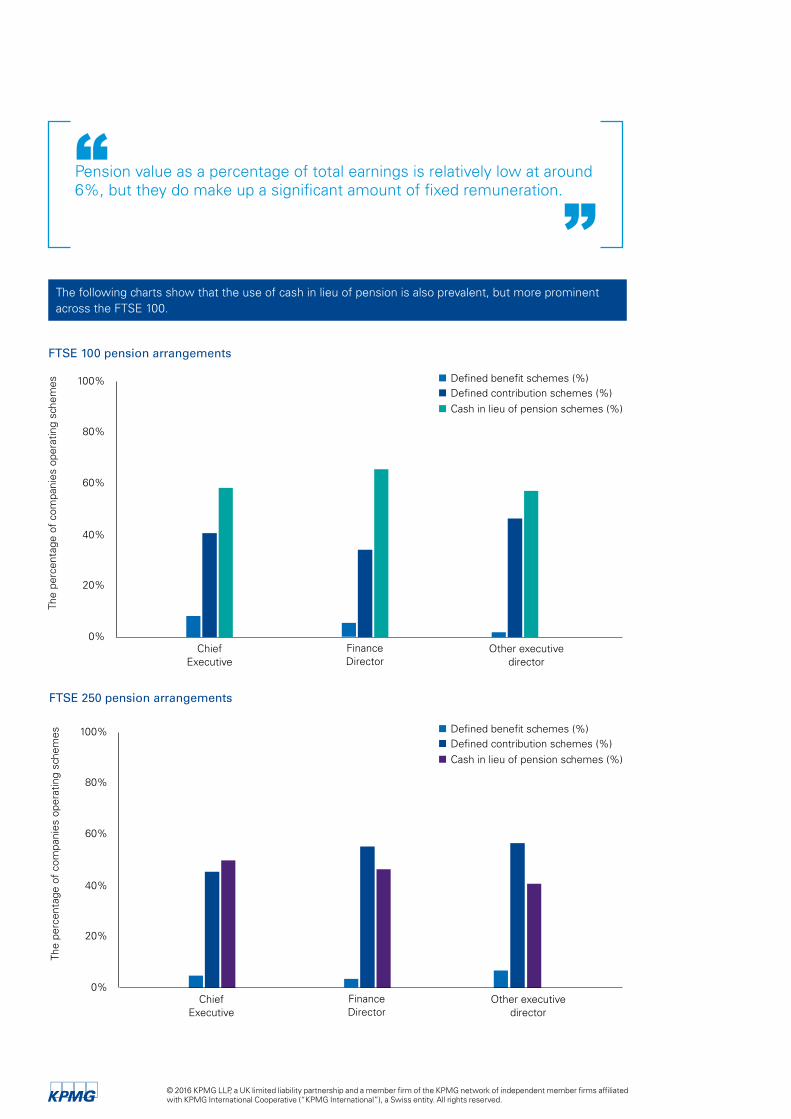
FTSE 100 pension arrangements
Defined benefit schemes (%)Defined contribution schemes (%)Cash in lieu of pension schemes (%)
100%
80%
60%
40%
20%
0%
The
perc
enta
ge o
f co
mpa
nies
ope
ratin
g sc
hem
es
Chief Executive
Other executive director
Finance Director
FTSE 250 pension arrangements
Defined benefit schemes (%)Defined contribution schemes (%)Cash in lieu of pension schemes (%)
100%
80%
60%
40%
20%
0%
The
perc
enta
ge o
f co
mpa
nies
ope
ratin
g sc
hem
es
Chief Executive
Other executive director
Finance Director
The following charts show that the use of cash in lieu of pension is also prevalent, but more prominent across the FTSE 100.
Pension value as a percentage of total earnings is relatively low at around 6%, but they do make up a significant amount of fixed remuneration.“
”
© 2016 KPMG LLP, a UK limited liability partnership and a member firm of the KPMG network of independent member firms affiliated with KPMG International Cooperative (“KPMG International”), a Swiss entity. All rights reserved.
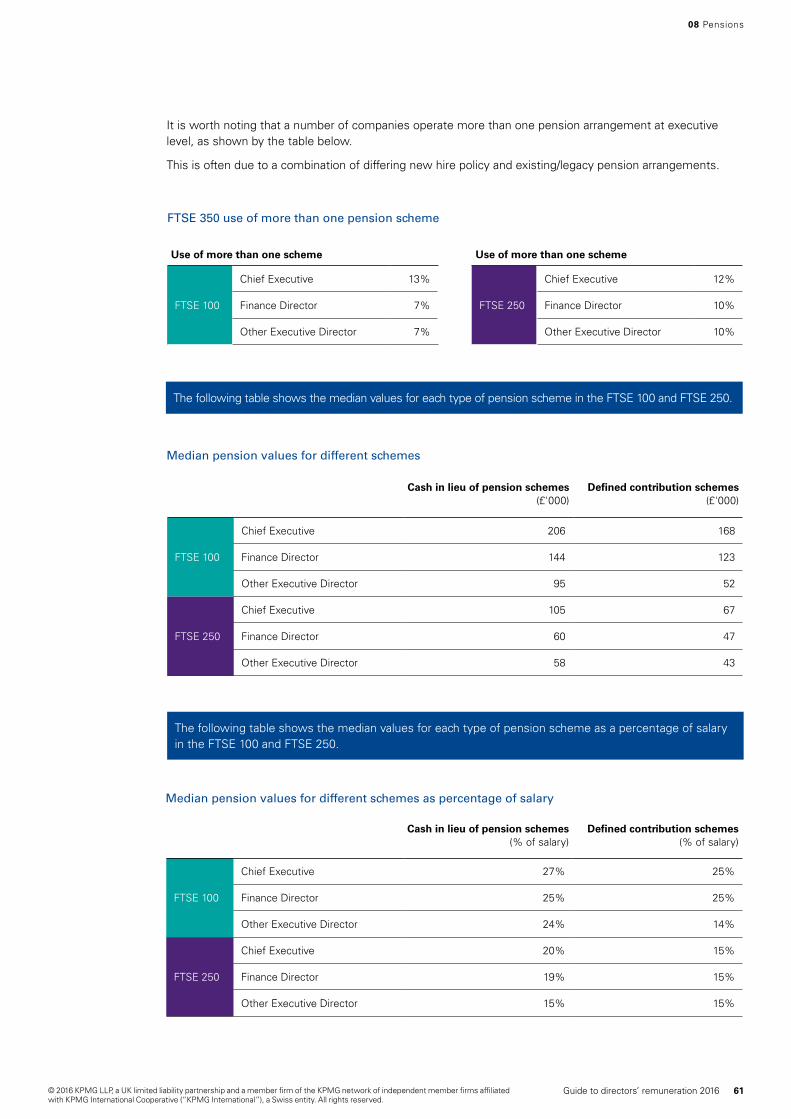
It is worth noting that a number of companies operate more than one pension arrangement at executive level, as shown by the table below.
This is often due to a combination of differing new hire policy and existing/legacy pension arrangements.
The following table shows the median values for each type of pension scheme as a percentage of salary in the FTSE 100 and FTSE 250.
Median pension values for different schemes
Median pension values for different schemes as percentage of salary
The following table shows the median values for each type of pension scheme in the FTSE 100 and FTSE 250.
Cash in lieu of pension schemes (£'000)
Defined contribution schemes (£'000)
FTSE 100
Chief Executive 206 168
Finance Director 144 123
Other Executive Director 95 52
FTSE 250
Chief Executive 105 67
Finance Director 60 47
Other Executive Director 58 43
Cash in lieu of pension schemes (% of salary)
Defined contribution schemes (% of salary)
FTSE 100
Chief Executive 27% 25%
Finance Director 25% 25%
Other Executive Director 24% 14%
FTSE 250
Chief Executive 20% 15%
Finance Director 19% 15%
Other Executive Director 15% 15%
FTSE 350 use of more than one pension scheme
Use of more than one scheme
FTSE 100
Chief Executive 13%
Finance Director 7%
Other Executive Director 7%
Use of more than one scheme
FTSE 250
Chief Executive 12%
Finance Director 10%
Other Executive Director 10%
08 Pensions
61Guide to directors’ remuneration 2016© 2016 KPMG LLP, a UK limited liability partnership and a member firm of the KPMG network of independent member firms affiliated with KPMG International Cooperative (“KPMG International”), a Swiss entity. All rights reserved.
Non-executive director
09
This section provides information on remuneration for the role of chairman and non-executive director.
© 2016 KPMG LLP, a UK limited liability partnership and a member firm of the KPMG network of independent member firms affiliated with KPMG International Cooperative (“KPMG International”), a Swiss entity. All rights reserved.
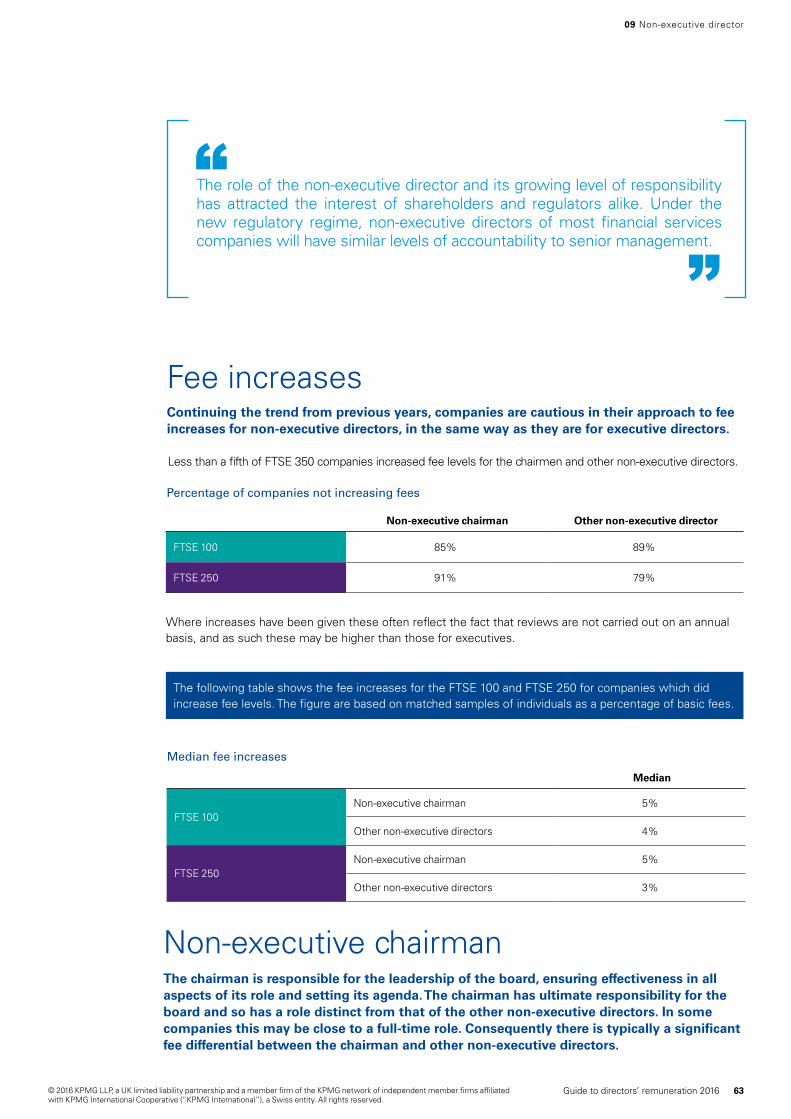
Non-executive chairman Other non-executive director
FTSE 100 85% 89%
FTSE 250 91% 79%
Median fee increases
Median
FTSE 100Non-executive chairman 5%
Other non-executive directors 4%
FTSE 250Non-executive chairman 5%
Other non-executive directors 3%
Where increases have been given these often reflect the fact that reviews are not carried out on an annual basis, and as such these may be higher than those for executives.
Fee increases Continuing the trend from previous years, companies are cautious in their approach to fee increases for non-executive directors, in the same way as they are for executive directors.
Less than a fifth of FTSE 350 companies increased fee levels for the chairmen and other non-executive directors.
The following table shows the fee increases for the FTSE 100 and FTSE 250 for companies which did increase fee levels. The figure are based on matched samples of individuals as a percentage of basic fees.
The role of the non-executive director and its growing level of responsibility has attracted the interest of shareholders and regulators alike. Under the new regulatory regime, non-executive directors of most financial services companies will have similar levels of accountability to senior management.
“”
Percentage of companies not increasing fees
09 Non-executive director
Non-executive chairman The chairman is responsible for the leadership of the board, ensuring effectiveness in all aspects of its role and setting its agenda. The chairman has ultimate responsibility for the board and so has a role distinct from that of the other non-executive directors. In some companies this may be close to a full-time role. Consequently there is typically a significant fee differential between the chairman and other non-executive directors.
63Guide to directors’ remuneration 2016© 2016 KPMG LLP, a UK limited liability partnership and a member firm of the KPMG network of independent member firms affiliated with KPMG International Cooperative (“KPMG International”), a Swiss entity. All rights reserved.
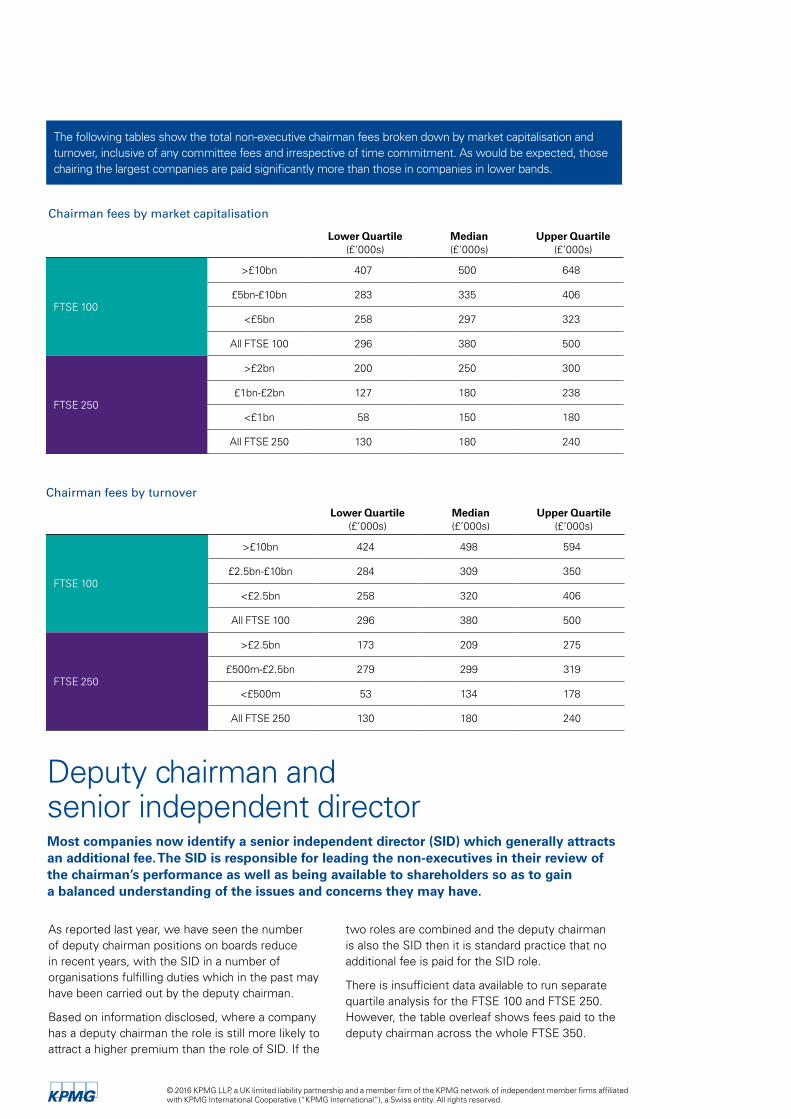
Deputy chairman and senior independent director Most companies now identify a senior independent director (SID) which generally attracts an additional fee. The SID is responsible for leading the non-executives in their review of the chairman’s performance as well as being available to shareholders so as to gain a balanced understanding of the issues and concerns they may have.
The following tables show the total non-executive chairman fees broken down by market capitalisation and turnover, inclusive of any committee fees and irrespective of time commitment. As would be expected, those chairing the largest companies are paid significantly more than those in companies in lower bands.
Chairman fees by turnover
Lower Quartile(£’000s)
Median(£’000s)
Upper Quartile(£’000s)
FTSE 100
>£10bn 424 498 594
£2.5bn-£10bn 284 309 350
<£2.5bn 258 320 406
All FTSE 100 296 380 500
FTSE 250
>£2.5bn 173 209 275
£500m-£2.5bn 279 299 319
<£500m 53 134 178
All FTSE 250 130 180 240
Chairman fees by market capitalisation
Lower Quartile(£’000s)
Median(£’000s)
Upper Quartile(£’000s)
FTSE 100
>£10bn 407 500 648
£5bn-£10bn 283 335 406
<£5bn 258 297 323
All FTSE 100 296 380 500
FTSE 250
>£2bn 200 250 300
£1bn-£2bn 127 180 238
<£1bn 58 150 180
All FTSE 250 130 180 240
As reported last year, we have seen the number of deputy chairman positions on boards reduce in recent years, with the SID in a number of organisations fulfilling duties which in the past may have been carried out by the deputy chairman.
Based on information disclosed, where a company has a deputy chairman the role is still more likely to attract a higher premium than the role of SID. If the
two roles are combined and the deputy chairman is also the SID then it is standard practice that no additional fee is paid for the SID role.
There is insufficient data available to run separate quartile analysis for the FTSE 100 and FTSE 250. However, the table overleaf shows fees paid to the deputy chairman across the whole FTSE 350.
© 2016 KPMG LLP, a UK limited liability partnership and a member firm of the KPMG network of independent member firms affiliated with KPMG International Cooperative (“KPMG International”), a Swiss entity. All rights reserved.
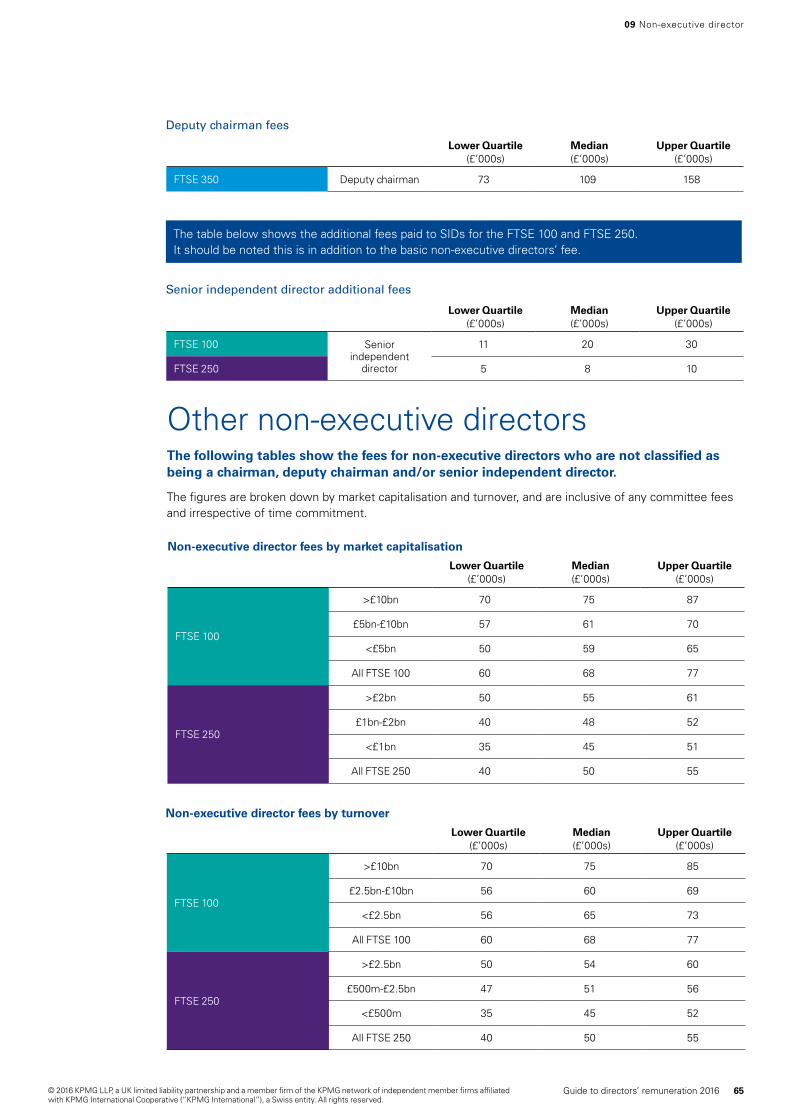
The table below shows the additional fees paid to SIDs for the FTSE 100 and FTSE 250. It should be noted this is in addition to the basic non-executive directors’ fee.
09 Non-executive director
Other non-executive directors The following tables show the fees for non-executive directors who are not classified as being a chairman, deputy chairman and/or senior independent director.
The figures are broken down by market capitalisation and turnover, and are inclusive of any committee fees and irrespective of time commitment.
Non-executive director fees by market capitalisation
Lower Quartile(£’000s)
Median(£’000s)
Upper Quartile(£’000s)
FTSE 100
>£10bn 70 75 87
£5bn-£10bn 57 61 70
<£5bn 50 59 65
All FTSE 100 60 68 77
FTSE 250
>£2bn 50 55 61
£1bn-£2bn 40 48 52
<£1bn 35 45 51
All FTSE 250 40 50 55
Deputy chairman fees
Lower Quartile(£’000s)
Median(£’000s)
Upper Quartile(£’000s)
FTSE 350 Deputy chairman 73 109 158
Senior independent director additional fees
Lower Quartile(£’000s)
Median(£’000s)
Upper Quartile(£’000s)
FTSE 100 Senior independent
director
11 20 30
FTSE 250 5 8 10
Non-executive director fees by turnover
Lower Quartile(£’000s)
Median(£’000s)
Upper Quartile(£’000s)
FTSE 100
>£10bn 70 75 85
£2.5bn-£10bn 56 60 69
<£2.5bn 56 65 73
All FTSE 100 60 68 77
FTSE 250
>£2.5bn 50 54 60
£500m-£2.5bn 47 51 56
<£500m 35 45 52
All FTSE 250 40 50 55
65Guide to directors’ remuneration 2016© 2016 KPMG LLP, a UK limited liability partnership and a member firm of the KPMG network of independent member firms affiliated with KPMG International Cooperative (“KPMG International”), a Swiss entity. All rights reserved.
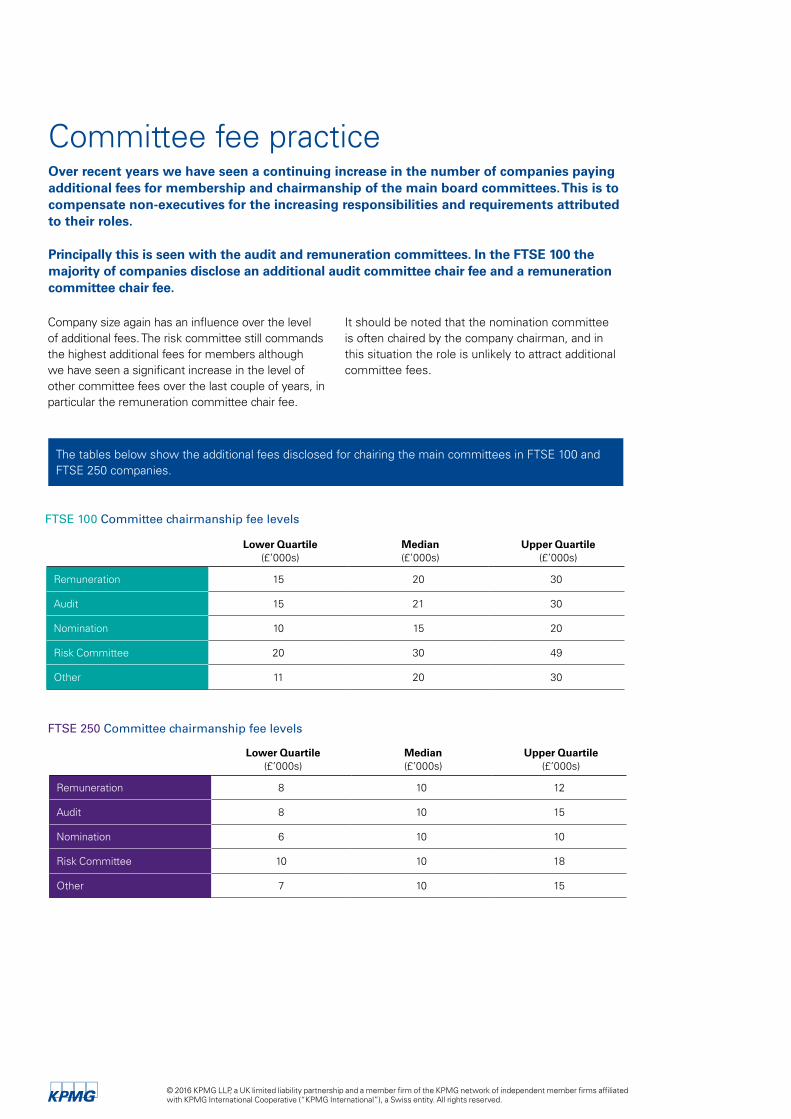
Committee fee practice Over recent years we have seen a continuing increase in the number of companies paying additional fees for membership and chairmanship of the main board committees. This is to compensate non-executives for the increasing responsibilities and requirements attributed to their roles.
Principally this is seen with the audit and remuneration committees. In the FTSE 100 the majority of companies disclose an additional audit committee chair fee and a remuneration committee chair fee.
FTSE 100 Committee chairmanship fee levels
Lower Quartile(£’000s)
Median(£’000s)
Upper Quartile(£’000s)
Remuneration 15 20 30
Audit 15 21 30
Nomination 10 15 20
Risk Committee 20 30 49
Other 11 20 30
Lower Quartile(£’000s)
Median(£’000s)
Upper Quartile(£’000s)
Remuneration 8 10 12
Audit 8 10 15
Nomination 6 10 10
Risk Committee 10 10 18
Other 7 10 15
FTSE 250 Committee chairmanship fee levels
The tables below show the additional fees disclosed for chairing the main committees in FTSE 100 and FTSE 250 companies.
Company size again has an influence over the level of additional fees. The risk committee still commands the highest additional fees for members although we have seen a significant increase in the level of other committee fees over the last couple of years, in particular the remuneration committee chair fee.
It should be noted that the nomination committee is often chaired by the company chairman, and in this situation the role is unlikely to attract additional committee fees.
© 2016 KPMG LLP, a UK limited liability partnership and a member firm of the KPMG network of independent member firms affiliated with KPMG International Cooperative (“KPMG International”), a Swiss entity. All rights reserved.
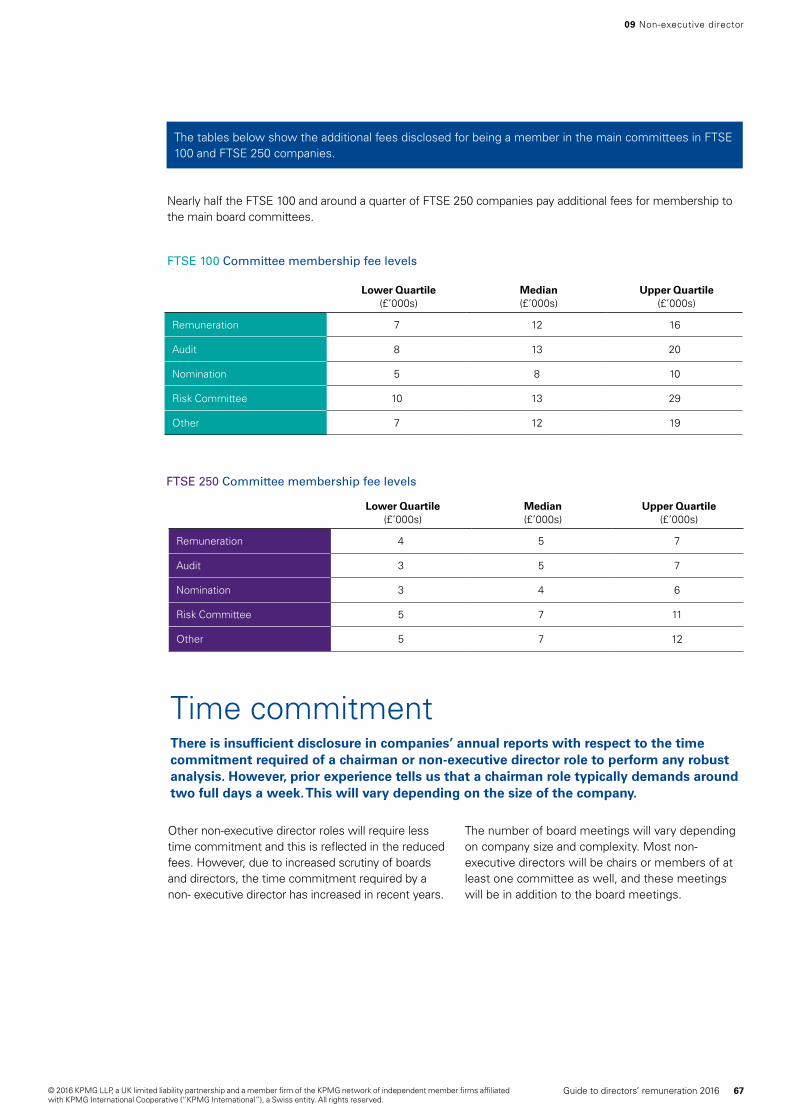
09 Non-executive director
Time commitment There is insufficient disclosure in companies’ annual reports with respect to the time commitment required of a chairman or non-executive director role to perform any robust analysis. However, prior experience tells us that a chairman role typically demands around two full days a week. This will vary depending on the size of the company.
Other non-executive director roles will require less time commitment and this is reflected in the reduced fees. However, due to increased scrutiny of boards and directors, the time commitment required by a non- executive director has increased in recent years.
The number of board meetings will vary depending on company size and complexity. Most non-executive directors will be chairs or members of at least one committee as well, and these meetings will be in addition to the board meetings.
The tables below show the additional fees disclosed for being a member in the main committees in FTSE 100 and FTSE 250 companies.
Nearly half the FTSE 100 and around a quarter of FTSE 250 companies pay additional fees for membership to the main board committees.
FTSE 100 Committee membership fee levels
Lower Quartile(£’000s)
Median(£’000s)
Upper Quartile(£’000s)
Remuneration 7 12 16
Audit 8 13 20
Nomination 5 8 10
Risk Committee 10 13 29
Other 7 12 19
FTSE 250 Committee membership fee levels
Lower Quartile(£’000s)
Median(£’000s)
Upper Quartile(£’000s)
Remuneration 4 5 7
Audit 3 5 7
Nomination 3 4 6
Risk Committee 5 7 11
Other 5 7 12
67Guide to directors’ remuneration 2016© 2016 KPMG LLP, a UK limited liability partnership and a member firm of the KPMG network of independent member firms affiliated with KPMG International Cooperative (“KPMG International”), a Swiss entity. All rights reserved.
The analysis in this guide is based on the most recently published annual report and accounts of each company as of 31 May 2016, as analysed by Manifest Information Services, an independent research organisation.
Methodology & assumptions
10 Appendix
© 2016 KPMG LLP, a UK limited liability partnership and a member firm of the KPMG network of independent member firms affiliated with KPMG International Cooperative (“KPMG International”), a Swiss entity. All rights reserved.
LTIP awardsLTIP awards are considered for the purpose of the guide to be awards where the vesting/performance period is longer than one year and have been categorised in the guide as performance share plans – a type of long term incentive in which participants are allocated free shares or nil cost options or, more commonly, rights to shares, the vesting of which is subject to the satisfaction of performance targets over a period of more than one year.
Median and quartile points For the purposes of the report, median information has been provided where there are four data points or more. Inter-quartile ranges have been provided where there are nine or more data points.
Data sources Unless otherwise stated, all graphs and tables have been created by KPMG, from data provided by Manifest Information Services. The data provided by Manifest Information Services has been further analysed by KPMG, using the methodology outlined below. In our research we have also drawn on analysis completed by IVIS (Institutional Voting Information Service).
Data sample FTSE constituents and market capitalisation figures are as at 31st May 2016 and turnover figures used for the analysis are as at the relevant reporting date for each company. All FTSE 350 investment trusts are excluded.
The positions included in the data sample are: chief executive, finance director, other executive directors and non-executive directors. Other executive director includes any main board position other than the chief executive, finance director, executive chairman and the non-executive directors. This typically includes operational directors, functional directors, chief operating officers, and executive deputy chairmen.
To enable the remuneration components of each position to be analysed they have been split in to the following categories:
Basic salary Annual salary received over a 12-month period as shown in the accounts (not necessarily set at annual review)
Total bonus Actual annual bonus paid plus any deferred portion of the annual bonus
Total cash The sum of basic salary, benefits and total bonus
Pensions The value of all pension related benefits including payments in lieu of retirement benefits and all retirement benefits in year from participating in pension schemes
Total earnings The sum of total cash, the value of any share based awards vested during the year, the value of any share options vested during the year and the cash value of pension arrangements. Final figure may also include some miscellaneous payments such as special payments for pensions, one-off bonuses for particular projects and profit share
10 Appendix: Methodology & assumptions
69Guide to directors’ remuneration 2016© 2016 KPMG LLP, a UK limited liability partnership and a member firm of the KPMG network of independent member firms affiliated with KPMG International Cooperative (“KPMG International”), a Swiss entity. All rights reserved.
The information contained herein is of a general nature and is not intended to address the circumstances of any particular individual or entity. Although we endeavour to provide accurate and timely information, there can be no guarantee that such information is accurate as of the date it is received or that it will continue to be accurate in the future. No one should act on such information without appropriate professional advice after a thorough examination of the particular situation.
© 2016 KPMG LLP, a UK limited liability partnership and a member firm of the KPMG network of independent member firms affiliated with KPMG International Cooperative (“KPMG International”), a Swiss entity. All rights reserved.
The KPMG name and logo are registered trademarks or trademarks of KPMG International.
CREATE | CRT066443A | November 2016
kpmg.com/uk
kpmg.com/uk/remreport16
Contact us
Tony Gilbert020 7694 [email protected]
Caroline Johnson 020 7694 1296 [email protected]
Steve Munday 020 7694 [email protected]
Ilias Nanas 020 7311 4841 [email protected]