Executive directors’ fees & remuneration ...
24
Executive directors’ fees & remuneration - Practices and trends South Africa July 2013 www.pwc.co.za
Transcript of Executive directors’ fees & remuneration ...
Executive directors’ fees & remuneration - Practices and trends South Africa July 2013
www.pwc.co.za
PwC
Introduction • NED report considers:
- Risk landscape
- The number of NEDs has risen to 2,294 (2,267)
• ED report considers:
- Executive pay model & disclosure
- Pay & gender gap
• Corporate governance update
• All data focuses on 373 JSE-listed companies and is based on publicly available information as at 30 November 2012 & April 2013
• Remuneration & fee analysis by reference to market capitalisation of the JSE and by four main industries – financial services, basic resources, industrial and services including AltX
• Profile of a JSE executive director
July 2013
2
PwC
The changing landscape for non-executive directors
• Emerging risks and increased ‘black swan’ events
• Technological revolution
• Emergence of ESG
• Board selection increasing risks
3
July 2013
PwC
Personal liability for non-executive directors
• New Companies Act – intention is to increase both transparency and accountability
• Breach of fiduciary responsibilities give rise to personal liability for losses caused, that may be unlimited
• NEDs personal risk management
• Risk mitigation alternatives
4
July 2013
PwC
NED independence
South Africa
• Nothing contained in the Companies Act on director rotation
• King III & best governance suggests that after a 9-yr period, director’s independence must be evaluated:
- This should be a rigorous review of the individual’s performance, and
- The Board and/or the Committee’s performance
- Preferably done by independent party
- Results of which should be communicated to shareholders
- Beneficial to express results at the AGM & in the Integrated Report why a director has been requested to stay on for an extended period
- Process should be followed every year thereafter
International
• 96% of FTSE 350 put all directors up for re-election every year
• Effectiveness of the board to be reviewed independently every three years
July 2013
5
PwC
Profile of a non-executive director (1)
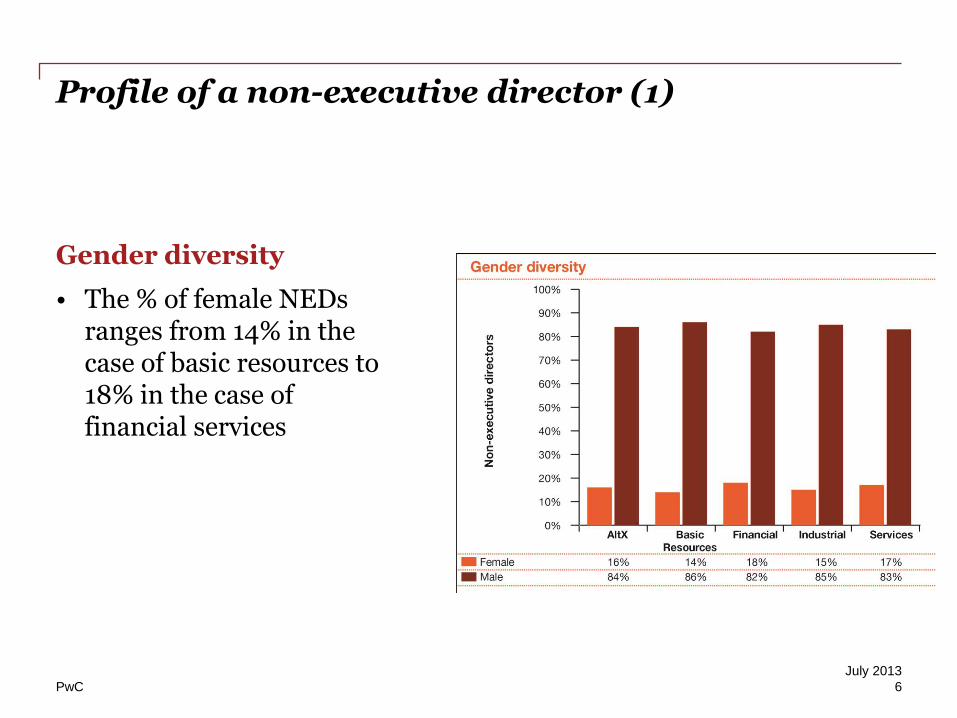
Gender diversity
• The % of female NEDs ranges from 14% in the case of basic resources to 18% in the case of financial services
6
July 2013
PwC
Profile of a non-executive director (2)
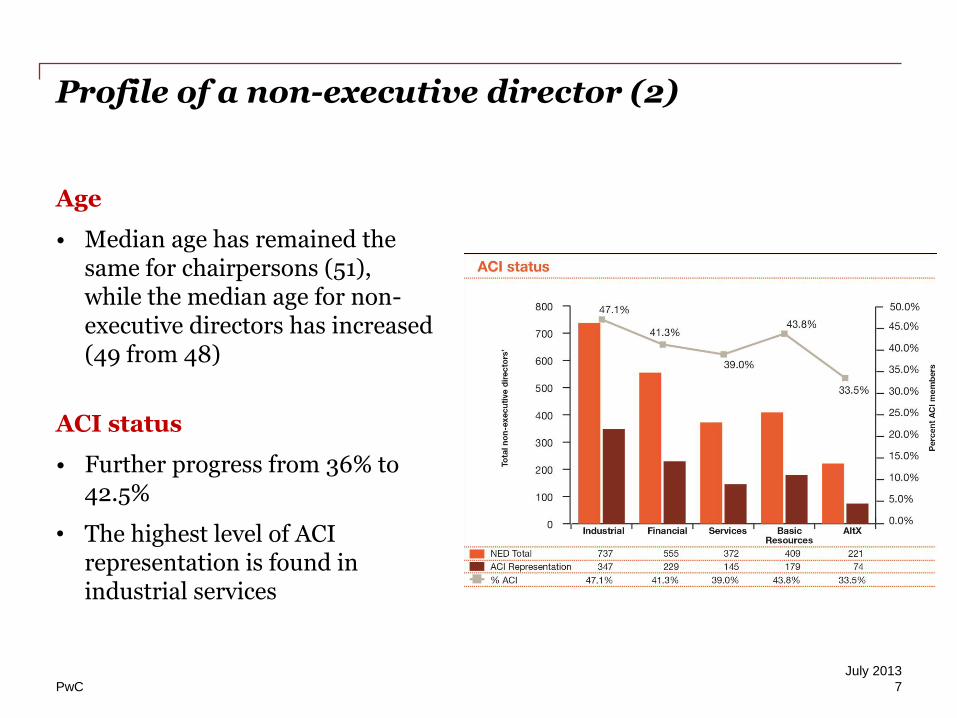
Age
• Median age has remained the same for chairpersons (51), while the median age for non-executive directors has increased (49 from 48)
ACI status
• Further progress from 36% to 42.5%
• The highest level of ACI representation is found in industrial services
7
July 2013
PwC
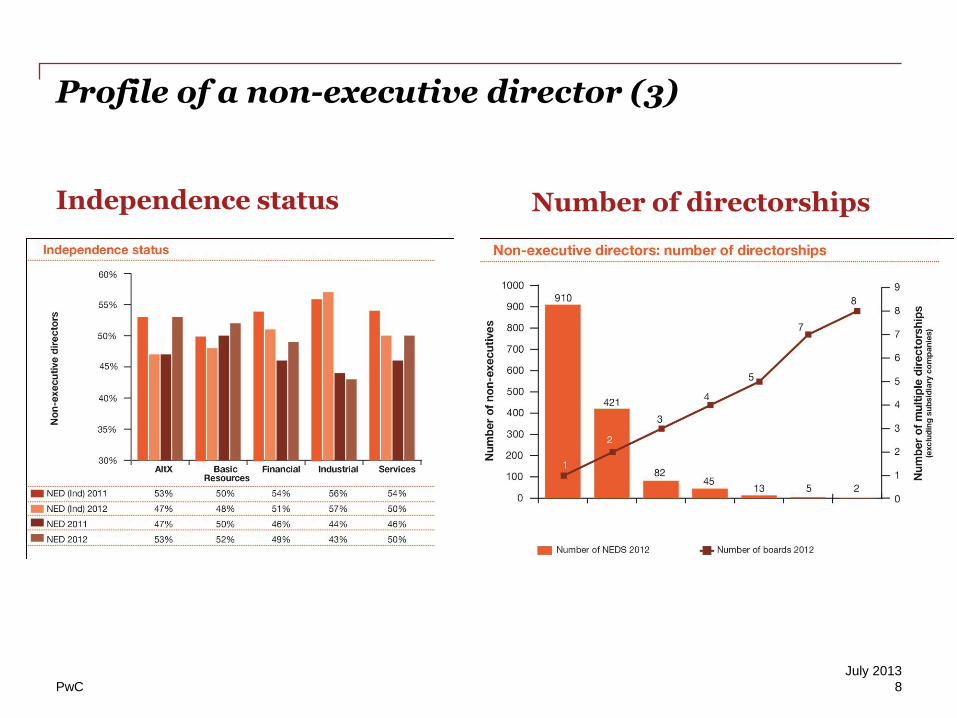
Profile of a non-executive director (3)
Independence status
8
Number of directorships
July 2013
PwC
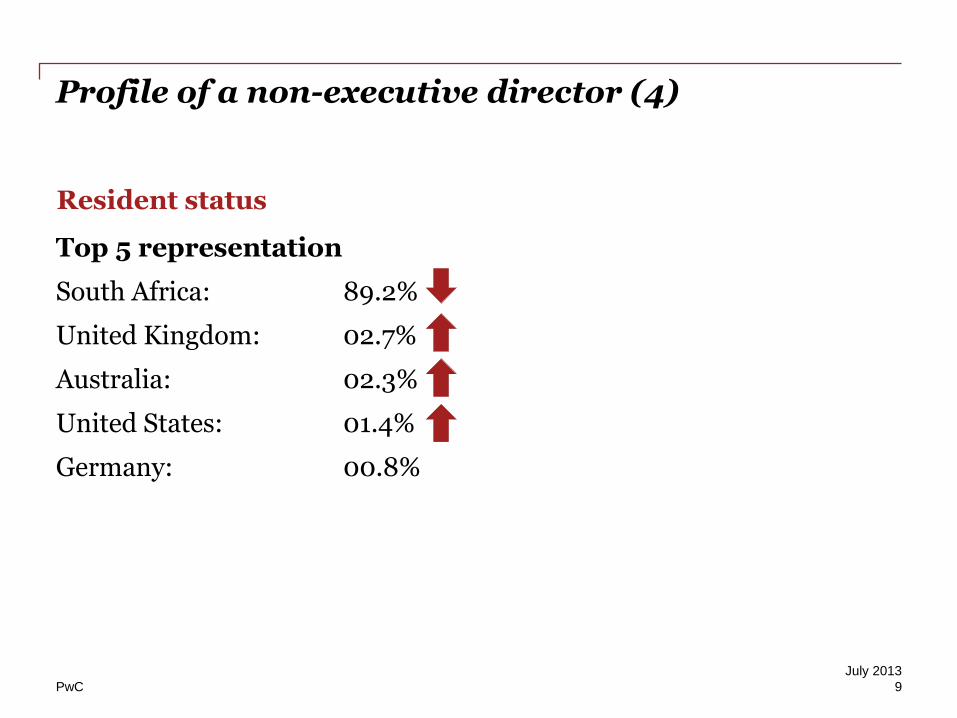
Profile of a non-executive director (4)
Resident status
9
Top 5 representation
South Africa: 89.2%
United Kingdom: 02.7%
Australia: 02.3%
United States: 01.4%
Germany: 00.8%
July 2013
PwC
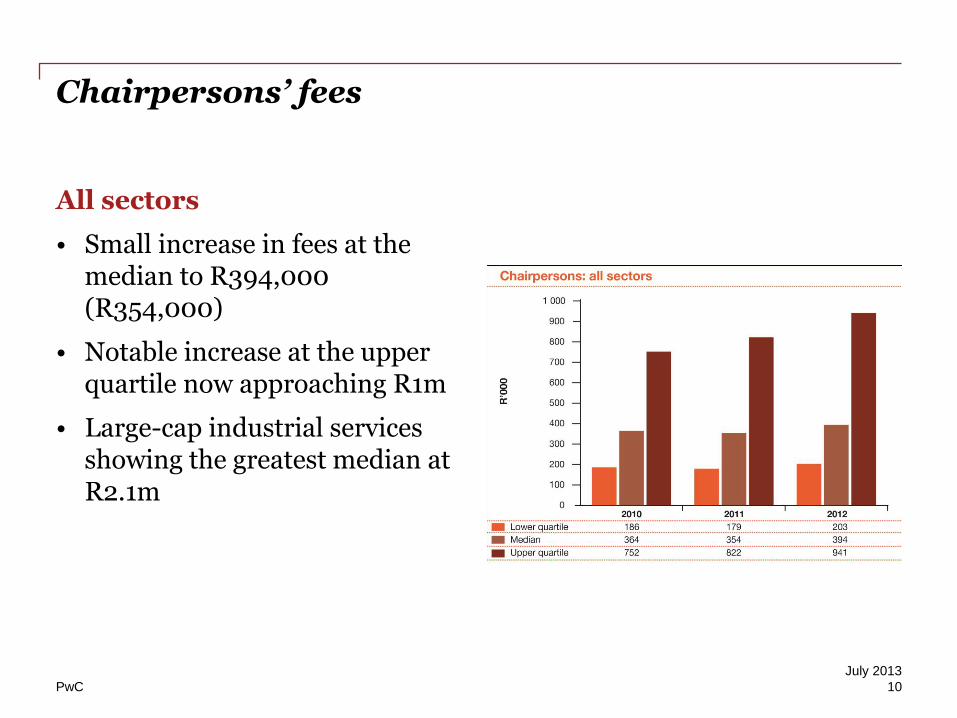
Chairpersons’ fees
All sectors
• Small increase in fees at the median to R394,000 (R354,000)
• Notable increase at the upper quartile now approaching R1m
• Large-cap industrial services showing the greatest median at R2.1m
10
July 2013
PwC
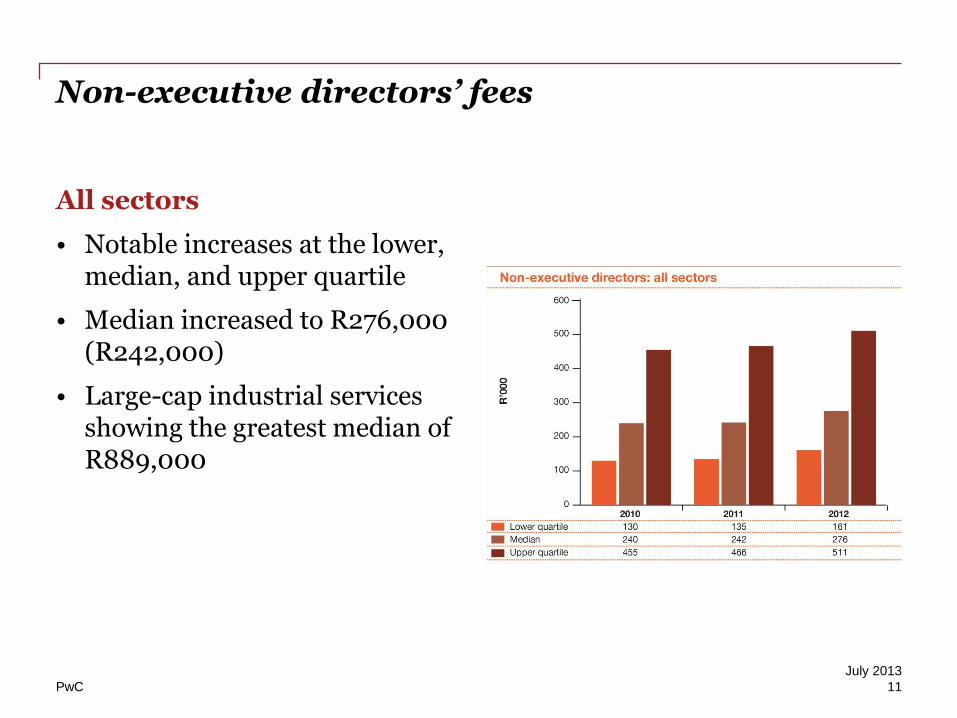
Non-executive directors’ fees
All sectors
• Notable increases at the lower, median, and upper quartile
• Median increased to R276,000 (R242,000)
• Large-cap industrial services showing the greatest median of R889,000
11
July 2013
PwC
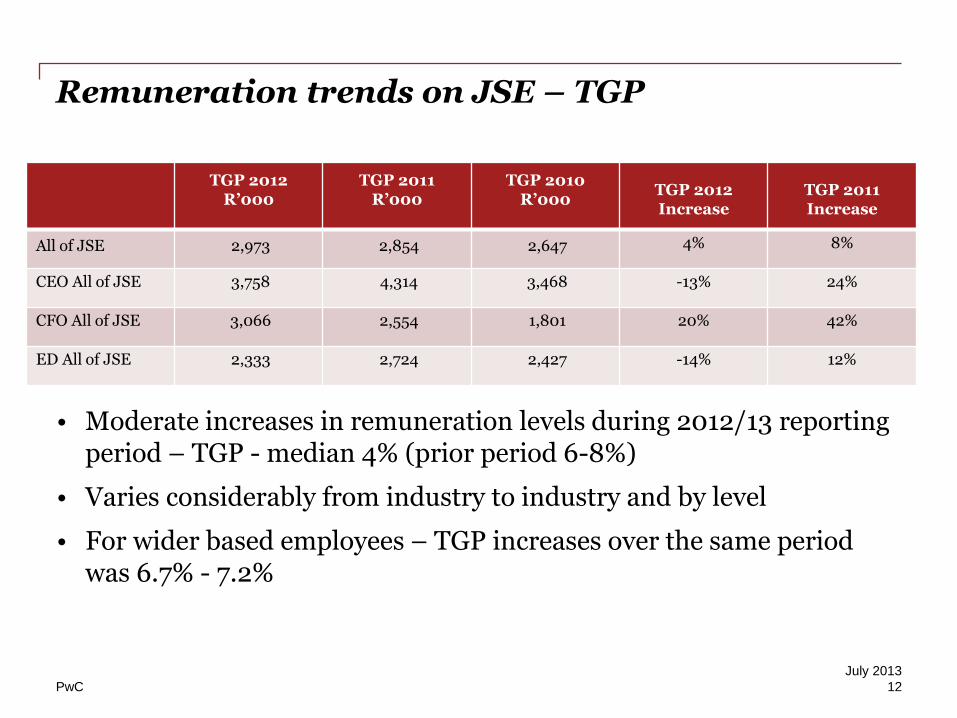
Remuneration trends on JSE – TGP
July 2013
TGP 2012 R’000
TGP 2011 R’000
TGP 2010 R’000
TGP 2012 Increase
TGP 2011 Increase
All of JSE 2,973 2,854 2,647 4% 8%
CEO All of JSE 3,758 4,314 3,468 -13% 24%
CFO All of JSE 3,066 2,554 1,801 20% 42%
ED All of JSE 2,333 2,724 2,427 -14% 12%
• Moderate increases in remuneration levels during 2012/13 reporting period – TGP - median 4% (prior period 6-8%)
• Varies considerably from industry to industry and by level
• For wider based employees – TGP increases over the same period was 6.7% - 7.2%
12
PwC
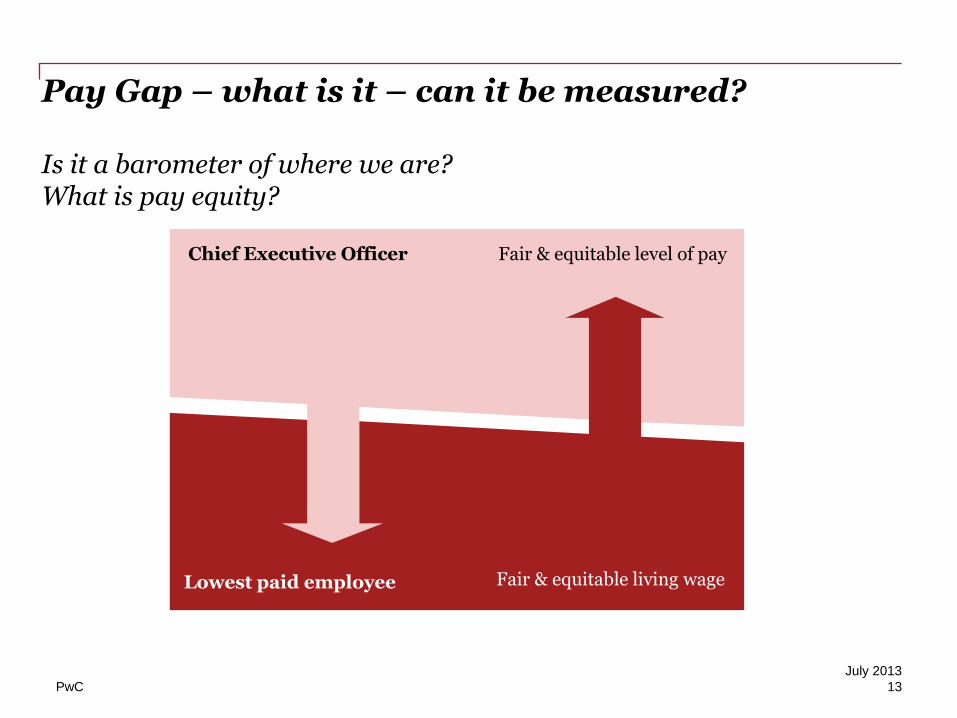
Pay Gap – what is it – can it be measured? Is it a barometer of where we are? What is pay equity?
Lowest paid employee
Chief Executive Officer Fair & equitable level of pay
Fair & equitable living wage
July 2013
13
PwC
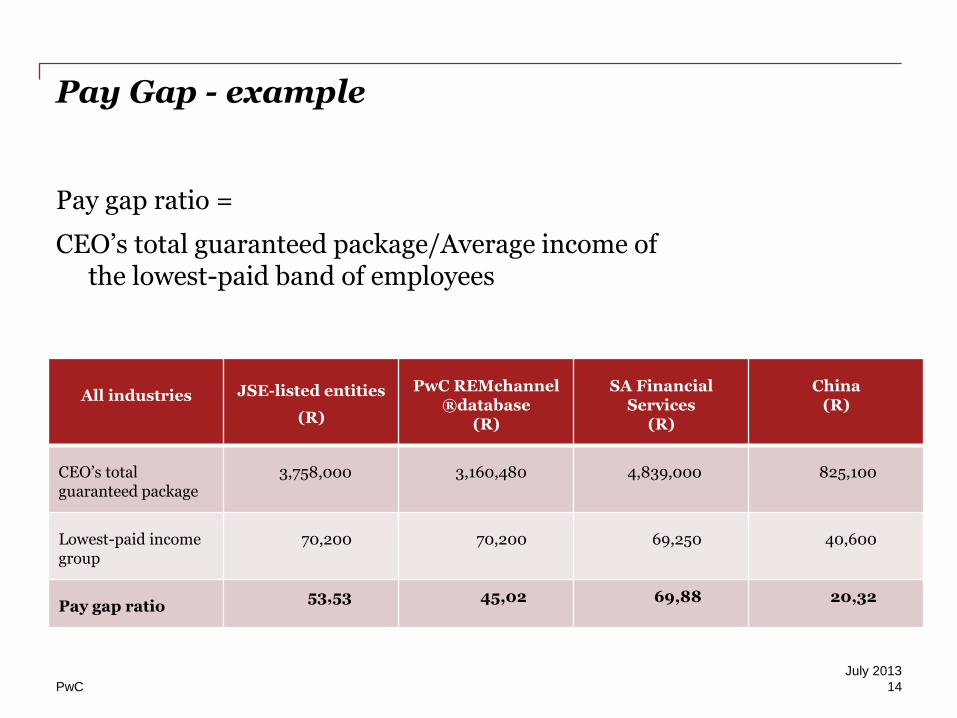
Pay Gap - example
Pay gap ratio =
CEO’s total guaranteed package/Average income of the lowest-paid band of employees
July 2013
All industries
JSE-listed entities
(R)
PwC REMchannel
®database (R)
SA Financial
Services (R)
China (R)
CEO’s total guaranteed package
3,758,000 3,160,480 4,839,000 825,100
Lowest-paid income group
70,200 70,200 69,250 40,600
Pay gap ratio
53,53 45,02 69,88 20,32
14
PwC
Pay Gap - stakeholders
• Who is responsible?
- Boards
- Shareholders
- Trade Unions
- Economists
• Why is it important?
- Internal equity?
- External perceptions?
• Remedial considerations?
July 2013
15
PwC
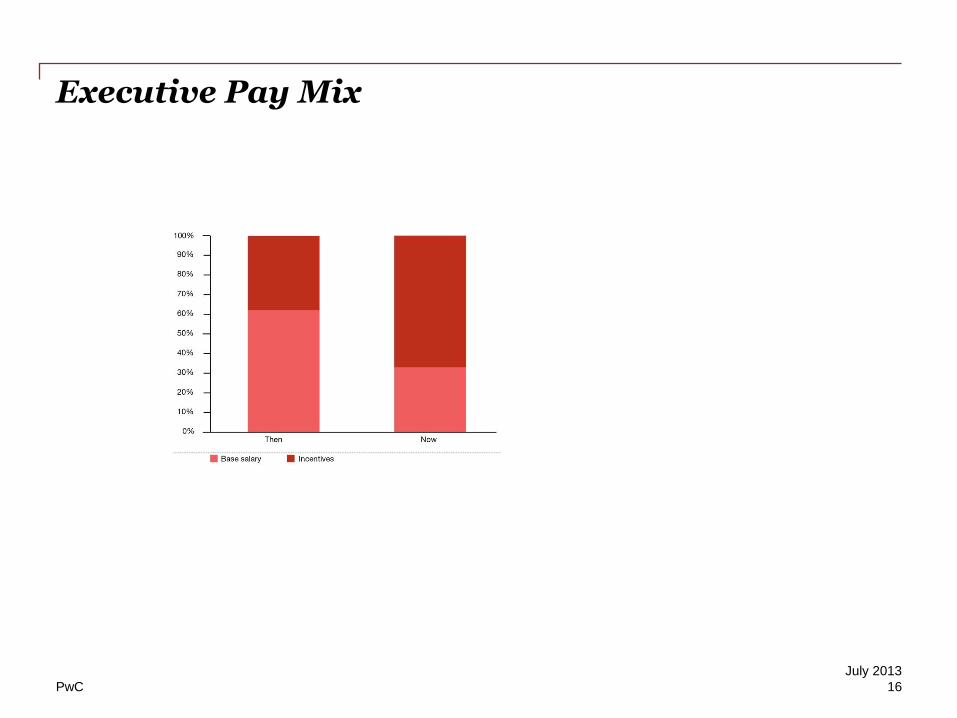
Executive Pay Mix
July 2013
16
PwC
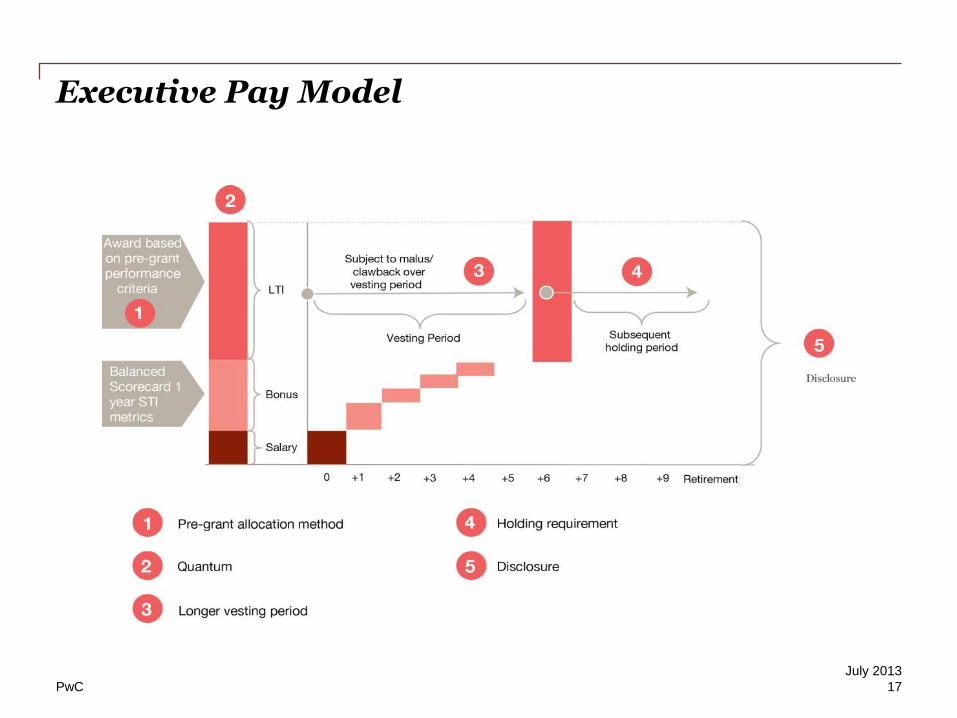
Executive Pay Model
July 2013
17
PwC
Governance update – Remuneration Report
18
July 2013
“Two-part” remuneration report as proposed by BIS
• Forward looking policy
− Binding shareholder vote
• Historic remuneration outcomes
− Advisory shareholder vote
PwC
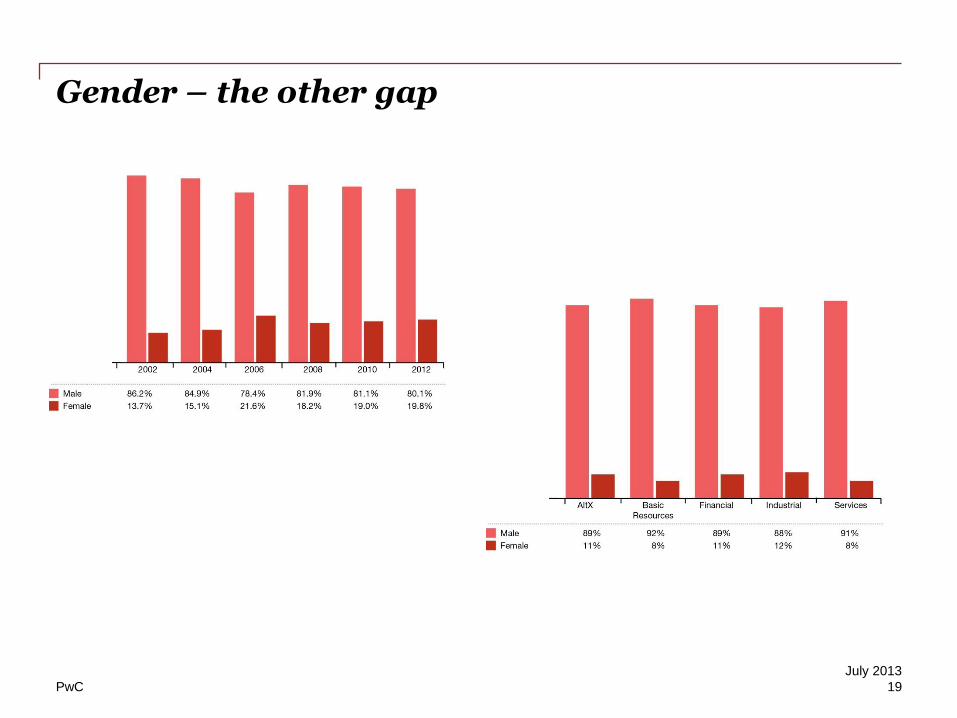
Gender – the other gap
July 2013
19
PwC
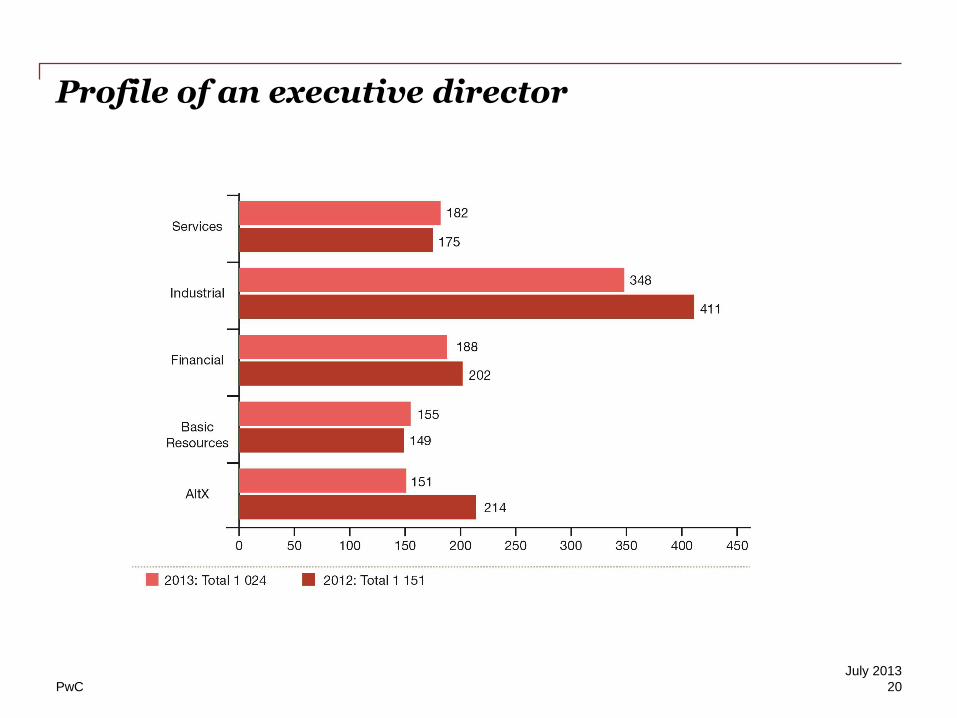
Profile of an executive director
July 2013
20
PwC
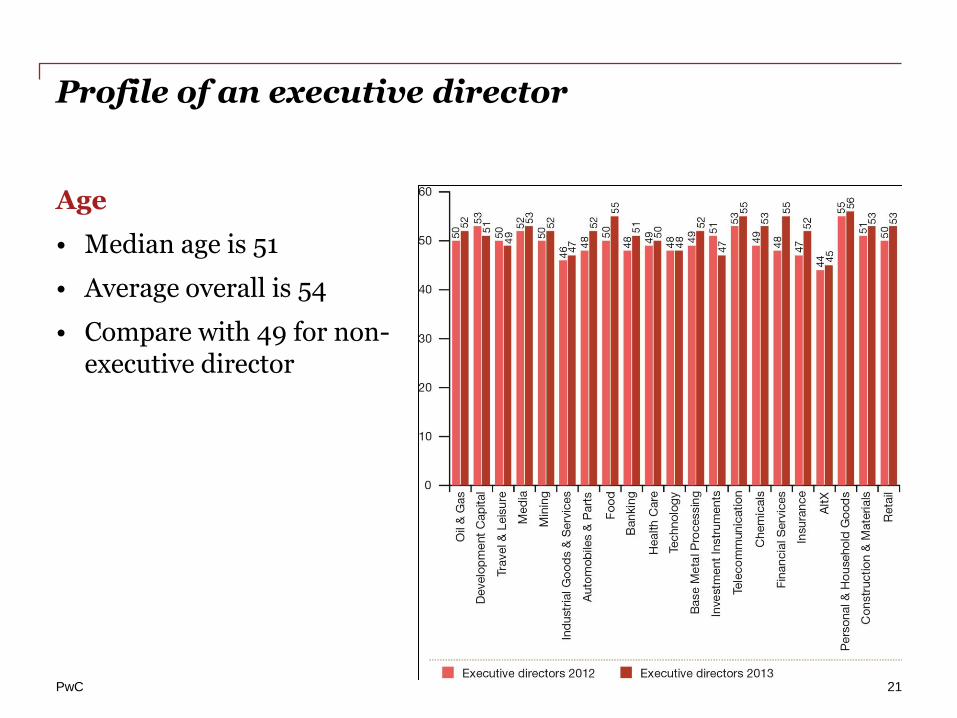
Profile of an executive director
Age
• Median age is 51
• Average overall is 54
• Compare with 49 for non-executive director
July 2013
21
PwC
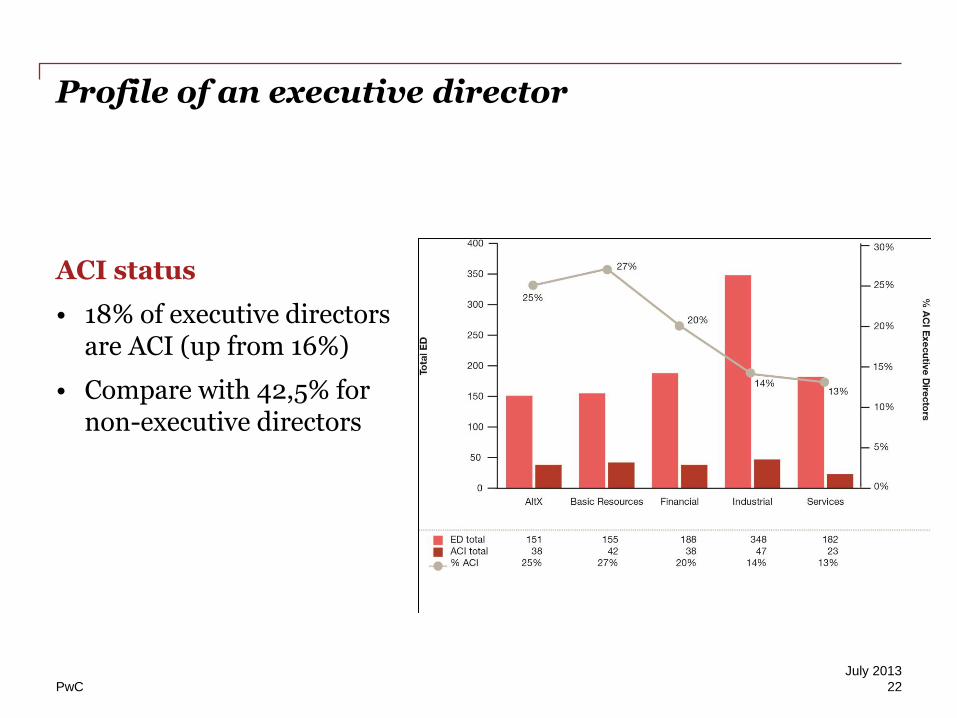
Profile of an executive director
ACI status
• 18% of executive directors are ACI (up from 16%)
• Compare with 42,5% for non-executive directors
July 2013
22
PwC
In closing.....
• Executive remuneration levels are showing some restraint
• Regulatory changes and economic conditions continue to raise challenges
• More change is still to come :
- Increased focus on corporate performance dictating remuneration
- Remuneration disclosure is improving but is to be more meaningful
- Shareholder activism is growing
July 2013
23
Questions?
This publication has been prepared for general guidance on matters of interest only, and does
not constitute professional advice. You should not act upon the information contained in this
publication without obtaining specific professional advice. No representation or warranty
(express or implied) is given as to the accuracy or completeness of the information contained
in this publication, and, to the extent permitted by law, PricewaterhouseCoopers Tax Services
(Pty) Limited its members, employees and agents do not accept or assume any liability,
responsibility or duty of care for any consequences of you or anyone else acting, or refraining
to act, in reliance on the information contained in this publication or for any decision based on
it.
© 2013 PricewaterhouseCoopers (“PwC”). All rights reserved. In this document, “PwC” refers
to PricewaterhouseCoopers Tax Services (Pty) Limited which is a member firm of
PricewaterhouseCoopers International Limited, each member firm of which is a separate legal
entity.
Gerald Seegers: +27 11 797 4560 [email protected]