Executive directors Practices and remuneration trends … · Executive directors: Practices and...
81
Executive directors Practices and remuneration trends report 8th edition, July 2016, South Africa www.pwc.co.za
Transcript of Executive directors Practices and remuneration trends … · Executive directors: Practices and...

Executive directorsPractices and remuneration trends report
8th edition, July 2016, South Africa
www.pwc.co.za

8th edition: July 2016 Executive directors: Practices and remuneration trends report
Contents
1. Executive summary 1
2. Sources of information 2
3. Global regulatory update 4
4. Remuneration practices under King IV™ 8
5. Say on pay: A global perspective 15
6. A new perspective on performance: Measuring impact in the age of sustainability 19
7. Executive remuneration versus investor return: another gap? 25
8. Contrasting views: CEOs versus investors 29
9. CEO succession: Insider or outsider? 32
10 The economics and ethics of pay 34
11. Profileofanexecutivedirector 36
12. The power of parity – gender equality 39
13. Executive directors’ total guaranteed package: JSE trends 43
14. FTSE-100 executive director remuneration trends 64
15. Remuneration trends in other African countries 71
16. Appendices 76
R

18th edition: July 2016 Executive directors: Practices and remuneration trends report
We continue our analysis of seven African stock exchanges and observe some interesting trends around executive remuneration across the continent. For the first time, this year we extend our analysis to the UK and observe trends among FTSE 100 companies.
In PwC’s 19th Annual Global CEO Survey, released in January this year, more than 1 400 business leaders in 83 countries shared their views on a range of issues impacting their organisations. They are feeling the pressure to address wider stakeholder needs and we get a sense of how they are thinking about sustainability issues and are starting to incorporate them into their businesses. Our analysis touches on some of these findings as we look for the necessary link between these strategic issues and executives’ remuneration.
Gerald Seegers Director
1. Executive summary
There is little evidence that listed executive remuneration is out of line either locally or globally. Better disclosure on variable pay is still required and remuneration committees should pay attention to this so as to enable the investor community to assess the toughness of the targets set.Our research on key trends in executive remuneration continues. Pay equity continues to be on the agenda, and we examine it further this year and introduce some deeper debate around living wage versus minimum wage. The focus on executive remuneration is coming from all angles, including regulators, and from a position of what many would argue is simply moral best practice.
The importance of pay-for-performance is recognised by CEOs and is high on their agenda. Remuneration policies are constantly being revisited as organisations and their remuneration
committees strive to strike a balance between executive remuneration and stakeholder satisfaction. In this edition, we continue our discussion of the importance of aligning an organisation’s purpose with executive remuneration, which we first initiated in our 2014 report.
At our cut-off date of 29 April 2016 there were 360 active JSE-listed companies with a combined market capitalisation of R14.7 trillion. Industrials lead the pack with 52.1% of the total, followed by services (18.9%), financial services (16.9%), basic resources (11.7%), AltX (0.2%) and preference shares (0.2%).
It is interesting to note that only 30 companies account for 80% of total market capitalisation on the JSE. Large-caps hold 85%, medium-caps 11% and small-caps 4%. The top 100 companies, comprising large- and medium-caps, account for 96% of the total JSE-listed invested capital.
It gives us great pleasure to share the eighth edition of our Executive directors – Practices and remuneration trends report: South Africa with all our clients and board members. Good news about executive remuneration does not tend to attract headlines, but the regulatory framework appears to be working, particularly within the financial services industry.

28th edition: July 2016 Executive directors: Practices and remuneration trends report
2. Sources of information
The data used in this publication has been drawn from information publicly available for the 12-month reporting period ended 29 April 2016.Information was extracted from the annual reports of 360 (2015: 355) actively trading companies listed on the Johannesburg Securities Exchange (JSE), which had a total market capitalisation of R14.7 trillion rand (2015: R11.9 trillion).
As at our cut-off date of 29 April 2016 an analysis of the market capitalisation reflects the following:
Figure 2.1 Market capitalisation by sector (R’million)
We have excluded the directors of those companies that have either delisted or were suspended during the reporting period. Residual market capitalisation
52.1%
18.9%
16.9%
11.7%
0.2%
0.2%
IndustrialServicesFinancial
Basic ResourcesAltXPreference shares
These quartiles/percentiles are defined as:
• Lower quartile (25th percentile) 75% of the sample earn more than this level and 25% earn less;
• Median (50th percentile) 50% of the sample earn more than this level and 50% of the sample earn less; and
• Upper quartile (75th percentile) 25% of the sample earn more than this level and 75% earn less.
Since the introduction of this annual publication in June 2009, we have held that there is no direct correlation between market capitalisation and the remuneration of executive directors. However, we believe that market capitalisation gives a good indication of size and complexity and is an appropriate metric to set peer groups and for benchmarking purposes. It is against this backdrop that data is analysed.
for these companies is also excluded. To avoid double accounting, we have excluded directors on boards with only preferential shares.
It is noteworthy that only 30 (2015: 36) companies account for 80% of the market’s capitalisation. Large-caps hold 85% (2015: 82%), medium-caps 11% (2015: 13%) and small-caps 4% (2015: 5%).
The top 100 companies comprising large- and medium-caps account for 96% (2015: 95%) of the total JSE-listed invested capital.
Format of information and definitions
Remuneration levels rarely follow a normal distribution curve – rather, these levels tend to fluctuate. For this reason, we have used a quartile/percentile range rather than giving averages and standard deviations that assume normality.

38th edition: July 2016
2. Sources of information
Executive directors: Practices and remuneration trends report
The market capitalisation breakpoints are:
• Large-cap: the top 40 JSE-listed companies;
• Medium-cap: 41 to 100 of the JSE-listed companies; and
• Small-cap: 101 to 360 of the JSE-listed companies.
As the box and whisker chart in figure 2.2 show, outliers are excluded in both maximum and minimum values.
Figure 2.2 Percentile classifications used in this report
Maximum Greatest value,excluding outliers
Upper quartile 25% ofdata is greater than this value
Median 50% of data is greaterthan this value: middle ofdataset
Lower quartile 25% of datais less than this value
Minimum Least value,excluding outliers
Outlier Less than 1/5times the lower quartile
Outlier More than 1/5times the upper quartile
Terms used in this publication
• Total guaranteed package (TGP) – refers to all components of remuneration that are guaranteed, including base salary and benefits that typically accrue on a monthly basis (retirement, medical, travel allowance, etc.).
• Short-term incentive (STI) – refers to all cash-based payments that are paid to an individual based on company and individual performance for a 12-month period. STI differs from target STI, which is reflective of the company’s policy regarding potential STI earnings.
• Long-term incentive (LTI) – refers to all cash and equity-based awards that accrue to an individual based on company performance over a period longer than 12 months.
• Variable pay – refers to short-term incentives and long-term incentives.
• Share gain – gains earned on LTI.
Johannesburg securities exchange
• The JSE is the largest stock exchange in Africa.
• The number of companies listed at 29 April for the last ten years are reflected in figure 2.3.
Figure 2.3 Number of companies listed on the JSE, 2006-2015
2006 2007 2008 2009 2010 2011 2012 2013 2014 2015
411 411396
383360354 355358
373389

48th edition: July 2016 Executive directors: Practices and remuneration trends report
3. Global regulatory update
Levels of executive remuneration have been facing unprecedented criticism across the globe. Many analysts and journalists have attempted to identify the underlying causes of increases in executive remuneration. Explanations have ranged from the failure to link pay to performance, to companies over-emphasising the need to retain executives. When it comes to incentive packages, various figures of the estimated value of share-based pay have been published in the media. Different institutions have different ways of calculating the fair value of share awards, which ultimately leads to confusion as to the true value of executive pay packages.
Many institutional investors have taken it upon themselves to vote down executive pay packages that are perceived as excessive, especially when the company’s financial performance has been lacklustre. This is a departure from the tradition of investors concentrating on the bottom-line and placing less emphasis on good corporate governance.
Governments are also taking an increasingly interventionist stance on executive pay, with many jurisdictions prescribing the policies and contracts that companies must enter into with their executives. Most recently, some countries have focused on risk alignment – for example, both the United States and the United Kingdom have proposed regulations compelling companies to adopt malus and clawback as risk adjustments of executive pay. This chapter looks at examples of regulations and corporate governance codes in major jurisdictions across the globe – and South African companies that wish to expand into these jurisdictions often have to adjust their remuneration policies in order to comply.
The SEC has chosen not to define the materiality of an error, because materiality would depend on the context of particular facts and circumstances.3 The draft regulation covers excess incentive-based compensation that was received three years before the date on which the company determines that a financial restatement is required.
3 Listing Standards for Recovery of Erroneously Awarded Compensation (supra) at 25.
Executive pay across the globe
United States
Recovery of erroneously awarded compensation
The United States Securities and Exchange Commission (SEC) has issued draft regulations regarding the recovery of erroneously awarded compensation.1
This will apply to all listed companies, no matter what size, that award incentives to employees.2 Companies must adopt and comply with a policy that provides that if the company is required to prepare a restatement to correct a material error in previously issued financial statements, the company must recover erroneously paid compensation.
1 US SEC, Listing Standards for Recovery of Erroneously Awarded Compensation, available at https://www.sec.gov/rules/proposed/2015/33-9861.pdf (accessed on 07 July 2015).
2 Listing Standards for Recovery of Erroneously Awarded Compensation (supra) at 12; 20.

58th edition: July 2016
3. Global regulatory update
Executive directors: Practices and remuneration trends report
Incentives can be recovered from current or former executive officers of the company who served as executive officers at any time during the performance period of the incentive-based compensation.4
This will also apply to officers who play an important role in financial reporting. The proposed rule would also include awards granted to new hires, as long as they were executive officers during the recovery period.
The definition of ‘incentive-based compensation’ will include “any compensation that is granted, earned or vested based wholly or in part upon the attainment of any financial reporting measure.”5
This means that if the employment period is longer than the performance period, the award will be deemed to have been received when the performance period ends (even though the employment period has not yet ended).6
4 Listing Standard for Recovery of Erroneously Awarded Compensation (supra) at 32. Executive officers include a company’s president, principal financial officer, principal accounting officer, any vice president in charge of a business unit, or any other officer who performs a policy-making function for the company.
5 Listing Standards for Recovery of Erroneously Awarded Compensation (supra) at 41.
6 Listing Standards for Recovery of Erroneously Awarded Compensation (supra) at 54.
The proposed definition of ‘financial reporting measures’ will be wide enough to take into account the development of new performance measures, and will include measures that are determined and presented in accordance with the accounting principles used in preparing the company’s financial statements, any measures derived wholly or in part from such financial information, and stock price and total shareholder return.
Incentives that are based on non-financial measures, e.g. restructuring or financing transactions, or completing a merger or acquisition, will not be subject to recovery.
The proposed rules do not appear to be punitive in nature, and the trigger events do not appear to require fault from an executive. The compensation subject to recovery will also include equities and bonuses paid from a bonus pool (the size of which depends on satisfying a financial reporting measure performance goal).
Salaries, as well as bonuses that are not paid from a performance-based bonus pool, and bonuses, non-equity incentive plan awards and equity awards which are not based on financial reporting performance measures will not be subject to recovery.
The amount that the company will have to recover is the amount of incentive-based compensation received by the executive officer or former executive officer that exceeds the amount of incentive-based compensation that he or she would otherwise have received had it been determined based on the accounting restatement.7
The recoverable amount will be calculated on a pre-tax basis.8 The company has the discretion not to pursue recovery in countries where it is not allowed, or it would be impractical to do so, but the exercise of this discretion must be appropriately justified.9
Incentive-based compensation arrangements
The SEC has issued draft regulations regarding incentive-based payments.10 The proposed regulation applies to financial institutions that have USD1 billion or more in assets.11 The regulation
7 Listing Standards for Recovery of Erroneously Awarded Compensation (supra) at 60.
8 Listing Standards for Recovery of Erroneously Awarded Compensation (supra) at 61.
9 Listing Standards for Recovery of Erroneously Awarded Compensation (supra) at 70.
10 US SEC, Incentive-based Compensation Arrangements, available at https://www.sec.gov/rules/proposed/2016/34-77776.pdf (accessed on 11 May 2016).
11 Incentive-based Compensation Arrangements (supra) at 16.
states that aligning the interests of shareholders and other stakeholders with those of employees may not always be sufficient to protect the safety and soundness of an institution – for the sake of the broader economy and in the public interest, inappropriate risk-taking encouraged by incentive-based compensation arrangements should also be addressed.12
To do so, the proposed rule will prohibit incentive-based compensation at listed institutions that could encourage inappropriate risks by providing excessive compensation, or that could lead to a material financial loss.13
Incentive-based compensation must balance risk and reward by:
• Including financial and non-financial measures of performance;
• Being designed to allow non-financial measures of performance to override financial measures of performance, when appropriate; and
• Being subject to adjustment to reflect actual losses, inappropriate risks taken, compliance deficiencies, or other measures or aspects of financial and non-financial performance.
12 Incentive-based Compensation Arrangements (supra) at 21-22.
13 Incentive-based Compensation Arrangements (supra) at 36.
68th edition: July 2016
3. Global regulatory update
Executive directors: Practices and remuneration trends report
Listed financial institutions would also be required to create annual records, to be retained for at least seven years, that set out the structure of incentive-based compensation arrangements and that demonstrate compliance with the proposed rule.
For larger institutions subject to the regulations, incentive-based compensation arrangements for certain persons will have to include the deferral of payments, risk of downward adjustment and forfeiture, and clawback to appropriately balance risk and reward.
The concepts of senior executive officers and significant risk-takers are also used in relation to the deferral of long-term incentives. For larger institutions, the deferral percentages range from 60% for senior executive officers’ incentive-based compensation to 50% for significant risk-takers for a period of at least four years. Accelerated vesting of deferred incentive-based compensation would only be allowed for death or disability. Pre-vesting forfeiture would become compulsory.
The conditions of forfeiture would include the following trigger events:
• Poor financial performance attributable to a significant deviation from the institution’s risk parameters;
• Inappropriate risk-taking, irrespective of the effect on financial performance;
• Material risk management or control failures;
• Non-compliance with regulatory rules resulting in enforcement or legal action from a regulator, or a requirement that the institution report a restatement of a financial statement to correct a material failure; and
• Other aspects of conduct or poor performance as defined by the institution.
Clawback would also be compulsory for incentive-based compensation arrangements for senior executive officers and significant risk-takers in larger institutions. Clawback would operate for at least seven years post-vesting, if there was:
• Misconduct that resulted in significant financial or reputational harm to the institution;
• Fraud; or
• Intentional misrepresentation of information used to determine the senior executive officer or significant risk-taker’s incentive-based compensation.
Larger institutions would also be prohibited from hedging; maximum incentive-based compensation opportunity (also referred to as leverage); relative performance measures; and volume-driven incentive-based compensation.
These institutions would also be required to, inter alia, implement a risk management framework for their incentive-based compensation programmes that is independent of any lines of business. Persons engaged in control functions would have to be compensated independently of the business areas they monitor and the institutions would also need the necessary policies in place to implement the risk controls.
78th edition: July 2016
3. Global regulatory update
Executive directors: Practices and remuneration trends report
United KingdomThere have been multiple reports of shareholder activism amongst large listed UK companies, with institutional investors reportedly leading the charge.14 Some commentators suggest that the increasing ownership of UK companies by US investors is influencing the trajectory of executive pay.15
The increasing influence of shareholder advisory groups, particularly over UK-held firms, has also been cited as a reason – investors are no longer relying on their own judgment when deciding whether to support a company’s remuneration policy or not. Companies have also begun engaging with shareholders more proactively regarding their remuneration policies.
14 Marcus, Lucy P. “Why the revolt against executive pay is not going away”. The Guardian, available at https://www.theguardian.com/business/2016/may/22/why-the-revolt-against-executive-pay-is-not-going-away (accessed on 03 June 2016).
15 Oakley, D. “UK plc and the Americanisation of executive pay”. FT.com, available at http://www.ft.com/intl/cms/s/0/5741f6c4-1c43-11e6-a7bc-ee846770ec15.html#axzz4AQN22roe (accessed on 03 June 2016).
UK Prudential Regulation Authority – buy-outs of variable remuneration
The UK Prudential Regulation Authority (PRA) released a consultation paper in January 2016 regarding the regulation of buy-outs of variable remuneration for banks.16 It follows on from the PRA and Financial Conduct Authority’s Policy Statement 12/15 ‘Strengthening the alignment of risk and reward: new remuneration rules’.
This rule relates to the practice whereby firms recruiting staff buy out the deferred bonus awards that were cancelled by their previous employer. The proposed rule aims to align risk and reward, and discourage short-term horizons.
The PRA is of the view that the practice of buyouts undermines the effectiveness of malus and clawback, as it insulates incoming executives from the ex-post risk adjustments of the awards made by their previous employers.
The proposed regulation will apply to all material risk-takers at PRA-regulated banks and financial institutions. A contract would be concluded between
16 Bank of England Prudential Regulation Authority. “Buy-outs of variable remuneration Consultation Paper CP2/16”. January 2016, available at http://www.bankofengland.co.uk/pra/Documents/publications/cp/2016/cp216.pdf (accessed on 03 June 2016).
the new employer and employee, which would provide for the possibility of malus and clawback to be applied on the basis of a determination made by the previous employer.
This would involve the previous employer notifying the new employer of the determination (i.e. that malus or clawback trigger events have occurred), and that a certain amount should be recovered from the employee’s deferred variable remuneration by way of malus or clawback.
The previous employer can use misconduct or failures of risk management as trigger mechanisms, but it cannot include a material downturn in its financial performance as a trigger mechanism.
Previous employers must, however, act fairly and reasonably in making the determination to apply for malus or clawback regarding their former employee. New employers, however, can waive the malus or clawback where they have reason to believe that a previous employer’s decision to apply malus or clawback is manifestly unfair or unreasonable.
Conclusion
Governments in major jurisdictions have attempted to regulate executive pay, with an emphasis being placed on remuneration paid to executives in financial institutions. Some jurisdictions have prescribed the policies that companies must adopt. Others have placed an emphasis on empowering shareholders by giving them the tools to vote down executive pay.
It remains to be seen how effective these regulations will be, and whether companies will attempt to circumvent them in practice. However, the increase in awareness among investors and the broader public about the mechanics behind executive pay is a positive development.

88th edition: July 2016 Executive directors: Practices and remuneration trends report
4. Remuneration practices under King IV™
Will King IV™ make a difference to remuneration practices applicable under King III?
“Fair and responsible remuneration is now seen as a corporate citizenship matter, to be overseen by the social and ethics committee in collaboration with the remuneration committee.” Draft King IV™
In considering whether King IV™ will achieve its aims in terms of remuneration, two standpoints must be considered:
• Firstly, the stated aim of draft King IV™, in terms of remuneration practices, which is to “foster enhanced accountability on remuneration”, while the remuneration disclosure requirements “set out to achieve a disclosure benchmark that enables a comparative analysis to be done among companies, organisations or entities within the same peer group”.
• Secondly, a wider viewpoint should be considered as to whether draft King IV™ captures international ‘best practice’ in terms of remuneration. Draft King IV™ has always aimed to be at the forefront of international leading best practice. This leads to the question of how best practice has evolved since the introduction of King III in 2009, insofar as remuneration is concerned.
The practices so identified could be considered to be ‘best remuneration practice’.
What is best practice? Investopedia suggests that “best practices are a set of guidelines, ethics or ideas that represent the most efficient or prudent course of action.” Another definition suggests that best practice is a “method or technique that has consistently shown results superior to those achieved with other means, and that is used as a benchmark.”17
To qualify as best practice, a course of action should result in the best possible outcome. For us to establish what best practice in terms of remuneration practices is, we should:
• Ascertain what the best possible outcomes are; and
• Consider which practices consistently and most reliably produce these outcomes.
17 http://www.businessdictionary.com/definition/best-practice.html

98th edition: July 2016
4. Remuneration practices under King IV™
Executive directors: Practices and remuneration trends report
The role of stakeholders
The difficulty with something as emotive as remuneration is that different stakeholders consider different outcomes to be desirable. Often, what is considered a best possible outcome for one group of stakeholders is not considered to be an acceptable outcome for others.
Thus, the best possible outcome of remuneration practices must be an outcome which is akin to a ‘fair compromise’ – meaning that ultimately, a balance must be struck between the desires of all interested stakeholders.
Who are the different stakeholders then, and what are their desired outcomes insofar as executive remuneration is concerned?
• Executive directors: Responsible for the day-to-day management of the company and executing the strategy put in place by the board, with a view to creating long-term value for the shareholders of the company, the executive directors wish to receive appropriate remuneration that takes into account the extensive responsibilities and onerous duties they undertake.
• Employees: Responsible for the execution of specific tasks, under the ultimate leadership of the executives, employees wish to receive appropriate remuneration for their level of responsibility, and expect a certain level of internal equity between their own remuneration and that of executive directors. Employees expect business to make an investment in them, and expect their own career development and remuneration goals to be realised when these are in place. The gap between the top-level employees (executive directors) and other employees is narrowed, and executive pay becomes less of a concern for employees.
• Shareholders/Institutional investors: As the owners of the company, shareholders wish to see their value increased. The desired outcomes for shareholders in terms of executive pay are largely captured by the ‘pay-for-performance’ movement – shareholders are only happy for executives to be paid incentives when satisfactory levels of corporate performance, linked to an increase in shareholder value, are considered to have been achieved.
• Wider stakeholders (customers, society and government): As the clients of the companies which employ the executives, and as contributors to the economy in which the companies participate, the public expect a level of moderation to executive pay, and wish to see that executive remuneration is fair and not excessive. With the changing view of the role of business, there is a growing expectation that businesses should shift their strategies to incorporate wider goals that relate to economic, social and environmental business objectives. The view of the public becomes particularly relevant in economies where there are higher levels of income disparity.
• Remuneration committees: As the subcommittee of the board governing executive pay and protecting shareholder interests by balancing executive remuneration expectations with performance requirements, remuneration committees have a responsibility to seek to ensure that executive pay practices are fair and responsible and aligned with best market practice, and result in acceptable outcomes.
Besides pursuing an executive remuneration policy that is fair to all stakeholders, consideration of best outcomes should also consider the shift from simply making shareholders happy to making stakeholders happy.
The old shareholder-centric view of business focused on maximising shareholder profits above all else, placing a far greater emphasis on shareholders’ desired outcomes than any other consideration. The new stakeholder-centric model requires a shift to a business model that incorporates KPIs linked to the concept of the interconnected business, taking into account the larger role that businesses play in society.
In this new model, executive directors, as the agents of business, are successful when their business has performed in relation to these wider KPIs, which take into account more than merely maximising profits at any cost.
It is worth noting that in this new era, the business’ success is good for everyone, and consequently any threat to business growth would be to the detriment of all stakeholders.

108th edition: July 2016
4. Remuneration practices under King IV™
Executive directors: Practices and remuneration trends report
79% of CEOs interviewed in PwC’s 19th Annual Global CEO Survey say they are concerned about regulation.
With 79% of CEOs interviewed in PwC’s 19th Annual Global CEO Survey saying they are concerned about regulation being a threat to business growth, it is in everyone’s interests to ensure that remuneration regulation does not translate into such a threat.18
It is in this context then that we must assess draft King IV™ and consider the potential changes it could introduce. Let us start by considering how draft King IV™ differs from King III in terms of remuneration principles.
Differences in remunerations principles
Governance element King III Draft King IV™
Non-executive director fees
King III stipulates that non-executive fees should comprise a base fee as well as an attendance fee per meeting. (Recommended practice 2.25.4)
Less prescriptive – only indicates that the remuneration policy should address all components of remuneration, including the structuring of the fees of non-executive members of the governing body. (Recommended practice 32.c)
The basis for computation of the fees of non-executive directors of companies must be submitted for a special resolution for approval by shareholders within the two years preceding payment. (Recommended practice 40)
Fair and responsible executive remuneration practices
Companies should remunerate directors and executives fairly and responsibly. (Principle 2.25)
No requirement for involvement of social and ethics committee.
Executive remuneration practices should be fair and responsible in the context of overall employee remuneration. (Recommended practice 31)
The governing body should oversee that the social and ethics committee, if it exists, reviews fair and responsible executive remuneration practices in the context of overall employee remuneration. (Recommended practice 34)
Voting Shareholders should approve the company’s remuneration policy.
Shareholders should pass a non-binding advisory vote on the company’s yearly remuneration policy.
(Principle 2.27)
A resolution for the adoption by shareholders of the remuneration policy by a non-binding advisory vote should be tabled every two years,or whenever a change to the policy is approved by the board, or whenever the policy was not adopted by a vote of at least 75% of the voting shares the year before. (Recommended Practice 41)
In addition, a resolution for the adoption by shareholders of the remuneration implementation report by a non-binding advisory vote should be tabled every year. (Recommended Practice 42)
In the event that either the remuneration policy or the implementation report is not adopted by a vote of at least 75% of the voting shares, the remuneration committee should be proactive in taking steps to address shareholders’ concerns. The remuneration committee should ensure that there is disclosure in the following year on the steps taken, the nature of engagement with shareholders and the outcomes. (Recommended Practice 43)
When evaluating the performance of the remuneration committee, and prior to recommending the re-appointment of directors who are serving on the remuneration committee, the board should take into consideration the results of non-binding advisory votes on the adoption of the remuneration policy or its implementation, as well as the extent and nature of the steps taken to address shareholders’ concerns. (Recommended Practice 44)
18 PwC 19th Annual Global CEO Survey

118th edition: July 2016
4. Remuneration practices under King IV™
Executive directors: Practices and remuneration trends report
Governance element King III Draft King IV™
Structure of the remuneration report
No specific guidance given regarding the structure of the remuneration report.
The governing body should ensure that remuneration is reported on in three parts:
(i) background statement ;
(ii) an overview of the main provisions of the organisation-wide policy on remuneration; and
(iii) an implementation report that contains details of all remuneration and benefits awarded to individual members of the governing body and prescribed officers during the reporting period. (Recommended Practice 36)
Disclosure of remuneration
The remuneration report, included in the integrated report, should include (inter alia):
• All benefits paid to directors (2.26.1);
• All benefits paid to prescribed officers (2.26.2);
• Participation in share incentive schemes (2.26.4); and
• The maximum expected potential dilution as a result of incentive awards (2.26.10).
No specific requirement relating to disclosure of STIs and LTIs.
Remuneration disclosures are more specific, and include, inter alia:
• The total remuneration paid and accrued to each executive member of the governing body and each prescribed officer, including basic salary, benefits, short-term incentives (including those deferred), loss-of-office payments, other allowances and long-term incentives, all reflected at fair value.
• Details of deferred short-term incentives and long-term incentives awarded but not yet paid or vested at the end of the financial year in respect of each executive member of the governing body and prescribed officer.
• Awards realised and paid to each executive member of the governing body and prescribed officer from deferred short-term incentives and long-term incentives.
(Recommended Practice 39 (a) – (c))

128th edition: July 2016
4. Remuneration practices under King IV™
Executive directors: Practices and remuneration trends report
Assessing the potential impact of draft King IV™ changes on best possible outcomes for identified stakeholdersExecutive directorsFor executive directors, as the individuals whose ‘best possible outcomes’ are most at risk of being compromised by increased regulation, draft King IV™ strikes an acceptable balance between the expectation of moderation in executive pay and shareholders’ rights to enforce such moderation.
Increased regulation may lead to unfairness for executives where:
• Shareholder voting rights are increased without the introduction of commensurate requirements for shareholders/institutional investors to obtain a certain level of understanding regarding remuneration practices, in order to be able to:
• Properly assess the company’s policy and avoid tick-box voting;
• Provide reasons for no votes, and engage with companies surrounding regarding these reasons; and
• Remuneration disclosures in comparable companies (both in terms of policy disclosure and disclosure regarding implementation of policy) are not advanced enough to support the increased voting rights, meaning that there is no consistent basis for comparison between companies, and shareholders have the right to vote without necessarily having complete information at their disposal.
In this regard this statement within draft King IV™ should be noted:
The remuneration disclosure requirements [within the draft] set out to achieve a disclosure benchmark that enables a comparative analysis to be done among companies, organisations or entities within the same peer group.
EmployeesFor the employee, King IV™ introduces two new recommended practices:
• Executive remuneration practices should be fair and responsible in the context of overall employee remuneration21; and
• The governing body should oversee that the social and ethics committee, if it exists, reviews fair and responsible executive remuneration practices in the context of overall employee remuneration.22
These new recommended practices introduce the concept of fairness in a more tangible manner – while King III’s approach to executive remuneration was based on the principle of fair and responsible pay23, it lacked a link between this concept and overall employee remuneration.
21 Recommended Practice 31 under Principle 4.422 Recommended Practice 34 under Principle 4.423 Principle 2.25. Companies should remunerate
directors and executives fairly and responsibly
It is also significant that while draft King IV™ does introduce a ‘shareholder responsibilities’ principle19, neither the principle nor recommended practices relating to it make any specific reference to remuneration matters.20
Draft King IV™ does, however, indirectly introduce an increased expectation for shareholders to understand the remuneration policy:
The governing body should oversee that there is regular dialogue with shareholders, to create and maintain a mutual understanding of what performance and value creation means, in order to properly evaluate the remuneration policy. (Recommended Practice 35 under Principle 4.4)
19 See Principle 5.2 “Responsibilities of shareholders”20 See chapter 4 of this report

138th edition: July 2016
4. Remuneration practices under King IV™
Executive directors: Practices and remuneration trends report
In contrast, draft King IV™ notes:
A subtle but important introduction by King IV™ is that the remuneration committee, social and ethics committee and governing body should consider and disclose the measures put in place to attain fair and responsible executive remuneration in the context of overall employee remuneration. This acknowledges the wage gap between remuneration for executives and those at the lower end of the pay scale. [Emphasis added].
While draft King IV™ does not introduce a requirement for the disclosure of the wage gap, as many public commentators have called for, it could be argued that it goes one step further by looking beyond what can be a misleading or unrepresentative figure to the
determination of executive remuneration in the context of wider employee remuneration. It is hoped that this will lead to better outcomes than the introduction of a mere requirement for the disclosure of an organisation’s wage gap.
Shareholders/Institutional investorsAn obvious win for shareholders in draft King IV™ is the introduction of enhanced voting rights. While many expected King IV™ to introduce the binding vote on remuneration policy, following in the footsteps of the UK, draft King IV™ retains the non-binding vote, although it changes it to every two years24, requires a higher voting percentage (75%) and introduces an additional vote – on the implementation of the policy, a 75% vote is also required.
The sanction for not receiving the 75% vote for either the remuneration policy or the implementation report is as follows:
• The remuneration committee should be proactive in taking steps to address shareholders’ concerns;
24 Or whenever a change to the policy is approved by the board, or whenever the policy was not adopted by a vote of at least 75% of the voting shares the year before
• The remuneration committee should ensure that there is disclosure in the following year on the steps taken, the nature of engagement with shareholders and the outcomes [of the engagement]; and
• If a 75% vote is not achieved in a voting year for the remuneration policy, the remuneration policy must be put to the shareholder vote in the next year, regardless of the two-year rule.
One of the main criticisms of draft King IV™ is its failure to introduce the binding vote. However, this should be considered in light of the status of a governance code such as King IV™, as a binding vote may be more appropriately introduced by legislation, which is legally enforceable and which can introduce real sanctions.
To ensure the fair application of a binding vote, the structure of remuneration policies and implementation reports should be standardised. It is hoped that the recommended practices set out in draft King IV™ will mean that South African remuneration reporting reaches this stage within the next few years.
While the introduction of the binding vote would certainly give shareholders more power, it is uncertain whether, at this stage, it would be fair in the context
of the ‘fair compromise’ of best possible outcomes for all stakeholders.
Wider stakeholders (customers, society and government)Draft King IV™ introduces a requirement that the governing body should oversee that the implementation of the remuneration policy results in:
… measuring variable remuneration in relation to sustainable value created across the whole of the economic, social and environmental context, and in accordance with enhancement or diminishment across the capitals that the organisation uses or affects.25
Thus – where variable pay is well designed, KPIs upon which payments are based should include those relevant in this context, meaning that executive remuneration becomes more stakeholder-centric (as opposed to shareholder-centric).
25 Recommended Practice 33(c) under Principle 4.4

148th edition: July 2016
4. Remuneration practices under King IV™
Executive directors: Practices and remuneration trends report
This constitutes a move towards achieving some of the ‘best possible outcomes’ for a wider group of stakeholders, and represents a shift from the ‘business-as-usual’ context that formed the background for King III.
Remuneration committeesDraft King IV™ recommends that the outcome of the non-binding advisory vote should be considered when evaluating the performance of the remuneration committee. Thus, although draft King IV™ assists remuneration committees by introducing more advanced recommended practices, which will contribute to the aim of fair and responsible executive remuneration (and the introduction of the involvement of the social and ethics committee), it also results in committee members having more at stake when considering executive remuneration.
The increased disclosure requirements will also require more active involvement for some remuneration committees – but ultimately, all of the changes introduced by draft King IV™ should contribute to the remuneration committee’s best desired outcome, being fair and responsible remuneration of executive directors.
When evaluating the performance of the remuneration committee, and prior to recommending the re-appointment of directors who are serving on the remuneration committee, the board should take into consideration the results of non-binding advisory votes on the adoption of the remuneration policy or its implementation, as well as the extent and nature of the steps taken to address shareholders’ concerns.26
Would the inclusion of a requirement to disclose the wage gap or the introduction of a binding vote on remuneration have been pertinent inclusions in terms of remuneration best practice? For this to be the case, the practice must assist in achieving one of the stakeholders’ best possible outcomes, while also being fair in light of other stakeholder interests.
The alternative practices introduced by draft King IV™ may contribute towards the ‘best possible outcomes’ for all stakeholders, while not being wholly unacceptable to any. No balance can be absolute – and so, a dynamic shift in thinking for all stakeholders must happen: each must understand their unique role in the bigger picture in terms
of executive remuneration, while respecting that their own ‘best possible outcomes’ may also be limited by those of other legitimate stakeholders. Regrettably, there is no possible solution that can fully satisfy every stakeholder.
26 Recommended Practice 44 under Principle 4.4

158th edition: July 2016 Executive directors: Practices and remuneration trends report
NorwayNorway’s sovereign wealth fund, worth USD870 billion, has committed to focusing on executive pay, targeting high salaries in companies that it owns stakes in around the world.
United KingdomIn light of the groundswell against excessive executive pay, some commentators have even suggested that the introduction of binding votes on pay policies has not had the effect on pay levels that regulators in the UK initially hoped it would.
FranceThe French Government has shown strong support for investors contesting executive pay, and has suggested that it may introduce regulations to curb executive pay.
5. Say on pay: A global perspective
The ‘new normal’
In the context of increasing demands for South Africa to move towards a binding vote on remuneration, ‘say on pay’ is now more relevant than ever.
International snapshots
CRISA and the expectations of institutional investors
The Code for Responsible Investing in South Africa 2011 (CRISA) is based on the UN-backed Principles for Responsible Investment (PRI) and is a non-mandatory market-based code of governance.
Similar to the King Code, CRISA seeks to positively influence corporate governance practices in South Africa. CRISA seeks to do this by providing a code for responsible investing by institutional investors, who, through their beneficial interests in the securities of companies, have the ability to influence and encourage the application of sound governance principles and practices within the companies in which they invest. In such a way, CRISA seeks to establish a ‘new normal’ in which all institutional investors apply their votes in a responsible and constructive manner.
Institutional investor have, by virtue of their share ownership and rights, including voting rights, the ability to influence and encourage investee companies to apply sound governance principles and practices. Recent experience in South Africa and internationally indicates that market failures in relation to governance are, at least in part, due to an absence of active institutional investors, or investment behaviour driven by short-term results. (CRISA introduction)

168th edition: July 2016
5. Say on pay: A global perspective
Executive directors: Practices and remuneration trends report
CRISA was drafted with a sustainability/ESG (environmental, social and governance) focus. Remuneration issues, although not specifically referenced in CRISA, are an important aspect of ESG, and considered by most institutional investors to be among the most important governance issues. Accordingly, the principles that CRISA promotes are important in the context of the ‘say-on-pay’ movement.
The two CRISA principles most applicable to remuneration are:
• Principle 2: An institutional investor should demonstrate its acceptance of ownership responsibilities in its investment arrangements and investment activities; and
• Principle 5: Institutional investors should be transparent about the content of their policies, how the policies are implemented and how CRISA is applied to enable stakeholders to make informed assessments.
When considered in light of the high percentage of voting at shareholder meetings focusing on remuneration issues27, it is natural that the policy referred to in sub-principle 3 (quoted below) could be expected to include detail surrounding the institutional investor’s policy on remuneration issues, and the criteria used to reach voting decisions.
Both these policies (sub-principle 14.b) and voting records (sub-principle 13) should be publically disclosed in an easily accessible manner, and the voting records disclosed should contain detailed reasons for no votes – rather than a mere indication that a no vote was cast.
27 For instance, Old Mutual Investment Group’s CRISA Disclosure released in February 2016 reveals that remuneration is “the most important governance category” and “a focal point for [their] proxy voting and engagement”, and was the governance category under which the second most votes were cast during the 2015 proxy voting season (after the category “election of directors”).
Sub-principle 3, under Principle 2:
An institutional investor should develop a policy dealing with ownership responsibilities. The policy should include, but not necessarily be limited to the following:
… c. voting at shareholder meetings, including the criteria that are used to reach voting decisions and for public disclosure of full voting records
Along with requiring the public disclosure of policies and records, CRISA emphasises the importance of engagement between the institutional investors and the investee companies.28 Such engagement is an integral characteristic of the ‘new normal’ that CRISA strives to establish.
28 Sub-principles 11 and 15, under Principle 5.
Public disclosure of an investor’s responsible investment strategy also enables listed companies to engage meaningfully with institutional investors and their service providers.29
To what extent are the CRISA requirements regarding disclosure of policies and voting records complied with?
Research commissioned by the CRISA Committee in 201330 revealed that 36% of institutional investors and service providers reviewed disclose their proxy voting results, with less than a third of these doing so more than once per year, as recommended by CRISA. This percentage does not appear to have improved by 2016 – as finding voting records, specifically voting records with enough detail to be informative remains challenging.
29 Oliphant, John, “Responsible investment research: CRISA disclosure by institutional investors and their service providers” CRISA Committee September 2013
30 For instance, Old Mutual Investment Group’s CRISA Disclosure released in February 2016 reveals that remuneration is “the most important governance category” and “a focal point for [their] proxy voting and engagement”, and was the governance category under which the second most votes were cast during the 2015 proxy voting season (after the category “election of directors”).

178th edition: July 2016
5. Say on pay: A global perspective
Executive directors: Practices and remuneration trends report
The absence of quality disclosures that are easy to locate, together with the lack of detail surrounding voting policies relating to remuneration practices and principles, presents a challenge to companies, which struggle to obtain information surrounding what is deemed acceptable to institutional investors.
While some companies are able to circumvent this challenge through direct engagement with institutional investors and proxy advisors such as the Institutional Shareholder Services (ISS), who often play a strong role in guiding the voting of institutional investors, other companies are subject to difficult AGMs in which shareholder activists present new and often unexpected preferences and concerns.
CRISA and the King CodeCRISA was developed in response to comments on King III submitted by the South African PRI network, calling for guidance to the investor community to be included in the report. At the time, the King Committee recommended that a separate code be drafted to specifically set out the expectations from institutional investors in this regard.
However, unlike its predecessor, draft King IV™ makes a move towards the incorporation of shareholder responsibilities. The new principles set out in the draft King IV™ may take us a step further towards the ‘new normal’ being sought. However, questions remain whether the provisions of the draft as they currently stand will have a positive impact on say-on-pay, and whether they are specific enough to remuneration to allow for the introduction of a binding vote.
The current provisions of draft King IV™ relating to the responsibilities of shareholders31 emulate those of CRISA to some degree, and refer to the adoption of “responsible investment principles and practices”, a term which could be wide enough to capture principles and practices relating to remuneration in its net.
The provisions also reference the need for disclosure (although only of policy and not specifically voting records).32
However, the recommended practices do not reference any specific shareholder responsibilities insofar as voting on remuneration-specific practices is concerned.
Some inclusions that could assist in obtaining the standard of institutional investor voting and education required to make the move towards the binding vote could specifically relate to:
• The inclusion of policy provisions that relate to the institutional investor’s stance on remuneration practices and policies;
• The requirement to ensure that detailed voting policies, which include detail surrounding remuneration practices and policies, are made available online;
• A commitment to ensure that those exercising votes on behalf of institutional investors have a comprehensive understanding of remuneration practices and policies;
• A requirement to engage directly with relevant parties at the investee companies before casting any votes on any remuneration-related matters; and
• A specific reference to ensure that voting records are disclosed online in an easily accessible manner, and include detailed reasons for ‘no’ votes, which will assist companies in assessing their practices and policies in light of shareholder concerns.
There continues to be a significant amount of attention and activism surrounding the executive remuneration issue, with some institutional investors demonstrating a strong repertoire of remuneration knowledge while others still seem to lack the requisite knowledge to make an informed vote.
Encouragingly, we have begun to note an increase in interest from institutional investors in improving their specialist knowledge on the issue of executive remuneration. A significant opportunity in this area exists for institutional investors to educate themselves – an opportunity that is aligned with the spirit and purpose of both King IV™ and CRISA.
Ultimately, if South Africa is to make a move towards the binding vote, there needs to be a strong certainty that the shareholders who are given the right to vote are in a position to be able to critically analyse the remuneration policies and practices that they are expected to express a view on.
31 Principle 5.2 32 Recommended practice 22 under Principle 5.2

188th edition: July 2016
5. Say on pay: A global perspective
Executive directors: Practices and remuneration trends report
Without this ‘new normal’ – informed proxy voters who are subject matter experts in executive remuneration structures and policies, and who have a deep understanding of the business drivers that inform the design thereof, together with a standardized approach to disclosure in terms of remuneration policy and implementation – a binding vote may yield unfair results.
Reason for ‘No’ votes: South Africa
• Performance conditions for the long-term incentive plan too lenient;
• Long-term incentive plans should be subject to performance conditions. Awards without performance conditions are not viewed as appropriate;
• Preferences for specific performance measures to be applied to long-term incentive plans;
• Limited transparency around performance targets – both company and individual scorecards;
• Disclosure is not sufficient to assess the full structure and components of the policy/inadequate disclosure surrounding short-term incentives, long-term incentives, KPIs, targets, measures and weightings within the remuneration policy;
• Targets considered low/thresholds too easy to meet/there are no clearly defined group performance targets;
• The quantum of the remuneration is considered to be excessive;
• Terms of executive service contracts should be disclosed; and
• Only one performance condition for short-term incentives/long-term incentives is questioned.
Reason for ‘No’ votes: Global
In most countries, say-on-pay votes are held as a non-disclosed ballot where the agenda motion is either accepted or rejected. Rejected votes may be disclosed where the rationale is newsworthy and this is often used to fuel debate.
The exception is the US, where shareholder-voting rates are available, and companies are more willing to disclose the reason for any rejection votes.
An examination of 2 599 proxy say-on-pay voting results reflects that shareholders in only 71 companies (2.7%) cast a vote below 50%. The average percentage of all say-on-pay votes cast in the entire sample was 90.1% in favour. The percentage of ‘no’ votes ranged from a 15% minimum to a mean of 40%.
A synopsis of the reasons for voting ‘no’ in the 71 companies was:
• Disappointing share price (46%);
• Lack of strategy (16%);
• Poor return on investment (15%);
• Limited transparency and lack of meaningful KPI (13%); and
• Budget targets missed (10%).

198th edition: July 2016 Executive directors: Practices and remuneration trends report
6. A new perspective on performance: Measuring impact in the age of sustainability
The Global Goals for Sustainable Development were agreed by 193 countries at the United Nations Sustainable Development Summit in September 2015. They include 17 Sustainable Development Goals (SDGs) to end poverty, fight inequality and injustice, and tackle climate change by 2030.33
Following the Paris Agreement reached at the Paris climate conference (COP21) in 2015, where 195 countries adopted the first-ever universal, legally binding global climate deal, there has been a shift in focus from short-term to long-term sustainability, and from shareholder to stakeholder interests.
33 “Business planning on Sustainable Development Goals needed to action CEO concerns about stakeholders”. PwC South Africa. http://www.pwc.co.za/en/press-room/sustainable-development-goals.html
The Sustainable Development Goals
Figure 6.1
Source: Global Goals, www.globalgoals.org
Significant investment will be required to tackle these issues and in our view, business will be a critical player in its success. The business community can expect a new wave of related regulation and policy, but in the end, it will be businesses that will be a driving force behind achieving the SDGs, regardless of regulation.
Governments define and drive policy and law, while businesses define and drive their own strategies. It is in the best long-term interests of business to be operating in a thriving society in a growing economy. Business is dependent on the community around it for its customers, employees and reputation, and it is dependent upon the environment for its primary materials, resources and land.
There is an added complexity nowadays too – it’s no longer sufficient for a business to do just enough. In recent years, tax decisions have been in the spotlight, with individual companies paying the right amount of tax in the view of the law, but not in the eyes of the people (or government). Issues around moral acceptability and accountability are coming into play.
Embracing this relationship with society, the environment and government creates a new strategic lens through which business success must be viewed and measured.

208th edition: July 2016
6. A new perspective on performance: Measuring impact in the age of sustainability
Executive directors: Practices and remuneration trends report
Link with remuneration
Measuring success is no longer confined to a mere set of financial metrics to keep investors and the broader stakeholders happy. PwC’s 19th Annual Global CEO Survey found that 86% of CEOs are already responding to changing stakeholder expectations by making changes to how they measure success and what they hold themselves accountable for. They have to take responsibility for impacts beyond financial performance.
In the January 2014 edition of our Non-executive directors: Practices and remuneration trends report we suggested these metrics need to find their way onto executives’ performance scorecards to broaden the conventional perspective on executive performance.34
With this in mind, PwC has developed a Total Impact Measurement and Management (TIMM) tool that allows organisations to carry out an impact study that puts a value on their activities (or products or services).
34 “Non-executive directors: Practices and remuneration trends report”. PwC South Africa. 2016. http://www.pwc.co.za/en/publications/non-executive-directors-report.html
TIMM allows organisations to measure the impact of their activities on society, the environment and the economy. This means that directors can be objectively held accountable (and also rewarded) for their efforts.
Impacts considered within TIMMFigure 6.2
Comm
unities
EmployeesShareholders
Suppliers
Governments
Cust
omer
s
Social impact
Econ
omi c
impa
ct
Tax impact
Environmental im
pact
Bu s
in e s s a c t i v it i e s
Peopletaxes
Propertytaxes
GHGs and other air emissions
Water pollution
Waste
Land use
Water use
Productiontaxes
Environmentaltaxes
Profittaxes
Exports
Investment
Profits
Payroll
Education
Financial performance
$
Livelihoods
Health Empowerment
Community cohesion
Intangibles
TIMM provides a holistic understanding of how an organisation’s business activities deliver value to the supply chain and communities in which it operates, through its contribution to the economy and the public finances, and its impact on the environment and wider society.35 In this way, it provides a comprehensive assessment of how organisations generate and potentially destroy value for shareholders and broader stakeholders.
In the same way, as performance is measurable, directors can also be held accountable and be rewarded or penalised appropriately. Traditionally, executives would continually chase sales and financial metrics to drive their short-term and long-term incentives.
Financial performance can no longer be the only measure of success, but rather should be recognised as a gauge of whether the organisation is providing something that consumers and society want.
35 PwC Measuring and managing total impact: A new language for business decisions

218th edition: July 2016
6. A new perspective on performance: Measuring impact in the age of sustainability
Executive directors: Practices and remuneration trends report
Having a meaningful purpose means that organisations need to bring the economic, fiscal, societal and environmental metrics together in a way that is relevant to them and their stakeholders. Executive remuneration linked to this mix of metrics would be more defendable and drive the correct behaviour for an organisation to be sustainable, profitable and a good corporate citizen.
PwC 29
Measuring your impact – a new perspective on performance
The more governments start to look at how business contributes to achieving the Global Goals and society is ever more vigilant at spotting and reporting poor business behaviours, the more important it is for business to understand that it’s not just economic contribution and profits that people are interested in, but their total impact. It’s looking at impact in a holistic way. But how do you measure ‘impact’?
Total Impact Measurement and Management (TIMM) provides a new ‘language’ that generates hard numbers (equivalent to the new ways of evaluating national output and wellbeing that governments use). TIMM enables management to develop a better understanding of the social, fiscal, environmental and economic impacts of their activities, while still, of course, making a profit. This exercise is, in itself, interesting and helps support a business’s licence to operate and its dialogue with its stakeholders.
But the value comes in evaluating options to identify and optimise trade-offs, i.e. to make more informed decisions. TIMM gives business leaders the ability to compare strategies and investment choices using quantified data, and assess the total impact of each decision and choice they make. Being able to measure, understand and compare the trade-offs between different options means decisions can be made with more complete knowledge of the overall impact they will have and a better understanding of which stakeholders will be affected by which decisions.It can help a business understand how it is contributing towards the achievement of a governmental Global Goal and be useful in discussions with governments to evidence potential impact or how impact is changing over time, e.g. to show how well an initiative is working to reduce a negative impact.
The original plan The new plan (built with interventions and mitigation measures)
Here’s an example: An energy provider wanted to understand the impact of building a transmission line as planned and with interventions and mitigation measures. The company wanted to pinpoint the value of the additional investment made.
Key Definitions
Direct
Indirect
Induced
Bar size represents the magnitude of our impact
Green represents a positive contribution Impacts from business operations
Impacts through the effects on organisations in our supply chain
Impacts through the spending by our employees, or suppliers’ employees, in the wider economy
Red represents a negative contribution
n Direct
n Direct
n Indirect
n Indirect
n Induced
n Induced
Source: PwC (Find out more at www.pwc.com/totalimpact)
218th edition: July 2016
Figure 6.3

228th edition: July 2016
6. A new perspective on performance: Measuring impact in the age of sustainability
Executive directors: Practices and remuneration trends report
South Africa36
To better appreciate the approach global companies are adopting about the SDGs, PwC conducted two separate surveys during 2015 – one for business and another for citizens – that were promoted through social media and shared with PwC clients, United Nations Global Compact (UNGC) members and Global Reporting Initiative (GRI) members. We wanted to know just how aware companies and citizens were of the SDGs and how companies were planning to engage with them.
Here, we focus on the results for South Africa. The surveys canvassed the views of both business and members of the general public. In total, 31 businesses and 103 citizens responded to the global survey.
36 We recommend that this report be read in conjunction with our global survey, Make it your business: Engaging with the Sustainable Development Goals, released in September 2015, to obtain a global perspective of the results of the survey. https://www.pwc.com/gx/en/sustainability/SDG/SDG%20Research_FINAL.pdf
The exact nature and requirements of the SDGs might not yet be common knowledge across the business world, but awareness among companies is already high, with 87% of the sample confirming they already knew of the goals.
However, business is split regarding who they see as being responsible for achieving the SDGs. Nearly half (48%) believe the government has the primary responsibility (only 3% gave business prime responsibility). Nevertheless, 64% are already making plans about how to respond to the SDGs.
After all, it makes sense to know how your business can contribute towards a government’s ability to achieve its SDGs. Mapping how you align, measuring your impact and implementing initiatives to improve creates a good basis for dialogue. It helps to demonstrate commitment and protect an organisation’s licence to operate.
Top business impacts by industry According to PwC's Engagement Survey 2015, the global results reflected the following SDG impacts on a broad range of industries.
Figure 6.4
Source: Global Goals, www.globalgoals.org
When asked where they could have the greatest impact in achieving SDGs, businesses across all industries except chemicals recognised ‘decent work and economic growth’ among the top two goals that their organisations could have the most impact on.
Utilities and Mining
Energy, Engineering and Construction
Financial Services
Professional Chemicals Communication Healthcare ManufacturingServices
Retail and Consumer
Technology

238th edition: July 2016
6. A new perspective on performance: Measuring impact in the age of sustainability
Executive directors: Practices and remuneration trends report
Geographically, all regions listed ‘decent work and economic growth’ as the SDG on which they could have the most impact, apart from the Middle East, where companies saw ‘good health and well-being’ as the area in which they could play the most significant role.
Businesses in South Africa believe that they can have the greatest impact on:
• ‘Promoting sustained, inclusive and sustainable economic growth’;
• ‘Inclusive and equitable quality education and promoting lifelong learning opportunities for all’;
• ‘Sustainable consumption and production patterns’;
• Building resilient infrastructure, promoting inclusive and sustainable industrialisation and fostering innovation’; and
• ‘Urgent action to combat climate change and its impacts’.
Citizens, on the other hand, have a strong concern about these SDGs:
• ‘Ending hunger, achieving food security and improving nutrition’;
• ‘Promoting sustainable agriculture, learning and health’;
• ‘Eliminating poverty in all its forms everywhere’;
• ‘Availability and sustainable management of water and sanitation for all’; and
• ‘Decent work and economic growth’ and ‘quality education’ were also priorities.
Figure 6.5 Global priorities
Source: Global Goals, www.globalgoals.org
Business has the greatest impact
Business sees the greatest opportunity
Citizens prioritise the importance
Top
The South African view is similar, yet the precedence is somewhat different.
Figure 6.6 South African priorities
Source: Global Goals, www.globalgoals.org
Business has the greatest impact
Business sees the greatest opportunity
Citizens prioritise the importance
Top

248th edition: July 2016
6. A new perspective on performance: Measuring impact in the age of sustainability
Executive directors: Practices and remuneration trends report
It’s interesting to note that South African citizens did not prioritise ‘urgent action to combat climate change and its impacts’. This contrasts with the global results, where it was ranked second. Ultimately, businesses should be engaging with their key stakeholders to understand which goals matter most to them and why.
93% of citizens believe it is important for companies to sign up to the SDGs.
The current disparity between the perceptions of businesses and citizens could be reduced if companies not only address the goals that are most relevant to citizens, but also extend strategies to those that citizens think are most important. By doing this, they will not be seen as just ‘cherry picking’ goals but be recognised for taking a holistic approach to supporting the sustainable development agenda.
Businesses have the ability to influence sustainable development by supporting the SDGs, and citizens are becoming increasingly aware of this. To successfully adopt the goals, businesses need to be clear about the next steps to take. This should include identifying and ranking the most important goals, followed by implementing an impact monitoring system for long-term strategy development.
In South Africa, 93% of citizens believe it is important for companies to sign up to the SDGs. Encouragingly, 64% of South African respondents are planning or implementing plans to address them. Of the remainder, 13% are not aware of the SDGs and 23% have not yet taken any action. This may also lead to poor prioritisation of efforts and a reduced impact.
64%of South African respondents are planning or implementing plans to address them.
13%are not aware of the SDGs.
23% have not yet taken any action.
The gap can be reduced if the majority of the 36% who have not thought through how to assess their impact yet take strategic action to respond to more relevant SDGs.
Businesses should adopt the goals, integrate them into their strategy and consider the impact they have on their customers’ needs. Companies that have adapted to changing market needs in the past have been rewarded – and it bears considering that the business landscape in South Africa continues to change, this time towards greater sustainability.

258th edition: July 2016 Executive directors: Practices and remuneration trends report
7. Executive remuneration versus investor return: another gap?
It is no longer unusual for investors to have a ‘say on pay’ regarding the directors and employees of companies they are invested in.For as long as there is a perception that executives’ remuneration is excessive, the longer stakeholders will question the legitimacy of company directors’ level of pay, even more so when the share price has remained flat or fallen.
This sentiment may be unfair, as external events over which executives have no control often directly impact the share price. Unfortunately, the investor community has a very narrow view on the return on their investment and the responsibility will be laid at the door of the company directors. This is especially so in the case of institutional investors that must answer to their own investors.
The disparity between the level of a CEO’s pay and an average employee’s remuneration at the lower level in a company (commonly referred to as the pay gap) is another measure used to exert downward pressure on pay levels. This disparity between CEOs’ remuneration and that of the lowest earner in the organisation is even more apparent and is addressed in chapter 10.
In this chapter we focus on the views of the investor community. Around the world, regulatory reforms have tried to address their concerns by empowering shareholders in various ways, from having binding votes at the AGM and forced deferral of incentives to imposing earning caps, to mention a few.
Investors are looking for a return on their investment. The principle put forward by many is that if there is no return, measured primarily by way of dividends and/or increases in share price, why should executives then receive an increase in pay, let alone any bonus?
In August 2015 the SEC adopted final rules implementing this requirement through the amendment of the executive compensation disclosure regulations under Item 402 of Regulation S-K (Final Rules). The Final Rules will require a registrant to disclose:
• The median of the annual total compensation of all employees;
• The annual total compensation of its CEO; and
• The ratio of these two amounts.
The disclosure is required in a registrant’s annual report, proxy or information, or registration statement that requires executive compensation disclosures.
While the concept appears simple, it is riddled with complexities when determining pay amounts across a broad workforce, particularly for global employers and those that rely on domestic part-time and seasonal employees. These complexities will likely require companies to engage in substantial data mining and analytics.
R
SEC requirements
The SEC released amendments to its rules for comment in April 2015. These require the clear disclosure of actual executive compensation paid versus the financial performance of the company.37
The SEC adopted its final ruling on Pay Ratio Disclosure, effective 19 October 2015. Registrants must comply with the final rule for the first fiscal year beginning on or after 1 January 2017.38
The Wall Street Reform and Consumer Protection Act (Dodd-Frank Act) of 2010 included a provision requiring public companies to disclose the ratio of annual total compensation of the CEO to the median total compensation of all employees.
37 Securities and Exchange Commission release no. 34-74835. http://www.sec.gov/rules/proposed/2015/34-74835.pdf (accessed 30 April 2015)
38 http://www.sec.gov/rules/final/2015/33-9877.pdf

268th edition: July 2016
7. Executive remuneration versus investor return: another gap?
Executive directors: Practices and remuneration trends report
These rules are effective for fiscal years commencing on or after 1 January 2017. For calendar year companies, disclosure is required together with executive compensation disclosures provided in the 10K or proxy statement in 2018.
The SEC estimates that these rules will apply to approximately 3 571 SEC registrants and that for many of these, it will require significant work to compile and integrate pay data from disparate sources. Compliance with this new disclosure requirement may be extremely difficult for many companies to satisfy, in part because compensation of non-US employees must be included in the calculation.
The Final Rules confirm that the identification of the median employee must include a cross-section of employees, including various employee categories.
Inclusion of these categories of employees will require multinational companies to gather data that may incorporate a wide variety of disparate compensation items, denominated in multiple currencies and compiled for unique reporting periods.
Companies may be able to simplify the variety of data to be gathered by basing the identification of the median employee on a consistently applied compensation measure, such as taxable income or wages, rather than based on the calculation of total annual compensation, as required.
The Final Rules emphasise that the mandate regarding disclosure of the company’s pay ratio is not based on an abstract average, but on the total annual compensation of ‘an actual employee’.
The Final Rules also include two exceptions for certain foreign employees to be excluded in the determination of the median employee. First, employees may be excluded if they are in a foreign country whose data privacy laws do not allow the company to comply with the Final Rules. To make use of this exception, the company must obtain a legal opinion that it is unable to comply with the Final Rules without a violation of the foreign jurisdiction’s data privacy laws or regulations. This must be filed as an exhibit to the SEC filing that includes the pay ratio disclosure.
before initial disclosures must be filed for most companies, the administrative burden involved in gathering and analysing the necessary employee pay data may also require such lead time.
Companies should perform an initial review of information systems to determine how these calculations can/will use them as well as the impact of local laws for multinational entities, among other issues.39
The regulations require a company to provide a clear description of the relationship between executive compensation actually paid to the named executive officers and the cumulative total shareholder return (TSR) of the company, and the relationship between the company’s TSR and the TSR of a peer group chosen by the company, over each of the company’s five most recently completed financial years.
Other measures of performance may also be disclosed (which may be more appropriate to the company) along with TSR, as long as they are clearly defined, not misleading and not presented with greater prominence than the required disclosure.
39 For detailed comment kindly visit https://www.pwc.com/us/en/tax-services/publications/insights/assets/pwc-sec-releases-final-pay-ratio-disclosure-rules.pdf
However, any foreign employees excluded under the data privacy exception also count towards the 5% that may be excluded as de minimis. Second, a de minimis number of non-US employees may be excluded if they comprise less than 5% of a company’s total employees. If the non-US employees make up less than 5% of the company’s total employees, and the company applies such exemption, it must apply it to exclude all non-US employees.
If the non-US employees make up more than 5% of a company’s total employees, then it may also exclude up to 5% of non-US employees provided that when it is applied to a jurisdiction it must exclude all employees within that jurisdiction.
The Final Rules also provide that in determining the median employee, and the compensation of such person, the company may apply an adjustment for the difference between the cost of living in a foreign jurisdiction.
The regulations impose significant burdens on public corporations to identify the median employee and that employee’s compensation. While the Final Rules provide notable lead time

278th edition: July 2016
7. Executive remuneration versus investor return: another gap?
Executive directors: Practices and remuneration trends report
JSE
Turning to South Africa, we examined the correlation between executive remuneration and company performance measured by share price growth and headline earnings per share in continuing operations (HEPS).
Total guaranteed pay (TGP) is paid regardless of the performance of the company. The level of TGP is normally determined with reference to job grading and a job evaluation process having been carried out on the relevant job function. Affordability may be an added measure.
Before any increase is granted, consideration should possibly also be given to whether or not there has been an equal or better return delivered to investors over the past reporting period. Most major corporates’ performance measures will look at share price and profits.
These are not the only measures that could be considered, as it may also be appropriate to look at measures based on the respective industry in which the company operates. For example, in the property sector, it would be appropriate to consider the extent to which distributions have increased year on year. Share price on its own may be inappropriate, as it reflects market sentiment at a point in time, but could be included with other measures.
We charted the main sectors on the JSE and identified the resultant correlations for the each of these sectors with the year-on-year movement in TGP for CEOs, CFOs and EDs against the movement in the share price and HEPS.
Figure 7.1 Basic resources
Figure 7.2 Financial services
Large capShare price
-45.7%
HEPS
-18.4%
TGP CEO
+1.3%
TGP CFO
-3.5%
TGP ED
+1.5%
Medium capShare price
-49.2%
HEPS
-87.6%
TGP CEO
+4.6%
TGP CFO
+2.0%
TGP ED
+6.0%
Small capShare price
-27.8%
HEPS
+4.1%
TGP CEO
+4.0%
TGP CFO
+8.0%
TGP ED
+4.0%
Large capShare price
+29.6%
HEPS
+20.3%
TGP CEO
+0.6%
TGP CFO
+7.0%
TGP ED
+5.0%
Medium capShare price
+15.1%
HEPS
+28.7%
TGP CEO
+6.0%
TGP CFO
+6.4%
TGP ED
+8.0%
Small capShare price
+12.9%
HEPS
+58.7%
TGP CEO
+3.5%
TGP CFO
+7.1%
TGP ED
+5.0%

288th edition: July 2016
7. Executive remuneration versus investor return: another gap?
Executive directors: Practices and remuneration trends report
Figure 7.3 Industrials
Figure 7.4 Services
Large capShare price
+11.3%
HEPS
+9.7%
TGP CEO
+6.0%
TGP CFO
+10.0%
TGP ED
+22.2%
Medium capShare price
+9.2%
HEPS
+10.1%
TGP CEO
+4.0%
TGP CFO
+3.9%
TGP ED
+3.0%
Small capShare price
+15.3%
HEPS
+3.2%
TGP CEO
+4.9%
TGP CFO
+17.5%
TGP ED
+7.0%
Large capShare price
+13.7%
HEPS
+13.2%
TGP CEO
+6.0%
TGP CFO
+9.0%
TGP ED
+10.0%
Medium capShare price
+17.0%
HEPS
+12.9%
TGP CEO
+8.0%
TGP CFO
+4.0%
TGP ED
+11.0%
Small capShare price
+8.1%
HEPS
+12.6%
TGP CEO
+9.0%
TGP CFO
+5.0%
TGP ED
+4.0%
Conclusion
The financial services industry shows some positive correlation between company performance and TGP increases. It is arguable that this may also be as a result of global regulation having made a positive impact. In contrast, basic resources shows the opposite with shareholders having lost significant value while executives have continued to receive increases in their TGP despite the decline in global commodity prices, an external factor that is beyond the control of the executives.
This TGP versus company performance comparison should be performed by company, where the level of correlation becomes more meaningful, particularly if the more appropriate shareholder return measure is used and not share price alone.
We recommend that remuneration committees consider including such comparative data in their annual remuneration reports so as to facilitate a meaningful comparison between executive remuneration and shareholder return. We believe that pay ratio disclosure will become a shareholder-reporting requirement, and the time to consider this important development is now.

298th edition: July 2016 Executive directors: Practices and remuneration trends report
8. Contrasting views: CEOs versus investors
In PwC’s latest Global Investor Survey40 , released in April 2016, the opinions of 438 investment professionals and rating agencies in 18 countries were canvassed and compared with the views of 1 409chiefexecutivespolledinPwC’s latest Annual Global CEO Survey41.
40 PwC. “Redefining business success in a changing world: Global survey of investor and CEO views”. 2016. https://www.pwc.com/gx/en/ceo-survey/assets/2016-global-investor-survey.pdf
41 PwC. “19th Annual Global CEO Survey”. 2016. https://www.pwc.com/gx/en/ceo-survey/2016/landing-page/pwc-19th-annual-global-ceo-survey.pdf
CEOs, on the other hand, may see a case for a long-term focus, but many see barriers to its implementation. For example, many CEOs believe markets punish companies if they incur additional short-term costs by adopting new practices that take account of wider stakeholder interests, even if they could enhance future performance.
Figure 8.1 Barriers encountered when responding to wider stakeholder expectations
Q: Which of the following barriers, if any, are companies encountering when responding to wider stakeholder expectations?
Conflict betweenstakeholder
interestsand financialperformanceexpectations
Investment professionalsCEOs
Misalignedperformance
incentives
Misalignedbetween
stakeholderinterests and
businessstrategy
Insufficientinformation aboutwider stakeholder
expectations
Inability toeffectivelyexecute on
their strategy
Lack ofthe right
capabilities
33%
54%
49%
17%
33%
20%
32%
24%
30%
23%20%
31%
Source: PwC Global Investor Survey 2016
It is encouraging to note that CEOs and investment professionals share similar opinions on many issues. So while both CEOs and investors are under no illusions about the challenges that businesses face when it comes to technology and both know that tomorrow’s innovation could spell the beginning of the end for today’s global giants, they don’t always see the world the same way. This is particularly evident in the area of remuneration.
In this chapter, we focus on some of the differences highlighted by the two surveys.
Metrics
The investor community has a greater interest in drivers of long-term business performance beyond those covered in traditional financial statements. Issues of trust, company purpose and values are on their radar. For some, metrics related to environmental impacts now appear fundamental to their assessment of a company’s future value creation.

308th edition: July 2016
8. Contrasting views: CEOs versus investors
Executive directors: Practices and remuneration trends report
Companies should consider measuring and communicating the impact they have and the value they create in terms of both hard and soft drivers of success. Investors want more measurement of innovation and more communication of business strategy. These are expected to also take account of social, environmental and economic impacts.
Investors tend to be distrustful of remuneration metrics. Companies could do more to link their remuneration policies and key performance indicators to overall strategy, risk management and other factors, given the number of investors who think companies need to change the way they measure success and hold themselves accountable.
Alternatively, if companies believe that link already exists, they can try to enhance their disclosure of that linkage to investors.
Figure 8.2 Areas in which companies could be doing more to communicate impact and value
Q: Within the context of wider stakeholders, in which of the following areas do you think companies should be doing more to measure or communicate impact and value?
Innovation
Investment professionals CEOs
MORE MEASUREMENT MORE COMMUNICATION
Business strategy
Key risks
Environmental impact
(e.g. EBITDA forecasts)
Organisational purpose and values
Impact on wider communities
Employee practices
40%
32%
28%
28%
26%
26%
41%
53%
51%
45%
37%
44%
30%
33%
30%
39%
39%
55%
39%
53%
37%
33%
27%
41%
35%
28%
44%
45%
54%
41%
50%
44%
30%
59%
44%
35%
44%
48%
48%
35%
Non-statutory financial information
Non-financial indicators (e.g. brand)
Traditional financial statements
Source: PwC Global Investor Survey 2016

318th edition: July 2016
8. Contrasting views: CEOs versus investors
Executive directors: Practices and remuneration trends report
Purpose
When asked how they would describe the purpose of a company, it was not surprising that the majority of investors defined it as creating value for shareholders. But many also see a wider purpose, where profit is necessary, but is not sufficient. Explicit links are made between the potential to generate value for shareholders whilst also creating value for customers, employees, the community and other stakeholders.
Figure 8.3 Company purpose
Q: The purpose of a company is to create value for...
Shareholders 73%16%
53%
48%
53%
31%
36%14%
24%5%
9%26%
Customers
Wider society
People (employees)
Supply chain
The business
Investment professionals CEOs
Source: PwC Global Investor Survey 2016
Summary
In theory, CEOs and investors have the same goal: value creation. However, they do see the world differently in some key respects. These differences may be attributable to three things:
• A reporting gap Companies may not be explaining their strategies clearly and telling investors everything they need to know, particularly in the context of material risks and the inclusion of relevant KPIs.
• An understanding gap Investors have the same facts as CEOs, but draw different conclusions. Investors may be failing to express in clear enough terms the value they place on wider issues and profits being generated in a socially responsible way. CEOs need to find out what their investors and other stakeholders want from them.
• A perception gap Investors have the facts, but do not place the same importance on them. CEOs may not fully understand the priorities and preferences of the investor community.

328th edition: July 2016 Executive directors: Practices and remuneration trends report
9. CEO succession: Insider or outsider?
According to the latest CEO Success study by Strategy&42, PwC’s strategy consulting business, 17% of the world’s largest 2 500 public companies changed their CEO during 2015, more than in any of the previous 16 years.
Over the past several years, more large enterprises have been choosing their new CEOs from outside the company as part of a planned succession, an indication that hiring an outsider has become more of an intentional leadership choice than a necessity. Industries experiencing the most disruption (such as telecommunications, utilities, healthcare and energy) have brought in a higher-than-average proportion of outsider CEOs.
42 Strategy&, “2015 CEO Success study”.2015. http://www.strategyand.pwc.com/ceosuccess
Faith in outsiders is also paying off. For the third straight year, the study found outsider CEOs have delivered higher median total shareholder returns than insiders. One reason we believe outsiders are performing better is that the outgoing CEOs over the last three years include a higher number who were hired in planned rather than forced turnovers, and fewer of them were themselves forced out. Historically, most outsiders had been hired following forced successions, more often than not in situations where the company had not been performing well.
Nevertheless, most companies have continued to promote insiders to the CEO position, and we believe that this will remain the preferred succession practice. Hiring a chief executive from the outside used to be seen as a last resort, something that typically happened when the board of directors had to force out the incumbent CEO suddenly or had failed to groom a suitable successor, or both.
Figure 9.1 Prior industry employment of incoming outsider CEOs, 2004-2015
63%
92%77% 75% 70% 64% 58% 56%
44% 41%28%
37%
8%23% 25% 30% 36% 42% 44%
56% 59%72%
UtilitiesCross Industry Consumer Discretionary2)
IndustrialsMaterialsInformation Technology
Consumer Staples
EnergyTelecommunication HealthcareServices
Financials
Different prior industry
Same prior industry
1) Exhibit shows incoming CEOs who joined their company as CEO, broken down by whether they had worked in the same or different industry immediately before joining thecurrent company.2) "Consumer Discretionary" includes automobiles and components, consumer durables and apparel, consumer services, media, and retailing.Note: Exhibit excludes turnover events resulting from M&A, interims, and events with incomplete information.Source: Strategy& 2015 CEO Success study
Source: Strategy& 2015 CEO Success study

338th edition: July 2016
9. CEO succession: Insider or outsider?
Executive directors: Practices and remuneration trends report
This, however, is no longer the case with the disruptive changes that companies are facing today. While an internal candidate may have had an excellent record of achieving the business’ goals in the past, boards are recognising that internal candidates may lack the skills needed to lead the company through the changes necessary to win in the future.
Boards of directors following well- thought-through succession plans should have a deep bench of strong internal candidates. However, when the company needs to make transformational changes away from their previous strategic and operating strategies, boards should factor the outsider option into their plans.
Outsiders don’t have biases and commitments built up over the years, and can make changes more objectively. They may also be able to look at the organisation from a broader perspective based on an understanding of what the business will require to succeed in the future.
When outsider CEOs are hired
Outsider CEOs are more likely to be hired if:
Outsider CEOs are less likely to be hired if:
• The company has been low performing • The chairman is hiring his/her first CEO at the company
• The chairman does not have CEO experience in the same company
• The outgoing CEO had a long tenure
• The outgoing CEO was also an outsider • The company is large
Whether the new leader comes from inside or outside the organisation, companies that plan for CEO succession more carefully are more likely to be better-performing companies in general.
Female CEOsOnly 10 women were among the 359 incoming CEOs at the world’s 2 500 largest companies in 2015.
At just 2.8%, this is the lowest share since 2011. The worst performers were the US and Canada.
Interestingly, female CEOs are more often hired from outside the company (32%) than males (23%).
Strategy&, PwC’s strategy consulting business, in its annual study of worldwide CEO succession patterns examines the degree, nature, and geographic distribution of chief executive changes among the world’s 2 500 largest public companies.
For more information on the 2015 CEO Success study, visit www.strategyand.pwc.com/ceosuccess

348th edition: July 2016 Executive directors: Practices and remuneration trends report
10 The economics and ethics of pay
This is the third year that we discuss the economics and ethics of pay in this publication, and the continued level of response and debate is significant, particularly around the issue of the pay gap. While the public’s fascination with the pay of top executives remains, the focus is also shifting to the level of pay of entry-level workers, with the debate around the minimum wage, the social wage and a living wage gaining momentum. The concept of a national wage is also being discussed in other parts of the world and was the subject of a recent referendum in Switzerland, where it was rejected by a 77% majority.
This is much lower than the national statistic, which the World Bank reports to be 0.65 (the higher the coefficient, the higher the income inequality in a society). The primary reason for the difference between that national figure and our estimate of the Gini coefficient of the employed is the high rate of unemployment in South Africa.
We have updated the data in our calculation of the Gini coefficient of the employed in South Africa based on the salary data in the PwC REMchannel® salary survey database as at April 2016, and the figure for this year remains 0.43.
Several leading companies are now calculating their own Gini coefficient and comparing this to the national average as well as industry norms.
Trends in executive pay
Large listed companies continue to exercise caution when considering the pay levels of their CEOs and executive committee members. While average levels of pay remain high relative to workers, and are viewed as excessive by labour and the general public, increases in guaranteed pay have generally remained subdued and below those granted to workers.
Structurally, the trend towards less volatile and geared long-term incentives (share awards) remains in place43, with share options and share appreciation rights being replaced by restricted shares, bonus shares and performance shares, which provide better alignment with shareholder interests and are more likely to avoid extreme payouts.
43 PwC Long Term Incentive Survey, 2013
In the UK and the EU, regulatory changes in the financial services sector (CRD IV), which cap the absolute level of variable pay to 100% of fixed pay (up to 200% with shareholder approval), have also decreased the volatility and maximum earning potential of banking executives. We are seeing the impact of these regulations in South Africa among British and European-owned banks such as Barclays Africa, Investec and Mercantile Bank.
The Gini coefficient of the employed
In the 2014 edition of this publication we calculated the Gini coefficient of the employed in South Africa on the basis of all employees’ data in the PwC REMchannel® salary survey. In 2014 the Gini was 0.44 and in 2015 it was 0.43.

358th edition: July 2016
10 The economics and ethics of pay
Executive directors: Practices and remuneration trends report
The pay gap ratio
The simple ratio of the total pay of the CEO to the average pay of the rest of the organisation is also gaining popularity as a way of measuring the pay gap. If we calculate this ratio using the same PwC REMchannel® data, this ranges between 12.7 and 64.4 for most South African companies. The major driver of this ratio is the size and complexity of the company, because this has a strong influence on CEO pay, but less impact on the pay of entry-level workers.
The minimum wage and a living wage
The minimum wage is a legislated minimum governing the employment of any full-time worker in the country, whereas a living wage is a level of pay to maintain a frugal, but dignified living standard. The minimum wage is based on absolute poverty levels of providing a minimum level of food intake for the worker and their immediate dependants, and the bare essentials. The living wage is based on a cost build-up of more
elements to sustain a decent standard of living. The living wage is deemed to be a good guideline for large profitable companies to set entry-level pay for their full-time workers.
The implementation of a uniform national minimum wage is currently being debated in South Africa, with the likelihood of this being set at around R3 500 per month. There is no definitive data on what constitutes a living wage in South Africa, with levels of R7 000 to R10 000 per month being discussed in the course of the debate.
In the UK, the National Living Wage (NLW) announced in George Osborne’s 2015 budget imposes a premium on top of the National Minimum Wage (NMW) for those workers aged 25 and over. The minimum hourly rate of pay for these employees rose by more than 7% in April 2016 to £7.20. This will be followed by an expected average annual uplift of ±6% until 2020, when the rate is expected to have reached 60% of median earnings. This is expected to be around £9 an hour in 2020, although the Office for Budget Responsibility has suggested the figure is likely to be closer to £9.35 an hour.
Conclusion
We continue to recommend caution with respect to executive pay and believe careful attention to both the quantum and alignment of remuneration with business performance should be pursued. Remuneration committees, and the social and ethics committees of leading companies should remain sensitive to the levels of pay of entry-level workers and aspire to pay these employees a level of remuneration that permits a dignified life when supported by other benefits that the company may provide, as well as guidance and education regarding financial wellness.

368th edition: July 2016 Executive directors: Practices and remuneration trends report
11. Profile of an executive director
Executive directors are responsible for the successful leadership and management of the organisation according to the strategic direction set by the board of directors. Mandatory appointments are Chief Executive Officer (CEO) and Chief Financial Officer (CFO).
The cut-off date to view published accounts for listed companies was 30 April 2016. At this date, there were 1 179 executive directors appointed to active JSE-listed companies. The overall headcount is similar to the prior year. There were 338 CEOs, 304 CFOs and 537 executive directors in this total.
Over a five-year time series, the number of executive directors on JSE boards fluctuated above what is expected, considering the limited number of listed companies. Applying a polynomial trend line across the macro database for top management headcount in these companies, the indication is that the trend points north. Provided business stability is achieved and suitably qualified directors are available in the market, we expect the number of executives to increase over time.
Figure 11.1 Executive directors JSE headcount 2011 to 2015
Source: PwC analysis
2011
1,151
1,024
1,180
1,145
1,179
2012 2013 20142014 2015
Trend

378th edition: July 2016
11. Profileofanexecutivedirector
Executivedirectors:Practicesandremunerationtrendsreport
Headcount across sectors is also similar to those reported last year:
Figure 11.2 Number of executive directors JSE companies by sector
Source: PwC analysis
AltX Basic ResourcesFinancialIndustrial Services
2015: (Total 1 179) 2014: (Total 1 180) 2013: (Total 1 145)
414 357415 208 226205 208 179206 189 208198 160 175156

388th edition: July 2016
11. Profileofanexecutivedirector
Executivedirectors:Practicesandremunerationtrendsreport
The age profile reflects that there is a slight downward trend in the median and average ages in the sub-sectors, with a median age of 52 and an average slightly higher at 53.
Figure 11.3 Average age of executive directors
Average
Median
Travel & leisure
Telecommunications
Technology
Retail
Personal & household goods
Oil & gas
Mining
Media
Investment instruments
Insurance
Industrial goods & services
Healthcare
Food
Financial services
Development capital
Construction & materials
Chemicals
Base metal processing
Banking
Automobiles & parts
AltX 5150515150 53
535454
5860
5853
5654
5455
50
5050 52
5753 55
56525352
505252
5655
5452
514951
5454
5258
5656
5454
5759
57
5756
5652
5962
52 5452
5252
5354
51
52
53
53
51
52
2015 2014 2013
Evolving in lock-step with a company’s strategic plans and risk profile are factors that determine today’s board tenure. Fresh perspectives and the need for diversity are gaining traction, and remuneration committees will encounter increasing pressure to appoint directors competent to lead the corporation as new challenges in the 21st century emerge. These demands will affect board tenure from two sides. Firstly, competence will need to be bought, and secondly, forced succession will take place due to retirement.
Figure 11.4 Executive directors board tenure
Source: Historical Annual Financial Statements 1994 – 2015: PwC analysis
Overall CEO CFO ED0
1
2
3
4
5
6
7
Average tenure 5.0 4.3 3.9 5.6
AltX 4.3 3.5 3.1 5.0
Basic resources 5.1 4.6 3.8 5.6
Financial services 5.2 4.3 3.9 6.0
Industrials 5.1 4.8 4.4 5.4
Services 5.2 4.3 4.2 6.1

398th edition: July 2016 Executive directors: Practices and remuneration trends report
12. The power of parity – gender equality
Globally, progressive executives have recognised that to focus on gender equality in their business is not only the ethical thing to do, but also good for business. Today, more CEOs, heads of state and other leaders are committing themselves to gender equality goals for the corporations and institutions they lead.
Female graduates are now well entrenched in the previously male-dominated fields of mining, construction, civil and mechanical engineering, and aeronautics.
A global perspective on education published by the OECD gives a clear perspective of the lead women have in education.
Figure 12.1 Percentage of tertiary degree qualifications awarded to women (selected countries)
Source: Education at a glance, OECD indicators 2013/2015
2015 2014
Saudi ArabiaChinaKoreaG20 AverageIreland
AustraliaBrazilGermanyOECD Country Average
USSouth AfricaHungary
UK
Canada
70% 68% 60% 61% 60% 60% 59% 59%
58% 58% 58% 57% 56% 57% 59% 55% 58% 55%
55% 54% 56% 54% 56% 51% 55% 48% 47% 44%
As consumers, 80% of purchasing decisions are made by women. Today, these include not only clothes, food and cosmetics, but also technology, real estate, financial services and motor vehicles.
Gender inclusion in the boardroom is no longer a nice-to-have or a moral issue, it is a business necessity. Attention to gender attracts the best employees, at least half of whom are women.
While gender equality in business is proving difficult to achieve, the need for it not only revolves around fairness; but with women attaining better educational levels than their male counterparts, it provides a significant opportunity to attract better workers and ultimately better management to run their companies.
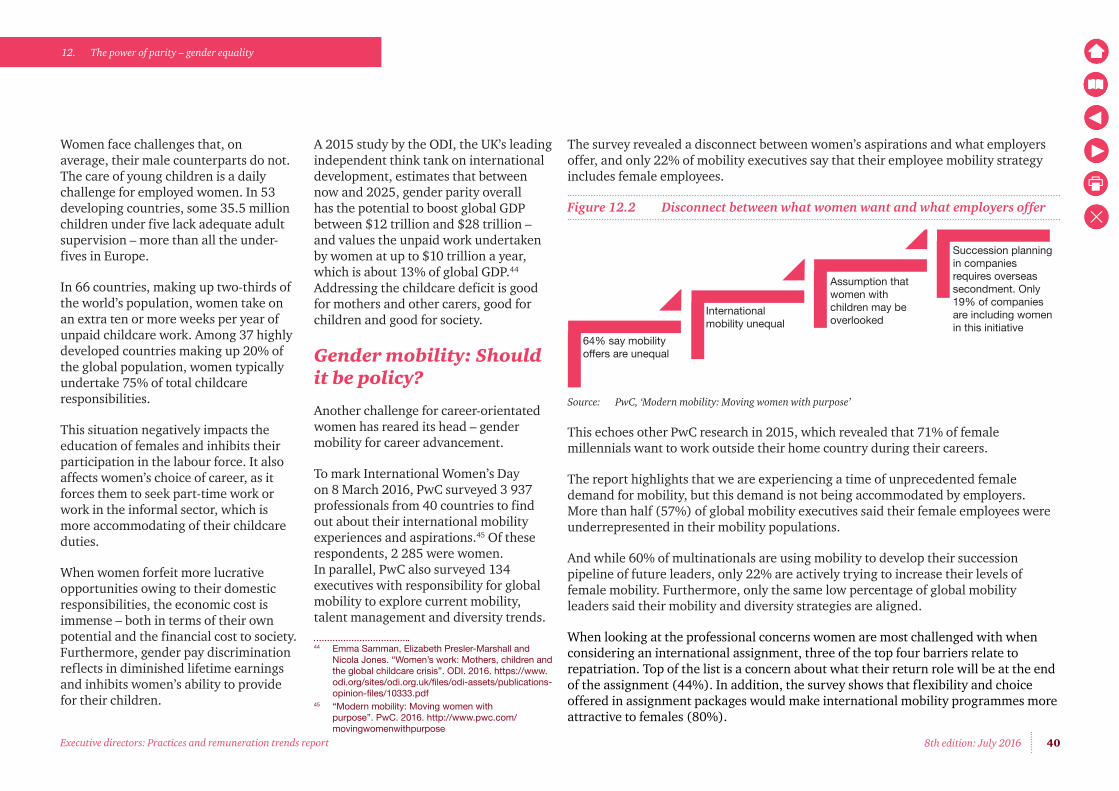
408th edition: July 2016
12. The power of parity – gender equality
Executive directors: Practices and remuneration trends report
Women face challenges that, on average, their male counterparts do not. The care of young children is a daily challenge for employed women. In 53 developing countries, some 35.5 million children under five lack adequate adult supervision – more than all the under-fives in Europe.
In 66 countries, making up two-thirds of the world’s population, women take on an extra ten or more weeks per year of unpaid childcare work. Among 37 highly developed countries making up 20% of the global population, women typically undertake 75% of total childcare responsibilities.
This situation negatively impacts the education of females and inhibits their participation in the labour force. It also affects women’s choice of career, as it forces them to seek part-time work or work in the informal sector, which is more accommodating of their childcare duties.
When women forfeit more lucrative opportunities owing to their domestic responsibilities, the economic cost is immense – both in terms of their own potential and the financial cost to society. Furthermore, gender pay discrimination reflects in diminished lifetime earnings and inhibits women’s ability to provide for their children.
A 2015 study by the ODI, the UK’s leading independent think tank on international development, estimates that between now and 2025, gender parity overall has the potential to boost global GDP between $12 trillion and $28 trillion – and values the unpaid work undertaken by women at up to $10 trillion a year, which is about 13% of global GDP.44 Addressing the childcare deficit is good for mothers and other carers, good for children and good for society.
Gender mobility: Should it be policy?
Another challenge for career-orientated women has reared its head – gender mobility for career advancement.
To mark International Women’s Day on 8 March 2016, PwC surveyed 3 937 professionals from 40 countries to find out about their international mobility experiences and aspirations.45 Of these respondents, 2 285 were women. In parallel, PwC also surveyed 134 executives with responsibility for global mobility to explore current mobility, talent management and diversity trends.
44 Emma Samman, Elizabeth Presler-Marshall and Nicola Jones. “Women’s work: Mothers, children and the global childcare crisis”. ODI. 2016. https://www.odi.org/sites/odi.org.uk/files/odi-assets/publications-opinion-files/10333.pdf
45 “Modern mobility: Moving women with purpose”. PwC. 2016. http://www.pwc.com/movingwomenwithpurpose
The survey revealed a disconnect between women’s aspirations and what employers offer, and only 22% of mobility executives say that their employee mobility strategy includes female employees.
Figure 12.2 Disconnect between what women want and what employers offer
Source: PwC, ‘Modern mobility: Moving women with purpose’
This echoes other PwC research in 2015, which revealed that 71% of female millennials want to work outside their home country during their careers.
The report highlights that we are experiencing a time of unprecedented female demand for mobility, but this demand is not being accommodated by employers. More than half (57%) of global mobility executives said their female employees were underrepresented in their mobility populations.
And while 60% of multinationals are using mobility to develop their succession pipeline of future leaders, only 22% are actively trying to increase their levels of female mobility. Furthermore, only the same low percentage of global mobility leaders said their mobility and diversity strategies are aligned.
When looking at the professional concerns women are most challenged with when considering an international assignment, three of the top four barriers relate to repatriation. Top of the list is a concern about what their return role will be at the end of the assignment (44%). In addition, the survey shows that flexibility and choice offered in assignment packages would make international mobility programmes more attractive to females (80%).
64% say mobilityoffers are unequal
Internationalmobility unequal
Assumption thatwomen with children may beoverlooked
Succession planningin companies requires overseassecondment. Only19% of companiesare including womenin this initiative

418th edition: July 2016
12. The power of parity – gender equality
Executive directors: Practices and remuneration trends report
Why women really leave
If high-potential women are leaving their careers to care for their families, they’re not doing it on purpose. That’s the conclusion Hunter College professor Pamela Stone drew from a study of 54 female high achievers, recruited mostly from alumnae of four selected colleges and universities.
The women pursued their careers an average of 11 years; 60% worked well past the birth of their second child. None was pushed out. Fully 90% left not to care for their families but because of workplace problems, chiefly frustration and long hours.
Two-thirds of those who left tried part-time work but found it problematic; since they’d been putting in long weeks, part-time tended to mean 40 hours of work for 20 hours’ worth of pay. Factoring even more into decisions to opt out entirely, though, was the inability to work part-time without being marginalised.46
46 “Women in the Workplace: A Research Roundup”. Harvard Business Review. 2013. https://hbr.org/2013/09/women-in-the-workplace-a-research-roundup
While nearly 45% of members of parliament are female, women remain underrepresented in senior management in the private sector, with an average of only 18% of women on boards in listed companies.
Figure 12.3 Gender gap in listed South African companies
Source: PwC analysis
The prevalence of traditional views of women’s role within households limits their opportunities to participate in paid work and entrepreneurial activities.
In listed companies on the JSE, total guaranteed pay for women on the board lags behind that of their male counterparts.
AltX Basic Resources Financial Services Industrial Services
Male Female
85% 15% 86% 14% 83% 17% 81% 19% 82% 18%
South Africa –gender reality
In education, South Africa offers equal opportunity to both sexes with nearly full enrolment in primary and secondary education. Between the ages of 7 and 15 years, 98.6% of girls are enrolled, and 98.3% of boys47. Government policies, which include ‘no-fee’ schools as well as school nutrition programmes, try to encourage school enrolment.
Since the mid-90s female labour-force participation has seen an increase of 38%, which has also boosted overall employment levels.
The increase in labour force participation in the South African economy over the past decades has not been matched by an increase in job creation. Today, reducing high unemployment and high poverty rates are key economic and social challenges. The unemployment rate of 54% for young women under the age of 24 is of particular concern.
47 “How long do students spend in the classroom?”. Education at a Glance. OECD. 2014. http://www.oecd-ilibrary.org/education/highlights-from-education-at-a-glance (accessed May 30, 2016).

428th edition: July 2016
12. The power of parity – gender equality
Executive directors: Practices and remuneration trends report
Figure 12.4 Percentage of female TGP below male TGP
Source: PwC analysis
There are enormous challenges to be resolved before true gender parity has any chance of becoming a reality.
AltX Basic Resources Financial Services Industrial Services
-13% -7% -8% -10% -11%

438th edition: July 2016 Executive directors: Practices and remuneration trends report
13. Executive directors’ total guaranteed package: JSE trends
Total guaranteed package (TGP) is that portion of remuneration that is paid regardless of company or employee performance and is a fixed cost made up of salary plus stated benefits. Here, we review the TGP over a three-year timescale and include a brief overview of short-term incentives (STI) based on performance.
Long-term incentives (LTIs) are excluded since this is not only complicated to define but difficult to report on given the different schemes companies have implemented over the years. This is also a changing scenario where incentive practices are adopting a more streamlined approach, and which may in time become generic.
The trends examined cover the whole JSE.
When directors are paid in foreign currency and the amounts are converted to rands, fluctuations in the exchange rate may result in substantial increases or decreases in the value of their remuneration. On the JSE, 140 executive directors are paid in foreign currency.
Rand exchange rate against major currencies
The comparative exchange rates at the cut-off date reflect the depreciation of the rand across major currencies since the previous edition of this publication.
Rand exchange rate against major currencies
Currency 30 April 2015 29 April 2016 Rand depreciation
Australian dollar 9.4714 10.8460 -14.5%
Euro 13.5122 16.1810 -19.8%
UK pound 18.2617 20.7735 -13.8%
US dollar 12.0637 14.2182 -17.9%%
Source: Oanda.com

448th edition: July 2016
13. Executive directors’ total guaranteed package: JSE trends
Executive directors: Practices and remuneration trends report
Summary: Total guaranteed packageFor ease of reference, the following summary draws together two years of data showing total guaranteed package (TGP) levels and increases given to CEOs, CFOs and executive directors. The average inflation in South Africa for 2015 was 6.2% (2014: 6.1%).
2014 R’000s % Increase 2015 R’000s % Increase/Decrease
All of JSE
Upper quartile 5 556 8.7% 6 040 8.7%
Median 3 298 6.2% 3 694 12.0%
Lower quartile 2 080 3.4% 2 147 3.2%
CEOs
Upper quartile 7 135 7.7% 7 697 7.9%
Median 4 130 4.8% 4 572 10.7%
Lower quartile 3 064 2.1% 3 134 2.3%
CFOs
Upper quartile 4 190 9.0% 4 649 11.0%
Median 3 656 6.8% 3 213 -12.1%
Lower quartile 1 968 3.5% 1 901 -3.4%
EDs
Upper quartile 3 703 8.4% 4 229 14.2%
Median 2 573 5.9% 2 805 9.0%
Lower quartile 2 011 5.2% 1 985 -1.3%
Source: PwC analysis
Published accounts are not coterminous since companies have different financial year-ends. The comparator years are the latest accounts available at the cut-off date, the newest being 31 December 2015. This methodology is consistent for remuneration trends in all editions of this publication.
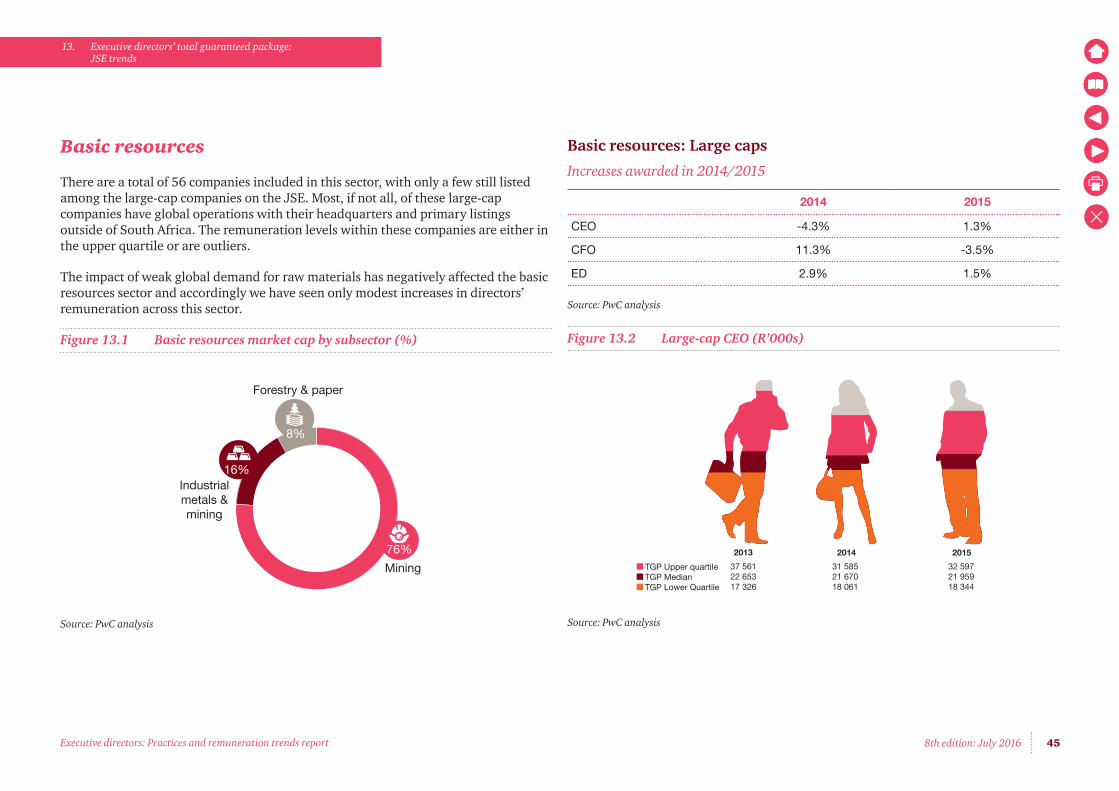
458th edition: July 2016
13. Executive directors’ total guaranteed package: JSE trends
Executive directors: Practices and remuneration trends report
Basic resources
There are a total of 56 companies included in this sector, with only a few still listed among the large-cap companies on the JSE. Most, if not all, of these large-cap companies have global operations with their headquarters and primary listings outside of South Africa. The remuneration levels within these companies are either in the upper quartile or are outliers.
The impact of weak global demand for raw materials has negatively affected the basic resources sector and accordingly we have seen only modest increases in directors’ remuneration across this sector.
Figure 13.1 Basic resources market cap by subsector (%)
Source: PwC analysis
76%
Mining
16%Industrialmetals &mining
8%
Forestry & paper
Basic resources: Large caps
Increases awarded in 2014/2015
2014 2015
CEO -4.3% 1.3%
CFO 11.3% -3.5%
ED 2.9% 1.5%
Source: PwC analysis
Figure 13.2 Large-cap CEO (R’000s)
Source: PwC analysis
2013 2014 2015
37 561 31 585 32 59722 653 21 670 21 95917 326 18 061 18 344
TGP Upper quartileTGP MedianTGP Lower Quartile

468th edition: July 2016
13. Executive directors’ total guaranteed package: JSE trends
Executive directors: Practices and remuneration trends report
Figure 13.3 Large-cap CFO (R’000s)
Source: PwC analysis
Figure 13.4 Large-cap ED (R’000s)
Source: PwC analysis
2013 2014 2015
16 361 15 809 16 91710 057 11 189 10 792 7 930 7 932 6 860
Upper quartileMedianLower Quartile
2013 2014 2015
18 726 20 549 23 63714 682 15 112 15 33410 249 14 549 15 011
Upper quartileMedianLower Quartile
Basic resources: Medium caps
Increases awarded in 2014/2015
2014 2015
CEO -2.9% 4.6%
CFO 8.7% 2.0%
ED 5.3% 6.0%
Source: PwC analysis
Figure 13.5 Medium-cap CEO (R’000s)
Source: PwC analysis
2013 2014 2015
12 574 10 297 8 913 7 549 7 332 7 669 7 150 6 548 6 696
Upper quartileMedianLower Quartile
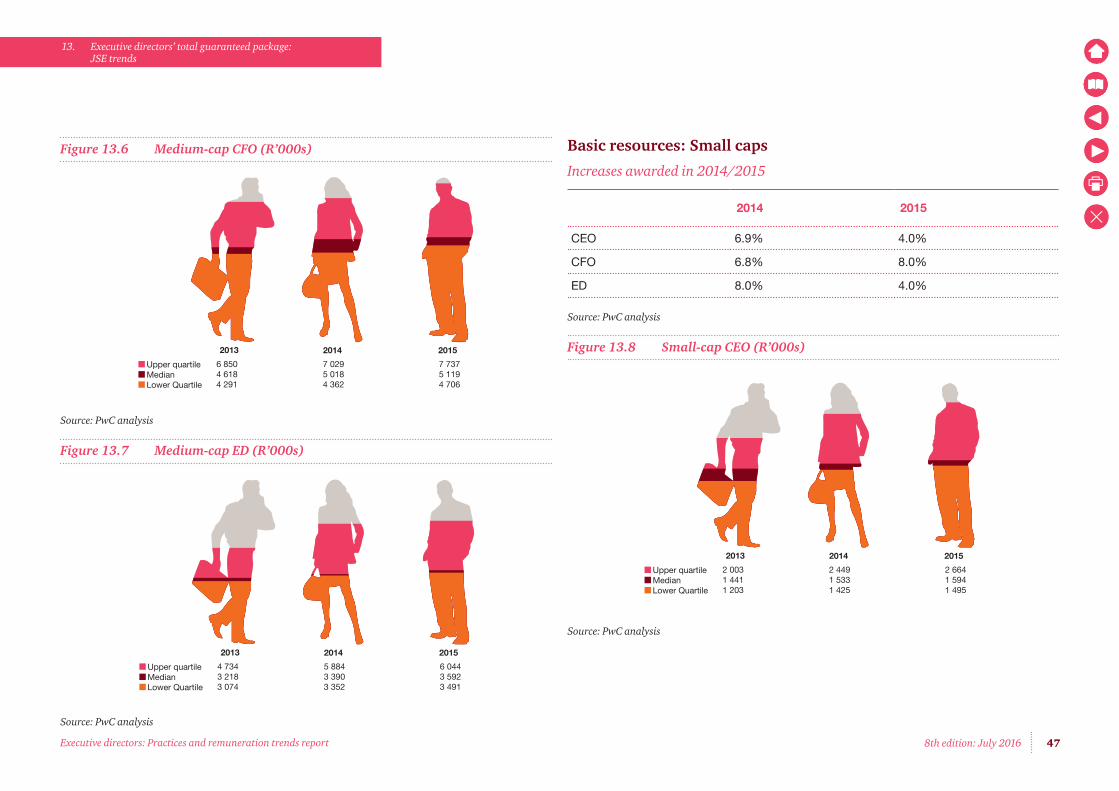
478th edition: July 2016
13. Executive directors’ total guaranteed package: JSE trends
Executive directors: Practices and remuneration trends report
Figure 13.6 Medium-cap CFO (R’000s)
Source: PwC analysis
Figure 13.7 Medium-cap ED (R’000s)
Source: PwC analysis
2013 2014 2015
6 850 7 029 7 7374 618 5 018 5 1194 291 4 362 4 706
Upper quartileMedianLower Quartile
2013 2014 2015
4 734 5 884 6 0443 218 3 390 3 5923 074 3 352 3 491
Upper quartileMedianLower Quartile
Basic resources: Small caps
Increases awarded in 2014/2015
2014 2015
CEO 6.9% 4.0%
CFO 6.8% 8.0%
ED 8.0% 4.0%
Source: PwC analysis
Figure 13.8 Small-cap CEO (R’000s)
Source: PwC analysis
2013 2014 2015
2 003 2 449 2 6641 441 1 533 1 5941 203 1 425 1 495
Upper quartileMedianLower Quartile

488th edition: July 2016
13. Executive directors’ total guaranteed package: JSE trends
Executive directors: Practices and remuneration trends report
Figure 13.9 Small-cap CFO (R’000s)
Source: PwC analysis
2013 2014 2015
1 653 1 811 1 9771 474 1 530 1 6521 329 1 450 1 529
Upper quartileMedianLower Quartile
Figure 13.10 Small-cap ED (R’000s)
Source: PwC analysis
2013 2014 2015
2 102 1 969 2 0041 693 1 828 1 9011 272 1 329 1 225
Upper quartileMedianLower Quartile

498th edition: July 2016
13. Executive directors’ total guaranteed package: JSE trends
Executive directors: Practices and remuneration trends report
Financial services
Failure of the global recovery is the greatest risk to bankers in the near to medium term. Central banks need to ensure that banks have enough liquidity, and risk management is taking centre stage with the global macroeconomic environment topping the agenda. There are also concerns about economic weakness in emerging economies, and uncertainty surrounding their central banks’ monetary policies.
The complexities of modern banking weigh heavily on all sectors of financial services, and by default on directors, who need to steer a steady course between costs and sustainability.
There are 92 companies included in this sector, spread over a number of subsectors, as shown in Figure 13.11.
Figure 13.11 Market capitalisation of the financial services industry
Source: PwC analysis
BanksLife insuranceReal estate investment trustsFinancial servicesReal estate investment and servicesEquity investment servicesNon-life insurance
37%
11%
6%
22%
19%
4%
1%
Financial services: Large caps
Increases awarded in 2014/2015
2014 2015
CEO 5.8% 0.6%
CFO 13.8% 7.0%
ED 10.3% 5.0%
Source: PwC analysis
Figure 13.12 Large-cap CEO (R’000s)
Source: PwC analysis
2013 2014 2015
10 297 12 234 16 864 6 620 7 006 7 050 5 175 5 352 5 816
Upper quartileMedianLower Quartile

508th edition: July 2016
13. Executive directors’ total guaranteed package: JSE trends
Executive directors: Practices and remuneration trends report
Figure 13.13 Large-cap CFO (R’000s)
Source: PwC analysis
Figure 13.14 Large-cap ED (R’000s)
Source: PwC analysis
2013 2014 2015
4 367 5 119 5 2903 770 4 292 4 5923 434 4 122 3 924
Upper quartileMedianLower Quartile
2013 2014 2015
5 406 4 480 5 1563 518 3 882 4 0763 008 3 251 3 901
Upper quartileMedianLower Quartile
Financial services: Medium caps
Increases awarded in 2014/2015
2014 2015
CEO 4.8% 6.0%
CFO 2.1% 6.4%
ED 5.5% 8.0%
Source: PwC analysis
Figure 13.15 Medium-cap CEO (R’000s)
Source: PwC analysis
2013 2014 2015
5 129 6 798 6 5993 325 3 483 3 6922 076 2 650 3 479
Upper quartileMedianLower Quartile

518th edition: July 2016
13. Executive directors’ total guaranteed package: JSE trends
Executive directors: Practices and remuneration trends report
Figure 13.16 Medium-cap CFO (R’000s)
Source: PwC analysis
Figure 13.17 Medium-cap ED (R’000s)
Source: PwC analysis
2013 2014 2015
2 261 2 745 3 1202 085 2 129 2 2661 593 1 503 1 660
Upper quartileMedianLower Quartile
2013 2014 2015
3 839 4 926 5 2342 275 2 401 2 5932 219 1 487 1 629
Upper quartileMedianLower Quartile
Financial services: Small caps
Increases awarded in 2014/2015
2014 2015
CEO 8.5% 3.5%
CFO 6.4% 7.1%
ED 3.8% 5.0%
Source: PwC analysis
Figure 13.18 Small-cap CEO (R’000s)
Source: PwC analysis
2013 2014 2015
2 992 3 300 3 6951 936 2 100 2 1741 659 1 786 1 589
Upper quartileMedianLower Quartile

528th edition: July 2016
13. Executive directors’ total guaranteed package: JSE trends
Executive directors: Practices and remuneration trends report
Figure 13.19 Small-cap CFO (R’000s)
Source: PwC analysis
2013 2014 2015
2 005 1 925 2 4091 441 1 533 1 642 968 1 082 1 208
Upper quartileMedianLower Quartile
Figure 13.20 Small-cap ED (R’000s)
Source: PwC analysis
2013 2014 2015
2 110 2 275 2 3911 474 1 530 1 607 946 881 1 188
Upper quartileMedianLower Quartile

538th edition: July 2016
13. Executive directors’ total guaranteed package: JSE trends
Executive directors: Practices and remuneration trends report
Industrials
The industrial sector is a category that relates to construction and materials, and industrial goods and services. There are 113 companies included in this sector and it is made up of nine subsectors.
Figure 13.21 Market capitalisation of the industrial sector
Source: PwC analysis
Industrials: Large caps
Increases awarded in 2014/2015
2014 2015
CEO 1.9% 6.0%
CFO 0.5% 10.0%
ED 9.7% 22.2%
Source: PwC analysis
Tobacco
Beverages
Personal goods
Household goods & home construction
Chemicals
General industrials
Food producers
Pharmaceuticals & biotechnology
Others
34%
29%
9%
7%
6%
3%
2%
6%
4%
Figure 13.22 Large-cap CEO (R’000s)
Source: PwC analysis
Figure 13.23 Large-cap CFO (R’000s)
Source: PwC analysis
2013 2014 2015
28 603 26 175 31 57213 659 13 924 14 759 9 005 9 684 10 481
Upper quartileMedianLower Quartile
2013 2014 2015
10 841 7 553 8 085 6 384 6 419 7 061 3 847 3 810 3 955
Upper quartileMedianLower Quartile

548th edition: July 2016
13. Executive directors’ total guaranteed package: JSE trends
Executive directors: Practices and remuneration trends report
Figure 13.24 Large-cap ED (R’000s)
Source: PwC analysis
2013 2014 2015
6 969 9 355 6 9833 970 4 357 5 3263 271 4 110 4 449
Upper quartileMedianLower Quartile
Industrials: Medium caps
Increases awarded in 2014/2015
2014 2015
CEO 2.8% 4.0%
CFO 3.5% 3.9%
ED 8.8% 3.0%
Source: PwC analysis
Figure 13.25 Medium-cap CEO (R’000s)
Source: PwC analysis
2013 2014 2015
6 290 8 711 7 4065 584 5 741 5 9695 000 4 770 5 772
Upper quartileMedianLower Quartile

558th edition: July 2016
13. Executive directors’ total guaranteed package: JSE trends
Executive directors: Practices and remuneration trends report
Figure 13.26 Medium-cap CFO (R’000s)
Source: PwC analysis
Figure 13.27 Medium-cap ED (R’000s)
Source: PwC analysis
2013 2014 2015
3 741 4 141 4 5483 508 3 632 3 7752 799 2 889 3 257
Upper quartileMedianLower Quartile
2013 2014 2015
5 428 5 882 6 0403 587 3 901 4 0182 733 3 307 3 306
Upper quartileMedianLower Quartile
Industrials: Small caps
Increases awarded in 2014/2015
2014 2015
CEO 9.2% 4.9%
CFO 10.1% 17.5%
ED 5.2% 7.0%
Source: PwC analysis
Figure 13.28 Small-cap CEO (R’000s)
Source: PwC analysis
2013 2014 2015
4 136 4 392 4 6083 063 3 345 3 5102 092 2 716 2 547
Upper quartileMedianLower Quartile
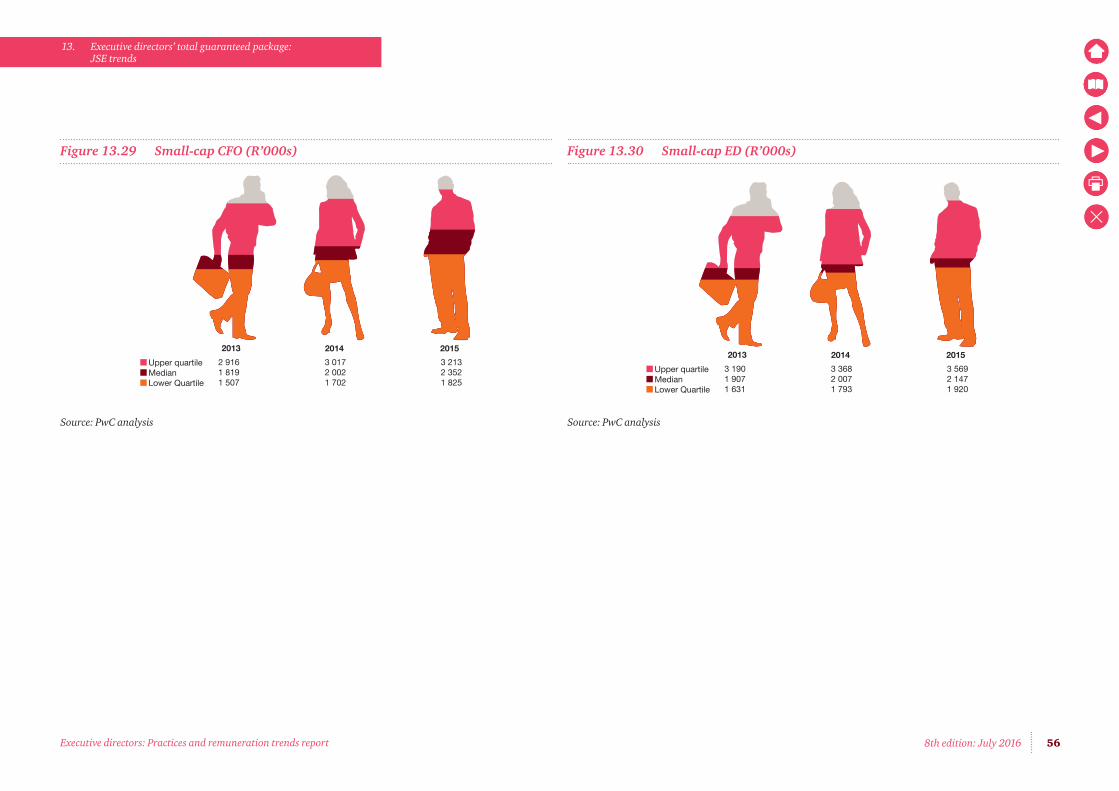
568th edition: July 2016
13. Executive directors’ total guaranteed package: JSE trends
Executive directors: Practices and remuneration trends report
Figure 13.29 Small-cap CFO (R’000s)
Source: PwC analysis
2013 2014 2015
2 916 3 017 3 2131 819 2 002 2 3521 507 1 702 1 825
Upper quartileMedianLower Quartile
Figure 13.30 Small-cap ED (R’000s)
Source: PwC analysis
2013 2014 2015
3 190 3 368 3 5691 907 2 007 2 1471 631 1 793 1 920
Upper quartileMedianLower Quartile

578th edition: July 2016
13. Executive directors’ total guaranteed package: JSE trends
Executive directors: Practices and remuneration trends report
Services
There are 50 companies included in this sector and it is made up of ten subsectors.
Figure 13.31 Market capitalisation of the services sector
Source: PwC analysis
Services: Large caps
Increases awarded in 2014/2015
2014 2015
CEO 7.7% 6.0%
CFO 9.0% 9.0%
ED 5.9% 10.0%
Source: PwC analysis
39%
Media
Mobile telecommunications
General retail
Healthcare
Food & drug retail
Travel & leisure
Industrial transportation
Fixed-line telecommunications
Software & computer services
Support services 21%
12%
10%
9%
3%
3%1%
1%
1%
Figure 13.32 Large-cap CEO (R’000s)
Source: PwC analysis
Figure 13.33 Large-cap CFO (R’000s)
Source: PwC analysis
2013 2014 2015
12 224 13 115 15 224 6 765 7 287 7 724 6 079 7 141 7 485
Upper quartileMedianLower Quartile
2013 2014 2015
5 231 4 597 6 8053 293 3 590 3 9132 467 2 666 2 790
Upper quartileMedianLower Quartile

588th edition: July 2016
13. Executive directors’ total guaranteed package: JSE trends
Executive directors: Practices and remuneration trends report
Figure 13.34 Large-cap ED (R’000s)
Source: PwC analysis
Services: Medium caps
Increases awarded in 2014/2015
2014 2015
CEO 10.7% 8.0%
CFO 7.3% 4.0%
ED 2.8% 11.0%
Source: PwC analysis
2013 2014 2015
4 001 4 221 5 0082 833 3 001 3 3012 501 2 887 3 273
Upper quartileMedianLower Quartile
Figure 13.35 Medium-cap CEO (R’000s)
Source: PwC analysis
Figure 13.36 Medium-cap CFO (R’000s)
Source: PwC analysis
2013 2014 2015
6 956 6 468 7 4094 156 4 601 4 9693 869 4 631 4 653
Upper quartileMedianLower Quartile
2013 2014 2015
3 625 3 951 4 4703 582 3 844 3 9981 808 1 968 2 303
Upper quartileMedianLower Quartile
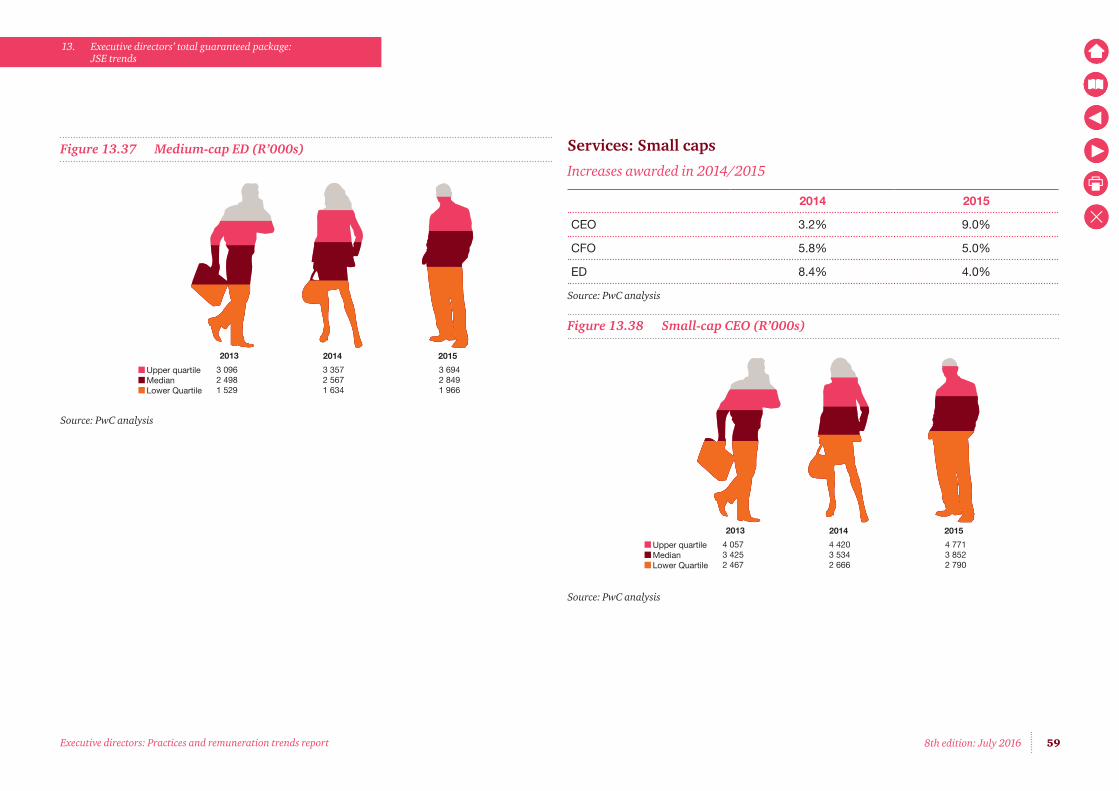
598th edition: July 2016
13. Executive directors’ total guaranteed package: JSE trends
Executive directors: Practices and remuneration trends report
Figure 13.37 Medium-cap ED (R’000s)
Source: PwC analysis
2013 2014 2015
3 096 3 357 3 6942 498 2 567 2 8491 529 1 634 1 966
Upper quartileMedianLower Quartile
Services: Small caps
Increases awarded in 2014/2015
2014 2015
CEO 3.2% 9.0%
CFO 5.8% 5.0%
ED 8.4% 4.0%
Source: PwC analysis
Figure 13.38 Small-cap CEO (R’000s)
Source: PwC analysis
2013 2014 2015
4 057 4 420 4 7713 425 3 534 3 8522 467 2 666 2 790
Upper quartileMedianLower Quartile
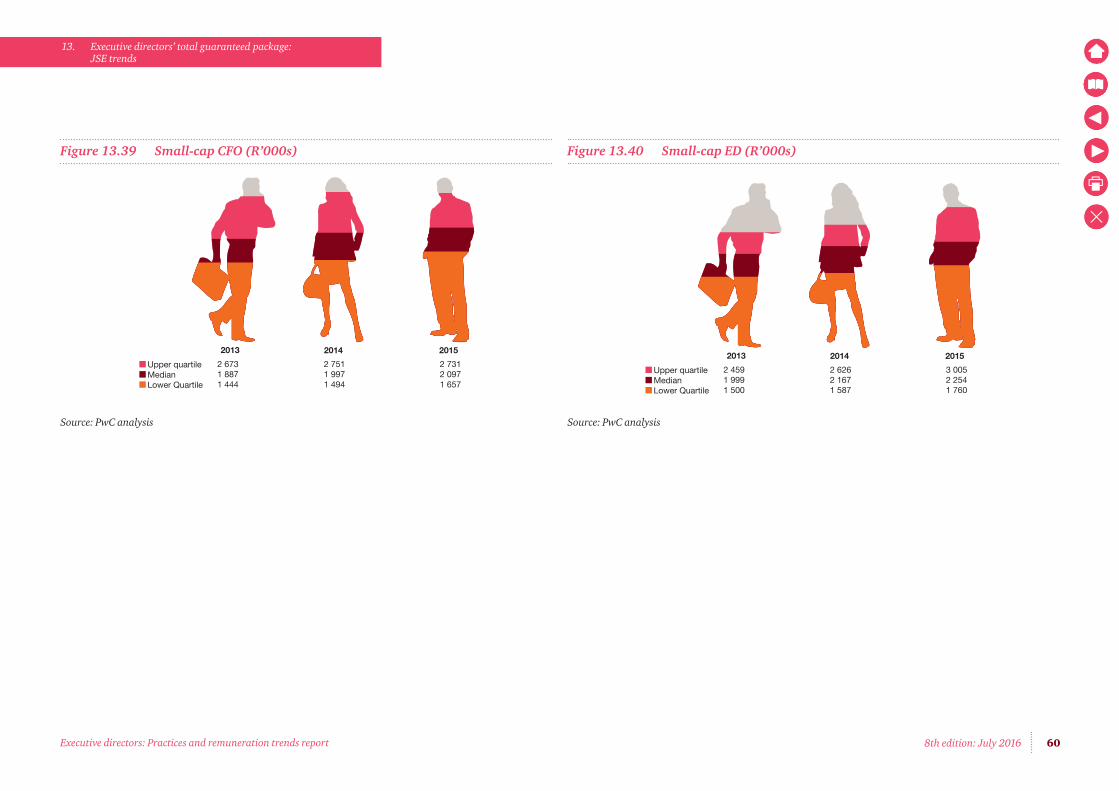
608th edition: July 2016
13. Executive directors’ total guaranteed package: JSE trends
Executive directors: Practices and remuneration trends report
Figure 13.39 Small-cap CFO (R’000s)
Source: PwC analysis
2013 2014 2015
2 673 2 751 2 7311 887 1 997 2 0971 444 1 494 1 657
Upper quartileMedianLower Quartile
Figure 13.40 Small-cap ED (R’000s)
Source: PwC analysis
2013 2014 2015
2 459 2 626 3 0051 999 2 167 2 2541 500 1 587 1 760
Upper quartileMedianLower Quartile
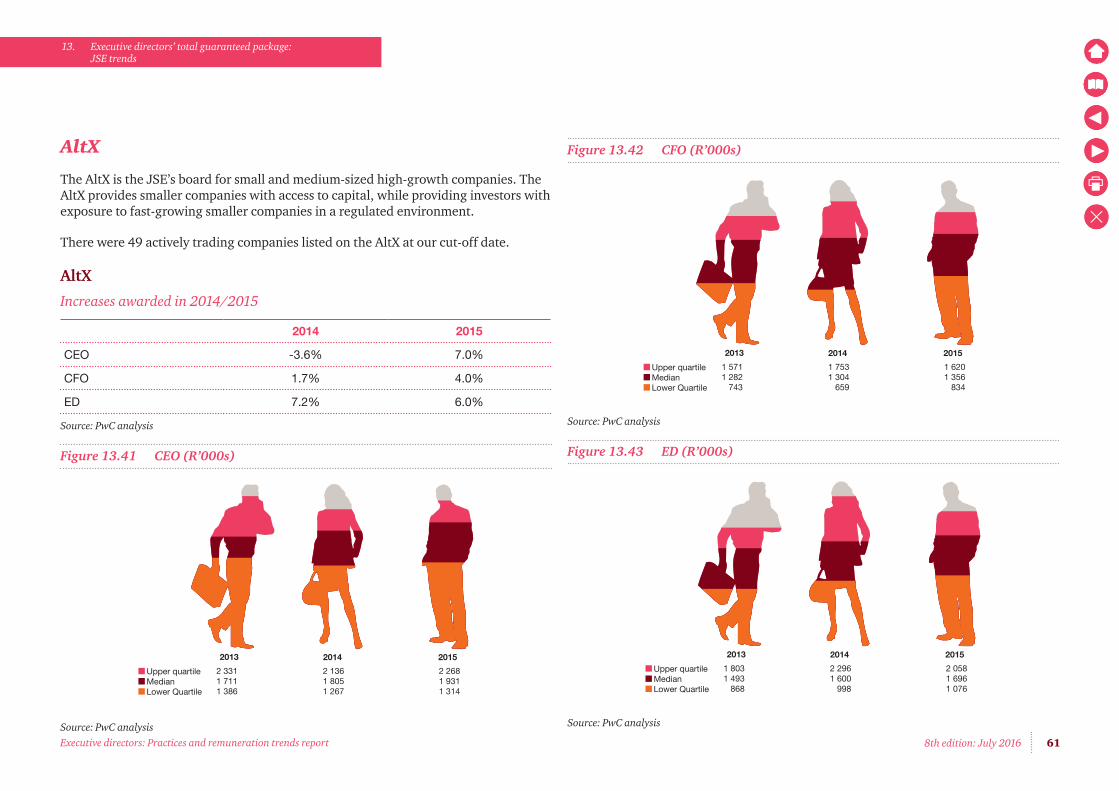
618th edition: July 2016
13. Executive directors’ total guaranteed package: JSE trends
Executive directors: Practices and remuneration trends report
AltX
The AltX is the JSE’s board for small and medium-sized high-growth companies. The AltX provides smaller companies with access to capital, while providing investors with exposure to fast-growing smaller companies in a regulated environment.
There were 49 actively trading companies listed on the AltX at our cut-off date.
AltX
Increases awarded in 2014/2015
2014 2015
CEO -3.6% 7.0%
CFO 1.7% 4.0%
ED 7.2% 6.0%
Source: PwC analysis
Figure 13.41 CEO (R’000s)
Source: PwC analysis
2013 2014 2015
2 331 2 136 2 2681 711 1 805 1 9311 386 1 267 1 314
Upper quartileMedianLower Quartile
Figure 13.42 CFO (R’000s)
Source: PwC analysis
Figure 13.43 ED (R’000s)
Source: PwC analysis
2013 2014 2015
1 571 1 753 1 6201 282 1 304 1 356 743 659 834
Upper quartileMedianLower Quartile
2013 2014 2015
1 803 2 296 2 0581 493 1 600 1 696 868 998 1 076
Upper quartileMedianLower Quartile
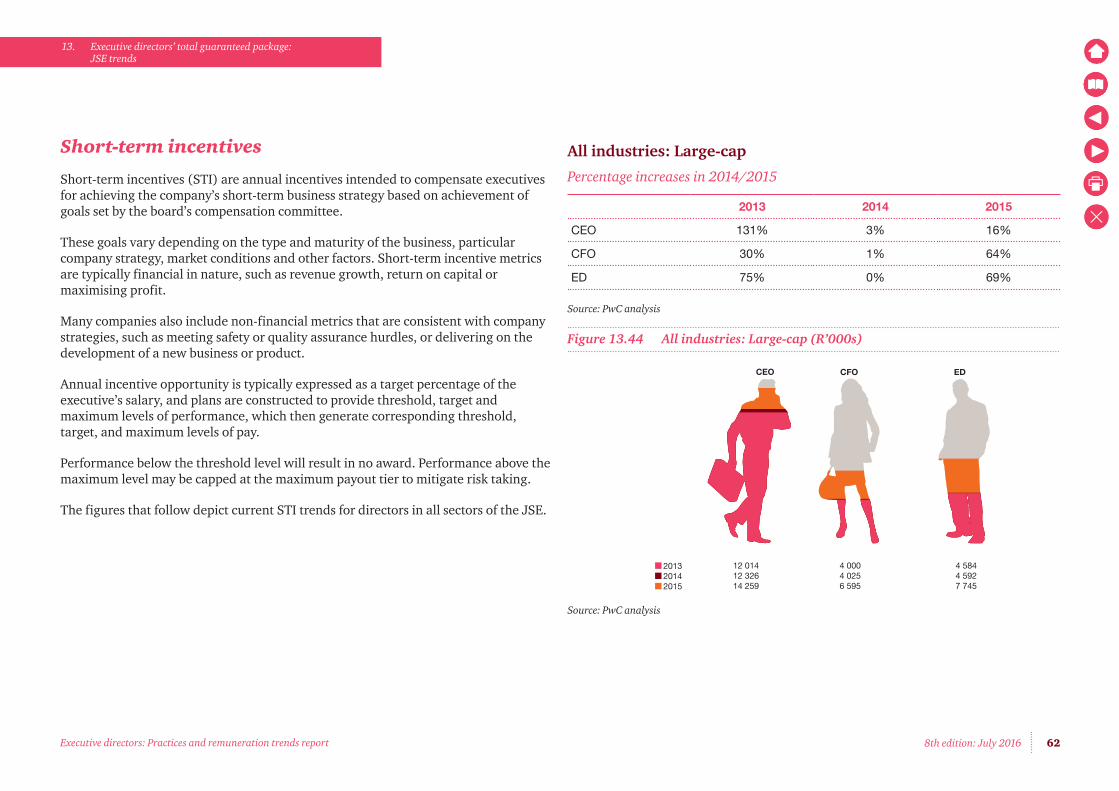
628th edition: July 2016
13. Executive directors’ total guaranteed package: JSE trends
Executive directors: Practices and remuneration trends report
Short-term incentives
Short-term incentives (STI) are annual incentives intended to compensate executives for achieving the company’s short-term business strategy based on achievement of goals set by the board’s compensation committee.
These goals vary depending on the type and maturity of the business, particular company strategy, market conditions and other factors. Short-term incentive metrics are typically financial in nature, such as revenue growth, return on capital or maximising profit.
Many companies also include non-financial metrics that are consistent with company strategies, such as meeting safety or quality assurance hurdles, or delivering on the development of a new business or product.
Annual incentive opportunity is typically expressed as a target percentage of the executive’s salary, and plans are constructed to provide threshold, target and maximum levels of performance, which then generate corresponding threshold, target, and maximum levels of pay.
Performance below the threshold level will result in no award. Performance above the maximum level may be capped at the maximum payout tier to mitigate risk taking.
The figures that follow depict current STI trends for directors in all sectors of the JSE.
All industries: Large-cap
Percentage increases in 2014/2015
2013 2014 2015
CEO 131% 3% 16%
CFO 30% 1% 64%
ED 75% 0% 69%
Source: PwC analysis
Figure 13.44 All industries: Large-cap (R’000s)
Source: PwC analysis
CEO CFO ED
12 014 4 000 4 58412 326 4 025 4 59214 259 6 595 7 745
201320142015
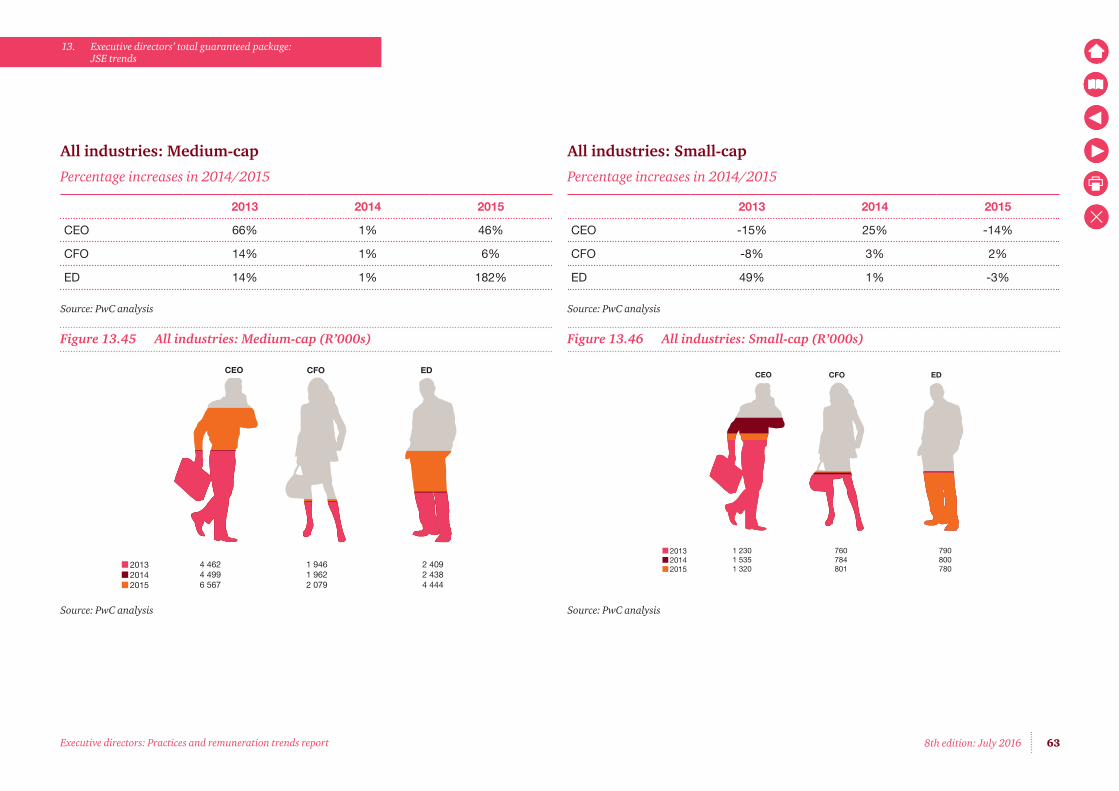
638th edition: July 2016
13. Executive directors’ total guaranteed package: JSE trends
Executive directors: Practices and remuneration trends report
All industries: Medium-cap
Percentage increases in 2014/2015
2013 2014 2015
CEO 66% 1% 46%
CFO 14% 1% 6%
ED 14% 1% 182%
Source: PwC analysis
Figure 13.45 All industries: Medium-cap (R’000s)
Source: PwC analysis
CEO CFO ED
4 462 1 946 2 4094 499 1 962 2 4386 567 2 079 4 444
201320142015
All industries: Small-cap
Percentage increases in 2014/2015
2013 2014 2015
CEO -15% 25% -14%
CFO -8% 3% 2%
ED 49% 1% -3%
Source: PwC analysis
Figure 13.46 All industries: Small-cap (R’000s)
Source: PwC analysis
CEO CFO ED
1 230 760 7901 535 784 8001 320 801 780
201320142015
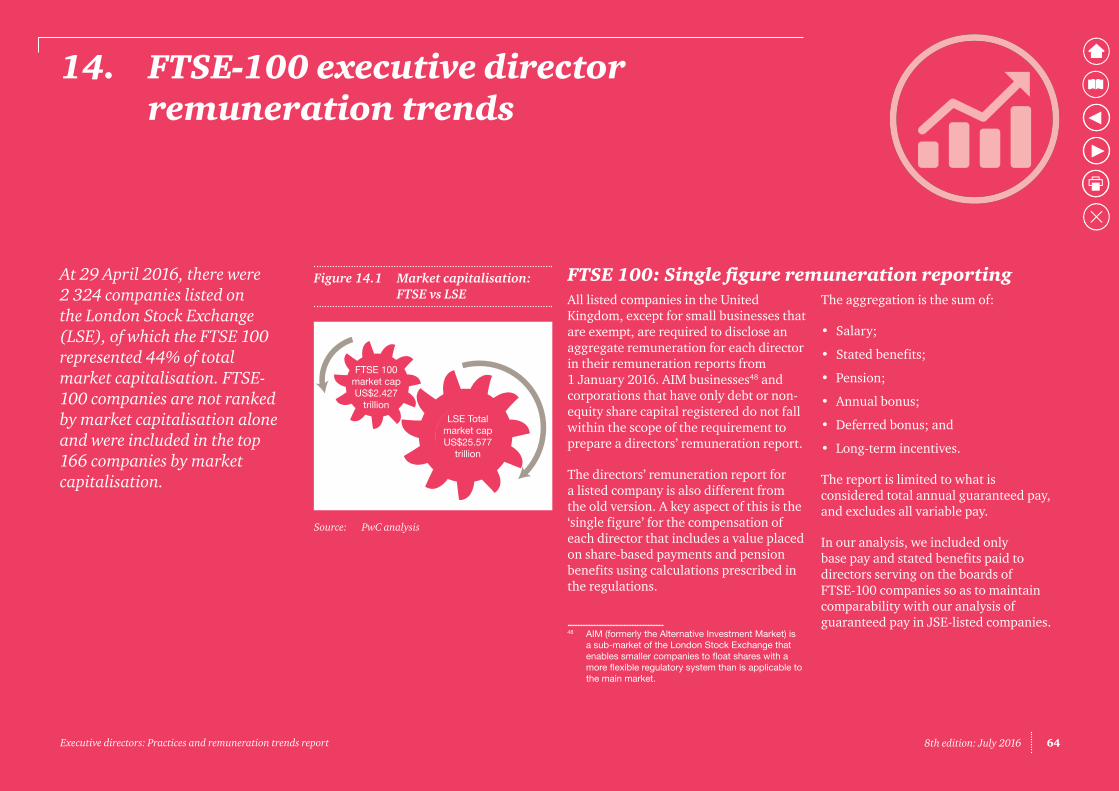
648th edition: July 2016 Executive directors: Practices and remuneration trends report
14. FTSE-100 executive director remuneration trends
At 29 April 2016, there were 2 324companieslistedonthe London Stock Exchange (LSE),ofwhichtheFTSE 100represented 44% of total market capitalisation. FTSE-100 companies are not ranked by market capitalisation alone and were included in the top 166 companies by market capitalisation.
Figure 14.1 Market capitalisation: FTSE vs LSE
Source: PwC analysis
FTSE 100market capUS$2.427
trillionLSE Total
market capUS$25.577
trillion
All listed companies in the United Kingdom, except for small businesses that are exempt, are required to disclose an aggregate remuneration for each director in their remuneration reports from 1 January 2016. AIM businesses48 and corporations that have only debt or non-equity share capital registered do not fall within the scope of the requirement to prepare a directors’ remuneration report.
The directors’ remuneration report for a listed company is also different from the old version. A key aspect of this is the ‘single figure’ for the compensation of each director that includes a value placed on share-based payments and pension benefits using calculations prescribed in the regulations.
48 AIM (formerly the Alternative Investment Market) is a sub-market of the London Stock Exchange that enables smaller companies to float shares with a more flexible regulatory system than is applicable to the main market.
FTSE 100: Single figure remuneration reportingThe aggregation is the sum of:
• Salary;
• Stated benefits;
• Pension;
• Annual bonus;
• Deferred bonus; and
• Long-term incentives.
The report is limited to what is considered total annual guaranteed pay, and excludes all variable pay.
In our analysis, we included only base pay and stated benefits paid to directors serving on the boards of FTSE-100 companies so as to maintain comparability with our analysis of guaranteed pay in JSE-listed companies.

658th edition: July 2016
14. FTSE-100 executive director remuneration trends
Executive directors: Practices and remuneration trends report
The trends reflected are extracted from the annual reports of the most recent FTSE-100 participants. Historical data has been excluded since the selection of companies in the index changes quarterly.
Figure 14.2 FTSE 100 sector profile
Source: PwC analysis
9%
24%
26%
41%
Basic resourcesFinancial services
IndustrialsServices
All sectors
Figure 14.3 All positions: Base pay and stated benefits (US$’000s)
Source: PwC analysis
Figure 14.4 CEO: Base pay and stated benefits (US$’000s)
1 5011 037 759
Upper quartileMedianLower quartile
2015
1 9951 4761 049
Upper quartileMedianLower quartile
2015
Source: PwC analysis

668th edition: July 2016
14. FTSE-100 executive director remuneration trends
Executive directors: Practices and remuneration trends report
Figure 14.5 CFO: Base pay and stated benefits (US$’000s)
Source: PwC analysis
1 172 938 696
Upper quartileMedianLower quartile
2015
Figure 14.6 ED: Base pay and stated benefits (US$’000s)
Source: PwC analysis
1 396 962 667
Upper quartileMedianLower quartile
2015

678th edition: July 2016
14. FTSE-100 executive director remuneration trends
Executive directors: Practices and remuneration trends report
Basic resources
Figure 14.7 All positions: Base pay and stated benefits (US$’000s)
Source: PwC analysis
Figure 14.8 CEO: Base pay and stated benefits (US$’000s)
Source: PwC analysis
1 9411 080 909
Upper quartileMedianLower quartile
2015
4 7842 6132 003
Upper quartileMedianLower quartile
2015
Figure 14.9 CFO: Base pay and stated benefits (US$’000s)
Source: PwC analysis
Figure 14.10 ED: Base pay and stated benefits (US$’000s)
Source: PwC analysis
6 8211 292 985
Upper quartileMedianLower quartile
2015
1 214 985 848
Upper quartileMedianLower quartile
2015

688th edition: July 2016
14. FTSE-100 executive director remuneration trends
Executive directors: Practices and remuneration trends report
Financial servicesFigure 14.11 All positions: Base pay and stated benefits (US$’000s)
Source: PwC analysis
Figure 14.12 CEO: Base pay and stated benefits (US$’000s)
Source: PwC analysis
20151 633 964 691
Upper quartileMedianLower quartile
2 1011 5651 311
Upper quartileMedianLower quartile
2015
Figure 14.13 CFO: Base pay and stated benefits (US$’000s)
Source: PwC analysis
Figure 14.14 ED: Base pay and stated benefits (US$’000s)
Source: PwC analysis
1 290 913 691
Upper quartileMedianLower quartile
2015
1 072 774 608
Upper quartileMedianLower quartile
2015

698th edition: July 2016
14. FTSE-100 executive director remuneration trends
Executive directors: Practices and remuneration trends report
IndustrialsFigure 14.15 All positions: Base pay and stated benefits (US$’000s)
Source: PwC analysis
Figure 14.16 CEO: Base pay and stated benefits (US$’000s)
Source: PwC analysis
1 6301 131 877
Upper quartileMedianLower quartile
2015
2 0141 6071 094
Upper quartileMedianLower quartile
2015
Figure 14.17 CFO: Base pay and stated benefits (US$’000s)
Source: PwC analysis
Figure 14.18 ED: Base pay and stated benefits (US$’000s)
Source: PwC analysis
1 267 977 774
Upper quartileMedianLower quartile
2015
1 4641 054 736
Upper quartileMedianLower quartile
2015

708th edition: July 2016
14. FTSE-100 executive director remuneration trends
Executive directors: Practices and remuneration trends report
Services sectorFigure 14.19 All positions: Base pay and stated benefits (US$’000s)
Source: PwC analysis
Figure 14.20 CEO: Base pay and stated benefits (US$’000s)
Source: PwC analysis
1 3701 009 724
Upper quartileMedianLower quartile
2015
1 5491 2791 035
Upper quartileMedianLower quartile
2015
Figure 14.21 CFO: Base pay and stated benefits (US$’000s)
Source: PwC analysis
Figure 14.22 ED: Base pay and stated benefits (US$’000s)
Source: PwC analysis
1 042 926 677
Upper quartileMedianLower quartile
2015
1 316 970 606
Upper quartileMedianLower quartile
2015

718th edition: July 2016 Executive directors: Practices and remuneration trends report
15. Remuneration trends in other African countries
There are 54 independent countries in Africa, of which 29 have stock exchanges. Most African stock exchanges are fledgling markets. Others are regional exchanges and do not represent any particular country. This edition marks the second year in which we analyse trends in executive directors’ remuneration in sub-Saharan Africa.
Included in our analysis are 401 companies listed across seven sub-Saharan Africa stock exchanges. Data remains thin due to a lack of transparent reporting.
Bourses included in our analysis
• Botswana
• Ghana
• Kenya
• Namibia
• Nigeria
• Tanzania
• Uganda
Figure 15.1 Sectoral breakdown of companies analysed
Source: PwC analysis
16%
37%
32%
15%
Basic resourcesFinancial services
IndustrialsServices

728th edition: July 2016
15. Remuneration trends in other African countries
Executive directors: Practices and remuneration trends report
Sub-Saharan stock exchanges analysed
Algeria
Tunisia
Egypt
Sudan
SouthSudan
Mauritania NigerChad Eritrea
Ethiopia
Central
African Republic
KenyaUga
nda
DemocraticRepublicof Congo
Camer
oon
Nigeria
Benin
Togo
Gha
naCôted’Ivoire
Burkin
a
Faso
Liberia
Sierra Leone
Guinea
SenegalGambia
Guinea Bissau
Gabon
Con
go
Angola
Zambia
Malaw
i
Moz
ambi
que
Zimbabwe
NamibiaBotswana
SouthAfrica
Lesotho
0 500 1000 Nautical Miles
Swaziland
Mad
agas
car
Mauritius
Comoros
Seychelles
Mayotte
Cape Verde
Morocco
Mali
Somali
a
Djibouti
Rwanda
Burundi
Tanzania
Libya
Reunion
Equatorial Guinea
São Tomé and Príncipe
Seven African Stock Exchanges examined
Data analysedTo maintain comparability to total guaranteed pay reported for JSE-listed companies, for purposes of this report we have viewed only the base pay and those stated benefits, where disclosed, paid to directors serving on the boards of African companies.
Remuneration sector analysis by country is not yet possible given the lack of information and the small number of listed entities in each sector.
For countries selected, further granularity is drawn to reflect the remuneration paid to the following executives:
• CEOs;
• CFOs; and
• EDs.
Values have all been converted into US dollars, using the closing dollar spot rate after midnight on the 29 April 2016.
Figure 15.2 Selected stock exchanges: Number of companies listed by sector
Source: PwC analysis
Botswana
16
2
6
11
Financial services Industrials Services Basic resources
Ghana
12
16
5
7
Kenya
22
20
15
6
Namibia
20
7
3
9
Nigeria
62
74
23
29
Tanzania
7
7
3
3
Uganda
8
4
4

738th edition: July 2016
15. Remuneration trends in other African countries
Executive directors: Practices and remuneration trends report
TGP for all selected stock exchanges
TGP for all 401 companies, where good data is available, is analysed in Figure 15.3, in quartiles.
Figure 15.3 TGP of EDs in selected stock exchanges (USD ’000s)
Base: 401 companies listed on seven sub-Saharan stock exchanges Source: PwC analysis
CEO 2014 CEO 2015 CFO 2014 CFO 2015 ED 2014 ED 2015
322 254 220 223 223 195245 234 174 176 173 162204 196 128 133 130 135
Upper quartileMedianLower quartile
Remuneration of executive directors by country
Figure 15.4 Botswana: TGP (USD ’000s)
Base: 35 companies listed on the Botswana Stock Exchange Source: PwC analysis
CEO 2014 CEO 2015 CFO 2014 CFO 2015 ED 2014 ED 2015
231 241 141 147 177 189198 209 125 133 154 153168 162 110 112 120 119
Upper quartileMedianLower quartile

748th edition: July 2016
15. Remuneration trends in other African countries
Executive directors: Practices and remuneration trends report
Figure 15.5 Ghana: TGP (USD ’000s)
Base: 40 companies listed on the Ghana Stock Exchange Source: PwC analysis
Figure 15.6 Kenya: TGP (USD ’000s)
CEO 2014 CEO 2015 CFO 2014 CFO 2015 ED 2014 ED 2015
204 211 137 140 172 182 191 196 121 122 138 144 153 162 110 115 115 119
Upper quartileMedianLower quartile
CEO 2014 CEO 2015 CFO 2014 CFO 2015 ED 2014 ED 2015
224 234 121 142 114 120185 186 105 111 98 101153 157 85 92 86 90
Upper quartileMedianLower quartile
Figure 15.7 Namibia: TGP (USD ’000s)
Base: 39 companies listed on the Namibian Stock Exchange Source: PwC analysis
Figure 15.8 Nigeria: TGP (USD ’000s)
CEO 2014 CEO 2015 CFO 2014 CFO 2015 ED 2014 ED 2015
303 304 195 209 203 209262 272 164 175 180 187203 200 145 153 156 153
Upper quartileMedianLower quartile
CEO 2014 CEO 2015 CFO 2014 CFO 2015 ED 2014 ED 2015
341 345 246 252 259 263292 307 213 219 213 220246 250 181 190 179 183
Upper quartileMedianLower quartile
Base: 63 companies listed on the Nairobi Stock Exchange Source: PwC analysis
Base: 188 companies listed on the Nigerian Stock Exchange Source: PwC analysis

758th edition: July 2016
15. Remuneration trends in other African countries
Executive directors: Practices and remuneration trends report
Figure 15.9 Tanzania: TGP (USD ’000s)
Base: 20 companies listed on the Dar es Salaam Stock Exchange Source: PwC analysis
CEO 2014 CEO 2015 CFO 2014 CFO 2015 ED 2014 ED 2015
356 308 214 221 230 241 350 290 195 190 189 197 279 257 153 154 158 161
Upper quartile MedianLower quartile
Figure 15.10 Uganda: TGP (USD ’000s)
Base: 16 companies listed on the Uganda Securities Exchange Source: PwC analysis
CEO 2014 CEO 2015 CFO 2014 CFO 2015 ED 2014 ED 2015
176 185 146 148 159 162152 157 127 129 136 135141 150 108 119 110 119
Upper quartileMedianLower quartile

768th edition: July 2016 Executive directors: Practices and remuneration trends report
16. Appendices
The South African marketplace
About PwC Acknowledgements Contacts

778th edition: July 2016
16. Appendices
Executive directors: Practices and remuneration trends report
South African companies360
AltX49
Basic resources56
Financial services92
Industrial133
Services50
Forestry andpaper
3
Banking6
Autos & parts2
Healthcare5
Industrial metals& mining
8
Developmentcapital
10
Beverages5
Media7
Mining45
General finances25
Chemicals6
Pharmaceuticals4
Insurance10
Constructionmaterials
19
Retail21
Investmentinstruments
14
Food producers15
Tele-Communications
4
Real estate30
Industrial goods& services
37
Travel & leisure9
Oil & gas5
Personal goods7
Technology17
The South African marketplace

788th edition: July 2016
16. Appendices
Executive directors: Practices and remuneration trends report
About PwCAt PwC we apply our industry knowledge and professional expertise to identify, report, protect, realise and create value for our clients and their stakeholders.
The strength of this value proposition is based on the breadth and depth of the firm’s client relationships. Networks are built around clients to provide them with our collective knowledge and resources. Our international network, experience, industry knowledge and business understanding are used to build trust and create value for clients.
We are committed to making PwC distinctive through consistent behaviours that enable the success of our clients and people. We call this the PwC Experience and it shapes the way in which we interact with clients, with one another and with the communities in which we operate. This, along with our core values of Teamwork, Leadership and Excellence – and our strong Code of Conduct – guides us in all that we do.
AcknowledgementsWe would like to thank the following for their valuable contribution to this report:
• Martin Hopkins – Director, PwC
• Karen Crous – Associate Director, PwC
• Anelisa Keke – Consultant, PwC
• Dave Yzelle – Independent project researcher
• PwC UK
• PwC US
ContactsFor more information about the issues raised in this report, please contact:
• Gerald Seegers +27 11 797 4560 [email protected]
• Martin Hopkins +27 11 797 5535 [email protected]
• Karen Crous +27 11 797 4616 [email protected]
• Julia Fourie +27 21 529 2170 [email protected]
For media enquiries, please contact:
• Sonja Nel +27 11 797 4207 [email protected]

The information contained in this publication is provided for general information purposes only, and does not constitute the provision of legal or professional advice in any way. Before making any decision or taking any action, a professional adviser should be consulted. No responsibility for loss to any person acting or refraining from action as a result of any material in this publication can be accepted by the author, copyright owner or publisher.
This publication has been prepared for general guidance on matters of interest only, and does not constitute professional advice. You should not act upon the information contained in this publication without obtaining specific professional advice. No representation or warranty (express or implied) is given as to the accuracy or completeness of the information contained in this publication, and, to the extent permitted by law, PricewaterhouseCoopers Inc, its subsidiary and associated companies and entities and their respective directors, employees agents and subcontractors do not accept or assume any liability, responsibility or duty of care for any consequences of you or anyone else acting, or refraining to act, in reliance on the information contained in this publication or for any decision based on it.
© 2016 PricewaterhouseCoopers (“PwC”), a South African firm, PwC is part of the PricewaterhouseCoopers International Limited (“PwCIL”) network that consists of separate and independent legal entities that do not act as agents of PwCIL or any other member firm, nor is PwCIL or the separate firms responsible or liable for the acts or omissions of each other in any way. No portion of this document may be reproduced by any process without the written permission of PwC. (16-19007)