Evaluation of Data Fusion in Radars Network and Determination of Optimum Algorithm
17
International Journa l of UbiComp (IJU), Vol.2, No.4, October 2011 DOI:10.5121/iju.2011.2405 51 E VALUATION OF D ATA FUSION IN R ADARS NETWORK AND DETERMINATION OF OPTIMUM A LGORITHM Ali Naseri and Omid Azmoon Department of Information and Communications Technology, Imam Hossein University, Tehran, Iran [email protected],[email protected] A BSTRACT Functionality of radars network strongly depends on data fusion algorithms. Because of ambiguous in radar backscatter, probability of detection is an important parameter in choosing optimized algorithm. Radar gating and swerling of targets are two fundamental parameters for probability of detection. In this paper, three custom data fusion algorithms, Averaging, Bayesian and Dempster-Shafer are simulated. Results are compared by simulated radar input data, and evaluated by convergence, precious, influence of fluctuations, running time and complexity of implementation. Results of evaluation declare Dempater- Shafer algorithm is optimized for two-cell network. In four-cell network, if radars outputs are mass functions directly, hierarchical topology with Dempater-Shafer algorithm in both layers will be optimize. When radars outputs are probability, because of pignistic transform in radar output and inverse pignistic transform in radar input, hierarchical topology with Average algorithm in first layer and Bayesian algorithm in second layer will be optimize. K EYWORDS Radars Network, Data Fusion, Averaging, Bayesian, Dempster-Shafer 1. INTRODUCTION Today any radar can be find that not linked to a network. Radars network has several purposes and applications for army and civil demands, like air defence, hydrology, and air traffic control. Moreover, radars network covers vast aims from information fusion to refuse unwanted parameters. Correctness of functionality of radars network strongly depends on data fusion of cells of radars. Some data fusion algorithms in radar have explained like PDA (Probability Data Association), MHT (Multiple Hypotheses Tracking) and IMM (Interacting Multiple Model). In radars network, the received data from radars have different precious. Therefore, data must be fuse by suitable weight. Probability of correctness of data is an important parameter of weighting. Many efforts have made to extract data in radars with extreme precious. Nevertheless, some subjects generate ambiguous, like swerling of targets, white noise and clatter, jamming,
-
Upload
ijujournal -
Category
Documents
-
view
226 -
download
0
Transcript of Evaluation of Data Fusion in Radars Network and Determination of Optimum Algorithm

8/3/2019 Evaluation of Data Fusion in Radars Network and Determination of Optimum Algorithm
http://slidepdf.com/reader/full/evaluation-of-data-fusion-in-radars-network-and-determination-of-optimum-algorithm 1/17

8/3/2019 Evaluation of Data Fusion in Radars Network and Determination of Optimum Algorithm
http://slidepdf.com/reader/full/evaluation-of-data-fusion-in-radars-network-and-determination-of-optimum-algorithm 2/17
International Journal of UbiComp (IJU), Vol.2, No.4, October 2011
52
quantization and colour noises from communications channels. Classic, Bayesian and Dempster-Shafer or Evidence reasoning are three custom algorithms that usually use for probability fusion.Classic algorithms use statistical methods or Boolean algebra, like majority voting or averaging.Bayesian algorithms use stochastic processing and estimation methods, and fuse data byprobability of events. Bayes equation is the base of them. Evidence algorithms fuse data by
possibility of events, and Dempster-Shafer theory is the base of them. Of course, some otheralgorithms have prepared to use in sensors network, like fuzzy logic, neural networks or imageprocessing algorithms [1]. In continue, important concepts of fusion and data extraction in radarhave described.
1.1. Data Fusion Principles
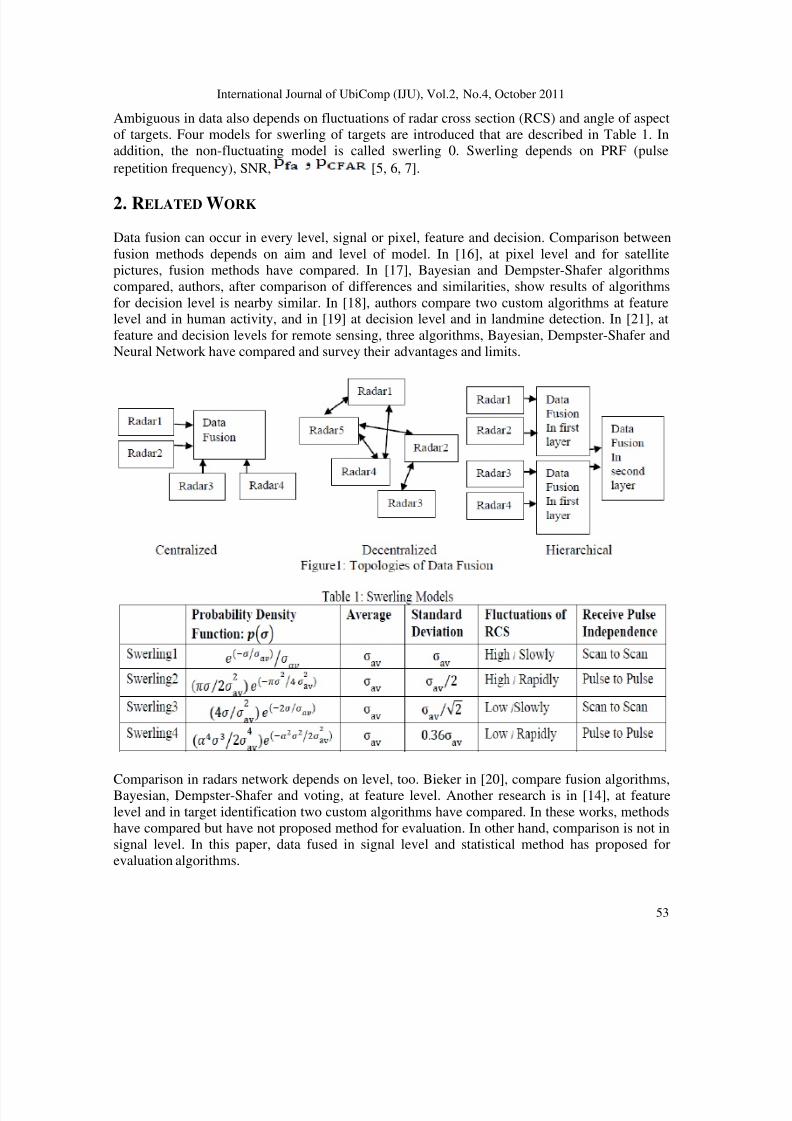
The methods of fusion classify to four types, across sensors, attributes, domains, and time. Forcommunications between sensors, three methods of configuration have classified;complementary, it means sensors do several duties in same time and complete one demand;cooperative, it means sensors do one duty in several time and complete one demand; competitive,it means sensors do one duty in same time and complete one demand. In addition, three models of topologies have classified; centralized, decentralized and hierarchical, they are illustrated infigure 1. Selection of topology depends on missions and applications. Some models of data fusionhave also developed, like JDL, multiple-sensors integration and waterfall. All models commonlyhave three levels, signal or pixel, feature and decision. Choosing model depends on processingpower and aim of networking [2, 3].
1.2. Data extraction in radar
Data in Radars have ambiguous. Sources of ambiguous are in backscatter signals. Receivedpower depends on transmitted power; if signals send in high power, received signals will havehigh SNR (Signal to Noise Ratio). Also received signals contain noises. Received noises
generally are composition of false alarm probability from white noise and constant falsealarm ratio ( ) from clatter. is little number. There are methods to minimize it, likeintegration of received pulses. Also there are technics for removing clatter influences. Othernoises generate in network, like signal quantization that is type of color noises and attempts havemade to remove them by special Kalman filters. Nevertheless, reported results always haveambiguous. It means there is difference between posterior and measured data. If the measured
distance and angle are Rmand θm ,and the estimated distance and angle are Rp and θp , and
and are variances of (Rp – Rm) and (θp – θm) respectively, Normalized Gating will be:
If Maximum of normalized gating is G, it must be d<G. If coordinates are M dimensions andevery components change by Gaussian probability density function, sum of M Gaussianprobability density functions will equal to Chi-square by M degrees of freedom According[4] probability of observation of targets in ellipsoidal gate, when coordinates have twodimensions, is equal to:
8/3/2019 Evaluation of Data Fusion in Radars Network and Determination of Optimum Algorithm
http://slidepdf.com/reader/full/evaluation-of-data-fusion-in-radars-network-and-determination-of-optimum-algorithm 3/17
International Journal of UbiComp (IJU), Vol.2, No.4, October 2011
53
Ambiguous in data also depends on fluctuations of radar cross section (RCS) and angle of aspectof targets. Four models for swerling of targets are introduced that are described in Table 1. Inaddition, the non-fluctuating model is called swerling 0. Swerling depends on PRF (pulserepetition frequency), SNR, [5, 6, 7].
2. RELATED WORK
Data fusion can occur in every level, signal or pixel, feature and decision. Comparison betweenfusion methods depends on aim and level of model. In [16], at pixel level and for satellitepictures, fusion methods have compared. In [17], Bayesian and Dempster-Shafer algorithmscompared, authors, after comparison of differences and similarities, show results of algorithmsfor decision level is nearby similar. In [18], authors compare two custom algorithms at featurelevel and in human activity, and in [19] at decision level and in landmine detection. In [21], atfeature and decision levels for remote sensing, three algorithms, Bayesian, Dempster-Shafer andNeural Network have compared and survey their advantages and limits.
Comparison in radars network depends on level, too. Bieker in [20], compare fusion algorithms,Bayesian, Dempster-Shafer and voting, at feature level. Another research is in [14], at featurelevel and in target identification two custom algorithms have compared. In these works, methodshave compared but have not proposed method for evaluation. In other hand, comparison is not insignal level. In this paper, data fused in signal level and statistical method has proposed forevaluation algorithms.
8/3/2019 Evaluation of Data Fusion in Radars Network and Determination of Optimum Algorithm
http://slidepdf.com/reader/full/evaluation-of-data-fusion-in-radars-network-and-determination-of-optimum-algorithm 4/17
International Journal of UbiComp (IJU), Vol.2, No.4, October 2011
54
3. DATA FUSION ALGORITHMS
Some algorithms are prepared in fuzzy logic, expert systems, neural networks and imageprocessing, for sensors network. Three custom algorithms, Classic, Bayesian and Dempster-
Shafer usually use for radars network [1]. These algorithms survey for two-cell and four-cellnetwork with centralized and hierarchical topologies. In this network, fusion type is sensory,configuration is competitive, and data are fused in signal level. Probability of detection of targetis named is NOT of it. Reported probability in nth step and ith radar is andresult of fusion in nth step is
3.1. Classic Algorithm
Statistical methods and Boolean algebra have used for data fusion like majority voting oraveraging from received data [8]. In this paper, data are fused by averaging. Two-cell fusion isnamed C and four-cell fusion with centralized topology is named C4. Fusion of N radars in nthstep is equal to:
3.2. Bayesian algorithm
Two-cell fusion by Bayesian algorithm is named B and four-cell fusion with centralized topologyis named B4. Bayes equation is:
In Bayes equation, if probability of detection of target is A and probability of received data is B,probability of detection in fusion node will be equal to [9]:
Fusion of N radars in nth step is equal to:
Where:

8/3/2019 Evaluation of Data Fusion in Radars Network and Determination of Optimum Algorithm
http://slidepdf.com/reader/full/evaluation-of-data-fusion-in-radars-network-and-determination-of-optimum-algorithm 5/17
International Journal of UbiComp (IJU), Vol.2, No.4, October 2011
55
And value in first step is:
3.3. Dempster-Shafer or Evidence algorithm
Two-cell fusion by Evidence algorithm is named D and four-cell fusion with centralized topologyis named D4. Some radars and sensors explain their outputs by possibility. For description of Dempster-Shafer or Evidence reasoning [9], A1, A2,….An are members of θ (frame of discernment). θ has 2n subsets that a number between (0, 1) is assigned to them and it is calledmass function; m ({Ai,…,A j}), where:
If two witnesses describe an event,m1(A) from first person and m2(A) from second person arefused by Shafer equation:
N mass functions are fused by Yager equation:
For comparison between Bayesian and Dempster-Shafer results, transformation is needed. Massfunction transfers to probability domain by pignistic transform [10]:
That | Ai| is number of Ai members. Many methods have proposed for probability to massfunction transformation. The custom method is inverse pignistic transform that is described bybelow algorithm [11]. For θ = { A1,A2,…,An}, possibility density function is defined:

8/3/2019 Evaluation of Data Fusion in Radars Network and Determination of Optimum Algorithm
http://slidepdf.com/reader/full/evaluation-of-data-fusion-in-radars-network-and-determination-of-optimum-algorithm 6/17
International Journal of UbiComp (IJU), Vol.2, No.4, October 2011
56
Where these functions must be monotonic:
Mass functions are equal to:
3.4. Algorithms for hierarchical topology
Another type of topology in radars network is hierarchical. Composite algorithms are named byalgorithms are used in layers. If classic algorithm is used in both layers, it will be named CC.According to [15] results of CC algorithm are equal to C4. If data is fused in both layers byBayesian algorithm, it will be named BB and by Dempster-Shafer algorithm, it will be namedDD. According to [15], if values of BB and B4 in their first steps are equal, results of algorithmswill equal, and if mass functions in all radars are simple mass functions, results of algorithms willequal (if θ has only one member, mass functions are called simple). Difference between CC andC4, BB and B4, DD and D4 is in running time and complexity of implementation. If first andsecond layers fusion are classic and Bayesian algorithm respectively, it will name CB. Others willname similarly; for Bayesian-classic algorithm BC, for classic-evidence algorithm CD, forevidence-classic algorithm DC, for Bayesian-evidence algorithm BD and for evidence-Bayesianalgorithm DB.
4. SIMULATION AND COMPARISON DATA FUSION ALGORITHMS FOR
RADARS NETWORK
According to radar gating and swerling of targets, probability of detection of radars is simulatedby MATLAB and is compared by radar simulator results in [12]. Data fusion also is simulated.Simulated scenario is surveillance radars signals in L band that contains target backscatter data.Range of target is 150km, velocity is 200 m/s, and height is 1000m. RCS and SNR are about 10m2 and 7 dB, respectively. False alarm with clatter is 10-6. Radars arrangement is serial thatmeans target move with consistent distance from radars in simulation time. Radars have 2
dimensions and G=10. Duration of simulation is 2 minutes and 25 scans. Every scan is integrationof 16 pulses. First for two-cell network, (R1, R2), target is assumed by swerling 0 and radarsdetect trajectory of it. Then scenario is repeated by swerling 1 to 4, respectively. It must be attendswerling 0, 1 and 3 are simulated for 25 scans that every scan is integration of 16 pulses and areillustrated in figures 2, 3 and 4. Swerling 2 and 4 also are simulated for 400 pulses and areillustrated in figures 5 and 6. For better view, initial forty samples are illustrated. Simulation isrepeated for swerling 1 to 4 for five times and averages and standard deviations of results of simulations are summarized in table 2. Then scenario is repeated for four-cell network (R1, R2,

8/3/2019 Evaluation of Data Fusion in Radars Network and Determination of Optimum Algorithm
http://slidepdf.com/reader/full/evaluation-of-data-fusion-in-radars-network-and-determination-of-optimum-algorithm 7/17
International Journal of UbiComp (IJU), Vol.2, No.4, October 2011
57
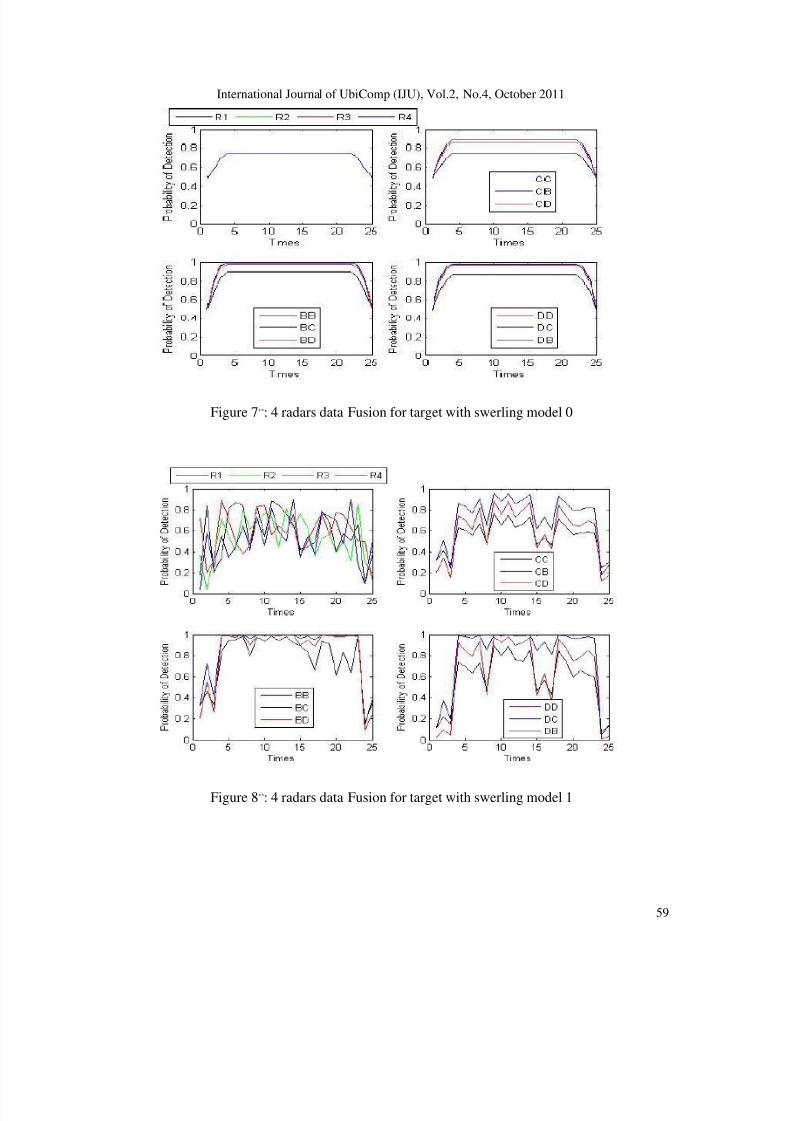
R3, R4). Results of fusion are illustrated in figures 7 to 11. Simulation is run for swerling 1 to 4for five times and averages and standard deviations of results of simulations are summarized intable 3. It must be attend, in algorithms with Dempster-Shafer equations, mass functions arederived from inverse pignistic transform and then data are fused, results of fusion are transferredto probability domain by pignistic transform and are illustrated for comparison.
Figure 2*: 2 radars data Fusion for target with swerling model 0
Figure 3*: 2 radars data Fusion for target with swerling model 1

8/3/2019 Evaluation of Data Fusion in Radars Network and Determination of Optimum Algorithm
http://slidepdf.com/reader/full/evaluation-of-data-fusion-in-radars-network-and-determination-of-optimum-algorithm 8/17
International Journal of UbiComp (IJU), Vol.2, No.4, October 2011
58
Figure 4*: 2 radars data Fusion for target with swerling model 2
Figure 5*: 2 radars data Fusion for target with swerling model 3
Figure 6*: 2 radars data Fusion for target with swerling model 4
8/3/2019 Evaluation of Data Fusion in Radars Network and Determination of Optimum Algorithm
http://slidepdf.com/reader/full/evaluation-of-data-fusion-in-radars-network-and-determination-of-optimum-algorithm 9/17
International Journal of UbiComp (IJU), Vol.2, No.4, October 2011
59
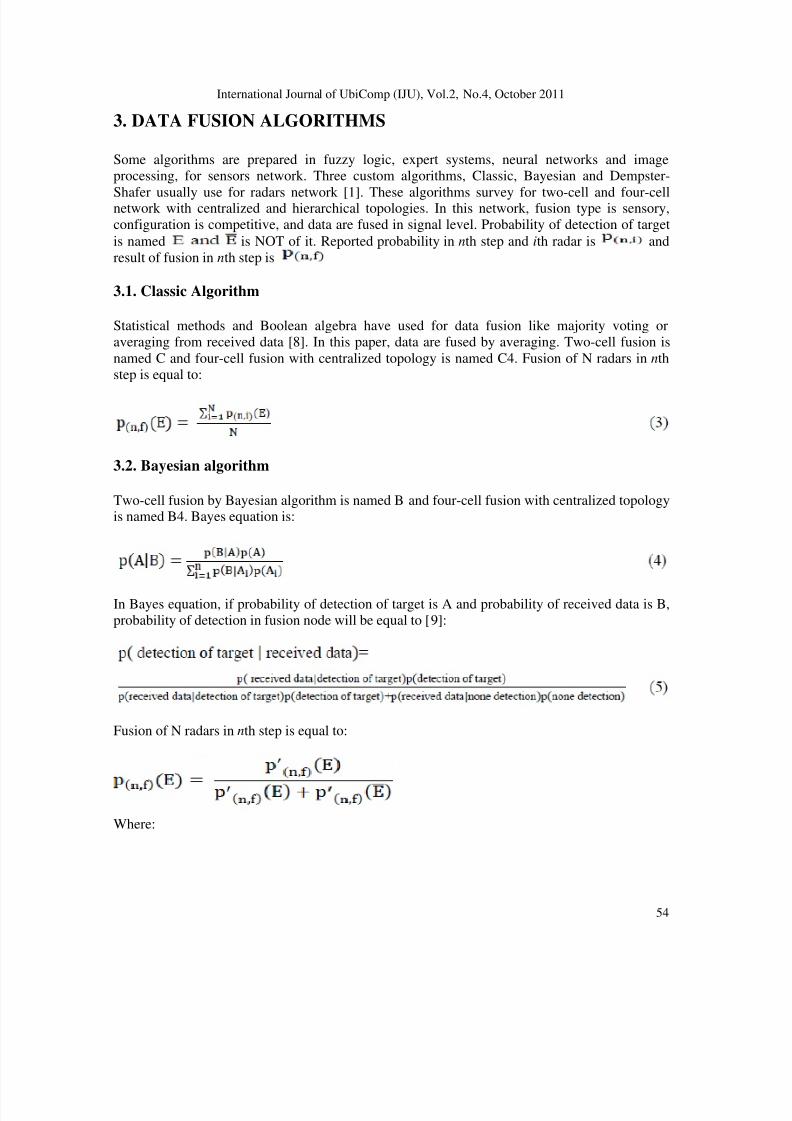
Figure 7**: 4 radars data Fusion for target with swerling model 0
Figure 8**: 4 radars data Fusion for target with swerling model 1

8/3/2019 Evaluation of Data Fusion in Radars Network and Determination of Optimum Algorithm
http://slidepdf.com/reader/full/evaluation-of-data-fusion-in-radars-network-and-determination-of-optimum-algorithm 10/17
International Journal of UbiComp (IJU), Vol.2, No.4, October 2011
60
Figure 9**: 4 radars data Fusion for target with swerling model 2
Figure 10**: 4 radars data Fusion for target with swerling model 3
8/3/2019 Evaluation of Data Fusion in Radars Network and Determination of Optimum Algorithm
http://slidepdf.com/reader/full/evaluation-of-data-fusion-in-radars-network-and-determination-of-optimum-algorithm 11/17
International Journal of UbiComp (IJU), Vol.2, No.4, October 2011
61
Figure 11**: 4 radars data Fusion for target with swerling model 4*: Left Up- Radars Probability of detection, Left Down – Fusion of Probabilities of detection by 2algorithms, Right Up – Radars Decision, Right Dow – Fusion of Decisions by 2 algorithms**: Left Up- Radars Probability of detection, Left Down – Fusion of Probabilities of detection byBB-BC-BD, Right Up – Fusion of Probabilities of detection by CC-CB-CD, Right Dow – Fusionof Probabilities of detection by DD-DC-DB
5. EVALUATION OF DATA FUSION ALGORITHMS FOR RADARS NETWORK
Five criterions are assumed; convergence, precious, fluctuations, running time and complexity of implementation. These criterions can compare performance of algorithms.
8/3/2019 Evaluation of Data Fusion in Radars Network and Determination of Optimum Algorithm
http://slidepdf.com/reader/full/evaluation-of-data-fusion-in-radars-network-and-determination-of-optimum-algorithm 12/17
International Journal of UbiComp (IJU), Vol.2, No.4, October 2011
62
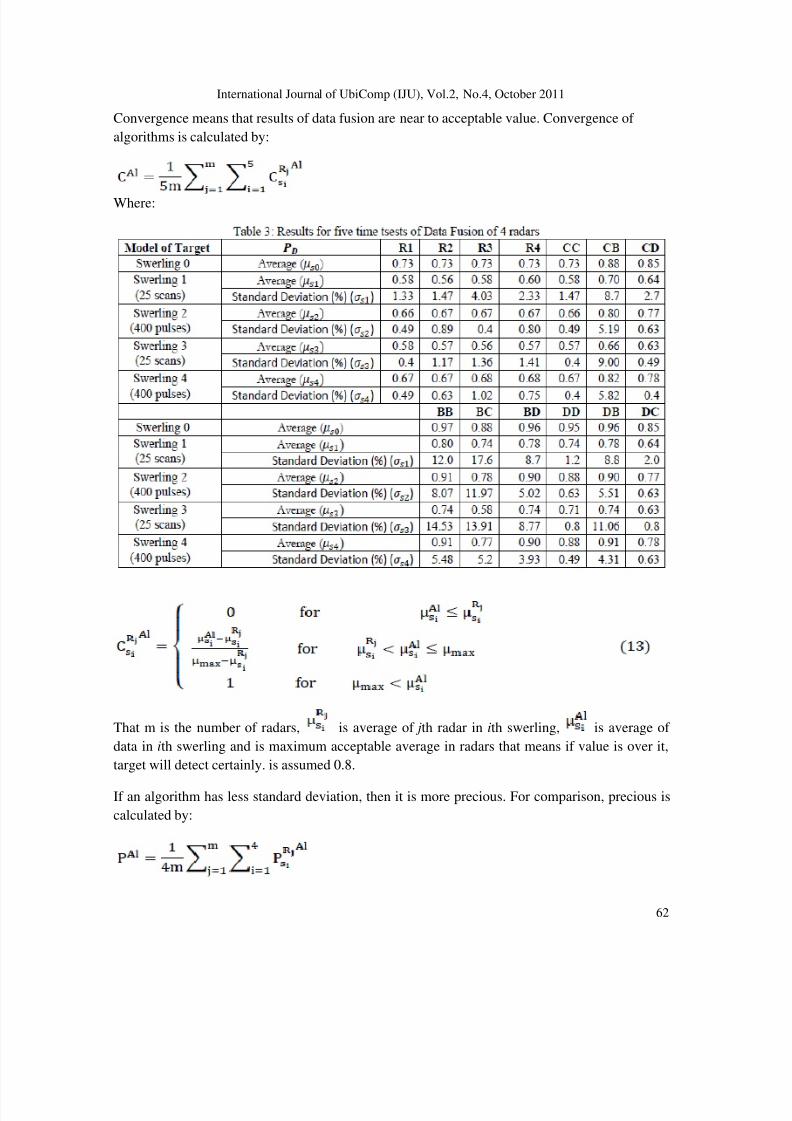
Convergence means that results of data fusion are near to acceptable value. Convergence of algorithms is calculated by:
Where:
That m is the number of radars, is average of jth radar in ith swerling, is average of data in ith swerling and is maximum acceptable average in radars that means if value is over it,target will detect certainly. is assumed 0.8.
If an algorithm has less standard deviation, then it is more precious. For comparison, precious iscalculated by:

8/3/2019 Evaluation of Data Fusion in Radars Network and Determination of Optimum Algorithm
http://slidepdf.com/reader/full/evaluation-of-data-fusion-in-radars-network-and-determination-of-optimum-algorithm 13/17
International Journal of UbiComp (IJU), Vol.2, No.4, October 2011
63
Where:
That is standard deviation of jth radar in ith swerling, is standard deviation of data inith swerling and Pmax is maximum acceptable standard deviation. Pmax is assumed 20%.
8/3/2019 Evaluation of Data Fusion in Radars Network and Determination of Optimum Algorithm
http://slidepdf.com/reader/full/evaluation-of-data-fusion-in-radars-network-and-determination-of-optimum-algorithm 14/17
International Journal of UbiComp (IJU), Vol.2, No.4, October 2011
64
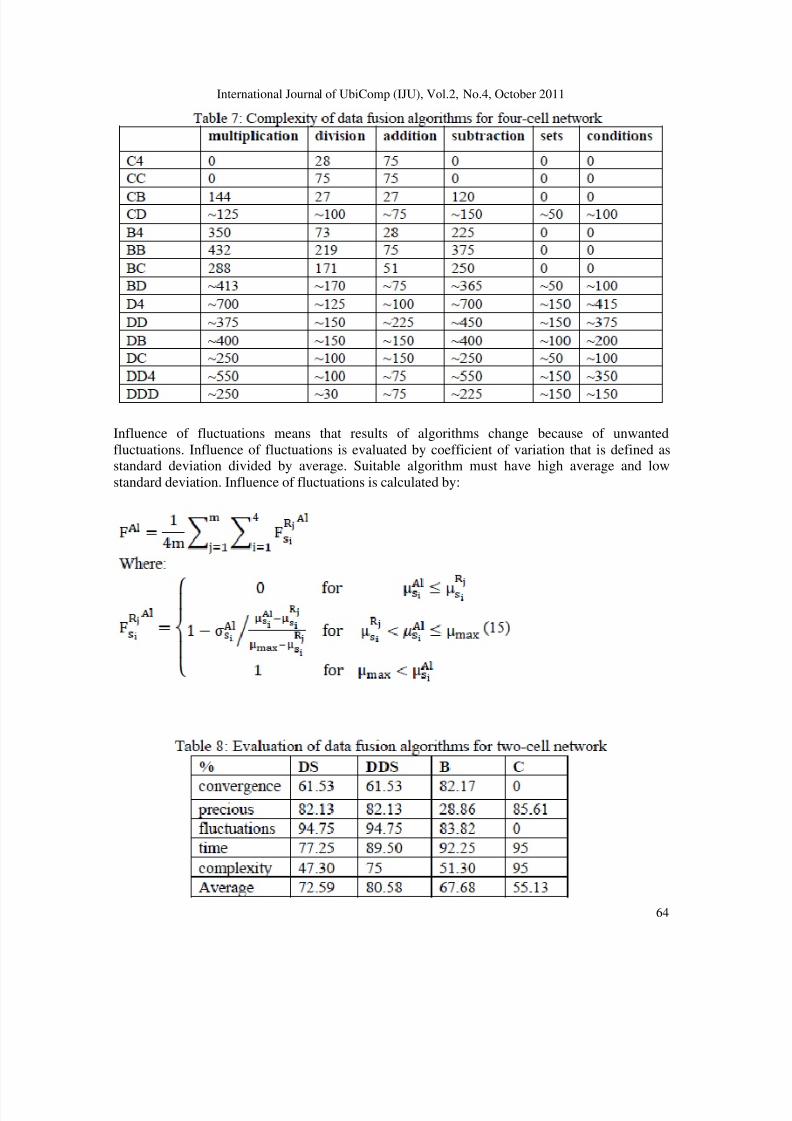
Influence of fluctuations means that results of algorithms change because of unwantedfluctuations. Influence of fluctuations is evaluated by coefficient of variation that is defined asstandard deviation divided by average. Suitable algorithm must have high average and lowstandard deviation. Influence of fluctuations is calculated by:

8/3/2019 Evaluation of Data Fusion in Radars Network and Determination of Optimum Algorithm
http://slidepdf.com/reader/full/evaluation-of-data-fusion-in-radars-network-and-determination-of-optimum-algorithm 15/17
International Journal of UbiComp (IJU), Vol.2, No.4, October 2011
65
Time of operation is assigned to some process, like network implementation or data transmission.Suitable time for detection process in simulated scenario is 2 to 4 seconds [13]. In same conditionof processing for all algorithms, scenario run for swerling 0 and time is measured. For evidencealgorithm, time of pignistic and inverse pignistic transform is calculated too. If radars outputs canbe mass functions directly, because of evidence algorithm, time will be decrease. This conditionfor two-cell network is named Direct Dempster-Shafer or DDS. For four-cell network is namedDD4 and DDD.
Results for two-cell and four-cell network with 10% error are summarized in table 4 and 5. If i Al
is running time, Imin is minimum and Imax is maximum of acceptable time, expression of suitabletime in percentage is:
According [14] complexity of implementation is expressed and compared by sum of
addition/subtraction, multiplication/division, conditions and relations of sets. Results aresummarized in tables 6 and 7. Because of conditions and relations of sets, calculations of mathematical operations for evidence algorithms are approximated. For two-cell network, sum of row of table 5 are calculated and results are mapped from (0, 1000) to (0, 100%) and for four-cellnetwork results are mapped from (0, 2000) to (0, 100%).
It must be attend running time is not similar with complexity of implementation, because of relations of sets for evidence algorithms.

8/3/2019 Evaluation of Data Fusion in Radars Network and Determination of Optimum Algorithm
http://slidepdf.com/reader/full/evaluation-of-data-fusion-in-radars-network-and-determination-of-optimum-algorithm 16/17
International Journal of UbiComp (IJU), Vol.2, No.4, October 2011
66
Evaluation of algorithms is summarized in table 8 for two-cell network and table 9 for four-cellnetwork. Linear optimization is considered by same weight for five parameters and is calculatedaverage. For two-cell network, direct Dempster-Shafer is optimized. For four-cell network, if radars outputs are probability, CB algorithm will optimized, and if radars outputs are mass
function directly, DDD algorithm will optimized.
Networks with more cells and complicated conditions must survey independently.
6. CONCLUSION
In this paper, custom data fusion algorithms, Averaging, Bayesian and Dempster-Shafer aresimulated and evaluated. First probability of detection of targets have generated according toradar gating and swerling of targets. Then the generated data have fused by described algorithmsand evaluated by five criterions, convergence, precious, influence of fluctuations, running timeand complexity of implementation. Results of evaluation declare Dempater-Shafer algorithm isoptimized for two-cell network. For four-cell network, if radars outputs are mass functionsdirectly, hierarchical topology with Dempater-Shafer algorithm in both layers will be optimized,and when radars outputs are only probability, pignistic transform is needed for radars outputs andinverse pignistic transform for radars inputs, then hierarchical topology with Average andBayesian algorithms in first and second layers, respectively, will optimized.
REFERENCE
[1] P. V l n, É. Bossé, A. Jou n, “A rborn ppl t on of nform t on fus on l or thms to l ss f t on”, DefenceR&D Canada - DRDC Valcartier TR 2004-282, 2006.
[2] H.Mitchell, "Multi-Sensor Data Fusion, An Introduction", Part I ,Chapter 3, Springer, 2007.
[3] A.Klausner, A.Tengg, B.Rinner, “D str but Mult l v l D t Fus on for Networked Embedded Syst ms”,IEEE Journ l of S l t Top s n S n l Pro ss n , 2008.
[4] S.Blackman, “Mult -Target Tracking with Ra r Appl t ons”, Art h Hous , 1986.
[5] M.Skoln k, “Intro u t on to R r Syst ms”, M Gr w-Hill, 1981.
[6] S.Bo qu t, “C l ul t on of R r Prob b l ty of D t t on n K-Distributed Sea Clutter and No s ”, DSTOAustr l , 2011.
[7] M.R h r s, “G n r t n Sw rl n R n om S qu n s”, 2008.
[8] T.Bieker, “St t st l Ev lu t on of D s on-Level Fusion Methods for Non-Cooperative Target I by R r Sn tur s”, IEEE 11th Int rn t on l Conference on Information Fusion, 2008.
[9] D.Koks, S.Challa, “An Intro u t on to B y s n n D mpst r Sh f r D t Fus on”, DSTO Australia, 2005.
[10] P.Smets, R.Kennes, “Th tr nsf r b l f mo l”, In Symbol n Qu nt t t v Appro h s to Uncertainty,Springer, 1991.
[11] A.Aregui, T.Denoeux, “Constru t n Conson nt B l f Fun t ons from S mpl D t us n Confi n S ts of P nst Prob b l t s”, Centrede Recherche de Royallieu, 2008.

8/3/2019 Evaluation of Data Fusion in Radars Network and Determination of Optimum Algorithm
http://slidepdf.com/reader/full/evaluation-of-data-fusion-in-radars-network-and-determination-of-optimum-algorithm 17/17
International Journal of UbiComp (IJU), Vol.2, No.4, October 2011
67
[12] H.V rsm ss n, “Stu y of th P rform n D r t on of th B l n S-band Air Surveillance Radars due to th Intrf r n of Up om n 4G T hnolo s, T st R port”, IE-RPT-00357-008 Test Report Study BIPT -Public.odt, Edition Date: 24 Jun 2011.
[13] J.Roux,J,Vuur n, “R l-t m Thr t Ev lu t on n Groun B s A r D f ns Env ronm nt”, ORION
Volume24(1), pp.75-101, 2008.[14] D.Bu , P.G r r , “A T r t I nt f t on Comp r son of B y s n n D mpst r–Shafer Multi-S nsor Fus on”,
IEEE Tr ns t ons on Syst ms, Man and Cybernetics, 1997.
[15] O.Azmoon, “Survey of Radars Networking Algorithms and Propose Optimum Algorithm”, Thesisfor the Degree of M.S.. Department of Information and Communications Technology, Imam HosseinUniversity, 2011.
[16] K.Khoshelhama, S.Nedkova, C.Nardinocchi, “A Comparison of Bayesian and Evidence-BasedFusion Methods for Automated Building Detection in Aerial Data”, The International Archives of the Photogrammetry, Remote Sensing and Spatial Information Sciences. Vol. XXXVII. Part B7.Beijing, 2008.
[17] B.Cobb, P.Shenoy, “A Comparison of Bayesian and Belief Function Reasoning”, InformationSystems Frontiers, Vol. 5, No. 4, pp. 345–358. Dec. 2003.
[18] A.Tolstikovi, et al. “Comparison of fusion methods based on DST and DBN in human activityrecognition”, J Control Theory Appl 2011 9(1) 18–27, 2011.
[19] F.Cremer, et al. “A Comparison of Decision Level Sensor Fusion Methods for Anti-personnelLandmine Detection”, Elsevier, Information Fusion 2, 187-208, 2001.
[20] T.Bieker, “Comparison of Fusion Methods for Successive Declarations of Radar Range”, IEEEInternational Conference on Information Fusion, 2005.
[21] Y.Zeng, J.Zhang, J.Genderen, “Comparison and Analysis of Remote Sensing Data Fusion
Techniques at Feature and Decision Levels”, International Journal of Remote Sensing,2004.
Authors
Ali Naseri is Professor of Department of Information and CommunicationsTechnology, and Chair for Faculty of Information Processing of Imam HosseinUniversity. He has after twenty years research experience in processing andcomputing fields and radar processing. Dr Naseri is also an advisor of Informationand Communications Technology Ministry of Iran.
Omid Azmoon is Master engineer of Department of Information andCommunications Technology of Imam Hossein University. He has after ten yearsresearch experience. His researches has focused on data fusion in radars network. Hecurrently works in Iran Communications Industries.