Energy Technology Perspectives 2010eneken.ieej.or.jp/data/3481.pdf · ©OECD/IEA -2010 Energy...
32
© OECD/IEA - 2010 Energy Technology Perspectives 2010 IEEJ, Tokyo 4 November 2010 Dr Peter Taylor Head, Energy Technology Policy Division IEEJ: November 2010
Transcript of Energy Technology Perspectives 2010eneken.ieej.or.jp/data/3481.pdf · ©OECD/IEA -2010 Energy...
© OECD/IEA - 2010
Energy Technology Perspectives 2010
IEEJ, Tokyo4 November 2010
Dr Peter TaylorHead, Energy Technology Policy Division
IEEJ: November 2010
2 0 1 0
ENERGYTECHNOLOGYPERSPECTIVES
Scenarios &Strategiesto 2050
© OECD/IEA - 2010
The context
Need a global energy technology revolution to meet climate change and energy security challenges.
Some early signs of progress, but much more needs to be done.
Which technologies can play a role?
What are the costs and benefits?
What policies are needed?
IEEJ: November 2010
2 0 1 0
ENERGYTECHNOLOGYPERSPECTIVES
Scenarios &Strategiesto 2050
© OECD/IEA - 2010
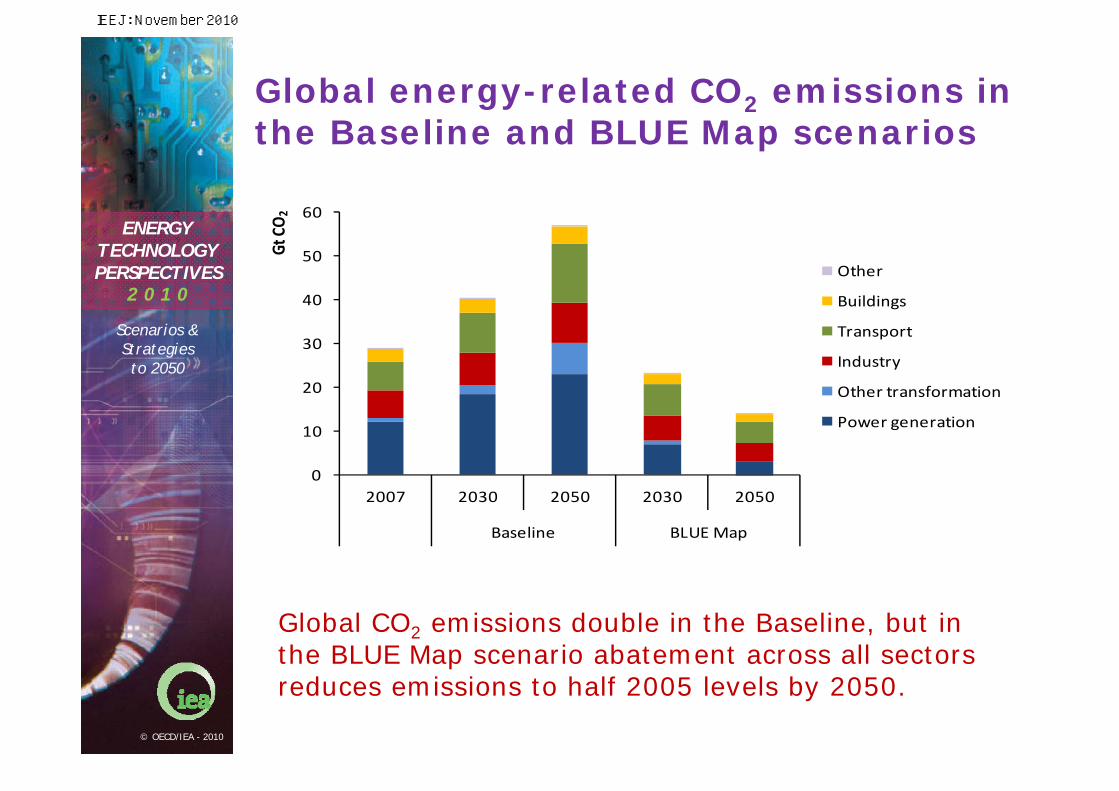
Global energy-related CO2 emissions in the Baseline and BLUE Map scenarios
0
10
20
30
40
50
60
2007 2030 2050 2030 2050
Baseline BLUE Map
Gt CO2
Other
Buildings
Transport
Industry
Other transformation
Power generation
Global CO2 emissions double in the Baseline, but in the BLUE Map scenario abatement across all sectors reduces emissions to half 2005 levels by 2050.
IEEJ: November 2010
2 0 1 0
ENERGYTECHNOLOGYPERSPECTIVES
Scenarios &Strategiesto 2050
© OECD/IEA - 2010
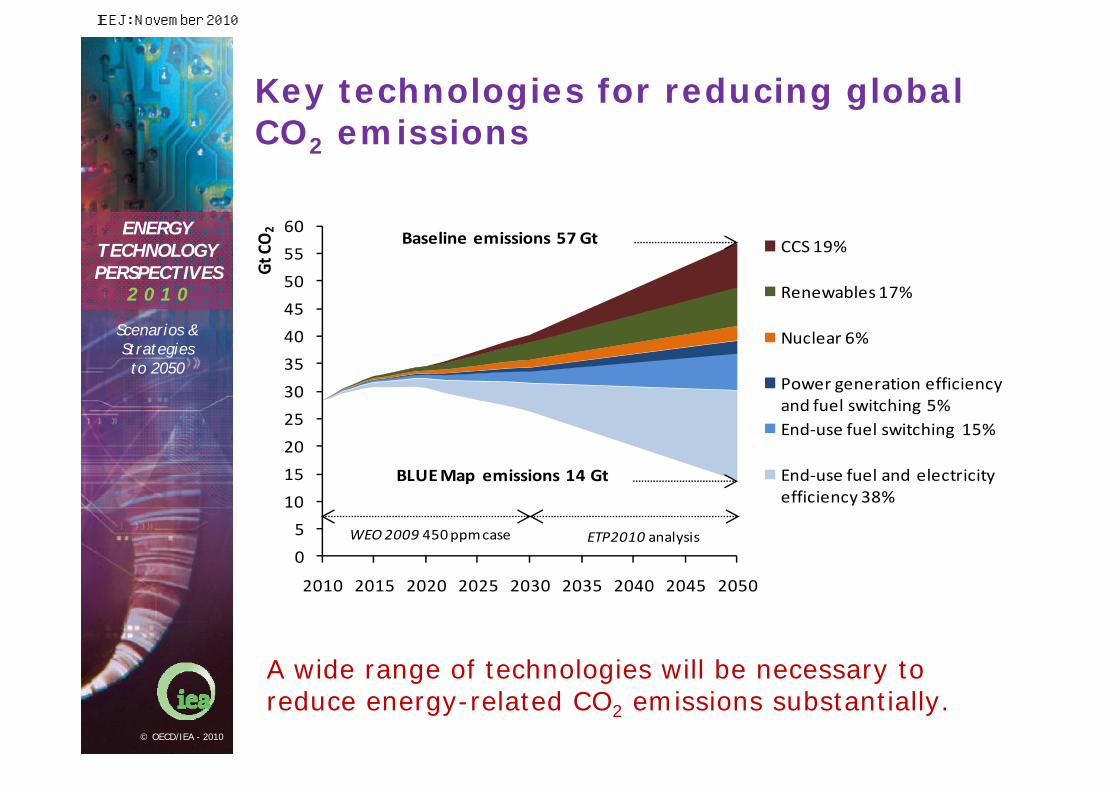
Key technologies for reducing global CO2 emissions
A wide range of technologies will be necessary to reduce energy-related CO2 emissions substantially.
0
5
10
15
20
25
30
35
40
45
50
55
60
2010 2015 2020 2025 2030 2035 2040 2045 2050
Gt CO2
CCS 19%
Renewables 17%
Nuclear 6%
Power generation efficiency and fuel switching 5%End‐use fuel switching 15%
End‐use fuel and electricity efficiency 38%
BLUE Map emissions 14 Gt
Baseline emissions 57 Gt
WEO 2009 450 ppmcase ETP2010 analysis
IEEJ: November 2010

2 0 1 0
ENERGYTECHNOLOGYPERSPECTIVES
Scenarios &Strategiesto 2050
© OECD/IEA - 2010
Primary energy demand by fuel and by scenario
By 2050, coal, oil and gas demand are all lower than today under the BLUE Map scenario.
0
1 000
2 000
3 000
4 000
5 000
6 000
7 000
8 000
Mtoe 2007 Baseline 2050 BLUE Map 2050
‐27%
‐36%
IEEJ: November 2010
2 0 1 0
ENERGYTECHNOLOGYPERSPECTIVES
Scenarios &Strategiesto 2050
© OECD/IEA - 2010
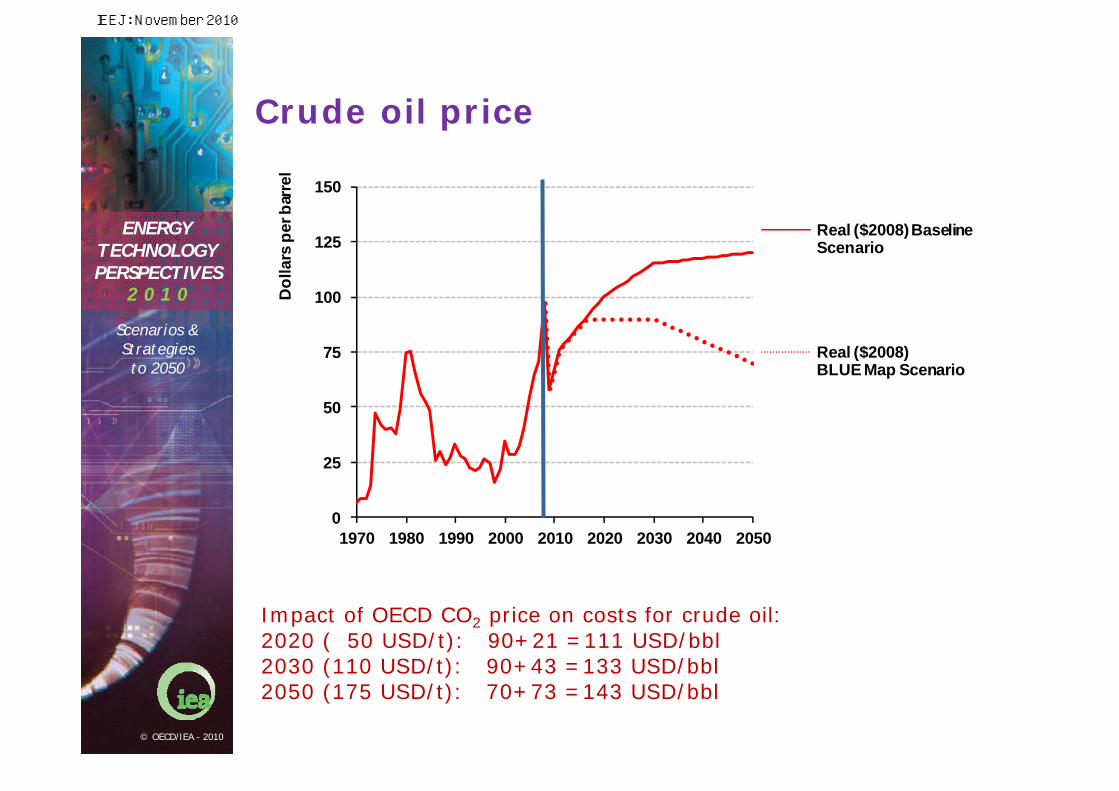
Crude oil price
Impact of OECD CO2 price on costs for crude oil:2020 ( 50 USD/t): 90+21 =111 USD/bbl 2030 (110 USD/t): 90+43 =133 USD/bbl2050 (175 USD/t): 70+73 =143 USD/bbl
0
25
50
75
100
125
150
1970 1980 1990 2000 2010 2020 2030 2040 2050
Dol
lars
per
bar
rel
Real ($2008) Baseline Scenario
Real ($2008) BLUE Map Scenario
IEEJ: November 2010
2 0 1 0
ENERGYTECHNOLOGYPERSPECTIVES
Scenarios &Strategiesto 2050
© OECD/IEA - 2010
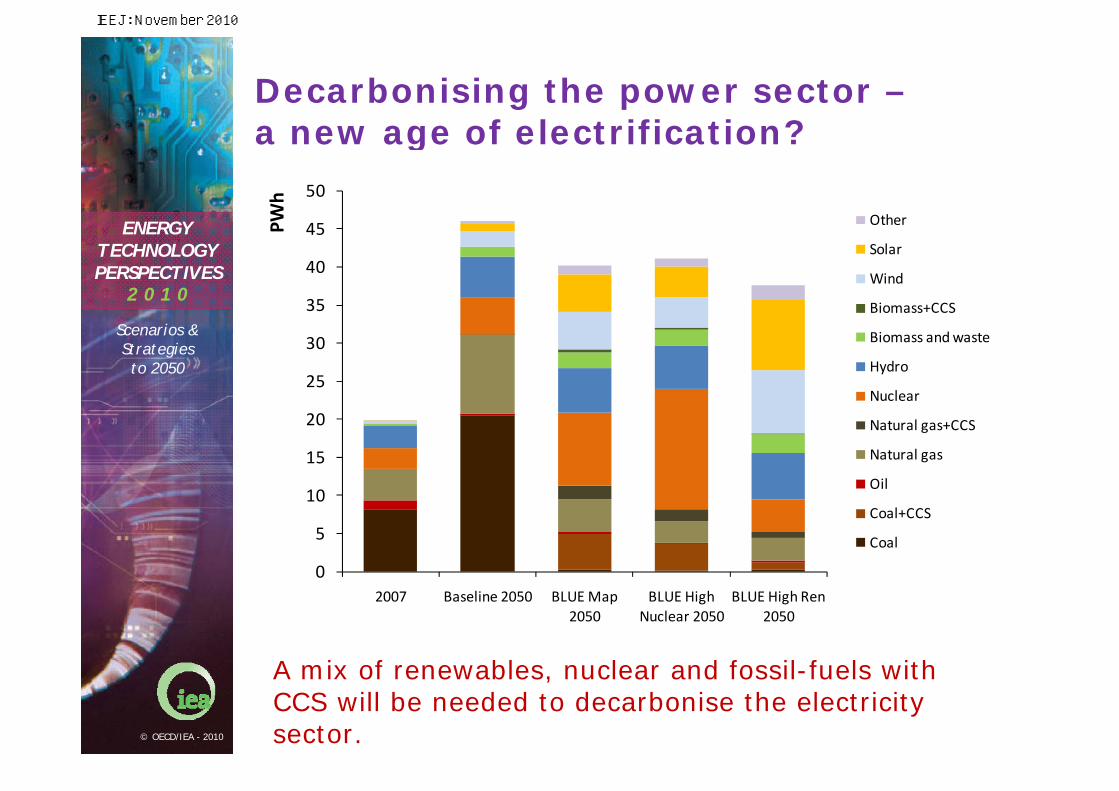
Decarbonising the power sector –a new age of electrification?
A mix of renewables, nuclear and fossil-fuels with CCS will be needed to decarbonise the electricity sector.
0
5
10
15
20
25
30
35
40
45
50
2007 Baseline 2050 BLUE Map 2050
BLUE High Nuclear 2050
BLUE High Ren 2050
PWh
Other
Solar
Wind
Biomass+CCS
Biomass and waste
Hydro
Nuclear
Natural gas+CCS
Natural gas
Oil
Coal+CCS
Coal
IEEJ: November 2010
2 0 1 0
ENERGYTECHNOLOGYPERSPECTIVES
Scenarios &Strategiesto 2050
© OECD/IEA - 2010
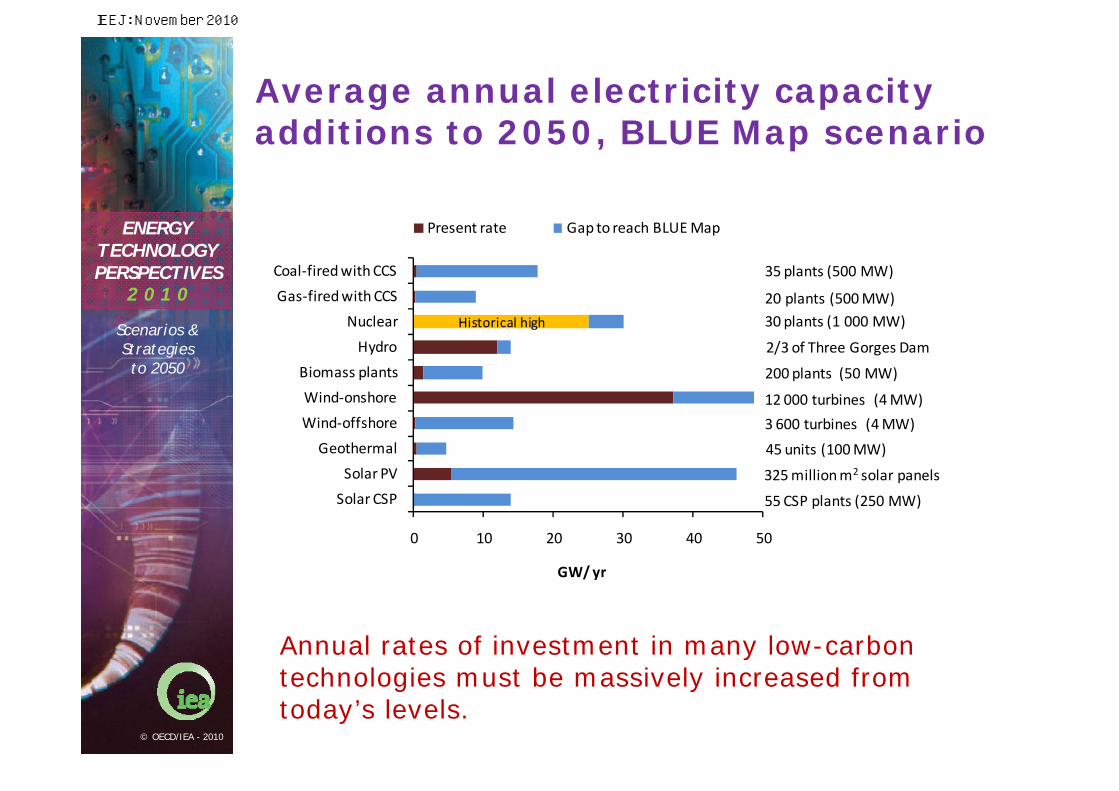
Average annual electricity capacity additions to 2050, BLUE Map scenario
Annual rates of investment in many low-carbon technologies must be massively increased from today’s levels.
0 10 20 30 40 50
Solar CSP
Solar PV
Geothermal
Wind‐offshore
Wind‐onshore
Biomass plants
Hydro
Nuclear
Gas‐fired with CCS
Coal‐fired with CCS
GW/ yr
Present rate Gap to reach BLUE Map
30 plants (1 000 MW)
200 plants (50 MW)
12 000 turbines (4 MW)
3 600 turbines (4 MW)
45 units (100 MW)
55 CSP plants (250 MW)
325 million m2 solar panels
2/3 of Three Gorges Dam
35 plants (500 MW)
20 plants (500 MW)
Historical high
IEEJ: November 2010
2 0 1 0
ENERGYTECHNOLOGYPERSPECTIVES
Scenarios &Strategiesto 2050
© OECD/IEA - 2010
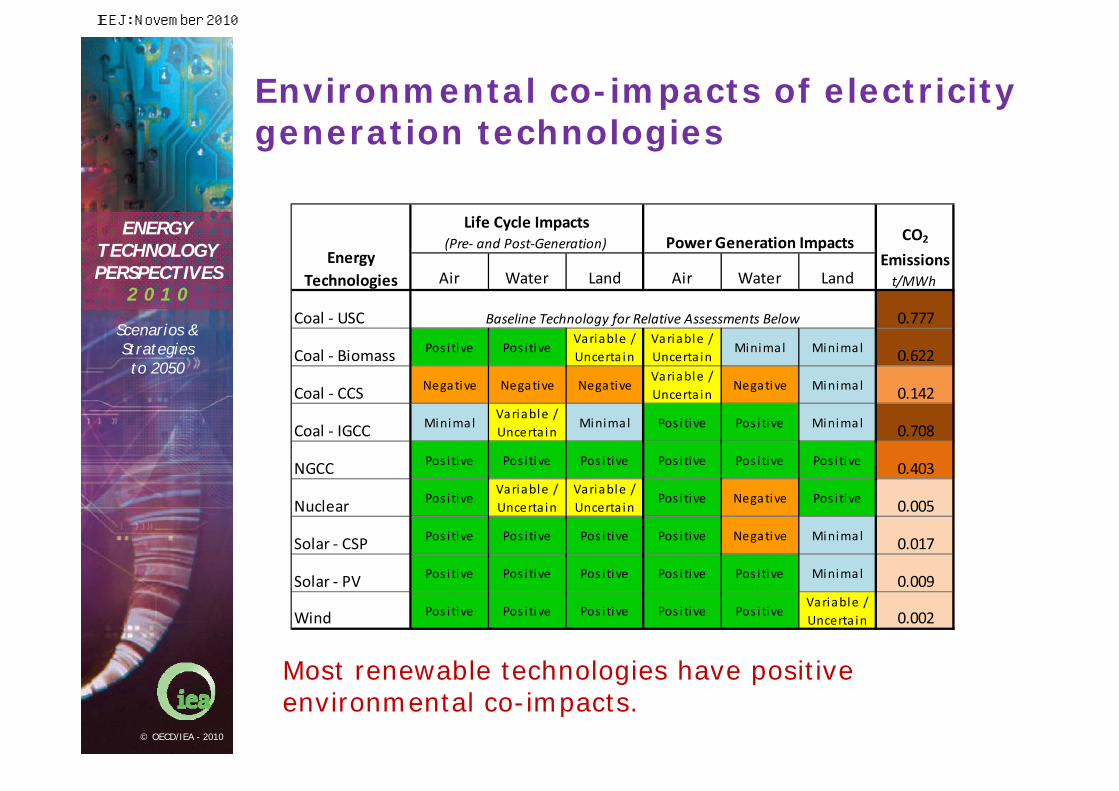
Environmental co-impacts of electricity generation technologies
Most renewable technologies have positive environmental co-impacts.
Air Water Land Air Water Land
Coal ‐ USC 0.777
Coal ‐ Biomass Pos i tive Pos i tiveVariable /Uncerta in
Variable /Uncerta in
Minimal Minimal 0.622
Coal ‐ CCS Negative Negative NegativeVariable /Uncerta in
Negative Minimal 0.142
Coal ‐ IGCC MinimalVariable /Uncerta in
Minimal Pos i tive Pos i tive Minimal 0.708
NGCC Pos itive Pos i tive Pos i tive Pos i tive Pos i tive Pos i tive 0.403
Nuclear Pos i tiveVariable /Uncerta in
Variable /Uncerta in
Pos i tive Negative Pos i tive 0.005
Solar ‐ CSP Pos itive Pos i tive Pos i tive Pos i tive Negative Minimal 0.017
Solar ‐ PV Pos itive Pos i tive Pos i tive Pos i tive Pos i tive Minimal 0.009
Wind Pos itive Pos i tive Pos i tive Pos i tive Pos i tiveVariable /Uncerta in 0.002
CO2
Emissionst/MWh
Energy Technologies
Baseline Technology for Relative Assessments Below
Life Cycle Impacts(Pre‐ and Post‐Generation) Power Generation Impacts
IEEJ: November 2010

2 0 1 0
ENERGYTECHNOLOGYPERSPECTIVES
Scenarios &Strategiesto 2050
© OECD/IEA - 2010
Smart grid CO2 reductions in 2050
Smart grids allow better management of the grid and can facilitate the deployment of low-carbon technologies, such as renewables and electric vehicles.
0.00
0.25
0.50
0.75
1.00
1.25
1.50
1.75
2.00
2.25
2.50
Direct reductions Enabled reductions
Greater integration of renewables
Facilitation of electric vehicles and plug‐in electric vehicles
Energy savings from peak load management
Continuous commissioning of service sector loads
Accelerated deployment of energy efficiency programs
Reduced line losses (voltage control)
Direct feedback on energy usage
0.34‐ 0.69
0.31‐ 0.62
0.09‐ 0.27
0.03‐ 0.25
0.01‐ 0.05
0.00‐ 0.01
0.07‐ 0.27
Gt CO
2/ yr
IEEJ: November 2010

2 0 1 0
ENERGYTECHNOLOGYPERSPECTIVES
Scenarios &Strategiesto 2050
© OECD/IEA - 2010
Additional investment and fuel savings, 2010-2050
Even using a 10% discount rate, fuel savings in the BLUE Map scenario more than offset the additional investment required.
‐140
‐120
‐100
‐80
‐60
‐40
‐20
0
20
40
60
Investmen
t
Fuel savings
USD
trillion (2010‐2050)
Commercial
Residential
Transport
Industry
Power distribution
Power transmission
Power generation
Biomass and waste
Natural gas
Oil
CoalUnd
iscoun
ted
3% discoun
t
10% discoun
t
Total
IEEJ: November 2010
2 0 1 0
ENERGYTECHNOLOGYPERSPECTIVES
Scenarios &Strategiesto 2050
© OECD/IEA - 2010
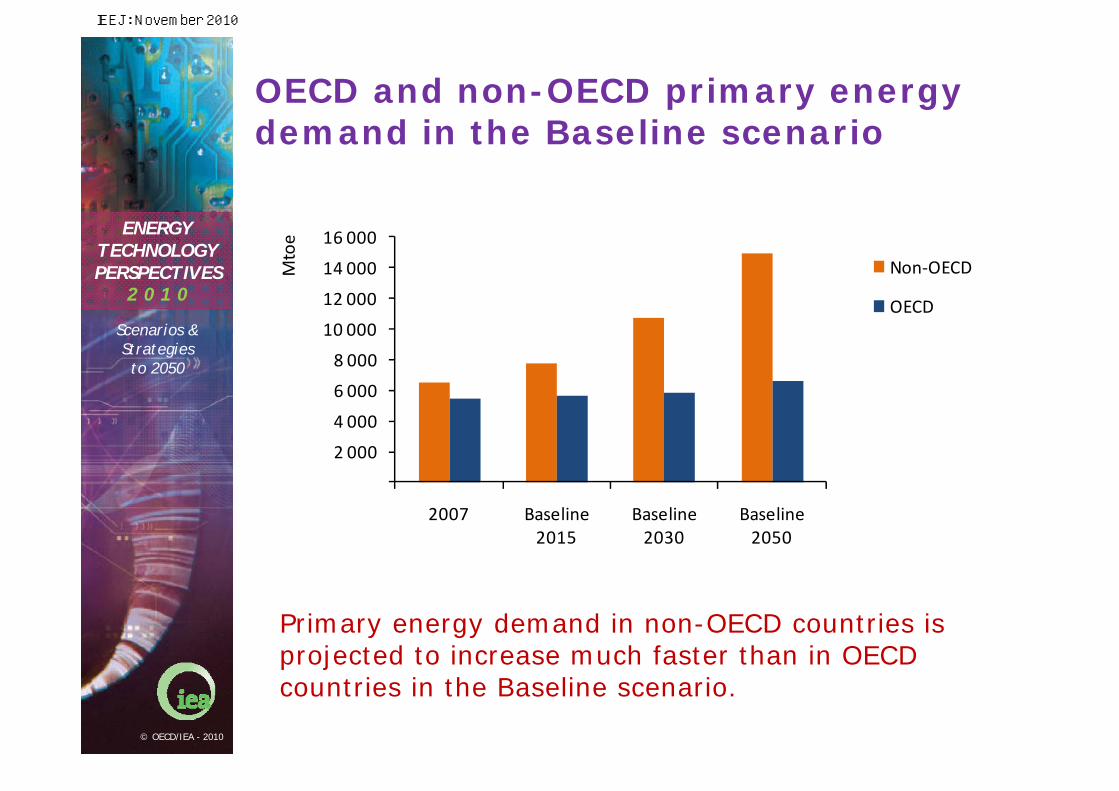
OECD and non-OECD primary energy demand in the Baseline scenario
Primary energy demand in non-OECD countries is projected to increase much faster than in OECD countries in the Baseline scenario.
2 000
4 000
6 000
8 000
10 000
12 000
14 000
16 000
2007 Baseline 2015
Baseline 2030
Baseline 2050
Mtoe
Non‐OECD
OECD
IEEJ: November 2010
2 0 1 0
ENERGYTECHNOLOGYPERSPECTIVES
Scenarios &Strategiesto 2050
© OECD/IEA - 2010
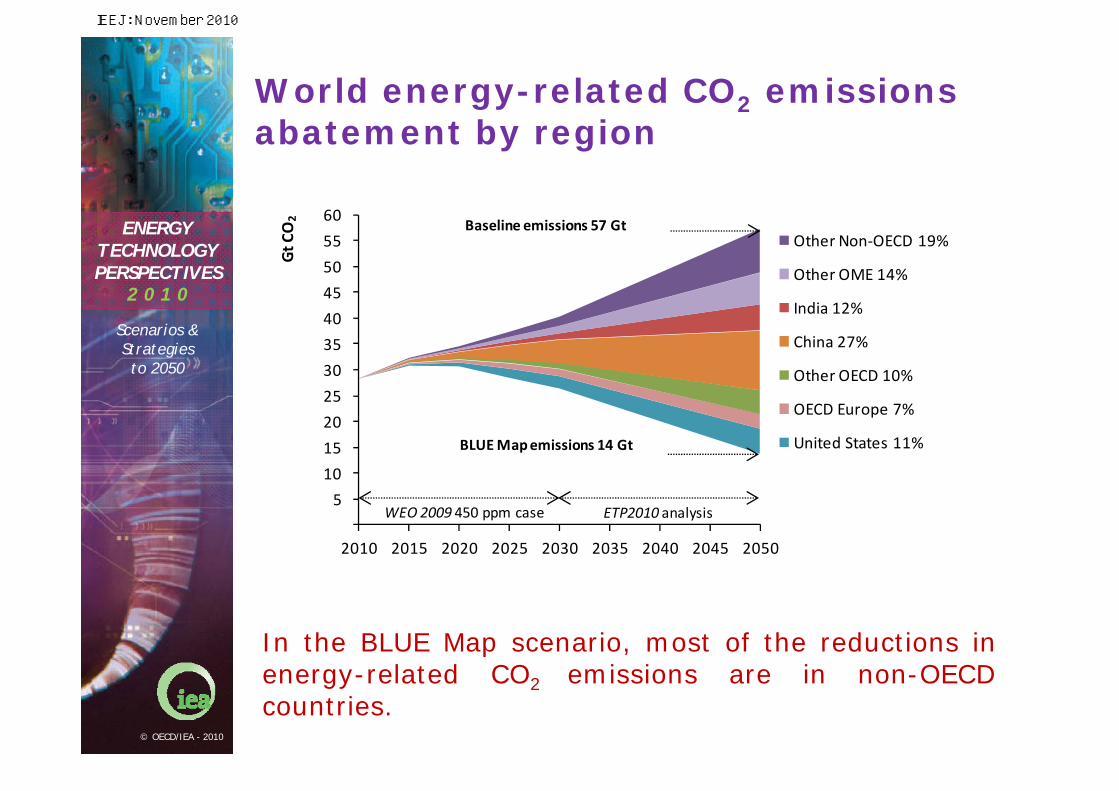
World energy-related CO2 emissions abatement by region
In the BLUE Map scenario, most of the reductions in energy-related CO2 emissions are in non-OECD countries.
5
10
15
20
25
30
35
40
45
50
55
60
2010 2015 2020 2025 2030 2035 2040 2045 2050
Gt C
O2
Other Non‐OECD 19%
Other OME 14%
India 12%
China 27%
Other OECD 10%
OECD Europe 7%
United States 11%BLUE Map emissions 14 Gt
Baseline emissions 57 Gt
ETP2010 analysis WEO 2009 450 ppm case
IEEJ: November 2010
2 0 1 0
ENERGYTECHNOLOGYPERSPECTIVES
Scenarios &Strategiesto 2050
© OECD/IEA - 2010
Regional Implications
IEEJ: November 2010
2 0 1 0
ENERGYTECHNOLOGYPERSPECTIVES
Scenarios &Strategiesto 2050
© OECD/IEA - 2010
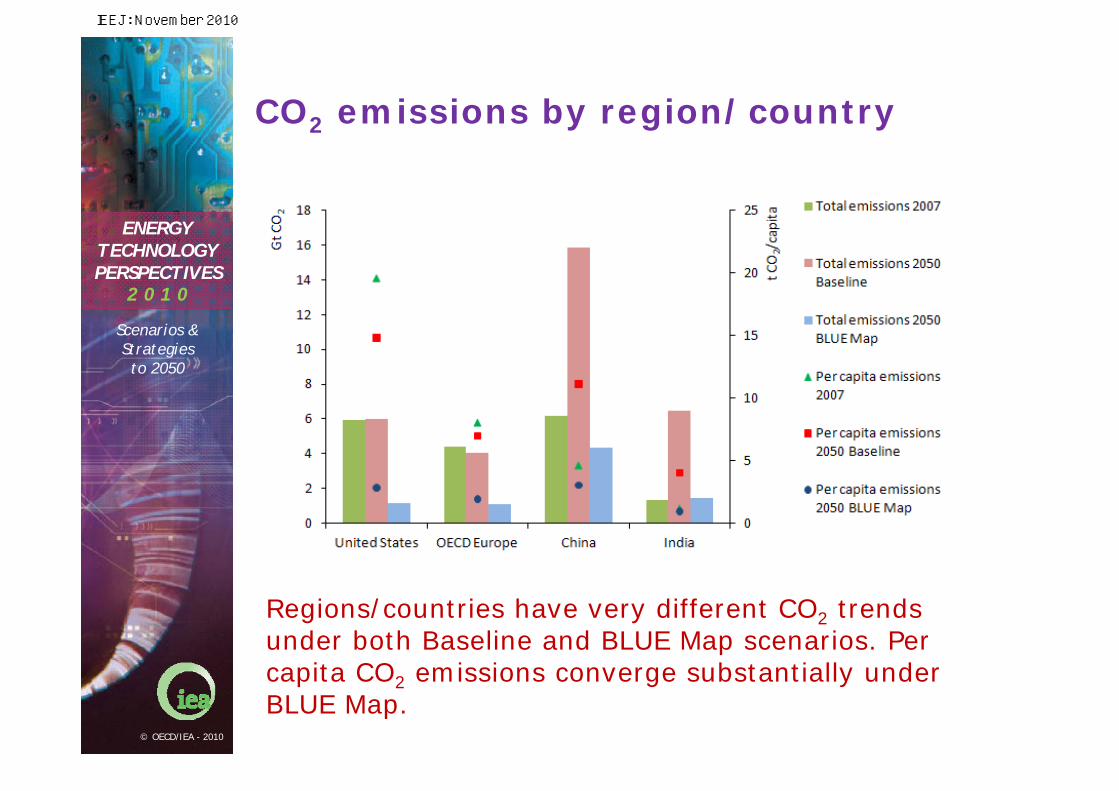
CO2 emissions by region/country
Regions/countries have very different CO2 trends under both Baseline and BLUE Map scenarios. Per capita CO2 emissions converge substantially under BLUE Map.
IEEJ: November 2010

2 0 1 0
ENERGYTECHNOLOGYPERSPECTIVES
Scenarios &Strategiesto 2050
© OECD/IEA - 2010
Primary energy demand by fuel and by scenario
Under the BLUE Map scenario fossil fuel demand growth is offset by the growth in nuclear power and the use of renewable energy.
IEEJ: November 2010

2 0 1 0
ENERGYTECHNOLOGYPERSPECTIVES
Scenarios &Strategiesto 2050
© OECD/IEA - 2010
Decarbonisation of power generation
Decarbonising the power sector requires all countries to dramatically change their generation mix.
IEEJ: November 2010

2 0 1 0
ENERGYTECHNOLOGYPERSPECTIVES
Scenarios &Strategiesto 2050
© OECD/IEA - 2010
Direct energy and process CO2emissions in industry by sector
Energy efficiency and CCS are the two most important abatement options in industry.
IEEJ: November 2010

2 0 1 0
ENERGYTECHNOLOGYPERSPECTIVES
Scenarios &Strategiesto 2050
© OECD/IEA - 2010
CO2 emissions reduction in the buildings sector
Decarbonisation of the electricity sector contributes two-thirds to emissions reduction in the buildings sector.
IEEJ: November 2010
2 0 1 0
ENERGYTECHNOLOGYPERSPECTIVES
Scenarios &Strategiesto 2050
© OECD/IEA - 2010
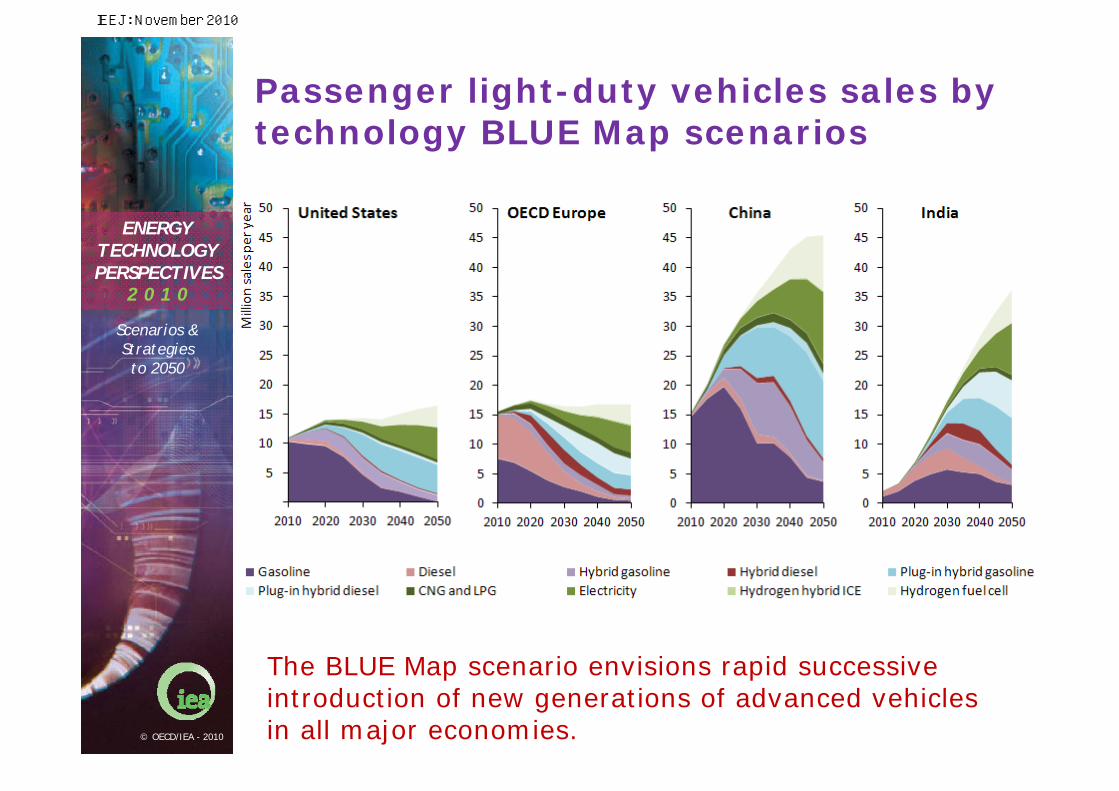
Passenger light-duty vehicles sales by technology BLUE Map scenarios
The BLUE Map scenario envisions rapid successive introduction of new generations of advanced vehicles in all major economies.
IEEJ: November 2010

2 0 1 0
ENERGYTECHNOLOGYPERSPECTIVES
Scenarios &Strategiesto 2050
© OECD/IEA - 2010
Technology policies
Carbon pricing is important, but should be complemented by other policies
Policies must be tailored to the technology’s stage of development and reflect good design principles
Public RD&D spending must at least double
Governments need to implement best practices in energy RD&D
A number of enabling actions are also needed:
Private sector leadership Expanded human capacity Greater government outreach and planning on
infrastructure needs Expanded, more effective international
collaboration
IEEJ: November 2010
2 0 1 0
ENERGYTECHNOLOGYPERSPECTIVES
Scenarios &Strategiesto 2050
© OECD/IEA - 2010
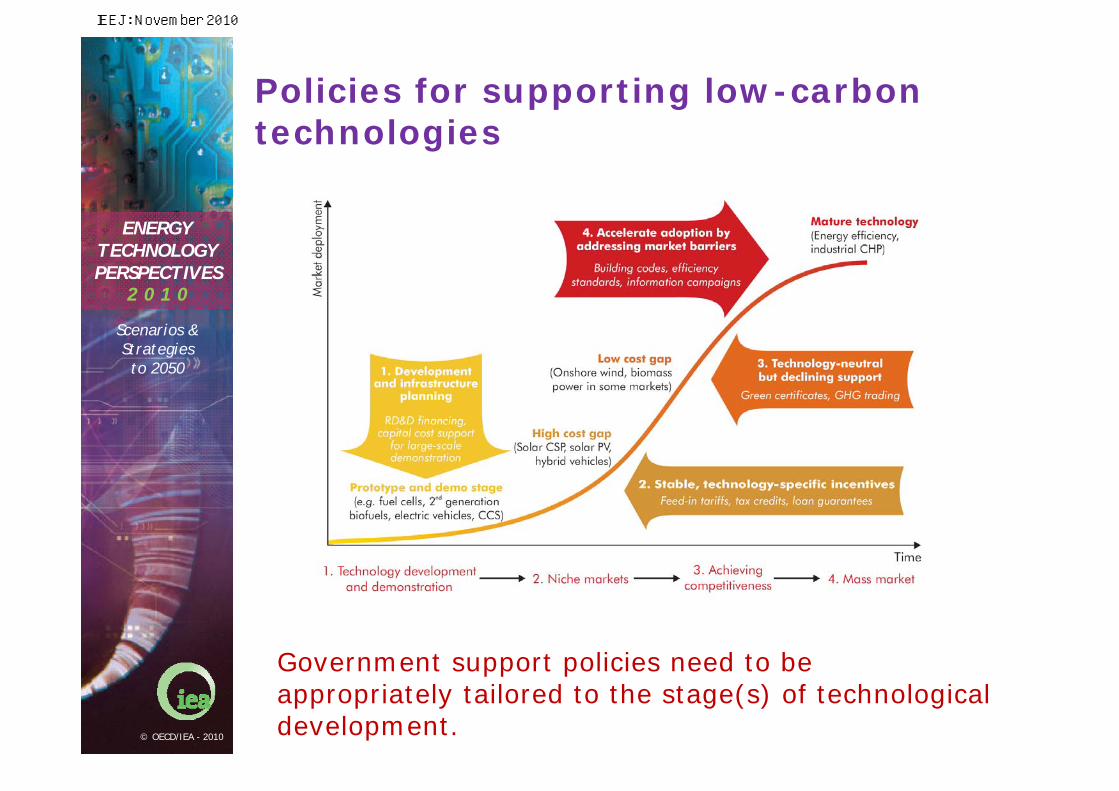
Policies for supporting low-carbon technologies
Government support policies need to be appropriately tailored to the stage(s) of technological development.
IEEJ: November 2010
2 0 1 0
ENERGYTECHNOLOGYPERSPECTIVES
Scenarios &Strategiesto 2050
© OECD/IEA - 2010
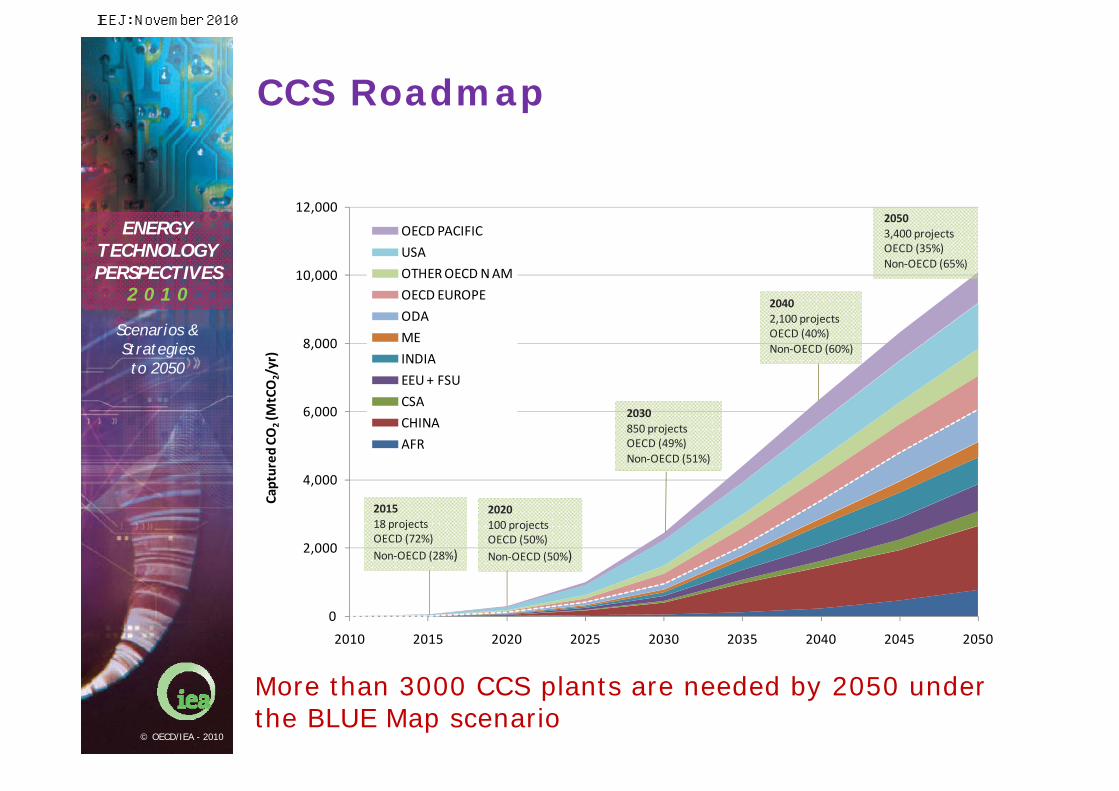
CCS Roadmap
0
2,000
4,000
6,000
8,000
10,000
12,000
2010 2015 2020 2025 2030 2035 2040 2045 2050
Captured
CO
2(M
tCO
2/yr)
OECD PACIFIC
USA
OTHER OECD N AM
OECD EUROPE
ODA
ME
INDIA
EEU + FSU
CSA
CHINA
AFR
2020100 projectsOECD (50%)Non‐OECD (50%)
2030850 projectsOECD (49%)Non‐OECD (51%)
20503,400 projectsOECD (35%)Non‐OECD (65%)
20402,100 projectsOECD (40%)Non‐OECD (60%)
201518 projectsOECD (72%)Non‐OECD (28%)
More than 3000 CCS plants are needed by 2050 under the BLUE Map scenario
IEEJ: November 2010
2 0 1 0
ENERGYTECHNOLOGYPERSPECTIVES
Scenarios &Strategiesto 2050
© OECD/IEA - 2010
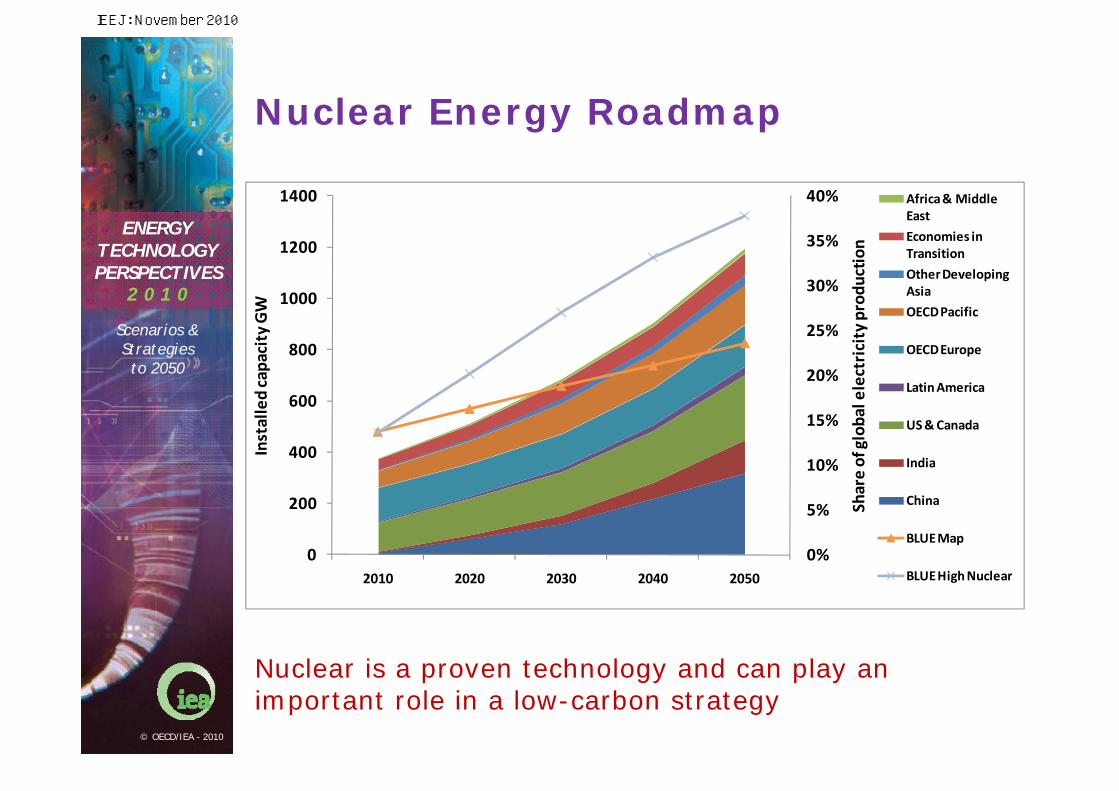
Nuclear is a proven technology and can play an important role in a low-carbon strategy
Nuclear Energy Roadmap
0%
5%
10%
15%
20%
25%
30%
35%
40%
0
200
400
600
800
1000
1200
1400
2010 2020 2030 2040 2050
Share of global electricity produ
ction
Installed capacity GW
Africa & Middle East
Economies in Transition
Other Developing Asia
OECD Pacific
OECD Europe
Latin America
US & Canada
India
China
BLUE Map
BLUE High Nuclear
IEEJ: November 2010
2 0 1 0
ENERGYTECHNOLOGYPERSPECTIVES
Scenarios &Strategiesto 2050
© OECD/IEA - 2010
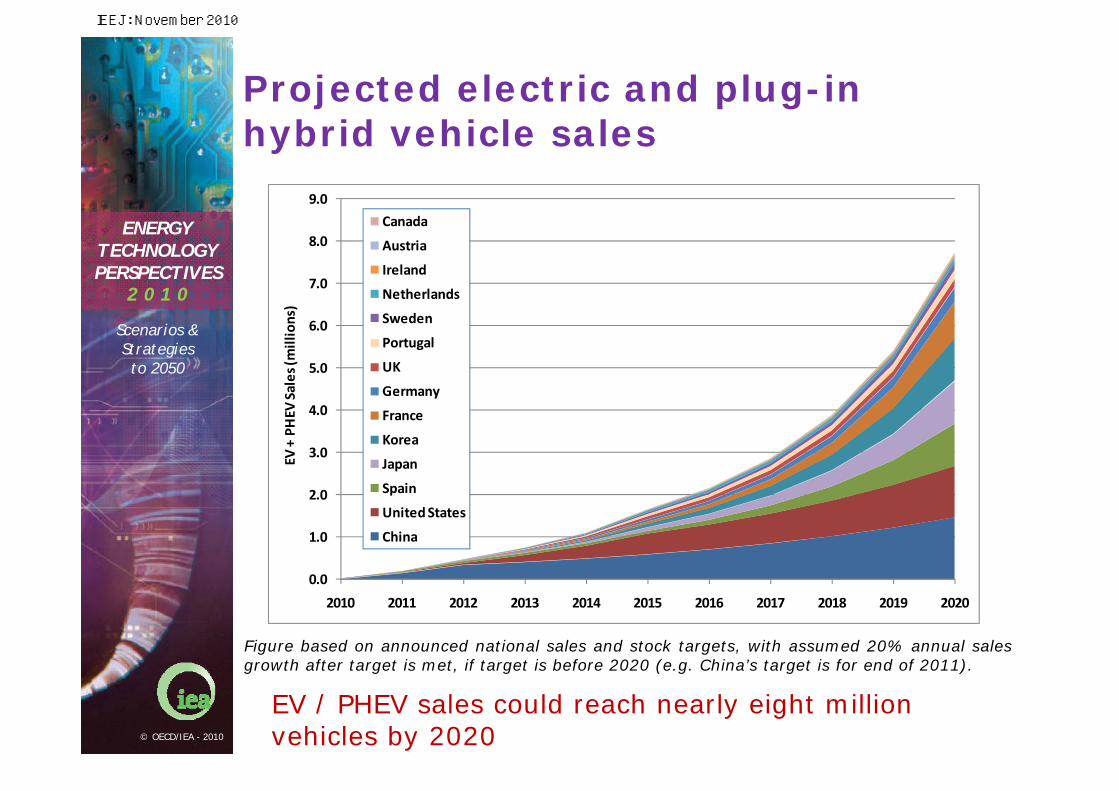
Projected electric and plug-in hybrid vehicle sales
EV / PHEV sales could reach nearly eight million vehicles by 2020
Figure based on announced national sales and stock targets, with assumed 20% annual sales growth after target is met, if target is before 2020 (e.g. China’s target is for end of 2011).
0.0
1.0
2.0
3.0
4.0
5.0
6.0
7.0
8.0
9.0
2010 2011 2012 2013 2014 2015 2016 2017 2018 2019 2020
EV + PHEV
Sales (m
illions)
Canada
Austria
Ireland
Netherlands
Sweden
Portugal
UK
Germany
France
Korea
Japan
Spain
United States
China
IEEJ: November 2010
2 0 1 0
ENERGYTECHNOLOGYPERSPECTIVES
Scenarios &Strategiesto 2050
© OECD/IEA - 2010
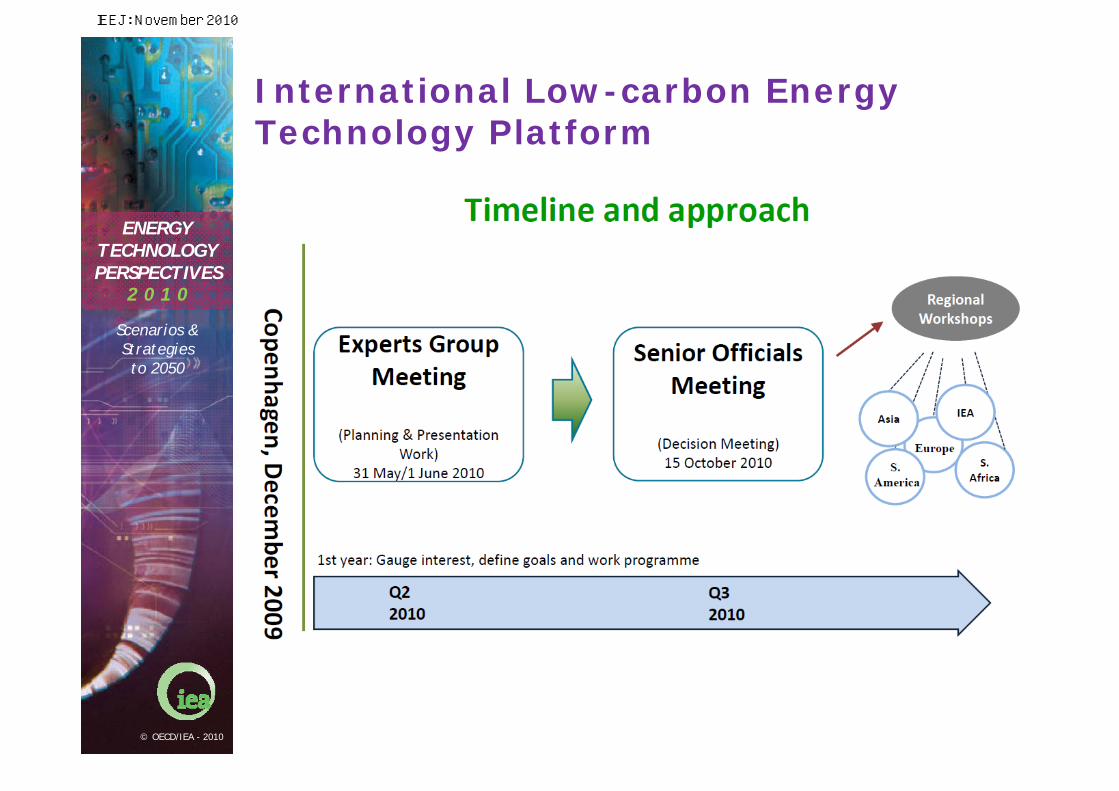
International Low-carbon Energy Technology Platform
IEEJ: November 2010
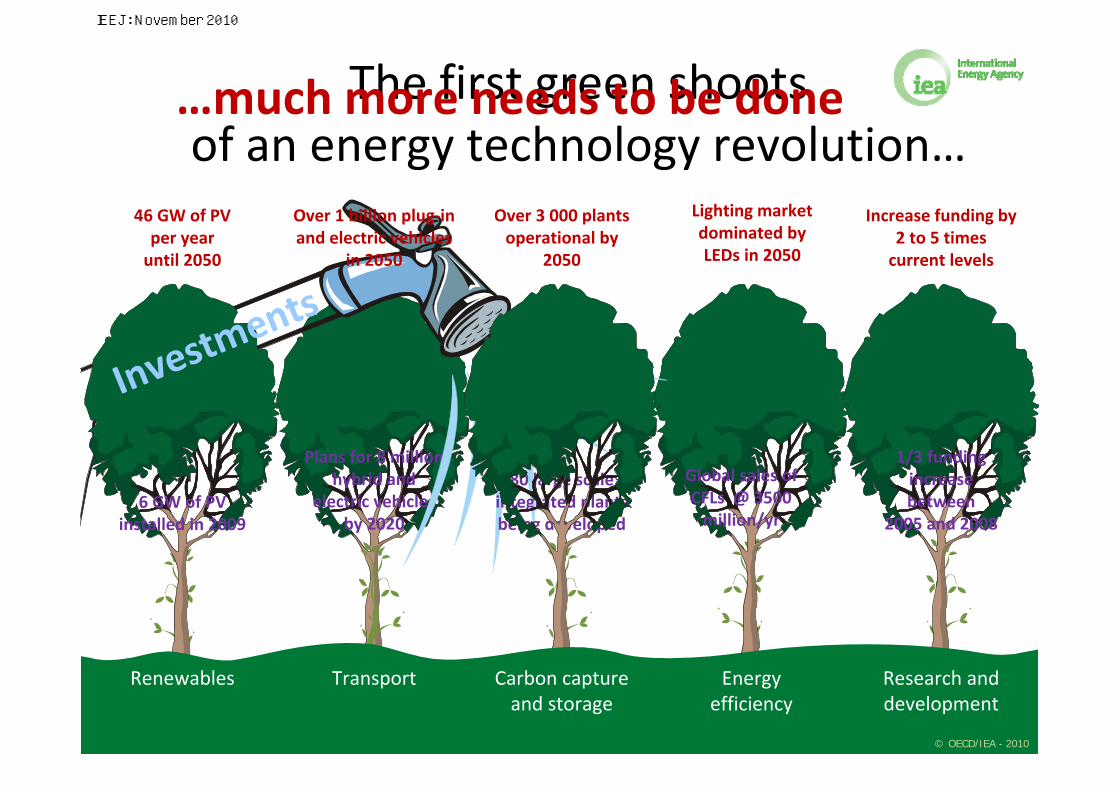
Plans for 8 million hybrid and
electric vehiclesby 2020
The first green shootsof an energy technology revolution……much more needs to be done
6 GW of PVinstalled in 2009
1/3 funding increasebetween
2005 and 2008
80 large scaleintegrated plantsbeing developed
Investm
ents
46 GW of PVper yearuntil 2050
Over 1 billion plug‐in and electric vehicles
in 2050
Increase funding by2 to 5 timescurrent levels
Over 3 000 plantsoperational by
2050
Renewables Transport Energyefficiency
Research anddevelopment
Carbon captureand storage
© OECD/IEA - 2010
Global sales of CFLs @ 3500 million/yr
Lighting market dominated by LEDs in 2050
IEEJ: November 2010
2 0 1 0
ENERGYTECHNOLOGYPERSPECTIVES
Scenarios &Strategiesto 2050
© OECD/IEA - 2010
Thank You
www.iea.org/techno/etp/index.asp
IEEJ: November 2010

2 0 1 0
ENERGYTECHNOLOGYPERSPECTIVES
Scenarios &Strategiesto 2050
© OECD/IEA - 2010
ANNEX
IEEJ: November 2010
2 0 1 0
ENERGYTECHNOLOGYPERSPECTIVES
Scenarios &Strategiesto 2050
© OECD/IEA - 2010
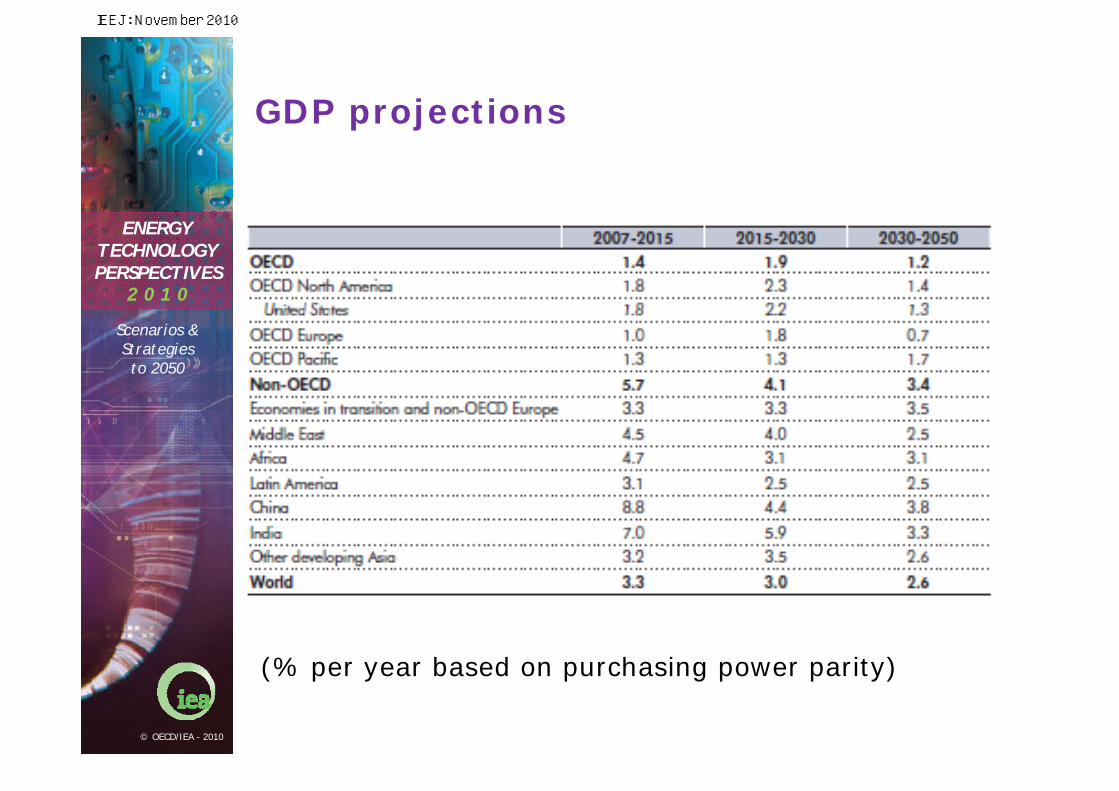
GDP projections
(% per year based on purchasing power parity)
IEEJ: November 2010
2 0 1 0
ENERGYTECHNOLOGYPERSPECTIVES
Scenarios &Strategiesto 2050
© OECD/IEA - 2010
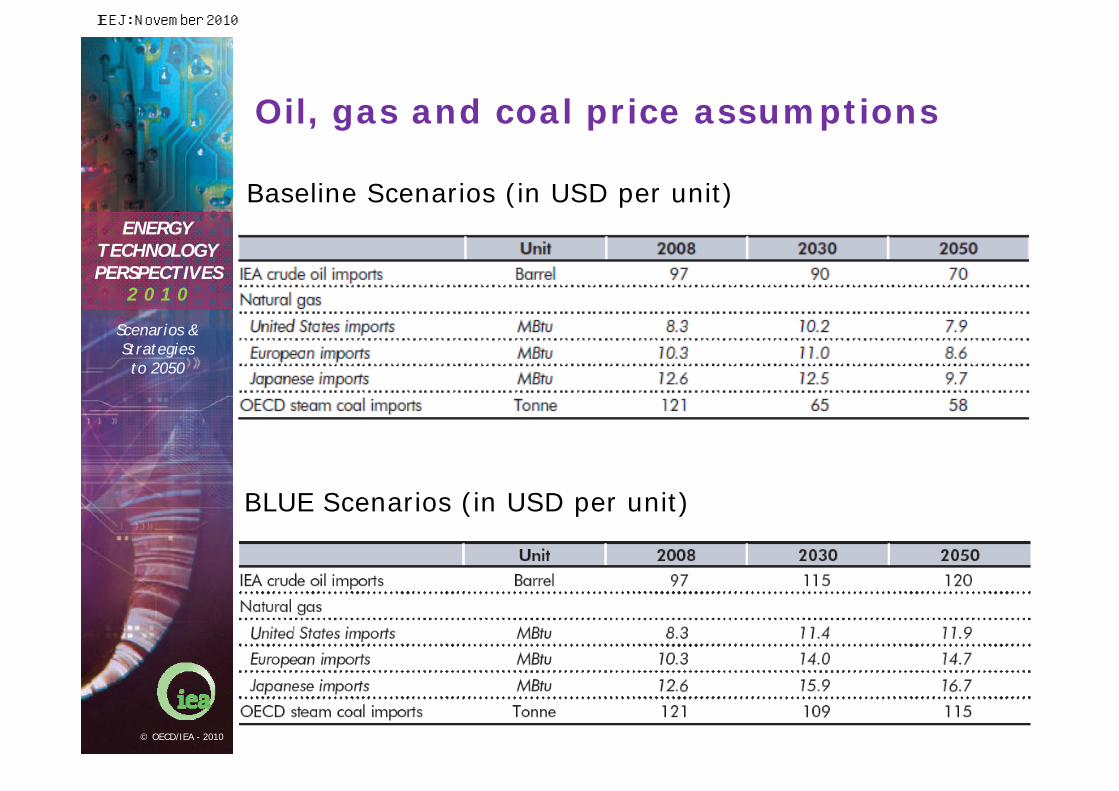
Oil, gas and coal price assumptions
Baseline Scenarios (in USD per unit)
BLUE Scenarios (in USD per unit)
IEEJ: November 2010

2 0 1 0
ENERGYTECHNOLOGYPERSPECTIVES
Scenarios &Strategiesto 2050
© OECD/IEA - 2010
Carbon prices in the BLUE Map scenario
USD / t CO2 2020 2030 2050
OECD 50 110 175
Non-OECD 0 65 175
IEEJ: November 2010
Contact: [email protected]