Energy Technology Perspectives 2017 - OECD€¦ · Energy Technology Perspectives 2017 - OECD ......
33
Energy Technology Perspectives 2017 Catalysing Energy Technology Transformations Together Secure Sustainable Energy Technology Perspectives 2017 http://dx.doi.org/10.1787/energy_tech-2017-en ISBN: 9789264275973(online) ISBN: 9789264270503 (print) © OECD/IEA 2017 Corrigendum Please note that despite our best efforts to ensure quality control, errors have slipped into Energy Technology Perspectives 2017. The text in pages 10, 13, 14, 15, 37, 90, 91, 96, 97, 104, 105, 106, 107, 108, 109, 110, 111, 120, 139, 144, 165, 169, 179, 208, 371, 372, 397, 418, 419, 426, 428, 429 has changed. It should be replaced by the following pages.
Transcript of Energy Technology Perspectives 2017 - OECD€¦ · Energy Technology Perspectives 2017 - OECD ......

Energy TechnologyPerspectives 2017Catalysing Energy Technology Transformations
Together
SecureSustainable
Energy Technology Perspectives 2017http://dx.doi.org/10.1787/energy_tech-2017-enISBN: 9789264275973(online)ISBN: 9789264270503 (print)© OECD/IEA 2017
CorrigendumPlease note that despite our best efforts to ensure quality control, errors have slipped into Energy Technology Perspectives 2017.The text in pages 10, 13, 14, 15, 37, 90, 91, 96, 97, 104, 105, 106, 107, 108, 109, 110, 111, 120, 139, 144, 165, 169, 179, 208, 371, 372, 397, 418, 419, 426, 428, 429 has changed. It should be replaced by the following pages.

Narrow cost and
performance gap
Compe��ve without
financial support
Time
RD&D
Se
co
nd
wa
ve
Th
ird
wa
ve
Niche
markets
Continual
incremental
improvements
Spillovers
Widespread
deployment
Inn
ova
tio
n s
tag
es
First
commercial
project
Second
generation
(learning from
early projects)Third generation
(performance improvement
from ongoing R&D)
Prototype and
demo stage
Wide cost and
performance gap
Fir
st
wa
ve
Learning: learning by doing, scaling up
Learning: learning by doing, scaling up
Learning: demonstra�on, knowledge
exchange, scale
Learning: R&D, knowledge exchange
Public support: strategically
directed R&D
Private ac�ons: angel investors,
corporate R&D
Public support: market crea�on,
technology-specific support
Private ac�ons: PPPs, ,venture capital
corporate debt, equity investors
Public support: declining,
technology-neutral, holis�c support
Private ac�ons: project ac�ons,
corporate debt
Public support: accelerate adop�on, market
pull policies, system integra�on
Private ac�ons: corporate and
household budgets; bond markets


Part 1
Setting the scene Chapter 1
The global outlook 37
© OECD/IEA, 2017.
The share of electricity in final energy demand across all end-use sectors almost doubles from 18% today to 35% in the 2DS in 2060, and 41% in the B2DS. The shift is particularly notable in transport, where electricity becomes the primary fuel for on-road vehicles in the B2DS (Figure 1.11). The additional electricity consumption by end-use sectors in the B2DS in 2060 is about 1 700 terawatt hours (TWh) more than the 2DS, equivalent to the combined annual electricity consumption of India and the Russian Federation today.
Decarbonisation of power generation The shift to electrification in the B2DS increases the pressure on the power sector, not only to accommodate additional generation but to do so while rapidly decarbonising and becoming a source of negative emissions. This transformation will require a considerable change in the traditional trends in power sector investment, with the carbon intensity of electricity generation declining at an average rate of -3.9% in the next decade for the 2DS or -4.5% for the B2DS, compared with -0.5% over the past decade.
In the 2DS, renewables deliver around two-thirds of the emissions reductions achieved in the power sector, with CCS providing 18% and nuclear 16% of reductions. By 2060, 98% of electricity generation is from low-carbon sources (Figure 1.12), with the carbon intensity of generation approaching zero — a colossal effort relative to today’s level of around 520 grammes of CO2 per kilowatt hour (gCO2/kWh) and the 254 gCO2/kWh achieved in the RTS. In the B2DS, the carbon intensity of electricity generation falls below zero, to -10 gCO2/kWh in 2060, effectively making the power sector a source of negative emissionsto offset residual emissions in industry and in transport.
Figure Power generation fuel mix by scenario, 2014 and 2060
Key point The fuel mix to generate electricity in the 2DS and B2DS would be vastly different from today’s mix.
Increased development and use of sustainable bioenergy A significant contribution from sustainably sourced bioenergy is needed as part of the transition to a clean energy future in both the 2DS and the B2DS. Bioenergy can play an important role across the energy sector: in electricity production, in heating for buildings, for industrial uses and in transport.
The role of bioenergy will largely be defined by the availability of sustainably sourced bioenergy feedstock. Its supply will need to grow from 55 EJ today to almost 100 EJ in 2060 in the RTS and to around 145 EJ in both the 2DS and B2DS. While this is within
0%
20%
40%
60%
80%
100%
RTS 2DS B2DS2014 2060
Elec
trici
ty m
ix
Fossil w/o CCS Fossil with CCS Nuclear Bioenergy with CCS Renewables

8
8
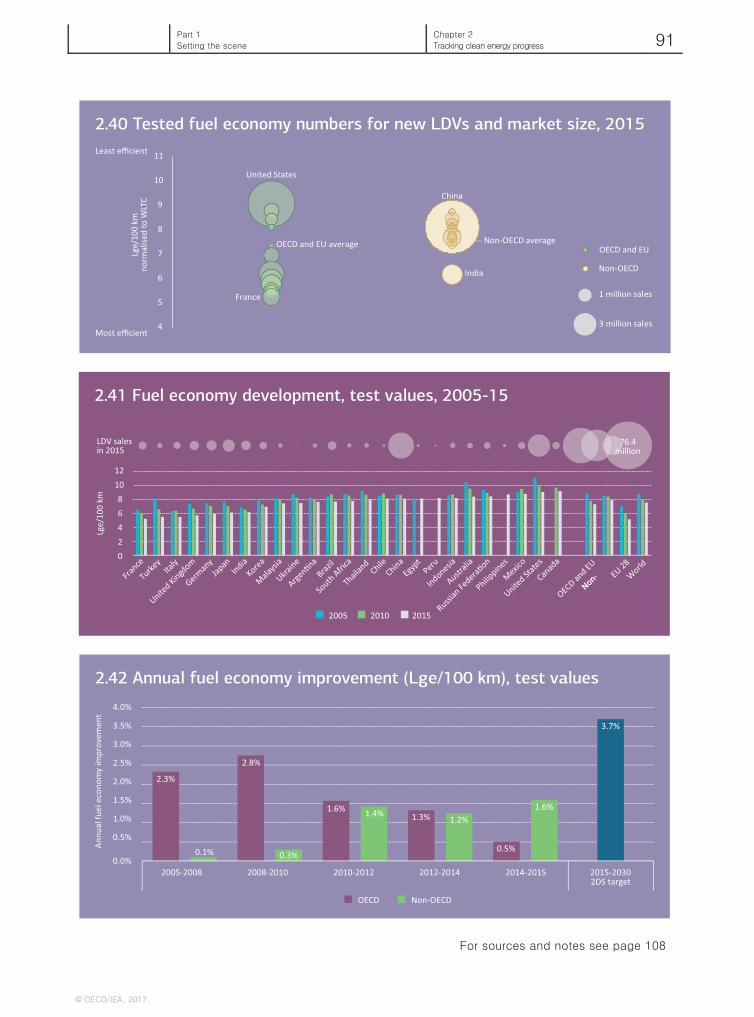
2.40 Tested fuel economy numbers for new LDVs and market size, 2015
2.41 Fuel economy development, test values, 2005-15
2.42 Annual fuel economy improvement (Lge/100 km), test values
2.3%
2.8%
1.6%
1.3%
0.5%
3.7%
0.1%0.3%
1.4%1.2%
1.6%
0.0%
0.5%
1.0%
1.5%
2.0%
2.5%
3.0%
3.5%
4.0%
2005-2008 2008-2010 2010-2012 2012-2014 2014-2015 2015-2030
2DS target
An
nu
alfu
el
eco
no
my
imp
ro
ve
me
nt
OECD Non-OECD

2.49 Building energy codes
2.50 Change in building envelope performance
0
20
40
60
80
100
120
1990 1995 2000 2005 2010 2015 2020 2025
Ind
ex
19
90
=1
00
AfricaLa�n AmericaOECD EuropeOECD AmericasWorld
ChinaEurasiaMiddle EastOther AsiaIndia
0%
20%
40%
60%
80%
2.51 Efficiency policy progress, 2005-15100%
Germany France niU ted
States
United
Kingdom
China Korea Italy Canada paS in
Residen�al progress
Non-residen�al progress
Residen�al proximity totarget
Non-residen�al proximity to target
No informa�on
Code in development
Voluntary energy codes
for part of sector
Mandatory energy codes
for part of sector
Mandatory energy codes
for the whole sector
Billion square metres in
floor area addi�ons to 2025
1
This map is without prejudice o the status of or sovereignty over any territory,t to the delimita�on of interna�onal fron�ers and boundaries, and to the name of any territory, city or area.
North
America
La�n America
and Caribbean
Africa
Western
Europe China
India
Eurasia
Japan and
Korea
Australia and
New Zealand
Other Asia
Middle
East
5.3
2.6
4.1
7.1
2.2
1.5
13.9
12.18.5
0.5
1.5
ONLY
1/3OF COUNTRIES HAVE MANDATORY ENERGY CODES FOR THE ENTIRE BUILDINGS SECTOR
2/3OF NEW
BUILDINGS NEED
TO BE COVERED
BY MANDATORY
BUILDING
ENERGY CODES
BY 2025


0 20 40 60 80
100 120 140 160 180 200
lm/W
Incandescent Halogen CFL LFL LED - RTS LED - 2DS LED - B2DS
0%10%20%30%40%50%60%70%80%90%
100%Sh
are
of re
siden
tial L
ED sa
les

Part 2
Catalysing energy technology transformations Chapter 4
Advancing the low-carbon transition in industry 165
© OECD/IEA, 2017
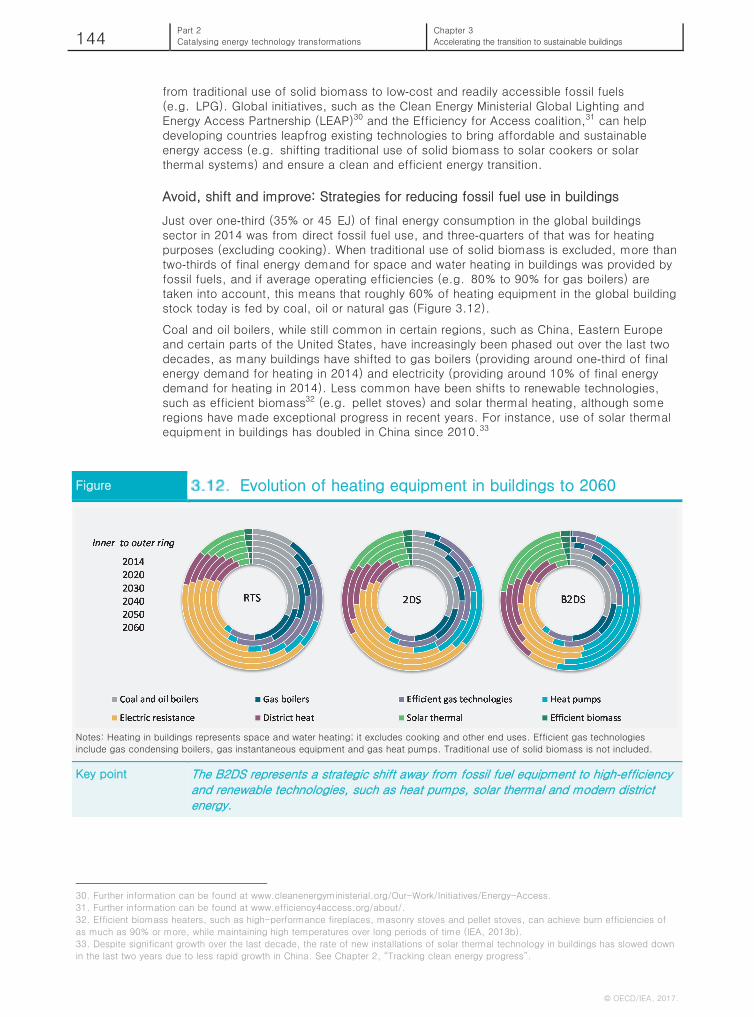
Decarbonisation pathways The levels of climate change ambition expressed in the Paris Agreement require a much more ambitious pathway for the energy system than the current and announced policies and targets in the RTS imply. The energy demand and CO2 emissions reduction needed to reach the 2DS pathway or a more ambitious climate target are significantly deeper. The annual improvements in aggregated energy intensity in the industry sector since 2000 would need to triple to meet a 2DS trajectory and almost quadruple to meet the more ambitious B2DS pathway through 2030 (Figure 4.2). The contribution of fossil fuels to the overall energy mix in industry, which has remained nearly flat since 2000, would need to fall by 4-7% over the next 15 years to avoid the more costly 2DS or B2DS trajectories in the long term, which would require much more drastic technological and structural changes to reduce CO2 emissions in the post‐2030 period. Without early action, as more carbon‐intensive capacity in industry is installed, stranded assets or costly retrofits are likely in order to shift to a less carbon‐intensive industry sector and compensate for early CO2 emissions by reducing more dramatically in later time periods.
Figure Energy use and aggregated energy intensity in industry per
value added by scenario
Notes: Final industrial energy use includes blast furnaces (BFs), coke ovens (COs) and petrochemical feedstocks. Energy intensity is
given in gigajoules (GJ) per thousand United States dollars (USD) of aggregated industrial value added.
Source: IEA (2016), World Energy Balances 2016.
Key point Final industry energy intensity decreases dramatically by 2060 in the low‐carbon scenarios.
In the 2DS, global direct CO2 emissions from industry are reduced by 44% by 2050 and halved by 2060 compared with the RTS. However, to reach net‐zero CO2 emissions at the system level, by 2060, which is required for the B2DS, industry would need to further reduce its carbon emissions by 69% by 2050 and 80% by 2060 compared with the RTS (Figure 4.3). These reductions would have to include efforts to address process CO2 emissions, generated in industrial processes from the use of carbon-based raw materials, which accounted for 23% of total CO2 emissions in industry in 2014, in addition to emissions from fuel combustion. Such an ambitious change in the direct CO2 intensity of industrial activity will need to occur along with development of new infrastructure and sustainable consumer products, which will require considerable amounts of material commodities to be produced and adapted to new applications.
0
50
100
150
200
250
2000 2005 2010 2014
Historical
EJ
0
1
2
3
4
5
2030 2030 2030 2060 2060 2060
RTS 2DS B2DS RTS 2DS B2DS
GJ/U
SD t
hous
and
Other renewables
Waste
Biomass
Heat
Electricity
Natural gas
Oil
Coal
Global aggregate energyintensity

Part 2
Catalysing energy technology transformations Chapter 4
Advancing the low-carbon transition in industry 169
© OECD/IEA, 2017
rates include the cost and time to develop infrastructure, stimulating behavioural change and technical issues related to the quality of scrap.
Figure Global material production projections in the RTS and B2DS
Notes: HVC = high-value chemicals. HVC refer to ethylene, propylene and BTX (benzene, toluene and xylene). Crude steel and aluminium
production levels are expressed in liquid metal terms.
Key point Production levels are decreased for crude steel, aluminium and primary chemicals in the B2DS due to material efficiency strategies.
Table Material efficiency strategies by subsector and scenario
RTS 2DS B2DS
Iron and steel Post‐consumer scrap
recycling – continue current
trends.
Post‐consumer scrap
recycling – improved
collection rates.
Same strategy as 2DS.
Improved manufacturing
and semi‐manufacturing
yields.
Post‐consumer scrap
reuse.
Cement Clinker substitution –
continue current trends.
Maximised clinker
substitution ratios.
Same strategy as 2DS.
0 150 300 450 600 750
2014
RTS 2060
B2DS 2060
2014
RTS 2060
B2DS 2060
Pulp
Alu
min
ium
Product (Mt)Primary
Recycled
Recovered fibrepulp
Virgin wood pulp
0 1 000 2 000 3 000 4 000 5 000
2014
RTS 2060
B2DS 2060
2014
RTS 2060
B2DS 2060
2014
RTS 2060
B2DS 2060
Chem
ical
sCr
ude
stee
lCe
men
t
Cement
Clinker additives
Primary
Secondary
HVC
Ammonia
Methanol
Product (Mt)
Part 2
Catalysing energy technology transformations Chapter 4
Advancing the low-carbon transition in industry 179
© OECD/IEA, 2017
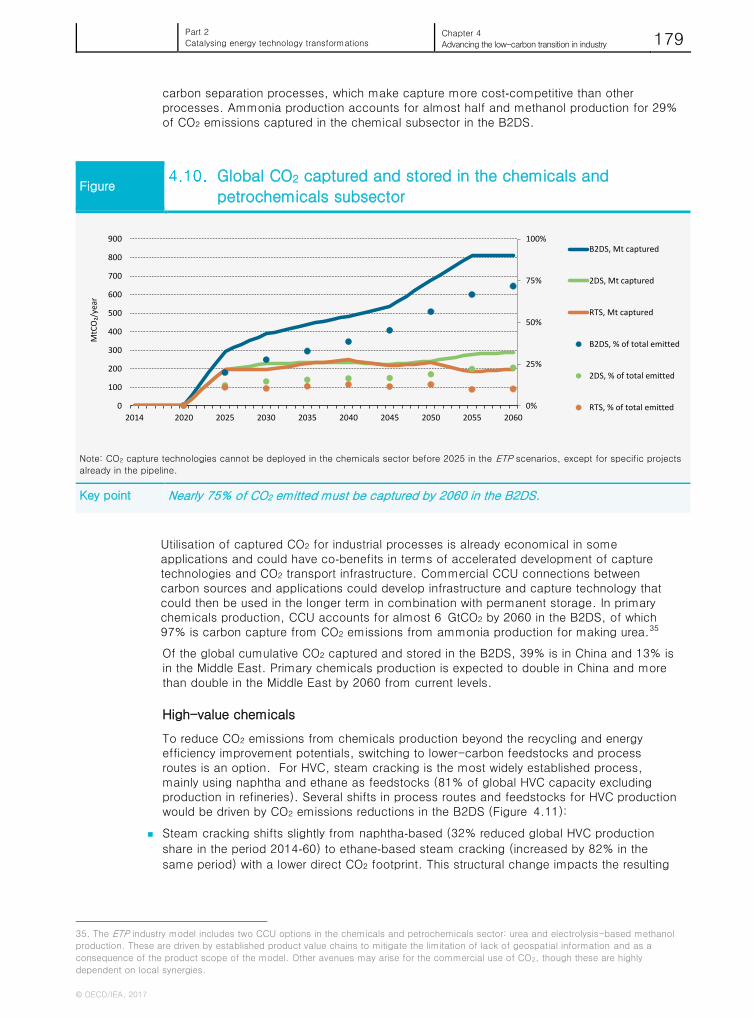
carbon separation processes, which make capture more cost‐competitive than other processes. Ammonia production accounts for almost half and methanol production for 29% of CO2 emissions captured in the chemical subsector in the B2DS.
Figure Global CO2 captured and stored in the chemicals and
petrochemicals subsector
Note: CO2 capture technologies cannot be deployed in the chemicals sector before 2025 in the ETP scenarios, except for specific projects
already in the pipeline.
Key point Nearly 75% of CO2 emitted must be captured by 2060 in the B2DS.
Utilisation of captured CO2 for industrial processes is already economical in some applications and could have co‐benefits in terms of accelerated development of capture technologies and CO2 transport infrastructure. Commercial CCU connections between carbon sources and applications could develop infrastructure and capture technology that could then be used in the longer term in combination with permanent storage. In primary chemicals production, CCU accounts for almost 6 GtCO2 by 2060 in the B2DS, of which 97% is carbon capture from CO2 emissions from ammonia production for making urea.35
Of the global cumulative CO2 captured and stored in the B2DS, 39% is in China and 13% is in the Middle East. Primary chemicals production is expected to double in China and more than double in the Middle East by 2060 from current levels.
High-value chemicals
To reduce CO2 emissions from chemicals production beyond the recycling and energy efficiency improvement potentials, switching to lower-carbon feedstocks and process routes is an option. For HVC, steam cracking is the most widely established process, mainly using naphtha and ethane as feedstocks (81% of global HVC capacity excluding production in refineries). Several shifts in process routes and feedstocks for HVC production would be driven by CO2 emissions reductions in the B2DS (Figure 4.11):
Steam cracking shifts slightly from naphtha‐based (32% reduced global HVC production
share in the period 2014‐60) to ethane‐based steam cracking (increased by 82% in the
same period) with a lower direct CO2 footprint. This structural change impacts the resulting
35. The ETP industry model includes two CCU options in the chemicals and petrochemicals sector: urea and electrolysis-based methanol
production. These are driven by established product value chains to mitigate the limitation of lack of geospatial information and as a
consequence of the product scope of the model. Other avenues may arise for the commercial use of CO2, though these are highly
dependent on local synergies.
0%
25%
50%
75%
100%
0
100
200
300
400
500
600
700
800
900
2014 2020 2025 2030 2035 2040 2045 2050 2055 2060
MtCO₂/year
B2DS, Mt captured
2DS, Mt captured
RTS, Mt captured
B2DS, % of total emitted
2DS, % of total emitted
RTS, % of total emitted

--
-- --
- --
--
-

0%
20%
40%
60%
80%
100%
2015 2025 2035 2045 2055
Shar
e of
pro
duct
ion
with
CCS
Steel
RTS 2DS B2DS Share of production which is not low carbon through other routes
0%
20%
40%
60%
80%
100%
2015 2025 2035 2045 2055
Cement
0%
20%
40%
60%
80%
100%
2015 2025 2035 2045 2055
Primary chemicals

- 4- 2 0 2 4 6 8
10
2030 2045 2060 2030 2045 2060 2030 2045 2060Low concentration,
smallLow concentration,
largeHigh concentration
GtCO
2/yr
2DS
CO captured Total net CO produced
- 4- 2 0 2 4 6 8
10
2030 2045 2060 2030 2045 2060 2030 2045 2060Low concentration,
smallLow concentration,
largeHigh concentration
B2DS

Coal
Natural gas
Oil products
Electricity
District heating
and cooling
Solid biomass
Solar thermal
energy
Geothermal
energy
Final energy
demand
Biofuels
Hydrogen
Coal
Primary
energy supply
Oil
Natural gas
Nuclear
Biomass
Hydro
Wind
Solar
Geothermal
Ocean
Refineries
Alternative fuel
production
Gas processing
Coal upgrading
Electricity plants
Co-generation plants
Heat plants
Electricity sector
Electricity storage
Gas pipelines, LNG
Electricity transmission
and distribution
District heat grid
Hydrogen
infrastructure
Conversion Transport and distribution
Energy flows
CO emissions2
New capacity additions Electricity prices
Overall costs of supply sideResults
Technical and
economic characteristics
Input assumptions
Demand load
curves
Resources, potentials
Supply costs
CO prices2