Emissions of Greenhouse Gases in the United States...
64
DOE/EIA-0573(2007) Emissions of Greenhouse Gases in the United States 2007 December 2008 Energy Information Administration Office of Integrated Analysis and Forecasting U.S. Department of Energy Washington, DC 20585 This report was prepared by the Energy Information Administration, the independent statistical and analytical agency within the Department of Energy. The information contained herein should be attributed to the Energy Information Administration and should not be construed as advocating or reflecting any policy position of the Department of Energy or of any other organization. Emissions of Greenhouse Gases in the United States 2007
Transcript of Emissions of Greenhouse Gases in the United States...

DOE/EIA-0573(2007)
Emissions of Greenhouse Gasesin the United States 2007
December 2008
Energy Information AdministrationOffice of Integrated Analysis and Forecasting
U.S. Department of EnergyWashington, DC 20585
This report was prepared by the Energy Information Administration, the independent statistical andanalytical agency within the Department of Energy. The information contained herein should beattributed to the Energy Information Administration and should not be construed as advocating orreflecting any policy position of the Department of Energy or of any other organization.
Emissions of Greenhouse Gasesin the United States 2007

Contacts
ii Energy Information Administration / Emissions of Greenhouse Gases in the United States 2007
This report, Emissions of Greenhouse Gases in the UnitedStates 2007, was prepared under the general directionof John Conti, Director of the Office of Integrated Anal-ysis and Forecasting, and Glen E. Sweetnam, Director,International, Economic, and Greenhouse Gases Divi-sion, Energy Information Administration. Generalquestions concerning the content of this report may bedirected to the National Energy Information Center at202/586-8800.
Specific technical information concerning the contentof the report may be obtained from Perry Lindstrom
at 202/586-0934 (e-mail, [email protected]). Without the assistance of Science ApplicationsInternational Corporation (SAIC), this report wouldnot have been possible. In particular we would liketo thank Keith Forbes, Kristin Igusky, Sarah Litke,Makely Lyon, Michael Mondshine, and Richard Rich-ards. We also wish to acknowledge the work done byour summer interns, Rebecca Zarin-Pass (EIA) andErin Beddingfield (SAIC), and to offer belated thanksto last year’s summer intern, Shiao-Ke Chin-Lee, for hishelp on this report and other projects.
Specific questions about the report should be referred to the following analysts:
Overview . . . . . . . . . . . . . . . . . . . . . . . . . . . . . . . Paul McArdle ([email protected], 202/586-4445)Carbon Dioxide. . . . . . . . . . . . . . . . . . . . . . . . . . Perry Lindstrom ([email protected], 202/586-0934)Methane . . . . . . . . . . . . . . . . . . . . . . . . . . . . . . . . Perry Lindstrom ([email protected], 202/586-0934)Nitrous Oxide . . . . . . . . . . . . . . . . . . . . . . . . . . . Perry Lindstrom ([email protected], 202/586-0934)High-GWP Gases . . . . . . . . . . . . . . . . . . . . . . . . Paul McArdle ([email protected], 202/586-4445)Land Use, Land-Use Change, and Forests . . . Paul McArdle ([email protected], 202/586-4445)
For this report, activity data on coal and natural gas consumption and electricity sales and losses by sector wereobtained from the October 2008 Monthly Energy Review (MER). Petroleum detail is now also available in publishedtables within the MER. Also, while generally in agreement with the MER, some data revisions were obtained fromthe Electric Power Annual that are not reflected in the October MER.
In keeping with current international practice, this report presents data on greenhouse gas emissions in million met-ric tons carbon dioxide equivalent. The data can be converted to carbon equivalent units by multiplying by 12/44.

Preface
Energy Information Administration / Emissions of Greenhouse Gases in the United States 2007 iii
Title XVI, Section 1605(a) of the Energy Policy Act of1992 (enacted October 24, 1992) provides:
Not later than one year after the date of the enact-ment of this Act, the Secretary, through the EnergyInformation Administration, shall develop, based ondata available to, and obtained by, the Energy Infor-mation Administration, an inventory of the nationalaggregate emissions of each greenhouse gas for eachcalendar year of the baseline period of 1987 through1990. The Administrator of the Energy Information
Administration shall annually update and analyzesuch inventory using available data. This subsectiondoes not provide any new data collection authority.
This report—the sixteenth annual report—presents theEnergy Information Administration’s latest estimatesof emissions for carbon dioxide, methane, nitrousoxide, and other greenhouse gases. Documentation forthese estimates is available on line at www.eia.doe.gov/oiaf/1605/ggrpt.


Contents
Greenhouse Gas Emissions Overview . . . . . . . . . . . . . . . . . . . . . . . . . . . . . . . . . . . . . . . . . . . . . . . . . . . . . . . . . . . . . . . 1Total Emissions . . . . . . . . . . . . . . . . . . . . . . . . . . . . . . . . . . . . . . . . . . . . . . . . . . . . . . . . . . . . . . . . . . . . . . . . . . . . . . . . 1U.S. Greenhouse Gas Intensity . . . . . . . . . . . . . . . . . . . . . . . . . . . . . . . . . . . . . . . . . . . . . . . . . . . . . . . . . . . . . . . . . . . 2Greenhouse Gas Emissions in the U.S. Economy . . . . . . . . . . . . . . . . . . . . . . . . . . . . . . . . . . . . . . . . . . . . . . . . . . . . 3U.S. Emissions in a Global Perspective . . . . . . . . . . . . . . . . . . . . . . . . . . . . . . . . . . . . . . . . . . . . . . . . . . . . . . . . . . . . 6Recent U.S. and International Developments in Global Climate Change. . . . . . . . . . . . . . . . . . . . . . . . . . . . . . . . 8Units for Measuring Greenhouse Gases. . . . . . . . . . . . . . . . . . . . . . . . . . . . . . . . . . . . . . . . . . . . . . . . . . . . . . . . . . . . 10Methodology Updates for This Report . . . . . . . . . . . . . . . . . . . . . . . . . . . . . . . . . . . . . . . . . . . . . . . . . . . . . . . . . . . . 12
Carbon Dioxide Emissions . . . . . . . . . . . . . . . . . . . . . . . . . . . . . . . . . . . . . . . . . . . . . . . . . . . . . . . . . . . . . . . . . . . . . . . . . 13Total Emissions . . . . . . . . . . . . . . . . . . . . . . . . . . . . . . . . . . . . . . . . . . . . . . . . . . . . . . . . . . . . . . . . . . . . . . . . . . . . . . . . 13Energy-Related Emissions . . . . . . . . . . . . . . . . . . . . . . . . . . . . . . . . . . . . . . . . . . . . . . . . . . . . . . . . . . . . . . . . . . . . . . . 14Residential and Commercial Sectors: Weather Effects on Energy-RelatedCarbon Dioxide Emissions, 2006 and 2007 . . . . . . . . . . . . . . . . . . . . . . . . . . . . . . . . . . . . . . . . . . . . . . . . . . . . . . . . 15
Residential Sector . . . . . . . . . . . . . . . . . . . . . . . . . . . . . . . . . . . . . . . . . . . . . . . . . . . . . . . . . . . . . . . . . . . . . . . . . . . . . . 16Commercial Sector. . . . . . . . . . . . . . . . . . . . . . . . . . . . . . . . . . . . . . . . . . . . . . . . . . . . . . . . . . . . . . . . . . . . . . . . . . . . . . 17Industrial Sector. . . . . . . . . . . . . . . . . . . . . . . . . . . . . . . . . . . . . . . . . . . . . . . . . . . . . . . . . . . . . . . . . . . . . . . . . . . . . . . . 18Transportation Sector . . . . . . . . . . . . . . . . . . . . . . . . . . . . . . . . . . . . . . . . . . . . . . . . . . . . . . . . . . . . . . . . . . . . . . . . . . . 19Electric Power Sector. . . . . . . . . . . . . . . . . . . . . . . . . . . . . . . . . . . . . . . . . . . . . . . . . . . . . . . . . . . . . . . . . . . . . . . . . . . . 20Nonfuel Uses of Energy Inputs . . . . . . . . . . . . . . . . . . . . . . . . . . . . . . . . . . . . . . . . . . . . . . . . . . . . . . . . . . . . . . . . . . . 21Adjustments to Energy Consumption . . . . . . . . . . . . . . . . . . . . . . . . . . . . . . . . . . . . . . . . . . . . . . . . . . . . . . . . . . . . . 23Other Sources . . . . . . . . . . . . . . . . . . . . . . . . . . . . . . . . . . . . . . . . . . . . . . . . . . . . . . . . . . . . . . . . . . . . . . . . . . . . . . . . . . 24
Methane Emissions . . . . . . . . . . . . . . . . . . . . . . . . . . . . . . . . . . . . . . . . . . . . . . . . . . . . . . . . . . . . . . . . . . . . . . . . . . . . . . . . 25Total Emissions . . . . . . . . . . . . . . . . . . . . . . . . . . . . . . . . . . . . . . . . . . . . . . . . . . . . . . . . . . . . . . . . . . . . . . . . . . . . . . . . 25Energy Use . . . . . . . . . . . . . . . . . . . . . . . . . . . . . . . . . . . . . . . . . . . . . . . . . . . . . . . . . . . . . . . . . . . . . . . . . . . . . . . . . . . . 26Agriculture . . . . . . . . . . . . . . . . . . . . . . . . . . . . . . . . . . . . . . . . . . . . . . . . . . . . . . . . . . . . . . . . . . . . . . . . . . . . . . . . . . . . 27Waste Management. . . . . . . . . . . . . . . . . . . . . . . . . . . . . . . . . . . . . . . . . . . . . . . . . . . . . . . . . . . . . . . . . . . . . . . . . . . . . 28Industrial Processes. . . . . . . . . . . . . . . . . . . . . . . . . . . . . . . . . . . . . . . . . . . . . . . . . . . . . . . . . . . . . . . . . . . . . . . . . . . . . 29
Nitrous Oxide Emissions . . . . . . . . . . . . . . . . . . . . . . . . . . . . . . . . . . . . . . . . . . . . . . . . . . . . . . . . . . . . . . . . . . . . . . . . . . . 31Total Emissions . . . . . . . . . . . . . . . . . . . . . . . . . . . . . . . . . . . . . . . . . . . . . . . . . . . . . . . . . . . . . . . . . . . . . . . . . . . . . . . . 31Agriculture . . . . . . . . . . . . . . . . . . . . . . . . . . . . . . . . . . . . . . . . . . . . . . . . . . . . . . . . . . . . . . . . . . . . . . . . . . . . . . . . . . . . 32Energy Use . . . . . . . . . . . . . . . . . . . . . . . . . . . . . . . . . . . . . . . . . . . . . . . . . . . . . . . . . . . . . . . . . . . . . . . . . . . . . . . . . . . . 33Industrial Sources . . . . . . . . . . . . . . . . . . . . . . . . . . . . . . . . . . . . . . . . . . . . . . . . . . . . . . . . . . . . . . . . . . . . . . . . . . . . . . 34Waste Management. . . . . . . . . . . . . . . . . . . . . . . . . . . . . . . . . . . . . . . . . . . . . . . . . . . . . . . . . . . . . . . . . . . . . . . . . . . . . 35
High-GWP Gases . . . . . . . . . . . . . . . . . . . . . . . . . . . . . . . . . . . . . . . . . . . . . . . . . . . . . . . . . . . . . . . . . . . . . . . . . . . . . . . . . . 37Total Emissions . . . . . . . . . . . . . . . . . . . . . . . . . . . . . . . . . . . . . . . . . . . . . . . . . . . . . . . . . . . . . . . . . . . . . . . . . . . . . . . . 37Hydrofluorocarbons . . . . . . . . . . . . . . . . . . . . . . . . . . . . . . . . . . . . . . . . . . . . . . . . . . . . . . . . . . . . . . . . . . . . . . . . . . . . 38Perfluorocarbons . . . . . . . . . . . . . . . . . . . . . . . . . . . . . . . . . . . . . . . . . . . . . . . . . . . . . . . . . . . . . . . . . . . . . . . . . . . . . . . 39Sulfur Hexafluoride. . . . . . . . . . . . . . . . . . . . . . . . . . . . . . . . . . . . . . . . . . . . . . . . . . . . . . . . . . . . . . . . . . . . . . . . . . . . . 40
Land Use . . . . . . . . . . . . . . . . . . . . . . . . . . . . . . . . . . . . . . . . . . . . . . . . . . . . . . . . . . . . . . . . . . . . . . . . . . . . . . . . . . . . . . . . . 41Overview. . . . . . . . . . . . . . . . . . . . . . . . . . . . . . . . . . . . . . . . . . . . . . . . . . . . . . . . . . . . . . . . . . . . . . . . . . . . . . . . . . . . . . 41Forest Lands and Harvested Wood Pools . . . . . . . . . . . . . . . . . . . . . . . . . . . . . . . . . . . . . . . . . . . . . . . . . . . . . . . . . . 42Croplands and Grasslands . . . . . . . . . . . . . . . . . . . . . . . . . . . . . . . . . . . . . . . . . . . . . . . . . . . . . . . . . . . . . . . . . . . . . . . 43Urban Trees, Yard Trimmings, and Food Scraps . . . . . . . . . . . . . . . . . . . . . . . . . . . . . . . . . . . . . . . . . . . . . . . . . . . . 44
Glossary . . . . . . . . . . . . . . . . . . . . . . . . . . . . . . . . . . . . . . . . . . . . . . . . . . . . . . . . . . . . . . . . . . . . . . . . . . . . . . . . . . . . . . . . . . 45
Energy Information Administration / Emissions of Greenhouse Gases in the United States 2007 v

Tables1. U.S. Emissions of Greenhouse Gases, Based on Global Warming Potential, 1990, 1995, and 2000-2007 . . . . 12. U.S. Greenhouse Gas Intensity and Related Factors, 1990, 1995, and 2000-2007 . . . . . . . . . . . . . . . . . . . . . . . . 23. World Energy-Related Carbon Dioxide Emissions by Region, 1990-2030 . . . . . . . . . . . . . . . . . . . . . . . . . . . . . 74. Greenhouse Gases and 100-Year Net Global Warming Potentials . . . . . . . . . . . . . . . . . . . . . . . . . . . . . . . . . . . . 115. U.S. Carbon Dioxide Emissions from Energy and Industry, 1990, 1995, and 2000-2007 . . . . . . . . . . . . . . . . . . 136. U.S. Energy-Related Carbon Dioxide Emissions by End-Use Sector, 1990, 1995, and 2000-2007. . . . . . . . . . . 147. U.S. Carbon Dioxide Emissions from Residential Sector Energy Consumption,
1990, 1995, and 2000-2007 . . . . . . . . . . . . . . . . . . . . . . . . . . . . . . . . . . . . . . . . . . . . . . . . . . . . . . . . . . . . . . . . . . . . . . 168. U.S. Carbon Dioxide Emissions from Commercial Sector Energy Consumption,
1990, 1995, and 2000-2007 . . . . . . . . . . . . . . . . . . . . . . . . . . . . . . . . . . . . . . . . . . . . . . . . . . . . . . . . . . . . . . . . . . . . . . 179. U.S. Carbon Dioxide Emissions from Industrial Sector Energy Consumption, 1990, 1996, and 2000-2007 . . 18
10. U.S. Carbon Dioxide Emissions from Transportation Sector Energy Consumption,1990, 1995, and 2000-2007 . . . . . . . . . . . . . . . . . . . . . . . . . . . . . . . . . . . . . . . . . . . . . . . . . . . . . . . . . . . . . . . . . . . . . . 19
11. U.S. Carbon Dioxide Emissions from Electric Power Sector Energy Consumption,1990, 1995, and 2000-2007 . . . . . . . . . . . . . . . . . . . . . . . . . . . . . . . . . . . . . . . . . . . . . . . . . . . . . . . . . . . . . . . . . . . . . . 20
12. U.S. Carbon Dioxide Emissions from Nonfuel Use of Energy Fuels, 1990, 1995, and 2000-2007 . . . . . . . . . . . 2113. U.S. Carbon Sequestered by Nonfuel Use of Energy Fuels, 1990, 1995, and 2000-2007. . . . . . . . . . . . . . . . . . . 2214. U.S. Carbon Dioxide Emissions: Adjustments for U.S. Territories and International Bunker Fuels,
1990, 1995, and 2000-2007 . . . . . . . . . . . . . . . . . . . . . . . . . . . . . . . . . . . . . . . . . . . . . . . . . . . . . . . . . . . . . . . . . . . . . . 2315. U.S. Carbon Dioxide Emissions from Other Sources, 1990, 1995, and 2000-2007 . . . . . . . . . . . . . . . . . . . . . . . . 2416. U.S. Methane Emissions from Anthropogenic Sources, 1990, 1995, and 2000-2007 . . . . . . . . . . . . . . . . . . . . . . 2517. U.S. Methane Emissions from Energy Sources, 1990, 1995, and 2000-2007 . . . . . . . . . . . . . . . . . . . . . . . . . . . . . 2618. U.S. Methane Emissions from Agricultural Sources, 1990, 1995, and 2000-2007 . . . . . . . . . . . . . . . . . . . . . . . . 2719. U.S. Methane Emissions from Waste Management, 1990, 1995, and 2000-2007 . . . . . . . . . . . . . . . . . . . . . . . . . 2820. U.S. Methane Emissions from Industrial Processes, 1990, 1995, and 2000-2007 . . . . . . . . . . . . . . . . . . . . . . . . . 2921. Estimated U.S. Emissions of Nitrous Oxide, 1990, 1995, and 2000-2007 . . . . . . . . . . . . . . . . . . . . . . . . . . . . . . . 3122. U.S. Nitrous Oxide Emissions from Agricultural Sources, 1990, 1995, and 2000-2007 . . . . . . . . . . . . . . . . . . . 3223. U.S. Nitrous Oxide Emissions from Energy Use, 1990, 1995, and 2000-2007. . . . . . . . . . . . . . . . . . . . . . . . . . . . 3324. U.S. Nitrous Oxide Emissions from Industrial Sources, 1990, 1995, and 2000-2007 . . . . . . . . . . . . . . . . . . . . . . 3425. U.S. Nitrous Oxide Emissions from Waste Management, 1990, 1995, and 2000-2007 . . . . . . . . . . . . . . . . . . . . 3526. U.S. Emissions of Hydrofluorocarbons, Perfluorocarbons, and Sulfur Hexafluoride,
1990, 1995, and 2000-2007 . . . . . . . . . . . . . . . . . . . . . . . . . . . . . . . . . . . . . . . . . . . . . . . . . . . . . . . . . . . . . . . . . . . . . . 3727. U.S. Emissions of Hydrofluorocarbons, 1990, 1995, and 2000-2007 . . . . . . . . . . . . . . . . . . . . . . . . . . . . . . . . . . . 3828. U.S. Emissions of Perfluorocarbons, 1990, 1995, and 2000-2007 . . . . . . . . . . . . . . . . . . . . . . . . . . . . . . . . . . . . . . 3929. U.S. Emissions of Sulfur Hexafluoride by Source, 1990, 1995, and 2000-2007. . . . . . . . . . . . . . . . . . . . . . . . . . . 4030. Net U.S. Carbon Dioxide Sequestration from Land Use, Land-Use Change, and Forestry,
1990, 1995, and 2000-2006 . . . . . . . . . . . . . . . . . . . . . . . . . . . . . . . . . . . . . . . . . . . . . . . . . . . . . . . . . . . . . . . . . . . . . . 4131. Net Carbon Dioxide Sequestration in U.S. Forests and Harvested Wood Pools,
1990, 1995, and 2000-2006 . . . . . . . . . . . . . . . . . . . . . . . . . . . . . . . . . . . . . . . . . . . . . . . . . . . . . . . . . . . . . . . . . . . . . . 4232. Net Carbon Dioxide Sequestration in Croplands and Grasslands, 1990, 1995, and 2000-2006. . . . . . . . . . . . . 4333. Net Carbon Dioxide Sequestration in U.S. Urban Trees, Yard Trimmings, and Food Scraps,
1990, 1995, and 2000-2006 . . . . . . . . . . . . . . . . . . . . . . . . . . . . . . . . . . . . . . . . . . . . . . . . . . . . . . . . . . . . . . . . . . . . . . 44
vi Energy Information Administration / Emissions of Greenhouse Gases in the United States 2007

Figures1. U.S. Greenhouse Gas Emissions by Gas, 2007. . . . . . . . . . . . . . . . . . . . . . . . . . . . . . . . . . . . . . . . . . . . . . . . . . . . . 12. Intensity Ratios: Carbon/Energy, Energy/GDP, and Carbon/GDP, 1980-2007 . . . . . . . . . . . . . . . . . . . . . . . . 23. World Carbon Dioxide Emissions by Region, 1990, 2005, 2020, and 2030 . . . . . . . . . . . . . . . . . . . . . . . . . . . . . 64. Regional Shares of World Carbon Dioxide Emissions, 1990, 2005, 2020, and 2030 . . . . . . . . . . . . . . . . . . . . . . 65. Annual Change in U.S. Carbon Dioxide Emissions, 1990-2007 . . . . . . . . . . . . . . . . . . . . . . . . . . . . . . . . . . . . . . . 136. U.S. Energy-Related Carbon Dioxide Emissions by Sector, 1990-2007. . . . . . . . . . . . . . . . . . . . . . . . . . . . . . . . . 147. Annual Changes in U.S. Heating Degree-Days and Residential Sector CO2 Emissions from
Direct Fuel Combustion, 1990-2007 . . . . . . . . . . . . . . . . . . . . . . . . . . . . . . . . . . . . . . . . . . . . . . . . . . . . . . . . . . . . . . 168. U.S. Commercial Sector CO2 Emissions and Per Capita Income, 1990-2007 . . . . . . . . . . . . . . . . . . . . . . . . . . . . 179. U.S. Industrial Sector CO2 Emissions and Major Industrial Fuel Use, 1990-2007. . . . . . . . . . . . . . . . . . . . . . . . 18
10. U.S. Vehicle Miles Traveled and CO2 Emissions from Gasoline and Diesel Transportation Fuel Use,1990-2007 . . . . . . . . . . . . . . . . . . . . . . . . . . . . . . . . . . . . . . . . . . . . . . . . . . . . . . . . . . . . . . . . . . . . . . . . . . . . . . . . . . . . 19
11. U.S. Electric Power Sector Energy Sales and Losses and CO2 Emissions from Primary Fuel Combustion,1990-2007 . . . . . . . . . . . . . . . . . . . . . . . . . . . . . . . . . . . . . . . . . . . . . . . . . . . . . . . . . . . . . . . . . . . . . . . . . . . . . . . . . . . . 20
12. U.S. Carbon Dioxide Emissions from Other Sources, 2007 . . . . . . . . . . . . . . . . . . . . . . . . . . . . . . . . . . . . . . . . . . 2413. U.S. Methane Emissions by Source, 1990-2007. . . . . . . . . . . . . . . . . . . . . . . . . . . . . . . . . . . . . . . . . . . . . . . . . . . . . 2514. U.S. Methane Emissions from Energy Sources, 1990-2007 . . . . . . . . . . . . . . . . . . . . . . . . . . . . . . . . . . . . . . . . . . . 2615. U.S. Methane Emissions from Agriculture by Source, 2007. . . . . . . . . . . . . . . . . . . . . . . . . . . . . . . . . . . . . . . . . . 2716. U.S. Methane Emissions from Waste Management by Source, 1990-2007 . . . . . . . . . . . . . . . . . . . . . . . . . . . . . . 2817. U.S. Methane Emissions from Industrial Processes by Source, 1990-2007. . . . . . . . . . . . . . . . . . . . . . . . . . . . . . 2918. U.S. Nitrous Oxide Emissions by Source, 1990-2007 . . . . . . . . . . . . . . . . . . . . . . . . . . . . . . . . . . . . . . . . . . . . . . . . 3119. U.S. Nitrous Oxide Emissions from Agriculture by Source, 2007 . . . . . . . . . . . . . . . . . . . . . . . . . . . . . . . . . . . . . 3220. U.S. Nitrous Oxide Emissions from Energy Use by Source, 1990-2007 . . . . . . . . . . . . . . . . . . . . . . . . . . . . . . . . 3321. U.S. Nitrous Oxide Emissions from Industry by Source, 1990-2007 . . . . . . . . . . . . . . . . . . . . . . . . . . . . . . . . . . . 3422. U.S. Nitrous Oxide Emissions from Waste Management by Source, 1990-2007 . . . . . . . . . . . . . . . . . . . . . . . . . 3523. U.S. Anthropogenic Emissions of High-GWP Gases, 1990-2007 . . . . . . . . . . . . . . . . . . . . . . . . . . . . . . . . . . . . . . 3724. U.S. Anthropogenic Emissions of HFCs, 1990-2007 . . . . . . . . . . . . . . . . . . . . . . . . . . . . . . . . . . . . . . . . . . . . . . . . 3825. U.S. Anthropogenic Emissions of PFCs, 1990-2007 . . . . . . . . . . . . . . . . . . . . . . . . . . . . . . . . . . . . . . . . . . . . . . . . . 3926. U.S. Anthropogenic Emissions of SF6 by Source, 1990-2007 . . . . . . . . . . . . . . . . . . . . . . . . . . . . . . . . . . . . . . . . . 4027. U.S. Carbon Sequestration from Land Use, Land-Use Change, and Forestry, 1990, 1995, and 2000-2006 . . . 4128. Carbon Sequestration in U.S. Forest Lands and Harvested Wood Pools, 2006. . . . . . . . . . . . . . . . . . . . . . . . . . 4229. Carbon Sequestration in U.S. Croplands and Grasslands, 1990, 1995, and 2001-2006 . . . . . . . . . . . . . . . . . . . . 4330. Carbon Sequestration in U.S. Urban Trees, Yard Trimmings, and Food Scraps,
1990, 1995, and 2000-2006 . . . . . . . . . . . . . . . . . . . . . . . . . . . . . . . . . . . . . . . . . . . . . . . . . . . . . . . . . . . . . . . . . . . . . . 44
Energy Information Administration / Emissions of Greenhouse Gases in the United States 2007 vii


Greenhouse Gas Emissions OverviewTotal Emissions
Overview Carbon Dioxide Methane Nitrous Oxide High-GWP Gases Land Use
Energy Information Administration / Emissions of Greenhouse Gases in the United States 2007 1
Summary• Total U.S. greenhouse gas emissions in 2007 were 1.4
percent above the 2006 total.
• Total emissions growth—from 7,179.7 million metrictons carbon dioxide equivalent (MMTCO2e) in 2006to 7,282.4 MMTCO2e in 2007—was largely the resultof a 75.9-MMTCO2e increase in carbon dioxide (CO2)emissions. There were larger percentage increases inemissions of other greenhouse gases, but their abso-lute contributions to total emissions growth were rel-atively small: 13.0 MMTCO2e for methane (CH4), 8.2MMTCO2e for nitrous oxide, and 5.6 MMTCO2e forthe man-made gases with high global warmingpotentials (high-GWP gases) (Table 1).
• The increase in U.S. carbon dioxide emissions in 2007resulted primarily from two factors: unfavorableweather conditions, which increased demand forheating and cooling in buildings; and a drop inhydropower availability that led to greater relianceon fossil energy sources (coal and natural gas) for
electricity generation, increasing the carbon intensityof the power supply.
• Methane emissions totaled 699.9 MMTCO2e in 2007(Figure 1), up by 13.0 MMTCO2e from 2006, withincreases in emissions from energy sources, wastemanagement, and agriculture.
• Emissions of nitrous oxide (N2O) increased by 8.2MMTCO2e from 2006 to a 2007 total of 383.9MMTCO2e. The increase is attributed primarily to anincrease of 6.9 MMTCO2e in emissions from nitrogenfertilization of agricultural soils.
• U.S. emissions of high-GWP gases, which totaled 176.9MMTCO2e in 2007, were 5.6 MMTCO2e above the 2006total. The increase resulted mainly from higher emis-sions levels for hydrofluorocarbons (HFCs, up by4.1 MMTCO2e) and perfluorocarbons (PFCs, up by2.0 MMTCO2e). Emissions of sulfur hexafluoride (SF6)were down by 0.5 MMTCO2e.
U.S. Anthropogenic Greenhouse Gas Emissions,1990, 2006, and 2007
1990 2006 2007
Estimated Emissions(Million Metric Tons CO2e). . 6,241.8 7,179.7 7,282.4
Change from 1990(Million Metric Tons CO2e). . . . . . . . . . 937.9 1,040.6(Percent) . . . . . . . . . . . . . . . . . . . . . . . 15.0% 16.7%
Average Annual Changefrom 1990 (Percent) . . . . . . . . . . . . . . . 0.9% 0.9%
Change from 2006(Million Metric Tons CO2e). . . . . . . . . . . . . . . . . . 102.7(Percent) . . . . . . . . . . . . . . . . . . . . . . . . . . . . . . . 1.4%
Energy-RelatedCarbon Dioxide*5,916.7 (81.2%)
Other Carbon Dioxide105.1 (1.4%)
Methane699.9 (9.6%)
Nitrous Oxide383.9 (5.3%)
High-GWP Gases176.9 (2.4%)
(Million Metric Tons CarbonDioxide Equivalent)
2007 Total = 7,282.4
Figure 1. U.S. Greenhouse Gas Emissionsby Gas, 2007
Source: EIA estimates. *Adjusted.
Table 1. U.S. Emissions of Greenhouse Gases, Based on Global Warming Potential, 1990, 1995, and2000-2007(Million Metric Tons Carbon Dioxide Equivalent)
Gas 1990 1995 2000 2001 2002 2003 2004 2005 2006 P2007
Carbon Dioxide . . . . . . . 5,021.4 5,348.4 5,892.6 5,806.9 5,880.5 5,938.7 6,023.9 6,032.3 5,945.8 6,021.8Methane. . . . . . . . . . . . . 782.1 752.6 685.7 670.1 674.2 676.5 679.7 679.4 686.9 699.9Nitrous Oxide. . . . . . . . . 336.0 359.7 344.6 339.3 335.4 334.6 361.5 370.8 375.7 383.9High-GWP Gasesa. . . . . 102.4 114.6 152.1 141.4 153.6 149.0 165.0 174.5 171.3 176.9
Total . . . . . . . . . . . . . . 6,241.8 6,575.2 7,075.0 6,957.7 7,043.7 7,098.8 7,230.1 7,256.9 7,179.7 7,282.4aHydrofluorocarbons (HFCs), perfluorocarbons (PFCs), and sulfur hexafluoride (SF6).P = preliminary data.Notes: Data in this table are revised from the data contained in the previous EIA report, Emissions of Greenhouse Gases in the United States
2006, DOE/EIA-0573(2006) (Washington, DC, November 2007). Totals may not equal sum of components due to independent rounding.Sources: Emissions: EIA estimates. Global Warming Potentials: Intergovernmental Panel on Climate Change, Climate Change 2007: The
Physical Science Basis (Cambridge, UK: Cambridge University Press, 2007), web site www.ipcc.ch/ipccreports/ar4-wg1.htm.

Greenhouse Gas Emissions OverviewU.S. Greenhouse Gas Intensity
Overview Carbon Dioxide Methane Nitrous Oxide High-GWP Gases Land Use
2 Energy Information Administration / Emissions of Greenhouse Gases in the United States 2007
U.S. Greenhouse Gas Intensity, 1990, 2006,and 2007
1990 2006 2007
Estimated Intensity(MTCO2e/GDP*) . . . . . . . 877.6 635.7 631.9
Change from 1990(MTCO2e/GDP*) . . . . . . . . . . . . . . . . -241.9 -245.6(Percent) . . . . . . . . . . . . . . . . . . . . . . -27.6% -28.0%
Average Annual Changefrom 1990 (Percent) . . . . . . . . . . . . . -2.0% -1.9%
Change from 2006(MTCO2e/GDP*). . . . . . . . . . . . . . . . . . . . . . . . . -3.7(Percent). . . . . . . . . . . . . . . . . . . . . . . . . . . . . . . -0.6%
*U.S. gross domestic product (million 2000 dollars).
Summary• From 2006 to 2007, the greenhouse gas intensity of
the U.S. economy—measured as metric tons carbondioxide equivalent (MTCO2e) emitted per milliondollars of gross domestic product (GDP)—fell by 0.6percent, the smallest annual decrease since 2002.
• Economic growth of 2.0 percent in 2007, coupledwith a 1.4-percent increase in total greenhouse gasemissions, accounted for the relatively slow rate ofdecrease (improvement) in U.S. greenhouse gasintensity from 2006 to 2007 (Table 2).
• Since 2002, the base year for the Bush Administration’semissions intensity reduction goal of 18 percent in adecade, U.S. greenhouse gas intensity has fallen by anaverage of 2.1 percent per year, resulting in a totalreduction of 9.8 percent from 2002 to 2007.
• The steady decrease in carbon intensity (carbon/GDP)has resulted mainly from reductions in energy use perunit of GDP (energy/GDP) rather than increased useof low-carbon fuels, as indicated by the carbon/energyratio shown in Figure 2.
��
� � � � � � � � � � � � � � � � � � � � � �� � � �
�
�
� �� �
� � � � � � � � � � � ��� � � � � � � � �
�
�
��� �
�� � � �
� � � � � � � � � � � � � � � � �
1980 1985 1990 1995 2000 200550
75
100
125
150Index (1990 = 100)
Carbon/Energy
Carbon/GDPEnergy/GDP
Figure 2. Intensity Ratios: Carbon/Energy,Energy/GDP, and Carbon/GDP, 1980-2007
Source: EIA estimates.
Table 2. U.S. Greenhouse Gas Intensity and Related Factors, 1990, 1995, and 2000-20071990 1995 2000 2001 2002 2003 2004 2005 2006 P2007
Gross Domestic Product(Billion 2000 Dollars) . . . . . . . . . . . . . . . 7,112.5 8,031.7 9,817.0 9,890.7 10,048.8 10,301.0 10,675.8 10,989.5 11,294.8 11,523.9Greenhouse Gas Emissions(MMTCO2e) . . . . . . . . . . . . . . . . . . . . . . 6,241.8 6,575.2 7,074.9 6,957.7 7,043.7 7,098.8 7,230.1 7,257.0 7,179.8 7,282.5Greenhouse Gas Intensity(MTCO2e per Million 2000 Dollars) . . . . 877.6 818.7 720.7 703.5 701.0 689.1 677.2 660.4 635.7 631.9
Change from Previous Year (Percent)Gross Domestic Product . . . . . . . . . . . — 2.5 3.7 0.8 1.6 2.5 3.6 2.9 2.8 2.0Greenhouse Gas Emissions . . . . . . . . — 0.8 2.6 -1.7 1.2 0.8 1.8 0.4 -1.1 1.4Greenhouse Gas Intensity . . . . . . . . . . — -1.7 -1.0 -2.4 -0.4 -1.7 -1.7 -2.5 -3.7 -0.6
Change from 2002 (Percent)a
Cumulative . . . . . . . . . . . . . . . . . . . . . . — — — — — -1.7 -3.4 -5.8 -9.3 -9.8Annual Average . . . . . . . . . . . . . . . . . . — — — — — -1.7 -1.7 -2.0 -2.4 -2.1aThe Bush Administration s emissions intensity goal calls for an 18-percent reduction between 2002 and 2012; achieving that goal would require
an average annual reduction of slightly less than 2 percent over the entire period.P = preliminary data.Note: Data in this table are revised from the data contained in the previous EIA report, Emissions of Greenhouse Gases in the United States
2006, DOE/EIA-0573(2006) (Washington, DC, November 2007).Sources: Emissions: EIA estimates. GDP: U.S. Department of Commerce, Bureau of Economic Analysis, web site www.bea.gov.

Greenhouse Gas Emissions OverviewGreenhouse Gas Emissions in the U.S. Economy
Overview Carbon Dioxide Methane Nitrous Oxide High-GWP Gases Land Use
Energy Information Administration / Emissions of Greenhouse Gases in the United States 2007 3
The diagram on page 4 illustrates the flow of U.S.greenhouse gas emissions in 2007, from their sources totheir distribution across the U.S. end-use sectors. Theleft side shows CO2 by fuel sources and quantities andother gases by quantities; the right side shows their dis-tribution by sector. The center of the diagram indicatesthe split between CO2 emissions from direct fuel com-bustion and electricity conversion. Adjustments indi-cated at the top of the diagram for U.S. territories andinternational bunker fuels correspond to greenhousegas reporting requirements developed by the UnitedNations Framework Convention on Climate Change(UNFCCC).
CO2. CO2 emission sources include energy-relatedemissions (primarily from fossil fuel combustion) andemissions from industrial processes. The energy subto-tal (5,991 MMTCO2e) includes petroleum, coal, andnatural gas consumption and smaller amounts fromrenewable sources, including municipal solid wasteand geothermal power generation. The energy subtotalalso includes emissions from nonfuel uses of fossilfuels, mainly as inputs to other products. Industrialprocess emissions (105 MMTCO2e) include cementmanufacture, limestone and dolomite calcination, sodaash manufacture and consumption, carbon dioxidemanufacture, and aluminum production. The sum ofthe energy subtotal and industrial processes equalsunadjusted CO2 emissions (6,096 MMTCO2e). Theenergy component of unadjusted emissions can bedivided into direct fuel use (3,557 MMTCO2e) and fuelconverted to electricity (2,433 MMTCO2e).
Non-CO2 Gases. Methane (700 MMTCO2e) and ni-trous oxide (384 MMTCO2e) sources include emissionsrelated to energy, agriculture, waste management, andindustrial processes. Other, high-GWP gases (177MMTCO2e) include hydrofluorocarbons (HFCs), per-fluorocarbons (PFCs), and sulfur hexafluoride (SF6).These gases have a variety of uses in the U.S. economy,including refrigerants, insulators, solvents, and aero-sols; as etching, cleaning, and firefighting agents; andas cover gases in various manufacturing processes.
Adjustments. In keeping with the UNFCCC, CO2emissions from U.S. Territories (57 MMTCO2e) areadded to the U.S. total, and CO2 emissions from fuelsused for international transport (both oceangoing ves-sels and airplanes) (131 MMTCO2e) are subtracted toderive total U.S. greenhouse gas emissions (7,282MMTCO2e).
Emissions by End-Use Sector. CO2 emissions by end-use sectors are based on EIA’s estimates of energy
consumption (direct fuel use and purchased electricity)by sector and on the attribution of industrial processemissions by sector. CO2 emissions from purchasedelectricity are allocated to the end-use sectors based ontheir shares of total electricity sales. Non-CO2 gases areallocated by direct emissions in those sectors plusemissions in the electric power sector that can be attrib-uted to the end-use sectors based on electricity sales.
Residential emissions (1,281 MMTCO2e) includeenergy-related CO2 emissions (1,261 MMTCO2e); andnon-CO2 emissions (20 MMTCO2e). The non-CO2sources include direct methane and nitrous oxide emis-sions from direct fuel use. Non-CO2 indirect emissionsattributable to purchased electricity, including meth-ane and nitrous oxide emissions from electric powergeneration and SF6 emissions related to electricitytransmission and distribution, are also included.
Emissions in the commercial sector (1,355 MMTCO2e)include both energy-related CO2 emissions (1,098MMTCO2e) and non-CO2 emissions (257 MMTCO2e).The non-CO2 emissions include direct emissions fromlandfills, wastewater treatment plants, commercialrefrigerants, and stationary combustion emissions ofmethane and nitrous oxide. Non-CO2 indirect emis-sions attributable to purchased electricity, includingmethane and nitrous oxide emissions from electricpower generation and SF6 emissions related to electric-ity transmission and distribution, are also included.
Industrial emissions (2,610 MMTCO2e) include CO2emissions (1,760 MMTCO2e)—which can be brokendown between combustion (1,655 MMTCO2e) and pro-cess emissions (105 MMTCO2e)—and non-CO2 emis-sions (850 MMTCO2e). The non-CO2 direct emissionsinclude emissions from agriculture (methane andnitrous oxide), coal mines (methane), petroleum andnatural gas pipelines (methane), industrial processemissions (methane, nitrous oxide, HFCs, PFCs andSF6), and direct stationary combustion emissions ofmethane and nitrous oxide. Non-CO2 indirect emis-sions attributable to purchased electricity, includingmethane and nitrous oxide emissions from electricpower generation and SF6 emissions related to electric-ity transmission and distribution, are also included.
Transportation emissions (2,036 MMTCO2e) includeenergy-related CO2 emissions from mobile sourcecombustion (1,902 MMTCO2e); and non-CO2 emis-sions (134 MMTCO2e). The non-CO2 emissions includemethane and nitrous oxide emissions from mobilesource combustion and HFC emissions from the use ofrefrigerants for mobile source air-conditioning units.
(continued on page 4)

Greenhouse Gas Emissions OverviewGreenhouse Gas Emissions in the U.S. Economy
Overview Carbon Dioxide Methane Nitrous Oxide High-GWP Gases Land Use
4 Energy Information Administration / Emissions of Greenhouse Gases in the United States 2007
Diagram Notes[a] CO2 emissions related to petroleum consumption (includes 99.3MMTCO2 of non-fuel-related emissions).
[b] CO2 emissions related to coal consumption (includes 0.5MMTCO2 of non-fuel-related emissions).
[c] CO2 emissions related to natural gas consumption (includes 17.8MMTCO2 of non-fuel-related emissions).
[d] Excludes carbon sequestered in nonfuel fossil products.
[e] CO2 emissions from the plastics portion of municipal solid waste(11.5 MMTCO2) combusted for electricity generation and very smallamounts (0.4 MMTCO2) of geothermal-related emissions.
[f] Includes mainly direct process emissions. Some combustionemissions are included from waste combustion outside the electricpower sector and flaring of non-marketed natural gas.
[g] Includes methane emissions related to energy, agriculture, wastemanagement, and industrial processes.
[h] Includes nitrous oxide emissions related to agriculture, energy,industrial processes, and waste management.
[i] Includes hydrofluorocarbons, perfluorocarbons, and sulfurhexafluoride.
[j] Includes only energy-related CO2 emissions from fossil fuels.Emissions are allocated to end-use sectors in proportion to U.S.ratios.
[k] Includes vessel bunkers and jet fuel consumed for internationaltravel. Under the UNFCCC, these emissions are not included incountry emission inventories. Emissions are subtracted from thetransportation sector total.
[l] CO2 emissions from electricity generation in the commercial andindustrial sectors are included in those sectors.
[m]Non-CO2: Direct stationary combustion emissions of methaneand nitrous oxide plus indirect power sector emissions of methane,nitrous oxide, and other greenhouse gases.
[n] Non-CO2: Direct stationary combustion emissions of methaneand nitrous oxide plus indirect power sector emissions of methane,nitrous oxide, and other greenhouse gases. Additional direct emis-sions include emissions from landfills, wastewater treatment, andcommercial refrigerants.
[o] Non-CO2: Direct stationary combustion emissions of methaneand nitrous oxide plus indirect power sector emissions of methane,nitrous oxide, and other greenhouse gases. In addition, all agricul-tural emissions are included in the industrial sector as well as directprocess emissions of methane, nitrous oxide, and the other gases.
[p] Non-CO2: Direct mobile combustion emissions of methane andnitrous oxide. Also, emissions related to transportation refrigerantsare included.
Source: Estimates presented in this report. CO2 emissions by end-usesector are based on EIA's estimates of energy consumption by sectorand on industrial process emissions. CO2 emissions from the electricpower sector are allocated to the end-use sectors based on electricitysales to the sector. Non-CO2 emissions by end-use sector are allocatedby direct emissions in those sectors plus indirect emissions from theelectric power sector allocated by electricity sales. Data are prelimi-nary. Totals may not equal sum of components due to independentrounding.
(continued on page 5)
(Million Metric Tons Carbon Dioxide Equivalent)Other Gases 177Nitrous Oxide 384
Methane 700Industrial Processes CO2 105
Renewables CO2 12
Natural Gas CO2 1,237
Petroleum CO2 2,580
CO2
Unadjusted Total6,096
Methane,Nitrous Oxide,Other Gases
1,261
U.S. Territories 57
International Bunkers 131
Direct Fuel Uses3,557
Power SectorConversionto Electricity
2,433
Industrial Processes105
Coal 1,980Natural Gas 376Petroleum 66Renewables 12
Greenhouse Gases2007 Total
7,282
CO21,261
Non-CO2 20
CO2 1,902Non-CO2 134
CO21,098
Non-CO2 257
CO2 1,760Non-CO2 850
Residential
1,281
Commercial
1,355
Industrial2,610
Transportation2,036
Coal CO2 2,162
CO2
Energy Subtotal5,991
[a,d]
[b,d]
[c,d]
[e]
[f]
[g]
[h]
[i]
[j]
[k]
[m]
[n]
[o]
[p]
[l]

Greenhouse Gas Emissions OverviewGreenhouse Gas Emissions in the U.S. Economy
Overview Carbon Dioxide Methane Nitrous Oxide High-GWP Gases Land Use
Energy Information Administration / Emissions of Greenhouse Gases in the United States 2007 5
Distribution of Total U.S. Greenhouse Gas Emissions by End-Use Sector, 2007
Greenhouse Gasand Source
Sector
Residential Commercial Industrial Transportation Total
Carbon Dioxide Million Metric Tons Carbon Dioxide Equivalent
Energy-Related (adjusted). . . . . . . . . 1,261.3 1,097.7 1,655.2 1,902.5 5,916.7Industrial Processes . . . . . . . . . . . . . — — 105.1 — 105.1
Total CO2 . . . . . . . . . . . . . . . . . . . . 1,261.3 1,097.7 1,760.3 1,902.5 6,021.8MethaneEnergyCoal Mining . . . . . . . . . . . . . . . . . . . — — 71.1 — 71.1Natural Gas Systems. . . . . . . . . . . . — — 176.6 — 176.6Petroleum Systems . . . . . . . . . . . . . — — 22.9 — 22.9Stationary Combustion . . . . . . . . . . 10.4 0.1 0.6 — 11.1Stationary Combustion: Electricity. . 0.1 0.1 0.1 — 0.3Mobile Sources . . . . . . . . . . . . . . . . — — — 5.1 5.1
Waste ManagementLandfills . . . . . . . . . . . . . . . . . . . . . . — 169.0 — — 169.0Domestic Wastewater Treatment . . — 17.4 — — 17.4Industrial Wastewater Treatment. . . — — 9.3 — 9.3
Industrial Processes . . . . . . . . . . . . — — 2.6 — 2.6Agricultural SourcesEnteric Fermentation . . . . . . . . . . . . — — 138.5 — 138.5Animal Waste . . . . . . . . . . . . . . . . . — — 65.0 — 65.0Rice Cultivation . . . . . . . . . . . . . . . . — — 9.7 — 9.7Crop Residue Burning . . . . . . . . . . . — — 1.4 — 1.4Total Methane . . . . . . . . . . . . . . . 10.5 186.7 497.6 5.1 699.9
Nitrous OxideAgricultureNitrogen Fertilization of Soils. . . . . . — — 229.6 — 229.6Solid Waste of Animals . . . . . . . . . . — — 62.2 — 62.2Crop Residue Burning . . . . . . . . . . . — — 0.6 — 0.6
Energy UseMobile Combustion . . . . . . . . . . . . . — — — 56.2 56.2Stationary Combustion . . . . . . . . . . 0.9 0.3 4.4 — 5.7Stationary Combustion: Electricity. . 3.4 3.3 2.6 — 9.3
Industrial Sources . . . . . . . . . . . . . . — — 14.0 — 14.0Waste ManagementHuman Sewage in Wastewater . . . . — 6.0 — — 6.0Waste Combustion . . . . . . . . . . . . . — — — — 0.0Waste Combustion: Electricity. . . . . 0.1 0.1 0.1 — 0.4
Total Nitrous Oxide . . . . . . . . . . . 4.5 9.8 313.5 56.2 383.9Hydrofluorocarbons (HFCs)HFC-23 . . . . . . . . . . . . . . . . . . . . . . . — — 22.0 — 22.0HFC-32 . . . . . . . . . . . . . . . . . . . . . . . — 0.5 — — 0.5HFC-125 . . . . . . . . . . . . . . . . . . . . . . — 22.8 — — 22.8HFC-134a . . . . . . . . . . . . . . . . . . . . . — — — 72.7 72.7HFC-143a . . . . . . . . . . . . . . . . . . . . . — 23.9 — — 23.9HFC-236fa . . . . . . . . . . . . . . . . . . . . . — 3.0 — — 3.0
Total HFCs . . . . . . . . . . . . . . . . . . . 0.0 50.2 22.0 72.7 144.9Perfluorocarbons (PFCs)CF4 . . . . . . . . . . . . . . . . . . . . . . . . . . — — 5.2 — 5.2C2F6. . . . . . . . . . . . . . . . . . . . . . . . . . — — 4.2 — 4.2NF3, C3F8, and C4F8 . . . . . . . . . . . . . — — 0.7 — 0.7
Total PFCs . . . . . . . . . . . . . . . . . . . 0.0 0.0 10.1 0.0 10.1Other HFCs, PFCs/PFPEs . . . . . . . . . — 6.1 — — 6.1Sulfur Hexafluoride (SF6)SF6: Utility . . . . . . . . . . . . . . . . . . . . . 4.6 4.4 3.4 — 12.3SF6: Other . . . . . . . . . . . . . . . . . . . . . — — 3.4 — 3.4Total SF6. . . . . . . . . . . . . . . . . . . . . 4.6 4.4 6.8 0.0 15.8
Total Non-CO2 . . . . . . . . . . . . . . . . . . 19.5 257.2 849.9 133.9 1,260.6Total Emissions . . . . . . . . . . . . . . . . . 1,280.8 1,354.7 2,610.4 2,036.4 7,282.4

Greenhouse Gas Emissions OverviewU.S. Emissions in a Global Perspective
Overview Carbon Dioxide Methane Nitrous Oxide High-GWP Gases Land Use
6 Energy Information Administration / Emissions of Greenhouse Gases in the United States 2007
World Energy-Related Carbon Dioxide Emissions,1990, 2005, and 2030
1990 2005 2030*
Estimated Emissions(Million Metric Tons) . . . . 21,226 28,051 42,325
Change from 1990(Million Metric Tons) . . . . . . . . . . . . . 6,825 21,099(Percent) . . . . . . . . . . . . . . . . . . . . . . 32.2% 99.4%
Average Annual Changefrom 1990 (Percent) . . . . . . . . . . . . . 1.9% 1.7%
Change from 2005(Million Metric Tons) . . . . . . . . . . . . . . . . . . . . . . 14,274(Percent). . . . . . . . . . . . . . . . . . . . . . . . . . . . . . . 50.9%
*EIA, International Energy Outlook 2008.
1990 2005 2020 20300
5,000
10,000
15,000
20,000Million Metric Tons Carbon Dioxide
United States Rest of OECD
China Rest of Non-OECD
History Projections
Figure 3. World Carbon Dioxide Emissionsby Region, 1990, 2005, 2020, and 2030
Source: EIA, International Energy Outlook 2008.
Summary• In EIA’s 2006 emissions inventory report, total U.S.
energy-related carbon dioxide emissions in 2005(including nonfuel uses of fossil fuels) were esti-mated at 5,982 MMT. With the 2005 world total forenergy-related carbon dioxide emissions estimatedat 28,051 MMT, U.S. emissions were about 21 percentof the world total (see Table 3 on page 7).
• Carbon dioxide emissions related to energy use inthe mature economies of countries that are membersof the Organization for Economic Cooperation andDevelopment (OECD)—including OECD NorthAmerica, OECD Europe, Japan, and Australia/NewZealand—are estimated at 13,565 MMT, or 48 per-cent of the world total. With the remaining 52 per-cent of worldwide energy-related carbon dioxideemissions (14,486 MMT) estimated as having comefrom non-OECD countries, 2005 marked the firstyear in which emissions from the non-OECD econo-mies were significantly greater than those from theOECD economies (Figure 3).
• In EIA’s International Energy Outlook 2008 (IEO2008)reference case, projections of energy use and emissionsare sensitive to economic growth rates and energyprices. Projections for a range of alternative growthand price scenarios are presented in IEO2008.
• U.S. energy-related carbon dioxide emissions are pro-jected to increase at an average annual rate of 0.5 per-cent from 2005 to 2030 in the IEO2008 reference case,while emissions from the non-OECD economies areprojected to grow by 2.5 percent per year. As a result,the U.S. share of world carbon dioxide emissions isprojected to fall to 16 percent in 2030 (6,851 MMT out ofa global total of 42,325 MMT) (Figure 4).
• China’s share of global energy-related carbon dioxideemissions is projected to grow from 18 percent in 2005to 28 percent in 2030. As a result, China is expected tobe responsible for 47 percent of the projected increasein world emissions over the period. India is expectedto account for the second-largest share of the projectedincrease, 8 percent.
1990 2005 2020 20300
10
20
30
40
50Percent of World Total
United States Rest of OECD
China Rest of Non-OECD
History Projections
Figure 4. Regional Shares of World CarbonDioxide Emissions, 1990, 2005, 2020, and 2030
Source: EIA, International Energy Outlook 2008.

Greenhouse Gas Emissions OverviewU.S. Emissions in a Global Perspective
Overview Carbon Dioxide Methane Nitrous Oxide High-GWP Gases Land Use
Energy Information Administration / Emissions of Greenhouse Gases in the United States 2007 7
Table 3. World Energy-Related Carbon Dioxide Emissions by Region, 1990-2030(Million Metric Tons Carbon Dioxide, Percent Share of World Emissions)
Region/Country
Historya Projectionsa Average AnnualPercent Change,
2005-2030b1990 2004 2005 2010 2015 2020 2025 2030OECDOECD North America . . . . . . . . . . . 5,754 6,959 7,008 7,109 7,408 7,653 7,928 8,300 0.7
(27.1%) (25.7%) (25.0%) (22.9%) (21.6%) (20.7%) (20.0%) (19.6%) (9.1%)United Statesc . . . . . . . . . . . . . . . . . 4,989 5,957 5,982 6,011 6,226 6,384 6,571 6,851 0.5
(23.5%) (22.0%) (21.3%) (19.3%) (18.1%) (17.2%) (16.6%) (16.2%) (6.1%)Canada . . . . . . . . . . . . . . . . . . . . . . 465 623 628 669 698 727 756 784 0.9
(2.2%) (2.3%) (2.2%) (2.2%) (2.0%) (2.0%) (1.9%) (1.9%) (1.1%)Mexico. . . . . . . . . . . . . . . . . . . . . . . 300 379 398 430 484 542 601 665 2.1
(1.4%) (1.4%) (1.4%) (1.4%) (1.4%) (1.5%) (1.5%) (1.6%) (1.9%)OECD Europe . . . . . . . . . . . . . . . . . 4,101 4,373 4,383 4,512 4,678 4,760 4,800 4,834 0.4
(19.3%) (16.2%) (15.6%) (14.5%) (13.6%) (12.9%) (12.1%) (11.4%) (3.2%)OECD Asia . . . . . . . . . . . . . . . . . . . . 1,541 2,148 2,174 2,208 2,287 2,322 2,357 2,403 0.4
(7.3%) (7.9%) (7.8%) (7.1%) (6.7%) (6.3%) (6.0%) (5.7%) (1.6%)Japan . . . . . . . . . . . . . . . . . . . . . . . 1,009 1,242 1,230 1,196 1,201 1,195 1,184 1,170 -0.2
(4.8%) (4.6%) (4.4%) (3.8%) (3.5%) (3.2%) (3.0%) (2.8%) (-0.4%)South Korea . . . . . . . . . . . . . . . . . . 241 488 500 559 612 632 656 693 1.3
(1.1%) (1.8%) (1.8%) (1.8%) (1.8%) (1.7%) (1.7%) (1.6%) (1.4%)Australia/New Zealand . . . . . . . . . . 291 418 444 454 474 495 517 540 0.8
(1.4%) (1.5%) (1.6%) (1.5%) (1.4%) (1.3%) (1.3%) (1.3%) (0.7%)Total OECD . . . . . . . . . . . . . . . . . 11,396 13,480 13,565 13,829 14,373 14,736 15,085 15,538 0.5
(53.7%) (49.8%) (48.4%) (44.5%) (41.9%) (39.8%) (38.1%) (36.7%) (13.8%)
Non-OECDNon-OECD Europe and Eurasia. . . 4,198 2,797 2,865 3,066 3,330 3,508 3,625 3,811 1.1
(19.8%) (10.3%) (10.2%) (9.9%) (9.7%) (9.5%) (9.2%) (9.0%) (6.6%)Russia . . . . . . . . . . . . . . . . . . . . . . . 2,376 1,669 1,696 1,789 1,902 1,984 2,020 2,117 0.9
(11.2%) (6.2%) (6.0%) (5.8%) (5.5%) (5.4%) (5.1%) (5.0%) (2.9%)Other . . . . . . . . . . . . . . . . . . . . . . . . 1,822 1,128 1,169 1,278 1,428 1,524 1,606 1,694 1.5
(8.6%) (4.2%) (4.2%) (4.1%) (4.2%) (4.1%) (4.1%) (4.0%) (3.7%)Non-OECD Asia. . . . . . . . . . . . . . . . 3,613 7,517 8,177 10,185 12,157 13,907 15,683 17,482 3.1
(17.0%) (27.8%) (29.2%) (32.7%) (35.4%) (37.6%) (39.6%) (41.3%) (65.2%)China. . . . . . . . . . . . . . . . . . . . . . . . 2,241 4,753 5,323 6,898 8,214 9,475 10,747 12,007 3.3
(10.6%) (17.6%) (19.0%) (22.2%) (23.9%) (25.6%) (27.1%) (28.4%) (46.8%)India . . . . . . . . . . . . . . . . . . . . . . . . 565 1,127 1,164 1,349 1,604 1,818 2,019 2,238 2.6
(2.7%) (4.2%) (4.1%) (4.3%) (4.7%) (4.9%) (5.1%) (5.3%) (7.5%)Other Non-OECD Asia . . . . . . . . . . 807 1,637 1,690 1,938 2,338 2,614 2,917 3,237 2.6
(3.8%) (6.0%) (6.0%) (6.2%) (6.8%) (7.1%) (7.4%) (7.6%) (10.8%)Middle East . . . . . . . . . . . . . . . . . . . 700 1,290 1,400 1,622 1,802 1,988 2,120 2,250 1.9
(3.3%) (4.8%) (5.0%) (5.2%) (5.2%) (5.4%) (5.4%) (5.3%) (6.0%)Africa . . . . . . . . . . . . . . . . . . . . . . . . 649 943 966 1,090 1,244 1,366 1,450 1,515 1.8
(3.1%) (3.5%) (3.4%) (3.5%) (3.6%) (3.7%) (3.7%) (3.6%) (3.8%)Central and South America . . . . . . 669 1,042 1,078 1,308 1,429 1,531 1,628 1,729 1.9
(3.2%) (3.8%) (3.8%) (4.2%) (4.2%) (4.1%) (4.1%) (4.1%) (4.6%)Brazil . . . . . . . . . . . . . . . . . . . . . . . . 216 350 356 451 498 541 582 633 2.3
(1.0%) (1.3%) (1.3%) (1.5%) (1.5%) (1.5%) (1.5%) (1.5%) (1.9%)Other Central/South America . . . . . 453 692 722 857 931 990 1,046 1,097 1.7
(2.1%) (2.6%) (2.6%) (2.8%) (2.7%) (2.7%) (2.6%) (2.6%) (2.6%)Total Non-OECD . . . . . . . . . . . . . 9,830 13,589 14,486 17,271 19,962 22,299 24,506 26,787 2.5
(46.3%) (50.2%) (51.6%) (55.5%) (58.1%) (60.2%) (61.9%) (63.3%) (86.2%)
Total World . . . . . . . . . . . . . . . . . . . . 21,226 27,070 28,051 31,100 34,335 37,035 39,591 42,325 1.7aValues adjusted for nonfuel sequestration.bValues in parentheses indicate percent share of total world absolute change.cIncludes the 50 States and the District of Columbia.Note: The U.S. numbers include carbon dioxide emissions attributable to renewable energy sources.Sources: History: Energy Information Administration (EIA), International Energy Annual 2005 (May-July 2007), web site www.eia.doe.gov/iea/;
and data presented in this report. Projections: EIA, Annual Energy Outlook 2008, DOE/EIA-0383(2008) (Washington, DC, June 2008), Table 1,web site www.eia.doe.gov/oiaf/aeo; and International Energy Outlook 2008, DOE/EIA-0484(2008) (Washington, DC, September 2008), Table A10.

Greenhouse Gas Emissions OverviewRecent U.S. and International Developments in Global Climate Change
Overview Carbon Dioxide Methane Nitrous Oxide High-GWP Gases Land Use
8 Energy Information Administration / Emissions of Greenhouse Gases in the United States 2007
United StatesFederal Actions
• The Consolidated Appropriations Act of 2008, whichbecame Public Law 110-161 on December 26, 2007,directed the U.S. Environmental Protection Agency(EPA) to develop a draft mandatory reporting rulefor greenhouse gases by the end of September 2008;although the draft rule has not yet been released, theFinal Rule is due to be completed by June 2009. TheRule is expected to require mandatory reporting ofgreenhouse gas emissions “above appropriatethresholds in all sectors of the economy,” withthresholds and frequency of reporting to be deter-mined by the EPA.
• In July 2008, the EPA released an Advance Notice ofProposed Rulemaking (ANPR) to implement the rul-ing of the U.S. Supreme Court case, Massachusetts v.the Environmental Protection Agency. On April 2,2007, the Court ruled that Section 202(a)(1) of theClean Air Act (CAA) gives the EPA authority to reg-ulate tailpipe emissions of greenhouse gases. Fourkey issues for discussion in the ANPR include:descriptions of key provisions and programs in theCAA and advantages and disadvantages of regulat-ing greenhouse gases under those provisions; how adecision to regulate GHG emissions under one sec-tion of the CAA could or would lead to regulation ofGHG emissions under other sections of the Act,including sections establishing permitting require-ments for major stationary sources of air pollutants;issues relevant for Congress to consider for possiblefuture climate legislation and the potential foroverlap between future legislation and regulationunder the existing CAA; and scientific informationrelevant to, and the issues raised by, an endanger-ment analysis.
Congressional Initiatives
• Senate Bill 3036, the Lieberman-Warner ClimateSecurity Act of 2008, came to the floor for debate inthe Senate on June 2, 2008. The main purpose of theAct was to establish a Federal program that wouldsubstantially reduce U.S. greenhouse gas emissionsbetween 2007 and 2050, in large part through a Fed-eral cap-and-trade program.
Regional and State Efforts
• On September 25, 2008, the Regional GreenhouseGas Initiative (RGGI) held its first auction. More than
12.6 million tons were sold at a clearing price of $3.07.New York, with 40 percent allowance allocation, didnot participate in the first round of auctions; however,all 10 States are expected to participate in the secondallowance auction on December 17, 2008, at which 31.5million allowances will be available with a reserveprice set at $1.86. RGGI is a cooperative effort by 10Northeast and Mid-Atlantic States to limit greenhousegas emissions from the electric power sector. Connecti-cut, Delaware, Maine, Maryland, Massachusetts, NewHampshire, New Jersey, New York, Rhode Island, andVermont are signatory States to the RGGI agreement.
• On September 28, 2008, the Western Climate Initiative(WCI) released a detailed scoping plan for its regionalmarket-based cap-and-trade program. The multi-sector program will be the most comprehensive carbonreduction strategy to date, covering nearly 90 percentof the region’s emissions, including those from elec-tricity, industry, transportation, and residential andcommercial fuel use, and reducing greenhouse gasemissions to 15 percent below 2005 levels by 2020. OnSeptember 30, 2008, the WCI released its Second Draftof Reporting Requirements, which addresses theessential requirements for mandatory reporting. Par-ticipating U.S. States include Arizona, California,Montana, New Mexico, Oregon, Utah, and Washing-ton. Canadian provinces participating include BritishColumbia, Manitoba, Ontario, and Quebec.
• Nine Midwestern governors and two Canadian pre-miers signed on to participate or observe in the Mid-western Greenhouse Gas Reduction Accord as firstagreed to in November 2007. Member States haveagreed to reduce greenhouse gas emissions, and aworking group is to provide recommendations regard-ing the implementation of the Accord. In September2008, the Advisory Group released an updatedtimeline that requires preliminary design recommen-dations to be released by November 2008, final recom-mendations by March 2009, and a draft model rulebetween May and September 2009. Member Statesinclude Iowa, Illinois, Kansas, Michigan, Minnesota,and Wisconsin, as well as the Canadian province ofManitoba. Observer States include Indiana, Ohio, andSouth Dakota, as well as the Canadian province ofOntario.
(continued on page 9)

Greenhouse Gas Emissions OverviewRecent U.S. and International Developments in Global Climate Change
Overview Carbon Dioxide Methane Nitrous Oxide High-GWP Gases Land Use
Energy Information Administration / Emissions of Greenhouse Gases in the United States 2007 9
United States (continued)• On September 30, 2008, Governor Arnold
Schwarzenegger of California signed S.B. 375 to inte-grate greenhouse gas emissions into California’stransportation planning decisions. Under the law,the California Air Resources Board will work withCalifornia’s 18 metropolitan planning organizations
to align their regional transportation, housing, andland-use plans and prepare a “sustainable communi-ties strategy” to reduce vehicle-miles traveled in theirrespective areas and demonstrate the region’s abilityto meet its greenhouse gas reduction targets.1
International: United Nations Framework Convention on Climate Change and the Kyoto ProtocolCOP-13 and CMP-3
In December 2007, the Thirteenth Conference of theParties to the United Nation’s Framework Conventionon Climate Change (COP-13) and the Third Meeting ofthe Parties to the Kyoto Protocol (CMP-3) were held inNusa Dua, Bali. Key areas included:
• Launch of a negotiating process with the expectationof reaching a comprehensive post-2012 agreement in2009 (COP-13 and CMP-3)
• Agreement by developing countries to considertaking “measurable, reportable, and verifiable”mitigation actions, while receiving technologicaland financial support from developed countries(COP-13)
• Agreement by developed countries to consider mak-ing “commitments or actions, quantified emissionlimitation and reduction objectives,” including mak-ing binding targets an option (COP-13)
• Reconstitution of the Expert Group on TechnologyTransfer for 5 more years, with a new mandate toevaluate technology transfer efforts and develop rec-ommendations for strengthening the efforts in apost-2012 agreement (COP-13)
• Adoption of a decision encouraging countries withtropical forests to undertake demonstration activi-ties, particularly the development of national emis-sion baselines, and provide indicative guidance forsuch projects (COP-13)
• Setting of parameters for a thorough review of theKyoto Protocol for CMP-4, including the scope and
effectiveness of the flexibility mechanisms, progressby developed countries in implementing their commit-ments on finance and technology for developing coun-tries, and the possibility of extending to the otherflexibility mechanisms the levy now applied to cleandevelopment mechanism (CDM) transactions to sup-port the Protocol’s Adaptation Fund(CMP-3)
• Resolution of long-standing differences on the gover-nance of the Adaptation Fund, including establishing a16-member Adaptation Fund Board to manage thefund on behalf of CMP (CMP-3).
COP-14 and CMP-4
Poland will host COP-14 and CMP-4 in Poznañ, December
1-12, 2008. Parties are expected to:
• Agree on a plan of action and programs of work for thefinal year of negotiations after a year of comprehensiveand extensive discussions on crucial issues relating tofuture commitments, actions, and cooperation
• Make significant progress on several issues required toenhance further the implementation of the Conventionand the Kyoto Protocol
• Advance understanding and commonality of views ona “shared vision” for a new climate change regimebeyond the Kyoto Protocol
• Strengthen momentum and commitment to the pro-cess and the agreed timeline
• Discuss capacity-building for developing countries,reducing emissions from deforestation, and technol-ogy transfer and adaptation.
1State of California, Office of the Governor, “Governor Schwarzenegger Signs Sweeping Legislation To Reduce Greenhouse Gas Emis-sions Through Land-Use,” Press Release GAAS:694:08 (September 30, 2008), web site http://gov.ca.gov/press-release/10697.
1State of California, Office of the Governor, “Governor Schwarzenegger Signs Sweeping Legislation To Reduce Greenhouse Gas Emis-sions Through Land-Use,” Press Release GAAS:694:08 (September 30, 2008), web site http://gov.ca.gov/press-release/10697.

Greenhouse Gas Emissions OverviewUnits for Measuring Greenhouse Gases
Overview Carbon Dioxide Methane Nitrous Oxide High-GWP Gases Land Use
10 Energy Information Administration / Emissions of Greenhouse Gases in the United States 2007
Emissions data are reported here in metric units, asfavored by the international scientific community.Metric tons are relatively intuitive for users of U.S.measurement units, because 1 metric ton is only about10 percent heavier than a short ton.
Throughout this report, emissions of carbon dioxideand other greenhouse gases are given in carbon diox-ide equivalents. In the case of carbon dioxide, emis-sions denominated in the molecular weight of the gasor in carbon dioxide equivalents are the same. Carbondioxide equivalent data can be converted to carbonequivalents by multiplying by 12/44.
Emissions of other greenhouse gases (such as methane)can also be measured in carbon dioxide equivalentunits by multiplying their emissions (in metric tons) bytheir global warming potentials (GWPs). Carbon diox-ide equivalents are the amount of carbon dioxide
by weight emitted into the atmosphere that would pro-duce the same estimated radiative forcing as a givenweight of another radiatively active gas.
Carbon dioxide equivalents are computed by multiply-ing the weight of the gas being measured (for example,methane) by its estimated GWP (which is 25 for meth-ane). In 2007, the Intergovernmental Panel on ClimateChange (IPCC) Working Group I released its FourthAssessment Report, Climate Change 2007: The PhysicalScience Basis.2 Among other things, the Fourth Assess-ment Report updated a number of the GWP estimatesthat appeared in the IPCC’s Third Assessment Report.3
The GWPs published in the Fourth Assessment Reportwere used for the calculation of carbon dioxide equiva-lent emissions for this report. Table 4 on page 11 sum-marizes the GWP values from the Second, Third, andFourth Assessment Reports.
2Intergovernmental Panel on Climate Change, Climate Change 2007: The Physical Science Basis (Cambridge, UK: Cambridge UniversityPress, 2007), web site www.ipcc.ch/ipccreports/ar4-wg1.htm.
3Intergovernmental Panel on Climate Change, Climate Change 2001: The Scientific Basis (Cambridge, UK: Cambridge University Press,2001), web site www.ipcc.ch/ipccreports/tar/wg1/index.htm.

Greenhouse Gas Emissions OverviewUnits for Measuring Greenhouse Gases
Overview Carbon Dioxide Methane Nitrous Oxide High-GWP Gases Land Use
Energy Information Administration / Emissions of Greenhouse Gases in the United States 2007 11
Table 4. Greenhouse Gases and 100-Year Net Global Warming Potentials
Greenhouse Gas Chemical Formula
Global Warming Potential
SARa TARb AR4c
Carbon Dioxide . . . . . . . . . . . . . . . . . . . . . . . . . . . . . . . CO21 1 1
Methane . . . . . . . . . . . . . . . . . . . . . . . . . . . . . . . . . . . . . CH4 21 23 25
Nitrous Oxide . . . . . . . . . . . . . . . . . . . . . . . . . . . . . . . . N2O 310 296 298
Hydrofluorocarbons
HFC-23 (Trifluoromethane). . . . . . . . . . . . . . . . . . . . . . CHF3 11,700 12,000 14,800
HFC-32 (Difluoromethane) . . . . . . . . . . . . . . . . . . . . . . CH2F2 650 550 675
HFC-41 (Monofluoromethane) . . . . . . . . . . . . . . . . . . . CH3F 150 97 —
HFC-125 (Pentafluoroethane). . . . . . . . . . . . . . . . . . . . CHF2CF3 2,800 3,400 3,500
HFC-134 (1,1,2,2-Tetrafluoroethane) . . . . . . . . . . . . . . CHF2CHF2 1,000 1,100 —
HFC-134a (1,1,1,2-Tetrafluoroethane) . . . . . . . . . . . . . CH2FCF3 1,300 1,300 1,430
HFC-143 (1,1,2-Trifluoroethane). . . . . . . . . . . . . . . . . . CHF2CH2F 300 330 —
HFC-143a (1,1,1-Trifluoroethane). . . . . . . . . . . . . . . . . CF3CH3 3,800 4,300 4,470
HFC-152 (1,2-Difluoroethane) . . . . . . . . . . . . . . . . . . . CH2FCH2F — 43 —
HFC-152a (1,1-Difluoroethane) . . . . . . . . . . . . . . . . . . CH3CHF2 140 120 124
HFC-161 (Ethyl Fluoride) . . . . . . . . . . . . . . . . . . . . . . . CH3CH2F — 12 —
HFC-227ea (Heptafluoropropane) . . . . . . . . . . . . . . . . CF3CHFCF3 2,900 3,500 3,220
HFC-236cb (1,1,1,2,2,3-Hexafluoropropane) . . . . . . . . CH2FCF2CF3 — 1,300 —
HFC-236ea (1,1,1,2,3,3-Hexafluoropropane) . . . . . . . . CHF2CHFCF3 — 1,200 —
HFC-236fa (1,1,1,3,3,3-Hexafluoropropane) . . . . . . . . CF3CH2CF3 6,300 9,400 9,810
HFC-245ca (1,1,2,2,3-Pentafluoropropane) . . . . . . . . . CH2FCF2CHF2 560 640 —
HFC-245fa (1,1,1,3,3-Pentafluoropropane) . . . . . . . . . CHF2CH2CF3 — 950 1,030
HFC-365mfc (Pentafluorobutane). . . . . . . . . . . . . . . . . CF3CH2CF2CH3 — 890 794
HFC-43-10mee (Decafluoropentane) . . . . . . . . . . . . . . CF3CHFCHFCF2CF3 1,300 1,500 1,640
Perfluorocarbons
Perfluoromethane . . . . . . . . . . . . . . . . . . . . . . . . . . . . . CF4 6,500 5,700 7,390
Perfluoroethane . . . . . . . . . . . . . . . . . . . . . . . . . . . . . . C2F6 9,200 11,900 12,200
Perfluoropropane . . . . . . . . . . . . . . . . . . . . . . . . . . . . . C3F8 7,000 8,600 8,830
Perfluorobutane (FC 3-1-10). . . . . . . . . . . . . . . . . . . . . C4F10 7,000 8,600 8,860
Perfluorocyclobutane . . . . . . . . . . . . . . . . . . . . . . . . . . c-C4F8 8,700 10,000 10,300
Perfluoropentane . . . . . . . . . . . . . . . . . . . . . . . . . . . . . C5F12 7,500 8,900 9,160
Perfluorohexane (FC 5-1-14) . . . . . . . . . . . . . . . . . . . . C6F14 7,400 9,000 9,300
Sulfur Hexafluoride. . . . . . . . . . . . . . . . . . . . . . . . . . . . SF6 23,900 22,200 22,800
Sources: aIntergovernmental Panel on Climate Change, Climate Change 1995: The Science of Climate Change (Cambridge, UK: CambridgeUniversity Press, 1996). bIntergovernmental Panel on Climate Change, Climate Change 2001: The Scientific Basis (Cambridge, UK: CambridgeUniversity Press, 2001), web site www.ipcc.ch/ipccreports/tar/wg1/index.htm. cIntergovernmental Panel on Climate Change, Climate Change2007: The Physical Science Basis (Cambridge, UK: Cambridge University Press, 2007), web site www.ipcc.ch/ipccreports/ar4-wg1.htm.

Methodology Updates for This Report
Overview Carbon Dioxide Methane Nitrous Oxide High-GWP Gases Land Use
12 Energy Information Administration / Emissions of Greenhouse Gases in the United States 2007
Carbon Dioxide
EIA has begun using a separate carbon coefficientfor net imports of metallurgical coke, based on IPCCguidelines. The new coefficient more accuratelyreflects the carbon content of imported coke. The car-bon in coke that is domestically produced, and the car-bon dioxide emissions from that coke, are counted inthe amount of domestic coking coal consumed. For netcoke imports, however, it was decided that the new,higher carbon coefficient should be used. Although thedifference between the two coefficients is about 14 per-cent, the amount of coke imported is relatively small.Thus, the increase in calculated carbon dioxide emis-sions resulting from the change in coefficients is in therange of 1 to 3 million metric tons for most years overthe 1990-2007 period.
Estimates of carbon dioxide emissions from natural gascombustion have been adjusted upward, to reflectincreasing concentrations of carbon dioxide in the nat-ural gas produced in the United States in recent years.As a result of the change, the estimates of carbon diox-ide emissions from natural gas combustion for recentyears are about 1 million metric tons higher than thosein last year’s report.
Because of a change in methodology, the estimate ofcarbon dioxide emissions from waste combustion(included in “Other Sources”) has been adjusted down-ward, as most of those emissions are accounted for bygrid-connected waste-to-energy plants in the electricpower sector, which are captured in EIA’s surveys. Theresult of this change is a reduction of 3 to 4 million met-ric tons per year from 1990 to 2007.
An error in the calculation code caused emissions fromindustrial lubricants to be omitted from total emissionsin EIA’s emissions inventory reports for 2005 and 2006.Although lubricants are a nonfuel use, there are emis-sions associated with their use. Emissions from thissource are again included in total emissions in thisyear’s report. As a result of the correction, the estimatesof total U.S. carbon dioxide emissions are higher byabout 6 to 7 million metric tons per year from 1990 to2007 than those in the 2005 and 2006 data reports.
Other changes reflect revisions in the underlying activ-ity data. For example, in the 2006 data report, theamount of natural gas consumed in the United States in2005 was estimated at 22,241 billion cubic feet, whereasin this year’s report the estimate for 2005 is 22,011
billion cubic feet. As a result, the estimate for carbondioxide emissions from natural gas combustion in 2005is about 10 million metric tons lower in this year’sreport than in last year’s report.
Methane
In its Fourth Assessment Report (AR4),4 the IPCCdeveloped revised global warming potential factors(GWPs) for selected gases. The GWP for methane wasrevised from the previously published value of 23 inthe IPCC’s Third Assessment Report5 to 25 in theFourth Assessment Report. The revised GWP for meth-ane is used in this report. In addition, this report incor-porates an increase in the density of methane from42.28 to 42.37 pounds per thousand cubic feet, in orderto provide consistent temperature and pressure valuesfor methane in all EIA data.
Nitrous Oxide
The IPCC also updated the GWP for nitrous oxide in itsFourth Assessment Report, to 298, up from 296 in theIPCC’s Third Assessment Report. The revised GWP fornitrous oxide is used in this report.
High-GWP Gases
The IPCC also updated GWPs for most of the high-GWP emissions sources in its Fourth Assessment Re-port. The revised GWPs are included in Table 4 on page11, under “Units for Measuring Greenhouse Gases.”
Land Use
Forest Land Remaining Forest Land is the major sourceof change in net carbon dioxide flux resulting fromland use. In this report, the addition of newly availableforest inventory data, as well as some refinements toprevious data, involved the following major changes:incorporating and updating State and sub-State inven-tory data; and including a portion of Alaskan forest forthe first time. In addition, minor refinements to the cal-culation of flux from harvested wood productsincluded: a shorter half-life for decay in dumps; andseparation of decay in dumps from decay in landfills.Overall, these changes, in combination with adjust-ments in the other sources/sinks within the land-usecategory, resulted in an average annual increase of 20.1million metric tons carbon dioxide equivalent (2.5 per-cent) in net carbon flux to the atmosphere from LandUse, Land-Use Change, and Forestry for the years 1990through 2005.
4S.D. Solomon, D. Qin, M. Manning, Z. Chen, M. Marquis, K.B. Avervt, M. Tignor, and H.L. Miller (Eds.), Climate Change 2007: The Physi-cal Science Basis (Cambridge, UK: Cambridge University Press, 2007), web site www.ipcc.ch/ipccreports/ar4-wg1.htm.
5J.T. Houghton, Y. Ding, D.J. Griggs, M. Noguer, P.J. van der Linden, and D. Xiaosu (Eds.), Climate Change 2001: The Scientific Basis (Cam-bridge, UK: Cambridge University Press, 2001), web site www.ipcc.ch/ipccreports/tar/wg1/index.htm.

Carbon Dioxide EmissionsTotal Emissions
Overview Carbon Dioxide Methane Nitrous Oxide High-GWP Gases Land Use
Energy Information Administration / Emissions of Greenhouse Gases in the United States 2007 13
Summary• Total U.S. carbon dioxide emissions in 2007 in-
creased by 75.9 million metric tons (1.3 percent) com-pared with 2006 emissions (Figure 5), to 6,022 millionmetric tons (MMT). The increase offset a 1.4-percentdrop in 2006 (to 5,946 MMT), raising the total backclose to the 2005 level (6,032 MMT).
• The important factors that contributed to the in-crease in carbon dioxide emissions in 2007 included:unfavorable weather, with both heating and coolingdegree-days above 2006 levels (see box on page 15);and the combination of a 2.5-percent increase in elec-tricity demand and a 14.2-percent decline in
hydropower generation that resulted in a 2.9-percentincrease in emissions from the electric power sector.
• Energy-related carbon dioxide emissions account for98 percent of U.S. carbon dioxide emissions (Table 5).The vast majority of carbon dioxide emissions comefrom fossil fuel combustion, with smaller amountsfrom the nonfuel use of energy inputs, and the totaladjusted for emissions from U.S. Territories and inter-national bunker fuels. Other sources include emissionsfrom industrial processes, such as cement and lime-stone production.
U.S. Anthropogenic Carbon Dioxide Emissions,1990, 2006, and 2007
1990 2006 2007
Estimated Emissions(Million Metric Tons) . . . . . . 5,021.4 5,945.8 6,021.8
Change from 1990(Million Metric Tons) . . . . . . . . . . . . . . 924.5 1,000.4(Percent) . . . . . . . . . . . . . . . . . . . . . . . 18.4% 19.9%
Average Annual Changefrom 1990 (Percent) . . . . . . . . . . . . . . 1.1% 1.1%
Change from 2006(Million Metric Tons) . . . . . . . . . . . . . . . . . . . . . . 75.9(Percent) . . . . . . . . . . . . . . . . . . . . . . . . . . . . . . . 1.3%
-48
11
1
12
3
86
55
18
6
77
27 7
0
18
5
-86
74
58 8
5
8
-86
76
1991
1992
1993
1994
1995
1996
1997
1998
1999
2000
2001
2002
2003
2004
2005
2006
2007
0
100
200
300
-100
-200
Million Metric Tons Carbon Dioxide
Figure 5. Annual Change in U.S. Carbon DioxideEmissions, 1990-2007
Source: EIA estimates.
Table 5. U.S. Carbon Dioxide Emissions from Energy and Industry, 1990, 1995, and 2000-2007(Million Metric Tons Carbon Dioxide)
Fuel Type or Process 1990 1995 2000 2001 2002 2003 2004 2005 2006 P2007
Energy ConsumptionPetroleum. . . . . . . . . . . . . . . . . . 2,178.8 2,206.1 2,459.0 2,470.2 2,467.7 2,512.4 2,602.8 2,619.9 2,596.2 2,579.9Coal . . . . . . . . . . . . . . . . . . . . . . 1,799.9 1,898.9 2,146.4 2,084.4 2,094.1 2,131.3 2,157.6 2,161.2 2,139.8 2,162.4Natural Gas . . . . . . . . . . . . . . . . 1,033.6 1,193.0 1,239.8 1,189.3 1,245.7 1,212.6 1,194.2 1,182.6 1,158.9 1,237.0Renewablesa . . . . . . . . . . . . . . . 6.3 10.5 10.6 11.2 13.1 11.8 11.5 11.6 11.8 11.6
Energy Subtotal . . . . . . . . . . . 5,018.7 5,308.5 5,855.8 5,755.1 5,820.6 5,868.1 5,966.2 5,975.3 5,906.7 5,990.9
Nonfuel Use Emissions b . . . . . . . 98.8 105.5 110.8 105.8 106.2 103.9 112.1 107.0 111.5 117.6
Nonfuel Use Sequestration c . . . . 251.2 286.5 308.2 293.8 293.9 289.6 311.9 302.3 302.0 301.5
Adjustments to Energy . . . . . . . . . -82.4 -62.4 -60.9 -45.3 -37.8 -28.3 -44.3 -46.5 -66.8 -74.2
Adjusted Energy Subtotal . . . . . 4,936.3 5,246.0 5,794.8 5,709.9 5,782.8 5,839.7 5,921.9 5,928.9 5,839.9 5,916.7Other Sources . . . . . . . . . . . . . . . 85.1 102.3 97.8 97.0 97.7 98.9 102.0 103.4 105.9 105.1
Total. . . . . . . . . . . . . . . . . . . . . . . 5,021.4 5,348.4 5,892.6 5,806.9 5,880.5 5,938.7 6,023.9 6,032.3 5,945.8 6,021.8aIncludes emissions from electricity generation using nonbiogenic municipal solid waste and geothermal energy.bEmissions from nonfuel uses are included in the energy subtotal above.cThe Btu value of carbon sequestered by nonfuel uses is subtracted from energy consumption before emissions are calculated.P = preliminary data.Notes: Data in this table are revised from the data contained in the previous EIA report, Emissions of Greenhouse Gases in the United States
2006, DOE/EIA-0573(2006) (Washington, DC, November 2007). Totals may not equal sum of components due to independent rounding. Adjustedenergy subtotal includes U.S. Territories but excludes international bunker fuels.
Source: EIA estimates.

Carbon Dioxide EmissionsEnergy-Related Emissions
Overview Carbon Dioxide Methane Nitrous Oxide High-GWP Gases Land Use
14 Energy Information Administration / Emissions of Greenhouse Gases in the United States 2007
Summary• Energy-related carbon dioxide emissions account for
more than 80 percent of U.S. greenhouse gas emis-sions. EIA breaks energy use into four end-use sec-tors (Table 6), and emissions from the electric powersector are attributed to the end-use sectors.
• Growth in energy-related carbon dioxide emissionshas resulted largely from increases associated withelectric power generation and transportation fueluse. All other energy-related carbon dioxide emis-sions (from direct fuel use in the residential, com-mercial, and industrial sectors) have been either flator declining in recent years (Figure 6).
• Reasons for the growth in electric power and trans-portation sector emissions include: increased
demand for electricity for computers and electronics inhomes and offices; strong growth in demand for com-mercial lighting and cooling; substitution of new elec-tricity-intensive technologies, such as electric arcfurnaces for steelmaking, in the industrial sector; andincreased demand for transportation services as aresult of relatively low fuel prices and robust economicgrowth in the 1990s and early 2000s.6
• Other U.S. energy-related carbon dioxide emissionshave remained flat or declined, for reasons that includeincreased efficiencies in heating technologies, as wellas declining activity in older “smokestack” industriesand the growing importance of less energy-intensiveindustries, such as computers and electronics.
U.S. Energy-Related Carbon Dioxide Emissions,1990, 2006, and 2007
1990 2006 2007
Estimated Emissions(Million Metric Tons) . . . . . . 5,018.7 5,906.7 5,990.9
Change from 1990(Million Metric Tons) . . . . . . . . . . . . . . 888.0 972.2(Percent) . . . . . . . . . . . . . . . . . . . . . . . 17.7% 19.4%
Average Annual Changefrom 1990 (Percent) . . . . . . . . . . . . . . 1.0% 1.0%
Change from 2006(Million Metric Tons) . . . . . . . . . . . . . . . . . . . . . . 84.2(Percent) . . . . . . . . . . . . . . . . . . . . . . . . . . . . . . . 1.4%
� �� � � � � � � � � � � � � � � ��
�
� � � � � � � � � � � � � � � ��
�
� � � � � � �� �
� � � � � � �
199019
9119
9219
9319
9419
9519
9619
9719
9819
9920
0020
0120
0220
0320
0420
0520
0620
070
500
1,000
1,500
2,000
2,500Million Metric Tons
Electric Power Sector�
All Other�
Transportation�
Figure 6. U.S. Energy-Related Carbon DioxideEmissions by Sector, 1990-2007
Source: EIA estimates.
Table 6. U.S. Energy-Related Carbon Dioxide Emissions by End-Use Sector, 1990, 1995, and 2000-2007(Million Metric Tons Carbon Dioxide)
Sector 1990 1995 2000 2001 2002 2003 2004 2005 2006 P2007
Residential . . . . . . . . . . . . . . . . . . 961.7 1,039.2 1,181.6 1,168.3 1,196.3 1,224.6 1,220.7 1,254.9 1,197.9 1,249.5Commercial . . . . . . . . . . . . . . . . . 787.5 848.4 1,015.2 1,020.1 1,017.9 1,027.1 1,042.3 1,060.2 1,043.0 1,087.4Industrial. . . . . . . . . . . . . . . . . . . . 1,686.9 1,738.6 1,786.4 1,715.8 1,715.5 1,719.1 1,744.2 1,672.3 1,652.4 1,639.7Transportation . . . . . . . . . . . . . . . 1,582.6 1,682.2 1,872.6 1,850.9 1,890.9 1,897.2 1,958.9 1,988.0 2,013.4 2,014.4
Total. . . . . . . . . . . . . . . . . . . . . . . 5,018.7 5,308.5 5,855.8 5,755.1 5,820.6 5,868.1 5,966.2 5,975.3 5,906.7 5,990.9
Electricity Generationa . . . . . . . . . 1,820.4 1,955.1 2,300.9 2,261.3 2,271.1 2,299.0 2,331.2 2,397.4 2,364.1 2,433.4aElectric power sector emissions are distributed across the end-use sectors. Emissions allocated to sectors are unadjusted. Adjustments are
made to total emissions only.P = preliminary data.Notes: Data in this table are revised from the data contained in the previous EIA report, Emissions of Greenhouse Gases in the United States
2006, DOE/EIA-0573(2006) (Washington, DC, November 2007). Totals may not equal sum of components due to independent rounding.Source: EIA estimates.
6This trend leveled off in 2007, and EIA is projecting a 3-percent decline in vehicle-miles traveled for 2008. See web site www.eia.doe.gov/emeu/steo/pub/contents.html.
6This trend leveled off in 2007, and EIA is projecting a 3-percent decline in vehicle-miles traveled for 2008. See web site www.eia.doe.gov/emeu/steo/pub/contents.html.

Carbon Dioxide EmissionsResidential and Commercial Sectors:
Weather Effects on Energy-Related Carbon Dioxide Emissions, 2006 and 2007
Overview Carbon Dioxide Methane Nitrous Oxide High-GWP Gases Land Use
Energy Information Administration / Emissions of Greenhouse Gases in the United States 2007 15
Annual variations in CO2 emissions in the residentialand commercial sectors over the 2005-2007 period illus-trate the impacts that changes in weather can have onemissions in those sectors. Total energy-related CO2emissions for all the end-use sectors combined (resi-dential, commercial, industrial, and transportation)were down in 2006 by about 69 million metric tons(MMT), but in 2007 they were up by about 84 MMT,inviting the question: Why are these years so differentfrom each other?
It is difficult to estimate the relative importance of thedifferent factors that affect year-to-year changes inemissions. Since 1990, energy-related emissions havegrown on average by about 1.0 percent per year. Atcurrent emissions levels that would mean about60 MMT added per year. With U.S. GDP growingby 2.8 percent in 2006 but by only 2.0 percent in2007, why was 2006 emissions growth so far belowaverage (-69 MMT) and 2007 growth above average(+84 MMT)?
One of the most important factors causing deviationsfrom average emissions growth is weather. The tablebelow shows emissions from energy use for heatingand cooling in the residential and commercial sectorsfor 2006 and 2007, and weather adjustments for bothsectors, based on estimates from EIA’s Annual EnergyOutlook 2008.7 In 2006, emissions attributable to spaceheating and space cooling both were lower than in2005; in 2007, both were higher than in 2006.8 Theannual variations can be estimated more precisely byusing changes in heating degree-days (HDD) and cool-ing degree-days (CDD).9 In 2006, both HDD and CDDwere down relative to 2005, reducing both space heat-ing and cooling requirements; in 2007, both HDD andCDD were up relative to 2006, increasing demand forboth heating and cooling.
In the residential sector, CO2 emissions related to heat-ing and cooling in 2006 were estimated to be about
48 and 13 MMT lower than in 2005, respectively, for atotal weather effect of -61 MMT. In the commercial sec-tor, emissions related to heating and cooling in 2006were 10 and 4 MMT lower than in 2005. Thus, for bothsectors, emissions in 2006 were about 76 MMT lowerthan they would have been without the weather effect.The effect is not insignificant: when 2006 emissions inthe two sectors are adjusted for the weather effect, theresult shows an increase of 7 MMT from 2005 to 2006.Similarly, for 2007, the weather effect accounts forabout two-thirds (56 MMT) of the total increase in resi-dential and commercial sector CO2 emissions relativeto 2006.
With the adjustments for weather, the growth of totalenergy-related CO2 emissions in both 2006 and 2007 isbelow the 1.0-percent average growth rate for the1990-2007 period. Other important factors in year-to-year changes in CO2 emissions include total and rela-tive fuel prices, efficiency of electricity generation andthe energy-intensive industries, and the availability ofhydropower, nuclear power, and other low-carbonenergy sources, as well as overall economic growth.
Emissions (MMT CO2) 2005 2006 2007
Residential Space Heating 358 308 345
Change From Previous Year -48 37
Residential Space Cooling 158 141 147
Change From Previous Year -13 6
Residential Weather Adjustment -61 43
Commercial Space Heating 104 94 101
Change From Previous Year -10 7
Commercial Space Cooling 105 99 104
Change From Previous Year -4 5
Commercial Weather Adjustment -14 12
Total Weather Adjustment, Both Sectors -76 56
Total Actual Change (All Sectors) -69 84
Total Weather-Adjusted Change (All Sectors) 7 28
7Carbon emissions factors for the appropriate fuels from this report were applied to Btu values from EIA’s Annual Energy Outlook 2008,Tables A4 and A5, to derive CO2 emissions related to energy consumed for heating and cooling. Cooling-related emissions were estimatedusing an average emissions factor for electricity, although it is likely that the emissions came from peaking generation units with emissionsfactors higher than the average for all generation.
8There is also a weather effect on the industrial sector, where about 7 percent of energy consumption is estimated to be weather-related.Inclusion of the industrial sector in this analysis would increase the weather effect for both years.
9HDD (or CDD) provide a measure of how cold (or warm) a location is over a period of time relative to a base temperature (most com-monly specified as 65oF) and, in energy analysis, an indicator of space heating (or air conditioning) energy requirements or use.

Carbon Dioxide EmissionsResidential Sector
Overview Carbon Dioxide Methane Nitrous Oxide High-GWP Gases Land Use
16 Energy Information Administration / Emissions of Greenhouse Gases in the United States 2007
Summary• Residential sector carbon dioxide emissions origi-
nate primarily from:
– Direct fuel consumption (principally, natural gas)for heating and cooking
– Electricity for cooling (and some heating), forlighting, and increasingly for televisions, comput-ers, and other household electronic devices (Table7).
• Energy consumed for heating in homes and busi-nesses has a large influence on the annual fluctua-tions in energy-related carbon dioxide emissions.
– The 6.5-percent increase in heating degree-days in2007 was the second-largest year-to-year increaseover the period from 1990 to 2007 (Figure 7).
– Although annual changes in cooling degree-dayshave a smaller impact on energy demand, the2.2-percent increase in 2007 contributed to theupward pressure on electricity demand.
– Weather was a key factor behind the 4.3-percentincrease in carbon dioxide emissions from the resi-dential sector in 2007.
• In the longer run, residential emissions are affected bypopulation growth and income. From 1990 to 2007:
– Residential sector carbon dioxide emissions grew byan average of 1.6 percent per year.
– U.S. population grew by an average of 0.9 percentper year.
– Per-capita income (measured in constant dollars)grew by an average of 1.7 percent per year.
Residential Sector Carbon Dioxide Emissions,1990, 2006, and 2007
1990 2006 2007
Estimated Emissions(Million Metric Tons) . . . . . . 961.7 1,197.9 1,249.5
Change from 1990(Million Metric Tons) . . . . . . . . . . . . . . 236.2 287.8(Percent) . . . . . . . . . . . . . . . . . . . . . . . 24.6% 29.9%
Average Annual Changefrom 1990 (Percent) . . . . . . . . . . . . . . 1.4% 1.6%
Change from 2006(Million Metric Tons) . . . . . . . . . . . . . . . . . . . . . . 51.6(Percent) . . . . . . . . . . . . . . . . . . . . . . . . . . . . . . . 4.3%
1991
1992
1993
1994
1995
1996
1997
1998
1999
2000
2001
2002
2003
2004
2005
2006
2007
0
5
10
-5
-10
-15
Annual Percent Change
Emissions
Heating Degree-Days
Figure 7. Annual Changes in U.S. HeatingDegree-Days and Residential Sector CO2
Emissions from Direct Fuel Combustion,1990-2007
Source: EIA estimates.
Table 7. U.S. Carbon Dioxide Emissions from Residential Sector Energy Consumption,1990, 1995, and 2000-2007(Million Metric Tons Carbon Dioxide)Fuel 1990 1995 2000 2001 2002 2003 2004 2005 2006 P2007
Petroleum
Liquefied Petroleum Gas . . 22.7 25.2 35.1 33.3 33.8 35.1 33.1 32.2 32.4 32.8Distillate Fuel . . . . . . . . . . . 71.6 66.2 66.2 66.4 62.9 66.2 67.6 62.5 52.1 52.6Kerosene . . . . . . . . . . . . . . 4.6 5.4 6.8 6.9 4.3 5.1 6.1 6.1 4.8 2.9Petroleum Subtotal . . . . 98.9 96.7 108.1 106.7 101.0 106.4 106.8 100.7 89.2 88.3
Coal . . . . . . . . . . . . . . . . . . . 2.9 1.7 1.0 1.0 1.1 1.2 1.2 0.9 0.6 0.6Natural Gas . . . . . . . . . . . . . 239.8 264.4 270.6 260.1 265.0 277.5 263.7 263.2 237.5 256.9Electricitya . . . . . . . . . . . . . . 620.1 676.4 801.9 800.5 829.1 839.5 849.0 890.1 870.6 903.7
Total. . . . . . . . . . . . . . . . . . . 961.7 1,039.2 1,181.6 1,168.3 1,196.3 1,224.6 1,220.7 1,254.9 1,197.9 1,249.5aShare of total electric power sector carbon dioxide emissions weighted by sales to the residential sector.P = preliminary data.Notes: Data in this table are revised from the data contained in the previous EIA report, Emissions of Greenhouse Gases in the United States
2006, DOE/EIA-0573(2006) (Washington, DC, November 2007). Totals may not equal sum of components due to independent rounding.Source: EIA estimates.

Carbon Dioxide EmissionsCommercial Sector
Overview Carbon Dioxide Methane Nitrous Oxide High-GWP Gases Land Use
Energy Information Administration / Emissions of Greenhouse Gases in the United States 2007 17
Summary• Commercial sector emissions (Table 8) are largely
the result of energy use for lighting, space heating,and space cooling in commercial structures, such asoffice buildings, shopping malls, schools, hospitals,and restaurants.
• Lighting accounts for a larger component of energydemand in the commercial sector (approximately 20percent of total demand in 2006) than in the residen-tial sector (approximately 11 percent of the total).
• Commercial sector emissions are affected less byweather than are residential sector emissions: heat-ing and cooling accounted for approximately 37 per-cent of energy demand in the residential sectorin 2006 but only about 19 percent in the commercialsector.10
• Although weather has a smaller effect on emissions inthe commercial sector than in the residential sector, itcontributed, along with 2-percent economic growth, tothe 4.3-percent increase in 2007—well above the aver-age annual increase from 1990 to 2006.
• In the longer run, trends in emissions from the com-mercial sector parallel economic trends. Commercialsector emissions grew at an average annual rate of 2.0percent from 1990 to 2007—about the same rate asgrowth in real per capita income (Figure 8).
• Emissions from direct fuel consumption in the com-mercial sector declined from 1990 to 2007, while thesector’s electricity-related emissions increased by anaverage of 2.6 percent per year.
Commercial Sector Carbon Dioxide Emissions,1990, 2006, and 2007
1990 2006 2007
Estimated Emissions(Million Metric Tons) . . . . . . 787.5 1,043.0 1,087.4
Change from 1990(Million Metric Tons) . . . . . . . . . . . . . . 255.5 299.8(Percent) . . . . . . . . . . . . . . . . . . . . . . . 32.4% 38.1%
Average Annual Changefrom 1990 (Percent) . . . . . . . . . . . . . . 1.8% 1.9%
Change from 2006(Million Metric Tons) . . . . . . . . . . . . . . . . . . . . . . 44.4
(Percent) . . . . . . . . . . . . . . . . . . . . . . . . . . . . . . . 4.3%
�
�
� � �� �
��
��
� � � ��
��
�
�
� �� �
��
�� �
� � � � ��
�
1990
1991
1992
1993
1994
1995
1996
1997
1998
1999
2000
2001
2002
2003
2004
2005
2006
2007
80
100
120
140Index, 1990 = 100
Emissions
Per Capita Income�
�
Figure 8. U.S. Commercial Sector CO2 Emissionsand Per Capita Income, 1990-2007
Source: EIA estimates.
Table 8. U.S. Carbon Dioxide Emissions from Commercial Sector Energy Consumption,1990, 1995, and 2000-2007(Million Metric Tons Carbon Dioxide)Fuel 1990 1995 2000 2001 2002 2003 2004 2005 2006 P2007
Petroleum
Motor Gasoline . . . . . . . . . . 7.8 1.3 3.2 2.7 3.2 4.2 3.1 3.2 3.2 3.1Liquefied Petroleum Gas. . . 4.0 4.4 6.2 5.9 6.0 6.2 5.8 5.7 5.7 5.8Distillate Fuel. . . . . . . . . . . . 39.2 35.0 35.9 37.2 32.5 35.2 34.4 32.7 29.3 29.6Residual Fuel . . . . . . . . . . . 18.1 11.1 7.2 5.5 6.3 8.8 9.7 9.1 5.9 6.2Kerosene. . . . . . . . . . . . . . . 0.9 1.6 2.1 2.3 1.2 1.3 1.5 1.6 1.1 0.7Petroleum Subtotal . . . . . 70.0 53.5 54.6 53.5 49.1 55.7 54.5 52.3 45.3 45.4
Coal. . . . . . . . . . . . . . . . . . . . 11.8 11.1 8.2 8.4 8.4 7.9 9.7 9.0 6.3 6.8Natural Gas . . . . . . . . . . . . . . 143.1 165.4 172.7 164.9 171.0 174.7 169.5 163.8 154.1 163.4Electricitya . . . . . . . . . . . . . . . 562.6 618.4 779.7 793.3 789.4 788.8 808.6 835.0 837.3 871.7
Total . . . . . . . . . . . . . . . . . . . 787.5 848.4 1,015.2 1,020.1 1,017.9 1,027.1 1,042.3 1,060.2 1,043.0 1,087.4aShare of total electric power sector carbon dioxide emissions weighted by sales to the commercial sector.P = preliminary data.Notes: Data in this table are revised from the data contained in the previous EIA report, Emissions of Greenhouse Gases in the United States
2006, DOE/EIA-0573(2006) (Washington, DC, November 2007). Totals may not equal sum of components due to independent rounding.Source: EIA estimates.
10Energy Information Administration, Annual Energy Outlook 2008, DOE/EIA-0383(2008) (Washington, DC, June 2008), Tables A4 andA5, web site www.eia.doe.gov/oiaf/aeo/excel/aeo_base.xls.
10Energy Information Administration, Annual Energy Outlook 2008, DOE/EIA-0383(2008) (Washington, DC, June 2008), Tables A4 andA5, web site www.eia.doe.gov/oiaf/aeo/excel/aeo_base.xls.

Carbon Dioxide EmissionsIndustrial Sector
Overview Carbon Dioxide Methane Nitrous Oxide High-GWP Gases Land Use
18 Energy Information Administration / Emissions of Greenhouse Gases in the United States 2007
Summary• Unlike commercial sector emissions, trends in U.S.
industrial sector emissions (Table 9) have not fol-lowed economic growth trends. In 2007, industrialcarbon dioxide emissions fell by 0.8 percent from2006 and were 2.8 percent below their 1990 level.
• Decreases in industrial sector carbon dioxide emis-sions have resulted largely from erosion of the olderenergy-intensive (specifically, coal-intensive) U.S.industrial base.
• Coke plants consumed 22.7 million short tons of coalin 2007, down from 38.9 million short tons in 1990.Other industrial coal consumption declined from
76.3 million short tons in 1990 to 56.5 million short tonsin 2007, as reflected by the drop in emissions from coalshown in Figure 9.
• The share of manufacturing activity represented byless energy-intensive industries, such as computerchip and electronic component manufacturing, hasincreased, while the share represented by the moreenergy-intensive industries has fallen.
• By fuel, only petroleum and purchased electricity usein 2007 were above 1990 levels for the commercial sec-tor. Coal use has fallen since 1990, and natural gas use,which rose in the 1990s, has fallen since 2000.
Industrial Sector Carbon Dioxide Emissions,1990, 2006, and 2007
1990 2006 2007
Estimated Emissions(Million Metric Tons) . . . . . . 1,686.9 1,652.4 1,639.7
Change from 1990(Million Metric Tons) . . . . . . . . . . . . . . -34.5 -47.2(Percent) . . . . . . . . . . . . . . . . . . . . . . . -2.0% -2.8%
Average Annual Changefrom 1990 (Percent) . . . . . . . . . . . . . . -0.1% -0.2%
Change from 2006(Million Metric Tons) . . . . . . . . . . . . . . . . . . . . . . -12.8(Percent) . . . . . . . . . . . . . . . . . . . . . . . . . . . . . . . -0.8%
� ��� � � �
� � � � �� � � �
� �� �� � � � � � � � � �
� � � � � ��
�
�
� �� �
�� �
�� � � �
� � �
��
�� � �
�� � �
� �
� �� �
� �
�
�
�� � � � � � �
� � �� � �
� �
1990
1991
1992
1993
1994
1995
1996
1997
1998
1999
2000
2001
2002
2003
2004
2005
2006
2007
40
60
80
100
120Index, 1990 = 100
Coal�
Natural Gas�
Electricity�
Emissions�
Petroleum�
Figure 9. U.S. Industrial Sector CO2 Emissionsand Major Industrial Fuel Use, 1990-2007
Source: EIA estimates.
Table 9. U.S. Carbon Dioxide Emissions from Industrial Sector Energy Consumption,1990, 1996, and 2000-2007(Million Metric Tons Carbon Dioxide)Fuel 1990 1995 2000 2001 2002 2003 2004 2005 2006 P2007
PetroleumMotor Gasoline . . . . . . . . . . 13.1 14.1 10.6 20.7 21.7 22.6 26.0 24.7 24.9 24.7Liquefied Petroleum Gas . . 40.1 46.6 58.2 50.4 56.1 51.7 57.0 53.2 52.6 52.8Distillate Fuel . . . . . . . . . . . 83.9 82.4 87.4 94.7 87.7 82.7 88.4 92.0 92.0 90.6Residual Fuel . . . . . . . . . . . 30.6 24.5 16.7 13.8 13.2 15.6 17.9 20.4 17.1 17.8Asphalt and Road Oil . . . . . 0.0 0.0 0.0 0.0 0.0 0.0 0.0 0.0 0.0 0.0Lubricants . . . . . . . . . . . . . . 6.9 6.6 7.0 6.5 6.4 5.9 6.0 5.9 5.8 6.0Kerosene . . . . . . . . . . . . . . 0.9 1.1 1.1 1.7 1.0 1.7 2.0 2.8 2.2 1.3Petroleum Coke . . . . . . . . . 63.8 66.9 74.1 77.0 76.2 76.0 82.8 79.1 82.0 71.5Other Petroleum . . . . . . . . . 125.4 112.5 115.9 130.3 127.6 137.7 140.3 137.5 143.3 141.6Petroleum Subtotal. . . . . 364.8 354.7 371.1 395.0 389.9 394.0 420.3 415.7 419.9 406.4
Coal . . . . . . . . . . . . . . . . . . . 250.3 225.9 214.1 215.3 205.2 205.8 208.1 182.4 179.2 172.2Coal Coke Net Imports . . . . 0.6 7.0 7.5 3.3 6.9 5.8 15.7 5.0 7.1 3.1Natural Gas . . . . . . . . . . . . . 436.7 494.0 478.1 438.4 464.5 447.5 431.3 401.8 394.8 404.9Electricitya . . . . . . . . . . . . . . 634.5 657.1 715.7 663.9 649.0 666.1 668.8 667.3 651.5 653.0
Totalb . . . . . . . . . . . . . . . . . . 1,686.9 1,738.6 1,786.4 1,715.8 1,715.5 1,719.1 1,744.2 1,672.3 1,652.4 1,639.7aShare of total electric power sector carbon dioxide emissions weighted by sales to the industrial sector.bIncludes emissions from nonfuel uses of fossil fuels. See Table 12 for details by fuel category.P = preliminary data.Notes: Data in this table are revised from the data contained in the previous EIA report, Emissions of Greenhouse Gases in the United States
2006, DOE/EIA-0573(2006) (Washington, DC, November 2007). Totals may not equal sum of components due to independent rounding.Source: EIA estimates.

Carbon Dioxide EmissionsTransportation Sector
Overview Carbon Dioxide Methane Nitrous Oxide High-GWP Gases Land Use
Energy Information Administration / Emissions of Greenhouse Gases in the United States 2007 19
Summary• Transportation sector carbon dioxide emissions in
2007 were 431.8 million metric tons higher than in1990 (Table 10), an increase that represents 44 per-cent of the growth in unadjusted energy-related car-bon dioxide emissions from all end-use sectors overthe period.
• The transportation sector has led all U.S. end-usesectors in emissions of carbon dioxide since 1999;however, with higher fuel prices and slower eco-nomic growth in 2007, emissions from the transpor-tation sector were essentially unchanged from their2006 level.
• Petroleum combustion is the largest source of carbondioxide emissions in the transportation sector, asopposed to electricity-related emissions in the otherend-use sectors.
• Increases in ethanol fuel consumption in recent yearshave mitigated the growth in transportation sectoremissions somewhat (emissions from energy inputs toethanol production plants are counted in the industrialsector).
• Transportation sector emissions from gasoline anddiesel fuel combustion generally parallel total vehiclemiles traveled (Figure 10).
Transportation Sector Carbon Dioxide Emissions,1990, 2006, and 2007
1990 2006 2007
Estimated Emissions(Million Metric Tons) . . . . . . 1,582.6 2,013.4 2,014.4
Change from 1990(Million Metric Tons) . . . . . . . . . . . . . . 430.8 431.8(Percent) . . . . . . . . . . . . . . . . . . . . . . . 27.2% 27.3%
Average Annual Changefrom 1990 (Percent) . . . . . . . . . . . . . . 1.5% 1.4%
Change from 2006(Million Metric Tons) . . . . . . . . . . . . . . . . . . . . . . 1.0(Percent) . . . . . . . . . . . . . . . . . . . . . . . . . . . . . . . *
*Less than 0.05 percent.
�
�
� ��
��
� ��
� � �� �
� ��
�
�
��
��
��
��
�� �
� �� � �
1990
1991
1992
1993
1994
1995
1996
1997
1998
1999
2000
2001
2002
2003
2004
2005
2006
2007
80
100
120
140Index, 1990 = 100
Vehicle Miles Traveled
Gasoline and Diesel Emissions�
�
Figure 10. U.S. Vehicle Miles Traveled andCO2 Emissions from Gasoline and DieselTransportation Fuel Use, 1990-2007
Source: EIA estimates.
Table 10. U.S. Carbon Dioxide Emissions from Transportation Sector Energy Consumption,1990, 1995, and 2000-2007(Million Metric Tons Carbon Dioxide)
Fuel 1990 1995 2000 2001 2002 2003 2004 2005 2006 P2007
PetroleumMotor Gasoline . . . . . . . . . 961.7 1,029.7 1,121.9 1,127.1 1,155.8 1,159.5 1,181.3 1,183.4 1,186.0 1,180.5Liquefied Petroleum Gas . . 1.3 1.0 0.7 0.8 0.8 1.0 1.1 1.7 1.7 1.7Jet Fuel . . . . . . . . . . . . . . . 222.6 222.1 253.8 242.8 236.8 231.5 239.8 246.3 239.5 238.0Distillate Fuel . . . . . . . . . . . 267.8 306.9 377.8 387.1 394.5 414.5 433.9 444.4 469.2 472.5Residual Fuel. . . . . . . . . . . 80.1 71.7 69.9 46.1 53.3 45.0 58.3 66.0 71.4 73.5Lubricantsa. . . . . . . . . . . . . 6.5 6.2 6.7 6.1 6.0 5.6 5.6 5.6 5.5 5.6Aviation Gasoline. . . . . . . . 3.1 2.7 2.5 2.4 2.3 2.1 2.2 2.4 2.3 2.2Petroleum Subtotal . . . . 1,543.2 1,640.4 1,833.3 1,812.5 1,849.5 1,859.1 1,922.2 1,949.8 1,975.5 1,974.0
Coal . . . . . . . . . . . . . . . . . . . 0.0 0.0 0.0 0.0 0.0 0.0 0.0 0.0 0.0 0.0Natural Gas. . . . . . . . . . . . . 36.2 38.6 35.6 34.8 37.7 33.6 32.0 33.2 33.2 35.4Electricityb . . . . . . . . . . . . . 3.2 3.2 3.6 3.7 3.6 4.6 4.8 4.9 4.7 5.0
Total . . . . . . . . . . . . . . . . . . 1,582.6 1,682.2 1,872.6 1,850.9 1,890.9 1,897.2 1,958.9 1,988.0 2,013.4 2,014.4aIncludes emissions from nonfuel uses of fossil fuels. See Table 12 for details by fuel category.bShare of total electric power sector carbon dioxide emissions weighted by sales to the transportation sector.P = preliminary data.Notes: Data in this table are revised from the data contained in the previous EIA report, Emissions of Greenhouse Gases in the United States
2006, DOE/EIA-0573(2006) (Washington, DC, November 2007). Totals may not equal sum of components due to independent rounding.Source: EIA estimates.

Carbon Dioxide EmissionsElectric Power Sector
Overview Carbon Dioxide Methane Nitrous Oxide High-GWP Gases Land Use
20 Energy Information Administration / Emissions of Greenhouse Gases in the United States 2007
Summary• The electric power sector transforms primary energy
inputs into electricity. The sector consists of compa-nies whose primary business is the generation ofelectricity.
• Carbon dioxide emissions from electric power gen-eration rose by 2.9 percent in 2007 (Table 11). Theincrease resulted from growth in total electricitygeneration (2.5 percent) and an increase in the car-bon intensity of the electricity supply (0.4 percent).
• Higher overall carbon intensity of power generationin 2007 was the result of a large drop in generationfrom hydropower resources (down by 40 billionkilowatthours), which more than offset increases ingeneration from wind and nuclear power plants (up
by 6 and 19 billion kilowatthours, respectively). Whilenuclear generation rose by 2.4 percent from 2006 to2007, generation from renewable fuels—includinghydropower—fell by 9.6 percent, and generation fromfossil fuels increased by 4.1 percent.
• From 2000 to 2007, as the overall efficiency of U.S. elec-tricity generation has increased, there has been adecline in electric power sector energy losses11 relativeto total sales, which has helped to mitigate the sector’scarbon dioxide emissions (Figure 11). For example,generation from natural gas rose by 57 percent from2000 to 2007, but emissions from natural-gas-fired gen-eration rose by only 33 percent over the same period.
Electric Power Sector Carbon Dioxide Emissions,1990, 2006, and 2007
1990 2006 2007
Estimated Emissions(Million Metric Tons) . . . . . . 1,820.4 2,364.1 2,433.4
Change from 1990(Million Metric Tons) . . . . . . . . . . . . . . 543.7 613.1(Percent) . . . . . . . . . . . . . . . . . . . . . . . 29.9% 33.7%
Average Annual Changefrom 1990 (Percent) . . . . . . . . . . . . . . 1.6% 1.7%
Change from 2006(Million Metric Tons) . . . . . . . . . . . . . . . . . . . . . . 69.4(Percent) . . . . . . . . . . . . . . . . . . . . . . . . . . . . . . . 2.9%
�
�
� �� �
�� �
����� �
�� �
�
�
� ����� �
��� �
� ��� �
�
�
� �
� � ���
� �
�� � �
���
199019
9119
9219
9319
9419
9519
9619
9719
9819
9920
0020
0120
0220
0320
0420
0520
0620
0770
80
90
100
110Index, 2000 = 100
Emissions
Power Sector Sales
Power Sector Losses
�
�
�
Figure 11. U.S. Electric Power Sector EnergySales and Losses and CO2 Emissions fromPrimary Fuel Combustion, 1990-2007
Source: EIA estimates.
Table 11. U.S. Carbon Dioxide Emissions from Electric Power Sector Energy Consumption,1990, 1995, and 2000-2007(Million Metric Tons Carbon Dioxide)
Fuel 1990 1995 2000 2001 2002 2003 2004 2005 2006 P2007
Petroleum
Residual Fuel Oil . . . . . . 92.0 45.1 69.5 80.1 52.3 69.0 69.8 69.8 34.9 37.1
Distillate Fuel Oil. . . . . . . 7.1 7.9 12.8 12.5 9.3 11.7 8.1 8.4 6.2 7.4
Petroleum Coke . . . . . . . 2.9 7.8 9.6 10.1 16.6 16.6 21.1 23.2 25.2 21.2
Petroleum Subtotal. . . 101.9 60.7 91.8 102.6 78.2 97.2 99.0 101.3 66.4 65.7
Coal . . . . . . . . . . . . . . . . . 1,534.4 1,653.4 1,915.7 1,856.3 1,872.4 1,910.7 1,922.9 1,963.9 1,946.7 1,979.7
Natural Gas . . . . . . . . . . . 177.7 230.6 282.8 291.1 307.5 279.3 297.7 320.5 339.3 376.4
Municipal Solid Waste . . 5.9 10.1 10.2 10.9 12.7 11.4 11.2 11.2 11.4 11.2
Geothermal . . . . . . . . . . . 0.4 0.4 0.4 0.3 0.4 0.4 0.4 0.4 0.4 0.4
Total . . . . . . . . . . . . . . . . . 1,820.4 1,955.1 2,300.9 2,261.3 2,271.1 2,299.0 2,331.2 2,397.4 2,364.1 2,433.4
P = preliminary data.Notes: Data in this table are revised from the data contained in the previous EIA report, Emissions of Greenhouse Gases in the United States
2006, DOE/EIA-0573(2006) (Washington, DC, November 2007). Emissions for total fuel consumption are allocated to end-use sectors in proportionto electricity sales. Totals may not equal sum of components due to independent rounding.
Source: EIA estimates.
11Electrical system energy losses are calculated as the difference between total primary consumption by the electric power sector and thetotal energy content of retail electricity sales.
11Electrical system energy losses are calculated as the difference between total primary consumption by the electric power sector and thetotal energy content of retail electricity sales.

Carbon Dioxide EmissionsNonfuel Uses of Energy Inputs
Overview Carbon Dioxide Methane Nitrous Oxide High-GWP Gases Land Use
Energy Information Administration / Emissions of Greenhouse Gases in the United States 2007 21
Summary• Nonfuel uses of fossil fuels (for purposes other than
their energy value) create carbon dioxide emissionsand also sequester carbon in nonfuel products.
• In 2007, carbon dioxide emissions from nonfuel usesof energy inputs totaled 117.6 MMT—more than 5percent above the 2006 total (Table 12).
• Carbon sequestration from nonfuel uses of energyinputs in 2007 included 301.5 MMTCO2e that wasembedded in plastics and other nonfuel productsrather than emitted to the atmosphere (see Table 13 onpage 22).
• The 2007 sequestration total was 0.2 percent below the2006 total.
Carbon Dioxide Emissions from Nonfuel Uses ofEnergy Inputs, 1990, 2006, and 2007
1990 2006 2007
Estimated Emissions(Million Metric Tons) . . . . . . . 98.8 111.5 117.6
Change from 1990(Million Metric Tons). . . . . . . . . . . . . . . 12.7 18.8(Percent) . . . . . . . . . . . . . . . . . . . . . . . 12.8% 19.1%
Average Annual Changefrom 1990 (Percent) . . . . . . . . . . . . . . . 0.8% 1.0%
Change from 2006(Million Metric Tons). . . . . . . . . . . . . . . . . . . . . . . 6.2(Percent) . . . . . . . . . . . . . . . . . . . . . . . . . . . . . . . 5.5%
Carbon Sequestration from Nonfuel Uses ofEnergy Inputs, 1990, 2006, and 2007
1990 2006 2007
Estimated Sequestration(Million Metric Tons CO2e) . . 251.2 302.0 301.5
Change from 1990(Million Metric Tons CO2e) . . . . . . . . . . 50.8 50.3(Percent) . . . . . . . . . . . . . . . . . . . . . . . 20.2% 20.0%
Average Annual Changefrom 1990 (Percent) . . . . . . . . . . . . . . . 1.2% 1.1%
Change from 2006(Million Metric Tons CO2e) . . . . . . . . . . . . . . . . . . -0.5(Percent) . . . . . . . . . . . . . . . . . . . . . . . . . . . . . . . -0.2%
Table 12. U.S. Carbon Dioxide Emissions from Nonfuel Use of Energy Fuels, 1990, 1995, and 2000-2007(Million Metric Tons Carbon Dioxide)
End Use and Type 1990 1995 2000 2001 2002 2003 2004 2005 2006 P2007
IndustrialPetroleumLiquefied Petroleum Gases. . . 14.8 19.6 20.5 19.2 20.0 19.1 19.4 18.3 18.7 19.0Distillate Fuel Oil . . . . . . . . . . . 0.3 0.3 0.4 0.4 0.4 0.4 0.4 0.4 0.4 0.4Residual Fuel Oil. . . . . . . . . . . 1.9 2.1 2.2 2.2 1.7 1.7 1.7 1.7 1.7 1.7Asphalt and Road Oil . . . . . . . 0.0 0.0 0.0 0.0 0.0 0.0 0.0 0.0 0.0 0.0Lubricants . . . . . . . . . . . . . . . . 6.9 6.6 7.0 6.5 6.4 5.9 6.0 5.9 5.8 6.0
Other (Subtotal) . . . . . . . . . . . 51.6 52.0 54.2 51.9 53.1 52.9 60.3 56.6 60.8 66.6
Pentanes Plus. . . . . . . . . . . . 1.1 4.1 3.2 2.7 2.3 2.3 2.3 2.0 1.4 1.8Petrochemical Feed . . . . . . . 33.6 36.0 36.8 32.9 33.5 36.5 41.8 38.4 41.0 37.8Petroleum Coke . . . . . . . . . . 9.1 6.8 7.2 10.6 9.8 8.2 12.6 11.7 13.3 21.3Special Naphtha . . . . . . . . . . 7.8 5.2 7.1 5.7 7.5 5.9 3.7 4.6 5.1 5.7Waxes and Miscellaneous . . 0.0 0.0 0.0 0.0 0.0 0.0 0.0 0.0 0.0 0.0Petroleum Subtotal . . . . . . . 75.5 80.6 84.5 80.2 81.6 80.0 87.9 83.1 87.5 93.7
Coal. . . . . . . . . . . . . . . . . . . . . . 0.5 0.7 0.6 0.6 0.5 0.5 0.5 0.5 0.5 0.5Natural Gas. . . . . . . . . . . . . . . . 16.3 18.0 19.1 18.9 18.1 17.8 18.1 17.8 18.1 17.8
Industrial Subtotal . . . . . . . . . . 92.3 99.2 104.2 99.7 100.2 98.3 106.5 101.4 106.0 112.0
TransportationLubricants . . . . . . . . . . . . . . . . . 6.5 6.2 6.7 6.1 6.0 5.6 5.6 5.6 5.5 5.6
Total . . . . . . . . . . . . . . . . . . . . . . 98.8 105.5 110.8 105.8 106.2 103.9 112.1 107.0 111.5 117.6
P = preliminary data.Notes: Emissions from nonfuel use of energy fuels are included in the energy consumption tables in this chapter. Data in this table are revised
from unpublished data used to produce the previous EIA report, Emissions of Greenhouse Gases in the United States 2006, DOE/EIA-0573(2006)(Washington, DC, November 2007). Totals may not equal sum of components due to independent rounding.
Sources: EIA estimates.

Carbon Dioxide EmissionsNonfuel Uses of Energy Inputs
Overview Carbon Dioxide Methane Nitrous Oxide High-GWP Gases Land Use
22 Energy Information Administration / Emissions of Greenhouse Gases in the United States 2007
Table 13. U.S. Carbon Sequestered by Nonfuel Use of Energy Fuels, 1990, 1995, and 2000-2007(Million Metric Tons Carbon Dioxide Equivalent)
End Use and Type 1990 1995 2000 2001 2002 2003 2004 2005 2006 P2007
IndustrialPetroleumLiquefied Petroleum Gases. . . 59.3 78.5 82.1 76.7 79.9 76.3 77.7 73.4 74.7 75.8Distillate Fuel . . . . . . . . . . . . . 0.3 0.3 0.4 0.4 0.4 0.4 0.4 0.4 0.4 0.4Residual Fuel . . . . . . . . . . . . . 1.9 2.1 2.2 2.2 1.7 1.7 1.7 1.7 1.7 1.7Asphalt and Road Oil . . . . . . . 88.5 89.1 96.4 95.0 93.7 92.2 98.6 100.0 95.3 90.5Lubricants . . . . . . . . . . . . . . . . 6.9 6.6 7.0 6.5 6.4 5.9 6.0 5.9 5.8 6.0
Other (Subtotal) . . . . . . . . . . . 72.1 83.1 88.8 84.0 86.5 88.1 101.5 94.6 97.8 100.5
Pentanes Plus. . . . . . . . . . . . 4.4 16.2 12.7 10.8 9.2 9.0 9.1 8.0 5.7 7.4Petrochemical Feed . . . . . . . 46.0 50.0 57.7 50.7 55.1 59.2 69.2 64.2 66.7 60.3Petroleum Coke . . . . . . . . . . 9.1 6.8 7.2 10.6 9.8 8.2 12.6 11.7 13.3 21.3Special Naphtha . . . . . . . . . . 0.0 0.0 0.0 0.0 0.0 0.0 0.0 0.0 0.0 0.0Waxes and Miscellaneous . . 12.6 10.2 11.2 11.9 12.3 11.6 10.7 10.7 12.0 11.5Petroleum Subtotal . . . . . . . 228.9 259.7 277.0 264.8 268.7 264.7 286.0 276.2 275.7 274.9
Coal. . . . . . . . . . . . . . . . . . . . . . 1.4 2.1 1.8 1.7 1.5 1.5 1.5 1.5 1.4 1.4Natural Gas. . . . . . . . . . . . . . . . 14.3 18.4 22.6 21.2 17.7 17.9 18.9 19.0 19.4 19.5
Industrial Subtotal . . . . . . . . . . 244.7 280.2 301.5 287.7 287.8 284.1 306.3 296.7 296.5 295.8
Transportation
Lubricants . . . . . . . . . . . . . . . . . 6.5 6.2 6.7 6.1 6.0 5.6 5.6 5.6 5.5 5.6
Total . . . . . . . . . . . . . . . . . . . . . . 251.2 286.5 308.2 293.8 293.9 289.6 311.9 302.3 302.0 301.5
P = preliminary data.Notes: Emissions from nonfuel use of energy fuels are included in the energy consumption tables in this chapter. Data in this table are revised
from the data contained in the previous EIA report, Emissions of Greenhouse Gases in the United States 2006, DOE/EIA-0573(2006) (Washington,DC, November 2007). Totals may not equal sum of components due to independent rounding.
Sources: EIA estimates.

Carbon Dioxide EmissionsAdjustments to Energy Consumption
Overview Carbon Dioxide Methane Nitrous Oxide High-GWP Gases Land Use
Energy Information Administration / Emissions of Greenhouse Gases in the United States 2007 23
Summary• EIA's greenhouse gas emissions inventory includes
two “adjustments to energy consumption” (Table14). First, the energy consumption and carbon diox-ide emissions data in this report correspond to EIA’scoverage of energy consumption, which includes the50 States and the District of Columbia, but under theUNFCCC the United States is also responsible foremissions emanating from its Territories; therefore,their emissions are added to the U.S. total. Second,because the IPCC definition of energy consumptionexcludes international bunker fuels, emissions from
international bunker fuels are subtracted from the U.S.total. Similarly, because the IPCC excludes emissionsfrom military bunker fuels from national totals, theyare subtracted from the U.S. Total.
• The net adjustment in emissions has been negative inevery year from 1990 to 2007, because emissions frombunker fuels have always exceeded emissions fromU.S. Territories. The net negative adjustment for 2007was larger (-74.2 MMT), because emissions from theU.S. Territories fell while emissions from bunker fuelsincreased.
Carbon Dioxide Emissions from U.S. Territories,1990, 2006, and 2007*
1990 2006 2007
Estimated Emissions(Million Metric Tons) . . . . . . 31.1 61.3 56.7
Change from 1990(Million Metric Tons) . . . . . . . . . . . . . . 30.2 25.6(Percent) . . . . . . . . . . . . . . . . . . . . . . . 97.0% 82.4%
Average Annual Changefrom 1990 (Percent) . . . . . . . . . . . . . . 4.3% 3.6%
Change from 2006(Million Metric Tons) . . . . . . . . . . . . . . . . . . . . . . -4.6
(Percent) . . . . . . . . . . . . . . . . . . . . . . . . . . . . . . . -7.4%
*Added to total U.S. emissions.
Carbon Dioxide Emissions from InternationalBunker Fuels, 1990, 2006, and 2007*
1990 2006 2007
Estimated Emissions(Million Metric Tons) . . . . . . 113.5 128.1 131.0
Change from 1990(Million Metric Tons) . . . . . . . . . . . . . . 14.6 17.5(Percent) . . . . . . . . . . . . . . . . . . . . . . . 12.9% 15.4%
Average Annual Changefrom 1990 (Percent) . . . . . . . . . . . . . . 0.8% 0.8%
Change from 2006(Million Metric Tons) . . . . . . . . . . . . . . . . . . . . . . 2.9
(Percent) . . . . . . . . . . . . . . . . . . . . . . . . . . . . . . . 2.3%
*Subtracted from total U.S. emissions.
Table 14. U.S. Carbon Dioxide Emissions: Adjustments for U.S. Territories and International Bunker Fuels,1990, 1995, and 2000-2007(Million Metric Tons Carbon Dioxide)Fuel 1990 1995 2000 2001 2002 2003 2004 2005 2006 P2007
Emissions from U.S. TerritoriesPuerto Rico. . . . . . . . . . . . . . . . . 20.2 24.1 27.6 34.3 34.9 37.2 37.9 39.0 40.4 37.4U.S. Virgin Islands . . . . . . . . . . . 7.0 8.5 9.8 14.2 13.7 15.2 18.1 16.1 16.4 15.0American Samoa . . . . . . . . . . . . 0.6 0.6 0.6 0.6 0.6 0.6 0.6 0.6 0.6 0.6Guam . . . . . . . . . . . . . . . . . . . . . 1.8 3.6 2.9 3.1 2.1 2.4 2.0 2.2 2.3 2.1U.S. Pacific Islands . . . . . . . . . . 0.3 0.3 0.3 0.3 0.3 0.3 0.3 0.3 0.3 0.3Wake Island . . . . . . . . . . . . . . . . 1.2 1.3 1.3 1.3 1.3 1.3 1.3 1.4 1.4 1.4Subtotala . . . . . . . . . . . . . . . . . 31.1 38.4 42.4 53.8 52.9 57.0 60.1 59.5 61.3 56.7
Emissions from Bunker FuelsMarine Bunkers (Subtotal) . . . . . 62.0 46.6 37.6 35.3 24.2 19.8 29.3 29.5 49.8 51.0
Distillate Fuel . . . . . . . . . . . . . . 6.2 5.8 2.9 2.0 1.6 1.4 1.7 2.4 3.1 3.6Residual Fuel . . . . . . . . . . . . . . 55.8 40.8 34.6 33.2 22.6 18.3 27.6 27.1 46.7 47.4
Aviation Bunkers (Subtotal) . . . . 38.1 45.3 57.9 55.6 58.4 56.4 65.1 67.2 70.3 72.0
U.S. Carriers. . . . . . . . . . . . . . . 18.5 21.0 25.9 24.8 23.6 23.2 26.5 28.3 28.5 29.4Foreign Carriers . . . . . . . . . . . . 19.5 24.3 32.0 30.7 34.7 33.2 38.6 38.9 41.8 42.6
Military Bunkers (Subtotal) . . . . . 13.4 8.9 7.9 8.2 8.1 9.2 10.1 9.2 8.0 8.0
Subtotalb . . . . . . . . . . . . . . . . . 113.5 100.8 103.3 99.0 90.7 85.3 104.4 106.0 128.1 131.0
Net Adjustment. . . . . . . . . . . . . . -82.4 -62.4 -60.9 -45.3 -37.8 -28.3 -44.3 -46.5 -66.8 -74.2
P = preliminary data.aAdded to total U.S. emissions.bSubtracted from total U.S. emissions.Note: Totals may not equal sum of components due to independent rounding.Source: EIA estimates.

Carbon Dioxide EmissionsOther Sources
Overview Carbon Dioxide Methane Nitrous Oxide High-GWP Gases Land Use
24 Energy Information Administration / Emissions of Greenhouse Gases in the United States 2007
Summary• “Other emissions sources” in total accounted for 1.7
percent (105.1 MMT) of all U.S. carbon dioxide emis-sions in 2007 (Figure 12).
• The largest source of U.S. carbon dioxide emissionsother than fossil fuel consumption is cement manu-facture (Table 15), where most emissions result fromthe production of clinker (consisting of calcium car-bonate sintered with silica in a cement kiln to pro-duce calcium silicate).
• Limestone consumption, especially for lime manufac-ture, is the source of 15 to 20 MMT of carbon dioxideemissions per year.
• In addition, “other sources” include: soda ash manu-facture and consumption; carbon dioxide manufac-ture; aluminum manufacture; flaring of natural gas atthe wellhead; carbon dioxide scrubbed from naturalgas; and waste combustion in the commercial andindustrial sectors.
Carbon Dioxide Emissions from Other Sources,1990, 2006, and 2007
1990 2006 2007
Estimated Emissions(Million Metric Tons) . . . . . . 85.1 105.9 105.1
Change from 1990(Million Metric Tons) . . . . . . . . . . . . . . 20.8 20.0(Percent) . . . . . . . . . . . . . . . . . . . . . . . 24.5% 23.5%
Average Annual Changefrom 1990 (Percent) . . . . . . . . . . . . . . 1.4% 1.3%
Change from 2006(Million Metric Tons) . . . . . . . . . . . . . . . . . . . . . . -0.8(Percent) . . . . . . . . . . . . . . . . . . . . . . . . . . . . . . . -0.8%
LimestoneConsumption
18.8
(Million Metric Tons)
CementManufacture
46.0Natural GasProduction
27.4
Other IndustrialSources
12.9
2007 Total = 105.1
Figure 12. U.S. Carbon Dioxide Emissions fromOther Sources, 2007
Source: EIA estimates.
Table 15. U.S. Carbon Dioxide Emissions from Other Sources, 1990, 1995, and 2000-2007(Million Metric Tons Carbon Dioxide)Source 1990 1995 2000 2001 2002 2003 2004 2005 2006 P2007
Cement Manufacture . . . . . . . . . . 33.3 36.9 41.3 41.5 43.0 43.2 45.7 46.1 46.7 46.0
Clinker Production . . . . . . . . . . . . 32.6 36.1 40.4 40.5 42.0 42.2 44.7 45.1 45.7 45.0Masonry Cement . . . . . . . . . . . . . 0.1 0.1 0.1 0.1 0.1 0.1 0.1 0.1 0.1 0.1Cement Kiln Dust. . . . . . . . . . . . . 0.7 0.7 0.8 0.8 0.8 0.8 0.9 0.9 0.9 0.9
Limestone Consumption. . . . . . . 15.9 17.8 18.6 18.1 17.0 18.0 18.9 18.7 19.6 18.8
Lime Manufacture . . . . . . . . . . . . 12.4 14.5 15.4 14.8 14.1 15.1 15.7 15.7 16.5 15.9Iron Smelting . . . . . . . . . . . . . . . . 1.7 1.2 1.1 1.0 0.9 0.9 1.0 0.8 0.9 0.8Steelmaking. . . . . . . . . . . . . . . . . 0.3 0.5 0.5 0.6 0.5 0.4 0.4 0.3 0.4 0.3Copper Refining. . . . . . . . . . . . . . 0.1 0.2 0.1 0.1 0.1 0.1 0.1 0.1 0.1 0.1Glass Manufacture. . . . . . . . . . . . 0.1 0.3 0.2 0.1 0.1 0.2 0.2 0.2 0.2 0.2Flue Gas Desulfurization . . . . . . . 0.7 0.9 1.2 1.4 1.3 1.3 1.4 1.5 1.5 1.5Dolomite Manufacture . . . . . . . . . 0.5 0.2 0.1 0.1 0.1 0.1 0.1 0.1 0.2 0.1
Natural Gas Production. . . . . . . . 23.1 33.9 23.8 24.7 24.4 24.5 24.3 25.3 26.6 27.4
Carbon Dioxide in Natural Gas . . 14.0 16.7 18.3 18.9 18.4 18.6 18.4 18.1 18.7 19.5Natural Gas Flaring . . . . . . . . . . . 9.1 17.2 5.5 5.9 6.0 5.9 5.8 7.2 7.8 7.8
Other . . . . . . . . . . . . . . . . . . . . . . . 12.7 13.8 14.1 12.7 13.3 13.2 13.1 13.2 13.0 12.9
Soda Ash Manufacture . . . . . . . . 3.4 3.8 3.6 3.6 3.5 3.6 3.8 3.9 3.9 4.0Soda Ash Consumption. . . . . . . . 0.5 0.8 0.6 0.5 0.4 0.6 0.6 0.5 0.5 0.6Carbon Dioxide Manufacture . . . . 0.9 1.0 1.3 1.3 1.4 1.5 1.5 1.6 1.6 1.7Aluminum Manufacture . . . . . . . . 5.9 4.9 5.4 3.9 4.0 4.0 3.7 3.6 3.3 3.8Shale Oil Production . . . . . . . . . . 0.2 * * * * * * * * *Waste Combustion . . . . . . . . . . . 1.9 3.2 3.2 3.4 4.0 3.6 3.5 3.6 3.6 2.8
Total . . . . . . . . . . . . . . . . . . . . . . . 85.1 102.3 97.8 97.0 97.7 98.9 102.0 103.4 105.9 105.1
P = preliminary data.*Less than 0.05 million metric tons.Notes: Data in this table are revised from the data contained in the previous EIA report, Emissions of Greenhouse Gases in the United States
2006, DOE/EIA-0573(2006) (Washington, DC, November 2007). Totals may not equal sum of components due to independent rounding.Source: EIA estimates.

Methane EmissionsTotal Emissions
Overview Carbon Dioxide Methane Nitrous Oxide High-GWP Gases Land Use
Energy Information Administration / Emissions of Greenhouse Gases in the United States 2007 25
Summary• The major sources of U.S. methane emissions are
energy production, distribution, and use; agricul-ture; and waste management (Figure 13).
• U.S. methane emissions in 2007 totaled 699.9 millionmetric tons carbon dioxide equivalent (MMTCO2e),up from the 2006 total of 686.9 MMTCO2e (Table 16).
• Methane emissions declined steadily from 1990 to2001, as emissions from coal mining and landfillsfell.
• Emissions have risen from 2001 to 2007, with moderateincreases in each of the major emission sources.
• The energy sector—including coal mining, natural gassystems, petroleum systems, and stationary andmobile combustion—is the largest source of U.S. meth-ane emissions.
• Agriculture (primarily livestock management) andwaste management (primarily landfills) also are largecontributors to U.S. methane emissions.
U.S. Anthropogenic Methane Emissions,1990, 2006, and 2007
1990 2006 2007
Estimated Emissions(Million Metric Tons CO2e) . . . . 782.1 686.9 699.9
Change from 1990(Million Metric Tons CO2e) . . . . . . . . . . . -95.2 -82.2(Percent) . . . . . . . . . . . . . . . . . . . . . . . . . -12.2% -10.5%
Average Annual Changefrom 1990 (Percent) . . . . . . . . . . . . . . . . -0.8% -0.7%
Change from 2006(Million Metric Tons CO2e). . . . . . . . . . . . . . . . . . . 13.0(Percent) . . . . . . . . . . . . . . . . . . . . . . . . . . . . . . . . 1.9%
� �� � � � � � � � � � � � � � � �
��
� � � � � � � � � � � � � � � �
�
�
� � � � � ��
�� � � � � � � �
��
� �� � �
��
� � � � � � � � �
1990
1991
1992
1993
1994
1995
1996
1997
1998
1999
2000
2001
2002
2003
2004
2005
2006
2007
0
100
200
300
Million Metric Tons Carbon Dioxide Equivalent
Agriculture Waste Management
Industrial Processes
Energy
Figure 13. U.S. Methane Emissions by Source,1990-2007
Source: EIA estimates.
Table 16. U.S. Methane Emissions from Anthropogenic Sources, 1990, 1995, and 2000-2007(Million Metric Tons Carbon Dioxide Equivalent)
Source 1990 1995 2000 2001 2002 2003 2004 2005 2006 P2007
Energy Sources . . . . . . . . . . . . . . . . . . 299.5 288.5 280.2 274.2 277.6 276.7 281.3 277.8 280.8 287.0Agricultural Sources . . . . . . . . . . . . . . . 199.0 212.9 206.8 206.7 206.8 207.6 207.5 210.4 212.7 214.5Waste Management . . . . . . . . . . . . . . . 280.6 247.9 195.5 186.4 186.9 189.3 188.0 188.6 190.8 195.7Industrial Processes . . . . . . . . . . . . . . . 2.9 3.3 3.2 2.8 2.9 2.9 3.0 2.7 2.7 2.6
Total. . . . . . . . . . . . . . . . . . . . . . . . . . . 782.1 752.6 685.7 670.1 674.2 676.5 679.7 679.4 686.9 699.9
P = preliminary data.Notes: Data in this table are revised from the data contained in the previous EIA report, Emissions of Greenhouse Gases in the United States
2006, DOE/EIA-0573(2006) (Washington, DC, November 2007). Totals may not equal sum of components due to independent rounding.Sources: Published and unpublished data used to produce Emissions of Greenhouse Gases in the United States 2006. Emissions calculations
based on Intergovernmental Panel on Climate Change, Greenhouse Gas Inventory Reference Manual: IPCC Guidelines for National GreenhouseGas Inventories (2007 and revised 1996 guidelines), web site www.ipcc-nggip.iges.or.jp/public/public.htm; and U.S. Environmental ProtectionAgency, Inventory of U.S. Greenhouse Gas Emissions and Sinks: 1990-2006, EPA 430-R-07-002 (Washington, DC, April 2007), web sitewww.epa.gov/climatechange/emissions/usinventoryreport.html.

Methane EmissionsEnergy Use
Overview Carbon Dioxide Methane Nitrous Oxide High-GWP Gases Land Use
26 Energy Information Administration / Emissions of Greenhouse Gases in the United States 2007
Summary• Natural gas systems and coal mines are the major
sources of methane emissions in the energy sector.
• Methane emissions from natural gas systems grewbetween 1990 and 2000, in parallel with increasesin U.S. natural gas consumption, then leveled offbetween 2000 and 2005 before resuming growth(Figure 14 and Table 17).
• Emissions from coal mines declined from 1990 to2002 and have remained low since then, because pro-duction increases have been largely from surfacemines that produce relatively little methane.
• Methane emissions from petroleum systems havedeclined as domestic oil production has dropped bymore than 30 percent since 1990.
• Residential wood consumption accounts for almost90 percent of methane emissions from stationarycombustion.
• Methane emissions from passenger cars (a major com-ponent of mobile sources), which declined from 1990to 2004 as more efficient catalytic converters wereadded on newer models, have rebounded withincreases in total vehicle miles traveled.
Energy-Related Methane Emissions,1990, 2006, and 2007
1990 2006 2007
Estimated Emissions(Million Metric Tons CO2e) . . . . 299.5 280.8 287.0
Change from 1990(Million Metric Tons CO2e) . . . . . . . . . . . -18.7 -12.5(Percent) . . . . . . . . . . . . . . . . . . . . . . . . . -6.2% -4.2%
Average Annual Changefrom 1990 (Percent) . . . . . . . . . . . . . . . . -0.4% -0.3%
Change from 2006(Million Metric Tons CO2e) . . . . . . . . . . . . . . . . . . 6.2(Percent) . . . . . . . . . . . . . . . . . . . . . . . . . . . . . . . . 2.2%
� �� � � � � � � � � � � � � � � �� �� � � � � � � � � � � � � � � �
��
� � � � � � � � � � � � � � � �
�
�
� � � � � �� � �
� �� � � � �
�
�
� �� � �
��
� � � � � � � � �
1990
1991
1992
1993
1994
1995
1996
1997
1998
1999
2000
2001
2002
2003
2004
2005
2006
2007
0
50
100
150
200Million Metric Tons Carbon Dioxide Equivalent
Stationary CombustionMobile SourcesPetroleum Systems
Coal Mining
Natural Gas Systems
Figure 14. U.S. Methane Emissions from EnergySources, 1990-2007
Source: EIA estimates.
Table 17. U.S. Methane Emissions from Energy Sources, 1990, 1995, and 2000-2007(Million Metric Tons Carbon Dioxide Equivalent)
Source 1990 1995 2000 2001 2002 2003 2004 2005 2006 P2007
Natural Gas Systems . . . . . . . . . . . . . 140.4 149.9 164.5 160.1 167.8 166.8 168.6 168.1 171.2 176.6
Production . . . . . . . . . . . . . . . . . . . . . 36.8 39.3 43.5 45.8 46.2 46.7 47.5 48.2 49.8 50.6Processing . . . . . . . . . . . . . . . . . . . . . 16.2 18.0 17.9 17.4 16.9 15.7 16.2 15.9 15.9 16.5Transmission and Storage . . . . . . . . . 52.6 53.7 60.4 53.3 60.6 59.6 58.5 58.3 56.2 60.1Distribution . . . . . . . . . . . . . . . . . . . . . 34.9 38.9 42.8 43.6 44.1 44.8 46.4 45.7 49.3 49.3
Coal Mining . . . . . . . . . . . . . . . . . . . . . 106.4 91.3 74.2 74.1 69.8 69.9 73.4 70.3 71.5 71.1
Surface . . . . . . . . . . . . . . . . . . . . . . . . 11.6 12.2 13.5 14.3 14.2 13.8 14.3 14.7 15.5 15.5Underground . . . . . . . . . . . . . . . . . . . 94.8 79.1 60.7 59.7 55.7 56.1 59.1 55.7 56.0 55.6
Petroleum Systems . . . . . . . . . . . . . . 32.6 29.3 25.9 25.8 25.6 25.3 24.2 23.2 22.9 22.9
Refineries . . . . . . . . . . . . . . . . . . . . . . 0.6 0.6 0.7 0.7 0.7 0.7 0.7 0.7 0.7 0.7Exploration and Production . . . . . . . . 31.6 28.4 25.0 24.9 24.6 24.4 23.3 22.3 21.9 22.0Crude Oil Transportation . . . . . . . . . . 0.3 0.3 0.3 0.3 0.3 0.3 0.3 0.3 0.3 0.3
Stationary Combustion . . . . . . . . . . . 14.1 12.8 10.6 9.5 9.7 10.1 10.4 11.2 10.3 11.4
Mobile Sources. . . . . . . . . . . . . . . . . . 6.1 5.2 4.9 4.7 4.7 4.5 4.7 4.9 5.0 5.1
Total. . . . . . . . . . . . . . . . . . . . . . . . . . . 299.5 288.5 280.2 274.2 277.6 276.7 281.3 277.8 280.8 287.0
P = preliminary data.Notes: Data in this table are revised from the data contained in the previous EIA report, Emissions of Greenhouse Gases in the United States
2006, DOE/EIA-0573(2006) (Washington, DC, November 2007). Totals may not equal sum of components due to independent rounding.Sources: Published and unpublished data used to produce Emissions of Greenhouse Gases in the United States 2006. Emissions calculations
based on Intergovernmental Panel on Climate Change, Greenhouse Gas Inventory Reference Manual: IPCC Guidelines for National GreenhouseGas Inventories (2007 and revised 1996 guidelines), web site www.ipcc-nggip.iges.or.jp/public/public.htm; and U.S. Environmental ProtectionAgency, Inventory of U.S. Greenhouse Gas Emissions and Sinks: 1990-2006, EPA 430-R-07-002 (Washington, DC, April 2007), web sitewww.epa.gov/climatechange/emissions/usinventoryreport.html.

Methane EmissionsAgriculture
Overview Carbon Dioxide Methane Nitrous Oxide High-GWP Gases Land Use
Energy Information Administration / Emissions of Greenhouse Gases in the United States 2007 27
Summary• Livestock management—including emissions from
enteric fermentation (two-thirds) and managementof animal wastes (one-third)—accounts for most ofthe U.S. methane emissions from agricultural activi-ties (Table 18).
• Since 1990, there has been a shift in livestock man-agement to larger facilities that are more likely tomanage waste in liquid systems, which increase theamounts of methane generated from livestock waste.In addition, increases in the U.S. swine populationhave contributed to the rise in methane emissions.
• Because 95 percent of all methane emissions fromenteric fermentation (digestion in ruminant animals)are attributable to cattle, trends in emissions are
correlated with trends in the size of the U.S. cattle pop-ulation. With little change in the cattle population sizesince 1990, the level of methane emissions from entericfermentation has been relatively stable.
• Decreases in U.S. rice production—particularly in Cal-ifornia, Louisiana, Oklahoma, and Texas—havereduced the estimated emissions from rice cultivation.In 2007, a rebound in Louisiana’s rice cultivation wasmore than offset by declines in cultivation in Arkansasand Missouri.
• Crop residue burning remains the smallest contributorto methane emissions from agriculture, representingless than 1 percent of total U.S. methane emissions(Figure 15).
Methane Emissions from Agricultural Sources,1990, 2006, and 2007
1990 2006 2007
Estimated Emissions(Million Metric Tons CO2e) . . . . 199.0 212.7 214.5
Change from 1990(Million Metric Tons CO2e) . . . . . . . . . . . 13.6 15.5(Percent) . . . . . . . . . . . . . . . . . . . . . . . . . 6.8% 7.8%
Average Annual Changefrom 1990 (Percent) . . . . . . . . . . . . . . . . 0.4% 0.4%
Change from 2006(Million Metric Tons CO2e). . . . . . . . . . . . . . . . . . . 1.8(Percent) . . . . . . . . . . . . . . . . . . . . . . . . . . . . . . . . 0.9%
Enteric Fermentationin Domesticated
Animals138.5
(Million Metric Tons CarbonDioxide Equivalent)
Crop ResidueBurning
1.4Solid Wasteof Domesticated
Animals65.0
Rice Cultivation9.7
2007 Total = 214.5
Figure 15. U.S. Methane Emissions fromAgriculture by Source, 2007
Source: EIA estimates.
Table 18. U.S. Methane Emissions from Agricultural Sources, 1990, 1995, and 2000-2007(Million Metric Tons Carbon Dioxide Equivalent)
Source 1990 1995 2000 2001 2002 2003 2004 2005 2006 P2007
Enteric Fermentationin Domesticated Animals . . . . . . . . . . . 140.5 146.4 137.0 135.7 136.1 136.7 134.6 137.1 138.5 138.5
Solid Wasteof Domesticated Animals . . . . . . . . . . . 47.4 54.3 57.5 58.1 58.5 59.1 59.6 60.4 63.0 65.0
Rice Cultivation . . . . . . . . . . . . . . . . . . 10.1 11.1 11.1 11.7 11.1 10.7 11.8 11.5 9.9 9.7
Crop Residue Burning . . . . . . . . . . . . . 1.1 1.0 1.2 1.2 1.1 1.3 1.4 1.3 1.3 1.4
Total. . . . . . . . . . . . . . . . . . . . . . . . . . . 199.0 212.9 206.8 206.7 206.8 207.6 207.5 210.4 212.7 214.5
P = preliminary data.Notes: Data in this table are revised from the data contained in the previous EIA report, Emissions of Greenhouse Gases in the United States
2006, DOE/EIA-0573(2006) (Washington, DC, November 2007). Totals may not equal sum of components due to independent rounding.Sources: Published and unpublished data used to produce Emissions of Greenhouse Gases in the United States 2006. Emissions calculations
based on Intergovernmental Panel on Climate Change, Greenhouse Gas Inventory Reference Manual: IPCC Guidelines for National GreenhouseGas Inventories (2007 and revised 1996 guidelines), web site www.ipcc-nggip.iges.or.jp/public/public.htm; and U.S. Environmental ProtectionAgency, Inventory of U.S. Greenhouse Gas Emissions and Sinks: 1990-2006, EPA 430-R-07-002 (Washington, DC, April 2007), web sitewww.epa.gov/climatechange/emissions/usinventoryreport.html.

Methane EmissionsWaste Management
Overview Carbon Dioxide Methane Nitrous Oxide High-GWP Gases Land Use
28 Energy Information Administration / Emissions of Greenhouse Gases in the United States 2007
Summary• Methane emissions from waste management are
dominated by the decomposition of solid waste inmunicipal and industrial landfills (Table 19).
• Emissions from landfills declined substantially from1990 to 2001 as a result of increases in recycling andin the recovery of landfill methane for energy; since2001, increases in the total amount of waste depos-ited in landfills have resulted in increasing methaneemissions (Figure 16).
• Rapid growth in methane recovery during the1990s can be traced in part to the Federal Section 29tax credit for alternative energy sources, which pro-vided a subsidy of approximately 1 cent per kilo-watthour for electricity generated from landfill gasbefore June 1998.
• The U.S. EPA’s New Source Performance Standardsand Emission Guidelines, which require large landfillsto collect and burn landfill gas, have also played animportant role in the growth of methane recovery.
• The Emergency Economic Stabilization Act of 2008included a 2-year extension (through December 31,2010) of the production tax credit for waste-to-energyand landfill gas, as well as other renewable energysources.
• Wastewater treatment, including both domesticwastewater (two-thirds) and industrial wastewater(one-third), is responsible for about 14 percent of meth-ane emissions from waste management.
Methane Emissions from Waste Management,1990, 2006, and 2007
1990 2006 2007
Estimated Emissions(Million Metric Tons CO2e) . . . . 280.6 190.8 195.7
Change from 1990(Million Metric Tons CO2e) . . . . . . . . . . . -89.9 -84.9(Percent) . . . . . . . . . . . . . . . . . . . . . . . . . -32.0% -30.2%
Average Annual Changefrom 1990 (Percent) . . . . . . . . . . . . . . . . -2.4% -2.1%
Change from 2006(Million Metric Tons CO2e). . . . . . . . . . . . . . . . . . . 5.0(Percent) . . . . . . . . . . . . . . . . . . . . . . . . . . . . . . . . 2.6%
� �� � � � � � � � � � � � � � � �� �� � � � � � � � � � � � � � � �
�
�
� � � � � ��
�� � � � � � � �
1990
1991
1992
1993
1994
1995
1996
1997
1998
1999
2000
2001
2002
2003
2004
2005
2006
2007
0
100
200
300Million Metric Tons Carbon Dioxide Equivalent
Domestic Wastewater Treatment
Landfills
Industrial Wastewater Treatment
Figure 16. U.S. Methane Emissions fromWaste Management by Source, 1990-2007
Source: EIA estimates.
Table 19. U.S. Methane Emissions from Waste Management, 1990, 1995, and 2000-2007(Million Metric Tons Carbon Dioxide Equivalent)
Source 1990 1995 2000 2001 2002 2003 2004 2005 2006 P2007
Landfills . . . . . . . . . . . . . . . . . . . . . . . . 258.4 223.6 170.0 161.0 161.2 163.5 161.9 162.5 164.2 169.0
Domestic Wastewater Treatment . . . . . 14.4 15.4 16.3 16.5 16.6 16.8 17.0 17.1 17.3 17.4
Industrial Waste Water Treatment . . . . 7.8 8.8 9.2 8.9 9.0 8.9 9.1 9.0 9.3 9.3
Total. . . . . . . . . . . . . . . . . . . . . . . . . . . 280.6 247.9 195.5 186.4 186.9 189.2 188.0 188.6 190.8 195.7
P = preliminary data.Notes: Data in this table are revised from the data contained in the previous EIA report, Emissions of Greenhouse Gases in the United States
2006, DOE/EIA-0573(2006) (Washington, DC, November 2007). Totals may not equal sum of components due to independent rounding.Sources: Published and unpublished data used to produce Emissions of Greenhouse Gases in the United States 2006. Emissions calculations
based on Intergovernmental Panel on Climate Change, Greenhouse Gas Inventory Reference Manual: IPCC Guidelines for National GreenhouseGas Inventories (2007 and revised 1996 guidelines), web site www.ipcc-nggip.iges.or.jp/public/public.htm; and U.S. Environmental ProtectionAgency, Inventory of U.S. Greenhouse Gas Emissions and Sinks: 1990-2006, EPA 430-R-07-002 (Washington, DC, April 2007), web sitewww.epa.gov/climatechange/emissions/usinventoryreport.html.

Methane EmissionsIndustrial Processes
Overview Carbon Dioxide Methane Nitrous Oxide High-GWP Gases Land Use
Energy Information Administration / Emissions of Greenhouse Gases in the United States 2007 29
Summary• Methane emissions are generated by industrial pro-
cesses in the production of iron and steel and inchemical production (Figure 17 and Table 20).
• Methane emissions from industrial processesdeclined by a net 0.3 MMTCO2e from 1990 to 2007,
as small increases in emissions from chemical produc-tion (0.2 MMTCO2e) were more than offset by declinesin emissions from iron and steel production (0.5MMTCO2e).
Methane Emissions from Industrial Processes,1990, 2006, and 2007
1990 2006 2007
Estimated Emissions(Million Metric Tons CO2e) . . . . 2.9 2.7 2.6
Change from 1990(Million Metric Tons CO2e) . . . . . . . . . . . -0.3 -0.3(Percent) . . . . . . . . . . . . . . . . . . . . . . . . . -9.4% -9.8%
Average Annual Changefrom 1990 (Percent) . . . . . . . . . . . . . . . . -0.6% -0.6%
Change from 2006(Million Metric Tons CO2e). . . . . . . . . . . . . . . . . . . *(Percent) . . . . . . . . . . . . . . . . . . . . . . . . . . . . . . . . -0.4%
*Less than 0.05 million metric tons.
�
�
� � � � � � � � � �� � � �
� �
��
� ��
� � � � � ��
�� �
�� �
1990
1991
1992
1993
1994
1995
1996
1997
1998
1999
2000
2001
2002
2003
2004
2005
2006
2007
0
1
2
3Million Metric Tons Carbon Dioxide Equivalent
Iron and Steel Production
Chemical Production
Figure 17. U.S. Methane Emissions fromIndustrial Processes by Source, 1990-2007
Source: EIA estimates.
Table 20. U.S. Methane Emissions from Industrial Processes, 1990, 1995, and 2000-2007(Million Metric Tons Carbon Dioxide Equivalent)
Source 1990 1995 2000 2001 2002 2003 2004 2005 2006 P2007
Chemical Production
Ethylene . . . . . . . . . . . . . . . . . . . . . . . 0.4 0.5 0.6 0.5 0.5 0.5 0.6 0.5 0.6 0.6
Ethylene Dichloride . . . . . . . . . . . . . . 0.1 0.1 0.1 0.1 0.1 0.1 0.1 0.1 0.1 0.1
Styrene . . . . . . . . . . . . . . . . . . . . . . . . 0.4 0.5 0.5 0.4 0.5 0.5 0.5 0.5 0.4 0.5
Methanol. . . . . . . . . . . . . . . . . . . . . . . 0.2 0.2 0.2 0.2 0.2 0.2 0.2 0.1 0.1 *
Carbon Black . . . . . . . . . . . . . . . . . . . 0.4 0.4 0.4 0.4 0.4 0.4 0.4 0.4 0.4 0.4
Subtotal . . . . . . . . . . . . . . . . . . . . . . 1.4 1.8 1.8 1.6 1.7 1.7 1.8 1.6 1.6 1.6
Iron and Steel Production
Cokea . . . . . . . . . . . . . . . . . . . . . . . . 0.3 0.2 0.2 0.1 0.1 0.1 0.1 0.1 0.1 0.1
Sinter . . . . . . . . . . . . . . . . . . . . . . . . . 0.2 0.2 0.1 0.1 0.1 0.1 0.1 0.1 0.1 0.1
Pig Iron . . . . . . . . . . . . . . . . . . . . . . . . 1.1 1.1 1.1 0.9 0.9 0.9 1.0 0.8 0.9 0.8
Subtotal . . . . . . . . . . . . . . . . . . . . . . 1.5 1.5 1.4 1.2 1.2 1.2 1.2 1.1 1.1 1.0
Total. . . . . . . . . . . . . . . . . . . . . . . . . . . 2.9 3.3 3.2 2.8 2.9 2.9 3.0 2.7 2.7 2.6aBased on total U.S. production of metallurgical coke, including for uses other than iron and steel manufacture.*Less than 0.05 million metric tons.P = preliminary data.Notes: Data in this table are revised from the data contained in the previous EIA report, Emissions of Greenhouse Gases in the United States
2006, DOE/EIA-0573(2006) (Washington, DC, November 2007). Totals may not equal sum of components due to independent rounding.Sources: Published and unpublished data used to produce Emissions of Greenhouse Gases in the United States 2006. Emissions calculations
based on Intergovernmental Panel on Climate Change, Greenhouse Gas Inventory Reference Manual: IPCC Guidelines for National GreenhouseGas Inventories (2007 and revised 1996 guidelines), web site www.ipcc-nggip.iges.or.jp/public/public.htm; and U.S. Environmental ProtectionAgency, Inventory of U.S. Greenhouse Gas Emissions and Sinks: 1990-2006, EPA 430-R-07-002 (Washington, DC, April 2007), web sitewww.epa.gov/climatechange/emissions/usinventoryreport.html.


Nitrous Oxide EmissionsTotal Emissions
Overview Carbon Dioxide Methane Nitrous Oxide High-GWP Gases Land Use
Energy Information Administration / Emissions of Greenhouse Gases in the United States 2007 31
U.S. Anthropogenic Nitrous Oxide Emissions,1990, 2006, and 2007
1990 2006 2007
Estimated Emissions(Million Metric Tons CO2e) . . . . 336.0 375.7 383.9
Change from 1990(Million Metric Tons CO2e) . . . . . . . . . . . 39.7 47.9(Percent) . . . . . . . . . . . . . . . . . . . . . . . . . 11.8% 14.2%
Average Annual Changefrom 1990 (Percent) . . . . . . . . . . . . . . . . 0.7% 0.8%
Change from 2006(Million Metric Tons CO2e). . . . . . . . . . . . . . . . . . . 8.2(Percent) . . . . . . . . . . . . . . . . . . . . . . . . . . . . . . . . 2.2%
��
� � � � � �� � � � � � � � � �
�
�
� � ��
� � � � � � � � �
� � �
� �� � � � � � � � � � � � � � � �
��
� � � � � � � � � � � � � � � �
1990
1991
1992
1993
1994
1995
1996
1997
1998
1999
2000
2001
2002
2003
2004
2005
2006
2007
0
100
200
300Million Metric Tons Carbon Dioxide Equivalent
Agriculture
Waste ManagementIndustryEnergy
Figure 18. U.S. Nitrous Oxide Emissionsby Source, 1990-2007
Source: EIA estimates.
Table 21. Estimated U.S. Emissions of Nitrous Oxide, 1990, 1995, and 2000-2007(Million Metric Tons Carbon Dioxide Equivalent)
Source 1990 1995 2000 2001 2002 2003 2004 2005 2006 P2007
AgricultureNitrogen Fertilization of Soils . . . . . . . . . 188.4 188.9 191.1 190.8 186.9 188.3 213.9 218.9 222.7 229.6Solid Waste of Domesticated Animals . . 62.3 66.2 62.4 61.9 61.7 61.2 60.9 61.7 62.2 62.2Crop Residue Burning . . . . . . . . . . . . . . 0.5 0.5 0.6 0.6 0.5 0.5 0.6 0.6 0.6 0.6Subtotal. . . . . . . . . . . . . . . . . . . . . . . . 251.2 255.6 254.1 253.3 249.1 250.1 275.4 281.2 285.5 292.4
Energy UseMobile Combustion . . . . . . . . . . . . . . . . 37.7 51.6 52.7 51.2 50.3 50.0 51.2 54.2 55.2 56.2Stationary Combustion. . . . . . . . . . . . . . 13.5 14.0 15.2 14.7 14.6 14.8 15.1 15.2 14.8 14.9Subtotal. . . . . . . . . . . . . . . . . . . . . . . . 51.1 65.6 67.9 65.9 64.9 64.8 66.3 69.4 69.9 71.1
Industrial Sources . . . . . . . . . . . . . . . . . 28.8 33.1 16.7 14.1 15.3 13.7 13.7 14.0 14.0 14.0
Waste ManagementHuman Sewage in Wastewater . . . . . . . 4.6 5.1 5.6 5.7 5.7 5.7 5.8 5.9 6.0 6.0Waste Combustion . . . . . . . . . . . . . . . . 0.3 0.3 0.3 0.3 0.3 0.3 0.3 0.4 0.4 0.4Subtotal. . . . . . . . . . . . . . . . . . . . . . . . 4.9 5.4 5.9 6.0 6.1 6.0 6.1 6.2 6.3 6.4
Total . . . . . . . . . . . . . . . . . . . . . . . . . . . . 336.0 359.7 344.6 339.3 335.4 334.6 361.5 370.8 375.7 383.9P = preliminary data.Notes: Data in this table are revised from the data contained in the previous EIA report, Emissions of Greenhouse Gases in the United States
2006, DOE/EIA-0573(2006) (Washington, DC, November 2007). Totals may not equal sum of components due to independent rounding.Sources: Estimates presented in this chapter. Emissions calculations based on Intergovernmental Panel on Climate Change, Greenhouse Gas
Inventory Reference Manual: IPCC Guidelines for National Greenhouse Gas Inventories (2007 and revised 1996 guidelines), web sitewww.ipcc-nggip.iges.or.jp/public/public.htm; and U.S. Environmental Protection Agency, Inventory of U.S. Greenhouse Gas Emissions and Sinks:1990-2006, EPA 430-R-07-002 (Washington, DC, April 2007), web site www.epa.gov/climatechange/emissions/usinventoryreport.html.
Summary• U.S. nitrous oxide emissions in 2007 were 2.2 percent
(8.2 MMTCO2e) above their 2006 total (Table 21).
• Rising demand for corn-based ethanol in 2007 led toan 18-percent increase in U.S. corn production and a19-percent drop in soybean production. As a result,the use of synthetic fertilizer (a nitrous oxide emit-ter), which is required for corn production, rose by9.6 percent. (Soybeans do not need synthetic fertil-izer, because they fix nitrogen in the soil.)
• Sources of U.S. nitrous oxide emissions include agri-culture, energy use, industrial processes, and wastemanagement. The largest source is agriculture, and themajority of agricultural emissions result from nitrogenfertilization of agricultural soils and the disposal ofanimal waste.
• Annual U.S. nitrous oxide emissions rose from 1990 to1994, then fell from 1994 to 2003 (Figure 18). Theybegan rising sharply from 2003 to 2007, largely as aresult of increased use of synthetic fertilizers.

Nitrous Oxide EmissionsAgriculture
Overview Carbon Dioxide Methane Nitrous Oxide High-GWP Gases Land Use
32 Energy Information Administration / Emissions of Greenhouse Gases in the United States 2007
U.S. Anthropogenic Nitrous Oxide Emissionsfrom Agriculture, 1990, 2006, and 2007
1990 2006 2007
Estimated Emissions(Million Metric Tons CO2e) . . . . 251.2 285.5 292.4
Change from 1990(Million Metric Tons CO2e) . . . . . . . . . . . 34.3 41.2(Percent) . . . . . . . . . . . . . . . . . . . . . . . . . 13.6% 16.4%
Average Annual Changefrom 1990 (Percent) . . . . . . . . . . . . . . . . 0.8% 0.9%
Change from 2006(Million Metric Tons CO2e). . . . . . . . . . . . . . . . . . . 7.0(Percent) . . . . . . . . . . . . . . . . . . . . . . . . . . . . . . . . 2.4%
(Million Metric TonsCarbon Dioxide
Equivalent)
2007 Total = 292.4
Crop ResidueBurning
0.6
Agricultural Soils229.6
Solid Waste ofDomesticated
Animals62.2
Figure 19. U.S. Nitrous Oxide Emissions fromAgriculture by Source, 2007
Source: EIA estimates.
Table 22. U.S. Nitrous Oxide Emissions from Agricultural Sources, 1990, 1995, and 2000-2007(Million Metric Tons Carbon Dioxide Equivalent)Source 1990 1995 2000 2001 2002 2003 2004 2005 2006 P2007
Agricultural SoilsDirect Emissions
Biological Fixation in Crops. . . 59.0 62.5 68.3 70.0 65.7 62.9 71.4 71.2 71.7 63.3Nitrogen Fertilizers . . . . . . . . . 53.4 51.6 45.9 44.7 45.9 48.3 54.7 58.3 60.3 69.5Crop Residues . . . . . . . . . . . . 28.4 28.3 34.9 34.9 33.1 33.1 38.8 37.6 37.2 36.1Other . . . . . . . . . . . . . . . . . . . . 4.5 4.8 4.9 4.9 4.9 5.0 5.0 5.0 5.0 5.0Total Direct Emissions . . . . 145.4 147.2 153.9 154.5 149.7 149.2 169.9 172.0 174.2 174.0
Indirect Emissions
Soil Leaching . . . . . . . . . . . . . 36.5 35.4 31.5 30.8 31.6 33.2 37.4 39.8 41.2 47.3Atmospheric Deposition . . . . . 6.5 6.3 5.6 5.5 5.6 5.9 6.6 7.1 7.3 8.4Total Indirect Emissions . . 43.0 41.7 37.2 36.3 37.2 39.1 44.0 46.8 48.5 55.7
Solid Waste of Domesticated AnimalsCattle. . . . . . . . . . . . . . . . . . . . . 57.9 61.5 57.8 57.3 57.1 56.6 56.2 56.8 57.2 57.1Swine . . . . . . . . . . . . . . . . . . . . 1.5 1.6 1.6 1.7 1.7 1.7 1.7 1.7 1.7 1.8Poultry. . . . . . . . . . . . . . . . . . . . 0.9 1.2 1.3 1.3 1.3 1.3 1.4 1.4 1.4 1.4Horses. . . . . . . . . . . . . . . . . . . . 0.7 0.7 0.7 0.7 0.7 0.7 0.7 0.7 0.7 0.7Sheep . . . . . . . . . . . . . . . . . . . . 1.0 0.9 0.7 0.7 0.7 0.7 0.7 0.7 0.7 0.7Goats . . . . . . . . . . . . . . . . . . . . 0.3 0.3 0.2 0.2 0.2 0.2 0.2 0.4 0.4 0.4Total Solid Waste . . . . . . . . . 62.3 66.2 62.4 61.9 61.7 61.2 60.9 61.7 62.2 62.2
Crop Residue Burning . . . . . . . 0.5 0.5 0.6 0.6 0.5 0.5 0.6 0.6 0.6 0.6
Total Agricultural Sources . . . . 251.2 255.6 254.1 253.3 249.1 250.1 275.4 281.2 285.5 292.4
P = preliminary data.Notes: Data in this table are revised from the data contained in the previous EIA report, Emissions of Greenhouse Gases in the United States
2006, DOE/EIA-0573(2006) (Washington, DC, November 2007). Totals may not equal sum of components due to independent rounding.Source: EIA estimates.
Summary• Agricultural sources, at 292.4 MMTCO2e, account
for more than three-quarters of all U.S. nitrous oxideemissions. U.S. nitrous oxide emissions from agri-cultural sources increased by 2.4 percent from 2006to 2007 (Table 22).
• More than three-quarters (229.6 MMTCO2e) of U.S.agricultural emissions of nitrous oxide in 2007 isattributable to nitrogen fertilization of soils (Figure
19), including 174.0 MMTCO2e from direct emissionsand 55.7 MMTCO2e from indirect emissions.
• Microbial denitrification of solid waste from domesticanimals in the United States, primarily cattle, emitted62.2 MMTCO2e of nitrous oxide in 2007. The amountreleased is a function of animal size and manure pro-duction, the amount of nitrogen in the waste, and themethod of managing the waste.

Nitrous Oxide EmissionsEnergy Use
Overview Carbon Dioxide Methane Nitrous Oxide High-GWP Gases Land Use
Energy Information Administration / Emissions of Greenhouse Gases in the United States 2007 33
Summary• Emissions from energy sources made up almost 20
percent of total U.S. nitrous oxide emissions in 2007.Nitrous oxide is a byproduct of fuel combustion inmobile and stationary sources (Figure 20).
• More than three-quarters of U.S. nitrous oxide emis-sions from energy use can be traced to mobilesources—motor vehicles, primarily passenger carsand light trucks (Table 23). Emissions from mobile
sources increased by 1.8 percent from 2006 to 2007, pri-marily because of a 12.9-percent increase in emissionsfrom off-road vehicles (included in “Other MobileSources”).
• Nitrous oxide emissions from stationary combustionsources are dominated by coal-fired generation at elec-tric power plants.
U.S. Anthropogenic Nitrous Oxide Emissionsfrom Energy Use, 1990, 2006, and 2007
1990 2006 2007
Estimated Emissions(Million Metric Tons CO2e) . . . . 51.1 69.9 71.1
Change from 1990(Million Metric Tons CO2e) . . . . . . . . . . . 18.8 20.0(Percent) . . . . . . . . . . . . . . . . . . . . . . . . . 36.8% 39.1%
Average Annual Changefrom 1990 (Percent) . . . . . . . . . . . . . . . . 2.0% 2.0%
Change from 2006(Million Metric Tons CO2e). . . . . . . . . . . . . . . . . . . 1.2(Percent) . . . . . . . . . . . . . . . . . . . . . . . . . . . . . . . . 1.7% 19
9019
9119
9219
9319
9419
9519
9619
9719
9819
9920
0020
0120
0220
0320
0420
0520
0620
070
20
40
60
80
100Million Metric Tons Carbon Dioxide Equivalent
Mobile Combustion
Stationary Combustion
Figure 20. U.S. Nitrous Oxide Emissions fromEnergy Use by Source, 1990-2007
Source: EIA estimates.
Table 23. U.S. Nitrous Oxide Emissions from Energy Use, 1990, 1995, and 2000-2007(Million Metric Tons Carbon Dioxide Equivalent)Item 1990 1995 2000 2001 2002 2003 2004 2005 2006 P2007
Mobile CombustionMotor Vehicles . . . . . . . . . . . . 34.1 48.0 48.8 47.6 46.7 46.6 47.5 50.0 50.5 51.0
Passenger Cars . . . . . . . . . . . 21.7 28.7 27.8 26.9 25.7 25.0 24.7 25.8 25.6 25.4Light-Duty Trucks . . . . . . . . . . 10.5 17.0 18.4 18.1 18.3 18.8 19.9 21.3 22.1 22.7Other Motor Vehicles . . . . . . . 1.8 2.2 2.6 2.6 2.7 2.7 2.8 2.8 2.8 2.8
Other Mobile Sources. . . . . . . 3.6 3.6 3.9 3.7 3.6 3.4 3.8 4.2 4.6 5.2
Total . . . . . . . . . . . . . . . . . . . . 37.7 51.6 52.7 51.2 50.3 50.0 51.2 54.2 55.2 56.2
Stationary CombustionResidential and Commercial . . . 1.5 1.4 1.3 1.2 1.2 1.3 1.3 1.3 1.1 1.2Industrial . . . . . . . . . . . . . . . . . . 4.7 4.9 4.9 4.7 4.6 4.5 4.8 4.6 4.6 4.4Electric Power . . . . . . . . . . . . . . 7.3 7.7 9.0 8.8 8.9 9.0 9.1 9.3 9.1 9.3Total . . . . . . . . . . . . . . . . . . . . 13.5 14.0 15.2 14.7 14.6 14.8 15.1 15.2 14.8 14.9
Total from Energy Use . . . . . . . 51.1 65.6 67.9 65.9 64.9 64.8 66.3 69.4 69.9 71.1
P = preliminary data.Notes: Data in this table are revised from the data contained in the previous EIA report, Emissions of Greenhouse Gases in the United States
2006, DOE/EIA-0573(2006) (Washington, DC, November 2007). Totals may not equal sum of components due to independent rounding.Sources: Calculations based on vehicle miles traveled from U.S. Department of Transportation, Federal Highway Statistics (various years),
Table VM-1, and current year preliminary estimates calculated using growth rates from EIA, Short-Term Energy Outlook (various years). OtherMobile Sources calculations based on Oak Ridge National Laboratory, Transportation Energy Data Book; EIA, Fuel Oil and Kerosene Sales, StateEnergy Data Report, and Petroleum Supply Annual (various years). Passenger car and light-duty truck emissions coefficients from U.S. Environ-mental Protection Agency, Office of Air and Radiation, Emissions of Nitrous Oxide From Highway Mobile Sources: Comments on the Draft Inventoryof U.S. Greenhouse Gas Emissions and Sinks, 1990-1996, EPA-420-R-98-009 (Washington DC, August 1998). Emissions coefficients from Inter-governmental Panel on Climate Change, Intergovernmental Panel on Climate Change, Greenhouse Gas Inventory Reference Manual: IPCCGuidelines for National Greenhouse Gas Inventories (2007 and revised 1996 guidelines), web site www.ipcc-nggip.iges.or.jp/public/public.htm.

Nitrous Oxide EmissionsIndustrial Sources
Overview Carbon Dioxide Methane Nitrous Oxide High-GWP Gases Land Use
34 Energy Information Administration / Emissions of Greenhouse Gases in the United States 2007
Summary• U.S. nitrous oxide emissions from industrial sources
in 2007, at 14.0 MMTCO2e, were unchanged from2006 (Table 24).
• The two industrial sources of nitrous oxide emis-sions are production of adipic acid and production ofnitric acid.
• A large decline in nitrous oxide emissions fromindustrial processes since 1996 (Figure 21) is a resultof emissions control technology at three of the fouradipic acid plants operating in the United States.
Adipic acid is a fine white power used primarily in themanufacture of nylon fibers and plastics. The threecompanies operating the U.S. plants manufactureadipic acid by oxidizing a ketone-alcohol mixture withnitric acid. The chemical reaction releases nitrousoxide emissions.
• Nitric acid, a primary ingredient in fertilizers, usuallyis manufactured by oxidizing ammonia with a plati-num catalyst. The oxidation process releases nitrousoxide emissions.
U.S. Anthropogenic Nitrous Oxide Emissionsfrom Industrial Sources, 1990, 2006, and 2007
1990 2006 2007
Estimated Emissions(Million Metric Tons CO2e) . . . . 28.8 14.0 14.0
Change from 1990(Million Metric Tons CO2e) . . . . . . . . . . . -14.8 -14.8(Percent) . . . . . . . . . . . . . . . . . . . . . . . . . -51.4% -51.4%
Average Annual Changefrom 1990 (Percent) . . . . . . . . . . . . . . . . -4.4% -4.2%
Change from 2006(Million Metric Tons CO2e). . . . . . . . . . . . . . . . . . . 0.0(Percent) . . . . . . . . . . . . . . . . . . . . . . . . . . . . . . . . -0.1% 19
9019
9119
9219
9319
9419
9519
9619
9719
9819
9920
0020
0120
0220
0320
0420
0520
0620
070
10
20
30
40Million Metric Tons Carbon Dioxide Equivalent
Adipic Acid
Nitric Acid
Figure 21. U.S. Nitrous Oxide Emissions fromIndustry by Source, 1990-2007
Source: EIA estimates.
Table 24. U.S. Nitrous Oxide Emissions from Industrial Sources, 1990, 1995, and 2000-2007(Million Metric Tons Carbon Dioxide Equivalent)
Source 1990 1995 2000 2001 2002 2003 2004 2005 2006 P2007
Adipic AcidControlled Sources . . . . . . . . . . . . . . 1.0 1.1 1.6 1.5 1.6 1.6 1.7 1.6 1.7 1.7Uncontrolled Sources . . . . . . . . . . . . 16.0 18.9 2.1 2.1 2.3 1.4 1.4 1.4 1.5 1.5Subtotal . . . . . . . . . . . . . . . . . . . . . 17.0 20.0 3.7 3.6 3.9 3.0 3.1 3.0 3.2 3.2
Nitric Acid. . . . . . . . . . . . . . . . . . . . . . 11.8 13.1 12.9 10.5 11.4 10.7 10.6 11.0 10.8 10.8
Total Known Industrial Sources. . . . 28.8 33.1 16.7 14.1 15.3 13.7 13.7 14.0 14.0 14.0
P = preliminary data.Note: Data in this table are revised from the data contained in the previous EIA report, Emissions of Greenhouse Gases in the United States
2006, DOE/EIA-0573(2006) (Washington, DC, November 2007). Totals may not equal sum of components due to independent rounding.Source: EIA estimates.

Nitrous Oxide EmissionsWaste Management
Overview Carbon Dioxide Methane Nitrous Oxide High-GWP Gases Land Use
Energy Information Administration / Emissions of Greenhouse Gases in the United States 2007 35
Summary• Emissions from residential and commercial waste-
water account for nearly all U.S. nitrous oxide emis-sions from waste management. The remainder isassociated with the combustion of municipal solidwaste (Figure 22 and Table 25).
• Estimates of nitrous oxide emissions from waste-water are scaled to population size and per-capitaintake of protein.
• Nitrous oxide is emitted from wastewater that con-tains nitrogen-based organic materials, such as thosefound in human or animal waste. Factors that influ-ence the amount of nitrous oxide generated fromwastewater include temperature, acidity, biochemicaloxygen demand, and nitrogen concentration.
U.S. Anthropogenic Nitrous Oxide Emissionsfrom Waste Management, 1990, 2006, and 2007
1990 2006 2007
Estimated Emissions(Million Metric Tons CO2e) . . . . 4.9 6.3 6.4
Change from 1990(Million Metric Tons CO2e) . . . . . . . . . . . 1.4 1.5(Percent) . . . . . . . . . . . . . . . . . . . . . . . . . 28.2% 29.5%
Average Annual Changefrom 1990 (Percent) . . . . . . . . . . . . . . . . 1.6% 1.5%
Change from 2006(Million Metric Tons CO2e). . . . . . . . . . . . . . . . . . . 0.1(Percent) . . . . . . . . . . . . . . . . . . . . . . . . . . . . . . . . 1.0%
1990
1991
1992
1993
1994
1995
1996
1997
1998
1999
2000
2001
2002
2003
2004
2005
2006
2007
0
2
4
6
8Million Metric Tons Carbon Dioxide Equivalent
Wastewater
Waste Combustion
Figure 22. U.S. Nitrous Oxide Emissions fromWaste Management by Source, 1990-2007
Source: EIA estimates.
Table 25. U.S. Nitrous Oxide Emissions from Waste Management, 1990, 1995, and 2000-2007(Million Metric Tons Carbon Dioxide Equivalent)
Source 1990 1995 2000 2001 2002 2003 2004 2005 2006 P2007
Domestic and Commercial Wastewater . . 4.6 5.1 5.6 5.7 5.7 5.7 5.8 5.9 6.0 6.0Waste Combustion. . . . . . . . . . . . . . . . . . 0.3 0.3 0.3 0.3 0.3 0.3 0.3 0.4 0.4 0.4
Total . . . . . . . . . . . . . . . . . . . . . . . . . . . 4.9 5.4 5.9 6.0 6.1 6.0 6.1 6.2 6.3 6.4
P = preliminary data.Note: Data in this table are revised from the data contained in the previous EIA report, Emissions of Greenhouse Gases in the United States
2006, DOE/EIA-0573(2006) (Washington, DC, November 2007). Totals may not equal sum of components due to independent rounding.Source: EIA estimates.


High-GWP GasesTotal Emissions
Overview Carbon Dioxide Methane Nitrous Oxide High-GWP Gases Land Use
Energy Information Administration / Emissions of Greenhouse Gases in the United States 2007 37
Summary• Greenhouse gases with high global warming
potential (high-GWP gases) are hydrofluorocarbons(HFCs), perfluorocarbons (PFCs), and sulfur hexa-fluoride (SF6), which together represented nearly2.4 percent of U.S. greenhouse gas emissions in 2007.
• Emissions estimates for the high-GWP gases are pro-vided to EIA by the EPA’s Office of Air and Radia-tion. The estimates are derived from the EPAVintaging Model.
• Emissions of high-GWP gases have increased steadilysince 1990 (Figure 23 and Table 26), largely becauseHFCs are being used to replace chlorofluorocarbons(CFCs), hydrochlorofluorocarbons (HCFCs), and otherozone-depleting substances that are being phased outunder the terms of the Montreal Protocol, whichentered into force on January 1, 1989.
• PFC emissions have declined since 1990 as a result ofproduction declines in the U.S. aluminum industry aswell as industry efforts to lower emissions per unit ofoutput.
U.S. Anthropogenic Emissions of High-GWPGases, 1990, 2006, and 2007
1990 2006 2007
Estimated Emissions(Million Metric Tons CO2e) . . . . 102.4 171.3 176.9
Change from 1990(Million Metric Tons CO2e) . . . . . . . . . . . 68.9 74.5(Percent) . . . . . . . . . . . . . . . . . . . . . . . . . 67.3% 72.8%
Average Annual Changefrom 1990 (Percent) . . . . . . . . . . . . . . . . 3.3% 3.3%
Change from 2006(Million Metric Tons CO2e). . . . . . . . . . . . . . . . . . . 5.6
(Percent) . . . . . . . . . . . . . . . . . . . . . . . . . . . . . . . . 3.3%
�
�
� � � � � � � � � � � � � � � �
��
� � � � � � � � � � � � � � � �
�
�� � � � � � � � � �
� � � � � �
�
�
�� � �
��
�
� �� �
� �
�� �
1990
1991
1992
1993
1994
1995
1996
1997
1998
1999
2000
2001
2002
2003
2004
2005
2006
2007
0
25
50
75
100
125
150Million Metric Tons Carbon Dioxide Equivalent
OtherPFCsSF6
HFCs
Figure 23. U.S. Anthropogenic Emissions ofHigh-GWP Gases, 1990-2007
Source: U.S. EPA estimates.
Table 26. U.S. Emissions of Hydrofluorocarbons, Perfluorocarbons, and Sulfur Hexafluoride,1990, 1995, and 2000-2007(Million Metric Tons Carbon Dioxide Equivalent)
Gas 1990 1995 2000 2001 2002 2003 2004 2005 2006 P2007
Hydrofluorocarbons . . . . . . . . . 46.3 67.1 112.6 110.2 120.6 117.9 134.6 143.3 140.8 144.9Perfluorocarbons . . . . . . . . . . . 24.4 18.6 16.3 8.6 11.0 9.1 8.0 8.0 8.1 10.1Other HFCs, PFCs/PFPEs . . . . . 0.4 2.1 4.9 4.7 4.7 4.7 5.4 6.1 6.1 6.1Sulfur Hexafluoride . . . . . . . . . . . 31.3 26.8 18.3 17.9 17.3 17.4 16.9 17.1 16.2 15.8
Total Emissions . . . . . . . . . . . 102.4 114.6 152.1 141.4 153.6 149.0 165.0 174.5 171.3 176.9
P = preliminary data.Notes: Other HFCs, PFCs/PFPEs include HFC-152a, HFC-227ea, HFC-245fa, HFC-4310mee, and a variety of PFCs and perfluoropolyethers
(PFPEs). They are grouped together to protect confidential data. Totals may not equal sum of components due to independent rounding.Source: U.S. Environmental Protection Agency, Office of Air and Radiation, web site www.epa.gov/globalwarming/ (preliminary estimates,
November 2008).

High-GWP GasesHydrofluorocarbons
Overview Carbon Dioxide Methane Nitrous Oxide High-GWP Gases Land Use
38 Energy Information Administration / Emissions of Greenhouse Gases in the United States 2007
Summary• HFCs are compounds that contain carbon, hydro-
gen, and fluorine. Although they do not destroystratospheric ozone, they are powerful greenhousegases.
• HFCs are used as solvents, residential and commer-cial refrigerants, firefighting agents, and propellantsfor aerosols.
• Emissions of substitutes for ozone-depleting sub-stances, including HFC-32, HFC-125, HFC-134a, andHFC-236fa, have grown from trace amounts in 1990to nearly 145 MMTCO2e in 2007 (Table 27).
• Nearly 90 percent of the growth in HFC emissionssince 1990 can be attributed to the use of HFCs asreplacements for ozone-depleting substances. The
market is expanding, with HFCs used in fire protectionapplications to replace Halon 1301 and Halon 1211.
• Since 2000, HFC-134a—used as a replacement forCFCs in air conditioners for passenger vehicles, trains,and buses—has accounted for the largest share of HFCemissions (Figure 24).
• Under the Clean Air Act, manufacture and importof HCFC-22, except for use as a feedstock and inequipment manufacture before 2010, are scheduled tobe phased out by January 1, 2010. Manufacturersof HCFC-22 are using cost-effective methods to makevoluntary reductions in the amount of HFC-23 that iscreated as a byproduct of HCFC-22 manufacture.
U.S. Anthropogenic Emissions of HFCs,1990, 2006, and 2007
1990 2006 2007
Estimated Emissions(Million Metric Tons CO2e) . . . . 46.3 140.8 144.9
Change from 1990(Million Metric Tons CO2e) . . . . . . . . . . . 94.6 98.6(Percent) . . . . . . . . . . . . . . . . . . . . . . . . . 204.2% 213.0%
Average Annual Changefrom 1990 (Percent) . . . . . . . . . . . . . . . . 7.2% 6.9%
Change from 2006(Million Metric Tons CO2e). . . . . . . . . . . . . . . . . . . 4.0(Percent) . . . . . . . . . . . . . . . . . . . . . . . . . . . . . . . . 2.9%
�
�
� � � � � � � � � � � ��
�� �
�
�
� � ��
�
�
��
��
��
��
� �
�
�
� � � � � � � � � � � � � � � �
�
�
��
� � � � �
�
� �
� �
�� � �
1990
1991
1992
1993
1994
1995
1996
1997
1998
1999
2000
2001
2002
2003
2004
2005
2006
2007
0
25
50
75Million Metric Tons Carbon Dioxide Equivalent
HFC-125
HFC-143a
HFC-134a
HFC-23
Figure 24. U.S. Anthropogenic Emissions ofHFCs, 1990-2007
Source: U.S. EPA estimates.
Table 27. U.S. Emissions of Hydrofluorocarbons, 1990, 1995, and 2000-2007(Million Metric Tons Carbon Dioxide Equivalent)
Gas 1990 1995 2000 2001 2002 2003 2004 2005 2006 P2007
HFC-23 . . . . . . . . . . . . . . . . . . . . 46.3 42.1 36.6 25.3 27.0 15.9 22.2 20.4 17.9 22.0HFC-32 . . . . . . . . . . . . . . . . . . . . 0.0 0.0 0.3 0.3 0.3 0.4 0.4 0.5 0.5 0.5HFC-125 . . . . . . . . . . . . . . . . . . . 0.0 4.5 14.0 15.4 16.8 18.4 20.4 22.8 22.8 22.8HFC-134a . . . . . . . . . . . . . . . . . . 0.0 19.5 49.9 54.6 58.9 62.4 67.8 72.7 72.7 72.7HFC-143a . . . . . . . . . . . . . . . . . . 0.0 0.9 9.7 11.8 14.3 17.1 20.3 23.9 23.9 23.9HFC-236fa . . . . . . . . . . . . . . . . . 0.0 0.0 2.1 2.8 3.3 3.6 3.6 3.0 3.0 3.0
Total HFCs . . . . . . . . . . . . . . . . 46.3 67.1 112.6 110.2 120.6 117.9 134.6 143.3 140.8 144.9
P = preliminary data.Note: Totals may not equal sum of components due to independent rounding.Source: U.S. Environmental Protection Agency, Office of Air and Radiation, web site www.epa.gov/globalwarming/ (preliminary estimates,
November 2008).
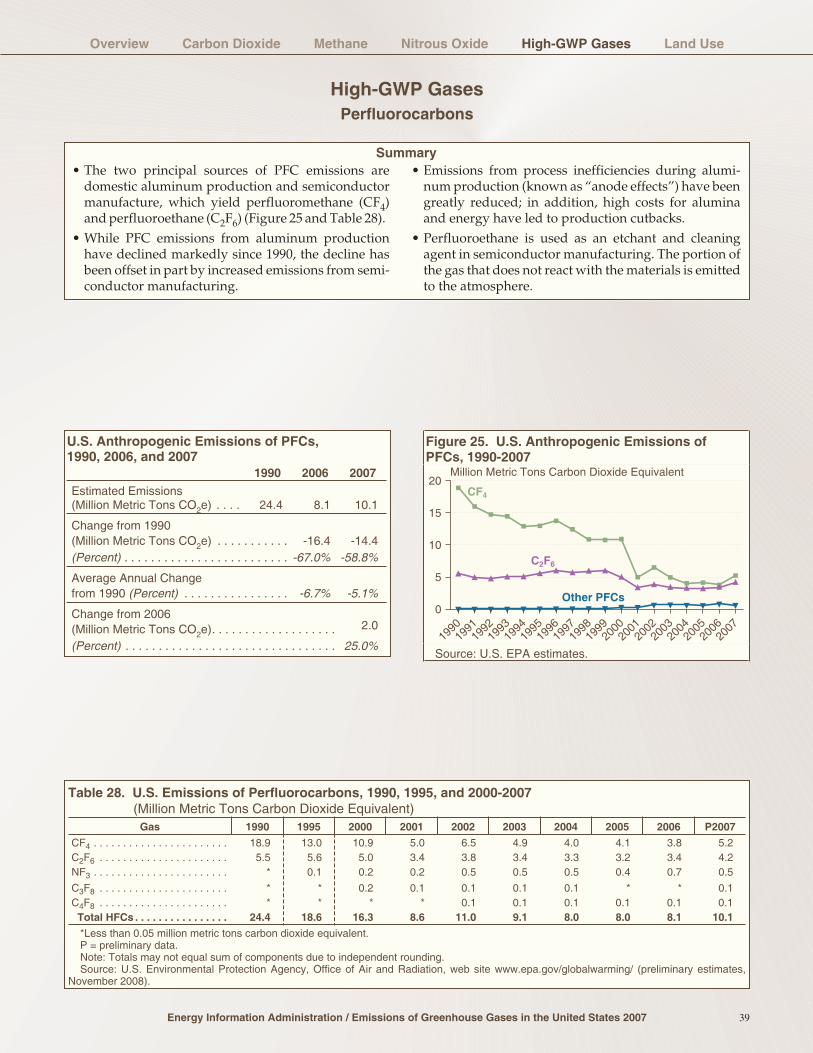
High-GWP GasesPerfluorocarbons
Overview Carbon Dioxide Methane Nitrous Oxide High-GWP Gases Land Use
Energy Information Administration / Emissions of Greenhouse Gases in the United States 2007 39
Summary• The two principal sources of PFC emissions are
domestic aluminum production and semiconductormanufacture, which yield perfluoromethane (CF4)and perfluoroethane (C2F6) (Figure 25 and Table 28).
• While PFC emissions from aluminum productionhave declined markedly since 1990, the decline hasbeen offset in part by increased emissions from semi-conductor manufacturing.
• Emissions from process inefficiencies during alumi-num production (known as “anode effects”) have beengreatly reduced; in addition, high costs for aluminaand energy have led to production cutbacks.
• Perfluoroethane is used as an etchant and cleaningagent in semiconductor manufacturing. The portion ofthe gas that does not react with the materials is emittedto the atmosphere.
U.S. Anthropogenic Emissions of PFCs,1990, 2006, and 2007
1990 2006 2007
Estimated Emissions(Million Metric Tons CO2e) . . . . 24.4 8.1 10.1
Change from 1990(Million Metric Tons CO2e) . . . . . . . . . . . -16.4 -14.4(Percent) . . . . . . . . . . . . . . . . . . . . . . . . . -67.0% -58.8%
Average Annual Changefrom 1990 (Percent) . . . . . . . . . . . . . . . . -6.7% -5.1%
Change from 2006(Million Metric Tons CO2e). . . . . . . . . . . . . . . . . . . 2.0
(Percent) . . . . . . . . . . . . . . . . . . . . . . . . . . . . . . . . 25.0%
� �� � � � � � � � � � � � � � � �
�
�
�� �
� ��
�� � �
��
�� � �
��
� � � � � � � � ��
� � � � � �
1990
1991
1992
1993
1994
1995
1996
1997
1998
1999
2000
2001
2002
2003
2004
2005
2006
2007
0
5
10
15
20Million Metric Tons Carbon Dioxide Equivalent
CF4
C2F6
Other PFCs
Figure 25. U.S. Anthropogenic Emissions ofPFCs, 1990-2007
Source: U.S. EPA estimates.
Table 28. U.S. Emissions of Perfluorocarbons, 1990, 1995, and 2000-2007(Million Metric Tons Carbon Dioxide Equivalent)
Gas 1990 1995 2000 2001 2002 2003 2004 2005 2006 P2007
CF4 . . . . . . . . . . . . . . . . . . . . . . . 18.9 13.0 10.9 5.0 6.5 4.9 4.0 4.1 3.8 5.2C2F6 . . . . . . . . . . . . . . . . . . . . . . 5.5 5.6 5.0 3.4 3.8 3.4 3.3 3.2 3.4 4.2NF3 . . . . . . . . . . . . . . . . . . . . . . . * 0.1 0.2 0.2 0.5 0.5 0.5 0.4 0.7 0.5
C3F8 . . . . . . . . . . . . . . . . . . . . . . * * 0.2 0.1 0.1 0.1 0.1 * * 0.1C4F8 . . . . . . . . . . . . . . . . . . . . . . * * * * 0.1 0.1 0.1 0.1 0.1 0.1Total HFCs . . . . . . . . . . . . . . . . 24.4 18.6 16.3 8.6 11.0 9.1 8.0 8.0 8.1 10.1
*Less than 0.05 million metric tons carbon dioxide equivalent.P = preliminary data.Note: Totals may not equal sum of components due to independent rounding.Source: U.S. Environmental Protection Agency, Office of Air and Radiation, web site www.epa.gov/globalwarming/ (preliminary estimates,
November 2008).

High-GWP GasesSulfur Hexafluoride
Overview Carbon Dioxide Methane Nitrous Oxide High-GWP Gases Land Use
40 Energy Information Administration / Emissions of Greenhouse Gases in the United States 2007
Summary• SF6, an excellent dielectric gas for high-voltage appli-
cations, is used primarily in electrical applications—as an insulator and arc interrupter for circuit break-ers, switch gear, and other equipment in electricitytransmission and distribution systems.
• Industry efforts to reduce emissions of SF6 from elec-trical power systems have led to a decline in emis-sions since 1990 (Figure 26 and Table 29).
• SF6 is also used in magnesium metal casting, as a covergas during magnesium production, and as an atmo-spheric tracer for experimental purposes.
• Other, minor applications of SF6 include leak detectionand the manufacture of loudspeakers and lasers.
U.S. Anthropogenic Emissions of SF6,1990, 2006, and 2007
1990 2006 2007
Estimated Emissions(Million Metric Tons CO2e) . . . . 31.3 16.2 15.8
Change from 1990(Million Metric Tons CO2e) . . . . . . . . . . . -15.0 -15.5(Percent) . . . . . . . . . . . . . . . . . . . . . . . . . -48.1% -49.5%
Average Annual Changefrom 1990 (Percent) . . . . . . . . . . . . . . . . -4.0% -3.9%
Change from 2006(Million Metric Tons CO2e). . . . . . . . . . . . . . . . . . . -0.5
(Percent) . . . . . . . . . . . . . . . . . . . . . . . . . . . . . . . . -2.8%
��
� � � � � � � � �
� � � � � � �� �� � � � � � � � � � � � � � � �
�
�
� � ��
��
�� � � � � � � � �
1990
1991
1992
1993
1994
1995
1996
1997
1998
1999
2000
2001
2002
2003
2004
2005
2006
2007
0
10
20
30Million Metric Tons Carbon Dioxide Equivalent
Semiconductors
Electrical Applications
Magnesium Smelting
Figure 26. U.S. Anthropogenic Emissions of SF6by Source, 1990-2007
Source: U.S. EPA estimates.
Table 29. U.S. Emissions of Sulfur Hexafluoride by Source, 1990, 1995, and 2000-2007(Million Metric Tons Carbon Dioxide Equivalent)Source 1990 1995 2000 2001 2002 2003 2004 2005 2006 P2007
Electrical Applications . . . . . . . . . 25.6 20.6 14.4 14.4 13.9 13.3 13.4 13.4 12.6 12.1Magnesium Smelting . . . . . . . . . 5.2 5.4 2.9 2.7 2.8 3.3 2.8 2.8 2.7 2.8Semiconductors . . . . . . . . . . . . . 0.5 0.9 1.0 0.7 0.6 0.8 0.8 0.9 0.9 0.9
Total SF6 . . . . . . . . . . . . . . . . . 31.3 26.8 18.3 17.9 17.3 17.4 16.9 17.1 16.2 15.8
P = preliminary data.Note: Totals may not equal sum of components due to independent rounding.Source: U.S. Environmental Protection Agency, Office of Air and Radiation, web site www.epa.gov/globalwarming/ (preliminary estimates,
November 2008).
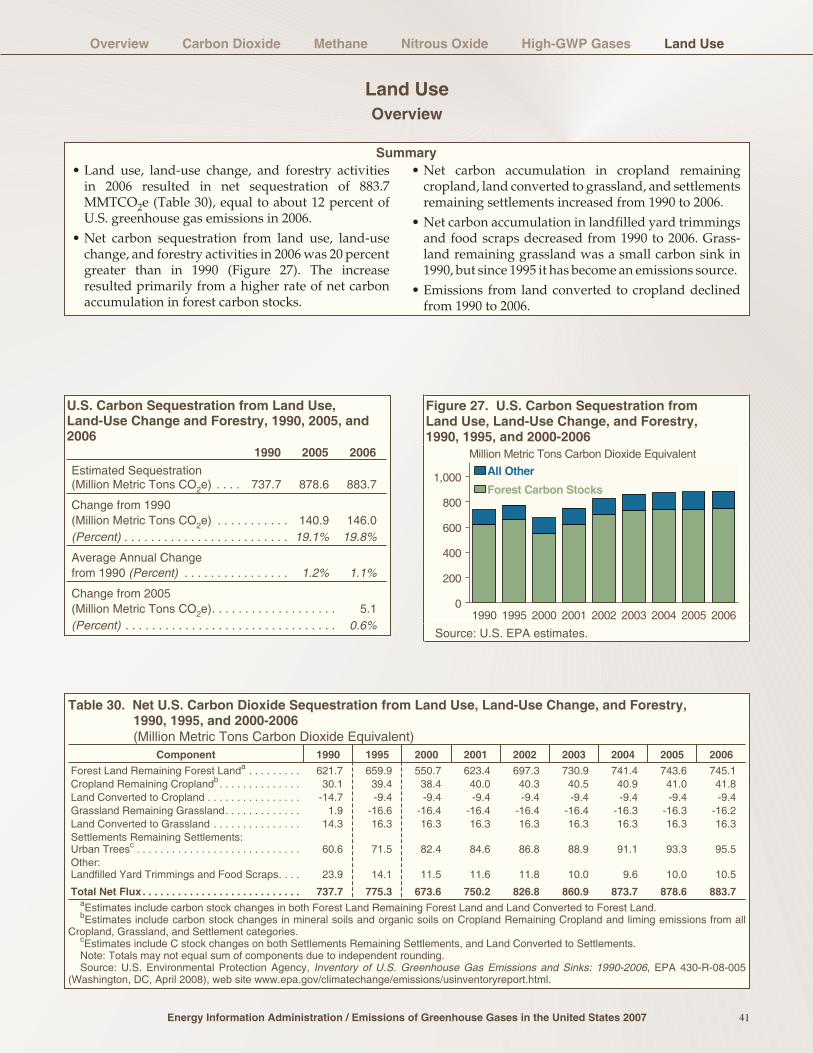
Land UseOverview
Overview Carbon Dioxide Methane Nitrous Oxide High-GWP Gases Land Use
Energy Information Administration / Emissions of Greenhouse Gases in the United States 2007 41
Summary• Land use, land-use change, and forestry activities
in 2006 resulted in net sequestration of 883.7MMTCO2e (Table 30), equal to about 12 percent ofU.S. greenhouse gas emissions in 2006.
• Net carbon sequestration from land use, land-usechange, and forestry activities in 2006 was 20 percentgreater than in 1990 (Figure 27). The increaseresulted primarily from a higher rate of net carbonaccumulation in forest carbon stocks.
• Net carbon accumulation in cropland remainingcropland, land converted to grassland, and settlementsremaining settlements increased from 1990 to 2006.
• Net carbon accumulation in landfilled yard trimmingsand food scraps decreased from 1990 to 2006. Grass-land remaining grassland was a small carbon sink in1990, but since 1995 it has become an emissions source.
• Emissions from land converted to cropland declinedfrom 1990 to 2006.
U.S. Carbon Sequestration from Land Use,Land-Use Change and Forestry, 1990, 2005, and2006
1990 2005 2006
Estimated Sequestration(Million Metric Tons CO2e) . . . . 737.7 878.6 883.7
Change from 1990(Million Metric Tons CO2e) . . . . . . . . . . . 140.9 146.0(Percent) . . . . . . . . . . . . . . . . . . . . . . . . . 19.1% 19.8%
Average Annual Changefrom 1990 (Percent) . . . . . . . . . . . . . . . . 1.2% 1.1%
Change from 2005(Million Metric Tons CO2e). . . . . . . . . . . . . . . . . . . 5.1(Percent) . . . . . . . . . . . . . . . . . . . . . . . . . . . . . . . . 0.6%
1990 1995 2000 2001 2002 2003 2004 2005 20060
200
400
600
800
1,000
Million Metric Tons Carbon Dioxide Equivalent
Forest Carbon Stocks
All Other
Figure 27. U.S. Carbon Sequestration fromLand Use, Land-Use Change, and Forestry,1990, 1995, and 2000-2006
Source: U.S. EPA estimates.
Table 30. Net U.S. Carbon Dioxide Sequestration from Land Use, Land-Use Change, and Forestry,1990, 1995, and 2000-2006(Million Metric Tons Carbon Dioxide Equivalent)
Component 1990 1995 2000 2001 2002 2003 2004 2005 2006
Forest Land Remaining Forest Landa . . . . . . . . . 621.7 659.9 550.7 623.4 697.3 730.9 741.4 743.6 745.1Cropland Remaining Croplandb. . . . . . . . . . . . . . 30.1 39.4 38.4 40.0 40.3 40.5 40.9 41.0 41.8Land Converted to Cropland . . . . . . . . . . . . . . . . -14.7 -9.4 -9.4 -9.4 -9.4 -9.4 -9.4 -9.4 -9.4Grassland Remaining Grassland. . . . . . . . . . . . . 1.9 -16.6 -16.4 -16.4 -16.4 -16.4 -16.3 -16.3 -16.2Land Converted to Grassland . . . . . . . . . . . . . . . 14.3 16.3 16.3 16.3 16.3 16.3 16.3 16.3 16.3Settlements Remaining Settlements:Urban Treesc . . . . . . . . . . . . . . . . . . . . . . . . . . . . 60.6 71.5 82.4 84.6 86.8 88.9 91.1 93.3 95.5Other:Landfilled Yard Trimmings and Food Scraps. . . . 23.9 14.1 11.5 11.6 11.8 10.0 9.6 10.0 10.5
Total Net Flux . . . . . . . . . . . . . . . . . . . . . . . . . . . 737.7 775.3 673.6 750.2 826.8 860.9 873.7 878.6 883.7aEstimates include carbon stock changes in both Forest Land Remaining Forest Land and Land Converted to Forest Land.bEstimates include carbon stock changes in mineral soils and organic soils on Cropland Remaining Cropland and liming emissions from all
Cropland, Grassland, and Settlement categories.cEstimates include C stock changes on both Settlements Remaining Settlements, and Land Converted to Settlements.Note: Totals may not equal sum of components due to independent rounding.Source: U.S. Environmental Protection Agency, Inventory of U.S. Greenhouse Gas Emissions and Sinks: 1990-2006, EPA 430-R-08-005
(Washington, DC, April 2008), web site www.epa.gov/climatechange/emissions/usinventoryreport.html.

Land UseForest Lands and Harvested Wood Pools
Overview Carbon Dioxide Methane Nitrous Oxide High-GWP Gases Land Use
42 Energy Information Administration / Emissions of Greenhouse Gases in the United States 2007
Summary• Carbon sequestration attributed to forest land
remaining forest land in 2006 totaled 745.1 millionmetric tons carbon dioxide equivalent (Figure 28 andTable 31). This carbon pool has grown by 20 percentsince 1990, and it is the primary source of growth inU.S. terrestrial carbon stocks.
• The increase in annual carbon sequestration on for-ested lands (146 MMTCO2e higher in 2006 than in1990) more than equals the decrease in sequestrationof carbon in harvested wood over the same period(23 MMTCO2e lower in 2006 than in 1990).
• The national sequestration estimates shown below12
are based on individual State surveys, which are per-formed at different times and irregular frequencies inthe different States. For the first time, this year’s inven-tory includes a portion of Alaskan forest.
• Because new data or changes in data for some yearsand/or States can affect the calculations for interven-ing years, the annual estimation process generallyresults in revisions of the national estimates for allyears in the series. In this year’s inventory, data for 31of the 48 States were changed from those in the previ-ous year’s inventory.
Carbon Sequestration in U.S. Forest Landsand Harvested Wood Pools, 1990, 2005, and 2006
1990 2005 2006
Estimated Sequestration(Million Metric Tons CO2e) . . . . 621.7 743.6 745.1
Change from 1990(Million Metric Tons CO2e) . . . . . . . . . . . 121.9 123.4(Percent) . . . . . . . . . . . . . . . . . . . . . . . . . 19.6% 19.8%
Average Annual Changefrom 1990 (Percent) . . . . . . . . . . . . . . . . 1.2% 1.1%
Change from 2005(Million Metric Tons CO2e). . . . . . . . . . . . . . . . . . . 1.5
(Percent) . . . . . . . . . . . . . . . . . . . . . . . . . . . . . . . . 0.2%
Below-GroundBiomass
80.9
(Million Metric TonsCarbon Dioxide
Equivalent)
Landfilled Wood64.7
Wood Products45.3Dead Wood
56.9 Litter56.2
Soil Organic Carbon34.5
Above-GroundBiomass
406.5
2005 Total = 745.1
Figure 28. Carbon Sequestration in U.S.Forest Lands and Harvested Wood Pools, 2006
Source: U.S. EPA estimates.
Table 31. Net Carbon Dioxide Sequestration in U.S. Forests and Harvested Wood Pools,1990, 1995, and 2000-2006(Million Metric Tons Carbon Dioxide Equivalent)
Carbon Pool 1990 1995 2000 2001 2002 2003 2004 2005 2006
Forests . . . . . . . . . . . . . . . . . . . . . . . . . . . . 489.1 540.5 436.8 529.0 598.0 635.1 635.1 635.1 635.1Above-Ground Biomass . . . . . . . . . . . . . . 287.6 318.4 335.4 367.7 384.4 406.5 406.5 406.5 406.5Below-Ground Biomass. . . . . . . . . . . . . . . 54.2 62.4 67.2 73.7 76.9 80.9 80.9 80.9 80.9Dead Wood . . . . . . . . . . . . . . . . . . . . . . . . 40.1 57.5 44.9 50.0 53.0 56.9 56.9 56.9 56.9Litter. . . . . . . . . . . . . . . . . . . . . . . . . . . . . . 63.3 34.9 17.3 36.3 47.7 56.2 56.2 56.2 56.2Soil Organic Carbon . . . . . . . . . . . . . . . . . 43.9 67.5 -28.0 1.3 36.0 34.5 34.5 34.5 34.5
Harvested Wood . . . . . . . . . . . . . . . . . . . . 132.6 119.4 113.9 94.5 99.2 95.9 106.3 108.5 110.0Wood Products . . . . . . . . . . . . . . . . . . . . . 64.8 55.2 47.0 31.9 35.1 35.4 45.5 47.3 45.3Landfilled Wood. . . . . . . . . . . . . . . . . . . . . 67.9 64.1 66.9 62.6 64.2 60.4 60.8 61.2 64.7
Total . . . . . . . . . . . . . . . . . . . . . . . . . . . . . . 621.7 659.9 550.7 623.4 697.3 730.9 741.4 743.6 745.1
Notes: The sums of the annual net stock changes in this table (shown in the “Total” row) represent estimates of the actual net flux between thetotal forest carbon pool and the atmosphere. Forest estimates are based on periodic measurements; harvested wood estimates are based onannual surveys and models. Totals may not equal sum of components due to independent rounding.
Source: U.S. Environmental Protection Agency, Inventory of U.S. Greenhouse Gas Emissions and Sinks: 1990-2006, EPA 430-R-08-005(Washington, DC, April 2008), web site www.epa.gov/climatechange/emissions/usinventoryreport.html.
12Compiled by the U.S. Department of Agriculture and the U.S. EPA.12Compiled by the U.S. Department of Agriculture and the U.S. EPA.

Land UseCroplands and Grasslands
Overview Carbon Dioxide Methane Nitrous Oxide High-GWP Gases Land Use
Energy Information Administration / Emissions of Greenhouse Gases in the United States 2007 43
Summary• For 2006, the aggregate flux of carbon dioxide in the
four agricultural categories (cropland remainingcropland, land converted to cropland, grasslandremaining grassland, and land converted to grass-land) was 32.5 MMTCO2e.
• Cropland remaining cropland and land converted tograssland sequestered 41.8 and 16.3 MMTCO2e,respectively, in 2006. Land converted to cropland
and grassland remaining grassland emitted 9.4 and16.2 MMTCO2e, respectively (Figure 29 and Table 32).
• This year’s inventory differs from last year’s in theclassification of agricultural land use. Last year, if sur-veys classified a given area of land as, for example,cropland remaining cropland in 2005, that categoriza-tion was applied over the entire period from 1990 to2005. In this year’s inventory, the classification of anarea is determined separately for each year.
Carbon Sequestration in U.S. Croplands andGrasslands, 1990, 2005, and 2006
1990 2005 2006
Estimated Sequestration(Million Metric Tons CO2e) . . . . 31.9 31.6 32.5
Change from 1990(Million Metric Tons CO2e) . . . . . . . . . . . -0.3 0.6(Percent) . . . . . . . . . . . . . . . . . . . . . . . . . -0.9% 1.9%
Average Annual Changefrom 1990 (Percent) . . . . . . . . . . . . . . . . -0.1% 0.1%
Change from 2005(Million Metric Tons CO2e). . . . . . . . . . . . . . . . . . . 0.9(Percent) . . . . . . . . . . . . . . . . . . . . . . . . . . . . . . . . 2.8% 1990 1995 2001 2002 2003 2004 2005 2006
0
20
40
60
80
100
-20
Million Metric Tons Carbon Dioxide EquivalentCropland Remaining Cropland
Land Converted to Cropland
Grassland Remaining Grassland
Land Converted to Grassland
Figure 29. Carbon Sequestration in U.S.Croplands and Grasslands, 1990, 1995, and2001-2006
Source: U.S. EPA estimates.
Table 32. Net Carbon Dioxide Sequestration in U.S. Croplands and Grasslands, 1990, 1995, and 2000-2006(Million Metric Tons Carbon Dioxide Equivalent)
Carbon Pool 1990 1995 2000 2001 2002 2003 2004 2005 2006
Cropland Remaining Cropland. . . . . . . . . 30.1 39.4 38.4 40.0 40.3 40.5 40.9 41.0 41.8Mineral Soils . . . . . . . . . . . . . . . . . . . . . . . 57.5 67.0 66.1 67.7 68.0 68.1 68.5 68.7 69.5Organic Soils . . . . . . . . . . . . . . . . . . . . . . . -27.4 -27.7 -27.7 -27.7 -27.7 -27.7 -27.7 -27.7 -27.7
Land Converted to Cropland . . . . . . . . . . -14.7 -9.4 -9.4 -9.4 -9.4 -9.4 -9.4 -9.4 -9.4Mineral Soils . . . . . . . . . . . . . . . . . . . . . . . -12.3 -6.7 -6.7 -6.7 -6.7 -6.7 -6.7 -6.7 -6.7Organic Soils . . . . . . . . . . . . . . . . . . . . . . . -2.4 -2.6 -2.6 -2.6 -2.6 -2.6 -2.6 -2.6 -2.6
Grassland Remaining Grassland . . . . . . . 1.9 -16.6 -16.4 -16.4 -16.4 -16.4 -16.3 -16.3 -16.2Mineral Soils . . . . . . . . . . . . . . . . . . . . . . . 5.7 -12.9 -12.8 -12.7 -12.7 -12.7 -12.6 -12.6 -12.5Organic Soils . . . . . . . . . . . . . . . . . . . . . . . -3.9 -3.7 -3.7 -3.7 -3.7 -3.7 -3.7 -3.7 -3.7
Land Converted to Grassland . . . . . . . . . 14.6 16.3 16.3 16.3 16.3 16.3 16.3 16.3 16.3Mineral Soils . . . . . . . . . . . . . . . . . . . . . . . 15.0 17.2 17.2 17.2 17.2 17.2 17.2 17.2 17.2Organic Soils . . . . . . . . . . . . . . . . . . . . . . . -0.5 -0.9 -0.9 -0.9 -0.9 -0.9 -0.9 -0.9 -0.9
Total Sequestration . . . . . . . . . . . . . . . . . . 31.9 29.7 28.9 30.5 30.8 31.0 31.5 31.6 32.5
Liming of Soils . . . . . . . . . . . . . . . . . . . . . . . -4.7 -4.4 -4.3 -4.4 -5.0 -4.6 -3.9 -4.3 -4.4
Note: Negative values indicate emissions.Source: U.S. Environmental Protection Agency, Inventory of U.S. Greenhouse Gas Emissions and Sinks: 1990-2006, EPA 430-R-08-005
(Washington, DC, April 2008), web site www.epa.gov/climatechange/emissions/usinventoryreport.html.

Land UseUrban Trees, Yard Trimmings, and Food Scraps
Overview Carbon Dioxide Methane Nitrous Oxide High-GWP Gases Land Use
44 Energy Information Administration / Emissions of Greenhouse Gases in the United States 2007
Summary• Urban trees accounted for nearly all (90 percent) of
the carbon sequestration attributed to urban trees,yard trimmings, and food scraps in 2006 (Figure 30and Table 33).
• The half-lives of branches and food scraps wereupdated this year to match the values for food scrapsand woody materials provided in the IPCC guide-lines for analyzing landfill methane.
• The increase in annual carbon sequestration in urbantrees (34.9 MMTCO2e higher in 2006 than in 1990)
more than equals the decrease in sequestration of car-bon in yard trimmings over the same period (14.6MMTCO2e lower in 2006 than in 1990).
• This year’s inventory uses new carbon content esti-mates for leaves and grass, as well as new data onmunicipal solid waste that eliminate the need for inter-polation. As a result of those changes, net flux esti-mates across the entire time series are 7 percent higheron average, and the estimate for 2005 is 13 percenthigher, than in last year’s inventory.
Carbon Sequestration in U.S. Urban Trees,Yard Trimmings, and Food Scraps,1990, 2005, and 2006
1990 2005 2006
Estimated Sequestration(Million Metric Tons CO2e) . . . . 84.5 103.3 106.0
Change from 1990(Million Metric Tons CO2e) . . . . . . . . . . . 18.8 21.5
(Percent) . . . . . . . . . . . . . . . . . . . . . . . . . 22.2% 25.4%
Average Annual Changefrom 1990 (Percent) . . . . . . . . . . . . . . . . 1.3% 1.4%
Change from 2005(Million Metric Tons CO2e). . . . . . . . . . . . . . . . . . . 2.7
(Percent) . . . . . . . . . . . . . . . . . . . . . . . . . . . . . . . . 2.6%1990 1995 2000 2001 2002 2003 2004 2005 2006
0
30
60
90
120
150Million Metric Tons Carbon Dioxide Equivalent
Urban Trees
Yard Trimmings
Food Scraps
Figure 30. Carbon Sequestration in U.S.Urban Trees, Yard Trimmings, and Food Scraps,1990, 1995, and 2000-2006
Source: U.S. EPA estimates.
Table 33. Net Carbon Dioxide Sequestration in U.S. Urban Trees, Yard Trimmings, and Food Scraps,1990, 1995, and 2000-2006(Million Metric Tons Carbon Dioxide Equivalent)
Carbon Pool 1990 1995 2000 2001 2002 2003 2004 2005 2006
Urban Trees . . . . . . . . . . . . . . . . . . . . . . . . 60.6 71.5 82.4 84.6 86.8 88.9 91.1 93.3 95.5Yard Trimmings . . . . . . . . . . . . . . . . . . . . . 21.4 12.6 8.2 8.5 8.7 7.1 6.2 6.5 6.8Grass . . . . . . . . . . . . . . . . . . . . . . . . . . . . . 1.9 0.8 0.4 0.5 0.6 0.4 0.3 0.4 0.5Leaves . . . . . . . . . . . . . . . . . . . . . . . . . . . . 9.7 6.0 4.0 4.1 4.2 3.5 3.1 3.2 3.3Branches . . . . . . . . . . . . . . . . . . . . . . . . . . 9.7 5.8 3.7 3.8 3.9 3.2 2.8 2.9 3.0
Food Scraps. . . . . . . . . . . . . . . . . . . . . . . . 2.5 1.6 3.3 3.1 3.1 2.9 3.4 3.5 3.7
Total Net Flux. . . . . . . . . . . . . . . . . . . . . . . 84.5 85.7 93.9 96.2 98.6 98.9 100.7 103.3 106.0
Note: Totals may not equal sum of components due to independent rounding.Source: U.S. Environmental Protection Agency, Inventory of U.S. Greenhouse Gas Emissions and Sinks: 1990-2006, EPA 430-R-08-005
(Washington, DC, April 2008), web site www.epa.gov/climatechange/emissions/usinventoryreport.html.
GlossaryAcid stabilization: A circumstance where the pH of thewaste mixture in an animal manure management sys-tem is maintained near 7.0, optimal conditions for meth-ane production.
Aerobic bacteria: Microorganisms living, active, oroccurring only in the presence of oxygen.
Aerobic decomposition: The breakdown of a moleculeinto simpler molecules or atoms by microorganismsunder favorable conditions of oxygenation.
Aerosols: Airborne particles.
Afforestation: Planting of new forests on lands thathave not been recently forested.
Agglomeration: The clustering of disparate elements.
Airshed: An area or region defined by settlement pat-terns or geology that results in discrete atmosphericconditions.
Albedo: The fraction of incident light or electromagneticradiation that is reflected by a surface or body. See Plane-tary albedo.
Anaerobes: Organisms that live and are active only inthe absence of oxygen.
Anaerobic bacteria: Microorganisms living, active, oroccurring only in the absence of oxygen.
Anaerobic decomposition: The breakdown of mole-cules into simpler molecules or atoms by microorgan-isms that can survive in the partial or complete absenceof oxygen.
Anaerobic lagoon: A liquid-based manure managementsystem, characterized by waste residing in water to adepth of at least six feet for a period ranging between 30and 200 days.
Anode: A positive electrode, as in a battery, radio tube,etc.
Anthracite: The highest rank of coal; used primarily forresidential and commercial space heating. It is a hard,brittle, and black lustrous coal, often referred to as hardcoal, containing a high percentage of fixed carbon anda low percentage of volatile matter. The moisture con-tent of fresh-mined anthracite generally is less than 15percent. The heat content of anthracite ranges from 22 to28 million Btu per ton on a moist, mineral-matter-freebasis. The heat content of anthracite coal consumed inthe United States averages 25 million Btu per ton, on theas-received basis (i.e., containing both inherent moistureand mineral matter). Note: Since the 1980’s, anthraciterefuse or mine waste has been used for steam electric
power generation. This fuel typically has a heat contentof 15 million Btu per ton or less.
Anthropogenic: Made or generated by a human orcaused by human activity. The term is used in the con-text of global climate change to refer to gaseous emis-sions that are the result of human activities, as well asother potentially climate-altering activities, such asdeforestation.
API Gravity: American Petroleum Institute measure ofspecific gravity of crude oil or condensate in degrees. Anarbitrary scale expressing the gravity or density of liquidpetroleum products. The measuring scale is calibrated interms of degrees API; it is calculated as follows: DegreesAPI = (141.5/sp.gr.60 deg.F/60 deg.F) - 131.5.
Asphalt: A dark brown-to-black cement-like materialobtained by petroleum processing and containing bitu-mens as the predominant component; used primarily forroad construction. It includes crude asphalt as well asthe following finished products: cements, fluxes, theasphalt content of emulsions (exclusive of water), andpetroleum distillates blended with asphalt to make cut-back asphalts. Note: The conversion factor for asphalt is5.5 barrels per short ton.
Associated natural gas: See Associated-dissolved naturalgas and Natural gas.
Associated-dissolved natural gas: Natural gas thatoccurs in crude oil reservoirs either as free gas (associ-ated) or as gas in solution with crude oil (dissolved gas).See Natural gas.
Aviation gasoline (finished): A complex mixture of rel-atively volatile hydrocarbons with or without smallquantities of additives, blended to form a fuel suitablefor use in aviation reciprocating engines. Fuel specifica-tions are provided in ASTM Specification D 910 and Mil-itary Specification MIL-G-5572. Note: Data on blendingcomponents are not counted in data on finished aviationgasoline.
Balancing item: Represents differences between thesum of the components of natural gas supply and thesum of the components of natural gas disposition. Thesedifferences may be due to quantities lost or to the effectsof data reporting problems. Reporting problems includedifferences due to the net result of conversions of flowdata metered at varying temperature and pressure basesand converted to a standard temperature and pressurebase; the effect of variations in company accounting andbilling practices; differences between billing cycle andcalendar period time frames; and imbalances resultingfrom the merger of data reporting systems that vary inscope, format, definitions, and type of respondents.
Energy Information Administration / Emissions of Greenhouse Gases in the United States 2007 45

Biofuels: Liquid fuels and blending components pro-duced from biomass (plant) feedstocks, used primarilyfor transportation.
Biogas: The gas produced from the anaerobic decompo-sition of organic material in a landfill.
Biogenic: Produced by the actions of living organisms.
Biomass: Organic nonfossil material of biological originconstituting a renewable energy source.
Biosphere: The portion of the Earth and its atmospherethat can support life. The part of the global carbon cyclethat includes living organisms and biogenic organicmatter.
Bituminous coal: A dense coal, usually black, some-times dark brown, often with well-defined bands ofbright and dull material, used primarily as fuel insteam-electric power generation, with substantial quan-tities also used for heat and power applications in manu-facturing and to make coke. Bituminous coal is the mostabundant coal in active U.S. mining regions. Its moisturecontent usually is less than 20 percent. The heat contentof bituminous coal ranges from 21 to 30 million Btu perton on a moist, mineral-matter-free basis. The heat con-tent of bituminous coal consumed in the United Statesaverages 24 million Btu per ton, on the as-received basis(i.e., containing both inherent moisture and mineralmatter).
BOD5: The biochemical oxygen demand of wastewaterduring decomposition occurring over a 5-day period. Ameasure of the organic content of wastewater.
Bromofluorocarbons (halons): Inert, nontoxic chemi-cals that have at least one bromine atom in their chemi-cal makeup. They evaporate without leaving a residueand are used in fire extinguishing systems, especially forlarge computer installations.
Bunker fuel: Fuel supplied to ships and aircraft, bothdomestic and foreign, consisting primarily of residualand distillate fuel oil for ships and kerosene-based jetfuel for aircraft. The term “international bunker fuels” isused to denote the consumption of fuel for internationaltransport activities. Note: For the purposes of green-house gas emissions inventories, data on emissions fromcombustion of international bunker fuels are subtractedfrom national emissions totals. Historically, bunkerfuels have meant only ship fuel. See Vessel bunkering.
Calcination: A process in which a material is heated to ahigh temperature without fusing, so that hydrates, car-bonates, or other compounds are decomposed and thevolatile material is expelled.
Calcium sulfate: A white crystalline salt, insoluble inwater. Used in Keene’s cement, in pigments, as a paperfiller, and as a drying agent.
Calcium sulfite: A white powder, soluble in dilute sul-furic acid. Used in the sulfite process for the manufac-ture of wood pulp.
Capital stock: Property, plant and equipment used inthe production, processing and distribution of energyresources.
Carbon black: An amorphous form of carbon, producedcommercially by thermal or oxidative decomposition ofhydrocarbons and used principally in rubber goods,pigments, and printer’s ink.
Carbon budget: Carbon budget: The balance of theexchanges (incomes and losses) of carbon between car-bon sinks (e.g., atmosphere and biosphere) in the carboncycle. See Carbon cycle and Carbon sink.
Carbon cycle: All carbon sinks and exchanges of carbonfrom one sink to another by various chemical, physical,geological, and biological processes. See Carbon sink andCarbon budget.
Carbon dioxide (CO2): A colorless, odorless, non-poisonous gas that is a normal part of Earth’s atmo-sphere. Carbon dioxide is a product of fossil-fuel com-bustion as well as other processes. It is considered agreenhouse gas as it traps heat (infrared energy) radi-ated by the Earth into the atmosphere and thereby con-tributes to the potential for global warming. The globalwarming potential (GWP) of other greenhouse gases ismeasured in relation to that of carbon dioxide, which byinternational scientific convention is assigned a value ofone (1). See Global warming potential (GWP) and Green-house gases.
Carbon dioxide equivalent: The amount of carbon diox-ide by weight emitted into the atmosphere that wouldproduce the same estimated radiative forcing as a givenweight of another radiatively active gas. Carbon dioxideequivalents are computed by multiplying the weight ofthe gas being measured (for example, methane) by itsestimated global warming potential (which is 21 formethane). “Carbon equivalent units” are defined as car-bon dioxide equivalents multiplied by the carbon con-tent of carbon dioxide (i.e., 12/44).
Carbon flux: See Carbon budget.
Carbon intensity: The amount of carbon by weightemitted per unit of energy consumed. A common mea-sure of carbon intensity is weight of carbon per Britishthermal unit (Btu) of energy. When there is only one fos-sil fuel under consideration, the carbon intensity and theemissions coefficient are identical. When there are sev-eral fuels, carbon intensity is based on their combinedemissions coefficients weighted by their energy con-sumption levels. See Emissions coefficient and Carbon out-put rate.
Glossary
46 Energy Information Administration / Emissions of Greenhouse Gases in the United States 2007

Carbon output rate: The amount of carbon by weightper kilowatthour of electricity produced.
Carbon sequestration: The fixation of atmospheric car-bon dioxide in a carbon sink through biological or physi-cal processes.
Carbon sink: A reservoir that absorbs or takes upreleased carbon from another part of the carbon cycle.The four sinks, which are regions of the Earth withinwhich carbon behaves in a systematic manner, are theatmosphere, terrestrial biosphere (usually includingfreshwater systems), oceans, and sediments (includingfossil fuels).
Catalytic converter: A device containing a catalyst forconverting automobile exhaust into mostly harmlessproducts.
Catalytic hydrocracking: A refining process that useshydrogen and catalysts with relatively low tempera-tures and high pressures for converting middle boilingor residual material to high octane gasoline, reformercharge stock, jet fuel, and/or high grade fuel oil. Theprocess uses one or more catalysts, depending on prod-uct output, and can handle high sulfur feedstocks with-out prior desulfurization.
Cesspool: An underground reservoir for liquid waste,typically household sewage.
Chlorofluorocarbon (CFC): Any of various compoundsconsisting of carbon, hydrogen, chlorine, and fluorineused as refrigerants. CFCs are now thought to be harm-ful to the earth’s atmosphere.
Clean Development Mechanism (CDM): A Kyoto Pro-tocol program that enables industrialized countries tofinance emissions-avoiding projects in developing coun-tries and receive credit for reductions achieved againsttheir own emissions limitation targets. See KyotoProtocol.
Climate: The average course or condition of the weatherover a period of years as exhibited by temperature,humidity, wind velocity, and precipitation.
Climate change: A term used to refer to all forms of cli-matic inconsistency, but especially to significant changefrom one prevailing climatic condition to another. Insome cases, “climate change” has been used synony-mously with the term “global warming”; scientists,however, tend to use the term in a wider sense inclusiveof natural changes in climate, including climatic cooling.
Clinker: Powdered cement, produced by heating aproperly proportioned mixture of finely ground rawmaterials (calcium carbonate, silica, alumina, and ironoxide) in a kiln to a temperature of about 2,700oF.
Cloud condensation nuclei: Aerosol particles that pro-vide a platform for the condensation of water vapor,resulting in clouds with higher droplet concentrationsand increased albedo.
Coal coke: See Coke (coal).
Coalbed methane: Methane is generated during coalformation and is contained in the coal microstructure.Typical recovery entails pumping water out of the coalto allow the gas to escape. Methane is the principal com-ponent of natural gas. Coalbed methane can be added tonatural gas pipelines without any special treatment.
Coke (coal): A solid carbonaceous residue derived fromlow-ash, low-sulfur bituminous coal from which the vol-atile constituents are driven off by baking in an oven attemperatures as high as 2,000 degrees Fahrenheit so thatthe fixed carbon and residual ash are fused together.Coke is used as a fuel and as a reducing agent in smelt-ing iron ore in a blast furnace. Coke from coal is grey,hard, and porous and has a heating value of 24.8 millionBtu per ton.
Coke (petroleum): A residue high in carbon content andlow in hydrogen that is the final product of thermaldecomposition in the condensation process in cracking.This product is reported as marketable coke or catalystcoke. The conversion is 5 barrels (of 42 U.S. gallons each)per short ton. Coke from petroleum has a heating valueof 6.024 million Btu per barrel.
Combustion: Chemical oxidation accompanied by thegeneration of light and heat.
Combustion chamber: An enclosed vessel in whichchemical oxidation of fuel occurs.
Conference of the Parties (COP): The collection ofnations that have ratified the Framework Convention onClimate Change (FCCC). The primary role of the COP isto keep implementation of the FCCC under review andmake the decisions necessary for its effective implemen-tation. See Framework Convention on Climate Change(FCCC).
Cracking: The refining process of breaking down thelarger, heavier, and more complex hydrocarbon mole-cules into simpler and lighter molecules.
Criteria pollutant: A pollutant determined to be hazard-ous to human health and regulated under EPA’sNational Ambient Air Quality Standards. The 1970amendments to the Clean Air Act require EPA todescribe the health and welfare impacts of a pollutant asthe “criteria” for inclusion in the regulatory regime.
Crop residue: Organic residue remaining after the har-vesting and processing of a crop.
Glossary
Energy Information Administration / Emissions of Greenhouse Gases in the United States 2007 47
Cultivar: A horticulturally or agriculturally derivedvariety of a plant.
Deforestation: The net removal of trees from forestedland.
Degasification system: The methods employed forremoving methane from a coal seam that could not oth-erwise be removed by standard ventilation fans andthus would pose a substantial hazard to coal miners.These systems may be used prior to mining or duringmining activities.
Degradable organic carbon: The portion of organic car-bon present in such solid waste as paper, food waste,and yard waste that is susceptible to biochemicaldecomposition.
Desulfurization: The removal of sulfur, as from moltenmetals, petroleum oil, or flue gases.
Diffusive transport: The process by which particles ofliquids or gases move from an area of higher concentra-tion to an area of lower concentration.
Distillate fuel: A general classification for one of thepetroleum fractions produced in conventional distilla-tion operations. It includes diesel fuels and fuel oils.Products known as No. 1, No. 2, and No. 4 diesel fuel areused in on-highway diesel engines, such as those intrucks and automobiles, as well as off-highway engines,such as those in railroad locomotives and agriculturalmachinery. Products known as No. 1, No. 2, and No. 4fuel oils are used primarily for space heating and electricpower generation.
Efflux: An outward flow.
Electrical generating capacity: The full-load continuouspower rating of electrical generating facilities, genera-tors, prime movers, or other electric equipment (individ-ually or collectively).
EMCON Methane Generation Model: A model for esti-mating the production of methane from municipal solidwaste landfills.
Emissions: Anthropogenic releases of gases to the atmo-sphere. In the context of global climate change, they con-sist of radiatively important greenhouse gases (e.g., therelease of carbon dioxide during fuel combustion).
Emissions coefficient: A unique value for scaling emis-sions to activity data in terms of a standard rate of emis-sions per unit of activity (e.g., pounds of carbon dioxideemitted per Btu of fossil fuel consumed).
Enteric fermentation: A digestive process by which car-bohydrates are broken down by microorganisms intosimple molecules for absorption into the bloodstream ofan animal.
Eructation: An act or instance of belching.
ETBE (ethyl tertiary butyl ether): (CH3)3COC2H: Anoxygenate blend stock formed by the catalyticetherification of isobutylene with ethanol.
Ethylene: An olefinic hydrocarbon recovered fromrefinery processes or petrochemical processes. Ethyleneis used as a petrochemical feedstock for numerouschemical applications and the production of consumergoods.
Ethylene dichloride: A colorless, oily liquid used as asolvent and fumigant for organic synthesis, and for oreflotation.
Facultative bacteria: Bacteria that grow equally wellunder aerobic and anaerobic conditions.
Flange: A rib or a rim for strength, for guiding, or forattachment to another object (e.g., on a pipe).
Flared: Gas disposed of by burning in flares usually atthe production sites or at gas processing plants.
Flatus: Gas generated in the intestines or the stomach ofan animal.
Flue gas desulfurization: Equipment used to removesulfur oxides from the combustion gases of a boiler plantbefore discharge to the atmosphere. Also referred to asscrubbers. Chemicals such as lime are used as scrubbingmedia.
Fluidized-bed combustion: A method of burning par-ticulate fuel, such as coal, in which the amount of airrequired for combustion far exceeds that found in con-ventional burners. The fuel particles are continually fedinto a bed of mineral ash in the proportions of 1 part fuelto 200 parts ash, while a flow of air passes up throughthe bed, causing it to act like a turbulent fluid.
Flux material: A substance used to promote fusion, e.g.,of metals or minerals.
Fodder: Coarse food for domestic livestock.
Forestomach: See Rumen.
Fossil fuel: An energy source formed in the earths crustfrom decayed organic material. The common fossil fuelsare petroleum, coal, and natural gas.
Framework Convention on Climate Change (FCCC):An agreement opened for signature at the “Earth Sum-mit” in Rio de Janeiro, Brazil, on June 4, 1992, which hasthe goal of stabilizing greenhouse gas concentrations inthe atmosphere at a level that would prevent significantanthropogenically forced climate change. See Climatechange.
Glossary
48 Energy Information Administration / Emissions of Greenhouse Gases in the United States 2007

Fuel cycle: The entire set of sequential processes orstages involved in the utilization of fuel, includingextraction, transformation, transportation, and combus-tion. Emissions generally occur at each stage of the fuelcycle.
Fugitive emissions: Unintended leaks of gas from theprocessing, transmission, and/or transportation of fos-sil fuels.
Gasification: A method for converting coal, petroleum,biomass, wastes, or other carbon-containing materialsinto a gas that can be burned to generate power or pro-cessed into chemicals and fuels.
Gate station: Location where the pressure of natural gasbeing transferred from the transmission system to thedistribution system is lowered for transport throughsmall diameter, low pressure pipelines.
Geothermal: Pertaining to heat within the Earth.
Global climate change: See Climate change.
Global warming: An increase in the near surface tem-perature of the Earth. Global warming has occurred inthe distant past as the result of natural influences, butthe term is today most often used to refer to the warmingthat some scientists predict will occur as a result ofincreased anthropogenic emissions of greenhouse gases.See Climate change.
Global warming potential (GWP): An index used tocompare the relative radiative forcing of different gaseswithout directly calculating the changes in atmosphericconcentrations. GWPs are calculated as the ratio of theradiative forcing that would result from the emission ofone kilogram of a greenhouse gas to that from the emis-sion of one kilogram of carbon dioxide over a fixedperiod of time, such as 100 years.
Greenhouse effect: The result of water vapor, carbondioxide, and other atmospheric gases trapping radiant(infrared) energy, thereby keeping the earth’s surfacewarmer than it would otherwise be. Greenhouse gaseswithin the lower levels of the atmosphere trap this radia-tion, which would otherwise escape into space, and sub-sequent re-radiation of some of this energy back to theEarth maintains higher surface temperatures thanwould occur if the gases were absent. See Greenhousegases.
Greenhouse gases: Those gases, such as water vapor,carbon dioxide, nitrous oxide, methane, hydrofluoro-carbons (HFCs), perfluorocarbons (PFCs) and sulfurhexafluoride, that are transparent to solar (short-wave)radiation but opaque to long-wave (infrared) radiation,thus preventing long-wave radiant energy from leavingthe Earth’s atmosphere. The net effect is a trapping ofabsorbed radiation and a tendency to warm the planet’ssurface.
Gross gas withdrawal: The full-volume of compoundsextracted at the wellhead, including nonhydrocarbongases and natural gas plant liquids.
Gypsum: Calcium sulfate dihydrate (CaSO4 · 2H2O), asludge constituent from the conventional lime scrubberprocess, obtained as a byproduct of the dewateringoperation and sold for commercial use.
Halogenated substances: A volatile compound contain-ing halogens, such as chlorine, fluorine or bromine.
Halons: See Bromofluorocarbons.
Heating degree-days (HDD): A measure of how cold alocation is over a period of time relative to a base tem-perature, most commonly specified as 65 degrees Fahr-enheit. The measure is computed for each day bysubtracting the average of the day's high and low tem-peratures from the base temperature (65 degrees), withnegative values set equal to zero. Each day's heatingdegree-days are summed to create a heating degree-daymeasure for a specified reference period. Heatingdegree-days are used in energy analysis as an indicatorof space heating energy requirements or use.
Herbivore: A plant-eating animal.
Hydrocarbon: An organic chemical compound ofhydrogen and carbon in either gaseous, liquid, orsolid phase. The molecular structure of hydrocarboncompounds varies from the simple (e.g., methane, a con-stituent of natural gas) to the very heavy and verycomplex.
Hydrochlorofluorocarbons (HCFCs): Chemicals com-posed of one or more carbon atoms and varying num-bers of hydrogen, chlorine, and fluorine atoms.
Hydrofluorocarbons (HFCs): A group of man-madechemicals composed of one or two carbon atoms andvarying numbers of hydrogen and fluorine atoms. MostHFCs have 100-year Global Warming Potentials in thethousands.
Hydroxyl radical (OH): An important chemical scaven-ger of many trace gases in the atmosphere that are green-house gases. Atmospheric concentrations of OH affectthe atmospheric lifetimes of greenhouse gases, theirabundance, and, ultimately, the effect they have onclimate.
Intergovernmental Panel on Climate Change (IPCC):A panel established jointly in 1988 by the World Meteo-rological Organization and the United Nations Environ-ment Program to assess the scientific informationrelating to climate change and to formulate realisticresponse strategies.
International bunker fuels: See Bunker fuels.
Glossary
Energy Information Administration / Emissions of Greenhouse Gases in the United States 2007 49
Jet fuel: A refined petroleum product used in jet aircraftengines. It includes kerosene-type jet fuel and naph-tha-type jet fuel.
Joint Implementation (JI): Agreements made betweentwo or more nations under the auspices of the Frame-work Convention on Climate Change (FCCC) whereby adeveloped country can receive “emissions reductionunits” when it helps to finance projects that reduce netemissions in another developed country (includingcountries with economies in transition).
Kerosene: A light petroleum distillate that is used inspace heaters, cook stoves, and water heaters and is suit-able for use as a light source when burned in wick-fedlamps. Kerosene has a maximum distillation tempera-ture of 400 degrees Fahrenheit at the 10-percent recoverypoint, a final boiling point of 572 degrees Fahrenheit,and a minimum flash point of 100 degrees Fahrenheit.Included are No. 1-K and No. 2-K, the two grades recog-nized by ASTM Specification D 3699 as well as all othergrades of kerosene called range or stove oil, which haveproperties similar to those of No. 1 fuel oil. See Kero-sene-type jet fuel.
Kerosene-type jet fuel: A kerosene-based product hav-ing a maximum distillation temperature of 400 degreesFahrenheit at the 10-percent recovery point and a finalmaximum boiling point of 572 degrees Fahrenheit andmeeting ASTM Specification D 1655 and Military Speci-fications MIL-T-5624P and MIL-T-83133D (Grades JP-5and JP-8). It is used for commercial and military turbojetand turboprop aircraft engines.
Kyoto Protocol: The result of negotiations at the thirdConference of the Parties (COP-3) in Kyoto, Japan, inDecember of 1997. The Kyoto Protocol sets bindinggreenhouse gas emissions targets for countries that signand ratify the agreement. The gases covered under theProtocol include carbon dioxide, methane, nitrousoxide, hydrofluorocarbons (HFCs), perfluorocarbons(PFCs) and sulfur hexafluoride.
Ketone-alcohol (cyclohexanol): An oily, colorless,hygroscopic liquid with a camphor-like odor. Used insoapmaking, dry cleaning, plasticizers, insecticides, andgermicides.
Leachate: The liquid that has percolated through the soilor other medium.
Lignite: The lowest rank of coal, often referred to asbrown coal, used almost exclusively as fuel forsteam-electric power generation. It is brownish-blackand has a high inherent moisture content, sometimes ashigh as 45 percent The heat content of lignite rangesfrom 9 to 17 million Btu per ton on a moist, min-eral-matter-free basis. The heat content of lignite con-sumed in the United States averages 13 million Btu per
ton, on the as-received basis (i.e., containing both inher-ent moisture and mineral matter).
Liquefied petroleum gases: A group of hydrocar-bon-based gases derived from crude oil refining or natu-ral gas fractionation. They include ethane, ethylene,propane, propylene, normal butane, butylene, isobu-tane, and isobutylene. For convenience of transporta-tion, these gases are liquefied through pressurization.
Lubricants: Substances used to reduce friction betweenbearing surfaces, or incorporated into other materialsused as processing aids in the manufacture of otherproducts, or used as carriers of other materials. Petro-leum lubricants may be produced either from distillatesor residues. Lubricants include all grades of lubricatingoils, from spindle oil to cylinder oil to those used ingreases.
Methane: A colorless, flammable, odorless hydrocarbongas (CH4) which is the major component of natural gas.It is also an important source of hydrogen in variousindustrial processes. Methane is a greenhouse gas. Seealso Greenhouse gases.
Methanogens: Bacteria that synthesize methane, requir-ing completely anaerobic conditions for growth.
Methanol: A light alcohol that can be used for gasolineblending. See oxygenate.
Methanotrophs: Bacteria that use methane as food andoxidize it into carbon dioxide.
Methyl chloroform (trichloroethane): An industrialchemical (CH3CCl3) used as a solvent, aerosol propel-lant, and pesticide and for metal degreasing.
Methyl tertiary butyl ether (MTBE): A colorless, flam-mable, liquid oxygenated hydrocarbon containing 18.15percent oxygen.
Methylene chloride: A colorless liquid, nonexplosiveand practically nonflammable. Used as a refrigerant incentrifugal compressors, a solvent for organic materials,and a component in nonflammable paint removers.
Mole: The quantity of a compound or element that has aweight in grams numerically equal to its molecularweight. Also referred to as gram molecule or grammolecular weight.
Montreal Protocol: The Montreal Protocol on Sub-stances that Deplete the Ozone Layer (1987). An interna-tional agreement, signed by most of the industrializednations, to substantially reduce the use of chlorofluoro-carbons (CFCs). Signed in January 1989, the originaldocument called for a 50-percent reduction in CFC useby 1992 relative to 1986 levels. The subsequent LondonAgreement called for a complete elimination of CFC useby 2000. The Copenhagen Agreement, which called for a
Glossary
50 Energy Information Administration / Emissions of Greenhouse Gases in the United States 2007

complete phaseout by January 1, 1996, was imple-mented by the U.S. Environmental Protection Agency.
Motor gasoline (finished): A complex mixture of rela-tively volatile hydrocarbons with or without smallquantities of additives, blended to form a fuel suitablefor use in spark-ignition engines. Motor gasoline, asdefined in ASTM Specification D 4814 or Federal Specifi-cation VV-G-1690C, is characterized as having a boilingrange of 122 to 158 degrees Fahrenheit at the 10 percentrecovery point to 365 to 374 degrees Fahrenheit at the 90percent recovery point. “Motor Gasoline” includes con-ventional gasoline; all types of oxygenated gasoline,including gasohol; and reformulated gasoline, butexcludes aviation gasoline. Note: Volumetric data onblending components, such as oxygenates, are notcounted in data on finished motor gasoline until theblending components are blended into the gasoline.
Multiple cropping: A system of growing several cropson the same field in one year.
Municipal solid waste: Residential solid waste andsome nonhazardous commercial, institutional, andindustrial wastes.
Naphtha less than 401 degrees Fahrenheit: A naphthawith a boiling range of less than 401 degrees Fahrenheitthat is intended for use as a petrochemical feedstock.Also see Petrochemical feedstocks.
Naphtha-type jet fuel: A fuel in the heavy naphtha boil-ing range having an average gravity of 52.8 degrees API,20 to 90 percent distillation temperatures of 290 degreesto 470 degrees Fahrenheit, and meeting Military Specifi-cation MIL-T-5624L (Grade JP-4). It is used primarily formilitary turbojet and turboprop aircraft engines becauseit has a lower freeze point than other aviation fuels andmeets engine requirements at high altitudes and speeds.
Natural gas: A mixture of hydrocarbons and smallquantities of various nonhydrocarbons in the gaseousphase or in solution with crude oil in natural under-ground reservoirs.
Natural gas liquids (NGLs): Those hydrocarbons in nat-ural gas that are separated as liquids from the gas.Includes natural gas plant liquids and lease condensate.
Natural gas, pipeline quality: A mixture of hydrocar-bon compounds existing in the gaseous phase with suffi-cient energy content, generally above 900 Btu, and asmall enough share of impurities for transport throughcommercial gas pipelines and sale to end-users.
Nitrogen oxides (NOx): Compounds of nitrogen andoxygen produced by the burning of fossil fuels.
Nitrous oxide (N2O): A colorless gas, naturally occur-ring in the atmosphere.
Nonmethane volatile organic compounds (NMVOCs):Organic compounds, other than methane, that partici-pate in atmospheric photochemical reactions.
Octane: A flammable liquid hydrocarbon found inpetroleum. Used as a standard to measure the anti-knock properties of motor fuel.
Oil reservoir: An underground pool of liquid consistingof hydrocarbons, sulfur, oxygen, and nitrogen trappedwithin a geological formation and protected from evap-oration by the overlying mineral strata.
Organic content: The share of a substance that is of ani-mal or plant origin.
Organic waste: Waste material of animal or plant origin.
Oxidize: To chemically transform a substance by com-bining it with oxygen.
Oxygenates: Substances which, when added to gaso-line, increase the amount of oxygen in that gasolineblend. Ethanol, Methyl Tertiary Butyl Ether (MTBE),Ethyl Tertiary Butyl Ether (ETBE), and methanol arecommon oxygenates.
Ozone: A molecule made up of three atoms of oxygen.Occurs naturally in the stratosphere and provides a pro-tective layer shielding the Earth from harmful ultravio-let radiation. In the troposphere, it is a chemical oxidant,a greenhouse gas, and a major component of photo-chemical smog.
Ozone precursors: Chemical compounds, such as car-bon monoxide, methane, nonmethane hydrocarbons,and nitrogen oxides, which in the presence of solar radi-ation react with other chemical compounds to formozone.
Paraffinic hydrocarbons: Straight-chain hydrocarboncompounds with the general formula CnH2n+2.
Perfluorocarbons (PFCs): A group of man-made chemi-cals composed of one or two carbon atoms and four tosix fluorine atoms, containing no chlorine. PFCs have nocommercial uses and are emitted as a byproduct of alu-minum smelting and semiconductor manufacturing.PFCs have very high 100-year Global Warming Poten-tials and are very long-lived in the atmosphere.
Perfluoromethane: A compound (CF4) emitted as abyproduct of aluminum smelting.
Petrochemical feedstocks: Chemical feedstocks derivedfrom petroleum principally for the manufacture ofchemicals, synthetic rubber, and a variety of plastics.
Glossary
Energy Information Administration / Emissions of Greenhouse Gases in the United States 2007 51

Petroleum: A broadly defined class of liquid hydrocar-bon mixtures. Included are crude oil, lease condensate,unfinished oils, refined products obtained from the pro-cessing of crude oil, and natural gas plant liquids. Note:Volumes of finished petroleum products includenonhydrocarbon compounds, such as additives anddetergents, after they have been blended into theproducts.
Petroleum coke: See Coke (petroleum).
Photosynthesis: The manufacture by plants of carbohy-drates and oxygen from carbon dioxide and water in thepresence of chlorophyll, with sunlight as the energysource. Carbon is sequestered and oxygen and watervapor are released in the process.
Pig iron: Crude, high-carbon iron produced by reduc-tion of iron ore in a blast furnace.
Pipeline, distribution: A pipeline that conveys gas froma transmission pipeline to its ultimate consumer.
Pipeline, gathering: A pipeline that conveys gas from aproduction well/field to a gas processing plant or trans-mission pipeline for eventual delivery to end-useconsumers.
Pipeline, transmission: A pipeline that conveys gasfrom a region where it is produced to a region where it isto be distributed.
Planetary albedo: The fraction of incident solar radia-tion that is reflected by the Earth-atmosphere systemand returned to space, mostly by backscatter fromclouds in the atmosphere.
Pneumatic device: A device moved or worked by airpressure.
Polystyrene: A polymer of styrene that is a rigid, trans-parent thermoplastic with good physical and electricalinsulating properties, used in molded products, foams,and sheet materials.
Polyvinyl chloride (PVC): A polymer of vinyl chloride.Tasteless. odorless, insoluble in most organic solvents. Amember of the family vinyl resin, used in soft flexiblefilms for food packaging and in molded rigid products,such as pipes, fibers, upholstery, and bristles.
Post-mining emissions: Emissions of methane fromcoal occurring after the coal has been mined, duringtransport or pulverization.
Radiative forcing: A change in average net radiation atthe top of the troposphere (known as the tropopause)because of a change in either incoming solar or exitinginfrared radiation. A positive radiative forcing tends onaverage to warm the earth’s surface; a negative radiative
forcing on average tends to cool the earth’s surface.Greenhouse gases, when emitted into the atmosphere,trap infrared energy radiated from the earth’s surfaceand therefore tend to produce positive radiative forcing.See Greenhouse gases.
Radiatively active gases: Gases that absorb incomingsolar radiation or outgoing infrared radiation, affectingthe vertical temperature profile of the atmosphere. SeeRadiative forcing.
Ratoon crop: A crop cultivated from the shoots of aperennial plant.
Redox potential: A measurement of the state of oxida-tion of a system.
Reflectivity: The ratio of the energy carried by a waveafter reflection from a surface to its energy beforereflection.
Reforestation: Replanting of forests on lands that haverecently been harvested or otherwise cleared of trees.
Reformulated gasoline: Finished motor gasoline for-mulated for use in motor vehicles, the composition andproperties of which meet the requirements of the refor-mulated gasoline regulations promulgated by the U.S.Environmental Protection Agency under Section 211(k)of the Clean Air Act. Note: This category includes oxy-genated fuels program reformulated gasoline (OPRG)but excludes reformulated gasoline blendstock for oxy-genate blending (RBOB).
Renewable energy resources: Energy resources that arenaturally replenishing but flow-limited. They are virtu-ally inexhaustible in duration but limited in the amountof energy that is available per unit of time. Renewableenergy resources include: biomass, hydro, geothermal,solar, wind, ocean thermal, wave action, and tidalaction.
Residual fuel oil: A general classification for the heavieroils, known as No. 5 and No. 6 fuel oils, that remain afterthe distillate fuel oils and lighter hydrocarbons are dis-tilled away in refinery operations. It conforms to ASTMSpecifications D 396 and D 975 and Federal SpecificationVV-F-815C. No. 5, a residual fuel oil of medium viscos-ity, is also known as Navy Special and is defined in Mili-tary Specification MIL-F-859E, including Amendment 2(NATO Symbol F-770). It is used in steam-powered ves-sels in government service and inshore powerplants.No. 6 fuel oil includes Bunker C fuel oil and is used forthe production of electric power, space heating, vesselbunkering, and various industrial purposes.
Rumen: The large first compartment of the stomach ofcertain animals in which cellulose is broken down by theaction of bacteria.
Glossary
52 Energy Information Administration / Emissions of Greenhouse Gases in the United States 2007

Sample: A set of measurements or outcomes selectedfrom a given population.
Sequestration: See Carbon sequestration.
Septic tank: A tank in which the solid matter of continu-ously flowing sewage is disintegrated by bacteria.
Sinter: A chemical sedimentary rock deposited by pre-cipitation from mineral waters, especially siliceoussinter and calcareous sinter.
Sodium silicate: A grey-white powder soluble in alkaliand water, insoluble in alcohol and acid. Used to fire-proof textiles, in petroleum refining and corrugatedpaperboard manufacture, and as an egg preservative.Also referred to as liquid gas, silicate of soda, sodiummetasilicate, soluble glass, and water glass.
Sodium tripolyphosphate: A white powder used forwater softening and as a food additive and texturizer.
Stabilization lagoon: A shallow artificial pond used forthe treatment of wastewater. Treatment includesremoval of solid material through sedimentation, thedecomposition of organic material by bacteria, and theremoval of nutrients by algae.
Still gas (refinery gas): Any form or mixture ofgases produced in refineries by distillation, cracking,reforming, and other processes. The principal constitu-ents are methane, ethane, ethylene, normal butane,butylene, propane, propylene, etc. Still gas is used as arefinery fuel and a petrochemical feedstock. The conver-sion factor is 6 million Btu per fuel oil equivalent barrel.
Stratosphere: The region of the upper atmosphereextending from the tropopause (8 to 15 kilometers alti-tude) to about 50 kilometers. Its thermal structure,which is determined by its radiation balance, is gener-ally very stable with low humidity.
Stripper well: An oil or gas well that produces at rela-tively low rates. For oil, stripper production is usuallydefined as production rates of between 5 and 15 barrelsof oil per day. Stripper gas production would generallybe anything less than 60 thousand cubic feet per day.
Styrene: A colorless, toxic liquid with a strong aromaticaroma. Insoluble in water, soluble in alcohol and ether;polymerizes rapidly; can become explosive. Used tomake polymers and copolymers, polystyrene plastics,and rubber.
Subbituminous coal: A coal whose properties rangefrom those of lignite to those of bituminous coal andused primarily as fuel for steam-electric power genera-tion. It may be dull, dark brown to black, soft andcrumbly, at the lower end of the range, to bright, jetblack, hard, and relatively strong, at the upper end.
Subbituminous coal contains 20 to 30 percent inherentmoisture by weight. The heat content of subbituminouscoal ranges from 17 to 24 million Btu per ton on a moist,mineral-matter-free basis. The heat content of subbitu-minous coal consumed in the United States averages 17to 18 million Btu per ton, on the as-received basis (i.e.,containing both inherent moisture and mineral matter).
Sulfur dioxide (SO2): A toxic, irritating, colorless gassoluble in water, alcohol, and ether. Used as a chemicalintermediate, in paper pulping and ore refining, and as asolvent.
Sulfur hexafluoride (SF6): A colorless gas soluble inalcohol and ether, and slightly less soluble in water. It isused as a dielectric in electronics.
Sulfur oxides (SOx): Compounds containing sulfur andoxygen, such as sulfur dioxide (SO2) and sulfur trioxide(SO3).
Tertiary amyl methyl ether ((CH3)2(C2H5)COCH3): Anoxygenate blend stock formed by the catalyticetherification of isoamylene with methanol.
Troposphere: The inner layer of the atmosphere belowabout 15 kilometers, within which there is normally asteady decrease of temperature with increasing altitude.Nearly all clouds form and weather conditions manifestthemselves within this region. Its thermal structure iscaused primarily by the heating of the earth’s surface bysolar radiation, followed by heat transfer through turbu-lent mixing and convection.
Uncertainty: A measure used to quantify the plausiblemaximum and minimum values for emissions from anysource, given the biases inherent in the methods used tocalculate a point estimate and known sources of error.
Vapor displacement: The release of vapors that had pre-viously occupied space above liquid fuels stored intanks. These releases occur when tanks are emptied andfilled.
Ventilation system: A method for reducing methaneconcentrations in coal mines to non-explosive levels byblowing air across the mine face and using large exhaustfans to remove methane while mining operationsproceed.
Vessel bunkering: Includes sales for the fueling of com-mercial or private boats, such as pleasure craft, fishingboats, tugboats, and ocean-going vessels, including ves-sels operated by oil companies. Excluded are volumessold to the U.S. Armed Forces.
Volatile organic compounds (VOCs): Organic com-pounds that participate in atmospheric photochemicalreactions.
Glossary
Energy Information Administration / Emissions of Greenhouse Gases in the United States 2007 53

Volatile solids: A solid material that is readily decom-posable at relatively low temperatures.
Waste flow: Quantity of a waste stream generated by anactivity.
Wastewater: Water that has been used and contains dis-solved or suspended waste materials.
Wastewater, domestic and commercial: Wastewater(sewage) produced by domestic and commercialestablishments.
Wastewater, industrial: Wastewater produced byindustrial processes.
Water vapor: Water in a vaporous form, especially whenbelow boiling temperature and diffused (e.g., in theatmosphere).
Wax: A solid or semi-solid material derived from petro-leum distillates or residues by such treatments aschilling, precipitating with a solvent, or de-oiling. Itis a light-colored, more-or-less translucent crystallinemass, slightly greasy to the touch, consisting of amixture of solid hydrocarbons in which the paraffinseries predominates. Includes all marketable wax,whether crude scale or fully refined. The three gradesincluded are microcrystalline, crystalline-fully refined,
and crystalline-other. The conversion factor is 280pounds per 42 U.S. gallons per barrel.
Weanling system: A cattle management system thatplaces calves on feed starting at 165 days of age and con-tinues until the animals have reached slaughter weight.
Wellhead: The point at which the crude (and/or naturalgas) exits the ground. Following historical precedent,the volume and price for crude oil production arelabeled as “wellhead,” even though the cost and volumeare now generally measured at the lease boundary. Inthe context of domestic crude price data, the term “well-head” is the generic term used to reference the produc-tion site or lease property.
Wetlands: Areas regularly saturated by surface orgroundwater and subsequently characterized by a prev-alence of vegetation adapted for life in saturated-soilconditions.
Wood energy: Wood and wood products used as fuel,including roundwood (cordwood), limbwood, woodchips, bark, sawdust, forest residues, charcoal, pulpwaste, and spent pulping liquor..
Yearling system: A cattle management system thatincludes a stocker period from 165 days of age to 425days of age followed by a 140-day feedlot period.
Glossary
54 Energy Information Administration / Emissions of Greenhouse Gases in the United States 2007