EFP05 J.nr. 033001/33031-0053 Project Report August … · ing natural gas transmission lines with...
97
RAPPORT Dansk Gasteknisk Center a/s • Dr. Neergaards Vej 5B • 2970 Hørsholm • Tlf. 2016 9600 • Fax 4516 1199 • www.dgc.dk • [email protected] Field test of hydrogen in the natural gas grid EFP05 J.nr. 033001/33031-0053 Project Report August 2010
Transcript of EFP05 J.nr. 033001/33031-0053 Project Report August … · ing natural gas transmission lines with...
RA
PP
OR
T
Dansk Gasteknisk Center a/s • Dr. Neergaards Vej 5B • 2970 Hørsholm • Tlf. 2016 9600 • Fax 4516 1199 • www.dgc.dk • [email protected]
Field test of hydrogen in the natural gas grid
EFP05 J.nr. 033001/33031-0053
Project Report
August 2010

Field test of hydrogen in the natural gas grid
EFP05 J.nr. 033001/33031-0053
Henrik Iskov
Danish Gas Technology Centre Hørsholm 2010

Title : Field test of hydrogen in the natural gas grid, EFP05 J.nr. 033001/33031-0053
Report Category : Project Report
Author : Henrik Iskov
Date of issue : 13 August 2010
Copyright : Danish Gas Technology Centre
File Number : 727-73; h:\727\73 naturgasnet m h2 fase ii\slutrapportering\finalreportefp05.doc
Project Name : Naturgasnettets anvendelighed til ren brintdistribution, fase II
ISBN : 978-87-7795-334-7
DGC-report 1
Table of Contents Page
1 Summary............................................................................................................................... 3
1.1 Summary in English ........................................................................................................ 3
1.1.1 Distribution grid - polymer pipes ............................................................................ 3
1.1.2 Transmission grid - steel pipes................................................................................ 3
1.2 Summary in Danish......................................................................................................... 4
1.2.1 Distributionsnet - plastrør........................................................................................ 4
1.2.2 Transmissionsnet - stålrør ....................................................................................... 5
2 Introduction and objectives................................................................................................... 6
3 Polymer pipe test and analysis.............................................................................................. 7
3.1 Test set-up ....................................................................................................................... 7
3.2 Samples used in the analysis ........................................................................................... 8
3.3 The analytical program.................................................................................................... 8
3.4 Results ............................................................................................................................. 9
3.4.1 General findings ...................................................................................................... 9
3.4.2 Determination of changes in slow crack growth..................................................... 9
3.4.3 PE 80 pipes.............................................................................................................. 9
3.4.4 PE 100 pipes.......................................................................................................... 10
3.4.5 Determination of structural changes ..................................................................... 11
3.4.6 Determination of oxidative power - consumption of antioxidants........................ 12
3.4.7 Determination of changes in tensile properties ..................................................... 13
3.5 Polymer testing conclusion ........................................................................................... 14
4 X70 steel natural gas transmission pipeline test and analysis ............................................ 16
4.1 Introduction and objectives ........................................................................................... 16
4.1.1 The object of the steel pipe test ............................................................................. 16
4.2 Analysis......................................................................................................................... 18
4.3 Conclusion of steel tests................................................................................................ 19
5 References........................................................................................................................... 20
Appendices
Appendix 1: Borealis Innovation Project Report
Appendix 2: FORCE final report
DGC-report 2
Abbreviations used
SCG = Slow crack growth
OIT = Oxygen Induction Time
ESCR = Environmental Stress Cracking
CTL = Constant Tensile Load, name of test method.
PE 80 = Polyethylene pipe material fulfilling classification of MRS 8,0 MPa
PE 100 = Polyethylene pipe material fulfilling classification of MRS 10,0 MPa
MRS = Minimum required strength at 50 years
DGC = Danish Gas Technology Centre
FTIR = Fourier Transform Infra Red analysis
MFR = Melt Flow Rate
FRR = Flow Rate Ratio
ISO = International Organisation for Standardisation
MPI = Magnetic Particle Inspection
CH4 = Danish natural gas
DGC-report 3
1 Summary
1.1 Summary in English
In order to prepare for a future use of hydrogen as a fuel gas it became evi-
dent that very little information existed regarding the compatibility between
long-term exposure and transportation of hydrogen in natural gas pipelines.
A program was therefore set to study the transportation in a small-scale pilot
grid at the research centre in Hørsholm, Denmark.
The test program included steel pipes from the Danish gas transmission grid
and polymer pipes from the Danish and Swedish gas distribution grid.
1.1.1 Distribution grid - polymer pipes
The test of polymer pipes was devised so that samples of all test pipes were
cut out of the grid each year and analysis performed on these pipe samples;
in this way any form of influence on the integrity of the polyethylene pipe
would be detected.
The analytical program for polymer was devised in order to detect any in-
fluence on the additivation of the polyethylene as this has an influence on
oxidative resistance, as well as checking already encountered possible deg-
radation caused by extrusion of the material. Further tools as rheology and
melt flow rate were used for detecting any structural changes on the mate-
rial. On the mechanical property side the tensile strength and modulus were
followed as well as the most important property for the pipe line, namely
slow crack growth.
The results of the polymer pipe tests show no degradations of any kind re-
lated to the continuous hydrogen exposure for more than 4 years. This is a
strong indication of the compatibility to hydrogen of the tested polymer ma-
terials PE 80 and PE 100.
1.1.2 Transmission grid - steel pipes
The object of the steel pipe test was to see the effect on fatigue life of exist-
ing natural gas transmission lines with hydrogen replacing the natural gas.
DGC-report 4
Full-scale dynamic tests were performed using randomly selected cut-out
API 5L X70 pipe sections with a diameter of 20 inches and a wall thickness
of 7 millimetres from the Danish natural gas transmission system. The pipe
sections contained field girth weld made during the installation of the pipe
line in the early 1980’s.
These pipe sections were exposed to pressure variations equal to twice the
maximum daily swing in the Danish gas transmission grid. The number of
pressure variations equals 80 years of operation. The results of analysing the
weldings afterwards show no growths in defects. If the pipe sections avail-
able for the test are representative for the Danish gas transmission grid, the
test result indicates that hydrogen can be compatible with the pressure swing
in the gas transmission grid.
1.2 Summary in Danish
Litteraturundersøgelser /1/ viste, at der kun fandtes ganske lidt information
om det eksisterende naturgasnets anvendelighed til transport af brint. Derfor
igangsatte man et projekt, der skulle undersøge brinttransport i naturgasnet-
tet i et forsøgsanlæg hos Dansk Gasteknisk Center i Hørsholm. Projektet
omfattede stålrør fra det danske gastransmissionsnet og plastrør fra det dan-
ske og svenske gasdistributionsnet.
1.2.1 Distributionsnet - plastrør
Testen af plastrørene blev udformet således, at der en gang årligt blev ud-
skåret en rørstump af samtlige testrør. Herefter gennemførtes en omfattende
analyse for at afdække, hvorvidt plastrørene blev degraderet af brinten.
Analyseprogrammet, der blev opstillet til testen af plastrørene, var udformet
med henblik på at detektere en eventuel indflydelse fra brint på additivstof-
ferne i plasten, da dette igen vil påvirke modstandsdygtigheden over for
oxidering (hvilket i afgørende grad påvirker fx svejsbarheden af rørene).
Analyseprogrammet skulle også kunne påvise eventuel allerede opstået de-
gradering af rørene ved ekstruderingen af materialet. Der blev også anvendt
reologiske undersøgelser samt kontrol af smelteindeks for at afsløre eventu-
elle strukturelle ændringer i materialet. Mht. materialeegenskaber måltes
brudstyrken og elasticiteten, ligesom den vel nok vigtigste materialeegen-
skab, nemlig revnevæksten, blev undersøgt.
DGC-report 5
Resultaterne fra testene af plastrørene viste ikke nogen som helst degrade-
ring i forbindelse med den vedvarende brinteksponering, der havde stået på i
mere end fire år. Dette er en stærk indikation af, at de testede plastmateria-
ler, PE 80 og PE 100, er egnede til brug af brint.
1.2.2 Transmissionsnet - stålrør
Litteraturundersøgelser har vist, at der med stor sandsynlighed ikke vil være
materialeproblemer ved statisk belastning med brint for de rørtyper, der an-
vendes i det danske gastransmissionsnet, X42, X52 og X70. Derimod anses
dynamisk belastning, dvs. trykvariationer, for problematisk.
En undersøgelse i samarbejde med Energinet.dk har vist, at der i det danske
gastransmissionsnet forekommer daglige trykvariationer på op til 20 bar,
således at trykket varierer mellem ca. 50 og 70 bar.
Målet for ståltesten var derfor via dynamiske test at afdække, hvorvidt brint
kunne initiere udmattelsesrevner.
Der blev udført dynamiske fuldskalaforsøg af tilfældigt udvalgte rørstykker,
API 5L X70, med en diameter på 20 tommer og en godstykkelse på 7 mm,
der var blevet skåret ud af det danske naturgastransmissionsnet. Rørstykker-
ne havde rundsømme, der var blevet svejst ved nedlægningen af rørlednin-
gerne i de tidlige firsere.
Disse rørstykker blev udsat for trykvariationer svarende til to gange det
maksimale daglige udsving i det danske gastransmissionsnet. Antallet af
trykvariationer svarer til 80 års drift. De efterfølgende analyseresultater af
svejsningerne viste ingen tegn på revnevækst. Såfremt de anvendte rørstyk-
ker er repræsentative for det danske gastransmissionsnet, så indikerer af-
prøvningsresultaterne, at de i gastransmissionsnettet anvendte stålkvaliteter
er kompatible med brint ved de trykvariationer, der forekommer.
DGC-report 6
2 Introduction and objectives
Very little information exists regarding the compatibility between long-term
exposure and transportation of hydrogen in steel gas transmission pipelines
and polyethylene gas distribution pipelines. A program was, therefore, set to
study the transportation in a small-scale pilot grid at the field-test facilities
of Danish Gas Technology Centre situated at the Scion-DTU research centre
in Hørsholm, Denmark.
The test program included formerly used steel pipes from the Danish gas
transmission grid and polymer pipes from the Danish and Swedish gas dis-
tribution grid.
The project partners were Danish Gas Technology Centre, Borealis AB and
FORCE Technology.
Danish Gas Technology Centre was project manager and responsible for
operation of the field test.
Borealis - one of the biggest suppliers of raw material from polyethylene for
the production of pipes for e.g. pressure pipes for gas distribution - provided
analytical services for the determination of compatibility problems between
polyethylene pipes and hydrogen under long-term exposure.
FORCE Technology focused on dynamic testing and analysis of the steel
pipes from the gas transmission grid.
DGC-report 7
3 Polymer pipe test and analysis
A dominant part of the natural gas distribution grid consists today of poly-
ethylene pipes due to polyethylene’s excellent track record as a reliable pip-
ing material with minimal maintenance. The reason for this is the inherent
properties like its corrosion free nature, the possibility to create fully weld-
able systems, its high ductility and excellent low-temperature properties.
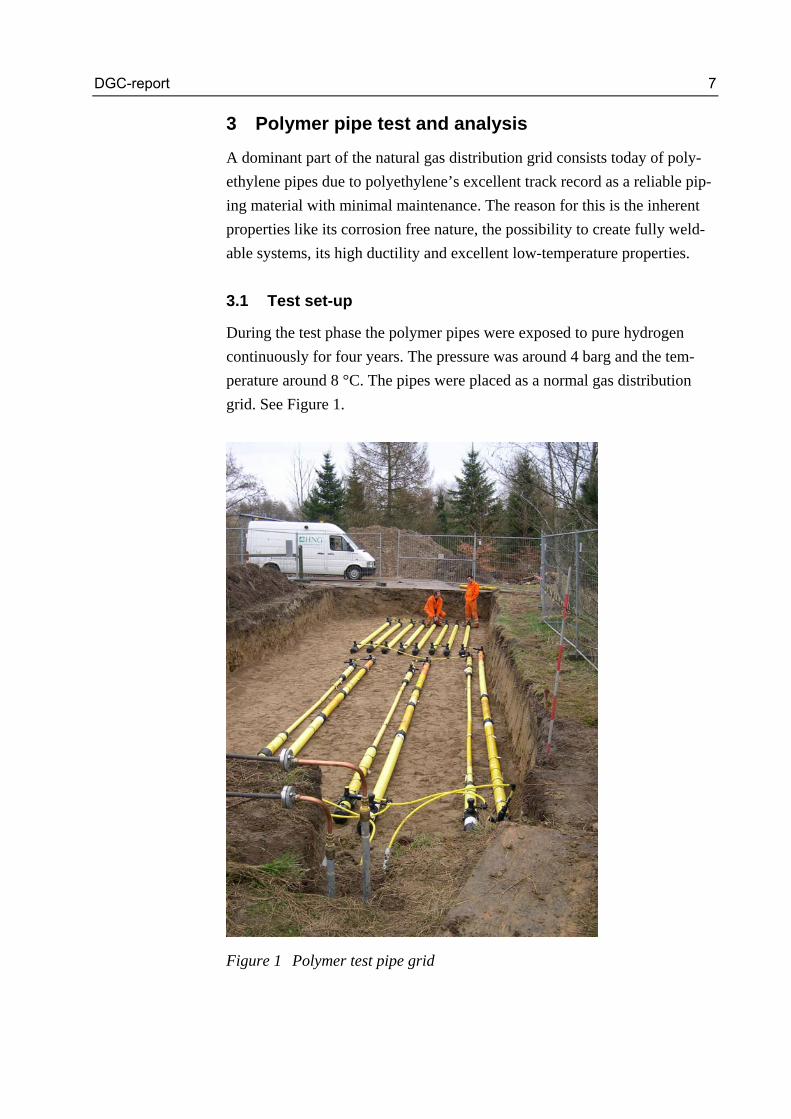
3.1 Test set-up
During the test phase the polymer pipes were exposed to pure hydrogen
continuously for four years. The pressure was around 4 barg and the tem-
perature around 8 °C. The pipes were placed as a normal gas distribution
grid. See Figure 1.
Figure 1 Polymer test pipe grid
DGC-report 8
The program was devised so that a part of the test grid was to be dug up
each year and analyses were performed on the pipes. In this way any form
of influence on the integrity of the polyethylene pipe would be detected. The
pipes were analysed before exposure to hydrogen, then the pipes were dug
up after 1 year, 2 years, 3 years and 4 years of exposure.
3.2 Samples used in the analysis
The samples consisted of three distinctly different materials:
1. A yellow solid-wall s.c. PE 80 medium-density polyethylene (PE 80
MDPE).
2. An orange solid-wall s.c. PE 100 high-density polyethylene (PE 100
HDPE), called PE 100 type I.
3. A natural coloured pipe with an orange outer protective layer. The natu-
ral coloured material is an s.c. PE 100 high-density polyethylene (PE
100 HDPE), called PE 100 type II.
For each material, samples of various production years were included.
Some of the pipes were also previously used in the Danish natural gas grid.
The oldest pipes were subjected to natural gas for 20 years before exposure
to H2 in the pilot grid.
General note: CH4 in text and figures should be read as Danish natural gas!
3.3 The analytical program
The annual analyzing program consisted of:
1. Structural changes in the polymer.
2. Consumption of antioxidants.
3. Change of tensile properties.
4. Change of slow crack growth properties of the material.
5. Surface oxidation.
The reason for this choice is that if no influence is detected in these proper-
ties then one can assume that polymer pipes are compatible with hydrogen
and can safely be used, seen from a polymer structure property and pipe
property point of view.
DGC-report 9
3.4 Results
3.4.1 General findings
During the investigations we found that there are basic quality level differ-
ences between pipes of different manufacturing years. Sometimes, this leads
to an impression that there might be a certain relationship between exposure
time to H2 or previous usage of the pipe as a natural gas pipe. However, as
can be seen below, there are basic quality level differences between pipes of
different manufacturing years (see Figure 2).
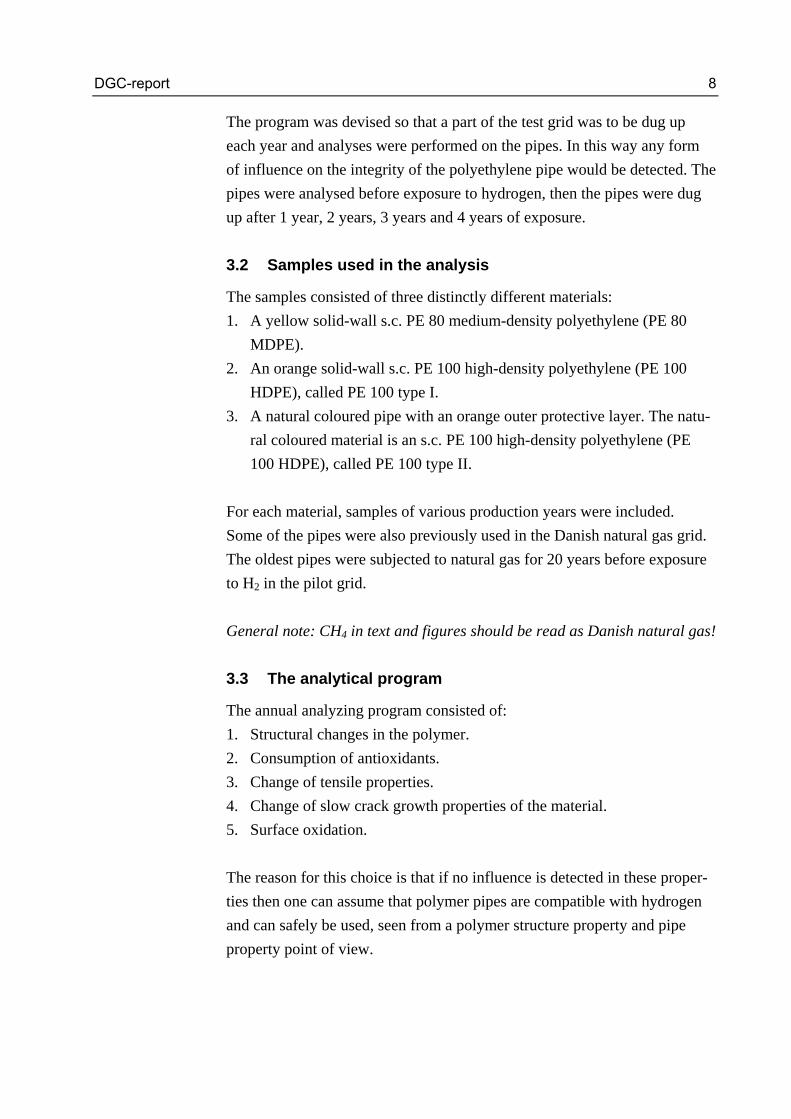
3.4.2 Determination of changes in slow crack growth
Figure 2 CTL test resistance to slow crack growth of PE 80 pipes of differ-ent manufacturing years
3.4.3 PE 80 pipes
In the ESCR testing there were no indications of changes of CTL test resis-
tance to slow crack growth with the time in the pilot hydrogen grid (see
Figure 2). All variations are explained by the pipe manufacturing date and
measurement variations, except for the probable outlier manufactured in
1987. The results are not depending on previous exposure to natural gas.
DGC-report 10
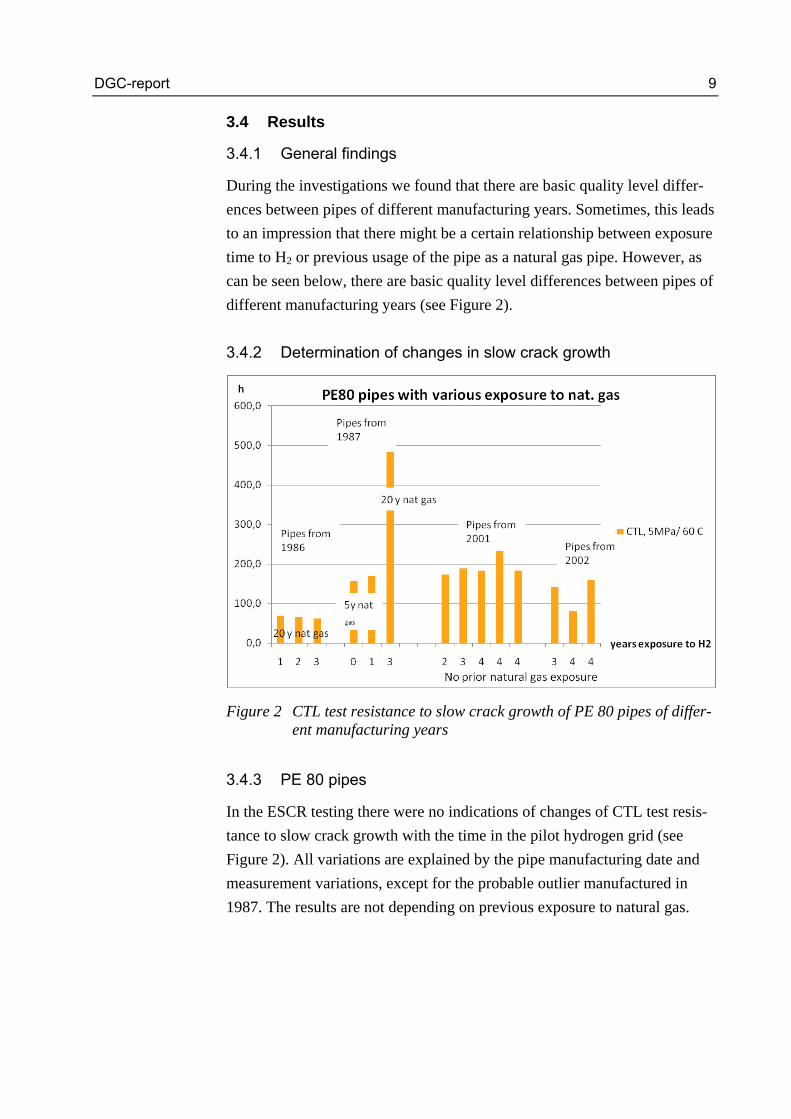
3.4.4 PE 100 pipes
The PE 100 type I and II follow the pattern of the previous analysis, i.e. no
negative influence can be detected in CTL with time in the pilot hydrogen
grid (see Figure 3). All samples show a very high resistance to slow crack
growth. All samples are on a high level of resistance.
Figure 3 ESCR-CTL at 5 MPa/60 °C versus years of exposure to hydrogen of pipes not previously used
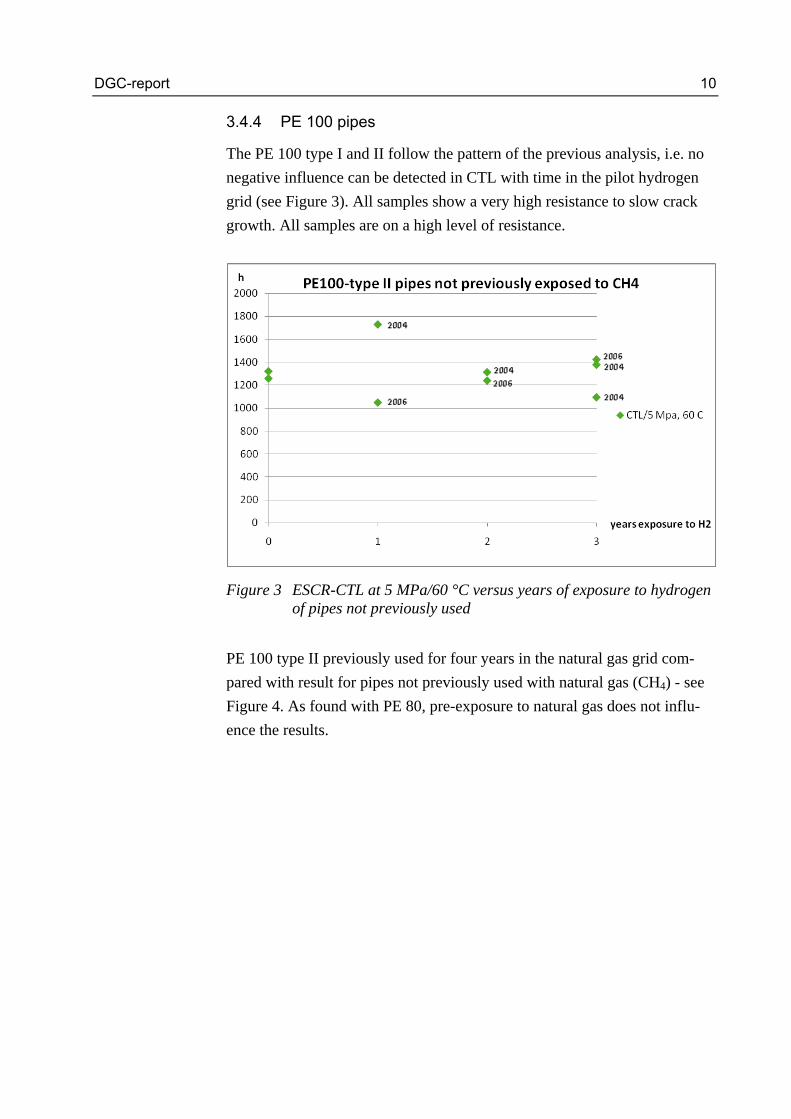
PE 100 type II previously used for four years in the natural gas grid com-
pared with result for pipes not previously used with natural gas (CH4) - see
Figure 4. As found with PE 80, pre-exposure to natural gas does not influ-
ence the results.
DGC-report 11
Figure 4 ESCR-CTL at 5 MPa/60 °C versus years of exposure to hydrogen of pipes not previously used and a pipe used for four years in the natural gas grid
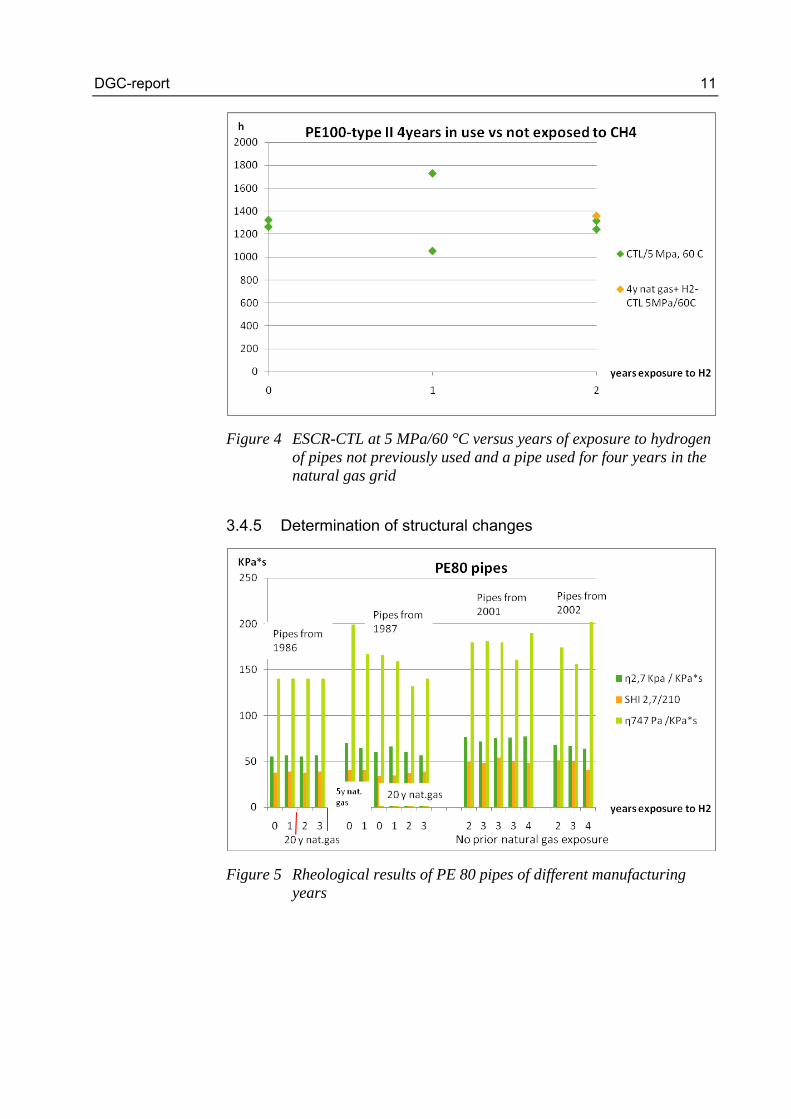
3.4.5 Determination of structural changes
Figure 5 Rheological results of PE 80 pipes of different manufacturing years
DGC-report 12
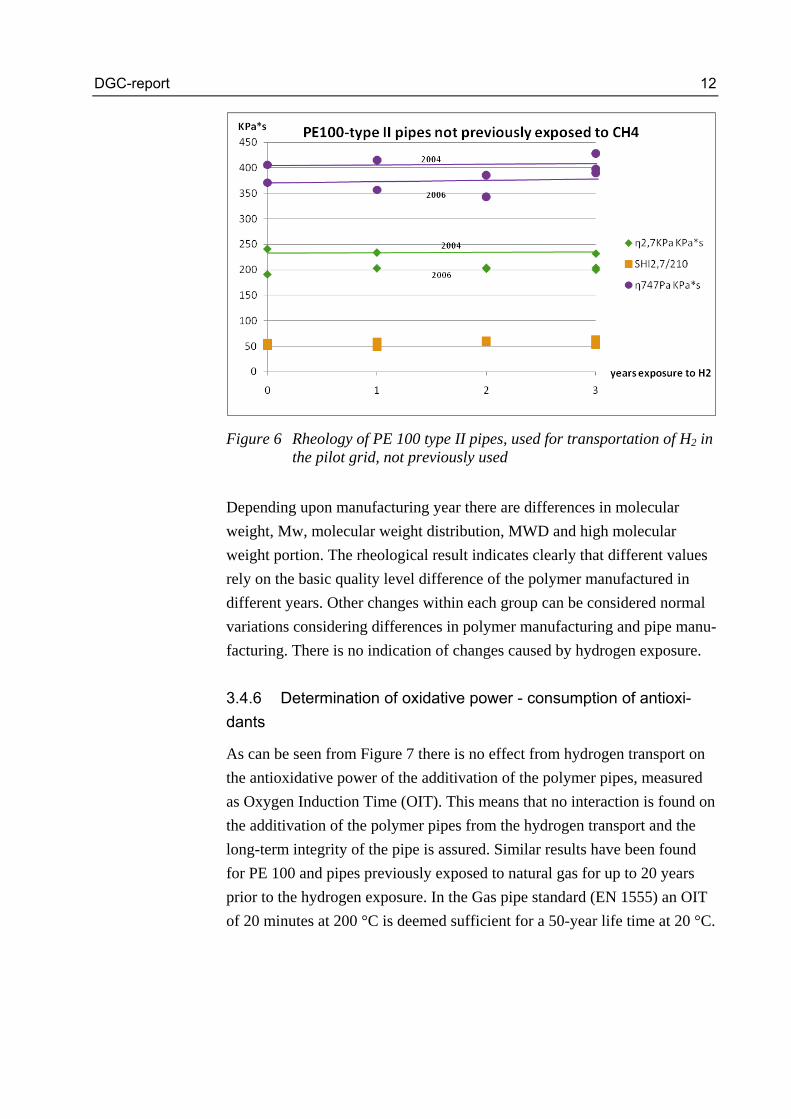
Figure 6 Rheology of PE 100 type II pipes, used for transportation of H2 in the pilot grid, not previously used
Depending upon manufacturing year there are differences in molecular
weight, Mw, molecular weight distribution, MWD and high molecular
weight portion. The rheological result indicates clearly that different values
rely on the basic quality level difference of the polymer manufactured in
different years. Other changes within each group can be considered normal
variations considering differences in polymer manufacturing and pipe manu-
facturing. There is no indication of changes caused by hydrogen exposure.
3.4.6 Determination of oxidative power - consumption of antioxi-
dants
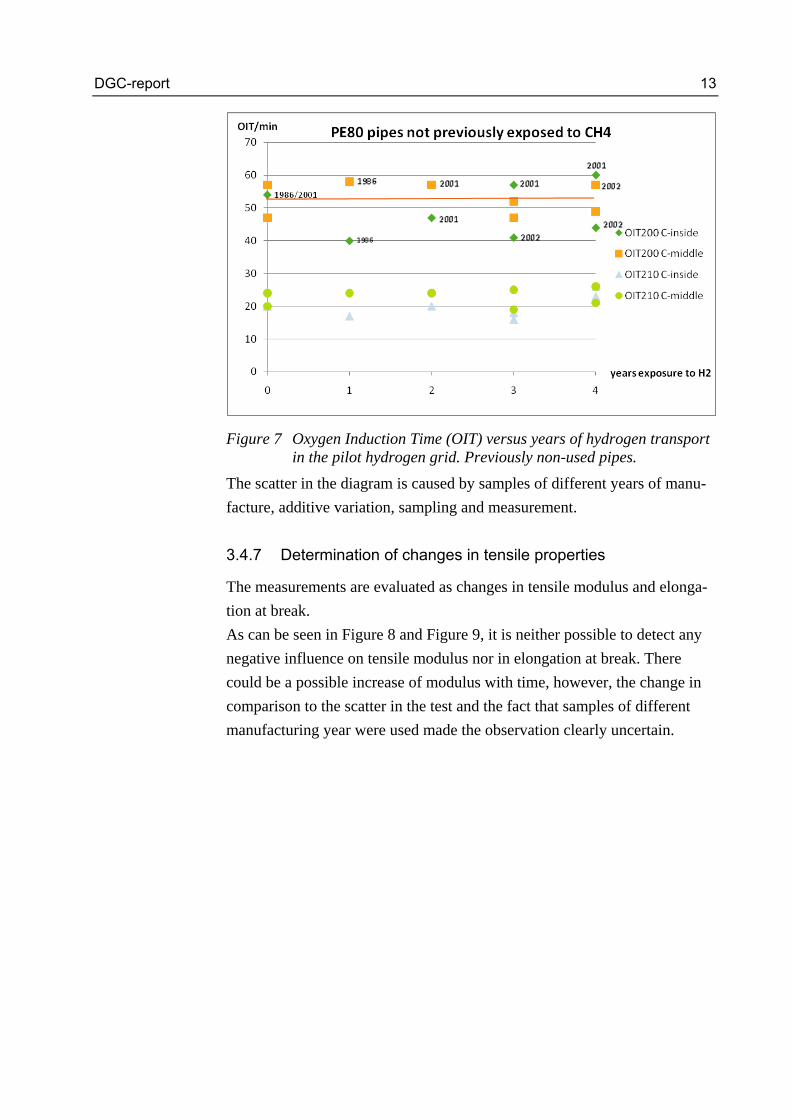
As can be seen from Figure 7 there is no effect from hydrogen transport on
the antioxidative power of the additivation of the polymer pipes, measured
as Oxygen Induction Time (OIT). This means that no interaction is found on
the additivation of the polymer pipes from the hydrogen transport and the
long-term integrity of the pipe is assured. Similar results have been found
for PE 100 and pipes previously exposed to natural gas for up to 20 years
prior to the hydrogen exposure. In the Gas pipe standard (EN 1555) an OIT
of 20 minutes at 200 °C is deemed sufficient for a 50-year life time at 20 °C.
DGC-report 13
Figure 7 Oxygen Induction Time (OIT) versus years of hydrogen transport in the pilot hydrogen grid. Previously non-used pipes.
The scatter in the diagram is caused by samples of different years of manu-
facture, additive variation, sampling and measurement.
3.4.7 Determination of changes in tensile properties
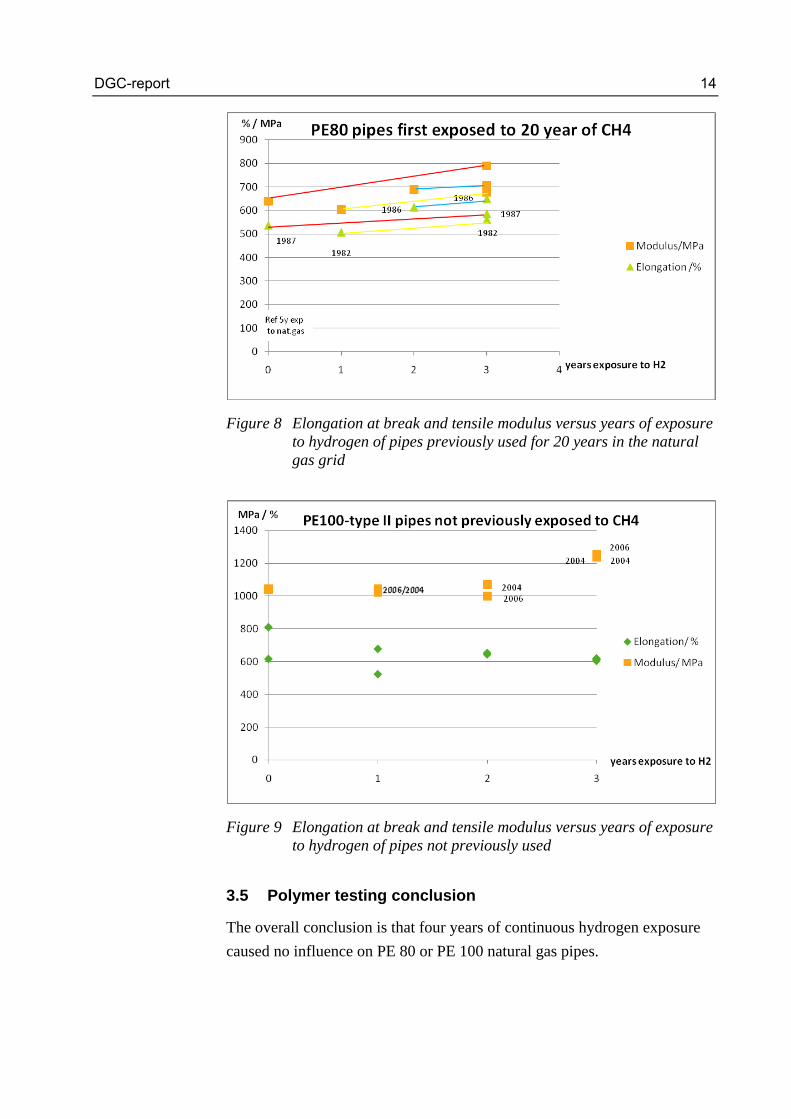
The measurements are evaluated as changes in tensile modulus and elonga-
tion at break.
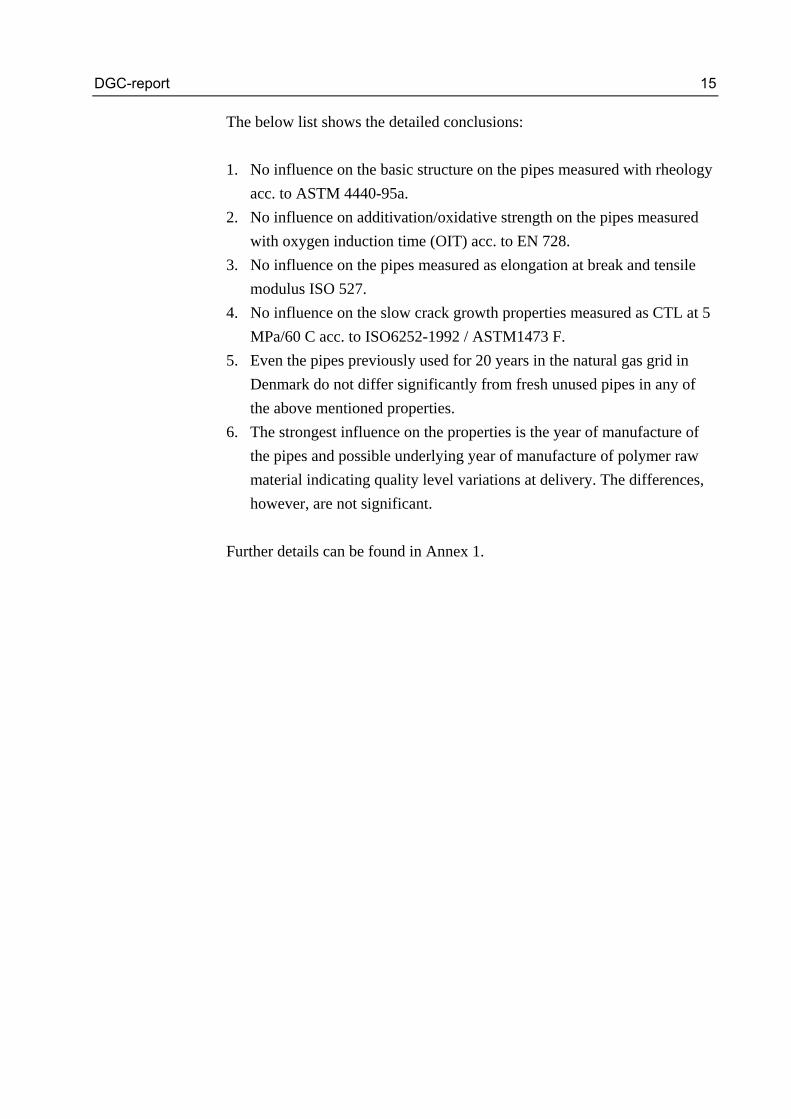
As can be seen in Figure 8 and Figure 9, it is neither possible to detect any
negative influence on tensile modulus nor in elongation at break. There
could be a possible increase of modulus with time, however, the change in
comparison to the scatter in the test and the fact that samples of different
manufacturing year were used made the observation clearly uncertain.
DGC-report 14
Figure 8 Elongation at break and tensile modulus versus years of exposure to hydrogen of pipes previously used for 20 years in the natural gas grid
Figure 9 Elongation at break and tensile modulus versus years of exposure to hydrogen of pipes not previously used
3.5 Polymer testing conclusion
The overall conclusion is that four years of continuous hydrogen exposure
caused no influence on PE 80 or PE 100 natural gas pipes.
DGC-report 15
The below list shows the detailed conclusions:
1. No influence on the basic structure on the pipes measured with rheology
acc. to ASTM 4440-95a.
2. No influence on additivation/oxidative strength on the pipes measured
with oxygen induction time (OIT) acc. to EN 728.
3. No influence on the pipes measured as elongation at break and tensile
modulus ISO 527.
4. No influence on the slow crack growth properties measured as CTL at 5
MPa/60 C acc. to ISO6252-1992 / ASTM1473 F.
5. Even the pipes previously used for 20 years in the natural gas grid in
Denmark do not differ significantly from fresh unused pipes in any of
the above mentioned properties.
6. The strongest influence on the properties is the year of manufacture of
the pipes and possible underlying year of manufacture of polymer raw
material indicating quality level variations at delivery. The differences,
however, are not significant.
Further details can be found in Annex 1.
DGC-report 16
4 X70 steel natural gas transmission pipeline test and
analysis
4.1 Introduction and objectives
Most studies aiming to describe the fatigue limits of existing pipelines for
hydrogen gas distribution are based on fracture mechanics principle and it
was found of less use to try to reproduce this work. Instead, it was decided
to make a series of full-scale test exposing pipes to fluctuating pressures
of hydrogen gas.
4.1.1 The object of the steel pipe test
The objective was to analyze the effect on fatigue life of existing natural gas
transmission lines with hydrogen replacing natural gas. The test and analysis
focused on the effect of hydrogen on fatigue cracking in pipeline girth
welds.
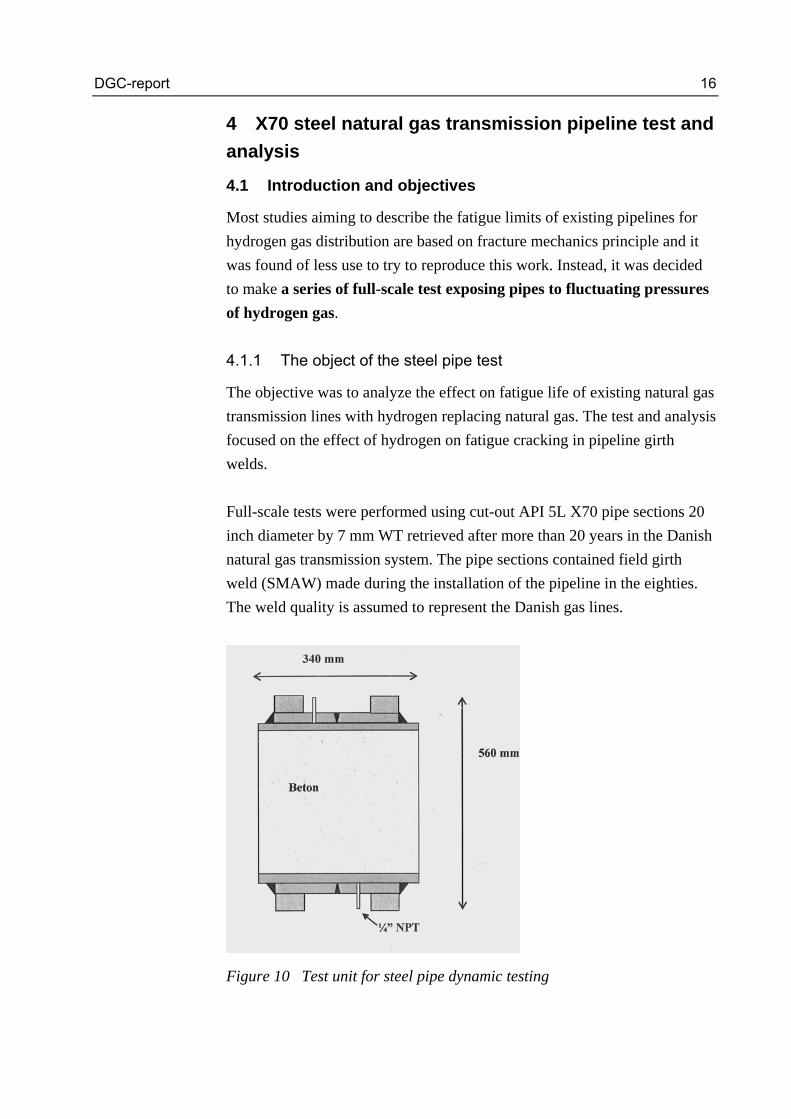
Full-scale tests were performed using cut-out API 5L X70 pipe sections 20
inch diameter by 7 mm WT retrieved after more than 20 years in the Danish
natural gas transmission system. The pipe sections contained field girth
weld (SMAW) made during the installation of the pipeline in the eighties.
The weld quality is assumed to represent the Danish gas lines.
Figure 10 Test unit for steel pipe dynamic testing
DGC-report 17
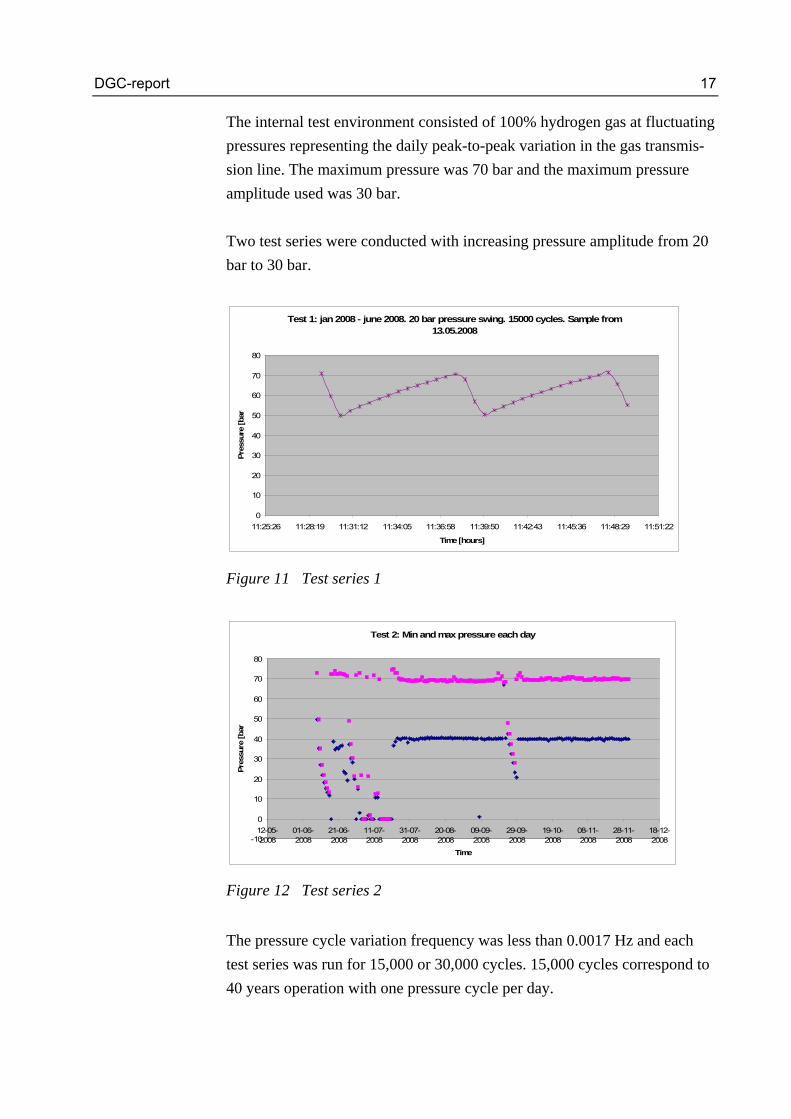
The internal test environment consisted of 100% hydrogen gas at fluctuating
pressures representing the daily peak-to-peak variation in the gas transmis-
sion line. The maximum pressure was 70 bar and the maximum pressure
amplitude used was 30 bar.
Two test series were conducted with increasing pressure amplitude from 20
bar to 30 bar.
Test 1: jan 2008 - june 2008. 20 bar pressure swing. 15000 cycles. Sample from 13.05.2008
0
10
20
30
40
50
60
70
80
11:25:26 11:28:19 11:31:12 11:34:05 11:36:58 11:39:50 11:42:43 11:45:36 11:48:29 11:51:22
Time [hours]
Pre
ssure
[bar
Figure 11 Test series 1
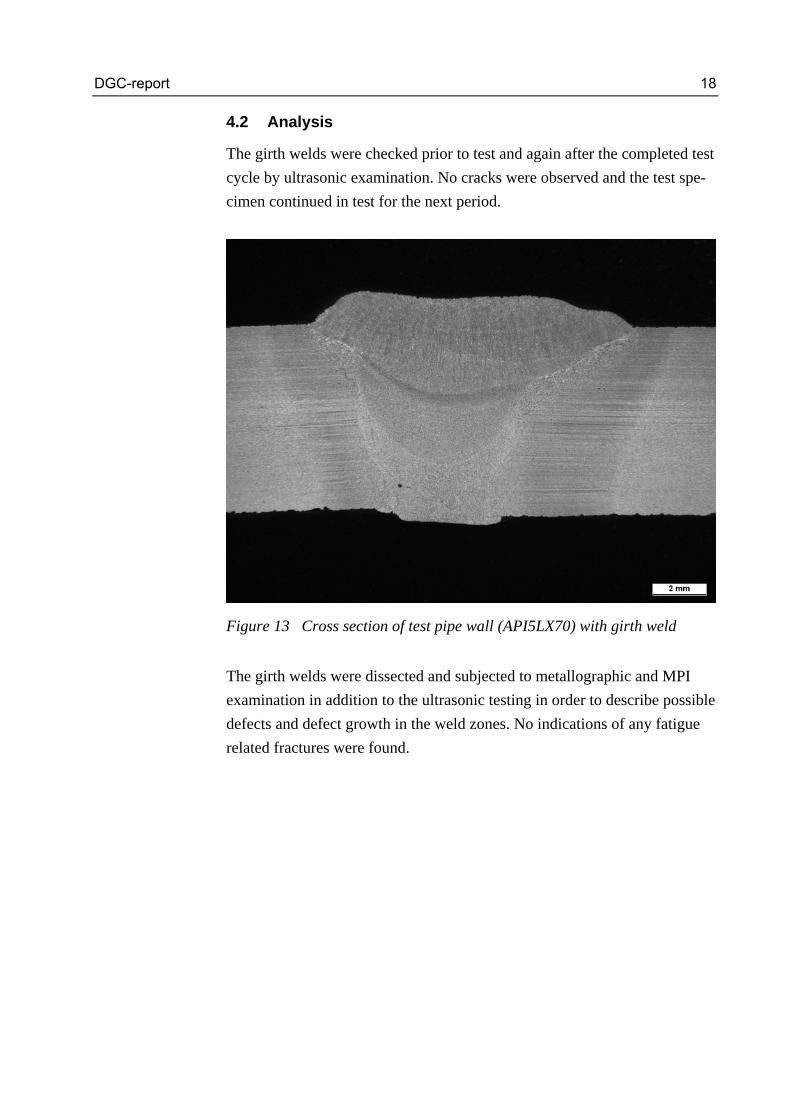
Test 2: Min and max pressure each day
-10
0
10
20
30
40
50
60
70
80
12-05-2008
01-06-2008
21-06-2008
11-07-2008
31-07-2008
20-08-2008
09-09-2008
29-09-2008
19-10-2008
08-11-2008
28-11-2008
18-12-2008
Time
Pre
ssure
[bar
Figure 12 Test series 2
The pressure cycle variation frequency was less than 0.0017 Hz and each
test series was run for 15,000 or 30,000 cycles. 15,000 cycles correspond to
40 years operation with one pressure cycle per day.
DGC-report 18
4.2 Analysis
The girth welds were checked prior to test and again after the completed test
cycle by ultrasonic examination. No cracks were observed and the test spe-
cimen continued in test for the next period.
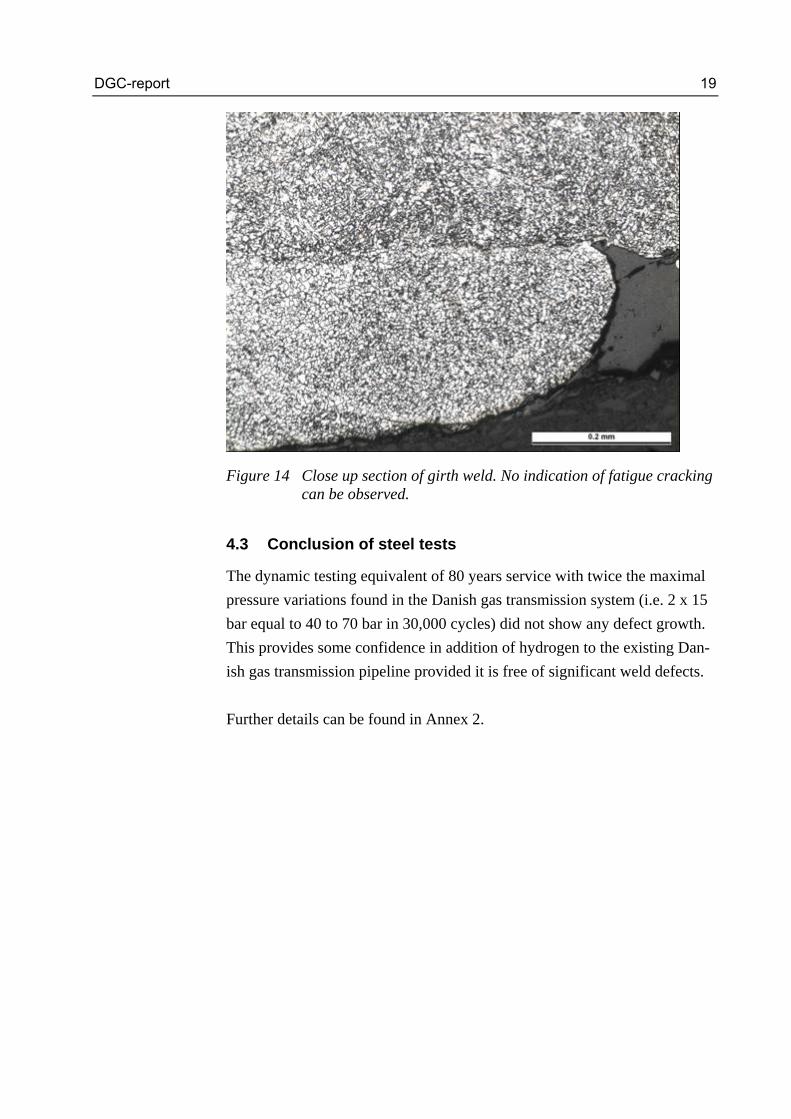
Figure 13 Cross section of test pipe wall (API5LX70) with girth weld
The girth welds were dissected and subjected to metallographic and MPI
examination in addition to the ultrasonic testing in order to describe possible
defects and defect growth in the weld zones. No indications of any fatigue
related fractures were found.
DGC-report 19
Figure 14 Close up section of girth weld. No indication of fatigue cracking can be observed.
4.3 Conclusion of steel tests
The dynamic testing equivalent of 80 years service with twice the maximal
pressure variations found in the Danish gas transmission system (i.e. 2 x 15
bar equal to 40 to 70 bar in 30,000 cycles) did not show any defect growth.
This provides some confidence in addition of hydrogen to the existing Dan-
ish gas transmission pipeline provided it is free of significant weld defects.
Further details can be found in Annex 2.

DGC-report 20
5 References
1. Andersen, Juhl, Pedersen, Myken, Iskov; Brint som energibærer; Dansk
Gasteknisk Center 1999; ISBN 87-7795-172-7.
DGC-report 21
APPENDIX 1: Borealis Innovation Project Report
Select the report type
Technical report
X Research report
Commercial report
1. General Project Data OA/IP/BU no.
Project name
Support work for Danish gas research centre on hydrogen transport in PE natural gas pipes.
2. General Report Data
5.1.1.1.1.1.1Date 5.1.1.1.1.1.2Report ID no.
2010-06-30
Title Summary report on a four year study of hydrogen transport in Polyethylene natural gas pipes.
Authors Mats Bäckman
Background It has become ever clearer that the resource of natural gas is an energy source which will be less important in the future due to limitations in natural reserves. In order to prepare for the future the gas industry is looking at alternative fuel gases, one such fuel gas is hydro-gen. A dominant part of the natural gas distribution grid consists today of polyethylene pipe due to its excellent track record as a reliable piping material with minimal arising problems or maintenance. The reason for this is the inherent properties like its corrosion free nature, the possibility to create fully weldable systems, its high ductility and excellent low temperature properties. In order to prepare for a future use of hydrogen as a fuel gas it became evident to the Dan-ish Gas research Centre that very little information existed regarding the compatibility be-tween long term exposure and transportation of hydrogen in Polyethylene gas pipelines. A program was therefore set to study the transportation in a small scale pilot grid at the re-search centre in Hörsholm, Denmark. Borealis being one of the biggest suppliers of raw material from Polyethylene for the produc-tion of pipes for e.g. pressure pipes for Gas distribution volunteered to provide analytical services for the determination of any compatibility problems between polyethylene pipes and hydrogen under long term exposure. The program was devised so that part of the grid was to be dug up each year and analysis performed on the pipes, in this way any form of influence on the integrity of the polyethylene
DGC-report 22
pipe would be detected. The pipes were analysed before exposure to hydrogen, then the pipes has been dug up after 1 year, 2 years, 3 years and 4 years of exposure. The expo-sure was made in a circulation grid so that both pressure and a linear speed were main-tained in a closed system. Some of the pipes have also previously been used in the Danish natural gas network. Lengths of pipes has been cut out of the network and replaced, the pipes has then been fitted into the pilot grid in Hörsholm and subjected to H2 there and of course been dug up as described above. The oldest pipes have been subjected to natural gas for 20 years before exposure to H2 in the pilot grid.
Short summary This report contains data from four years of hydrogen transport in PE natural gas pipes, in the pilot grid built up at Danish gas research centre in Hörsholm, Denmark. The pipes are both unused pipes as well as pipes that have a prehistory of 4, 5 and 20 years of service in the Danish natural gas network. This study has focused on detecting structural changes (by MFR/FRR and rheology), changes in antioxidative power (Oxygen induction time), previous deterioration of oxidative power, surface oxidation from pipe manufacturing (Fourier trans-form infrared analysis), changes in mechanical properties (E-modulus/ elongation at break) as well as changes to the resistance to slow crack growth ( constant tensile load test). No detrimental effect has been found by the exposure to hydrogen nor has any effect of a prior use in the Danish natural gas network up to 20 years been found.
Conclusions
We can see from the four years of exposure to hydrogen in the pilot grid in Denmark that.
No adverse effect is found on either PE80 pipes or on two types of PE100 in terms of its:
Oxidative resistance measured with oxygen induction time;
Mechanical properties measured as e-modulus and elongation at break;
Slow crack growth resistance measured with CTL at 60 C;
Structural build up measured with rheology
MFR5, MFR21 and FRR21/5
We see no reason why MDPE PE80 or HDPE PE100 can’t be used as me-dia pipes for hydrogen transport.
We have also found that: There is no adverse effect if the pipes have previously been used for natu-
ral gas transport, still no effect on the above-mentioned properties;
The pipes that have been exposed to 20 years of usage as natural gas transport pipes show the same properties as unused pipes in the above-mentioned properties;
Pipes with a total of 24 years of usage, natural gas transport + hydrogen

DGC-report 23
transport show the same properties as virgin pipes.
Actions / proposals
Product(s) PE100, PE80
Distribution Henrik Iskov (DGC)
DGC-report 24
Investigation of Natural gas pipes for Hydrogen gas transportation. Introduction: It has become ever clearer that the resource of natural gas is an energy source which will be less important in the future due to limitations in natural reserves. In order to prepare for the fu-ture the gas industry is looking at alternative fuel gases, one such fuel gas is hydrogen. A dominant part of the natural gas distribution grid consists today of polyethylene pipe due to its excellent track record as a reliable piping material with minimal arising problems or mainte-nance. The reason for this is the inherent properties like its corrosion free nature, the possibility to create fully weldable systems, its high ductility and excellent low temperature properties. In order to prepare for a future use of hydrogen as a fuel gas it became evident to the Danish Gas research Centre that very little information existed regarding the compatibility between long term exposure and transportation of hydrogen in Polyethylene gas pipelines. A program was therefore set to study the transportation in a small scale pilot grid at the research centre in Hör-sholm, Denmark. Borealis being one of the biggest suppliers of raw material from Polyethylene for the production of pipes for e.g. pressure pipes for Gas distribution volunteered to provide analytical services for the determination of any compatibility problems between polyethylene pipes and hydrogen un-der long term exposure. The program was devised so that part of the grid was to be dug up each year and analysis per-formed on the pipes, in this way any form of influence on the integrity of the polyethylene pipe would be detected. The pipes were analysed before exposure to hydrogen, then the pipes has been dug up after 1 year, 2 years, 3 years and 4 years of exposure. The exposure was made in a circulation grid so that both pressure and a linear speed were maintained in a closed system. Some of the pipes have also previously been used in the Danish natural gas network. Lengths of pipes has been cut out of the network and replaced, the pipes has then been fitted into the pilot grid in Hörsholm and subjected to H2 there and of course been dug up as described above. The oldest pipes have been subjected to natural gas for 20 years before exposure to H2 in the pilot grid. Abbreviations used: SCG = Slow crack growth OIT= Oxygen Induction Time ESCR = Environmental Stress Cracking CTL = Constant Tensile Load, name of test method. PE100 = Polyethylene pipe material fulfilling classification of MRS 10,0 MPa PE80 = Polyethylene pipe material fulfilling classification of MRS 8,0 MPa MRS= Minimum required strength at 50 years DGC= Danish Gas research Centre FTIR= Fourier Transform Infra Red analysis MFR= Melt Flow Rate FRR= Flow Rate Ratio ISO= International Organisation for Standardisation CH4= Natural gas Experiments: After each year of exposure to hydrogen gas and its references the planned experiments was to determine if there had been any 1) Structural changes in the polymer 2) Consumption of anti-oxidants 3) Change of Tensile properties 4) Change of slow crack growth properties of the ma-terial 5) Change of MFR/FRR. The reason for this choice is that if no influences are detected in these properties then one can assume that the media polymer pipe are compatible and can safely be used, seen from a polymer structure-property-pipe property point of view.
DGC-report 25
Samples used in the analysis: It has been found that the samples consist of three distinctly different materials namely 1) a yel-low solid wall s.c. PE80 medium density polyethylene (PE80 MDPE) 2) An Orange solid wall s.c. PE100 High density polyethylene (PE100 HDPE) hereinafter called PE100 type I 3) A natu-ral coloured pipe with an Orange outer protective layer, the natural coloured material is a s.c. PE100 High density polyethylene (PE100 HDPE) hereinafter called PE100 type II. Determination of structural changes: Pressure pipe PE polymers are high molecular weight materials with a broad molecular weight distribution and the physical properties of the polymer are determined to a large extent by the high molecular weight portion of the material. There are two main ways of determining the struc-ture, molecular weight and molecular weight distribution either it can be determined by Size Ex-clusion Chromatography (SEC alt GPC) or it can be determined by Rheology. Since we are to analyse high molecular weight materials with a broad molecular weight distribution the choice fell upon Rheology since this is more sensitive to changes in the high molecular portion and these changes are coupled to physical properties of the material. In these rheological meas-urements one can define certain indexes. In this study we have chosen to use η2,7KPa which cor-responds to the average molecular weight Mw, SHI2,7/210KPa which corresponds to the molecular weight distribution MWD as well as η747Pa which roughly correspond to the high molecular weight tail Mz (ref 1,2) (see also ASTM 4440-95a and EP1137707-rheological description). The measurement principle is to melt and subject a melt pool of the polymer to ever increasing shear rate (oscillating speed in Rheometer), (see Experimental set-up, Rheometry), since PE is a s.c. shear thinning polymer it will mean that the viscosity will be reduced with increasing shear speed. The way the viscosity decrease, with the shear speed depends on the molecular struc-ture, MWD, Mw etc. By analysing the curve according to the above mentioned indexes detailed information about the structure of the particular material can be achieved. Determination of Oxidative power - consumption of antioxidants: In order to detect interaction between the transported medium and antioxidant (the pipe grades contains mainly phenolic antioxidants) the so called Oxygen Induction Time (OIT, acc EN728) was chosen as it gives a quick and reliable measurement of the oxidation power of the additiva-tion in the polymer. This has been determined at two temperatures to increase the accuracy of the determination. However many gas pipe material contains UV-stabilisers which also act as antioxidants at temperatures below 120 C. Since the analysis is performed at 200 C and 210 C this capability is not captured. However the analysis will show if an interaction between the anti-oxidant and transported media has taken place and the antioxidative power will be at least that shown. The measurement principle is to let in pure oxygen into the heated furnace (see Experimental set-up, Oxygen induction time), as long as the antioxidant works no oxidation takes place on the polymer but once it is consumed the polymer starts to oxidise and energy is released this en-ergy is recorded (see Experimental set-up, Oxygen induction time, diagrams) and the time to antioxidant depletion can be recorded. This test normally takes place at 200 or 210 C, the ac-celeration factor per 10 C is ca 2,3-2,5 which means that a result of 25 min at 210 C would cor-respond to roughly 354-1730 years at 20 C. The standard demand of 20 min at 200 C is roughly equal to 123-553 year at 20 C. However normally some losses to the transport media are calcu-lated, especially in the case of water transport and it is a long extrapolation, therefore the high safety margin in the standard (see ref 3) for the demand for oxidative stability. Determination of changes in Tensile properties: In order to detect changes in the basic mechanical properties of the Pipes we have chosen to test the pipes according to ISO 527-2/1B and have determined yield point, break point, elonga-tion at break as well as the tensile modulus of the pipe. The measurement principle is to draw a dumbbell until failure and from this curve extract differ-ent values like yield point etc (see Experimental set-up, tensile testing and diagram)
DGC-report 26
Determination of changes in Slow Crack Growth: In order to be able to use specimens prepared out of the pipes, we have chosen a method called CTL (ISO 6252-1992) fitted with notches according to ASTM 1473 F of 40 % notch depth. The test was performed at 5 MPa and 60 ºC in a 10 % solution of Igepal 720 in water. The measurement principle is to pre-create a notch in a sample and use temperature as well as a stress cracking media (such testing is normally called ESCR, Environmental stress cracking) to accelerate the growth of the crack (see Experimental set-up, Slow crack growth, CTL). The reason is that if a PE pipe fails in practise it will be because of slow crack growth and this can be started by e.g. rocks impinging the pipe because of soil settlement, poor welding at installa-tion etc. To have a good resistance to slow crack growth is vital for the long term integrity of the pipe. Determination of MFR / FRR: In order to determine any changes in the basic parameters MFR5 and FRR21/5 measurements according to ISO 1133 was performed. The measurement principle is to melt polymer in the apparatus (see Experimental set-up, MFR ISO 1133), then load the melt pool with a certain weight (in this case 5 & 21,6 Kg) and record the amount of polymer flowing out per time unit. This is a standard way of having a quick meas-urement of Mw (MFR5) and MWD (FRR21/5) however much less accurate than the rheological evaluation referred to above. Further determination: In order to detect any prior negative influence from the pipe extrusion, a measurement of the carbonyl index or in other words the surface oxidation of the inner surface of the pipes was per-formed. The surface oxidation was measured with Fourier Transform Infra Red (FTIR) technique (see experimental set up). The measurement principal is to shine infrared light of different wave lengths through a polymer sample, depending upon the chemical nature of the composition (e.g. carbonyl group) and amount, the material will absorb the infra red light and an analysis of the wave length versus absorption will reveal the chemical nature and amount of species in the polymer.
DGC-report 27
Experimental set up: MFR ISO 1133: Performed according to ISO 1133, principle of measurement and equipment see below:
Figure 1 MFR apparatus
DGC-report 28
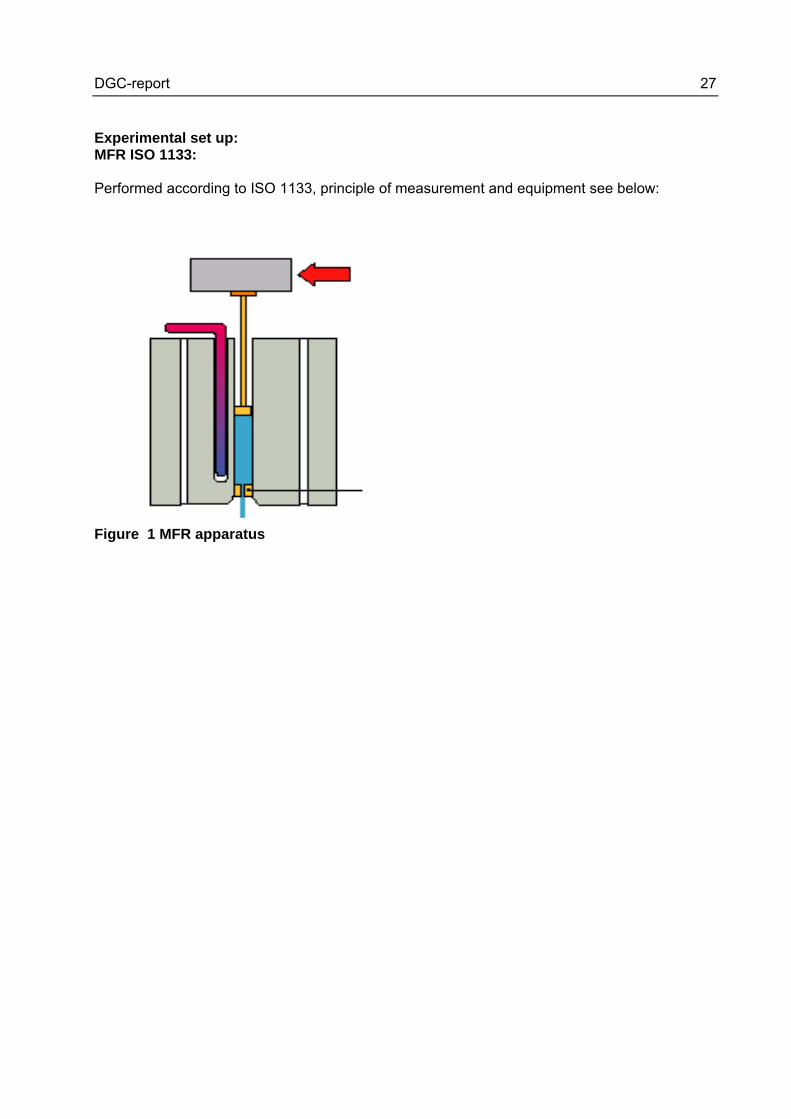
Slow crack growth CTL, ISO 6052-1992, Notch acc ASTM F1473
Figure 2 Surface-active solution, Igepal CO-720 at 60 C, stress level 5,0 MPa.
DGC-report 29
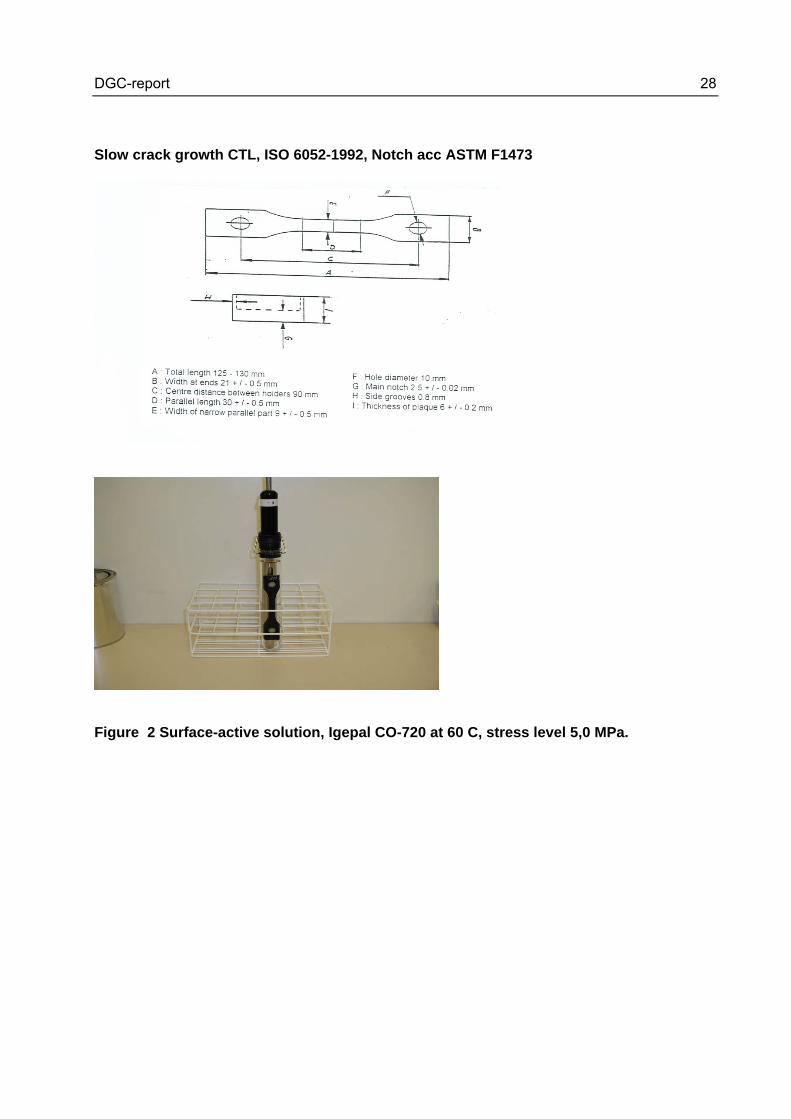
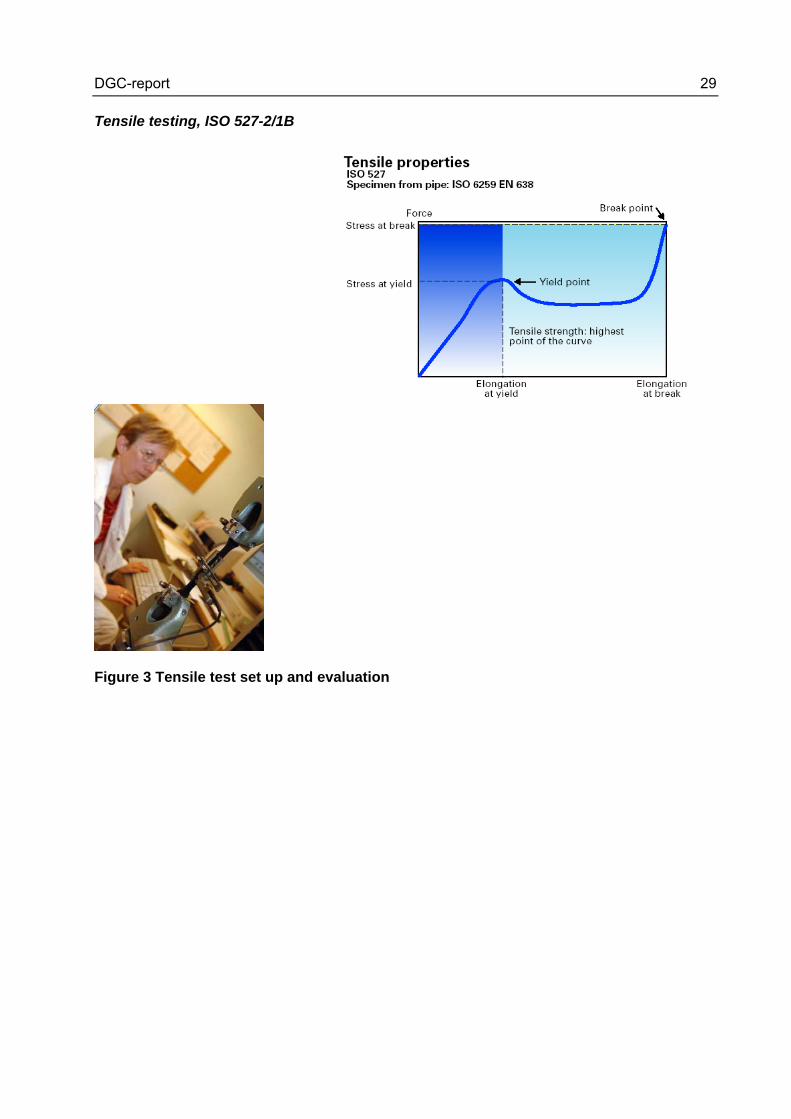
Tensile testing, ISO 527-2/1B
Figure 3 Tensile test set up and evaluation
DGC-report 30
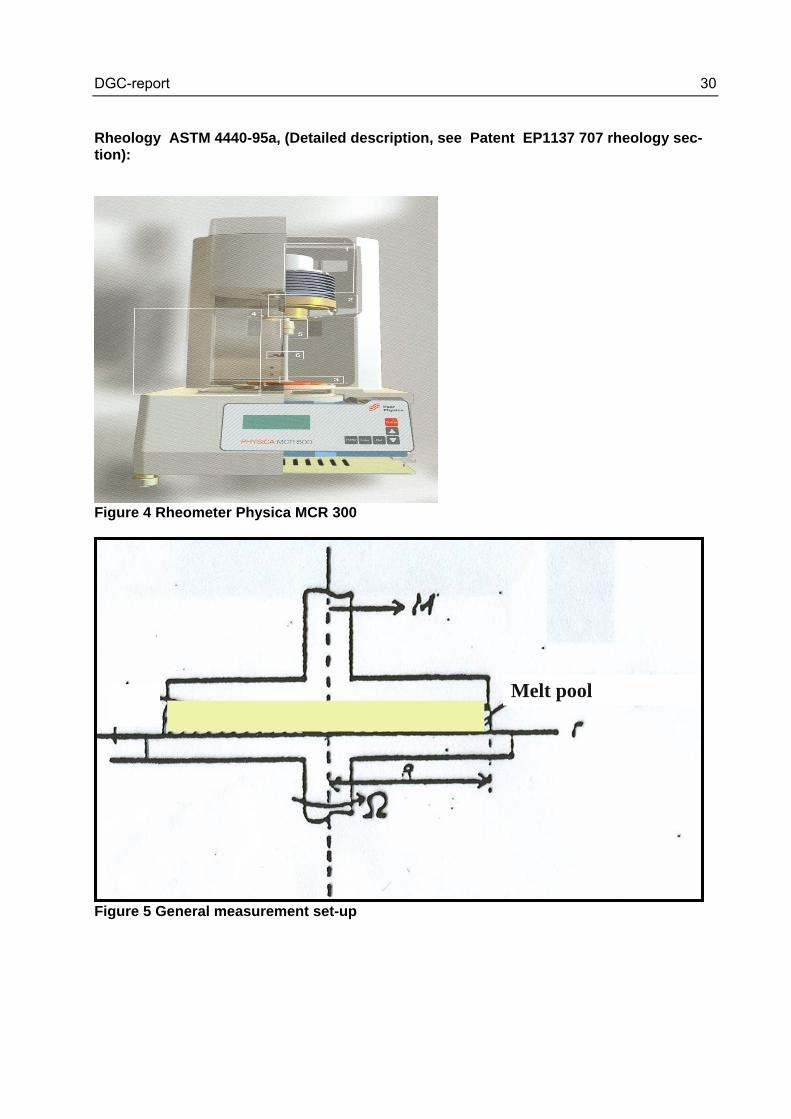
Rheology ASTM 4440-95a, (Detailed description, see Patent EP1137 707 rheology sec-tion):
Figure 4 Rheometer Physica MCR 300
Figure 5 General measurement set-up
Melt pool
DGC-report 31
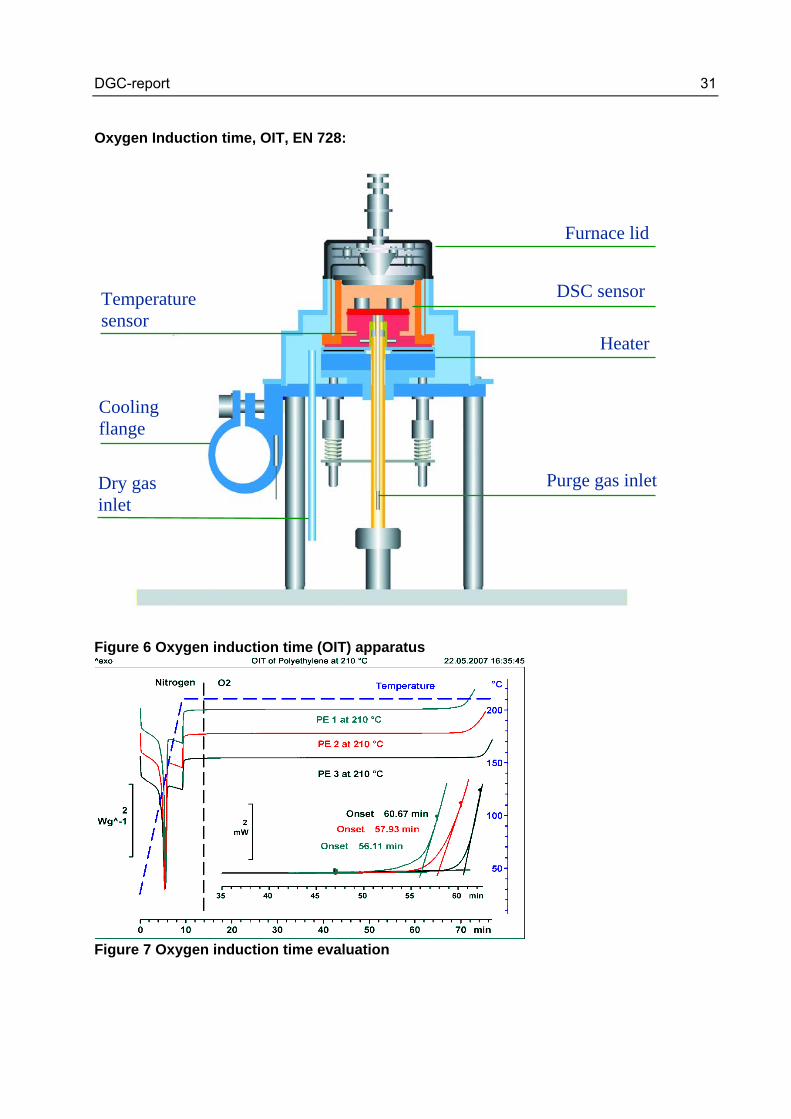
Oxygen Induction time, OIT, EN 728:
Figure 6 Oxygen induction time (OIT) apparatus
Figure 7 Oxygen induction time evaluation
Furnace lid
Heater
Temperature sensor
DSC sensor
Cooling flange
Purge gas inletDry gas inlet
DGC-report 32
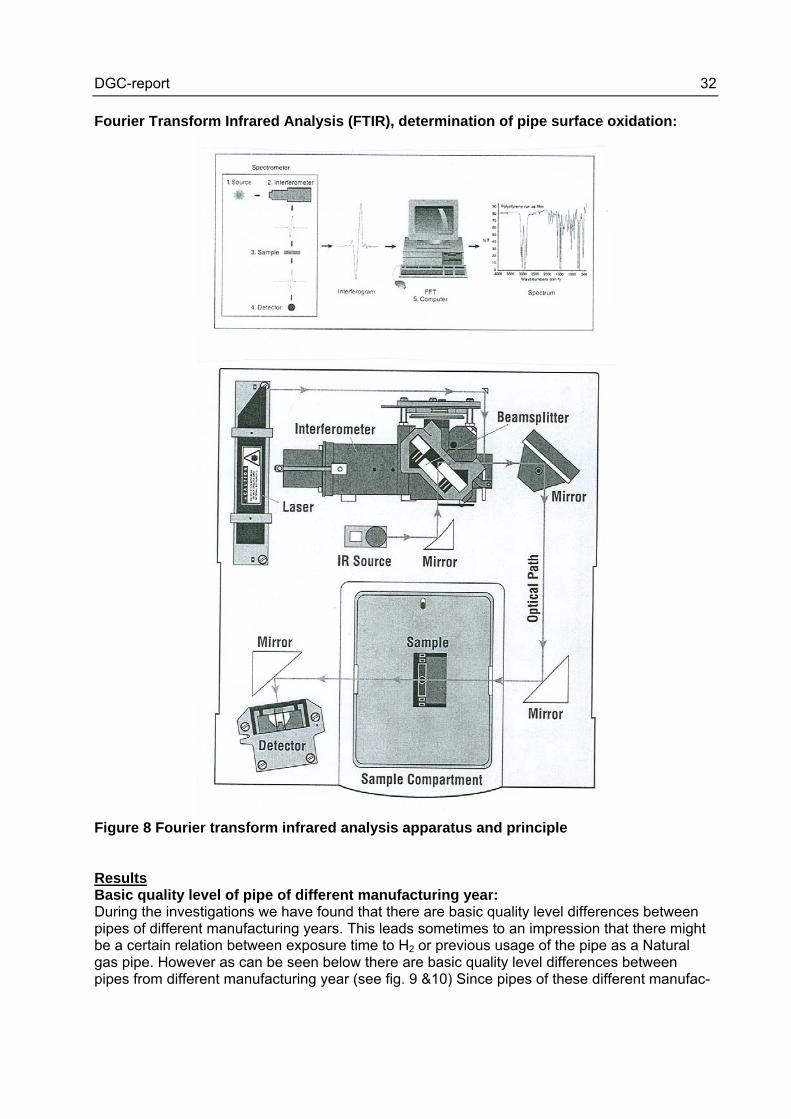
Fourier Transform Infrared Analysis (FTIR), determination of pipe surface oxidation: Figure 8 Fourier transform infrared analysis apparatus and principle Results Basic quality level of pipe of different manufacturing year: During the investigations we have found that there are basic quality level differences between pipes of different manufacturing years. This leads sometimes to an impression that there might be a certain relation between exposure time to H2 or previous usage of the pipe as a Natural gas pipe. However as can be seen below there are basic quality level differences between pipes from different manufacturing year (see fig. 9 &10) Since pipes of these different manufac-
DGC-report 33
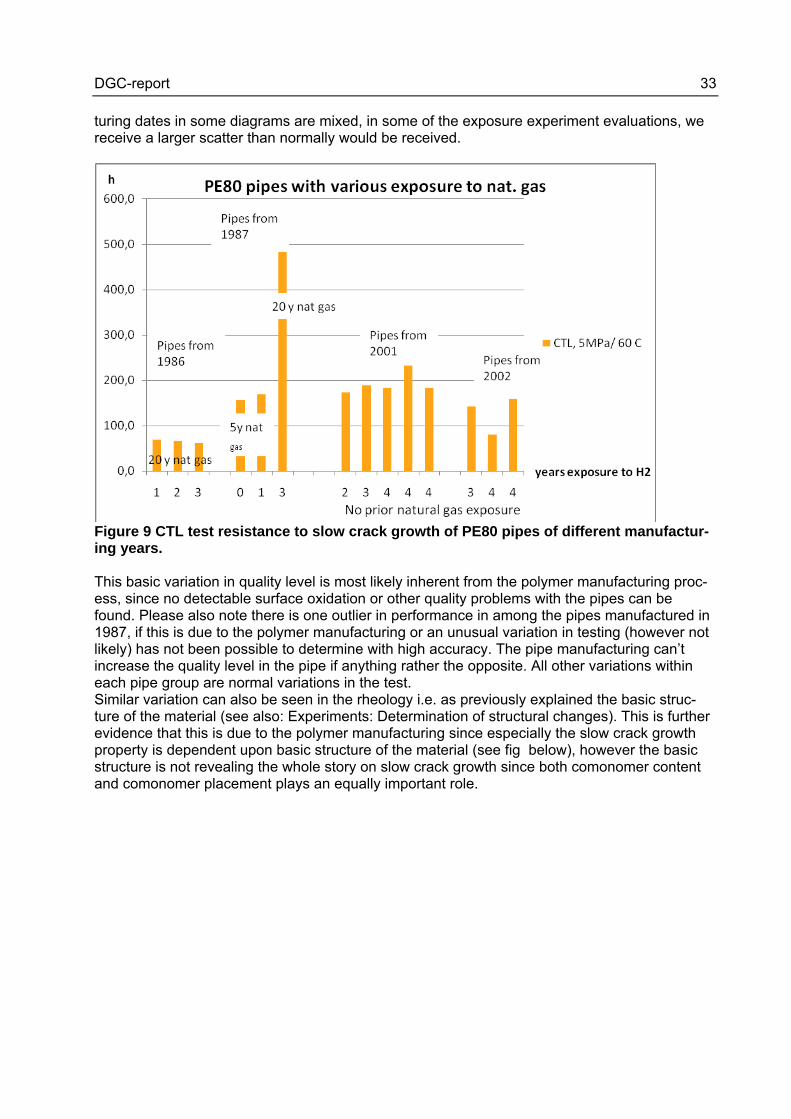
turing dates in some diagrams are mixed, in some of the exposure experiment evaluations, we receive a larger scatter than normally would be received.
Figure 9 CTL test resistance to slow crack growth of PE80 pipes of different manufactur-ing years. This basic variation in quality level is most likely inherent from the polymer manufacturing proc-ess, since no detectable surface oxidation or other quality problems with the pipes can be found. Please also note there is one outlier in performance in among the pipes manufactured in 1987, if this is due to the polymer manufacturing or an unusual variation in testing (however not likely) has not been possible to determine with high accuracy. The pipe manufacturing can’t increase the quality level in the pipe if anything rather the opposite. All other variations within each pipe group are normal variations in the test. Similar variation can also be seen in the rheology i.e. as previously explained the basic struc-ture of the material (see also: Experiments: Determination of structural changes). This is further evidence that this is due to the polymer manufacturing since especially the slow crack growth property is dependent upon basic structure of the material (see fig below), however the basic structure is not revealing the whole story on slow crack growth since both comonomer content and comonomer placement plays an equally important role.
DGC-report 34
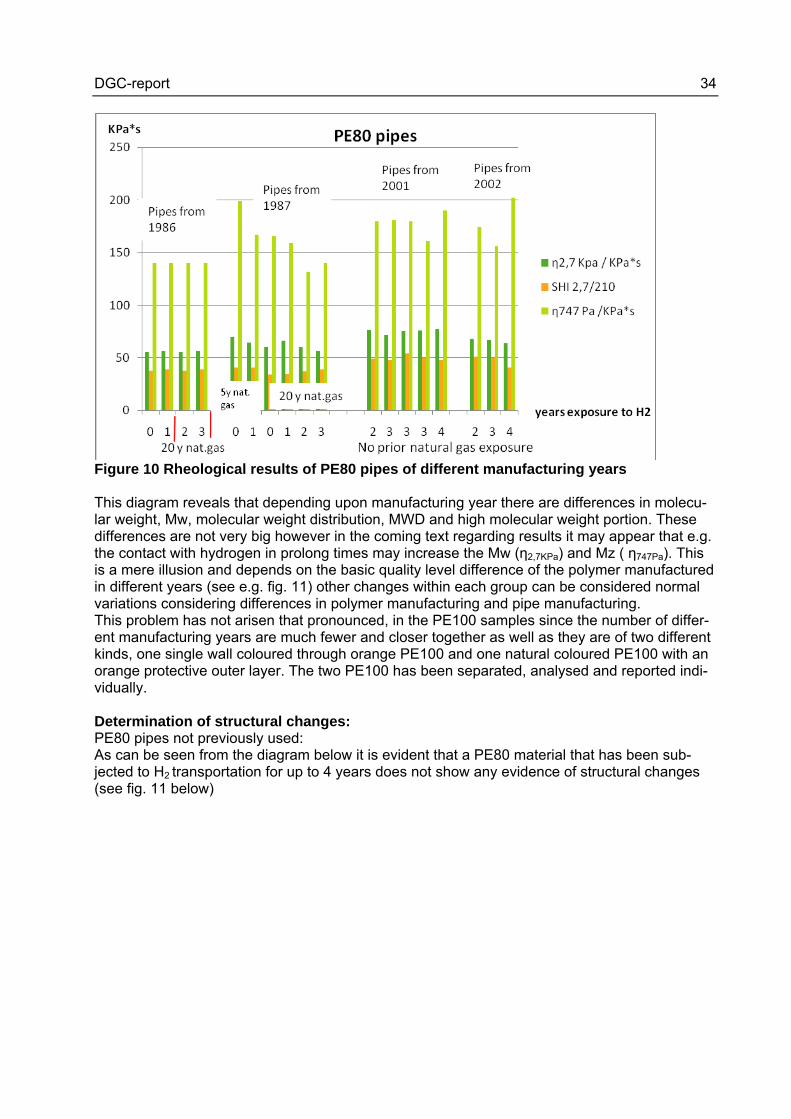
Figure 10 Rheological results of PE80 pipes of different manufacturing years This diagram reveals that depending upon manufacturing year there are differences in molecu-lar weight, Mw, molecular weight distribution, MWD and high molecular weight portion. These differences are not very big however in the coming text regarding results it may appear that e.g. the contact with hydrogen in prolong times may increase the Mw (η2,7KPa) and Mz ( η747Pa). This is a mere illusion and depends on the basic quality level difference of the polymer manufactured in different years (see e.g. fig. 11) other changes within each group can be considered normal variations considering differences in polymer manufacturing and pipe manufacturing. This problem has not arisen that pronounced, in the PE100 samples since the number of differ-ent manufacturing years are much fewer and closer together as well as they are of two different kinds, one single wall coloured through orange PE100 and one natural coloured PE100 with an orange protective outer layer. The two PE100 has been separated, analysed and reported indi-vidually. Determination of structural changes: PE80 pipes not previously used: As can be seen from the diagram below it is evident that a PE80 material that has been sub-jected to H2 transportation for up to 4 years does not show any evidence of structural changes (see fig. 11 below)
DGC-report 35
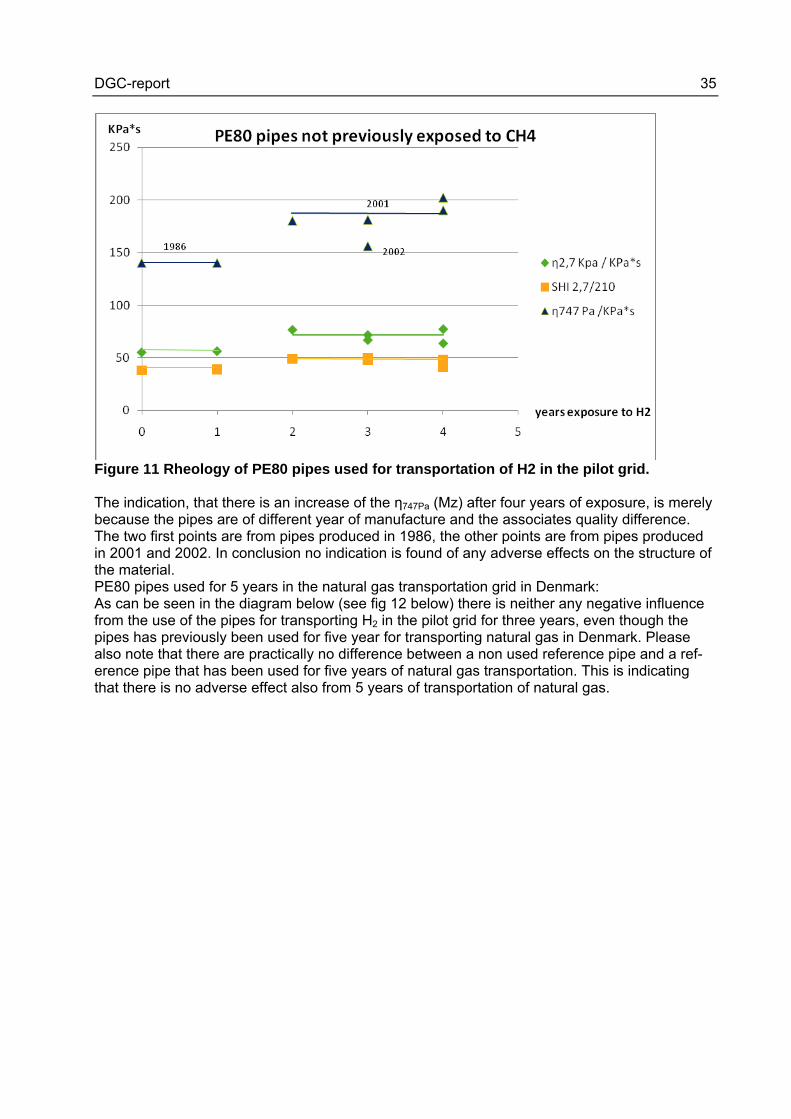
Figure 11 Rheology of PE80 pipes used for transportation of H2 in the pilot grid. The indication, that there is an increase of the η747Pa (Mz) after four years of exposure, is merely because the pipes are of different year of manufacture and the associates quality difference. The two first points are from pipes produced in 1986, the other points are from pipes produced in 2001 and 2002. In conclusion no indication is found of any adverse effects on the structure of the material. PE80 pipes used for 5 years in the natural gas transportation grid in Denmark: As can be seen in the diagram below (see fig 12 below) there is neither any negative influence from the use of the pipes for transporting H2 in the pilot grid for three years, even though the pipes has previously been used for five year for transporting natural gas in Denmark. Please also note that there are practically no difference between a non used reference pipe and a ref-erence pipe that has been used for five years of natural gas transportation. This is indicating that there is no adverse effect also from 5 years of transportation of natural gas.
DGC-report 36
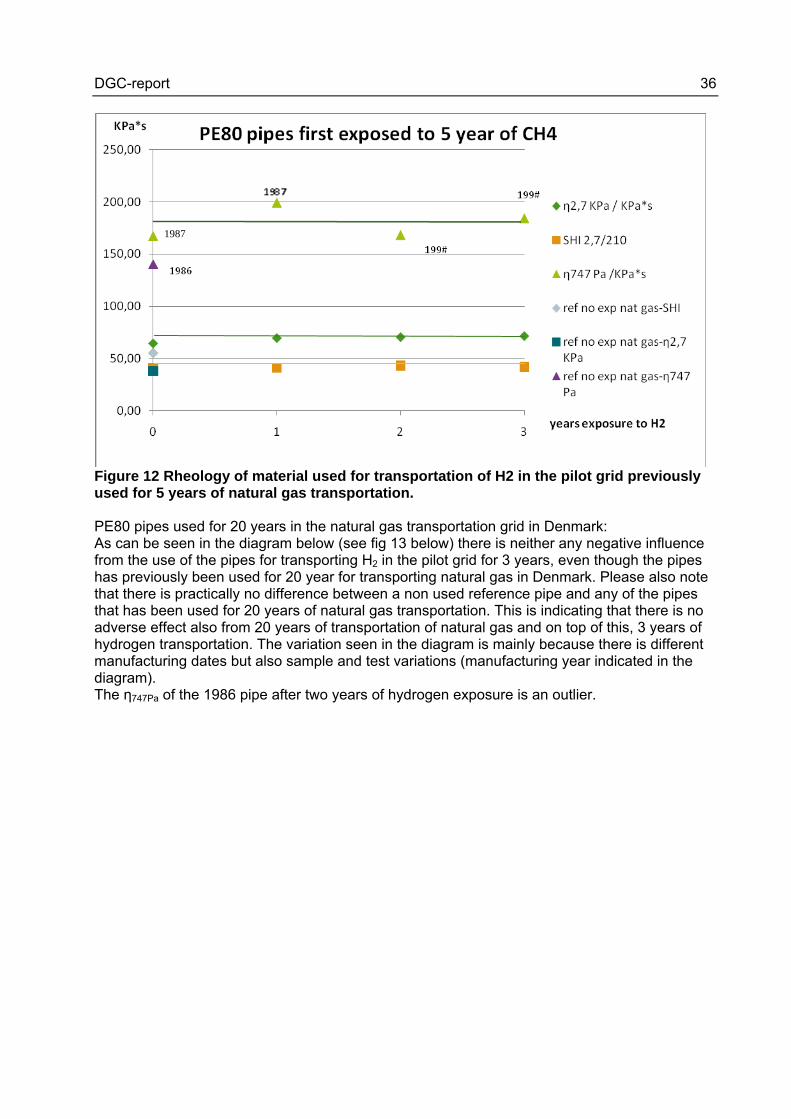
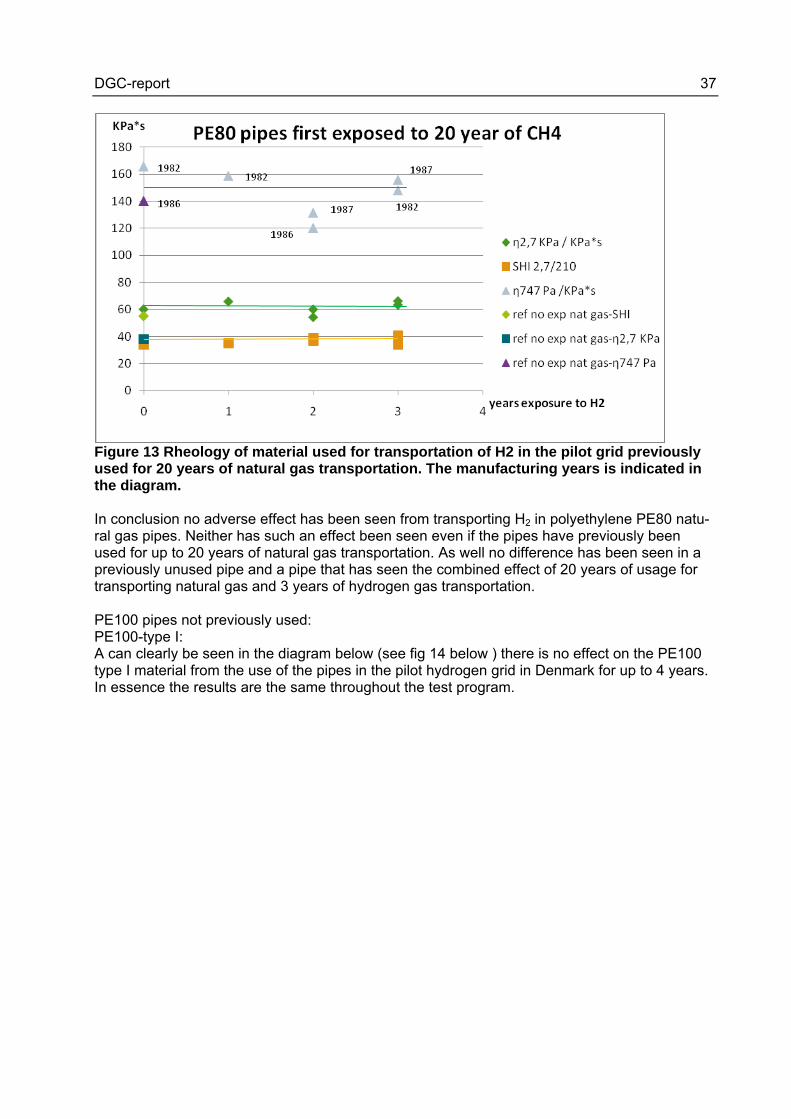
Figure 12 Rheology of material used for transportation of H2 in the pilot grid previously used for 5 years of natural gas transportation. PE80 pipes used for 20 years in the natural gas transportation grid in Denmark: As can be seen in the diagram below (see fig 13 below) there is neither any negative influence from the use of the pipes for transporting H2 in the pilot grid for 3 years, even though the pipes has previously been used for 20 year for transporting natural gas in Denmark. Please also note that there is practically no difference between a non used reference pipe and any of the pipes that has been used for 20 years of natural gas transportation. This is indicating that there is no adverse effect also from 20 years of transportation of natural gas and on top of this, 3 years of hydrogen transportation. The variation seen in the diagram is mainly because there is different manufacturing dates but also sample and test variations (manufacturing year indicated in the diagram). The η747Pa of the 1986 pipe after two years of hydrogen exposure is an outlier.
1987
DGC-report 37
Figure 13 Rheology of material used for transportation of H2 in the pilot grid previously used for 20 years of natural gas transportation. The manufacturing years is indicated in the diagram. In conclusion no adverse effect has been seen from transporting H2 in polyethylene PE80 natu-ral gas pipes. Neither has such an effect been seen even if the pipes have previously been used for up to 20 years of natural gas transportation. As well no difference has been seen in a previously unused pipe and a pipe that has seen the combined effect of 20 years of usage for transporting natural gas and 3 years of hydrogen gas transportation. PE100 pipes not previously used: PE100-type I: A can clearly be seen in the diagram below (see fig 14 below ) there is no effect on the PE100 type I material from the use of the pipes in the pilot hydrogen grid in Denmark for up to 4 years. In essence the results are the same throughout the test program.
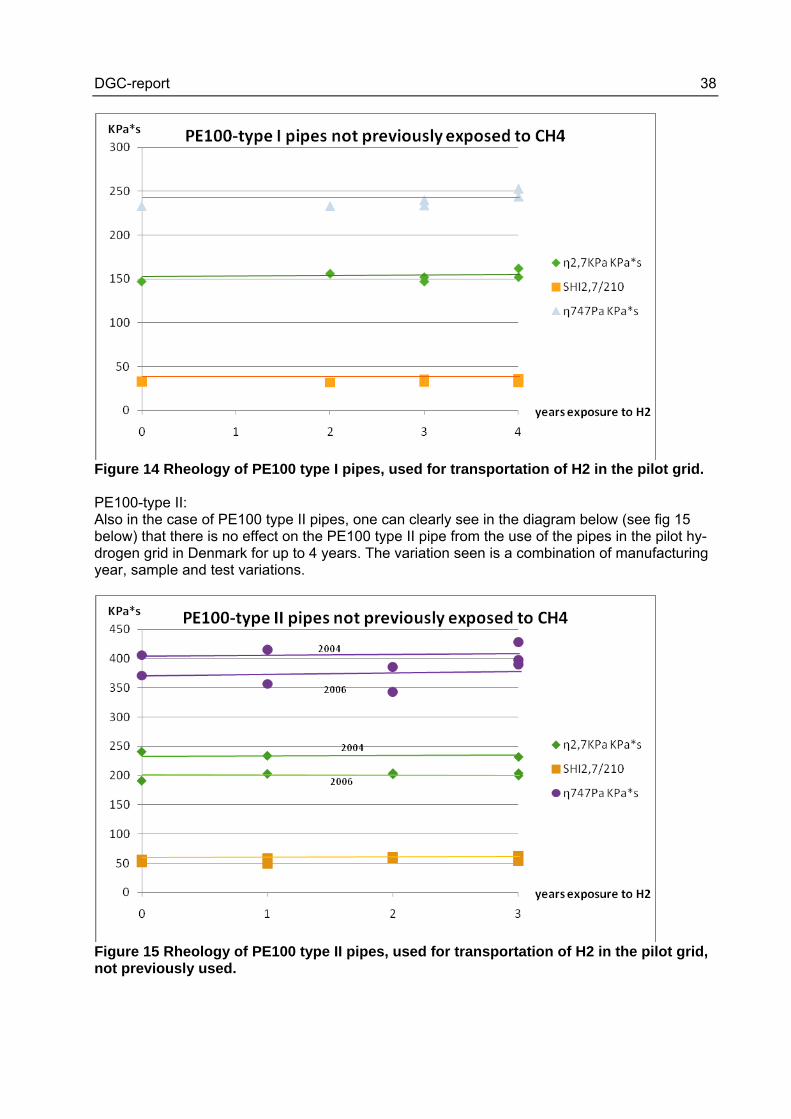
DGC-report 38
Figure 14 Rheology of PE100 type I pipes, used for transportation of H2 in the pilot grid. PE100-type II: Also in the case of PE100 type II pipes, one can clearly see in the diagram below (see fig 15 below) that there is no effect on the PE100 type II pipe from the use of the pipes in the pilot hy-drogen grid in Denmark for up to 4 years. The variation seen is a combination of manufacturing year, sample and test variations.
Figure 15 Rheology of PE100 type II pipes, used for transportation of H2 in the pilot grid, not previously used.
DGC-report 39
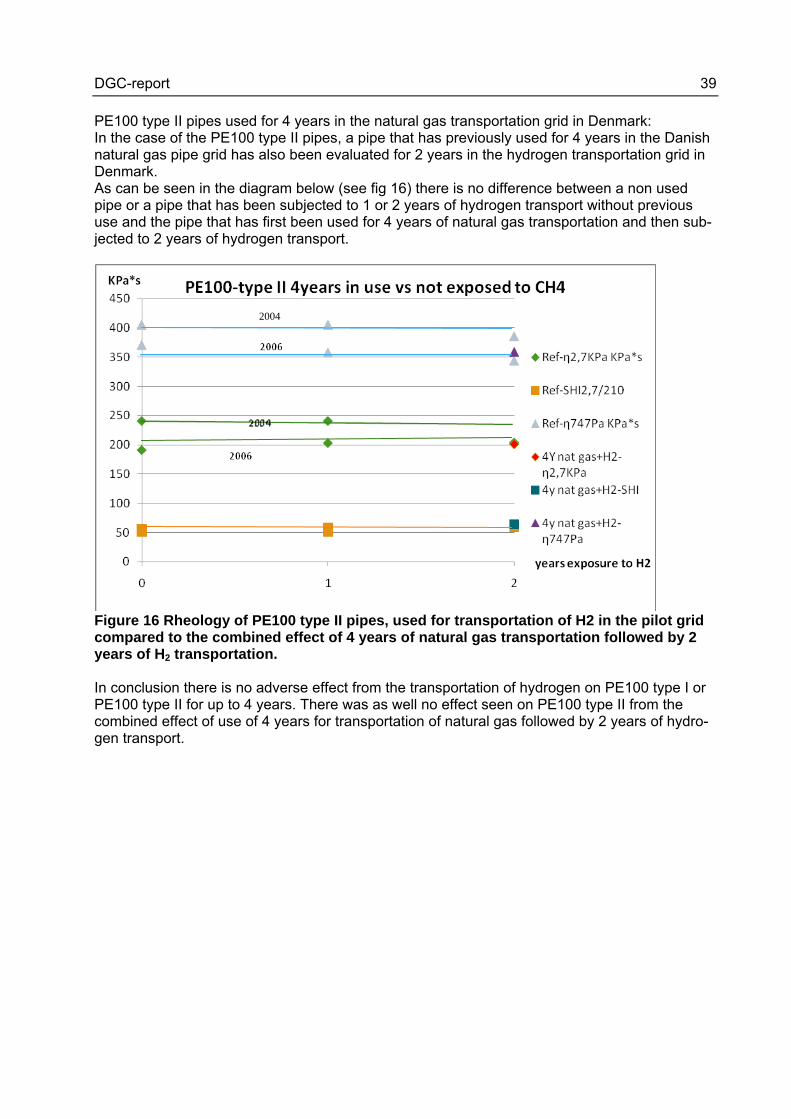
PE100 type II pipes used for 4 years in the natural gas transportation grid in Denmark: In the case of the PE100 type II pipes, a pipe that has previously used for 4 years in the Danish natural gas pipe grid has also been evaluated for 2 years in the hydrogen transportation grid in Denmark. As can be seen in the diagram below (see fig 16) there is no difference between a non used pipe or a pipe that has been subjected to 1 or 2 years of hydrogen transport without previous use and the pipe that has first been used for 4 years of natural gas transportation and then sub-jected to 2 years of hydrogen transport.
Figure 16 Rheology of PE100 type II pipes, used for transportation of H2 in the pilot grid compared to the combined effect of 4 years of natural gas transportation followed by 2 years of H2 transportation. In conclusion there is no adverse effect from the transportation of hydrogen on PE100 type I or PE100 type II for up to 4 years. There was as well no effect seen on PE100 type II from the combined effect of use of 4 years for transportation of natural gas followed by 2 years of hydro-gen transport.
2004
DGC-report 40
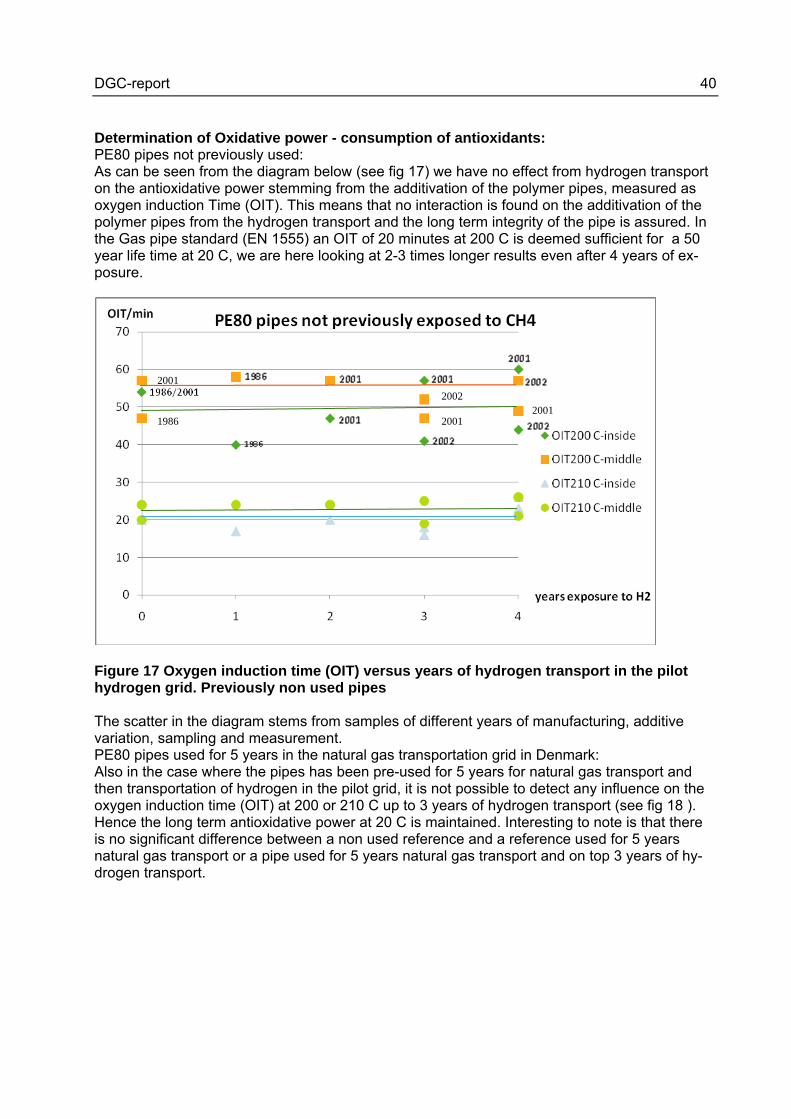
Determination of Oxidative power - consumption of antioxidants: PE80 pipes not previously used: As can be seen from the diagram below (see fig 17) we have no effect from hydrogen transport on the antioxidative power stemming from the additivation of the polymer pipes, measured as oxygen induction Time (OIT). This means that no interaction is found on the additivation of the polymer pipes from the hydrogen transport and the long term integrity of the pipe is assured. In the Gas pipe standard (EN 1555) an OIT of 20 minutes at 200 C is deemed sufficient for a 50 year life time at 20 C, we are here looking at 2-3 times longer results even after 4 years of ex-posure.
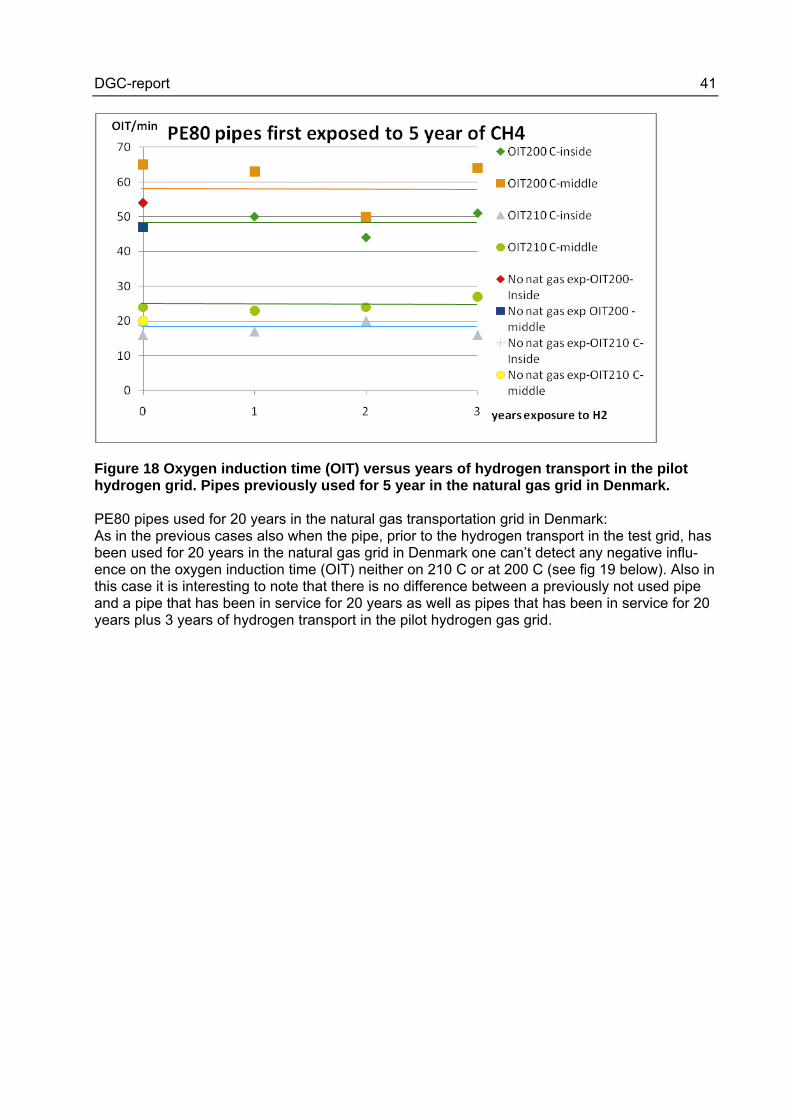
Figure 17 Oxygen induction time (OIT) versus years of hydrogen transport in the pilot hydrogen grid. Previously non used pipes The scatter in the diagram stems from samples of different years of manufacturing, additive variation, sampling and measurement. PE80 pipes used for 5 years in the natural gas transportation grid in Denmark: Also in the case where the pipes has been pre-used for 5 years for natural gas transport and then transportation of hydrogen in the pilot grid, it is not possible to detect any influence on the oxygen induction time (OIT) at 200 or 210 C up to 3 years of hydrogen transport (see fig 18 ). Hence the long term antioxidative power at 20 C is maintained. Interesting to note is that there is no significant difference between a non used reference and a reference used for 5 years natural gas transport or a pipe used for 5 years natural gas transport and on top 3 years of hy-drogen transport.
1986
2001
2001
20022001
DGC-report 41
Figure 18 Oxygen induction time (OIT) versus years of hydrogen transport in the pilot hydrogen grid. Pipes previously used for 5 year in the natural gas grid in Denmark. PE80 pipes used for 20 years in the natural gas transportation grid in Denmark: As in the previous cases also when the pipe, prior to the hydrogen transport in the test grid, has been used for 20 years in the natural gas grid in Denmark one can’t detect any negative influ-ence on the oxygen induction time (OIT) neither on 210 C or at 200 C (see fig 19 below). Also in this case it is interesting to note that there is no difference between a previously not used pipe and a pipe that has been in service for 20 years as well as pipes that has been in service for 20 years plus 3 years of hydrogen transport in the pilot hydrogen gas grid.
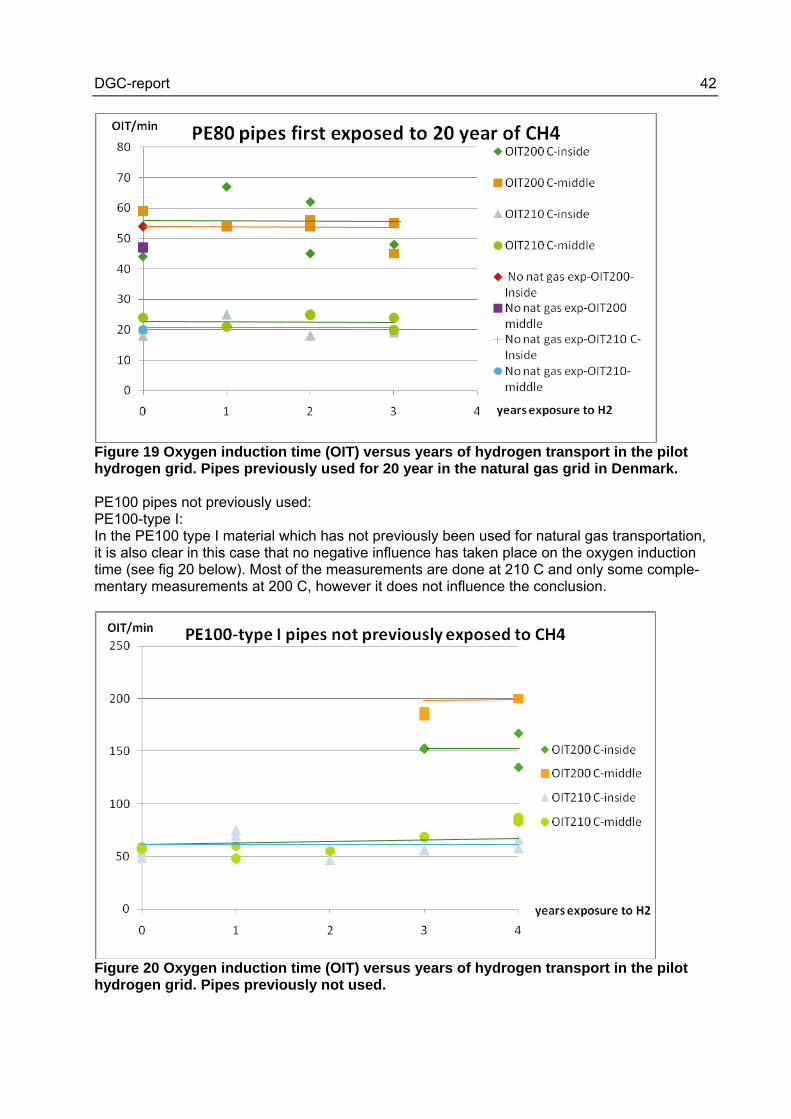
DGC-report 42
Figure 19 Oxygen induction time (OIT) versus years of hydrogen transport in the pilot hydrogen grid. Pipes previously used for 20 year in the natural gas grid in Denmark. PE100 pipes not previously used: PE100-type I: In the PE100 type I material which has not previously been used for natural gas transportation, it is also clear in this case that no negative influence has taken place on the oxygen induction time (see fig 20 below). Most of the measurements are done at 210 C and only some comple-mentary measurements at 200 C, however it does not influence the conclusion.
Figure 20 Oxygen induction time (OIT) versus years of hydrogen transport in the pilot hydrogen grid. Pipes previously not used.
DGC-report 43
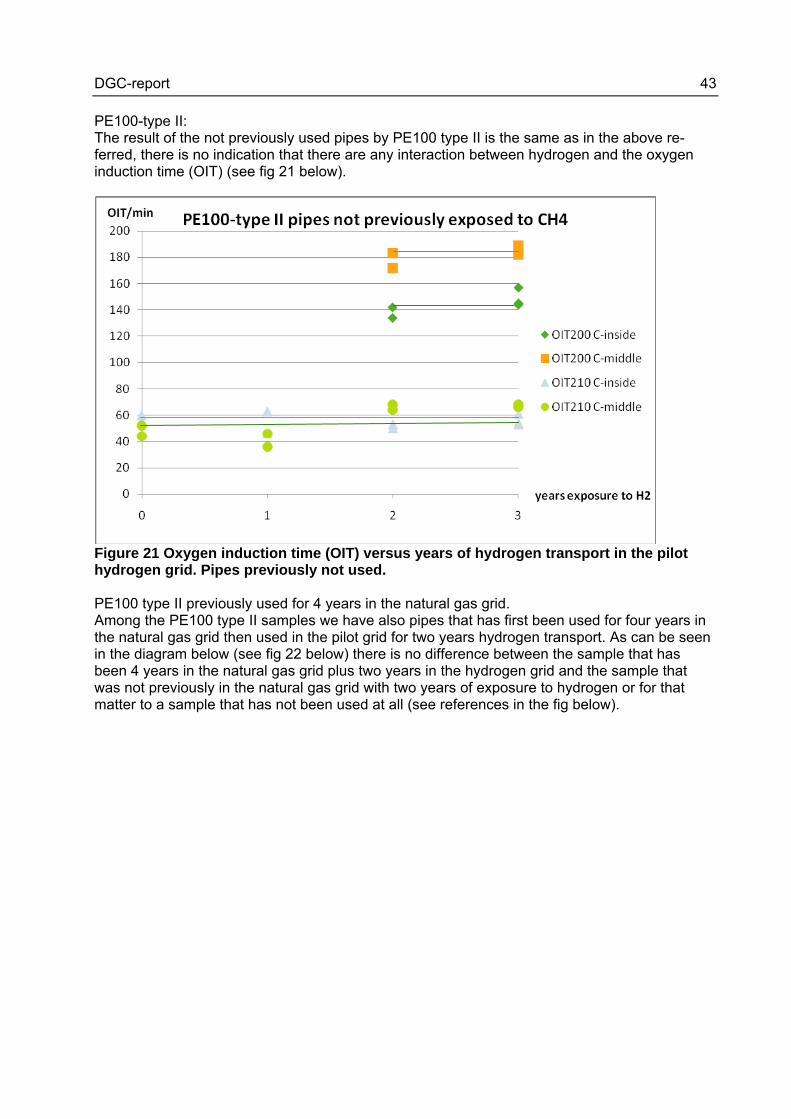
PE100-type II: The result of the not previously used pipes by PE100 type II is the same as in the above re-ferred, there is no indication that there are any interaction between hydrogen and the oxygen induction time (OIT) (see fig 21 below).
Figure 21 Oxygen induction time (OIT) versus years of hydrogen transport in the pilot hydrogen grid. Pipes previously not used. PE100 type II previously used for 4 years in the natural gas grid. Among the PE100 type II samples we have also pipes that has first been used for four years in the natural gas grid then used in the pilot grid for two years hydrogen transport. As can be seen in the diagram below (see fig 22 below) there is no difference between the sample that has been 4 years in the natural gas grid plus two years in the hydrogen grid and the sample that was not previously in the natural gas grid with two years of exposure to hydrogen or for that matter to a sample that has not been used at all (see references in the fig below).
DGC-report 44
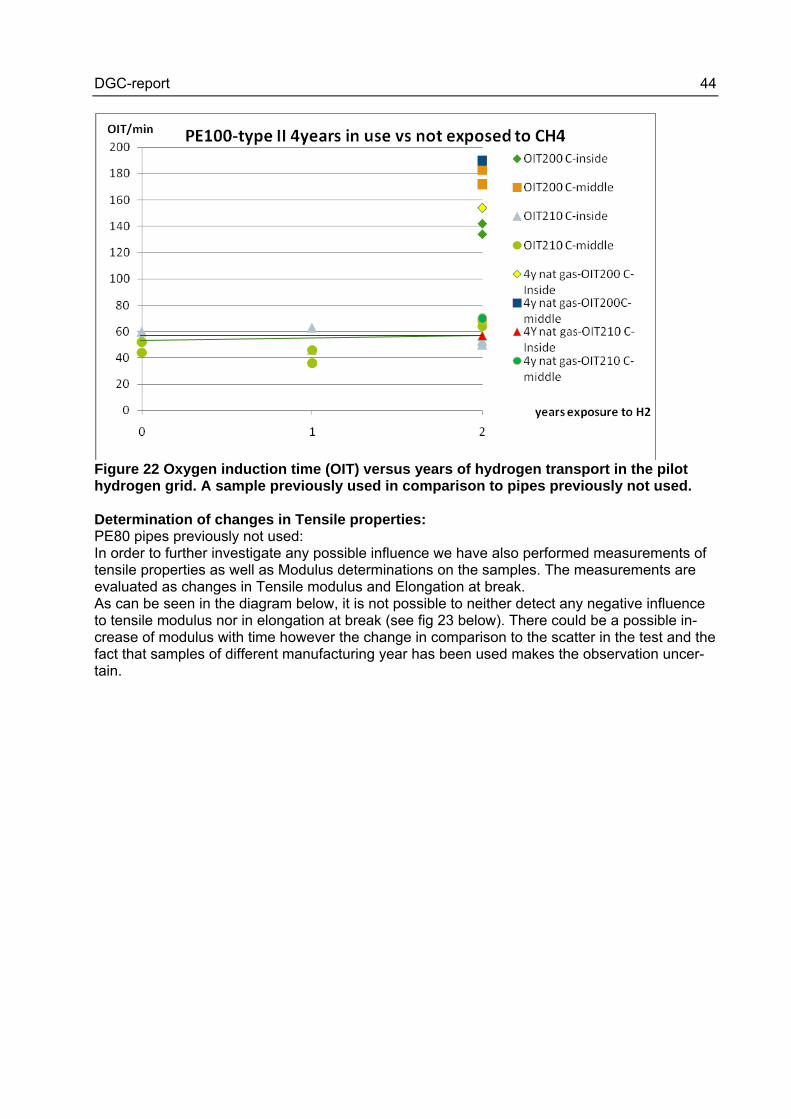
Figure 22 Oxygen induction time (OIT) versus years of hydrogen transport in the pilot hydrogen grid. A sample previously used in comparison to pipes previously not used. Determination of changes in Tensile properties: PE80 pipes previously not used: In order to further investigate any possible influence we have also performed measurements of tensile properties as well as Modulus determinations on the samples. The measurements are evaluated as changes in Tensile modulus and Elongation at break. As can be seen in the diagram below, it is not possible to neither detect any negative influence to tensile modulus nor in elongation at break (see fig 23 below). There could be a possible in-crease of modulus with time however the change in comparison to the scatter in the test and the fact that samples of different manufacturing year has been used makes the observation uncer-tain.
DGC-report 45
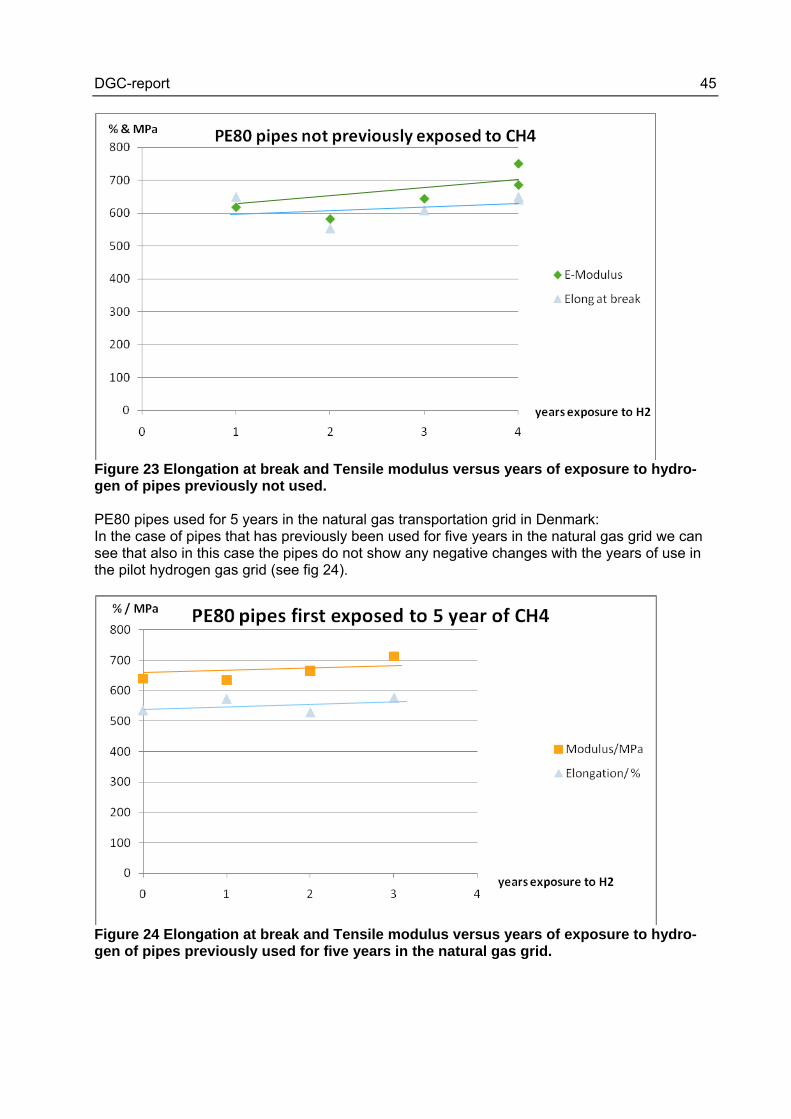
Figure 23 Elongation at break and Tensile modulus versus years of exposure to hydro-gen of pipes previously not used. PE80 pipes used for 5 years in the natural gas transportation grid in Denmark: In the case of pipes that has previously been used for five years in the natural gas grid we can see that also in this case the pipes do not show any negative changes with the years of use in the pilot hydrogen gas grid (see fig 24).
Figure 24 Elongation at break and Tensile modulus versus years of exposure to hydro-gen of pipes previously used for five years in the natural gas grid.
DGC-report 46
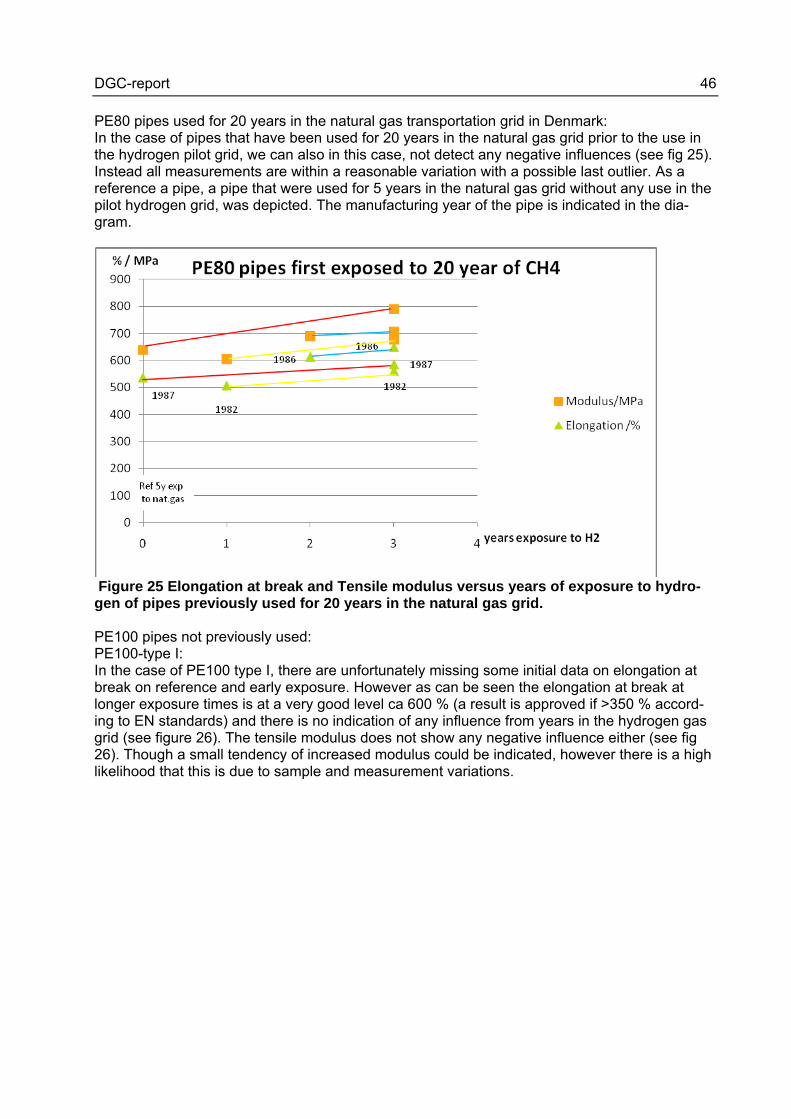
PE80 pipes used for 20 years in the natural gas transportation grid in Denmark: In the case of pipes that have been used for 20 years in the natural gas grid prior to the use in the hydrogen pilot grid, we can also in this case, not detect any negative influences (see fig 25). Instead all measurements are within a reasonable variation with a possible last outlier. As a reference a pipe, a pipe that were used for 5 years in the natural gas grid without any use in the pilot hydrogen grid, was depicted. The manufacturing year of the pipe is indicated in the dia-gram.
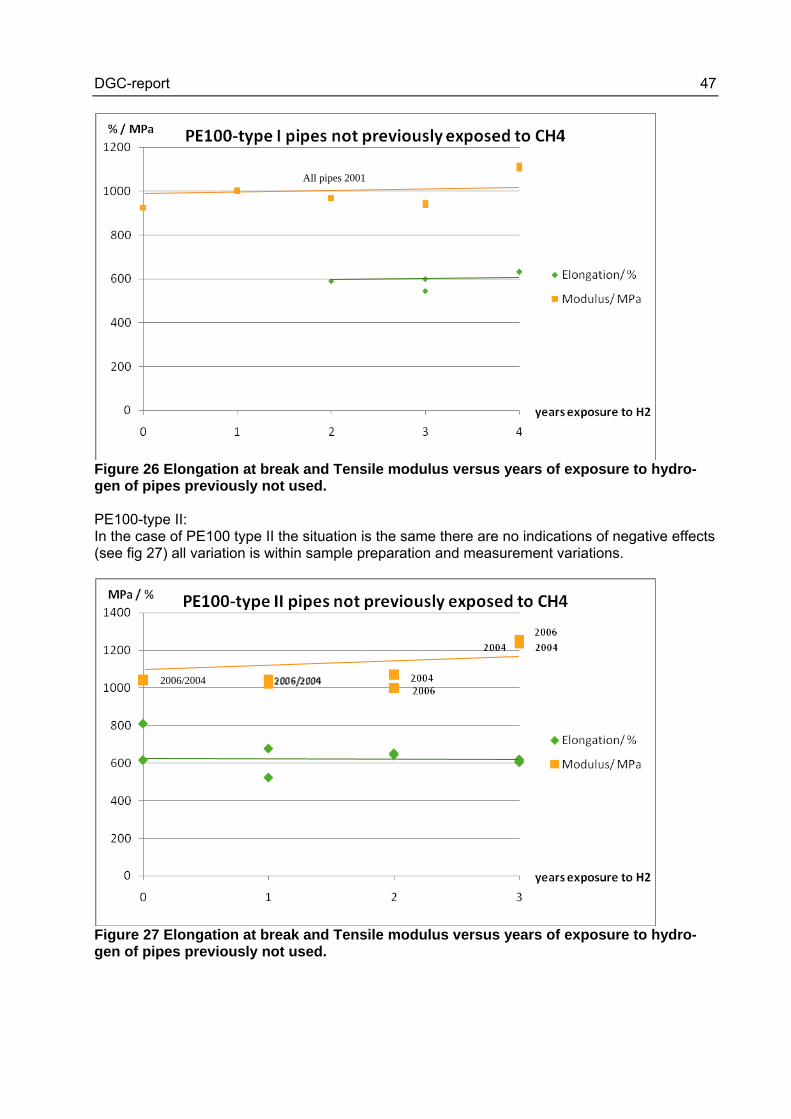
Figure 25 Elongation at break and Tensile modulus versus years of exposure to hydro-gen of pipes previously used for 20 years in the natural gas grid. PE100 pipes not previously used: PE100-type I: In the case of PE100 type I, there are unfortunately missing some initial data on elongation at break on reference and early exposure. However as can be seen the elongation at break at longer exposure times is at a very good level ca 600 % (a result is approved if >350 % accord-ing to EN standards) and there is no indication of any influence from years in the hydrogen gas grid (see figure 26). The tensile modulus does not show any negative influence either (see fig 26). Though a small tendency of increased modulus could be indicated, however there is a high likelihood that this is due to sample and measurement variations.
DGC-report 47
Figure 26 Elongation at break and Tensile modulus versus years of exposure to hydro-gen of pipes previously not used. PE100-type II: In the case of PE100 type II the situation is the same there are no indications of negative effects (see fig 27) all variation is within sample preparation and measurement variations.
Figure 27 Elongation at break and Tensile modulus versus years of exposure to hydro-gen of pipes previously not used.
All pipes 2001
2006/2004
DGC-report 48
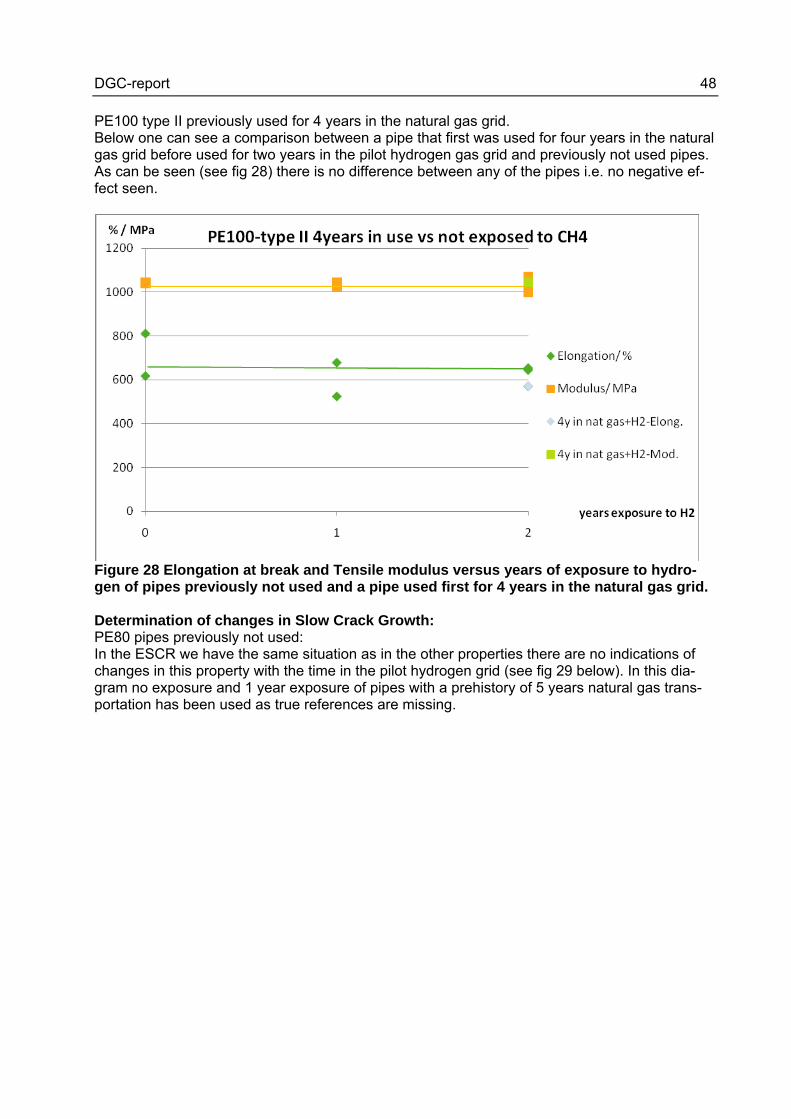
PE100 type II previously used for 4 years in the natural gas grid. Below one can see a comparison between a pipe that first was used for four years in the natural gas grid before used for two years in the pilot hydrogen gas grid and previously not used pipes. As can be seen (see fig 28) there is no difference between any of the pipes i.e. no negative ef-fect seen.
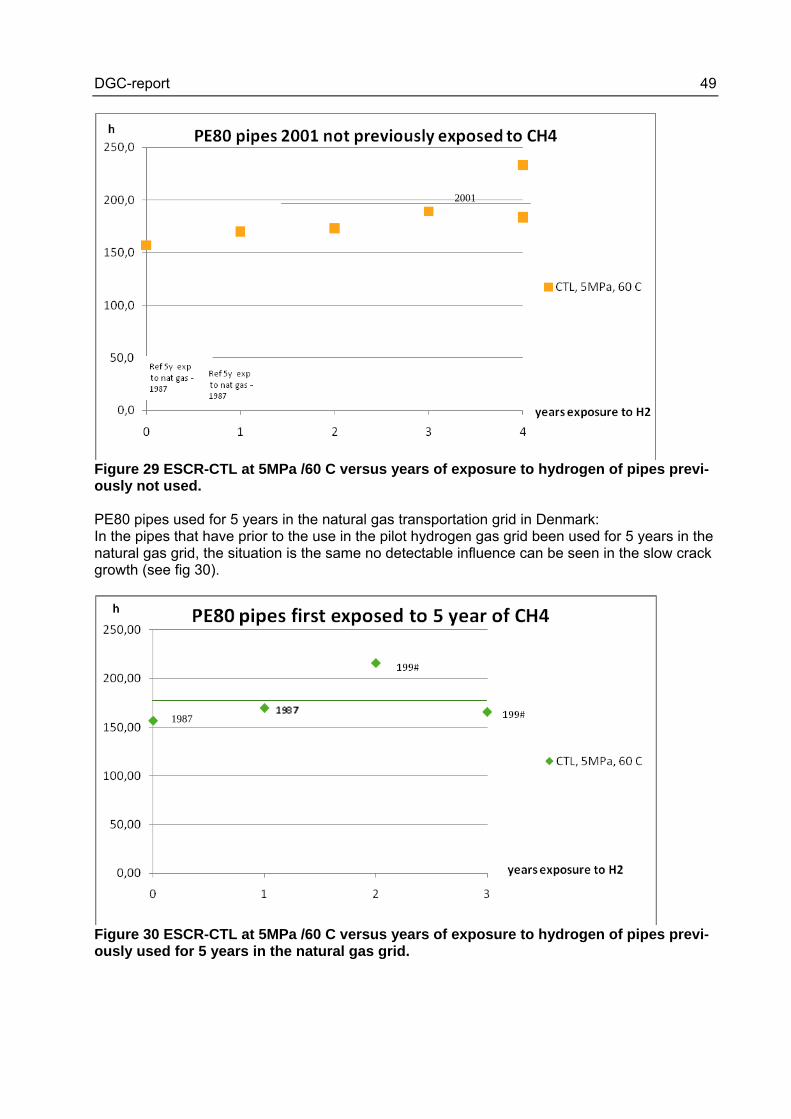
Figure 28 Elongation at break and Tensile modulus versus years of exposure to hydro-gen of pipes previously not used and a pipe used first for 4 years in the natural gas grid. Determination of changes in Slow Crack Growth: PE80 pipes previously not used: In the ESCR we have the same situation as in the other properties there are no indications of changes in this property with the time in the pilot hydrogen grid (see fig 29 below). In this dia-gram no exposure and 1 year exposure of pipes with a prehistory of 5 years natural gas trans-portation has been used as true references are missing.
DGC-report 49
Figure 29 ESCR-CTL at 5MPa /60 C versus years of exposure to hydrogen of pipes previ-ously not used. PE80 pipes used for 5 years in the natural gas transportation grid in Denmark: In the pipes that have prior to the use in the pilot hydrogen gas grid been used for 5 years in the natural gas grid, the situation is the same no detectable influence can be seen in the slow crack growth (see fig 30).
Figure 30 ESCR-CTL at 5MPa /60 C versus years of exposure to hydrogen of pipes previ-ously used for 5 years in the natural gas grid.
2001
1987
DGC-report 50
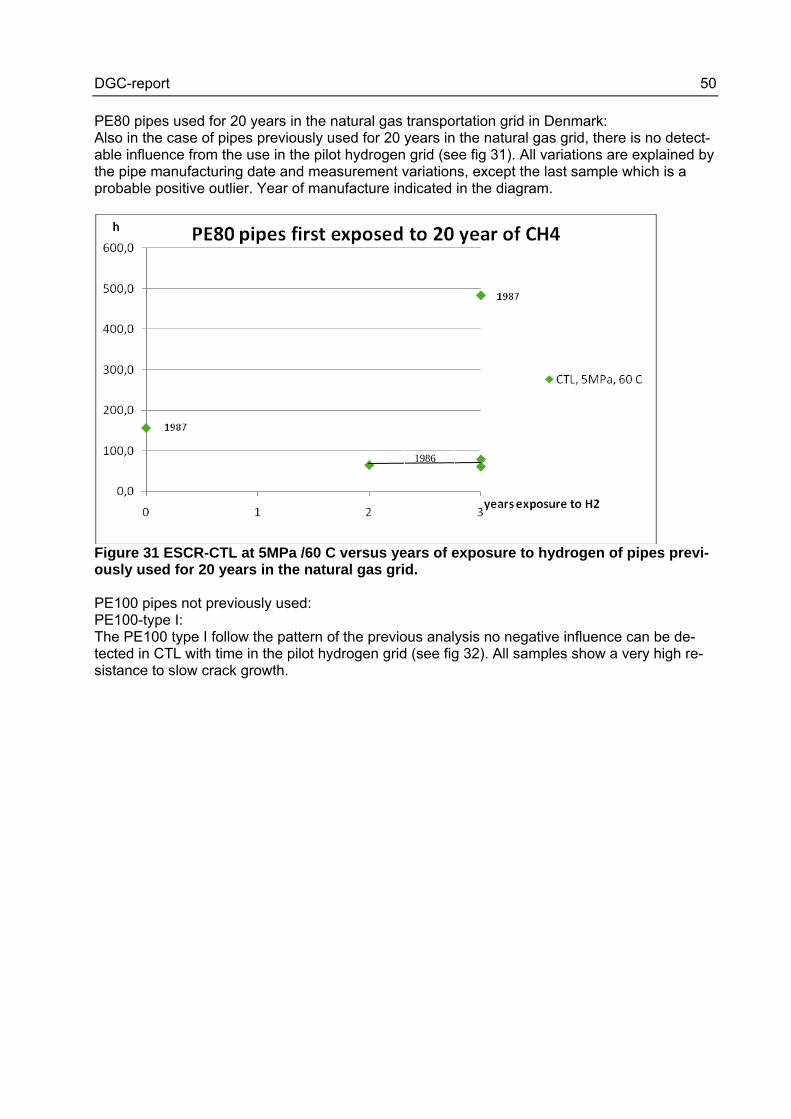
PE80 pipes used for 20 years in the natural gas transportation grid in Denmark: Also in the case of pipes previously used for 20 years in the natural gas grid, there is no detect-able influence from the use in the pilot hydrogen grid (see fig 31). All variations are explained by the pipe manufacturing date and measurement variations, except the last sample which is a probable positive outlier. Year of manufacture indicated in the diagram.
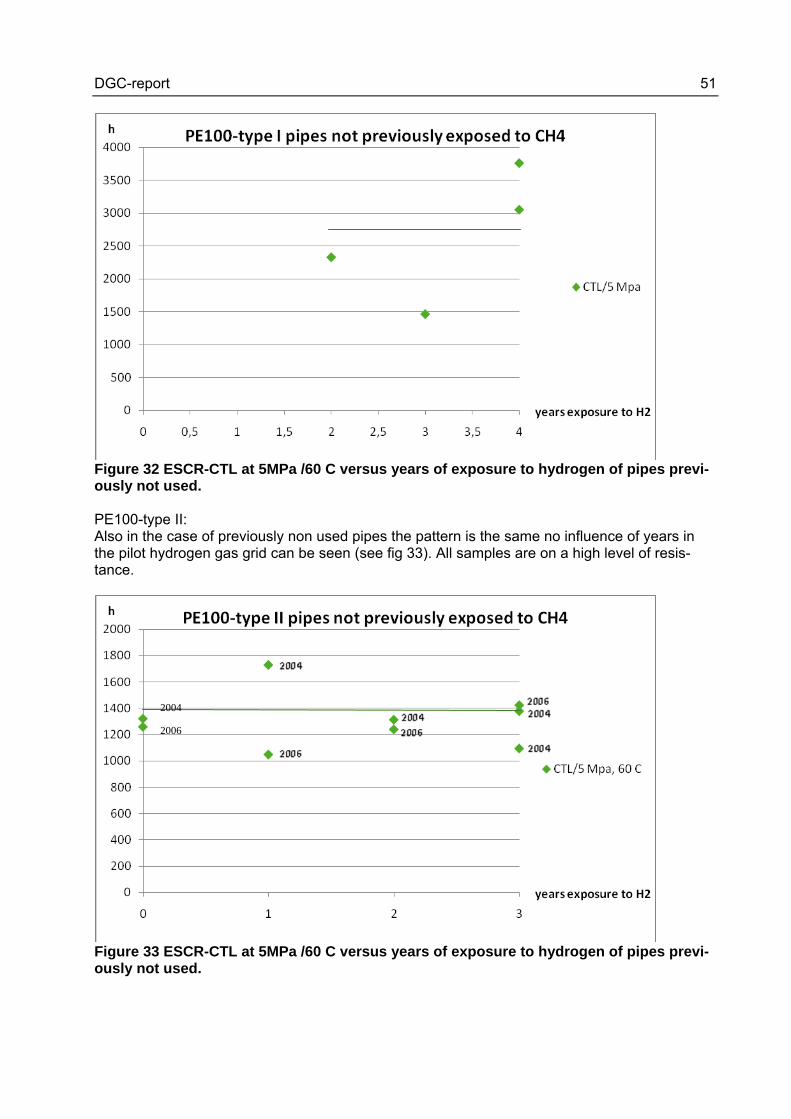
Figure 31 ESCR-CTL at 5MPa /60 C versus years of exposure to hydrogen of pipes previ-ously used for 20 years in the natural gas grid. PE100 pipes not previously used: PE100-type I: The PE100 type I follow the pattern of the previous analysis no negative influence can be de-tected in CTL with time in the pilot hydrogen grid (see fig 32). All samples show a very high re-sistance to slow crack growth.
1986
DGC-report 51
Figure 32 ESCR-CTL at 5MPa /60 C versus years of exposure to hydrogen of pipes previ-ously not used. PE100-type II: Also in the case of previously non used pipes the pattern is the same no influence of years in the pilot hydrogen gas grid can be seen (see fig 33). All samples are on a high level of resis-tance.
Figure 33 ESCR-CTL at 5MPa /60 C versus years of exposure to hydrogen of pipes previ-ously not used.
2006
2004

DGC-report 52
PE100 type II previously used for 4 years in the natural gas grid. In the case of PE100 type we have also a pipe that before 2 years of use in the pilot hydrogen gas grid, have been used for 4 years in the natural gas grid. This pipe is depicted in comparison to pipes not previously used in the natural gas grid with different exposure time in the pilot hy-drogen grid (see fig 34). As can be seen (fig 34) no difference between a pipe that has not been used (see references) and pipes not used in the natural gas grid but different no of years in the pilot grid and the pipe that first was 4 years in the natural gas grid and then exposed for two years in the pilot hydrogen grid, can be detected.
Figure 34 ESCR-CTL at 5MPa /60 C versus years of exposure to hydrogen of pipes previ-ously not used and a pipe used first for 4 years in the natural gas grid. Surface oxidation of pipe samples: All samples were analysed for surface oxidation but no surface oxidation was found.
DGC-report 53
Report on surface oxidation of the first round of test 2004 (Borealis) MEMO
To Mats Bäckman
From Ann-Christin Augustsson
Date 06.09.2004
Total pages 3 (including this)
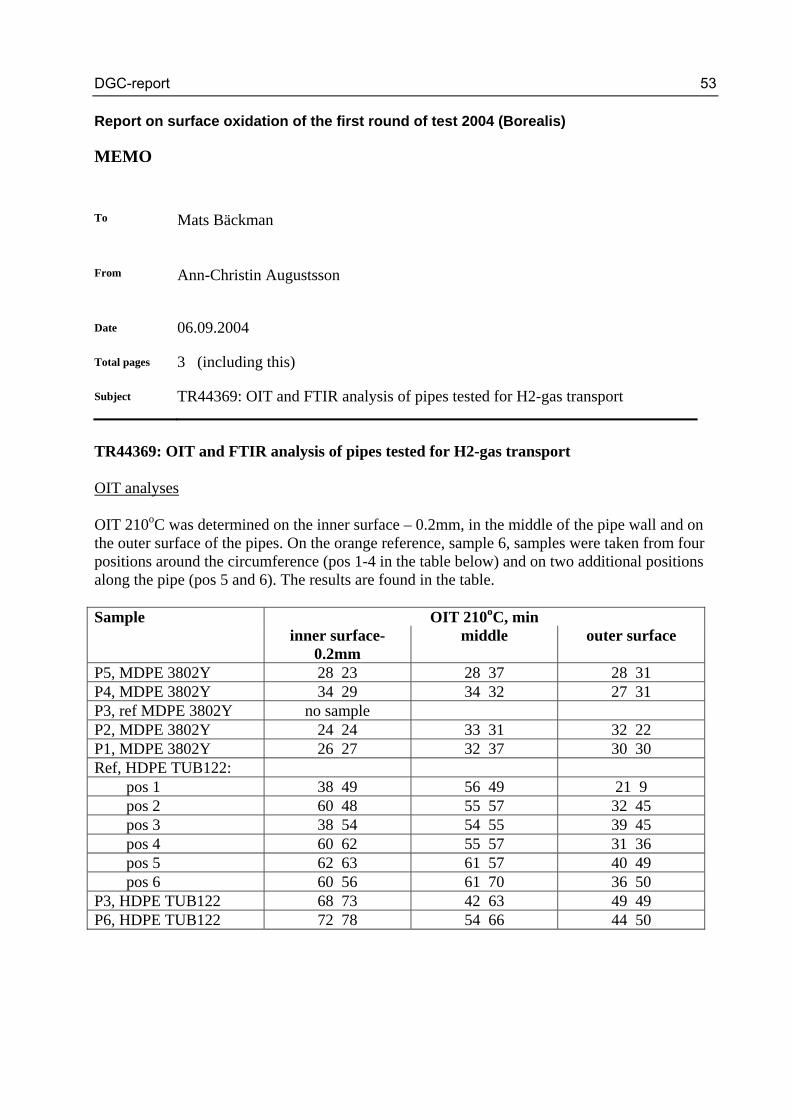
Subject TR44369: OIT and FTIR analysis of pipes tested for H2-gas transport TR44369: OIT and FTIR analysis of pipes tested for H2-gas transport OIT analyses OIT 210oC was determined on the inner surface – 0.2mm, in the middle of the pipe wall and on the outer surface of the pipes. On the orange reference, sample 6, samples were taken from four positions around the circumference (pos 1-4 in the table below) and on two additional positions along the pipe (pos 5 and 6). The results are found in the table. Sample OIT 210oC, min inner surface-
0.2mm middle outer surface
P5, MDPE 3802Y 28 23 28 37 28 31 P4, MDPE 3802Y 34 29 34 32 27 31 P3, ref MDPE 3802Y no sample P2, MDPE 3802Y 24 24 33 31 32 22 P1, MDPE 3802Y 26 27 32 37 30 30 Ref, HDPE TUB122: pos 1 38 49 56 49 21 9 pos 2 60 48 55 57 32 45 pos 3 38 54 54 55 39 45 pos 4 60 62 55 57 31 36 pos 5 62 63 61 57 40 49 pos 6 60 56 61 70 36 50 P3, HDPE TUB122 68 73 42 63 49 49 P6, HDPE TUB122 72 78 54 66 44 50
DGC-report 54
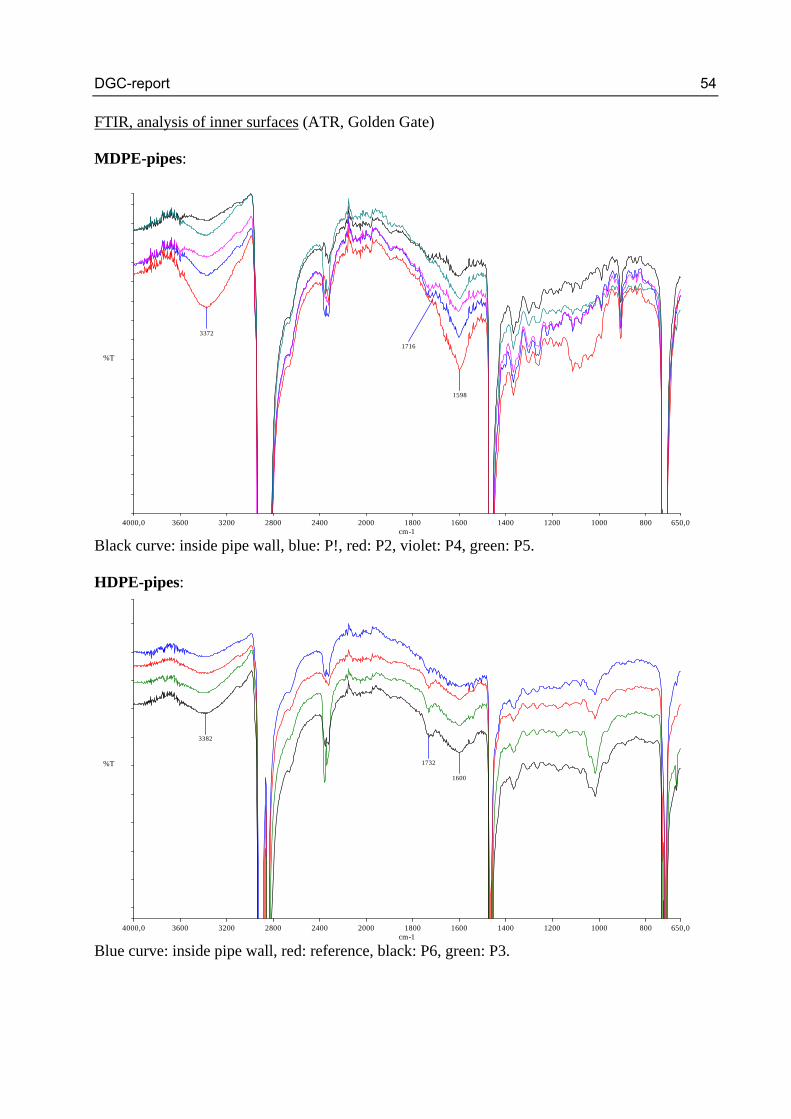
FTIR, analysis of inner surfaces (ATR, Golden Gate) MDPE-pipes:
4000,0 3600 3200 2800 2400 2000 1800 1600 1400 1200 1000 800 650,0cm-1
%T
1598
1716
3372
Black curve: inside pipe wall, blue: P!, red: P2, violet: P4, green: P5. HDPE-pipes:
4000,0 3600 3200 2800 2400 2000 1800 1600 1400 1200 1000 800 650,0cm-1
%T 1732
1600
3382
Blue curve: inside pipe wall, red: reference, black: P6, green: P3.

DGC-report 55
Weak carbonyl groups were observed on the orange HDPE pipes. The wavenumber (1732cm-1) indicates that the carbonyls derive from stabilisers and/or pigments. Significant surface oxidation was not detected on any of the pipes.
DGC-report 56
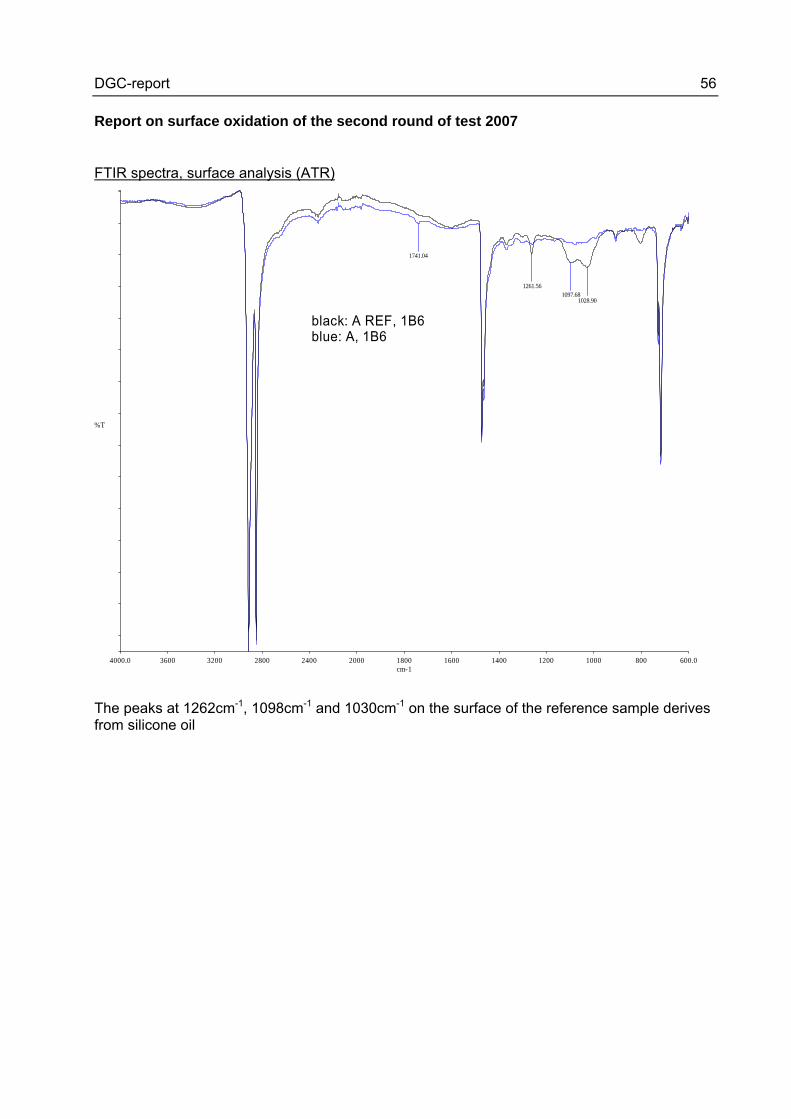
Report on surface oxidation of the second round of test 2007 FTIR spectra, surface analysis (ATR)
4000.0 3600 3200 2800 2400 2000 1800 1600 1400 1200 1000 800 600.0cm-1
%T
black: A REF, 1B6blue: A, 1B6
1741.04
1261.561097.68
1028.90
The peaks at 1262cm-1, 1098cm-1 and 1030cm-1 on the surface of the reference sample derives from silicone oil
DGC-report 57
4000.0 3600 3200 2800 2400 2000 1800 1600 1400 1200 1000 800 600.0cm-1
%T
black: B REF, 1B3blue: B 1B3
1261.561261.56
1030.92
1081.50
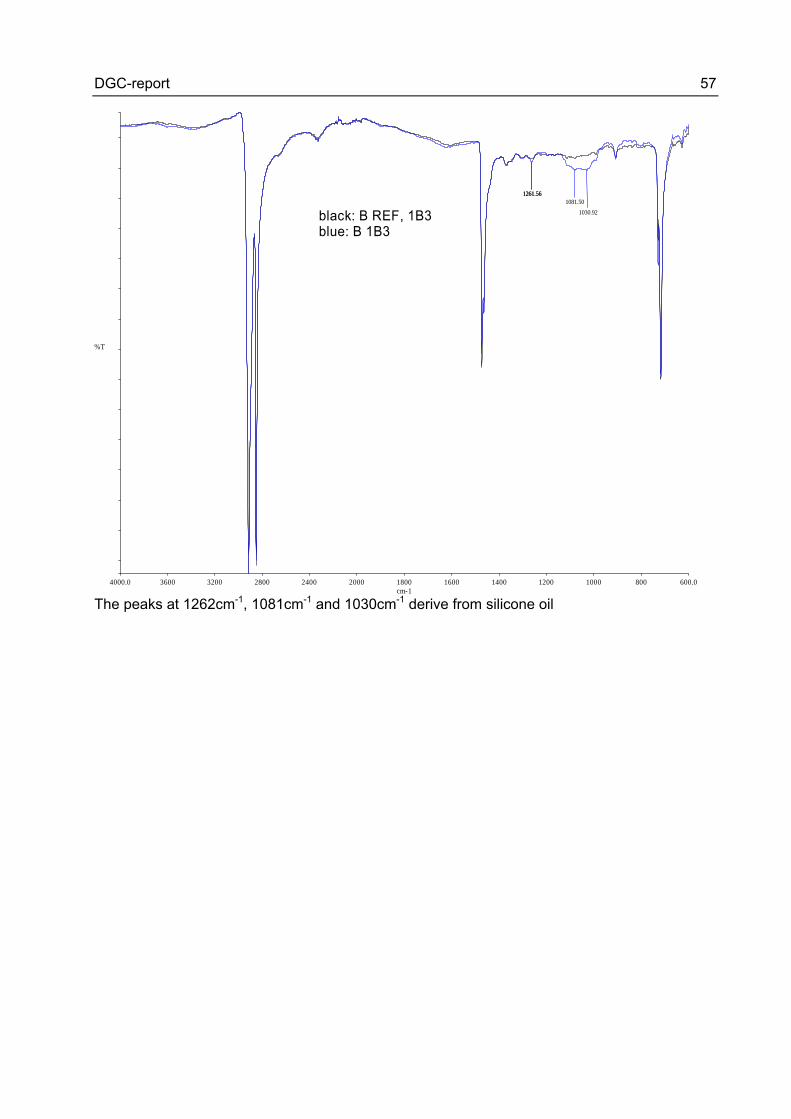
The peaks at 1262cm-1, 1081cm-1 and 1030cm-1 derive from silicone oil
DGC-report 58
4000.0 3600 3200 2800 2400 2000 1800 1600 1400 1200 1000 800 600.0cm-1
%T
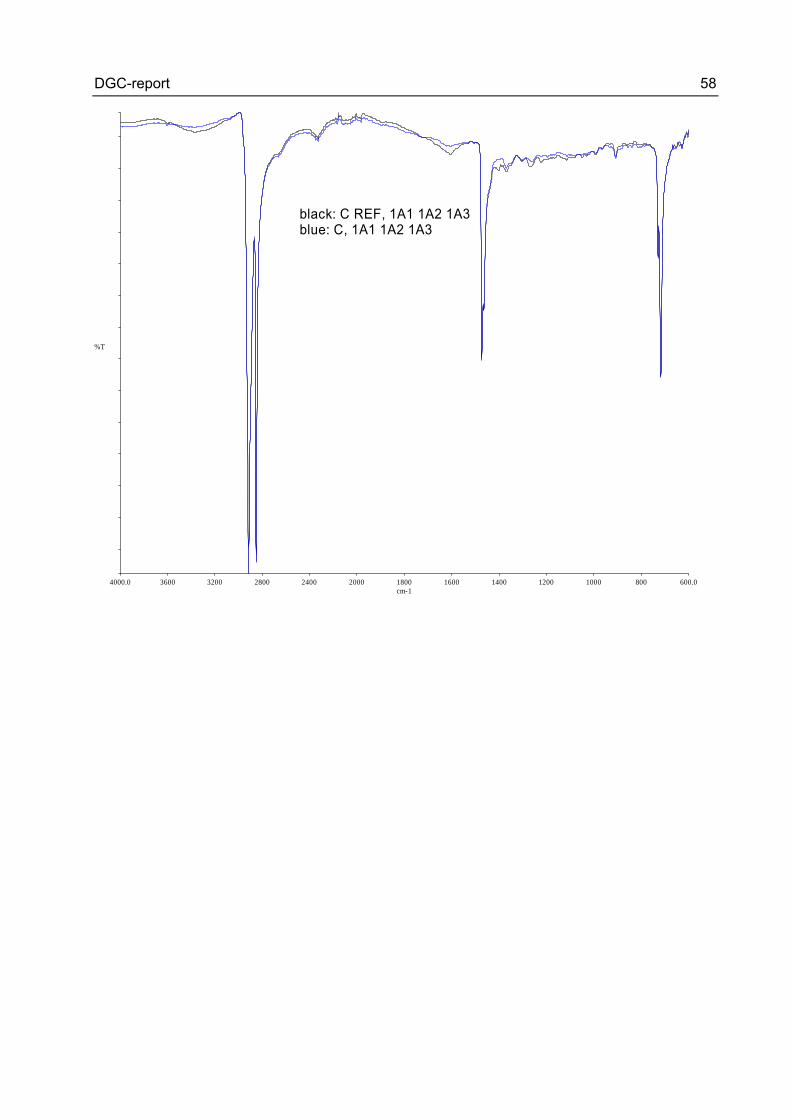
black: C REF, 1A1 1A2 1A3blue: C, 1A1 1A2 1A3
DGC-report 59
4000.0 3600 3200 2800 2400 2000 1800 1600 1400 1200 1000 800 600.0
27.6
30
35
40
45
50
55
60
65
70
75
80
85
90
92.4
cm-1
%T
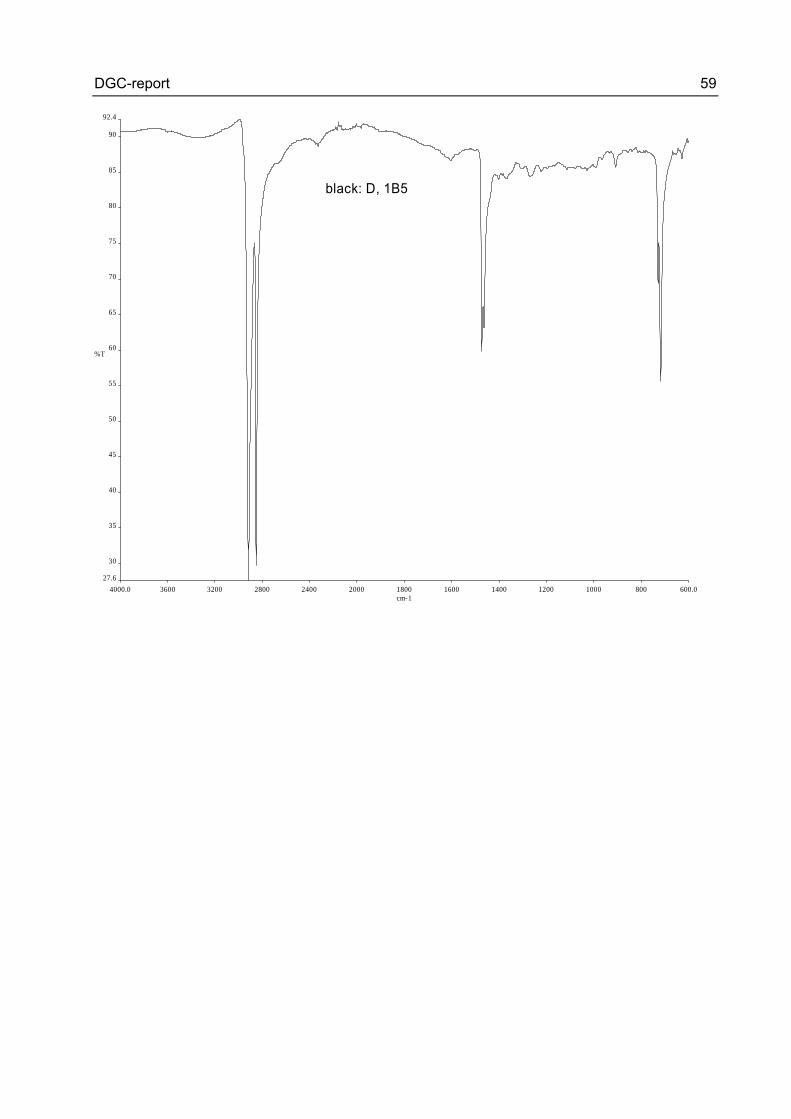
black: D, 1B5
DGC-report 60
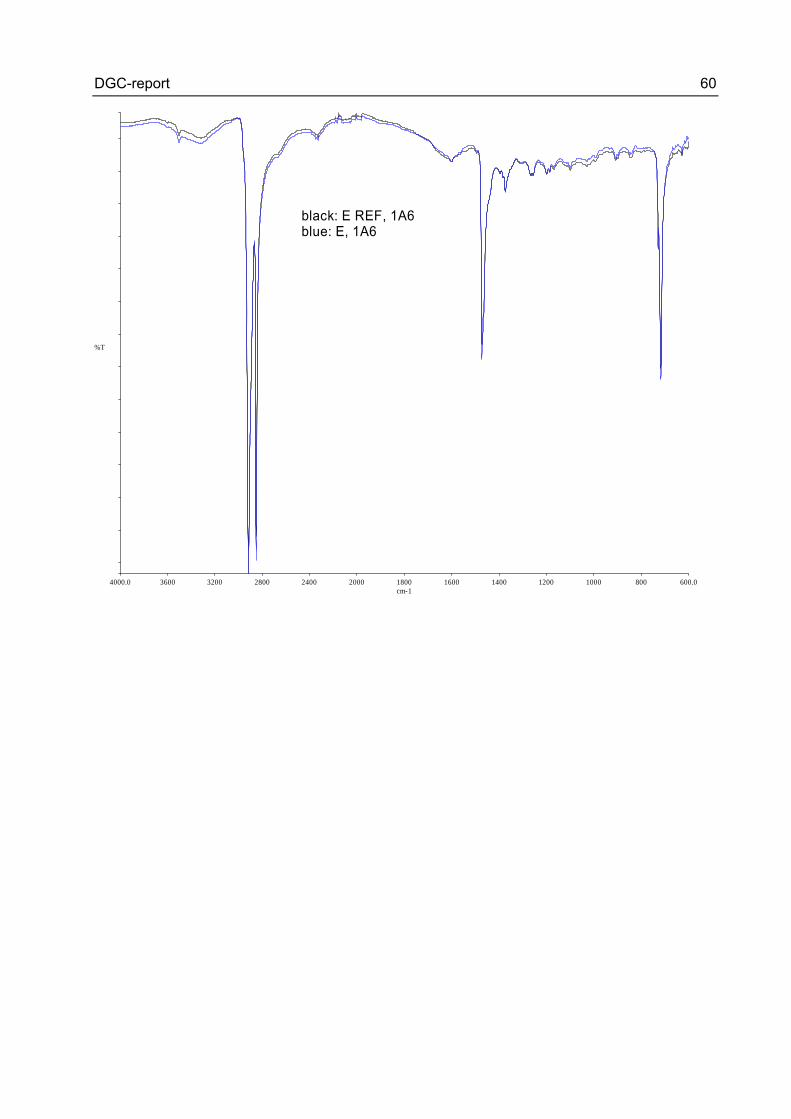
4000.0 3600 3200 2800 2400 2000 1800 1600 1400 1200 1000 800 600.0cm-1
%T
black: E REF, 1A6blue: E, 1A6
DGC-report 61
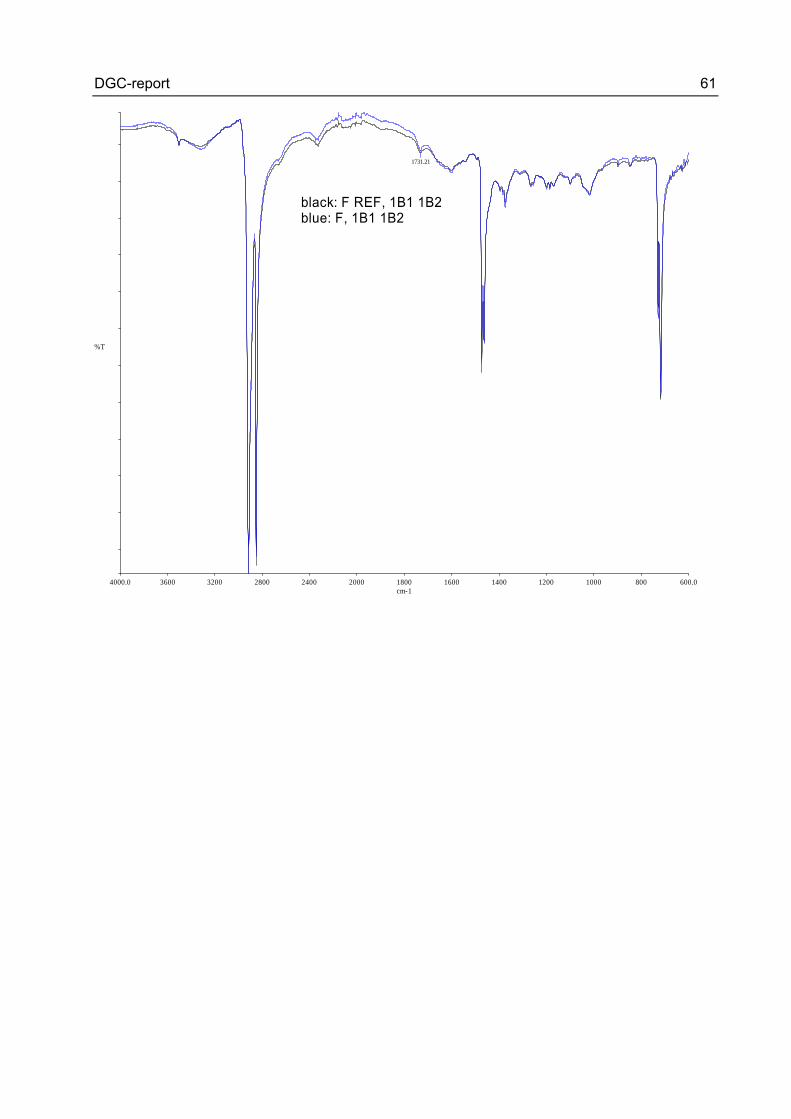
4000.0 3600 3200 2800 2400 2000 1800 1600 1400 1200 1000 800 600.0cm-1
%T
black: F REF, 1B1 1B2blue: F, 1B1 1B2
1731.21
DGC-report 62
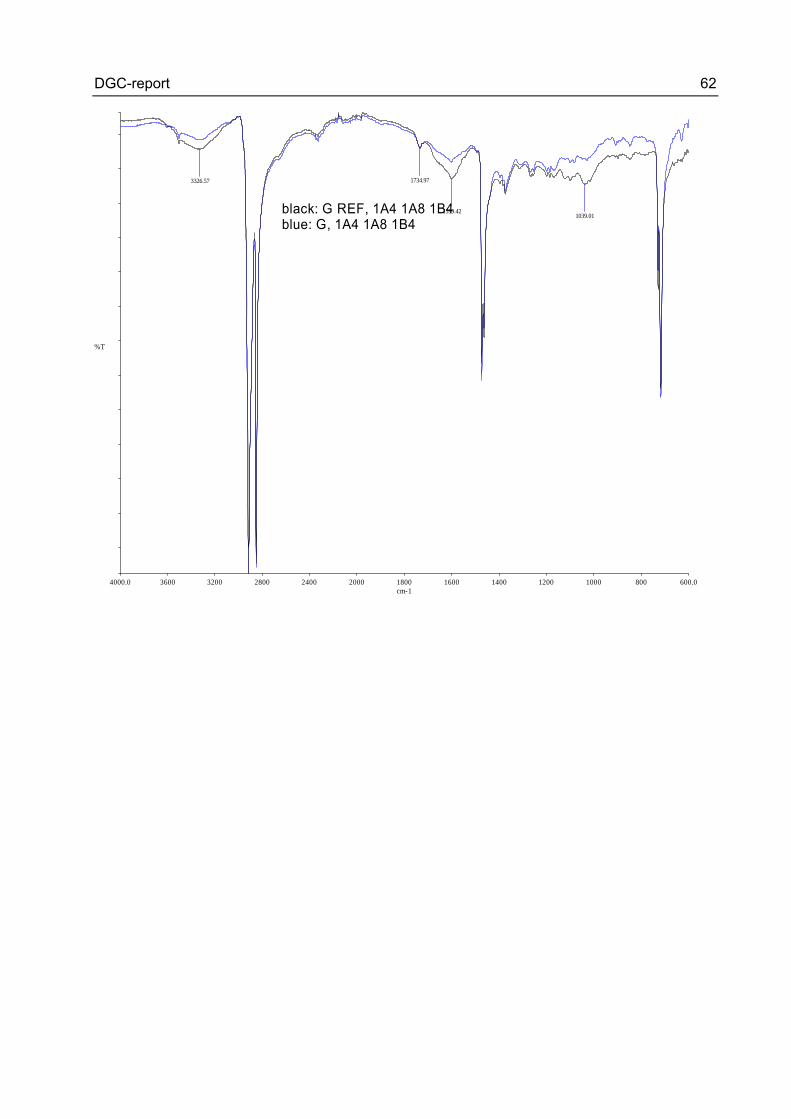
4000.0 3600 3200 2800 2400 2000 1800 1600 1400 1200 1000 800 600.0cm-1
%T
black: G REF, 1A4 1A8 1B4blue: G, 1A4 1A8 1B4
1734.97
1599.421039.01
3326.57
DGC-report 63
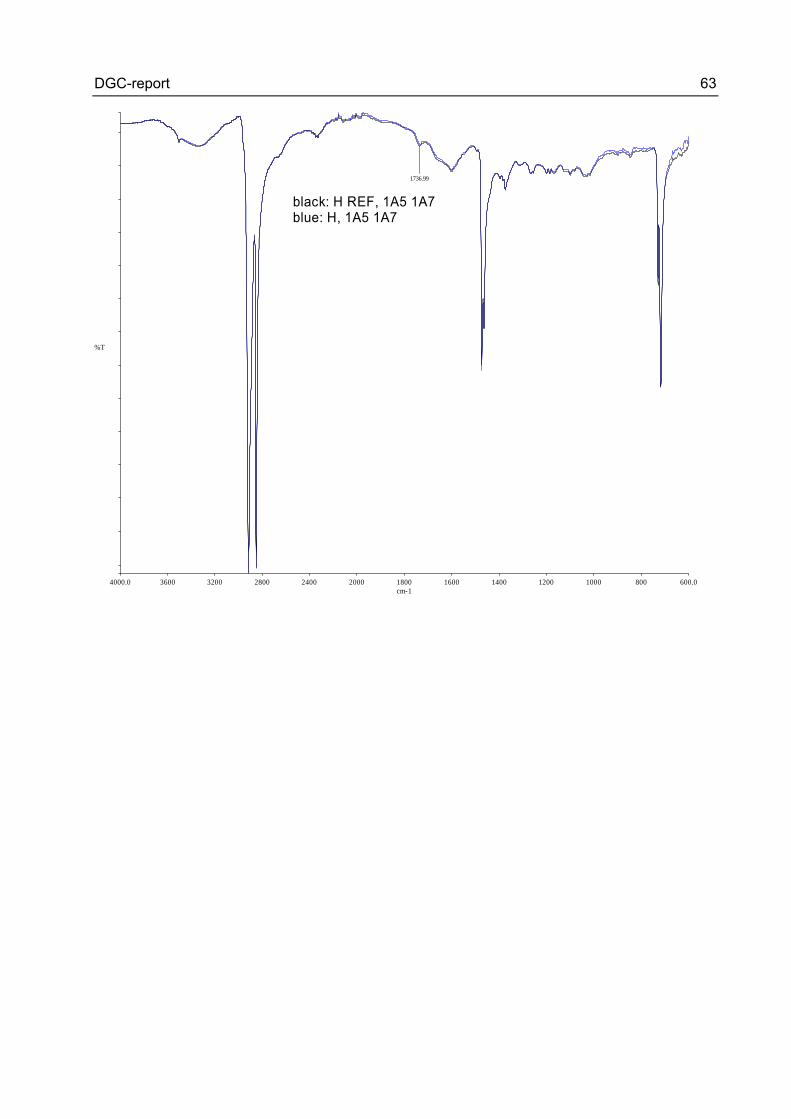
4000.0 3600 3200 2800 2400 2000 1800 1600 1400 1200 1000 800 600.0cm-1
%T
black: H REF, 1A5 1A7blue: H, 1A5 1A7
1736.99
DGC-report 64
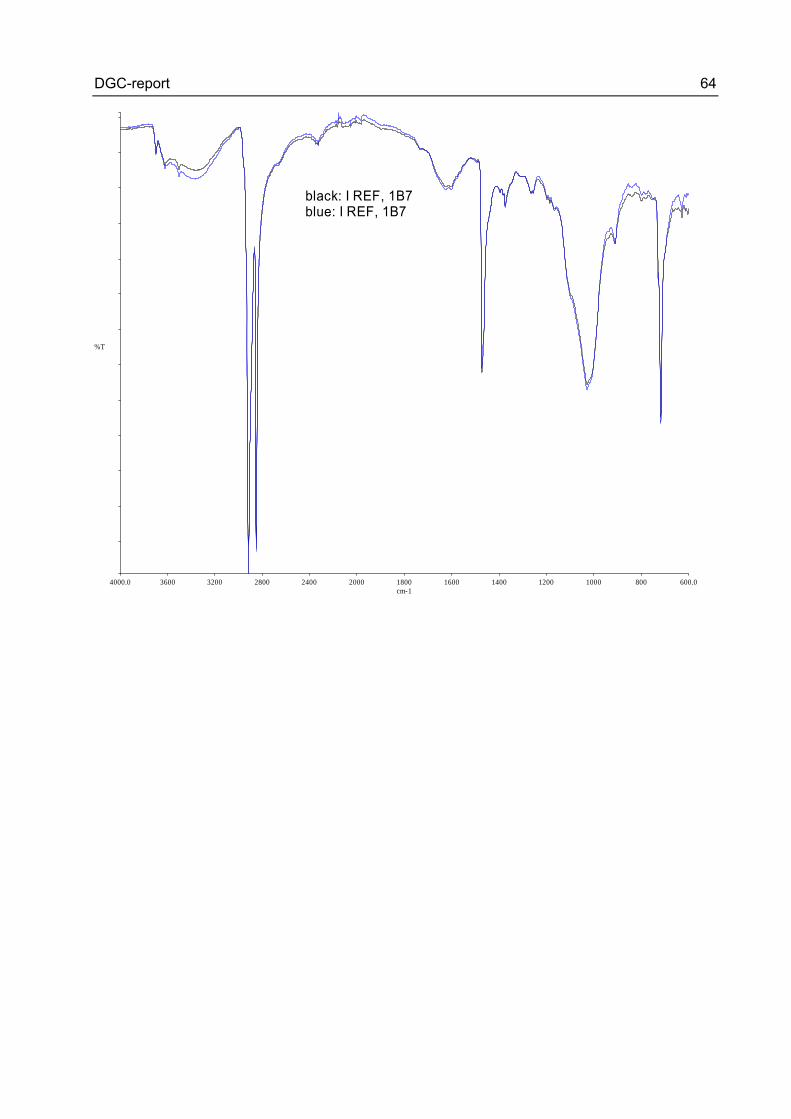
4000.0 3600 3200 2800 2400 2000 1800 1600 1400 1200 1000 800 600.0cm-1
%T
black: I REF, 1B7blue: I REF, 1B7
DGC-report 65
Report on surface oxidation of the third round of test 2008 (Borealis) MEMO
To Mats Bäckman
From Ann-Christin Augustsson
Date 12.01.2009
Total pages 3 (including this)
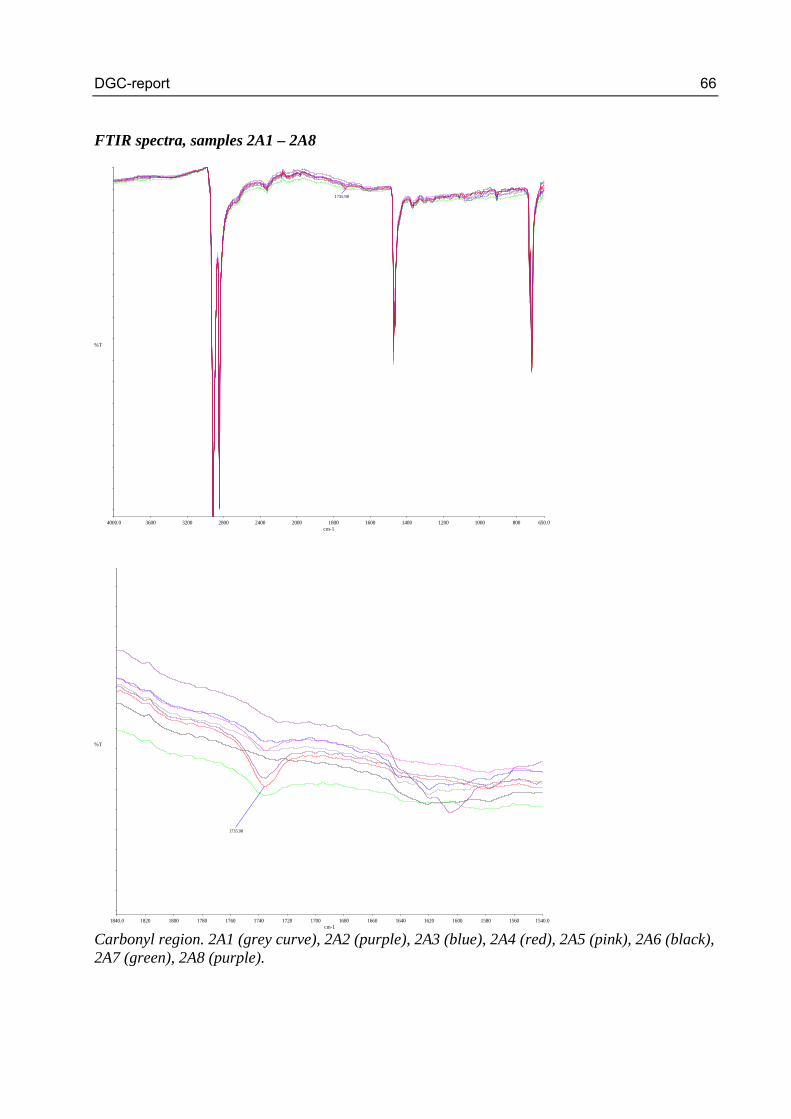
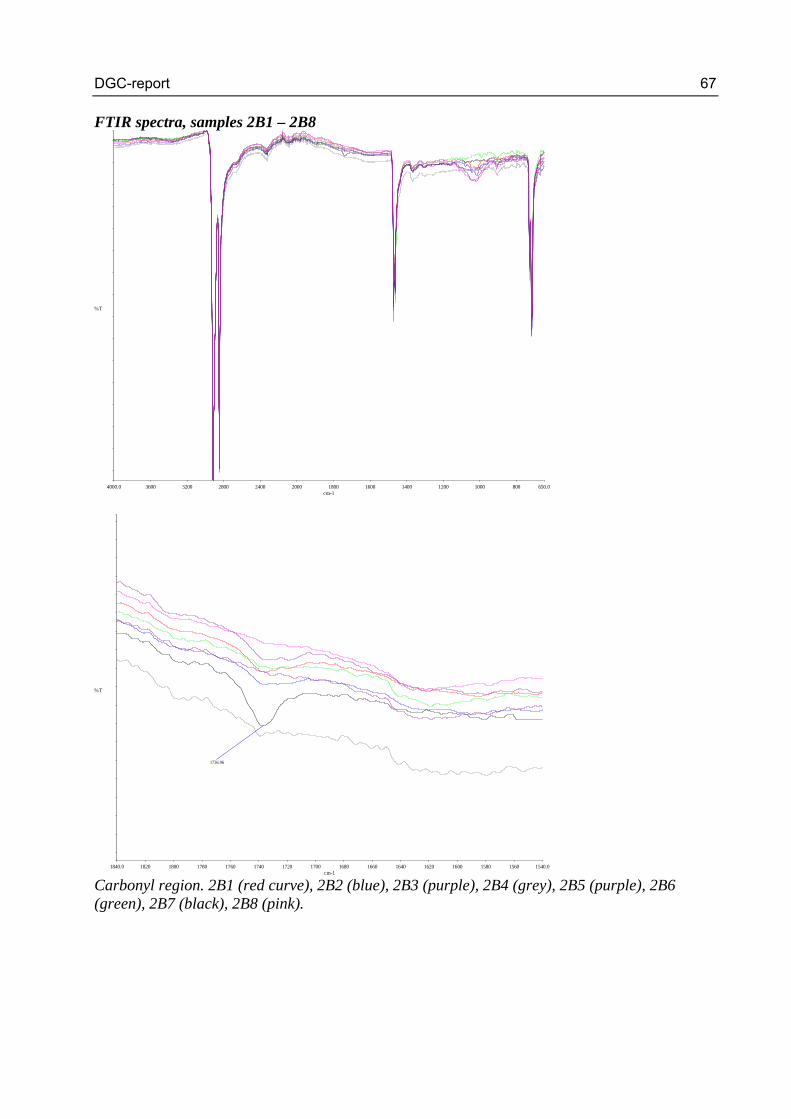
Subject TR83565: FTIR analyses of pipes from Dansk Gastekniskt Center TR83565: FTIR analyses of pipes from Dansk Gastekniskt Center Background BU Pipe has decided to support a project headed by Dansk Gastekniskt Center on Hydrogen transport i Natural as pipelines. The decision was that we should support them with Analytical expertise and analysis in the PE pipes which are exposed to hydrogen in return we will have available the outcome of the data from this project and other hydrogen project in a bigger pro-gram of which this project are a part of. They have now excavated pipes after 2 year of exposure and we now have to perform an analysis program on reference (non exposed) and the excavated exposed pipes. (For analytical results on pipes exposed for 1 year, see TR74655.) Analyses The following tests were performed: Surface oxidation by FTIR using the ATR accessory Golden Gate FTIR results The results do not indicate that the hydrogen exposure has deteriorated the materials. The carbonyl peaks with maxima around 1735 cm-1 detected on the surface of some of the pipes are most probably due to ester groups in the stabilisers and not oxidation. Spectra are attached.
DGC-report 66
FTIR spectra, samples 2A1 – 2A8
4000.0 3600 3200 2800 2400 2000 1800 1600 1400 1200 1000 800 650.0cm-1
%T
1735.98
1840.0 1820 1800 1780 1760 1740 1720 1700 1680 1660 1640 1620 1600 1580 1560 1540.0cm-1
%T
1735.98
Carbonyl region. 2A1 (grey curve), 2A2 (purple), 2A3 (blue), 2A4 (red), 2A5 (pink), 2A6 (black), 2A7 (green), 2A8 (purple).
DGC-report 67
FTIR spectra, samples 2B1 – 2B8
4000.0 3600 3200 2800 2400 2000 1800 1600 1400 1200 1000 800 650.0cm-1
%T
1840.0 1820 1800 1780 1760 1740 1720 1700 1680 1660 1640 1620 1600 1580 1560 1540.0cm-1
%T
1736.96
Carbonyl region. 2B1 (red curve), 2B2 (blue), 2B3 (purple), 2B4 (grey), 2B5 (purple), 2B6 (green), 2B7 (black), 2B8 (pink).
DGC-report 68
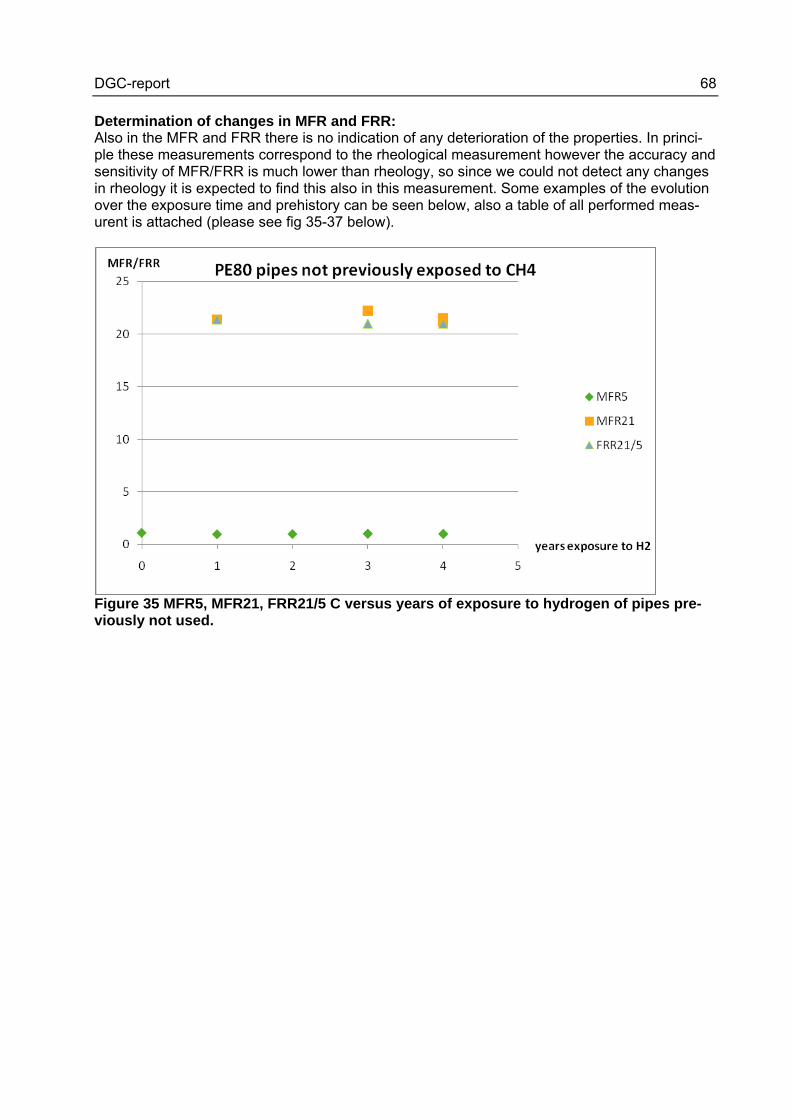
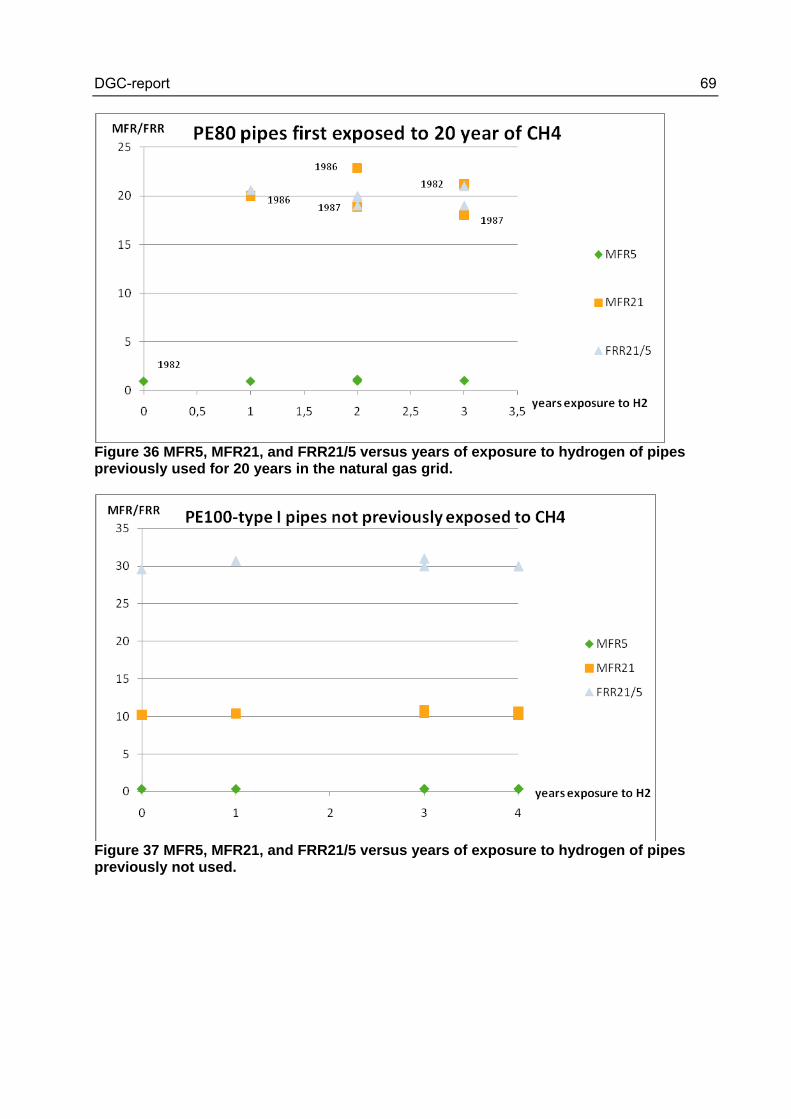
Determination of changes in MFR and FRR: Also in the MFR and FRR there is no indication of any deterioration of the properties. In princi-ple these measurements correspond to the rheological measurement however the accuracy and sensitivity of MFR/FRR is much lower than rheology, so since we could not detect any changes in rheology it is expected to find this also in this measurement. Some examples of the evolution over the exposure time and prehistory can be seen below, also a table of all performed meas-urent is attached (please see fig 35-37 below).
Figure 35 MFR5, MFR21, FRR21/5 C versus years of exposure to hydrogen of pipes pre-viously not used.
DGC-report 69
Figure 36 MFR5, MFR21, and FRR21/5 versus years of exposure to hydrogen of pipes previously used for 20 years in the natural gas grid.
Figure 37 MFR5, MFR21, and FRR21/5 versus years of exposure to hydrogen of pipes previously not used.
DGC-report 70
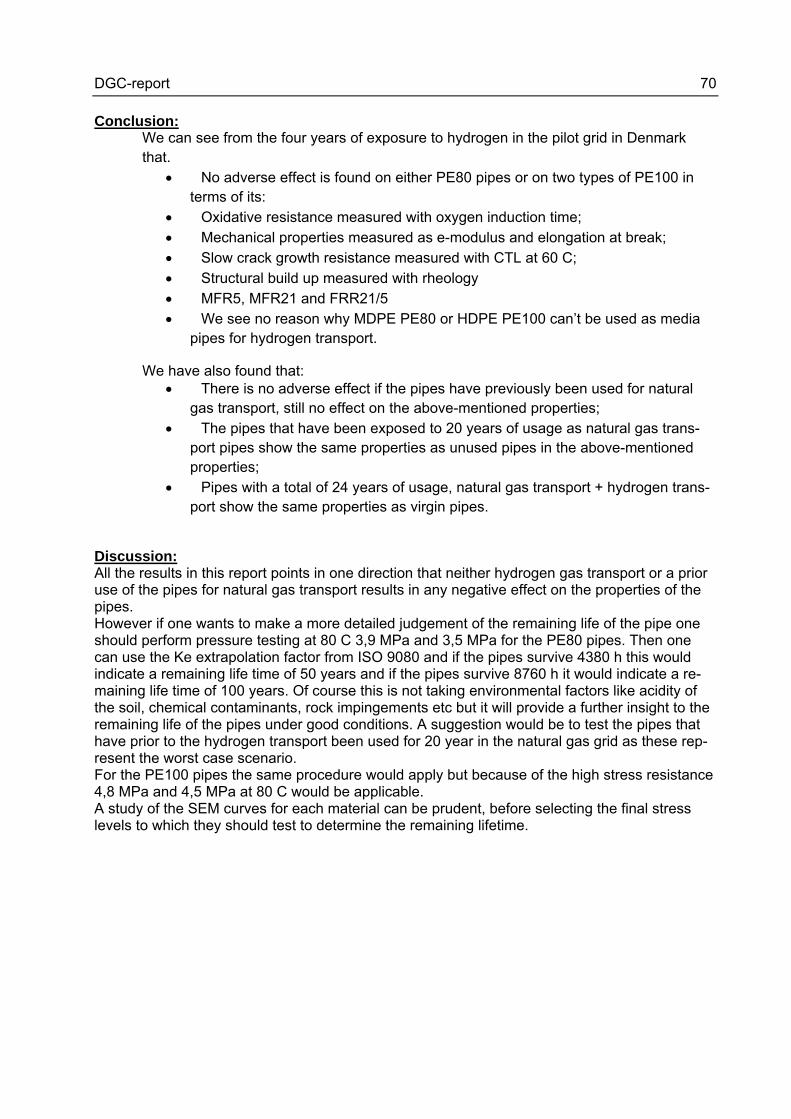
Conclusion: We can see from the four years of exposure to hydrogen in the pilot grid in Denmark that.
No adverse effect is found on either PE80 pipes or on two types of PE100 in terms of its:
Oxidative resistance measured with oxygen induction time; Mechanical properties measured as e-modulus and elongation at break; Slow crack growth resistance measured with CTL at 60 C; Structural build up measured with rheology MFR5, MFR21 and FRR21/5 We see no reason why MDPE PE80 or HDPE PE100 can’t be used as media
pipes for hydrogen transport.
We have also found that: There is no adverse effect if the pipes have previously been used for natural
gas transport, still no effect on the above-mentioned properties; The pipes that have been exposed to 20 years of usage as natural gas trans-
port pipes show the same properties as unused pipes in the above-mentioned properties;
Pipes with a total of 24 years of usage, natural gas transport + hydrogen trans-port show the same properties as virgin pipes.
Discussion: All the results in this report points in one direction that neither hydrogen gas transport or a prior use of the pipes for natural gas transport results in any negative effect on the properties of the pipes. However if one wants to make a more detailed judgement of the remaining life of the pipe one should perform pressure testing at 80 C 3,9 MPa and 3,5 MPa for the PE80 pipes. Then one can use the Ke extrapolation factor from ISO 9080 and if the pipes survive 4380 h this would indicate a remaining life time of 50 years and if the pipes survive 8760 h it would indicate a re-maining life time of 100 years. Of course this is not taking environmental factors like acidity of the soil, chemical contaminants, rock impingements etc but it will provide a further insight to the remaining life of the pipes under good conditions. A suggestion would be to test the pipes that have prior to the hydrogen transport been used for 20 year in the natural gas grid as these rep-resent the worst case scenario. For the PE100 pipes the same procedure would apply but because of the high stress resistance 4,8 MPa and 4,5 MPa at 80 C would be applicable. A study of the SEM curves for each material can be prudent, before selecting the final stress levels to which they should test to determine the remaining lifetime.

DGC-report 71
Reference list: 1. Rheological characterisation of Polyethylene fractions – Heino E-L, Lehtinen A, Tanner
J, Seppälä J, Theor. Applied Rheology Procedings, Int. Congr of Rheology, 11’th (1992), 1, 360-362
2. The influence of molecular structure on some rheological properties of PE, Heino E-L, Annual transactions of the Nordic rheological society, 1995
3. EN1555 Plastics piping systems for the supply of gaseous fuels-Polyethylene(PE)- Part 1 General, December 2002
DGC-report 72
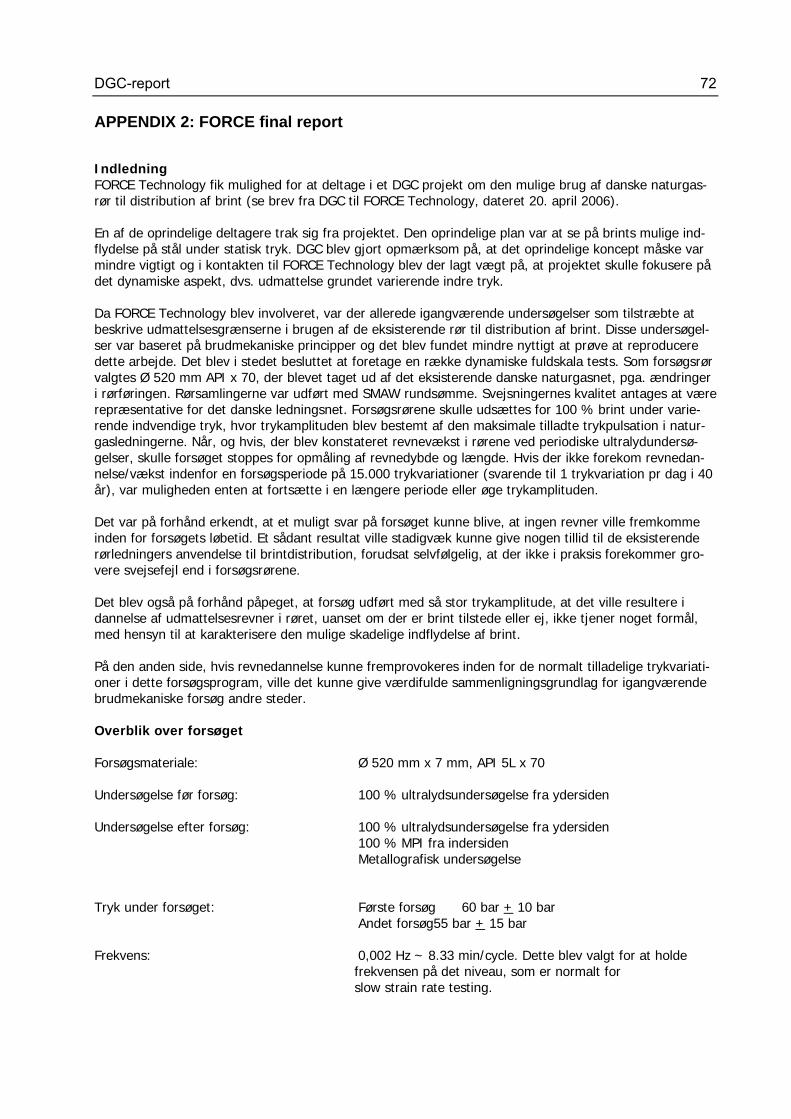
APPENDIX 2: FORCE final report
Indledning FORCE Technology fik mulighed for at deltage i et DGC projekt om den mulige brug af danske naturgas-rør til distribution af brint (se brev fra DGC til FORCE Technology, dateret 20. april 2006). En af de oprindelige deltagere trak sig fra projektet. Den oprindelige plan var at se på brints mulige ind-flydelse på stål under statisk tryk. DGC blev gjort opmærksom på, at det oprindelige koncept måske var mindre vigtigt og i kontakten til FORCE Technology blev der lagt vægt på, at projektet skulle fokusere på det dynamiske aspekt, dvs. udmattelse grundet varierende indre tryk. Da FORCE Technology blev involveret, var der allerede igangværende undersøgelser som tilstræbte at beskrive udmattelsesgrænserne i brugen af de eksisterende rør til distribution af brint. Disse undersøgel-ser var baseret på brudmekaniske principper og det blev fundet mindre nyttigt at prøve at reproducere dette arbejde. Det blev i stedet besluttet at foretage en række dynamiske fuldskala tests. Som forsøgsrør valgtes Ø 520 mm API x 70, der blevet taget ud af det eksisterende danske naturgasnet, pga. ændringer i rørføringen. Rørsamlingerne var udført med SMAW rundsømme. Svejsningernes kvalitet antages at være repræsentative for det danske ledningsnet. Forsøgsrørene skulle udsættes for 100 % brint under varie-rende indvendige tryk, hvor trykamplituden blev bestemt af den maksimale tilladte trykpulsation i natur-gasledningerne. Når, og hvis, der blev konstateret revnevækst i rørene ved periodiske ultralydundersø-gelser, skulle forsøget stoppes for opmåling af revnedybde og længde. Hvis der ikke forekom revnedan-nelse/vækst indenfor en forsøgsperiode på 15.000 trykvariationer (svarende til 1 trykvariation pr dag i 40 år), var muligheden enten at fortsætte i en længere periode eller øge trykamplituden. Det var på forhånd erkendt, at et muligt svar på forsøget kunne blive, at ingen revner ville fremkomme inden for forsøgets løbetid. Et sådant resultat ville stadigvæk kunne give nogen tillid til de eksisterende rørledningers anvendelse til brintdistribution, forudsat selvfølgelig, at der ikke i praksis forekommer gro-vere svejsefejl end i forsøgsrørene. Det blev også på forhånd påpeget, at forsøg udført med så stor trykamplitude, at det ville resultere i dannelse af udmattelsesrevner i røret, uanset om der er brint tilstede eller ej, ikke tjener noget formål, med hensyn til at karakterisere den mulige skadelige indflydelse af brint. På den anden side, hvis revnedannelse kunne fremprovokeres inden for de normalt tilladelige trykvariati-oner i dette forsøgsprogram, ville det kunne give værdifulde sammenligningsgrundlag for igangværende brudmekaniske forsøg andre steder. Overblik over forsøget Forsøgsmateriale: Ø 520 mm x 7 mm, API 5L x 70 Undersøgelse før forsøg: 100 % ultralydsundersøgelse fra ydersiden Undersøgelse efter forsøg: 100 % ultralydsundersøgelse fra ydersiden 100 % MPI fra indersiden Metallografisk undersøgelse Tryk under forsøget: Første forsøg 60 bar + 10 bar Andet forsøg 55 bar + 15 bar Frekvens: 0,002 Hz ~ 8.33 min/cycle. Dette blev valgt for at holde
frekvensen på det niveau, som er normalt for slow strain rate testing.
DGC-report 73
Antal trykændringer pr. forsøg: 15000, svarende til et trykudsving om dagen i 40 år. Undersøgelse under testen: 100 % ultralyd fra ydersiden Hvis utætheder forekommer stoppes forsøget. Et nyt forsøg igangsættes ved lavere maksimum belast-ning og/eller lavere trykudsving. Hvis der konstateres beskeden revnevækst, fortsætter forsøget en ekstra periode eller indtil utæthed. Hvis der ingen revner findes, fortsætter forsøget, men med en smule højere trykudsving. Det blev på forhånd bestemt ikke at bruge trykudstrækninger/udsving højere end + 15 bar, da det ville øge risikoen for begyndende udmattelsesrevner, uanset det indre miljø. Når forsøget er blevet stoppet bliver det mulige revneområde analyseret grundigt, således at revnedyb-den måles, en mulig revnevækstrate bestemmes til brug for fremtidige sammenligninger med brudmeka-niske forsøgsresultater. Hvis der ikke forefindes revner, tjekkes hele svejsesømmen vha. MPI, og mikro prøver udvælges til at beskrive svejseområdet.
DGC-report 74
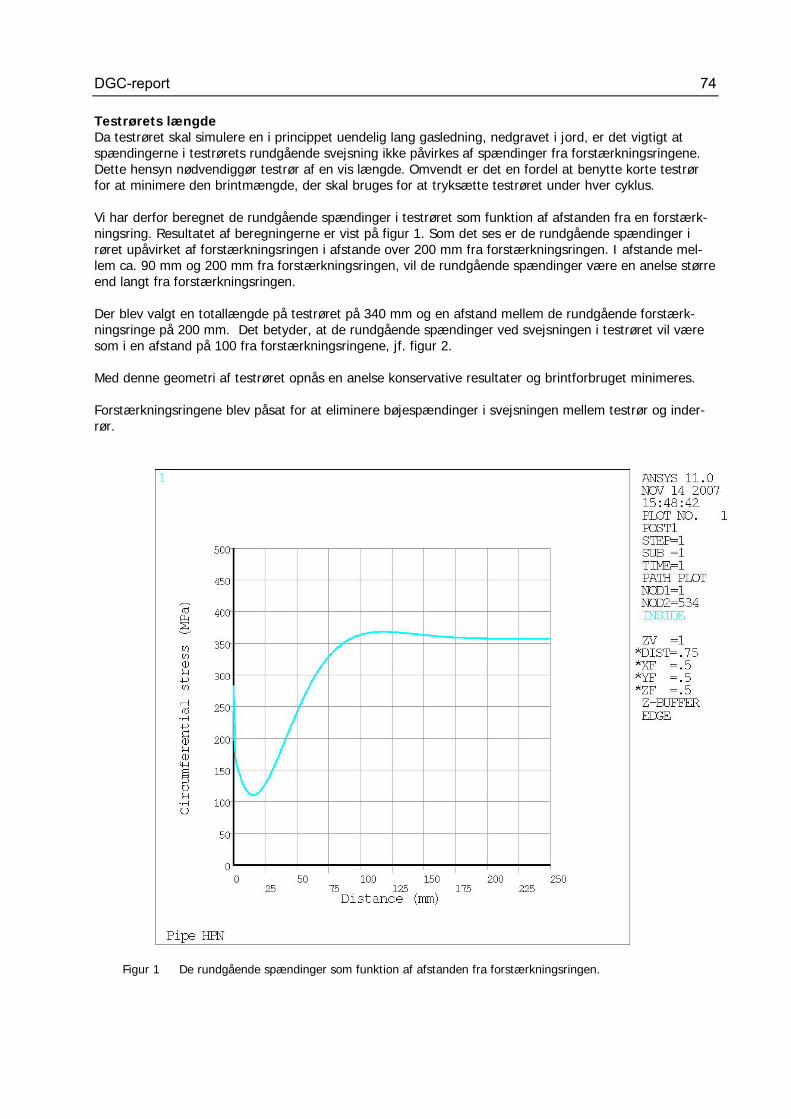
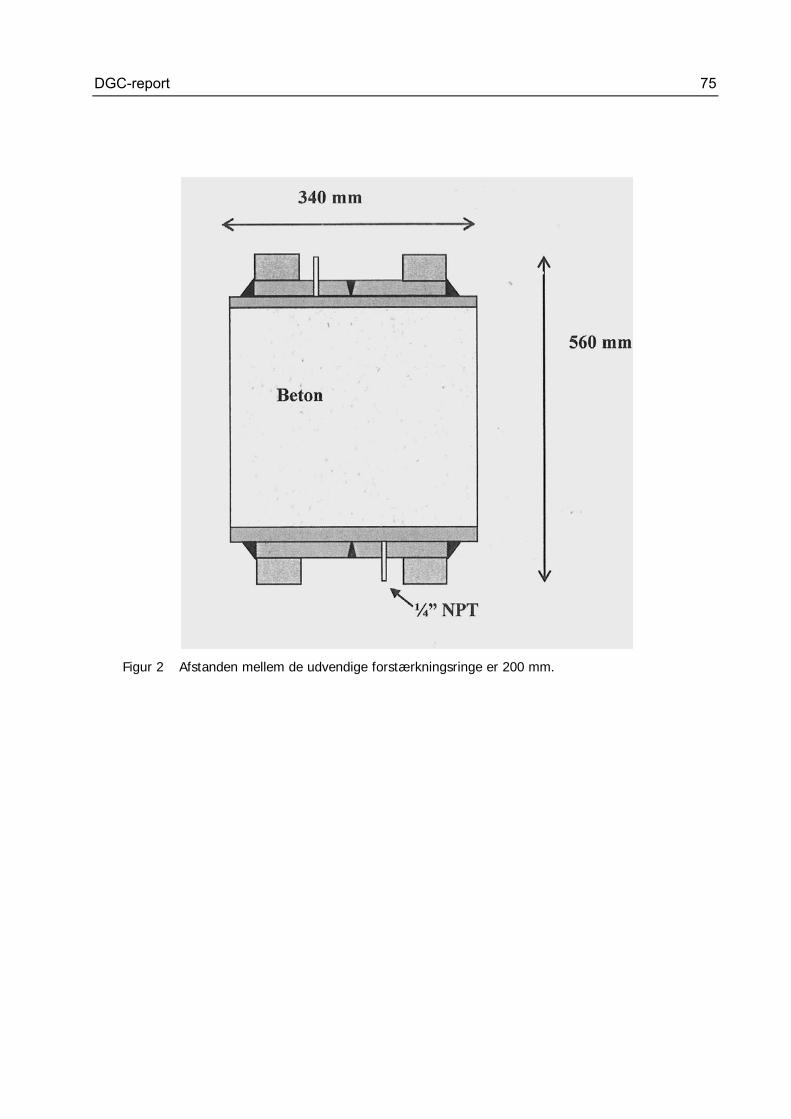
Testrørets længde Da testrøret skal simulere en i princippet uendelig lang gasledning, nedgravet i jord, er det vigtigt at spændingerne i testrørets rundgående svejsning ikke påvirkes af spændinger fra forstærkningsringene. Dette hensyn nødvendiggør testrør af en vis længde. Omvendt er det en fordel at benytte korte testrør for at minimere den brintmængde, der skal bruges for at tryksætte testrøret under hver cyklus. Vi har derfor beregnet de rundgående spændinger i testrøret som funktion af afstanden fra en forstærk-ningsring. Resultatet af beregningerne er vist på figur 1. Som det ses er de rundgående spændinger i røret upåvirket af forstærkningsringen i afstande over 200 mm fra forstærkningsringen. I afstande mel-lem ca. 90 mm og 200 mm fra forstærkningsringen, vil de rundgående spændinger være en anelse større end langt fra forstærkningsringen. Der blev valgt en totallængde på testrøret på 340 mm og en afstand mellem de rundgående forstærk-ningsringe på 200 mm. Det betyder, at de rundgående spændinger ved svejsningen i testrøret vil være som i en afstand på 100 fra forstærkningsringene, jf. figur 2. Med denne geometri af testrøret opnås en anelse konservative resultater og brintforbruget minimeres. Forstærkningsringene blev påsat for at eliminere bøjespændinger i svejsningen mellem testrør og inder-rør. Figur 1 De rundgående spændinger som funktion af afstanden fra forstærkningsringen.
DGC-report 75
Figur 2 Afstanden mellem de udvendige forstærkningsringe er 200 mm.
DGC-report 76
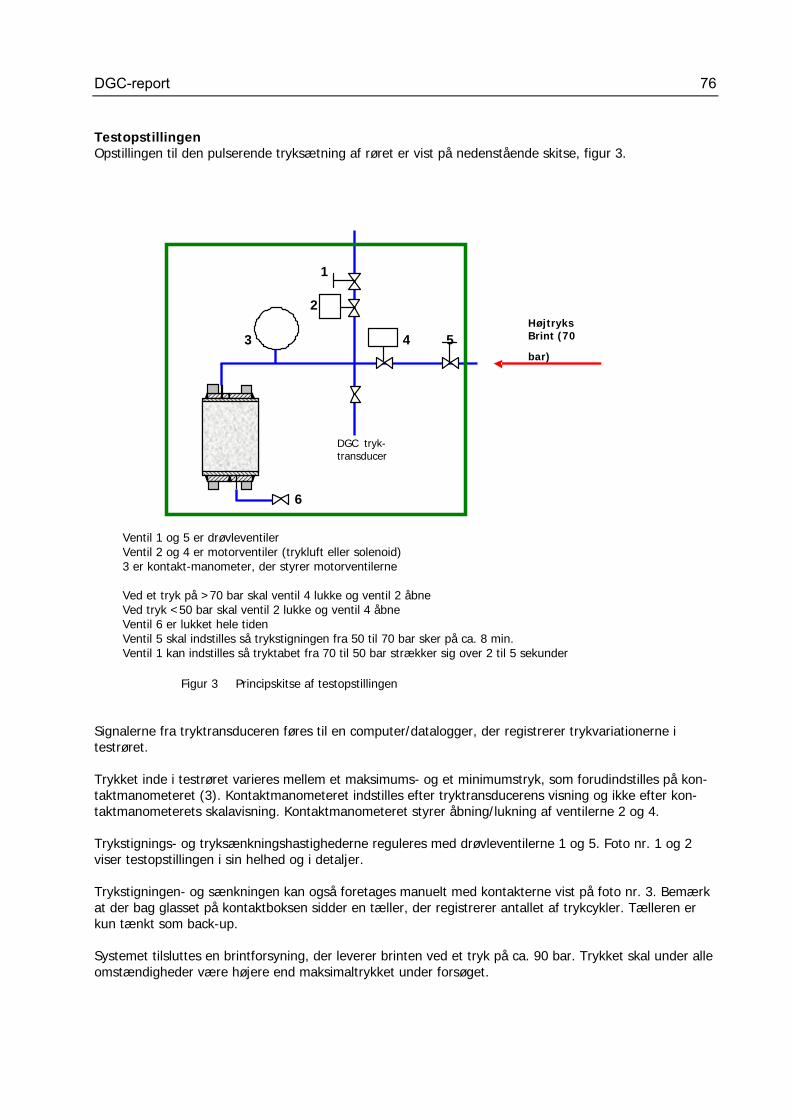
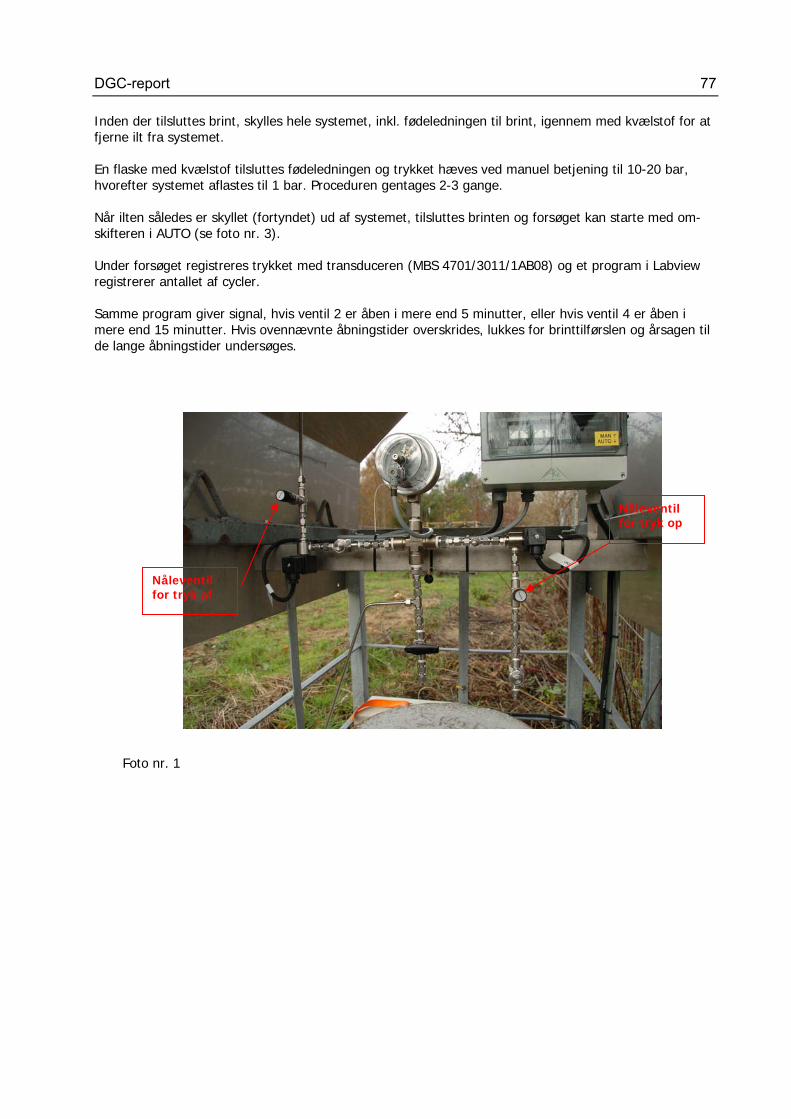
Testopstillingen Opstillingen til den pulserende tryksætning af røret er vist på nedenstående skitse, figur 3. Ventil 1 og 5 er drøvleventiler Ventil 2 og 4 er motorventiler (trykluft eller solenoid) 3 er kontakt-manometer, der styrer motorventilerne Ved et tryk på >70 bar skal ventil 4 lukke og ventil 2 åbne Ved tryk <50 bar skal ventil 2 lukke og ventil 4 åbne Ventil 6 er lukket hele tiden Ventil 5 skal indstilles så trykstigningen fra 50 til 70 bar sker på ca. 8 min. Ventil 1 kan indstilles så tryktabet fra 70 til 50 bar strækker sig over 2 til 5 sekunder
Figur 3 Principskitse af testopstillingen Signalerne fra tryktransduceren føres til en computer/datalogger, der registrerer trykvariationerne i testrøret. Trykket inde i testrøret varieres mellem et maksimums- og et minimumstryk, som forudindstilles på kon-taktmanometeret (3). Kontaktmanometeret indstilles efter tryktransducerens visning og ikke efter kon-taktmanometerets skalavisning. Kontaktmanometeret styrer åbning/lukning af ventilerne 2 og 4. Trykstignings- og tryksænkningshastighederne reguleres med drøvleventilerne 1 og 5. Foto nr. 1 og 2 viser testopstillingen i sin helhed og i detaljer. Trykstigningen- og sænkningen kan også foretages manuelt med kontakterne vist på foto nr. 3. Bemærk at der bag glasset på kontaktboksen sidder en tæller, der registrerer antallet af trykcykler. Tælleren er kun tænkt som back-up. Systemet tilsluttes en brintforsyning, der leverer brinten ved et tryk på ca. 90 bar. Trykket skal under alle omstændigheder være højere end maksimaltrykket under forsøget.
1 2 3 4 5
Højtryks Brint (70
bar)
DGC tryk-transducer
6
DGC-report 77
Inden der tilsluttes brint, skylles hele systemet, inkl. fødeledningen til brint, igennem med kvælstof for at fjerne ilt fra systemet. En flaske med kvælstof tilsluttes fødeledningen og trykket hæves ved manuel betjening til 10-20 bar, hvorefter systemet aflastes til 1 bar. Proceduren gentages 2-3 gange. Når ilten således er skyllet (fortyndet) ud af systemet, tilsluttes brinten og forsøget kan starte med om-skifteren i AUTO (se foto nr. 3). Under forsøget registreres trykket med transduceren (MBS 4701/3011/1AB08) og et program i Labview registrerer antallet af cycler. Samme program giver signal, hvis ventil 2 er åben i mere end 5 minutter, eller hvis ventil 4 er åben i mere end 15 minutter. Hvis ovennævnte åbningstider overskrides, lukkes for brinttilførslen og årsagen til de lange åbningstider undersøges. Foto nr. 1
Nåleventil for tryk af
Nåleventil for tryk op
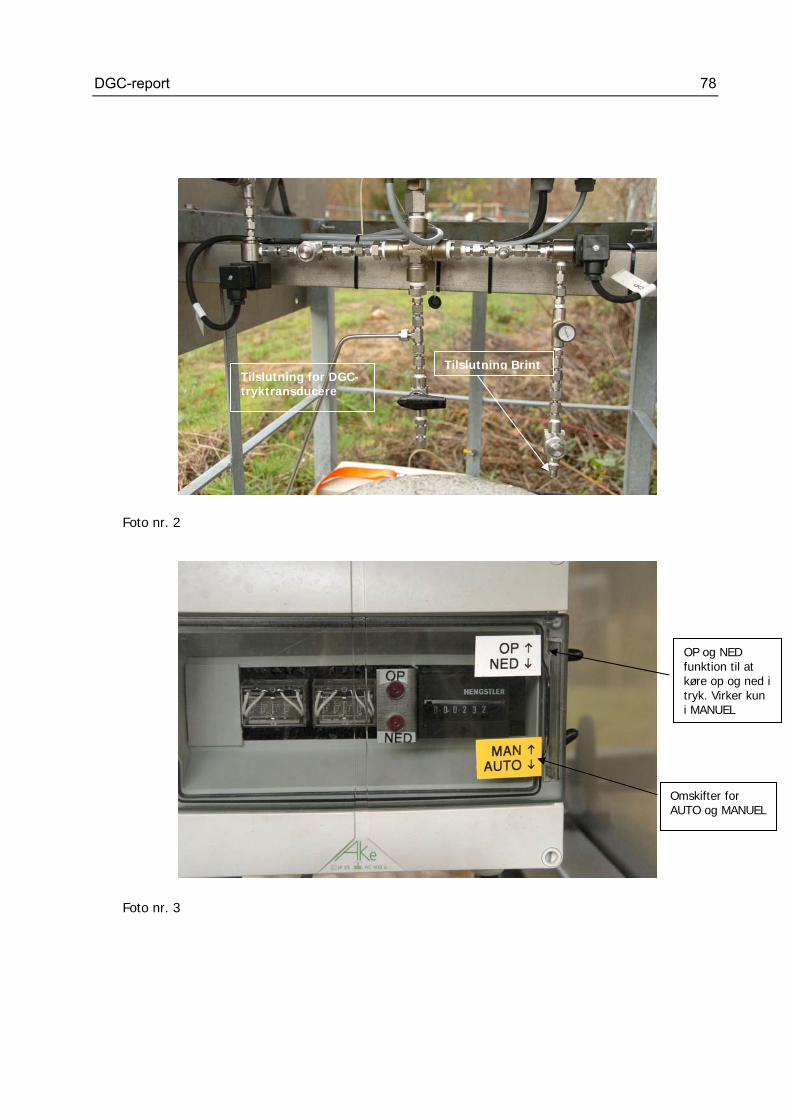
DGC-report 78
Foto nr. 2 Foto nr. 3
Tilslutning for DGC-tryktransducere
Tilslutning Brint
OP og NED funktion til at køre op og ned i tryk. Virker kun i MANUEL
Omskifter for AUTO og MANUEL
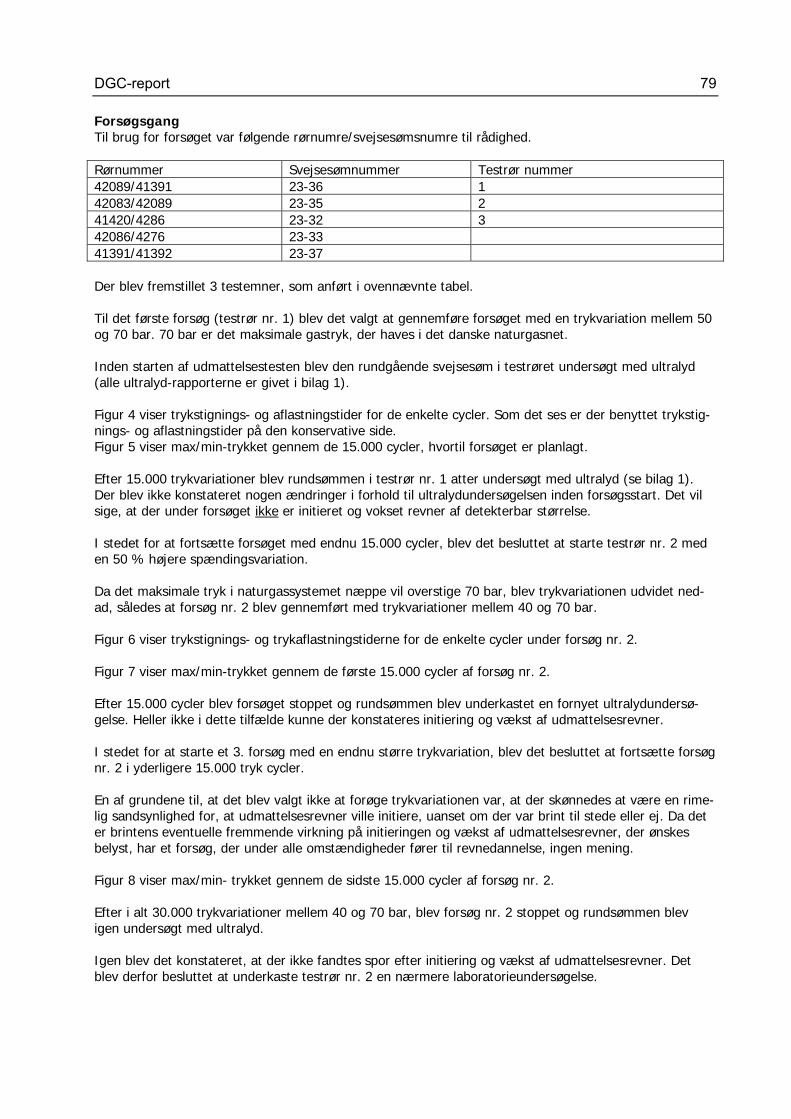
DGC-report 79
Forsøgsgang Til brug for forsøget var følgende rørnumre/svejsesømsnumre til rådighed. Rørnummer Svejsesømnummer Testrør nummer 42089/41391 23-36 1 42083/42089 23-35 2 41420/4286 23-32 3 42086/4276 23-33 41391/41392 23-37 Der blev fremstillet 3 testemner, som anført i ovennævnte tabel. Til det første forsøg (testrør nr. 1) blev det valgt at gennemføre forsøget med en trykvariation mellem 50 og 70 bar. 70 bar er det maksimale gastryk, der haves i det danske naturgasnet. Inden starten af udmattelsestesten blev den rundgående svejsesøm i testrøret undersøgt med ultralyd (alle ultralyd-rapporterne er givet i bilag 1). Figur 4 viser trykstignings- og aflastningstider for de enkelte cycler. Som det ses er der benyttet trykstig-nings- og aflastningstider på den konservative side. Figur 5 viser max/min-trykket gennem de 15.000 cycler, hvortil forsøget er planlagt. Efter 15.000 trykvariationer blev rundsømmen i testrør nr. 1 atter undersøgt med ultralyd (se bilag 1). Der blev ikke konstateret nogen ændringer i forhold til ultralydundersøgelsen inden forsøgsstart. Det vil sige, at der under forsøget ikke er initieret og vokset revner af detekterbar størrelse. I stedet for at fortsætte forsøget med endnu 15.000 cycler, blev det besluttet at starte testrør nr. 2 med en 50 % højere spændingsvariation. Da det maksimale tryk i naturgassystemet næppe vil overstige 70 bar, blev trykvariationen udvidet ned-ad, således at forsøg nr. 2 blev gennemført med trykvariationer mellem 40 og 70 bar. Figur 6 viser trykstignings- og trykaflastningstiderne for de enkelte cycler under forsøg nr. 2. Figur 7 viser max/min-trykket gennem de første 15.000 cycler af forsøg nr. 2. Efter 15.000 cycler blev forsøget stoppet og rundsømmen blev underkastet en fornyet ultralydundersø-gelse. Heller ikke i dette tilfælde kunne der konstateres initiering og vækst af udmattelsesrevner. I stedet for at starte et 3. forsøg med en endnu større trykvariation, blev det besluttet at fortsætte forsøg nr. 2 i yderligere 15.000 tryk cycler. En af grundene til, at det blev valgt ikke at forøge trykvariationen var, at der skønnedes at være en rime-lig sandsynlighed for, at udmattelsesrevner ville initiere, uanset om der var brint til stede eller ej. Da det er brintens eventuelle fremmende virkning på initieringen og vækst af udmattelsesrevner, der ønskes belyst, har et forsøg, der under alle omstændigheder fører til revnedannelse, ingen mening. Figur 8 viser max/min- trykket gennem de sidste 15.000 cycler af forsøg nr. 2. Efter i alt 30.000 trykvariationer mellem 40 og 70 bar, blev forsøg nr. 2 stoppet og rundsømmen blev igen undersøgt med ultralyd. Igen blev det konstateret, at der ikke fandtes spor efter initiering og vækst af udmattelsesrevner. Det blev derfor besluttet at underkaste testrør nr. 2 en nærmere laboratorieundersøgelse.
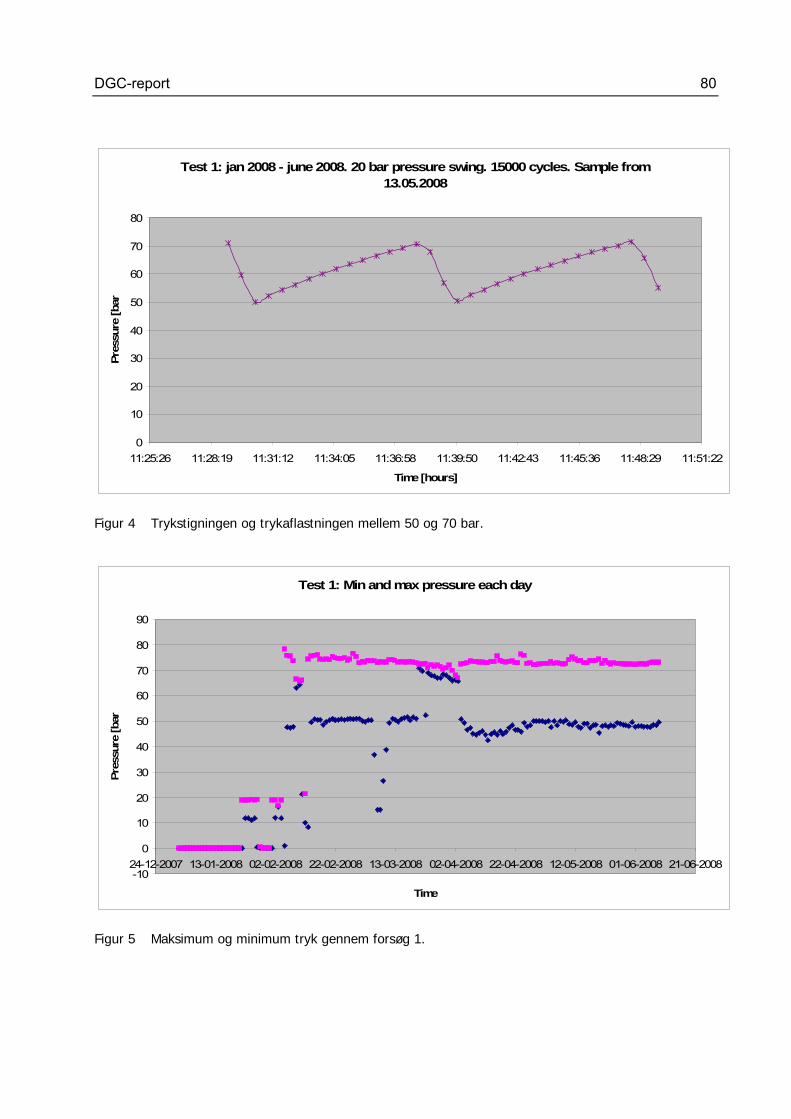
DGC-report 80
Test 1: jan 2008 - june 2008. 20 bar pressure swing. 15000 cycles. Sample from 13.05.2008
0
10
20
30
40
50
60
70
80
11:25:26 11:28:19 11:31:12 11:34:05 11:36:58 11:39:50 11:42:43 11:45:36 11:48:29 11:51:22
Time [hours]
Pre
ssure
[bar
Figur 4 Trykstigningen og trykaflastningen mellem 50 og 70 bar.
Test 1: Min and max pressure each day
-10
0
10
20
30
40
50
60
70
80
90
24-12-2007 13-01-2008 02-02-2008 22-02-2008 13-03-2008 02-04-2008 22-04-2008 12-05-2008 01-06-2008 21-06-2008
Time
Pre
ssure
[bar
Figur 5 Maksimum og minimum tryk gennem forsøg 1.
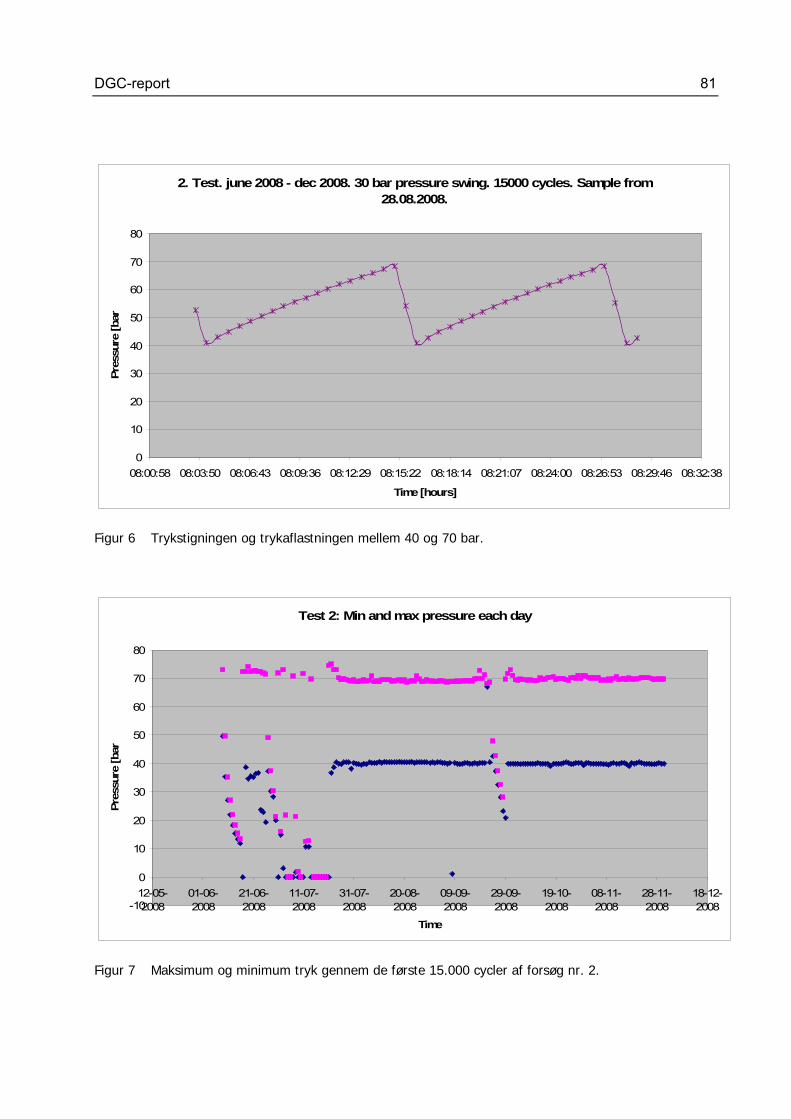
DGC-report 81
2. Test. june 2008 - dec 2008. 30 bar pressure swing. 15000 cycles. Sample from 28.08.2008.
0
10
20
30
40
50
60
70
80
08:00:58 08:03:50 08:06:43 08:09:36 08:12:29 08:15:22 08:18:14 08:21:07 08:24:00 08:26:53 08:29:46 08:32:38
Time [hours]
Pre
ssure
[bar
Figur 6 Trykstigningen og trykaflastningen mellem 40 og 70 bar.
Test 2: Min and max pressure each day
-10
0
10
20
30
40
50
60
70
80
12-05-2008
01-06-2008
21-06-2008
11-07-2008
31-07-2008
20-08-2008
09-09-2008
29-09-2008
19-10-2008
08-11-2008
28-11-2008
18-12-2008
Time
Pre
ssure
[bar
Figur 7 Maksimum og minimum tryk gennem de første 15.000 cycler af forsøg nr. 2.
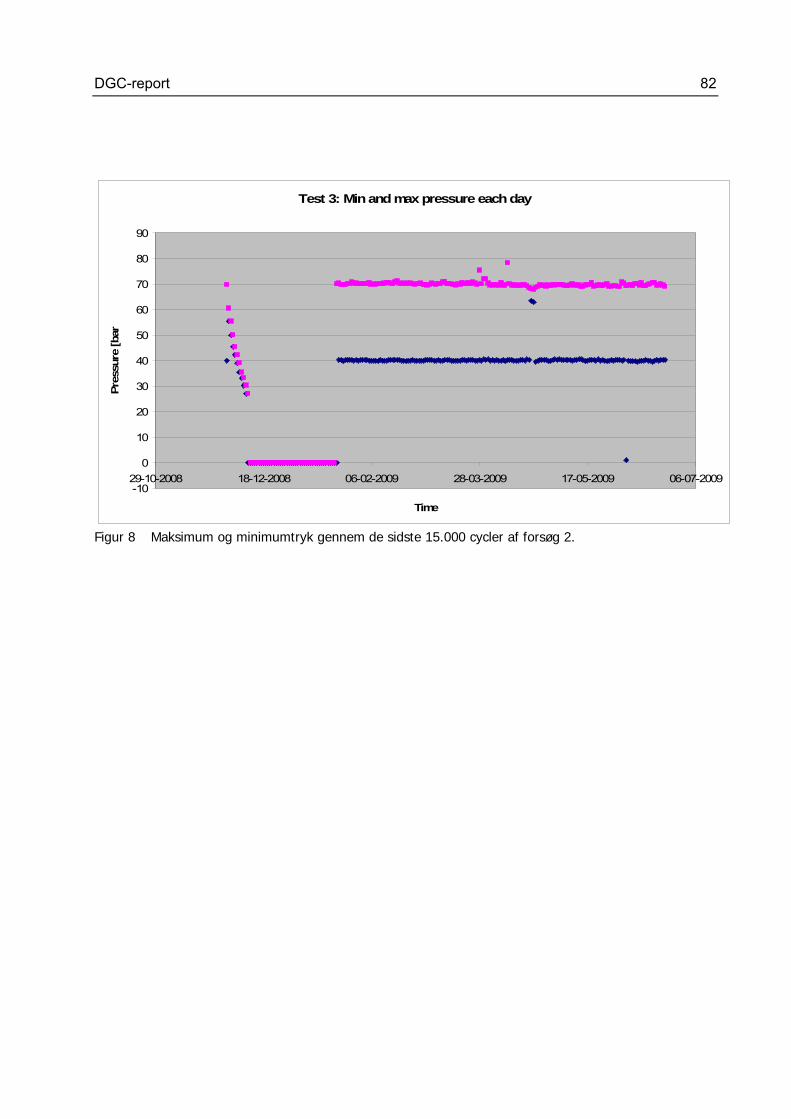
DGC-report 82
Test 3: Min and max pressure each day
-10
0
10
20
30
40
50
60
70
80
90
29-10-2008 18-12-2008 06-02-2009 28-03-2009 17-05-2009 06-07-2009
Time
Pre
ssure
[bar
Figur 8 Maksimum og minimumtryk gennem de sidste 15.000 cycler af forsøg 2.
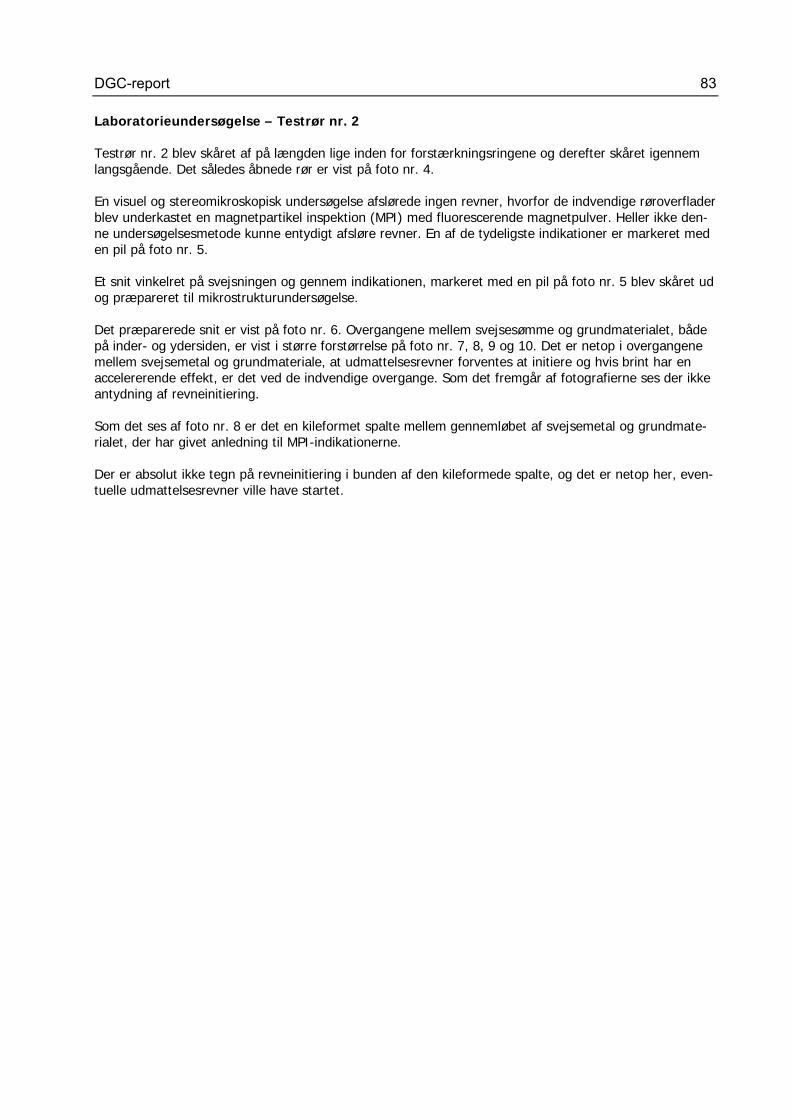
DGC-report 83
Laboratorieundersøgelse – Testrør nr. 2 Testrør nr. 2 blev skåret af på længden lige inden for forstærkningsringene og derefter skåret igennem langsgående. Det således åbnede rør er vist på foto nr. 4. En visuel og stereomikroskopisk undersøgelse afslørede ingen revner, hvorfor de indvendige røroverflader blev underkastet en magnetpartikel inspektion (MPI) med fluorescerende magnetpulver. Heller ikke den-ne undersøgelsesmetode kunne entydigt afsløre revner. En af de tydeligste indikationer er markeret med en pil på foto nr. 5. Et snit vinkelret på svejsningen og gennem indikationen, markeret med en pil på foto nr. 5 blev skåret ud og præpareret til mikrostrukturundersøgelse. Det præparerede snit er vist på foto nr. 6. Overgangene mellem svejsesømme og grundmaterialet, både på inder- og ydersiden, er vist i større forstørrelse på foto nr. 7, 8, 9 og 10. Det er netop i overgangene mellem svejsemetal og grundmateriale, at udmattelsesrevner forventes at initiere og hvis brint har en accelererende effekt, er det ved de indvendige overgange. Som det fremgår af fotografierne ses der ikke antydning af revneinitiering. Som det ses af foto nr. 8 er det en kileformet spalte mellem gennemløbet af svejsemetal og grundmate-rialet, der har givet anledning til MPI-indikationerne. Der er absolut ikke tegn på revneinitiering i bunden af den kileformede spalte, og det er netop her, even-tuelle udmattelsesrevner ville have startet.
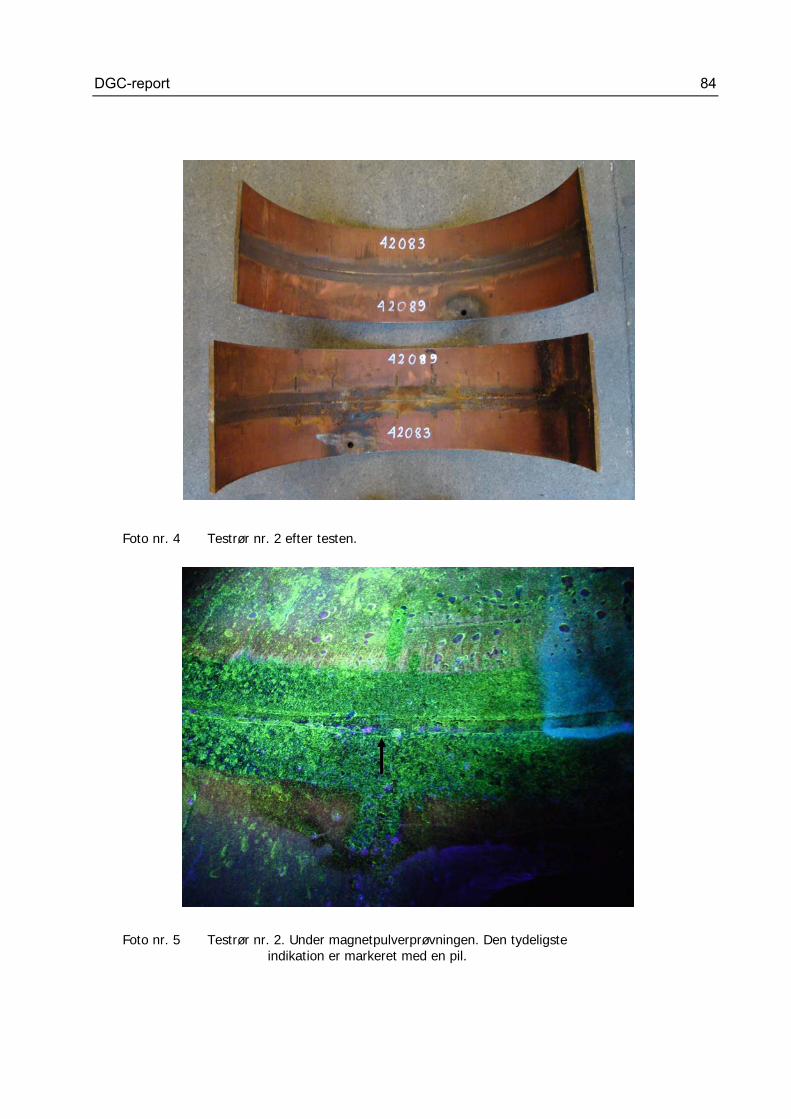
DGC-report 84
Foto nr. 4 Testrør nr. 2 efter testen. Foto nr. 5 Testrør nr. 2. Under magnetpulverprøvningen. Den tydeligste
indikation er markeret med en pil.
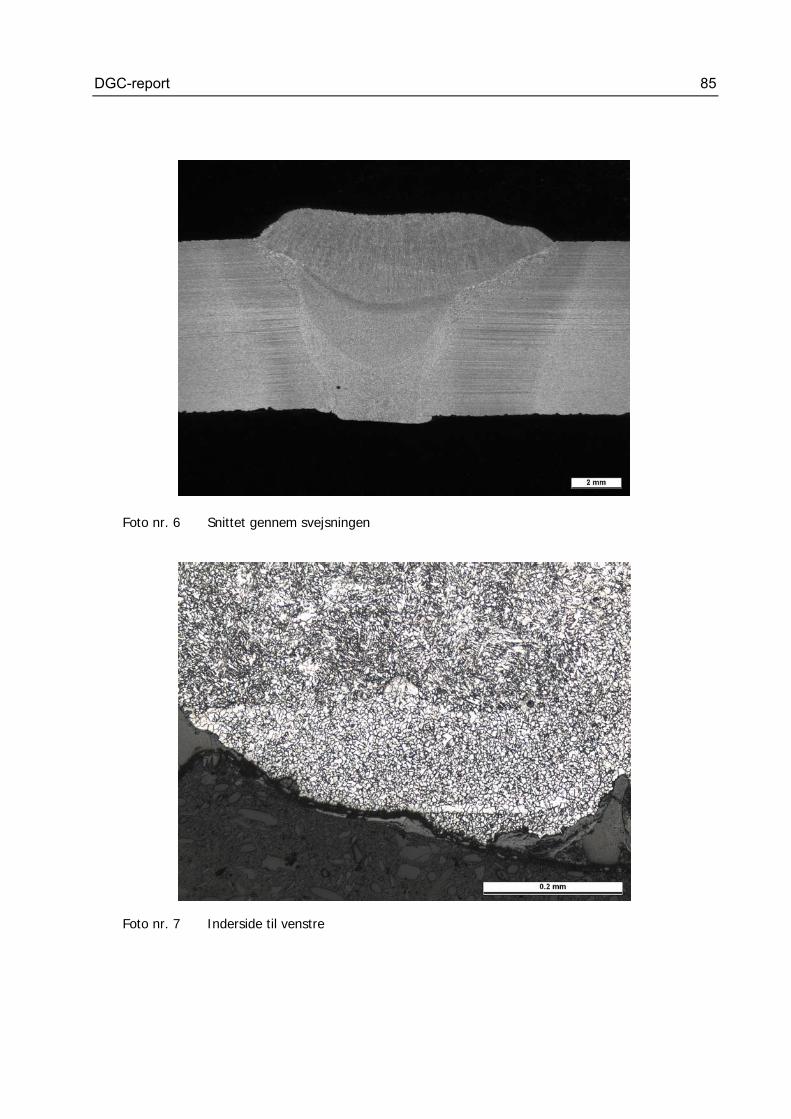
DGC-report 85
Foto nr. 6 Snittet gennem svejsningen Foto nr. 7 Inderside til venstre
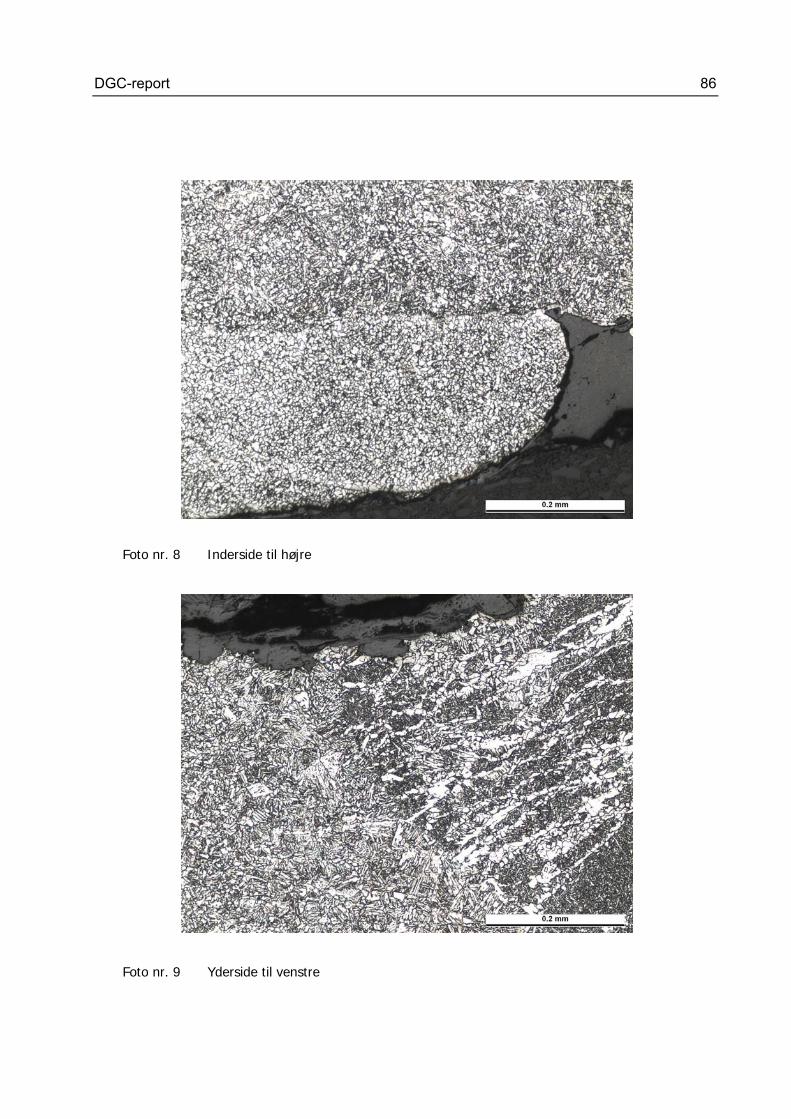
DGC-report 86
Foto nr. 8 Inderside til højre Foto nr. 9 Yderside til venstre
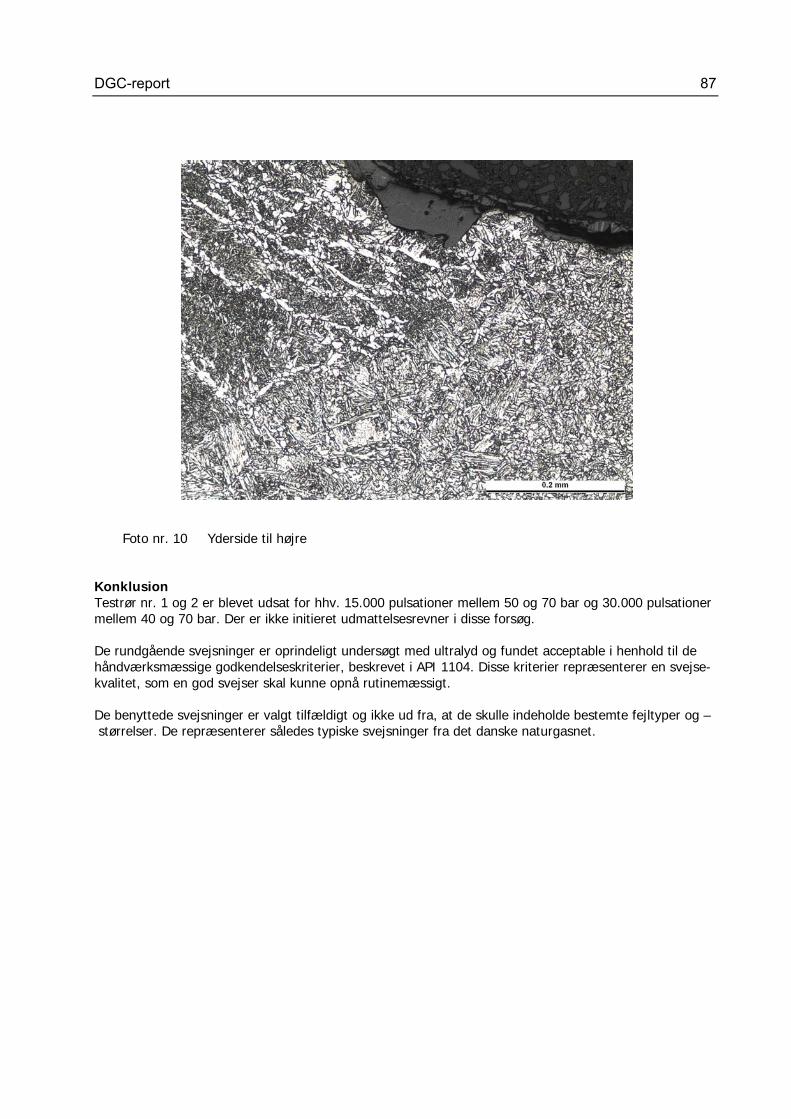
DGC-report 87
Foto nr. 10 Yderside til højre Konklusion Testrør nr. 1 og 2 er blevet udsat for hhv. 15.000 pulsationer mellem 50 og 70 bar og 30.000 pulsationer mellem 40 og 70 bar. Der er ikke initieret udmattelsesrevner i disse forsøg. De rundgående svejsninger er oprindeligt undersøgt med ultralyd og fundet acceptable i henhold til de håndværksmæssige godkendelseskriterier, beskrevet i API 1104. Disse kriterier repræsenterer en svejse-kvalitet, som en god svejser skal kunne opnå rutinemæssigt. De benyttede svejsninger er valgt tilfældigt og ikke ud fra, at de skulle indeholde bestemte fejltyper og – størrelser. De repræsenterer således typiske svejsninger fra det danske naturgasnet.
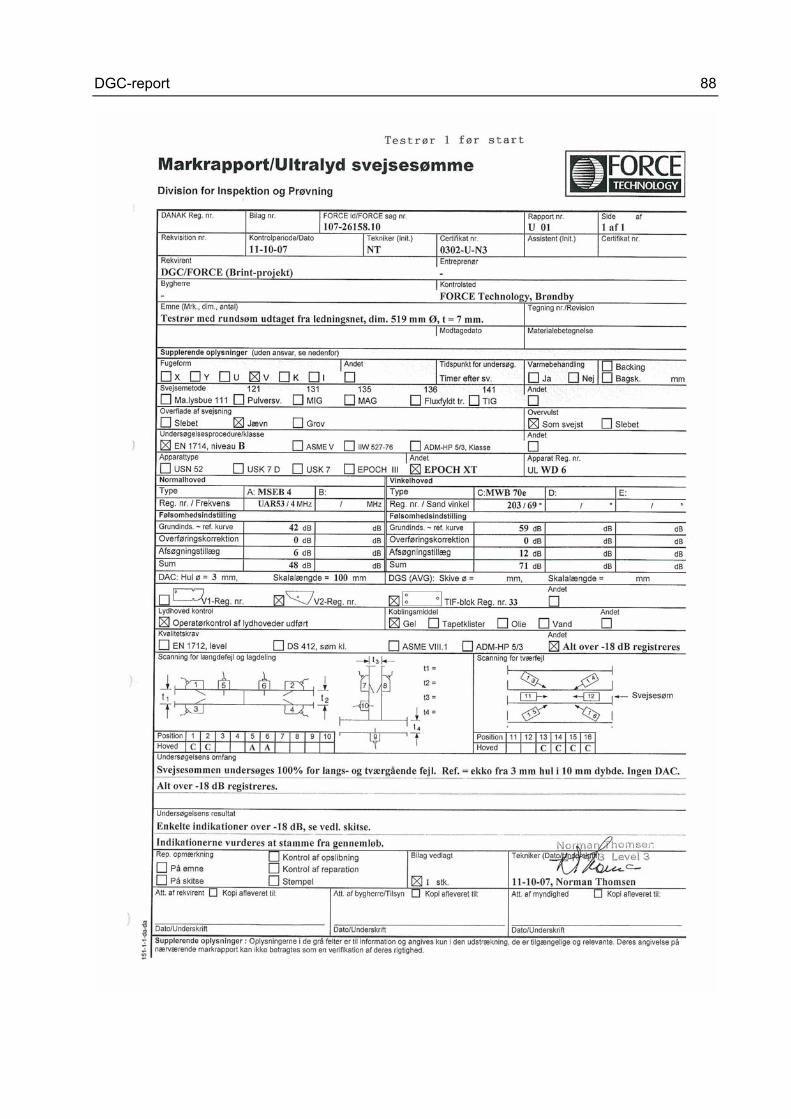
DGC-report 88

DGC-report 89

DGC-report 90

DGC-report 91

DGC-report 92

DGC-report 93
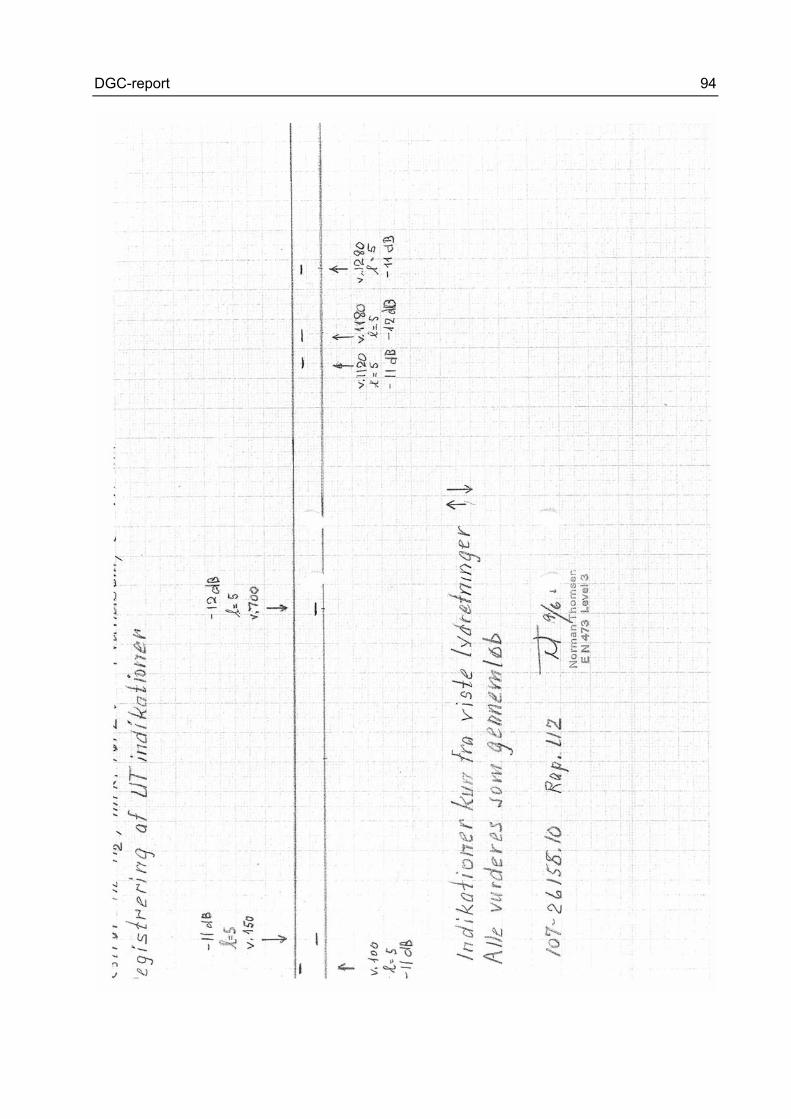
DGC-report 94