Miami-Dade Water and Sewer Department P. 0. Box 33031 … · 2012-01-26 · Box 33031 6 3071 SW...
122
Miami-Dade Water and Sewer Department P. 0. Box 33031 6 3071 SW 38th Avenue Miami, Florida 33233-031 6 T 305-665-7471 ADA Coordination Agenda Coordination Animal Services Art in Public Places Audit and Management Services Aviation Building Building Code Compliance Business Development Capital lmprovements Construction Coordination Citizens' lndependentTransportation Trust Commission on Ethics and Public Trust Communications Community Action Agency Community & Economic Development Community Relations Consumer Services Corrections & Rehabilitation Cultural Affairs Elections Emergency Management Employee Relations Empowerment Trust EnterpriseTechnology Services Environmental Resources Management Fair Employment Practices Finance Fire Rescue General Services Administration Historic Preservation Homeless Trust Housing Agency Housing Finance Authority Human Services lndependent Review Panel International Trade Consortium Electronic Correspondence1 Original via Certified Mail1 Return Receipt Requested 7001 -0360-0001 -6783-5672 CCN: 50990 March 14,2008 Mr. Curt Thompson, Senior Regulatory Professional Environmental Resource Regulation South Florida Water Management District P. 0 . Box 24680 West Palm Beach, FL 33416-4680 e-mail: [email protected] Re: Miami-Dade County Consolidated PWS Water Use Permit No. 13-0001 7-W Calibrate Raw and Finished Venturi Meters at Alex Orr WTP; Submit lnterim Report, Exhibit 33, Limiting Condition 48 Dear Mr. Thompson: Enclosed is a copy of the lnterim Report on the Plan to Address Raw Water Flow Measuring Adjustments in accordance with exhibit 33 and limiting condition number 48 of the subject permit. lfyou have any questions concerning this submittal; please contact me at (786) 552-8979 or Ms. Bertha Goldenberg, P.E. at (786) 552-8120. Juvenile Assessment Cent Medical Exami Metro-Miami Action P Metropolitan Planning Organizati Park and Recreatio Planning and Zoning Police Procurement Management Properly Appraiser Public Library System Public Works Safe Neighborhood Parks Seaport Solid Waste Management Strategic Business Management Team Metro Transit Task Force on Urban Economic Revitalization Vizcaya Museum And Gardens Water & Sewer Regulatory Compliance & Capital lmprovements Enclosure: lnterim Report on the Plan to Address Raw Water Flow Measuring Adjustments c: M. Elsner [email protected]
Transcript of Miami-Dade Water and Sewer Department P. 0. Box 33031 … · 2012-01-26 · Box 33031 6 3071 SW...
Miami-Dade Water and Sewer Department P. 0. Box 33031 6 3071 SW 38th Avenue
Miami, Florida 33233-031 6 T 305-665-7471
ADA Coordination
Agenda Coordination
Animal Services
Art in Public Places
Audit and Management Services
Aviation
Building
Building Code Compliance
Business Development
Capital lmprovements Construction Coordination
Citizens' lndependent Transportation Trust
Commission on Ethics and Public Trust
Communications
Community Action Agency
Community & Economic Development
Community Relations
Consumer Services
Corrections & Rehabilitation
Cultural Affairs
Elections
Emergency Management
Employee Relations
Empowerment Trust
EnterpriseTechnology Services
Environmental Resources Management
Fair Employment Practices
Finance
Fire Rescue
General Services Administration
Historic Preservation
Homeless Trust
Housing Agency
Housing Finance Authority
Human Services
lndependent Review Panel
International Trade Consortium
Electronic Correspondence1 Original via Certified Mail1 Return Receipt Requested 7001 -0360-0001 -6783-5672 CCN: 50990
March 14,2008
Mr. Curt Thompson, Senior Regulatory Professional Environmental Resource Regulation South Florida Water Management District P. 0 . Box 24680 West Palm Beach, FL 33416-4680 e-mail: [email protected]
Re: Miami-Dade County Consolidated PWS Water Use Permit No. 13-0001 7-W Calibrate Raw and Finished Venturi Meters at Alex Orr WTP; Submit lnterim Report, Exhibit 33, Limiting Condition 48
Dear Mr. Thompson:
Enclosed is a copy of the lnterim Report on the Plan to Address Raw Water Flow Measuring Adjustments in accordance with exhibit 33 and limiting condition number 48 of the subject permit.
lfyou have any questions concerning this submittal; please contact me at (786) 552-8979 or Ms. Bertha Goldenberg, P.E. at (786) 552-8120.
Juvenile Assessment Cent
Medical Exami
Metro-Miami Action P
Metropolitan Planning Organizati
Park and Recreatio
Planning and Zoning
Police
Procurement Management
Properly Appraiser
Public Library System
Public Works
Safe Neighborhood Parks
Seaport
Solid Waste Management
Strategic Business Management
Team Metro
Transit
Task Force on Urban Economic Revitalization
Vizcaya Museum And Gardens
Water & Sewer
Regulatory Compliance & Capital lmprovements
Enclosure: lnterim Report on the Plan to Address Raw Water Flow Measuring Adjustments
c: M. Elsner [email protected]
Mr. Curtis Thompson, SFWMD Page 2 March 13, 2008 Water Use Permit No. 13-0017-W, Water Accounting bc: J. Renfrow
J. Ruiz L. Yoder B. Goldenberg L. Aguiar D. Bridges T. Segars M. Balbin S. Negahban J. Epaves E. Turner A. Baldwin R. O’Rourke A. Sanchez
L08069SFWMD
Interim Report
Miami-Dade Water and Sewer Department Plan to Address Raw Water Flow Measuring Adjustments (FY 2008) Water Use Permit No. 13-00017-W Limiting Condition No. 48 March 15, 2008

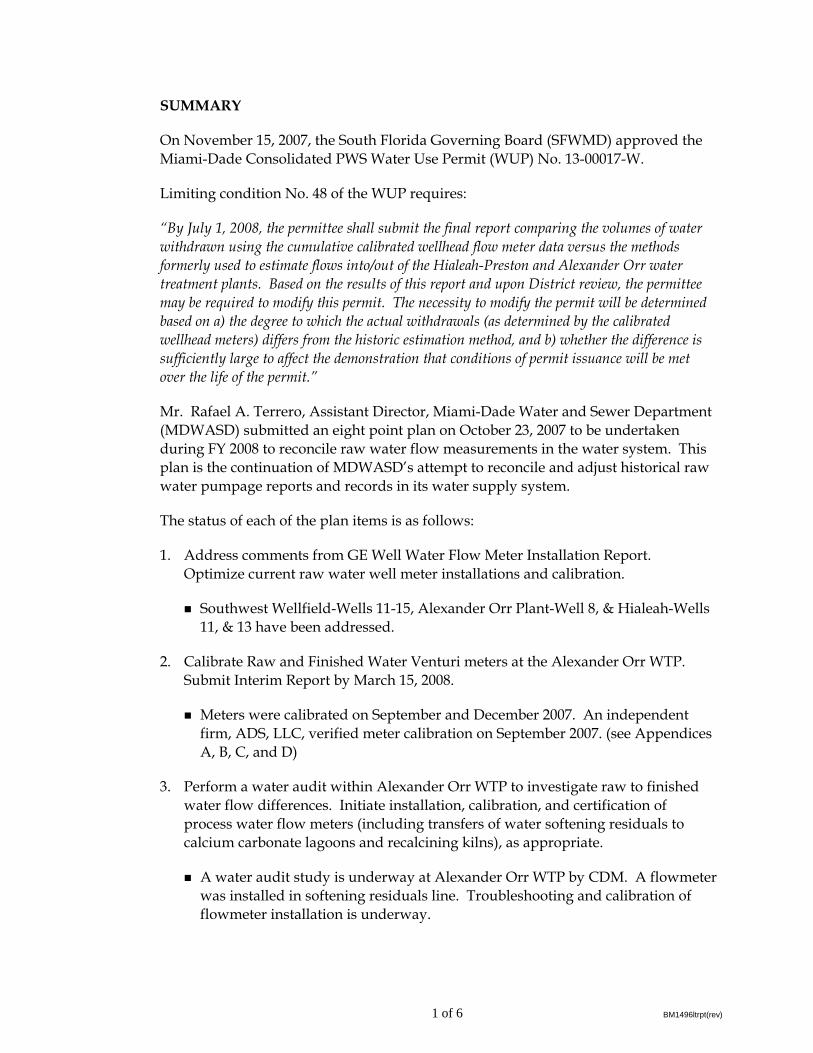
SUMMARY
On November 15, 2007, the South Florida Governing Board (SFWMD) approved the Miami-Dade Consolidated PWS Water Use Permit (WUP) No. 13-00017-W.
Limiting condition No. 48 of the WUP requires:
“By July 1, 2008, the permittee shall submit the final report comparing the volumes of water withdrawn using the cumulative calibrated wellhead flow meter data versus the methods formerly used to estimate flows into/out of the Hialeah-Preston and Alexander Orr water treatment plants. Based on the results of this report and upon District review, the permittee may be required to modify this permit. The necessity to modify the permit will be determined based on a) the degree to which the actual withdrawals (as determined by the calibrated wellhead meters) differs from the historic estimation method, and b) whether the difference is sufficiently large to affect the demonstration that conditions of permit issuance will be met over the life of the permit.”
Mr. Rafael A. Terrero, Assistant Director, Miami-Dade Water and Sewer Department (MDWASD) submitted an eight point plan on October 23, 2007 to be undertaken during FY 2008 to reconcile raw water flow measurements in the water system. This plan is the continuation of MDWASD’s attempt to reconcile and adjust historical raw water pumpage reports and records in its water supply system.
The status of each of the plan items is as follows:
1. Address comments from GE Well Water Flow Meter Installation Report. Optimize current raw water well meter installations and calibration.
Southwest Wellfield-Wells 11-15, Alexander Orr Plant-Well 8, & Hialeah-Wells 11, & 13 have been addressed.
2. Calibrate Raw and Finished Water Venturi meters at the Alexander Orr WTP. Submit Interim Report by March 15, 2008.
Meters were calibrated on September and December 2007. An independent firm, ADS, LLC, verified meter calibration on September 2007. (see Appendices A, B, C, and D)
3. Perform a water audit within Alexander Orr WTP to investigate raw to finished water flow differences. Initiate installation, calibration, and certification of process water flow meters (including transfers of water softening residuals to calcium carbonate lagoons and recalcining kilns), as appropriate.
A water audit study is underway at Alexander Orr WTP by CDM. A flowmeter was installed in softening residuals line. Troubleshooting and calibration of flowmeter installation is underway.
1 of 6 BM1496ltrpt(rev)
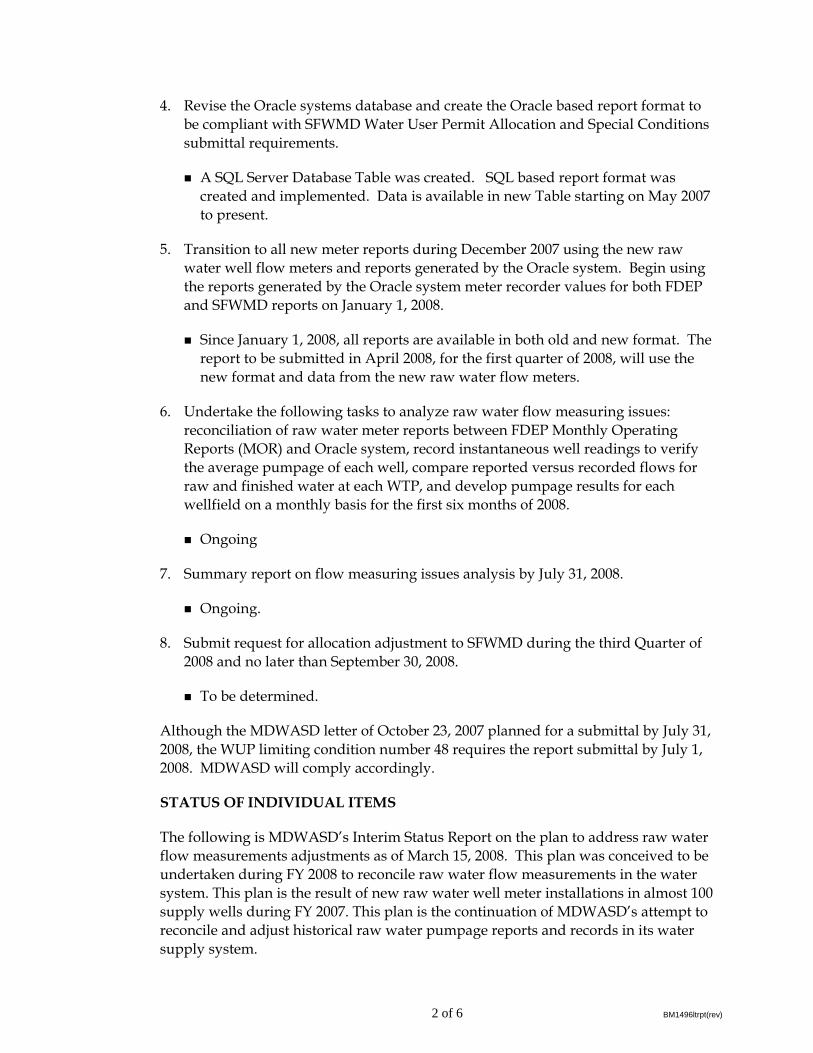
4. Revise the Oracle systems database and create the Oracle based report format to be compliant with SFWMD Water User Permit Allocation and Special Conditions submittal requirements.
A SQL Server Database Table was created. SQL based report format was created and implemented. Data is available in new Table starting on May 2007 to present.
5. Transition to all new meter reports during December 2007 using the new raw water well flow meters and reports generated by the Oracle system. Begin using the reports generated by the Oracle system meter recorder values for both FDEP and SFWMD reports on January 1, 2008.
Since January 1, 2008, all reports are available in both old and new format. The report to be submitted in April 2008, for the first quarter of 2008, will use the new format and data from the new raw water flow meters.
6. Undertake the following tasks to analyze raw water flow measuring issues: reconciliation of raw water meter reports between FDEP Monthly Operating Reports (MOR) and Oracle system, record instantaneous well readings to verify the average pumpage of each well, compare reported versus recorded flows for raw and finished water at each WTP, and develop pumpage results for each wellfield on a monthly basis for the first six months of 2008.
Ongoing
7. Summary report on flow measuring issues analysis by July 31, 2008.
Ongoing.
8. Submit request for allocation adjustment to SFWMD during the third Quarter of 2008 and no later than September 30, 2008.
To be determined.
Although the MDWASD letter of October 23, 2007 planned for a submittal by July 31, 2008, the WUP limiting condition number 48 requires the report submittal by July 1, 2008. MDWASD will comply accordingly.
STATUS OF INDIVIDUAL ITEMS
The following is MDWASD’s Interim Status Report on the plan to address raw water flow measurements adjustments as of March 15, 2008. This plan was conceived to be undertaken during FY 2008 to reconcile raw water flow measurements in the water system. This plan is the result of new raw water well meter installations in almost 100 supply wells during FY 2007. This plan is the continuation of MDWASD’s attempt to reconcile and adjust historical raw water pumpage reports and records in its water supply system.
2 of 6 BM1496ltrpt(rev)
Item 1 - Address Comments from GE Well Water Flow Meter Installation
Comments from GE Well Water Flow Meter Installation Report (August 30, 2007) are being addressed. Work has been completed on the Southwest Well Field, Alexander Orr Jr WTP, and two out of three wells have been address on the Hialeah Well Fields.
Southwest Well Field - Wells 11-15 have pipe sizes that are difficult to match up on GE pipe data sheets and appear to have very thick walls. A section of pipe was replaced similar to Well No. 6. Work has been completed.
Alexander Orr Plant - Well No. 8 has flow disturbances and appeared to have intermittent pockets of air that cause signal to be lost. This problem has been addressed.
Hialeah - Wells 11, 12, & 13 piping and valves were replaced but the valves are throttled to create enough back pressure for the transducers to have good signals and sound speed. More work is required on these wells. Wells 11 & 13 have been shut down.
Miami Springs - Some wells needed pipe replacement and were replaced. Wells 1, 2, 3, 4, 5, 6, 7 & 8 had pipe replaced but still have issues with air pockets…Valves were throttled to create backpressure for the transducers to have good signals and sound speed.
Some work is still pending on the GE well meter installation comments, namely Hialeah, and Miami Spring wells.
Item 2 - Calibrate Raw and Finished Water Venturi Meters at Alexander Orr Jr. Water Treatment Plant (WTP) by March 15, 2008
Calibration on the Venturi Meter Flowmeters’ Electronic Transmitters at the Alexander Orr Jr. Water Treatment Plant (WTP) is being performed every 90 days. Venturi Meters Electronics were last calibrated on September and December 2007 (see Appendix A and B). All four raw water and five finished water venturi meters at the WTP passed the calibration process satisfactorily. Calibration of the venturi meters electronic transmitters employs a Fluke 744 Documenting Process Calibrator, Emerson Hart Field Communicator Model 375, and an Ametek Pneumatic Dead Weight Tester Model PK II. (See enclosed Appendix C electronic transmitter’s for calibration procedures.)
In addition to the above transmitter calibration, an independent firm, ADS, LLC was contacted to verify venturi meter accuracy by performing pitometer tests on the production water meters at the WTP and some well meters in the West Well field. These testing took place between August 27, 2007 and September 24, 2007. (See enclosed appendix D) The test consisted of the following:
3 of 6 BM1496ltrpt(rev)
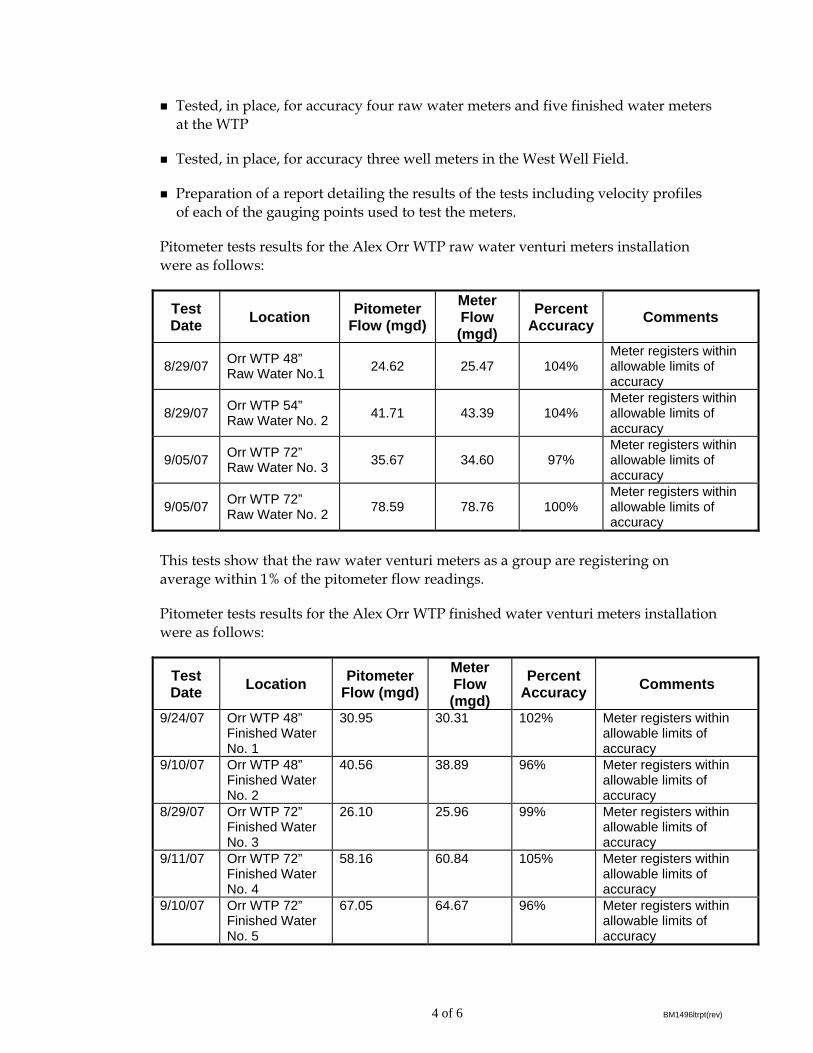
Tested, in place, for accuracy four raw water meters and five finished water meters at the WTP
Tested, in place, for accuracy three well meters in the West Well Field.
Preparation of a report detailing the results of the tests including velocity profiles of each of the gauging points used to test the meters.
Pitometer tests results for the Alex Orr WTP raw water venturi meters installation were as follows:
Test Date Location Pitometer
Flow (mgd) Meter Flow (mgd)
Percent Accuracy Comments
8/29/07 Orr WTP 48” Raw Water No.1 24.62 25.47 104%
Meter registers within allowable limits of accuracy
8/29/07 Orr WTP 54” Raw Water No. 2 41.71 43.39 104%
Meter registers within allowable limits of accuracy
9/05/07 Orr WTP 72” Raw Water No. 3 35.67 34.60 97%
Meter registers within allowable limits of accuracy
9/05/07 Orr WTP 72” Raw Water No. 2 78.59 78.76 100%
Meter registers within allowable limits of accuracy
This tests show that the raw water venturi meters as a group are registering on average within 1% of the pitometer flow readings.
Pitometer tests results for the Alex Orr WTP finished water venturi meters installation were as follows:
Test Date Location Pitometer
Flow (mgd) Meter Flow (mgd)
Percent Accuracy Comments
9/24/07 Orr WTP 48” Finished Water No. 1
30.95 30.31 102% Meter registers within allowable limits of accuracy
9/10/07 Orr WTP 48” Finished Water No. 2
40.56 38.89 96% Meter registers within allowable limits of accuracy
8/29/07 Orr WTP 72” Finished Water No. 3
26.10 25.96 99% Meter registers within allowable limits of accuracy
9/11/07 Orr WTP 72” Finished Water No. 4
58.16 60.84 105% Meter registers within allowable limits of accuracy
9/10/07 Orr WTP 72” Finished Water No. 5
67.05 64.67 96% Meter registers within allowable limits of accuracy
4 of 6 BM1496ltrpt(rev)
This tests show that the venturi meters as a group are registering within 1% of the pitometer flow readings.
Item 3 - Perform a water audit within Alexander Orr WTP
CDM has been retained to evaluate the various flow streams identified within the plant and to verify the calibration of the venturi meters at the WTP. A kick-off meeting was held at the WTP on March 11, 2008. CDM will perform a water audit within the WTP to investigate raw to finished water flow differences, and initiate installation, calibration, and certification of process water flow meters (including transfers of water softening residuals to calcium carbonate lagoons and recalcining kilns), as appropriate. CDM will consider the various methodologies required to reliably estimate unmetered or unknown flows. In addition, proper analytical methods for determining sludge density and water content in solids residuals will be identified.
MDWASD’s instrumentation personnel installed a flowmeter on the water softening residuals line. Instrumentation personnel are still verifying and checking with the initial readings from this meter.
Item 4 - Revise the Oracle Systems database
The “Oracle systems database” has been revised and is now called the Normalized Database. It is a SQL Database Server Table which has integrated all raw and finished water SCADA meter reading reports within a single table. This table now holds data from May 2007 to present. A SQL based report format to be compliant with SFWMD Water User Permit Allocation and Special Conditions submittal requirements has been created (see enclosed Appendix F).
Item 5 - Transition to all new meter reports during December 2007
Currently, all raw and finished water meter reports are being prepared in both the old and new format while the new meter installations comments are being addressed and the new system’s performance is being assessed.
Item 6 - Undertake the following tasks to analyze raw water flow measuring issues
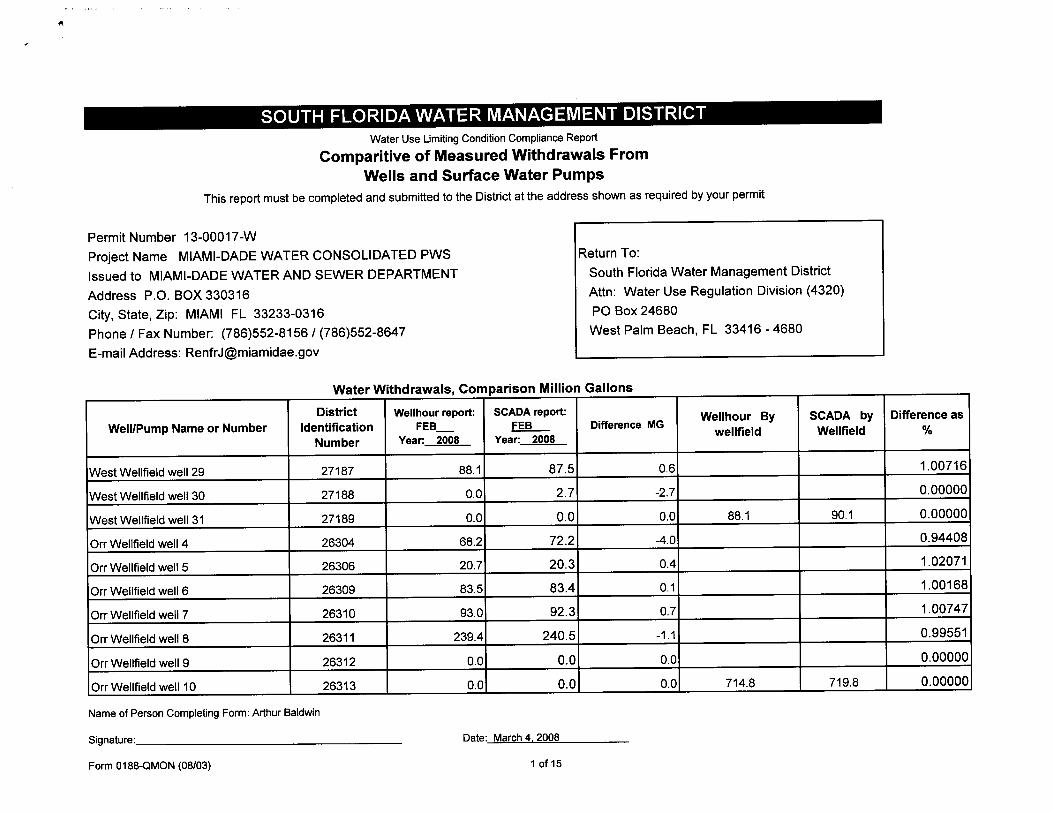
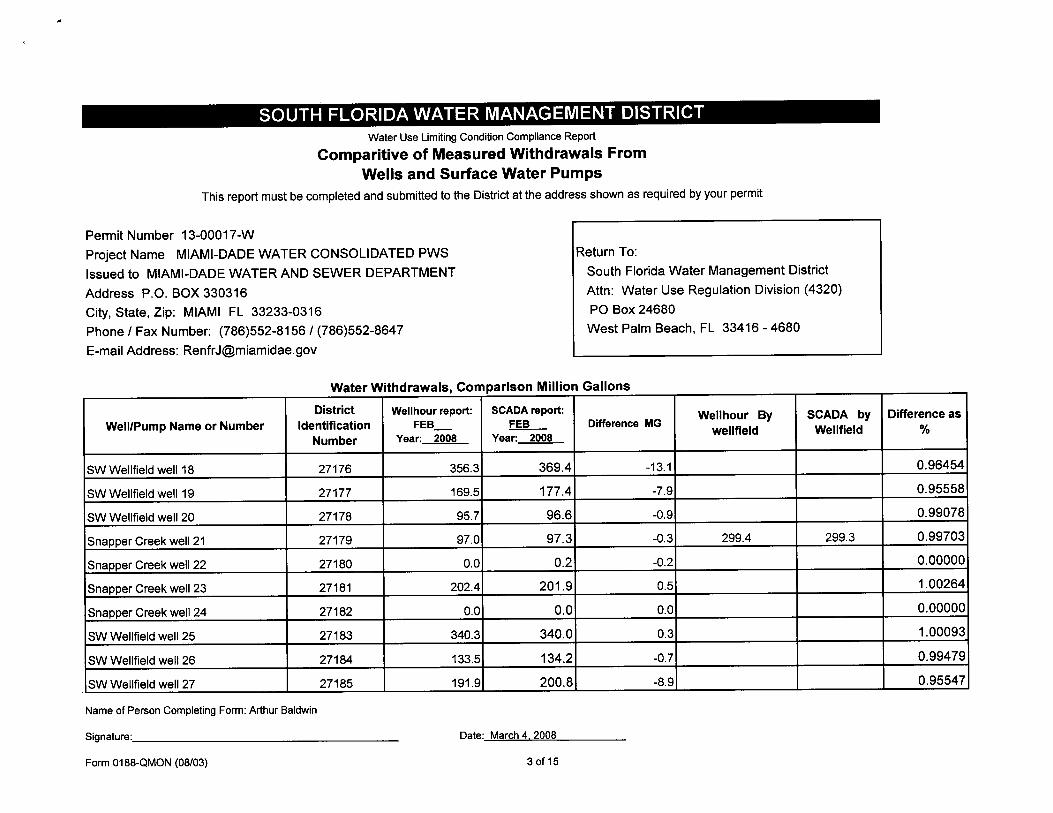
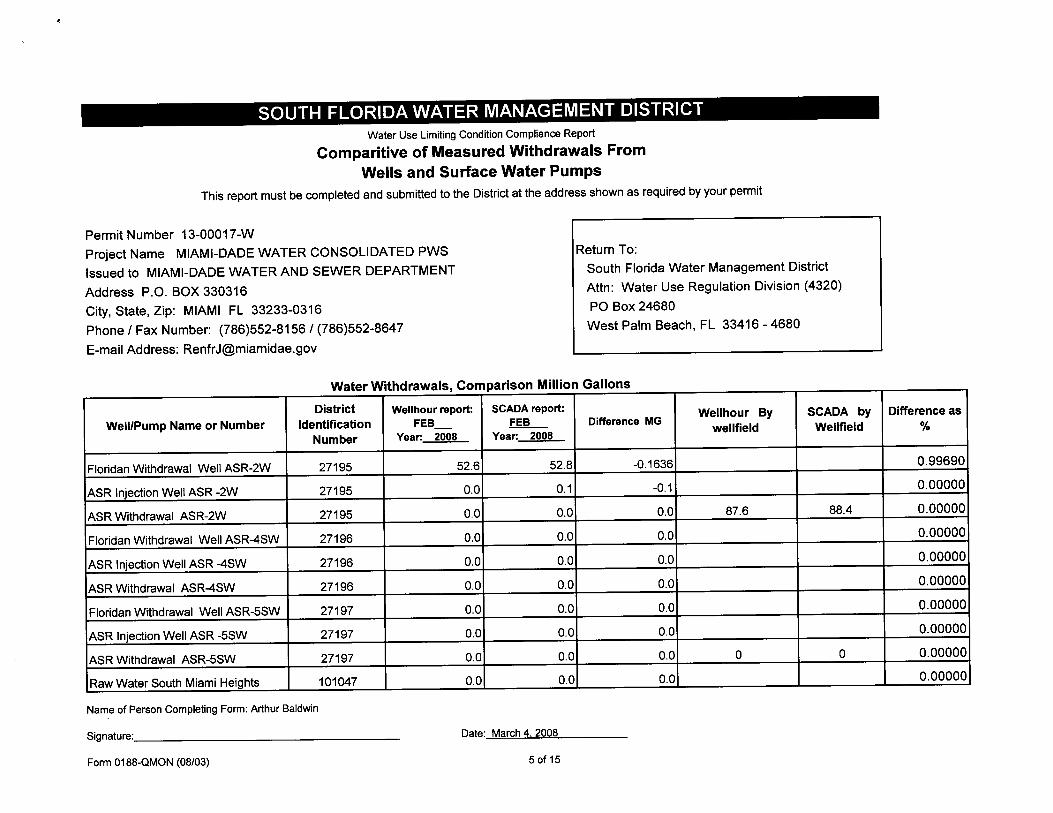
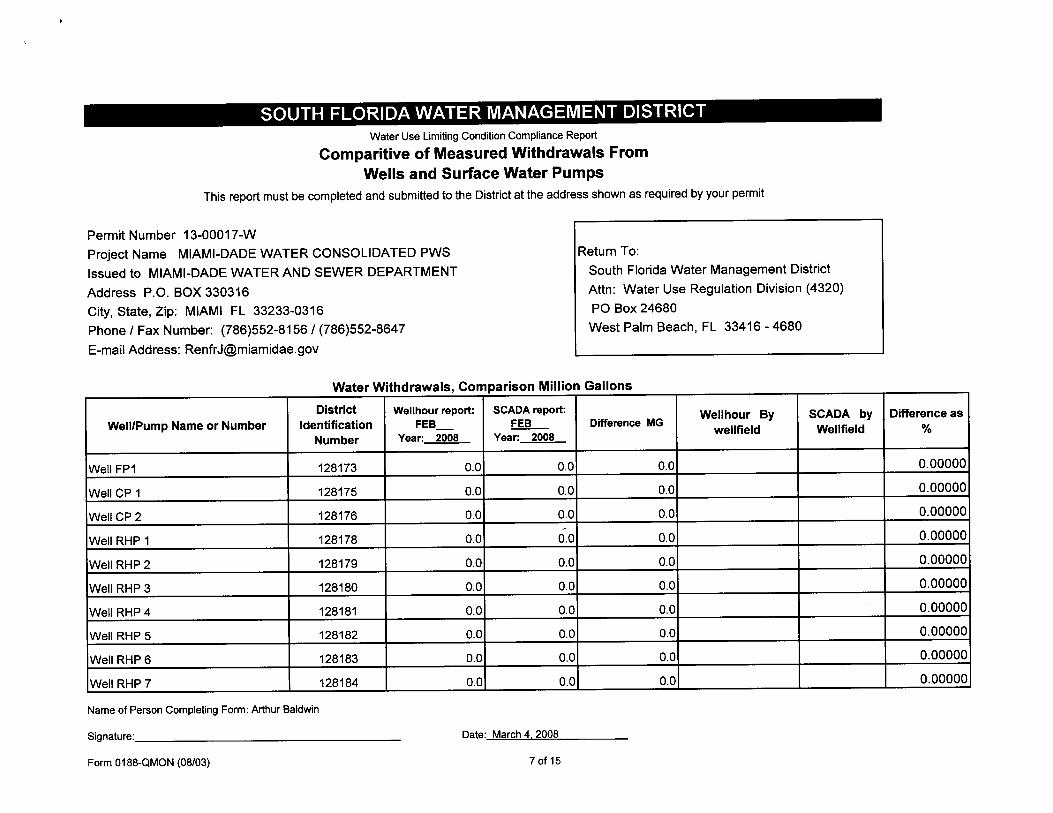
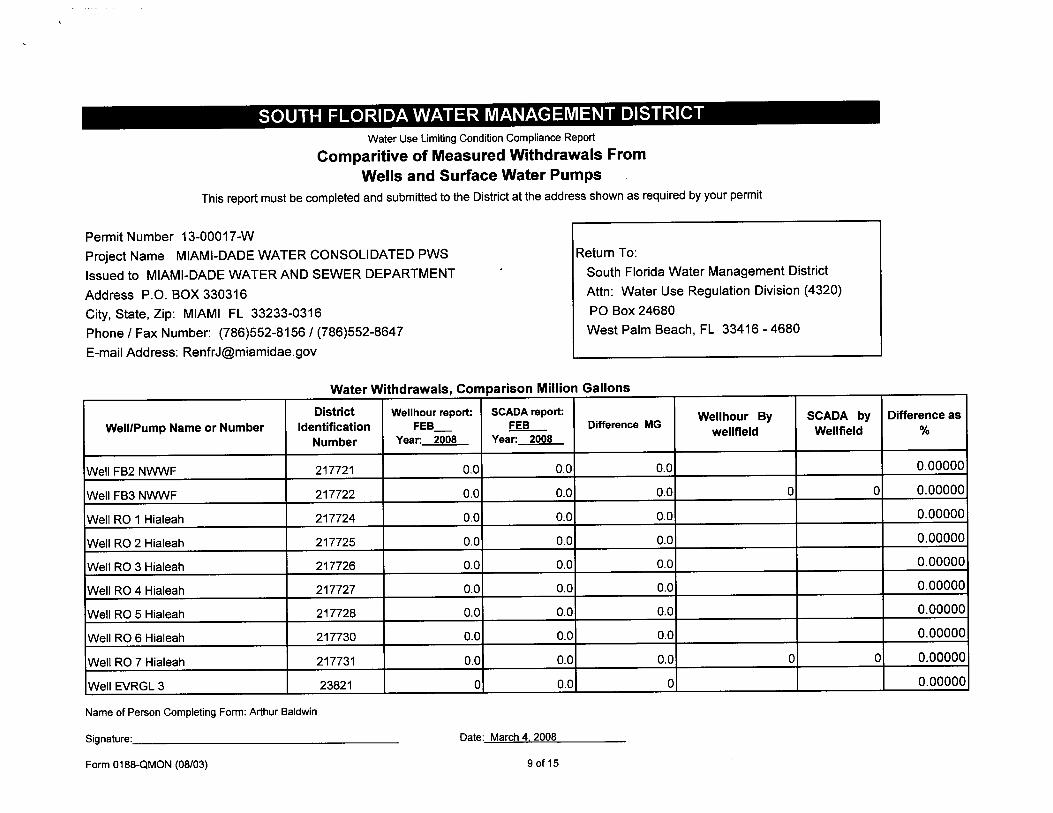
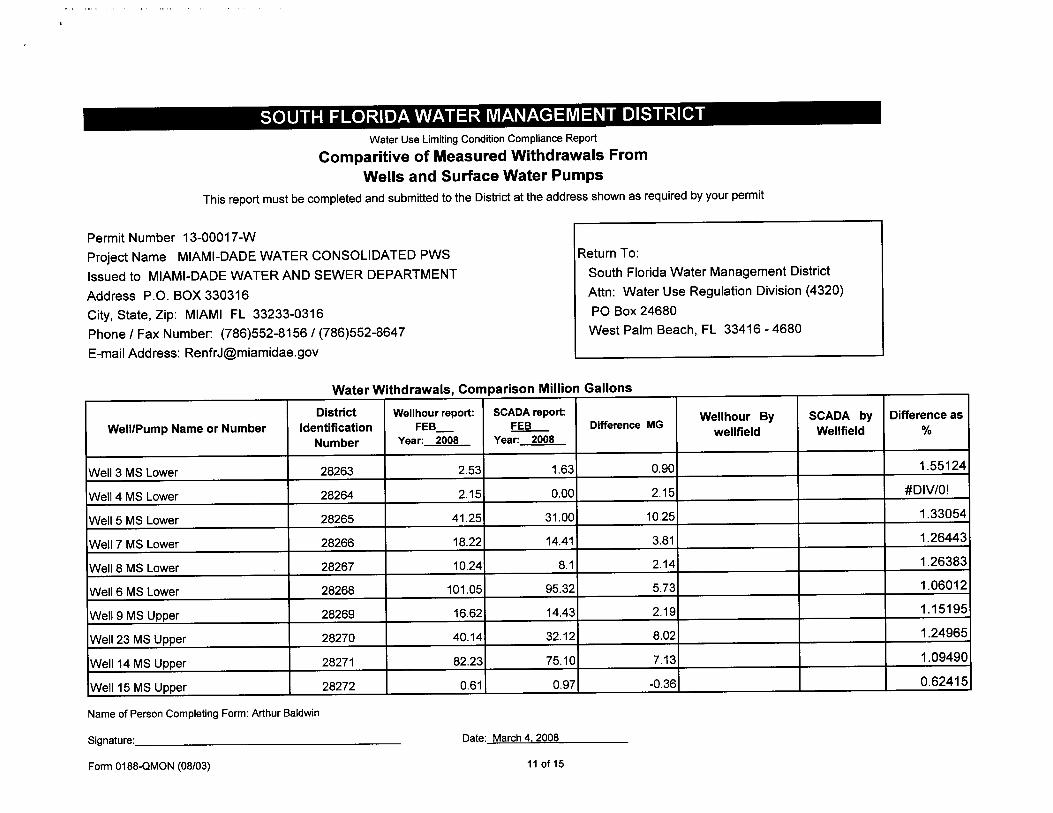
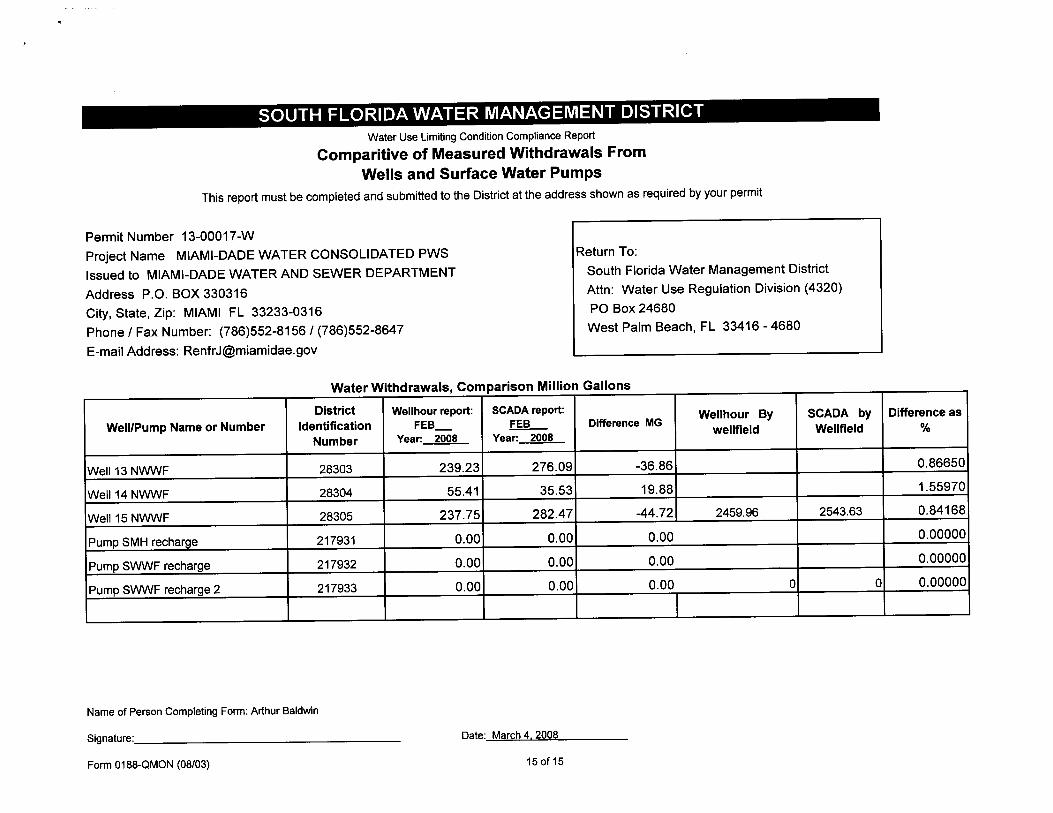
MDWASD performed a Comparison of Measured Withdrawals from Wells and Surface Water Pumps for a three month period: December 2007, January 2008, and February 2008 (see Appendix E).
CDM was recently authorized to perform the following tasks for the Alexander Orr WTP system:
Reconciliation of raw water meter reports between FDEP Monthly Operating Reports (MOR) and historical Normalized database (alias Oracle) system. CDM
5 of 6 BM1496ltrpt(rev)
will prepare an analysis of daily historical FDEP MOR and historical Normalized Data system meter records for a period of several months.
Comparative analysis of reported versus recorded flows for raw and finished water. Pumpage results for each wellfield for the month of March 2008.
Adjustment factor for raw water by wellfield based on WTP influent flow. CDM will derive a factor for the individual wellfield metered flows and plant raw water (Venturi) flows so that the sum of the adjusted wellfield metered flows match the plant raw water Venturi meter flows.
Item 7 - Summary report on flow measuring issues analysis by July 31, 2008 (July 1 on Limiting Condition No. 48)
The summary report is anticipated to be submitted by July 1, 2008.
Item 8 - Submit request for allocation adjustment to SFWMD during the third Quarter of 2008
To be determined based on the results of ongoing analyses and investigations.
The following Appendices are submitted in support of this Interim Report:
Appendix A Water Report Alex Orr In-Plant Transmitters and Recorders for September 2007 (Venturi Meter Transmitter Calibration September 2007)
Appendix B Water Report Alex Orr In-Plant Transmitters and Recorders for December 2007 (Venturi Meter Transmitter Calibration December 2007)
Appendix C MDWASD Procedures for Venturi Flow Transmitter Calibrations for Plant and Pay Meters (Venturi Transmitter Calibration Procedure)
Appendix D ADS, LLC Pitometer Testing Report, September 2007 (Venturi Calibration Verification August – September 2007)
Appendix E Comparative of Measured Withdrawals from Wells and Surface Water Pumps (December 2007 thru February 2008)
Appendix F Water Treatment Division Data Evaluation and Automation Project (Electronic Database Project)
6 of 6 BM1496ltrpt(rev)
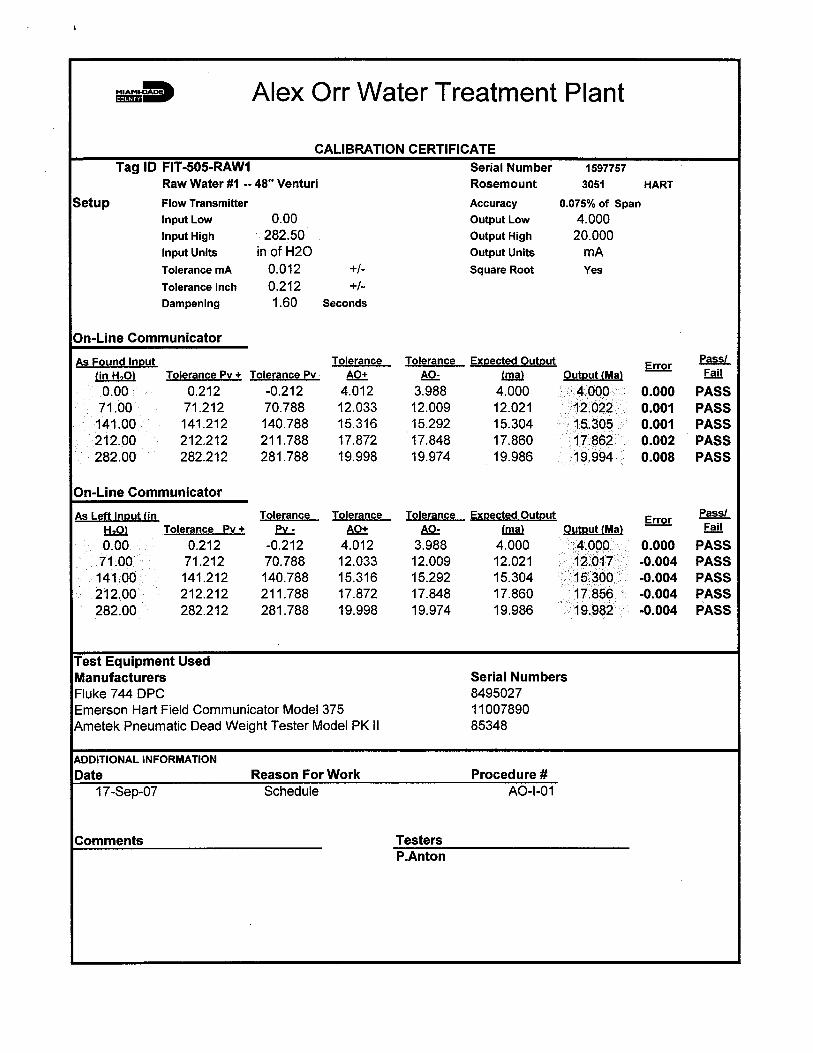
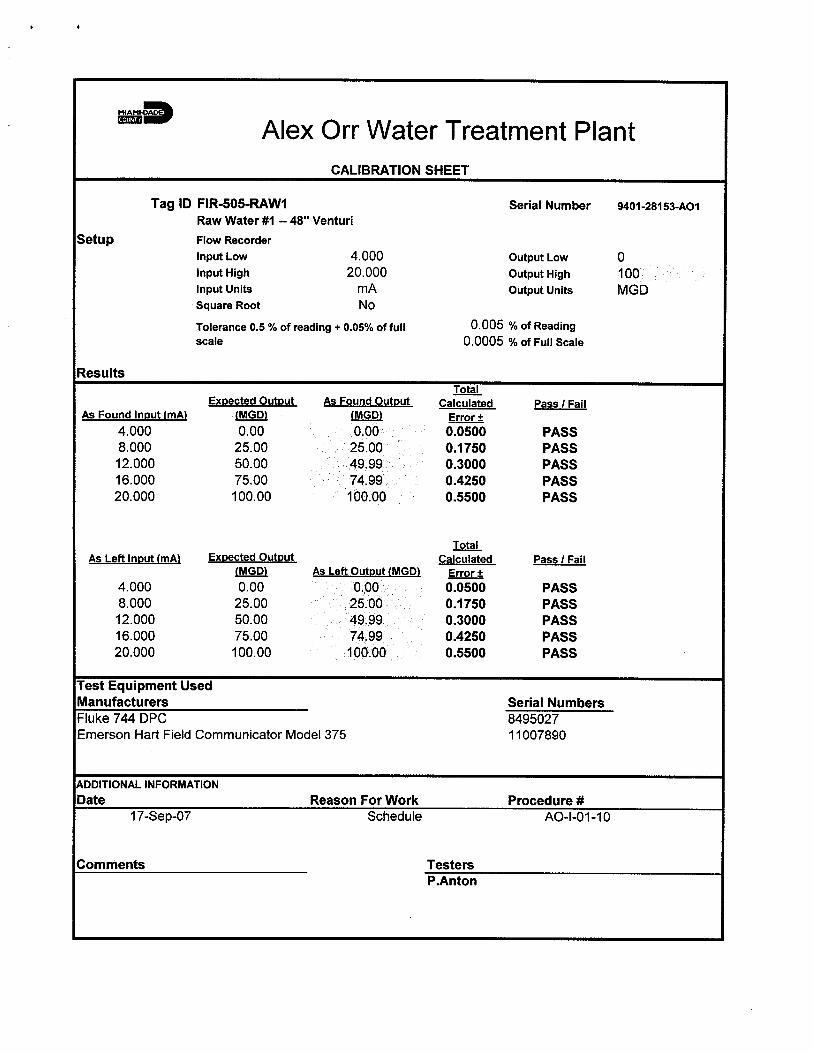


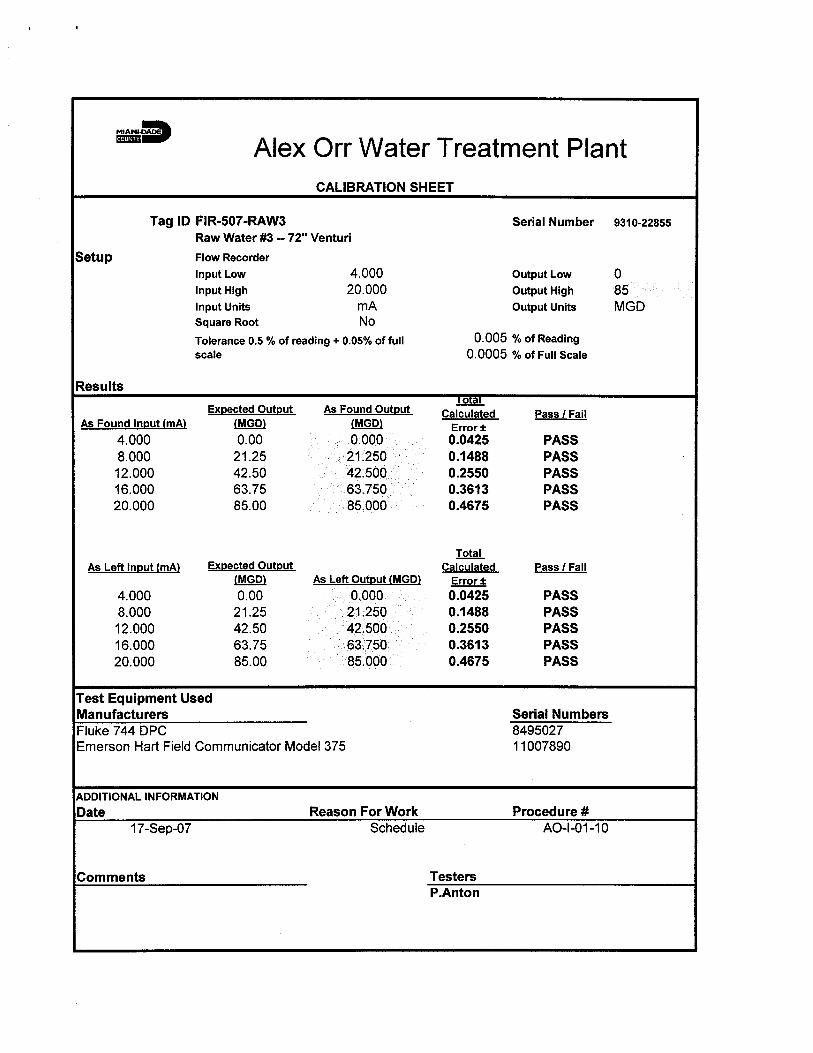
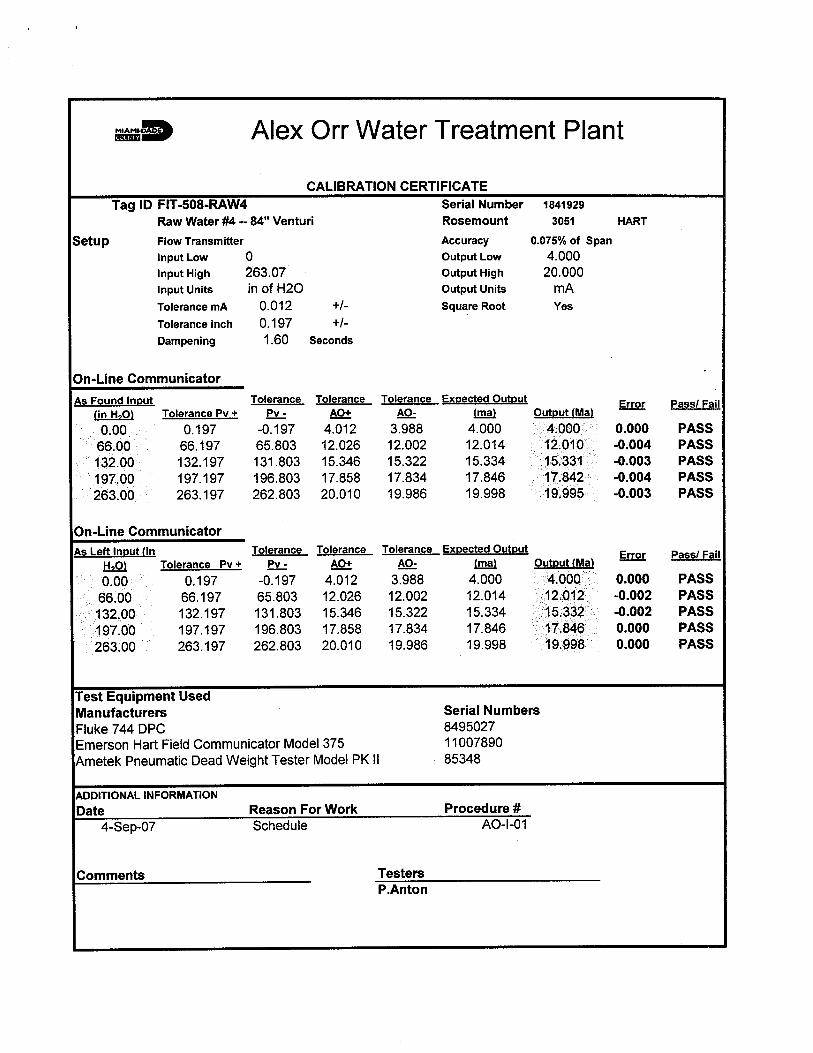
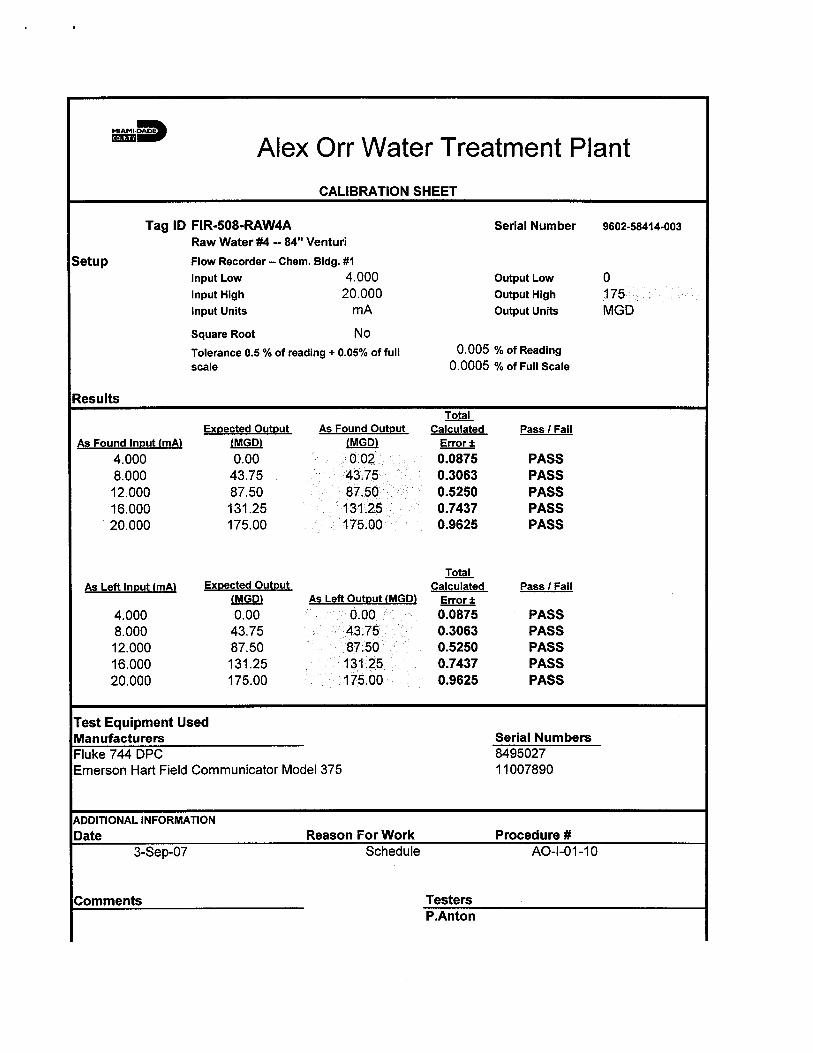
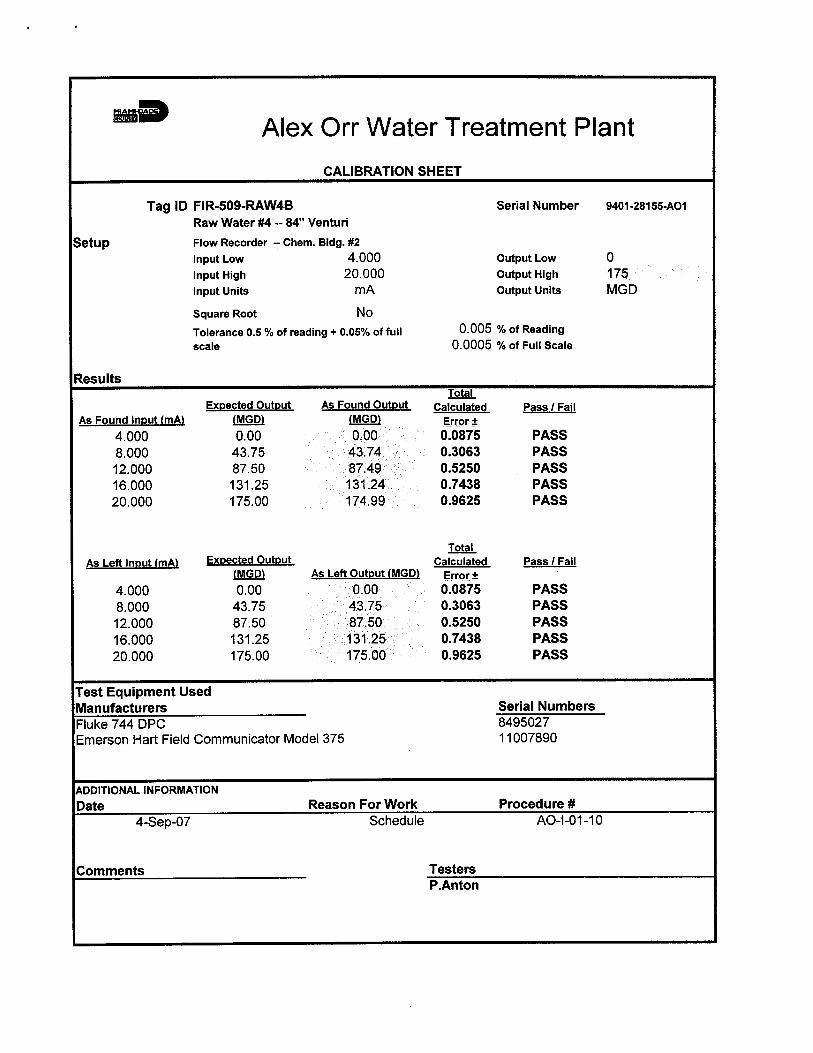
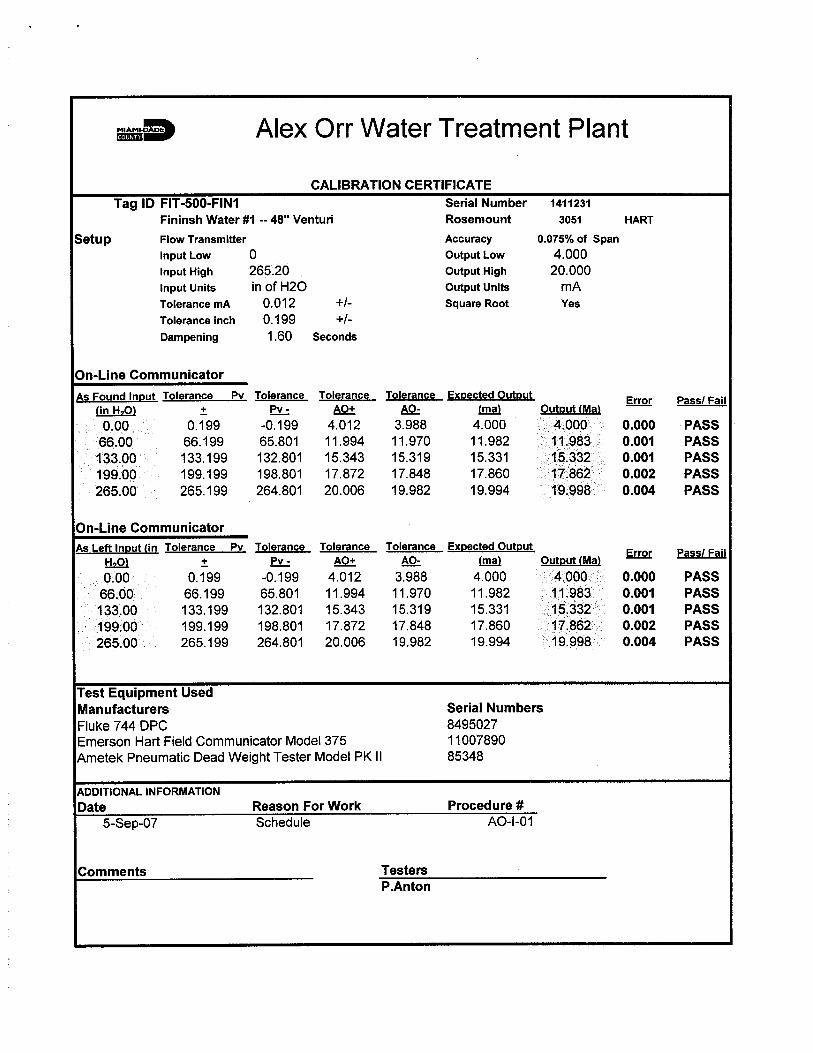
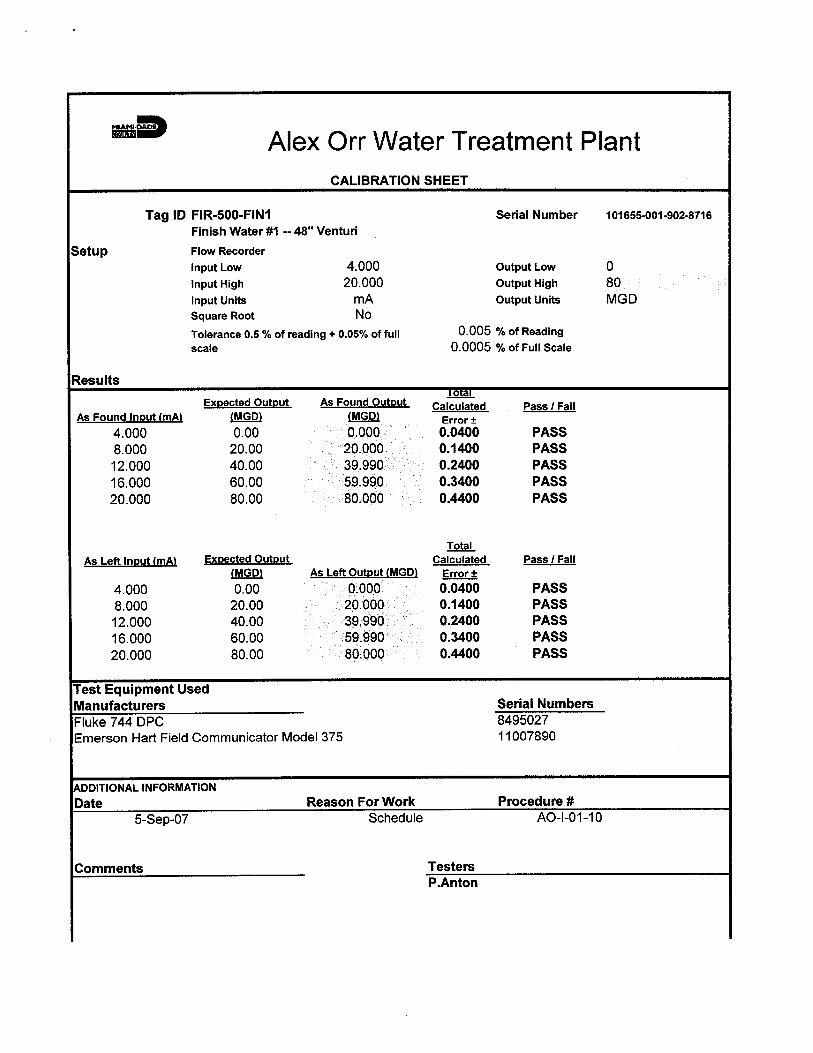
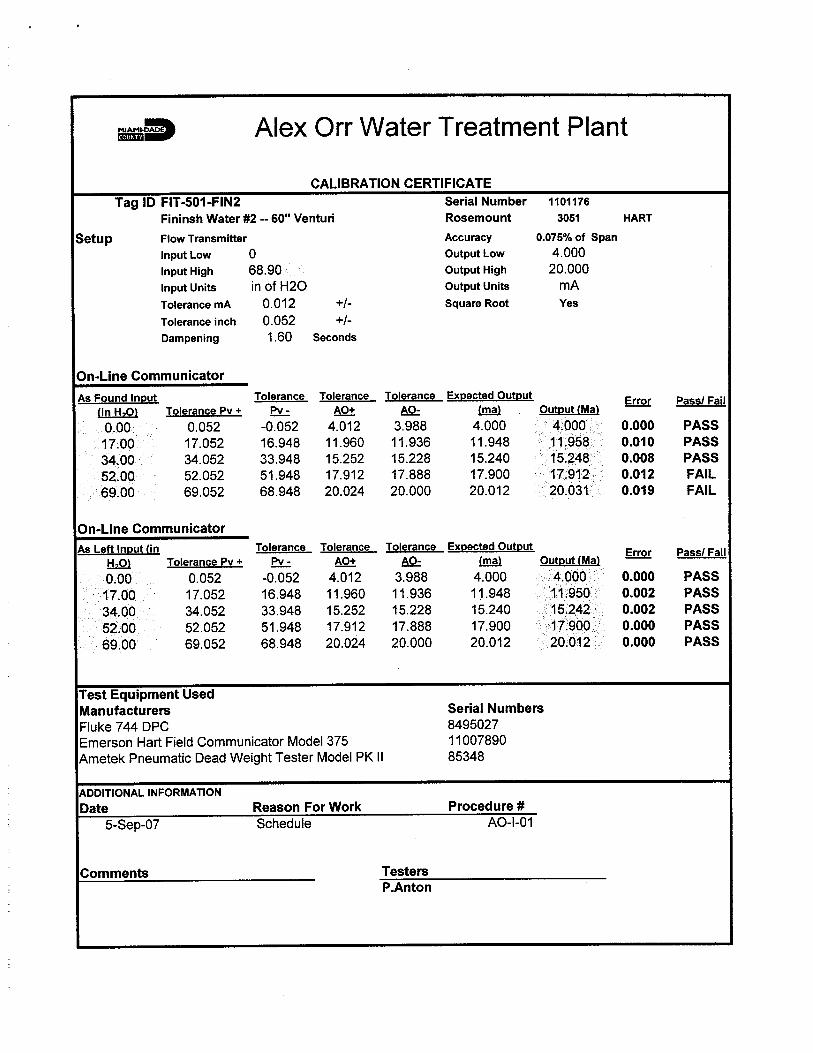

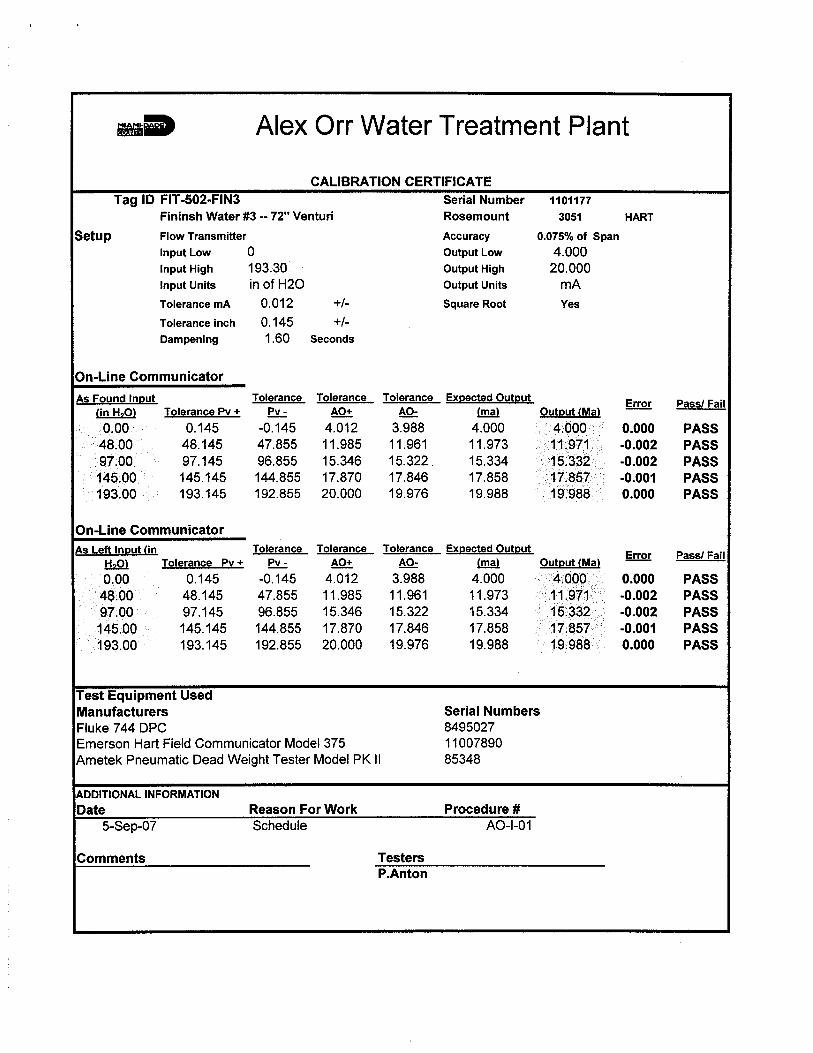
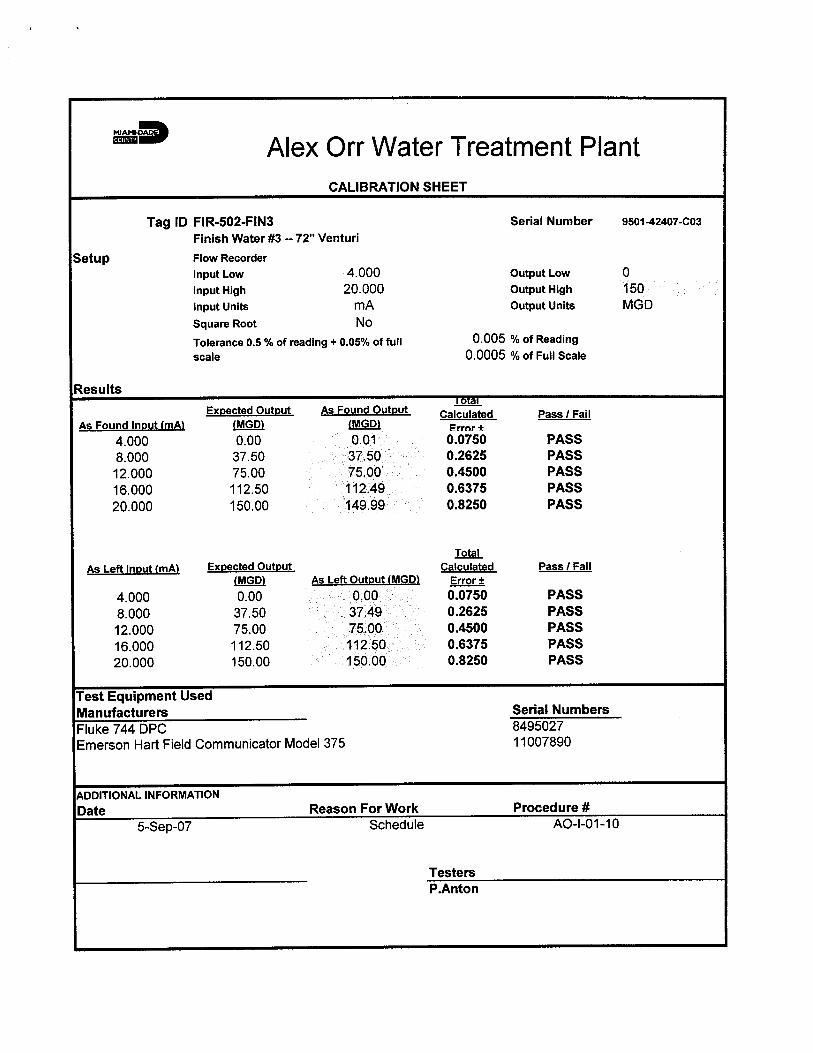

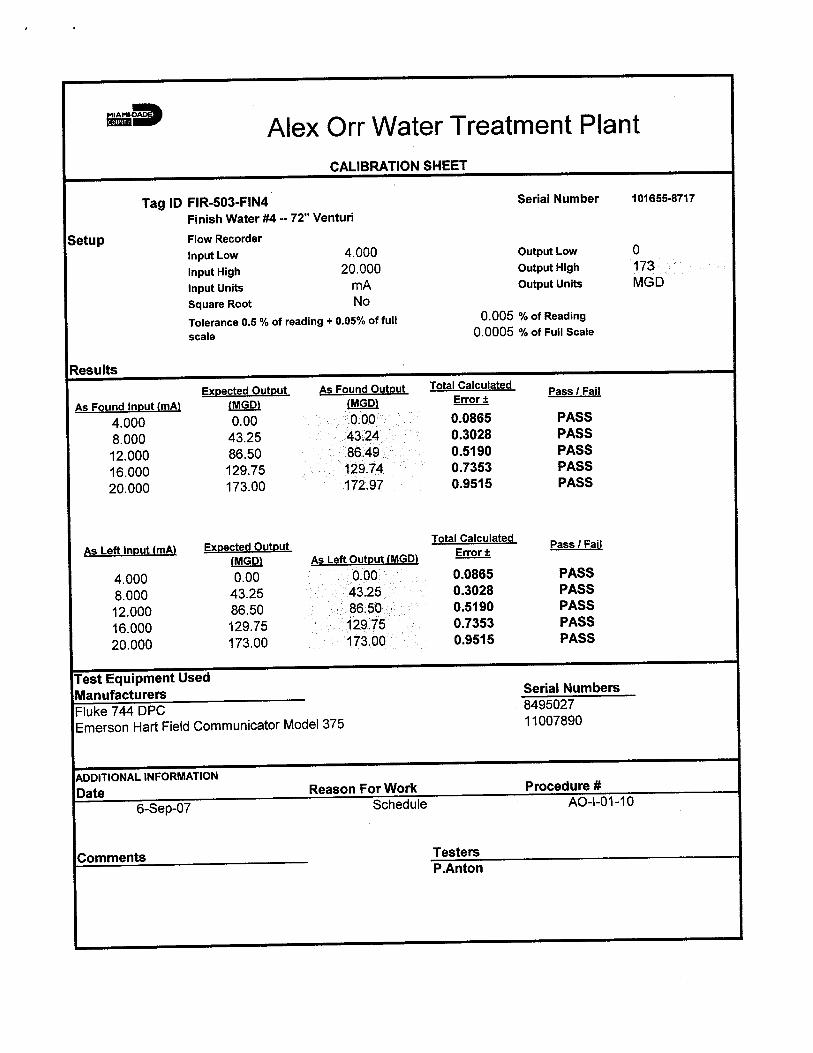

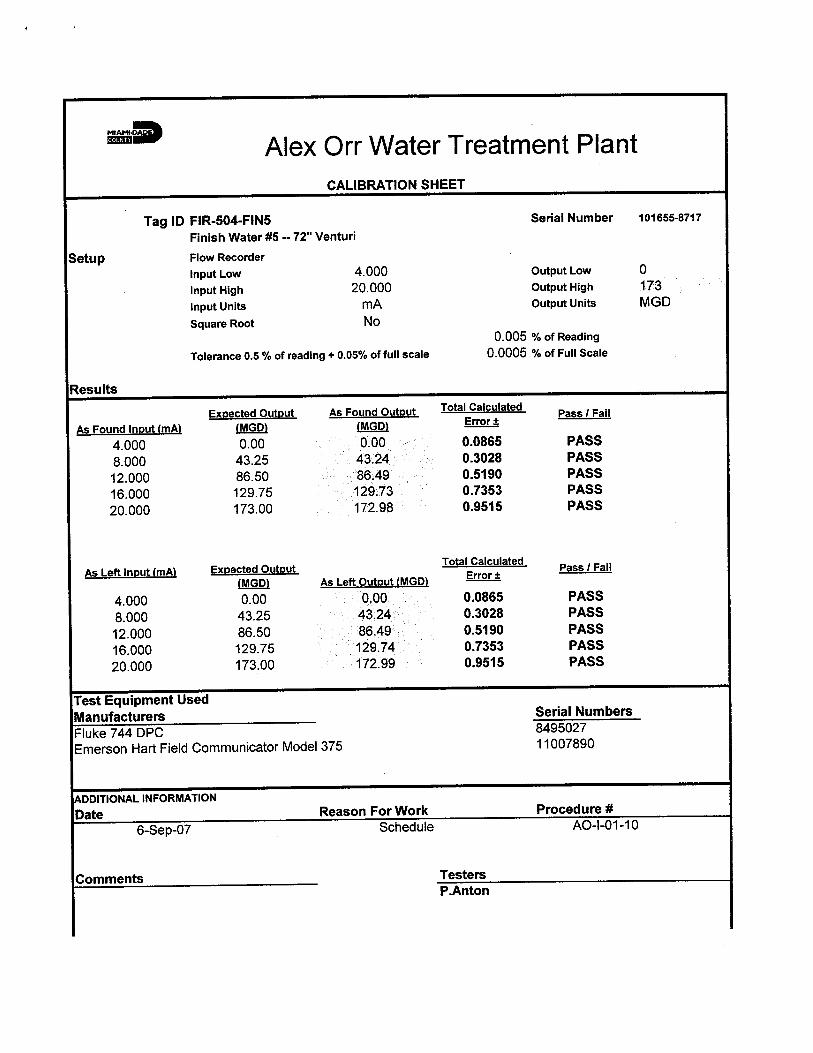
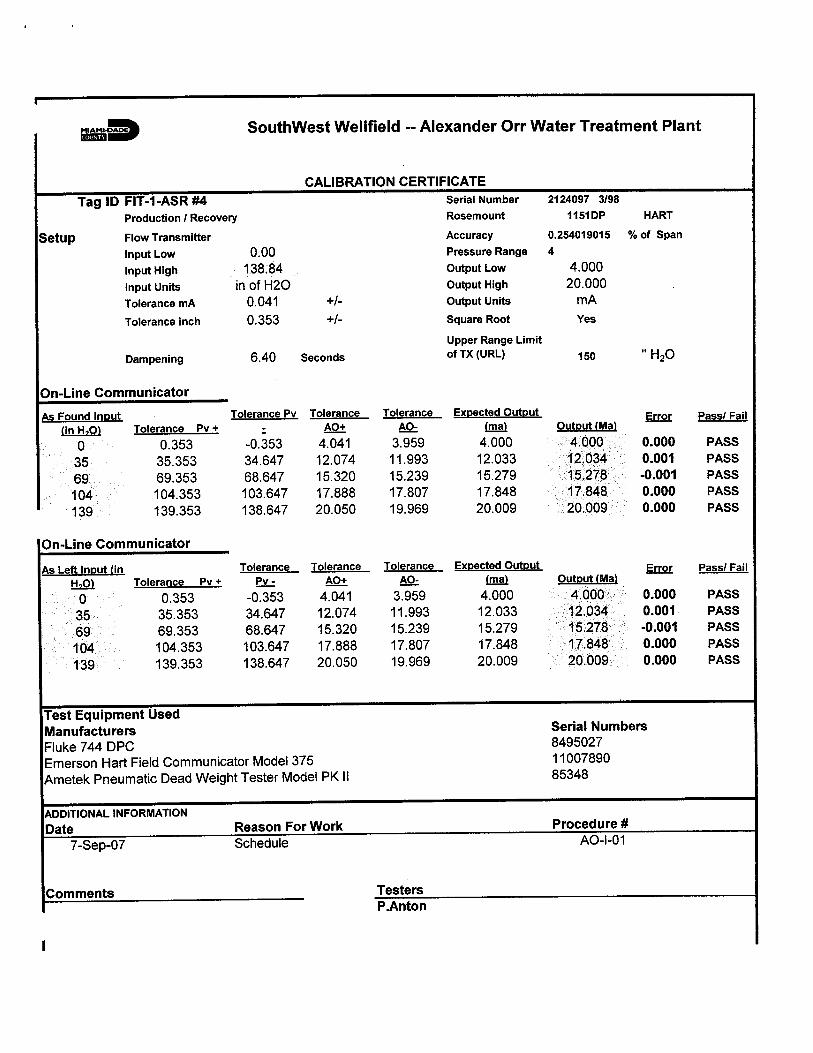
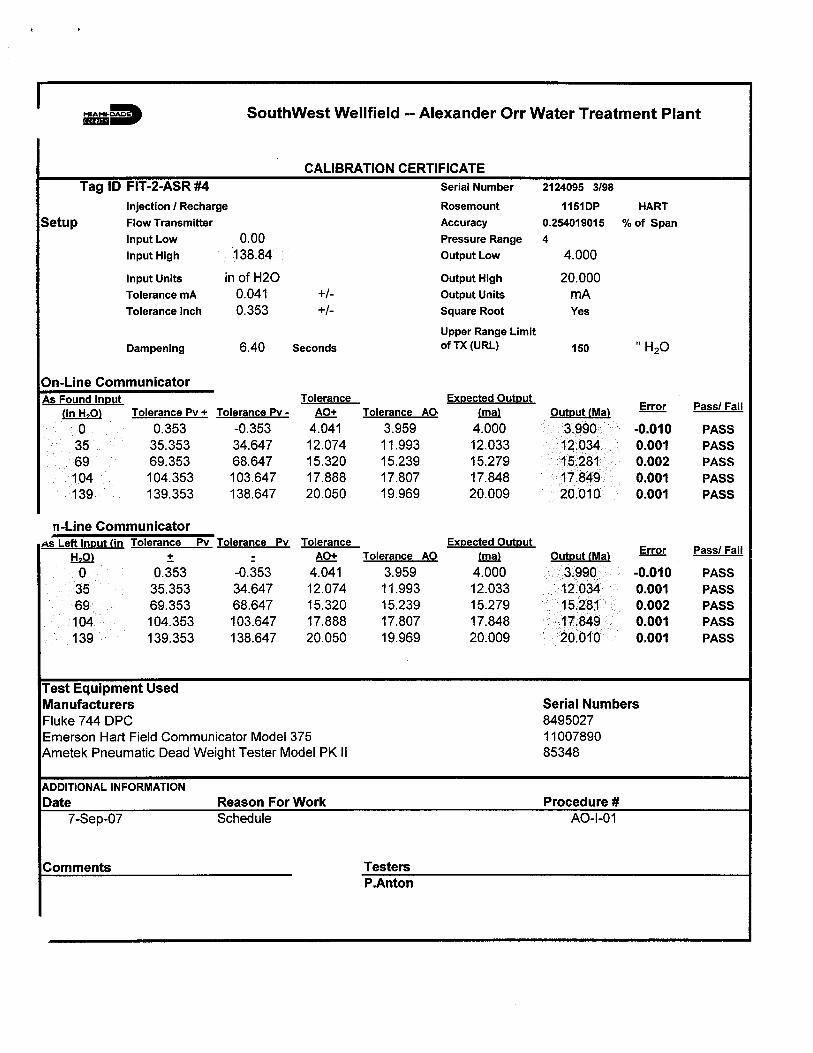
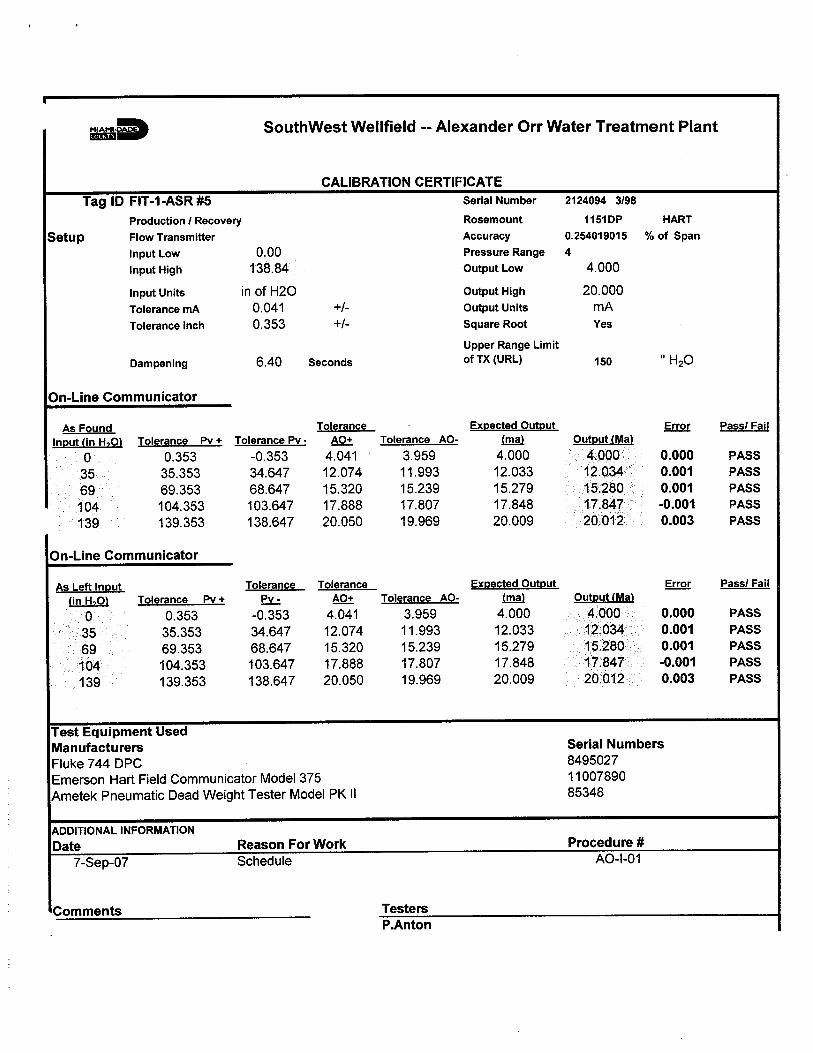
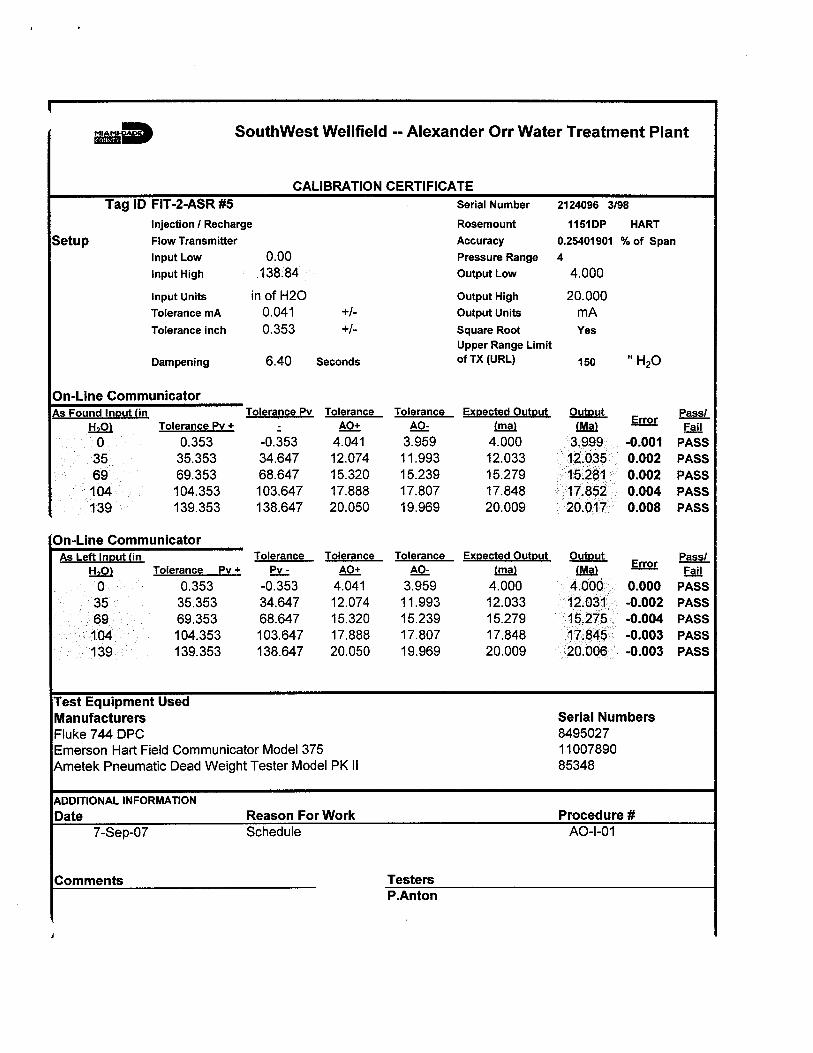

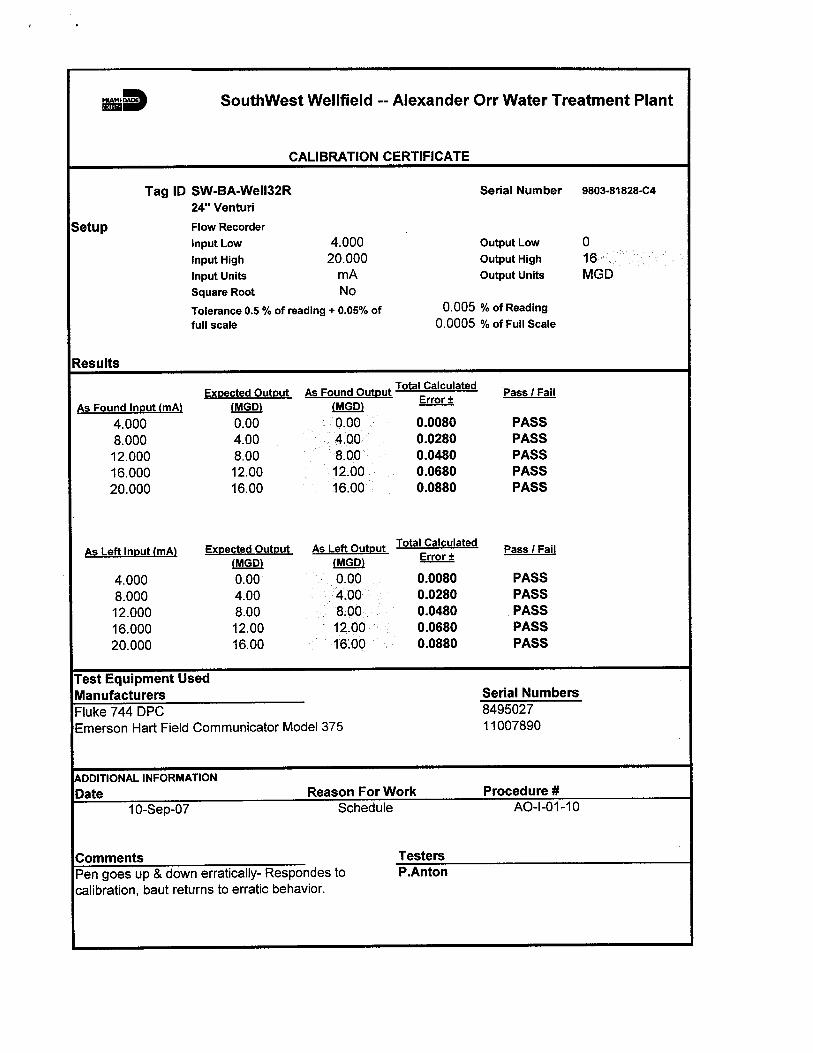

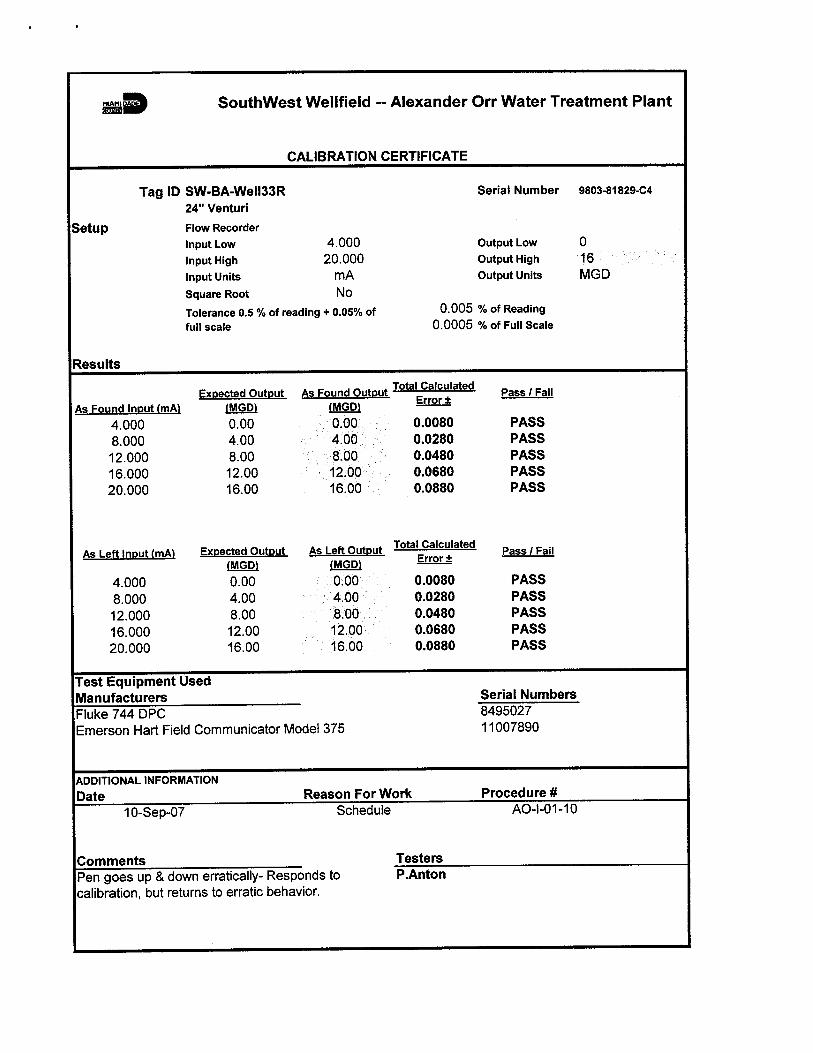
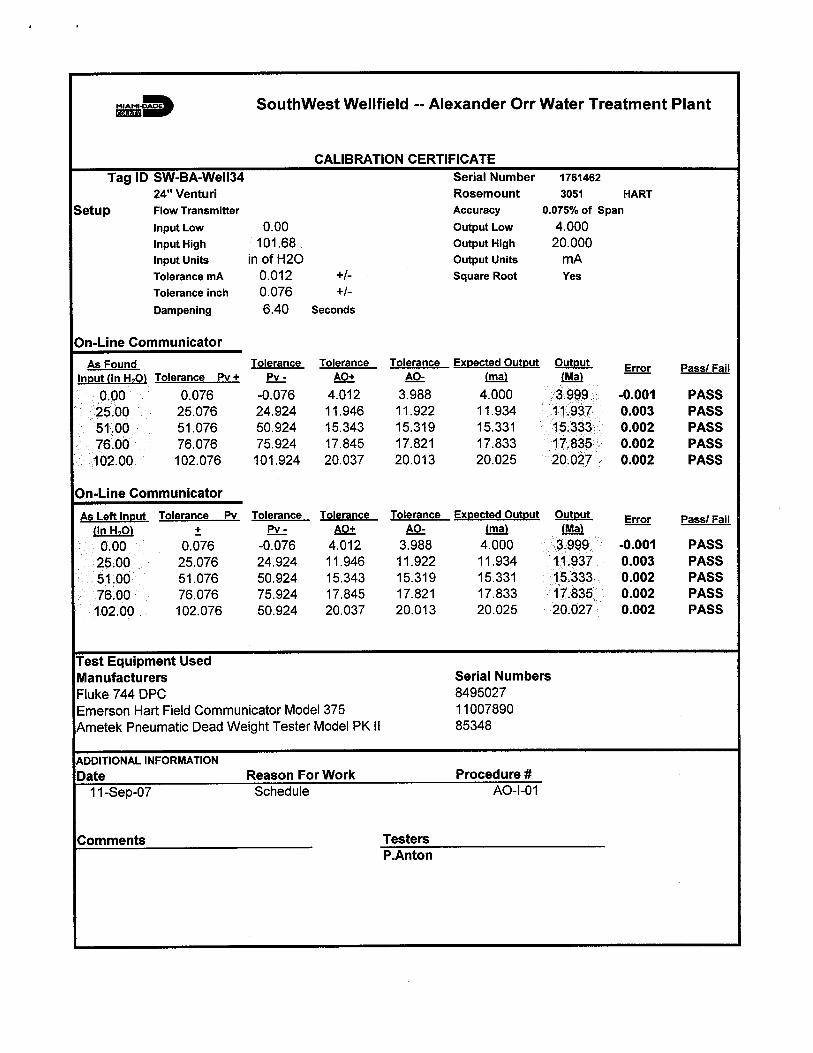
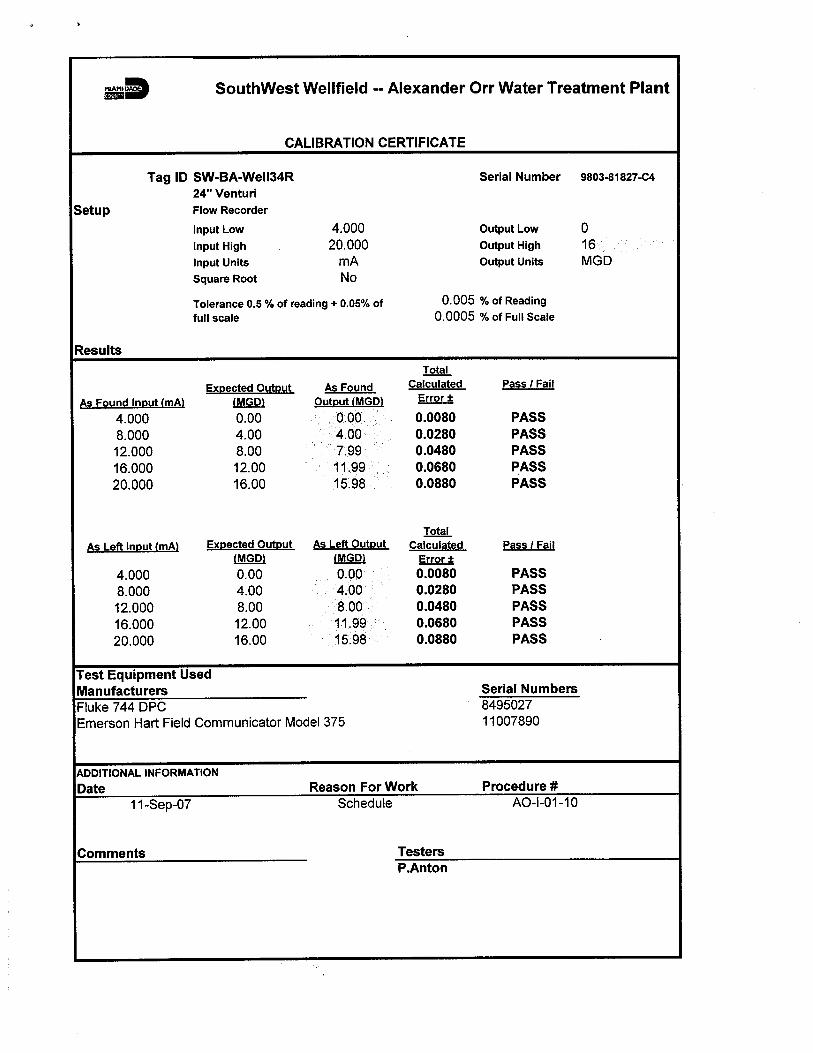

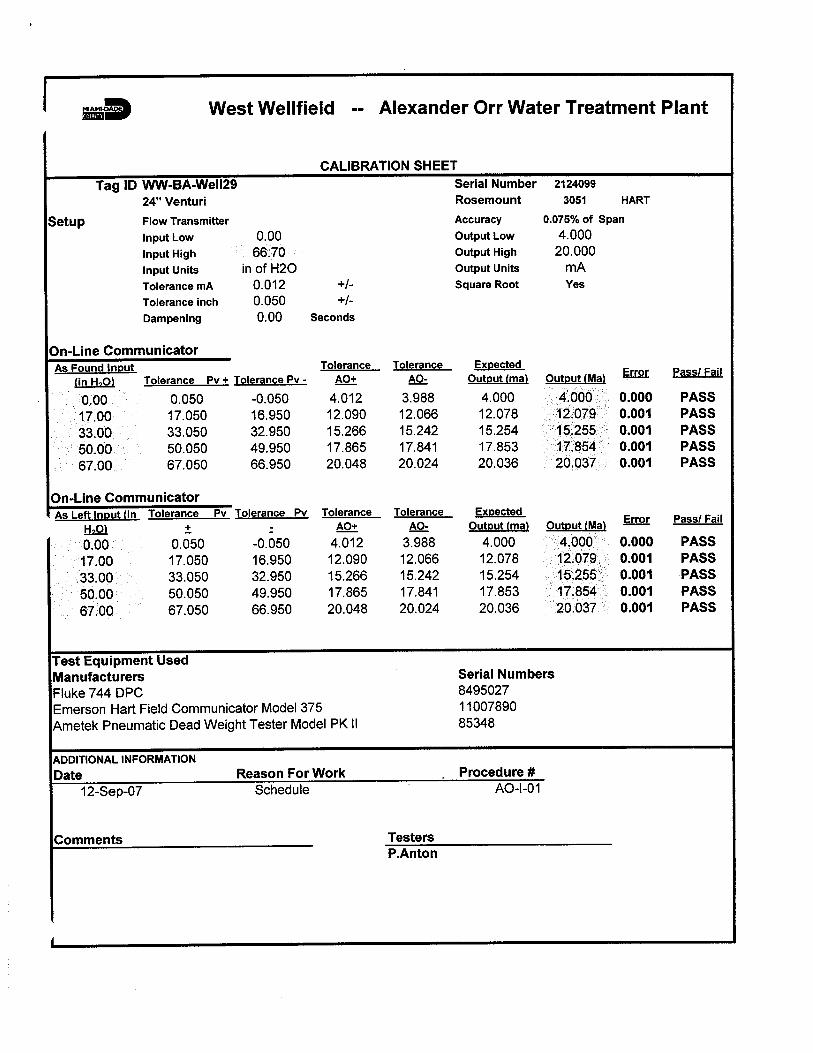
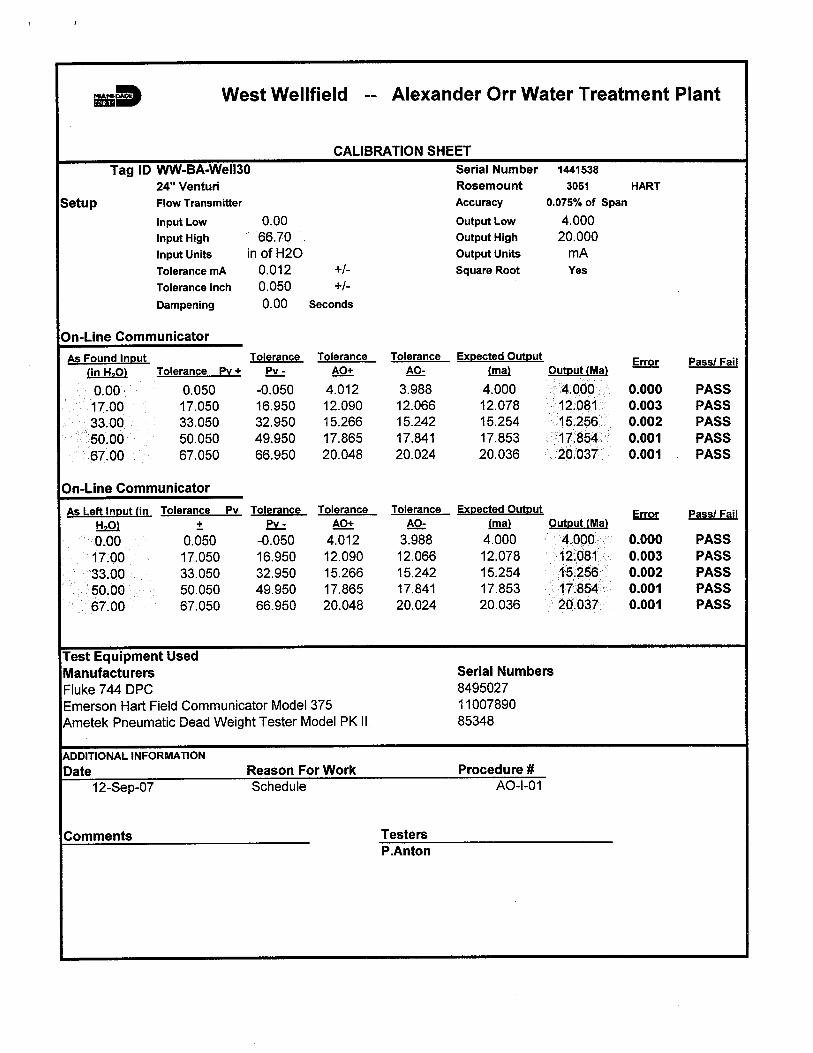


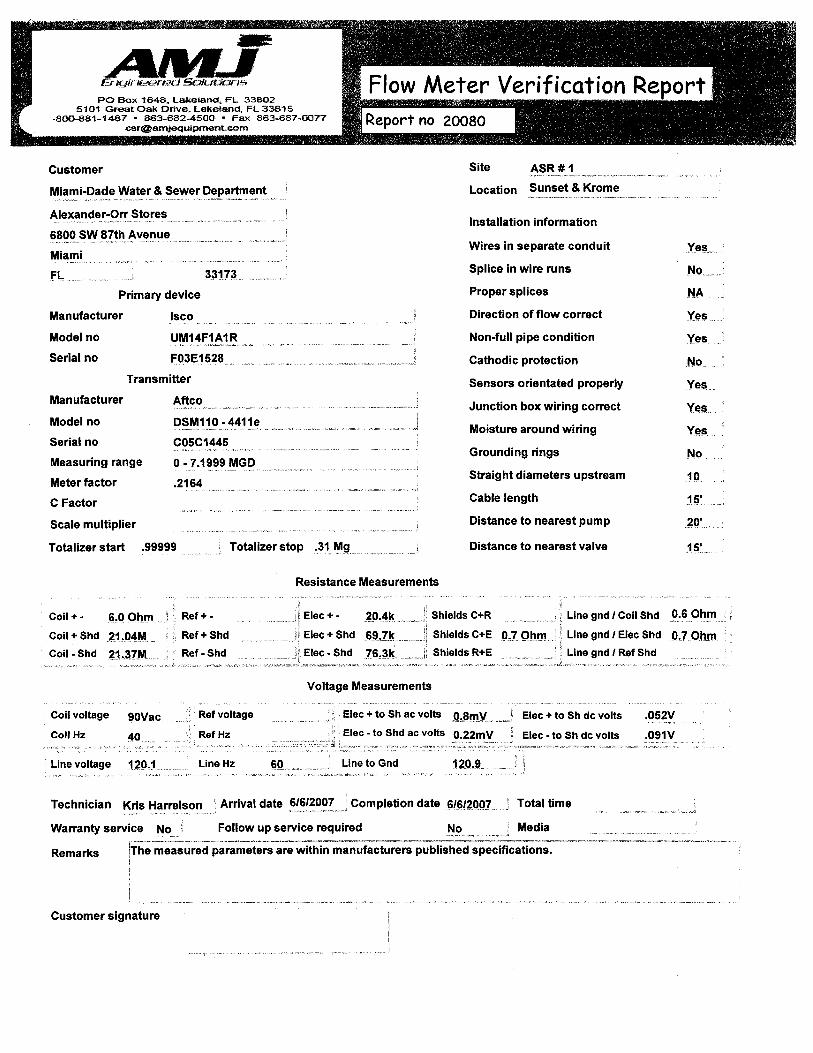
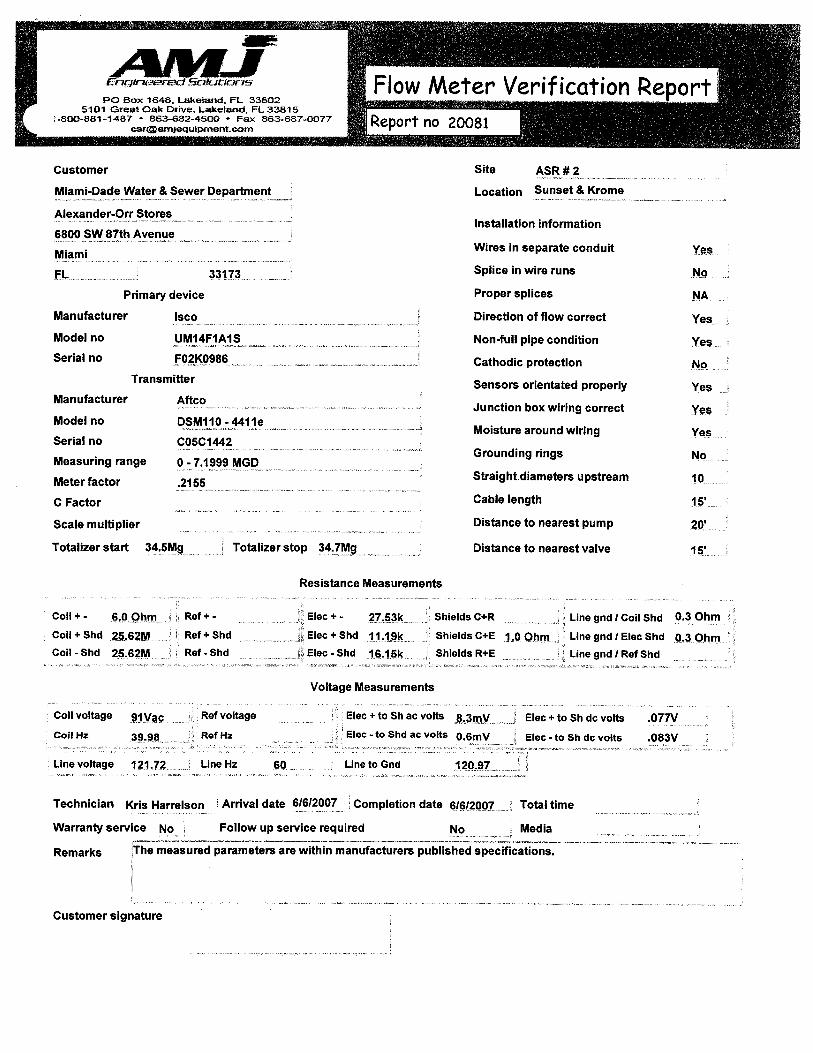

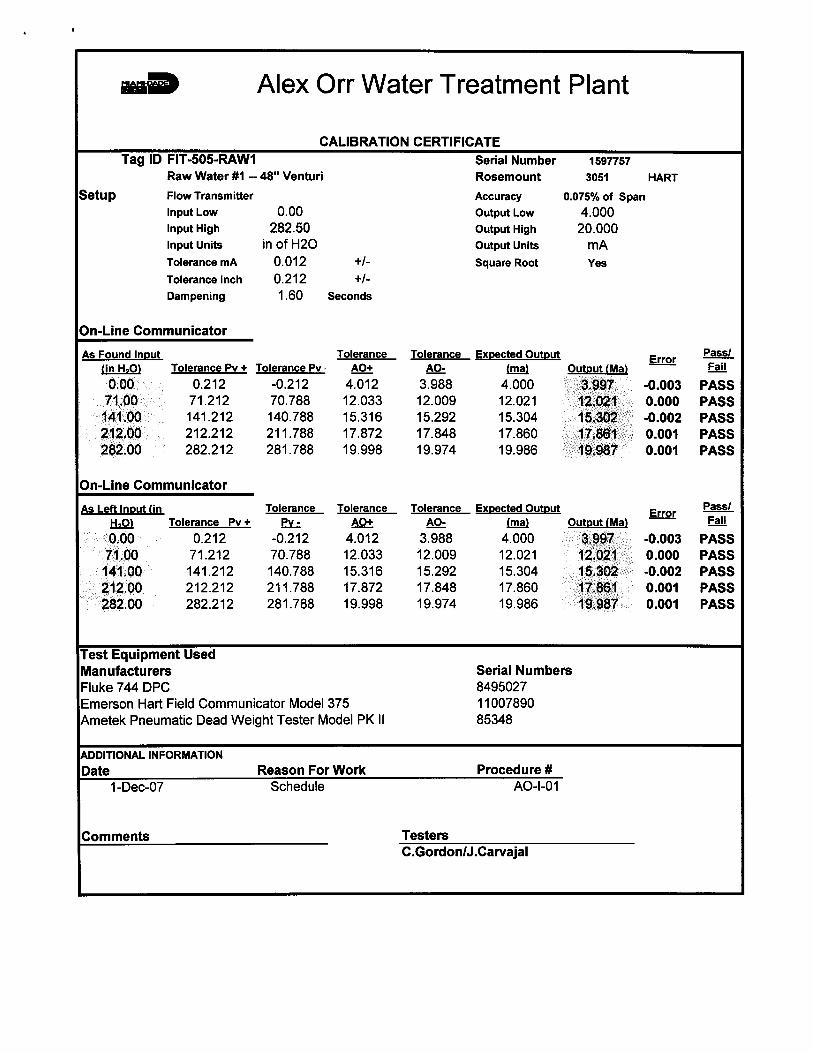
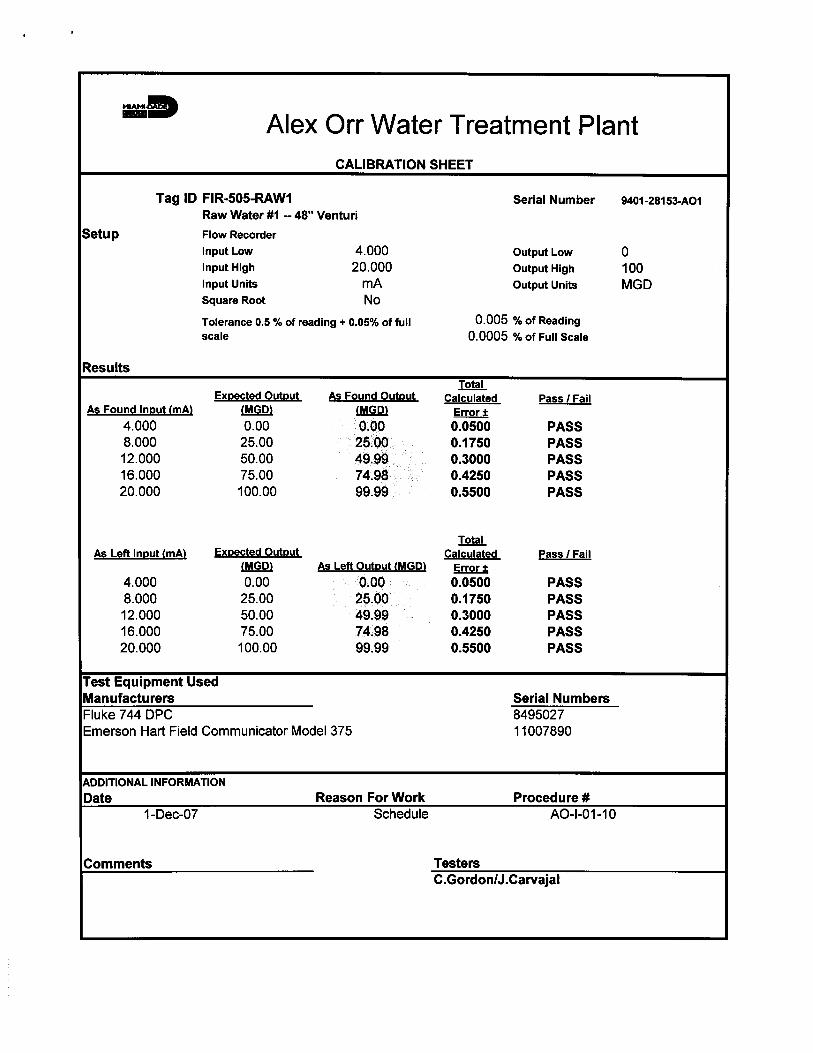

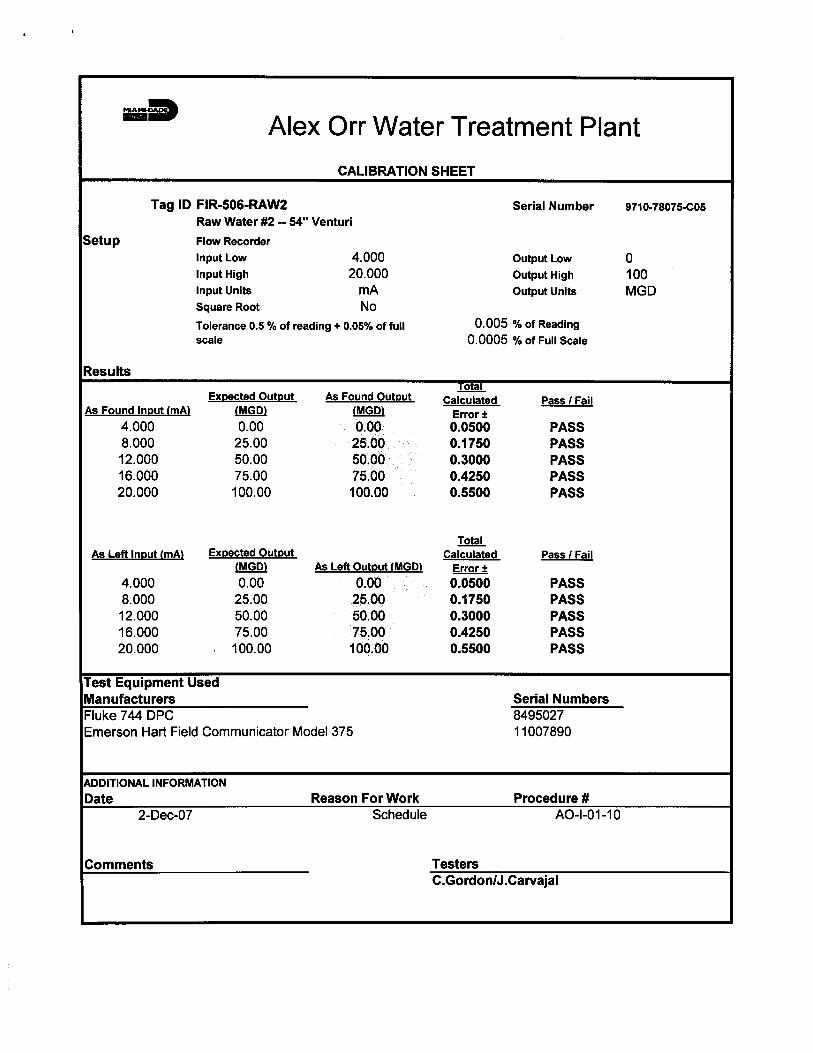
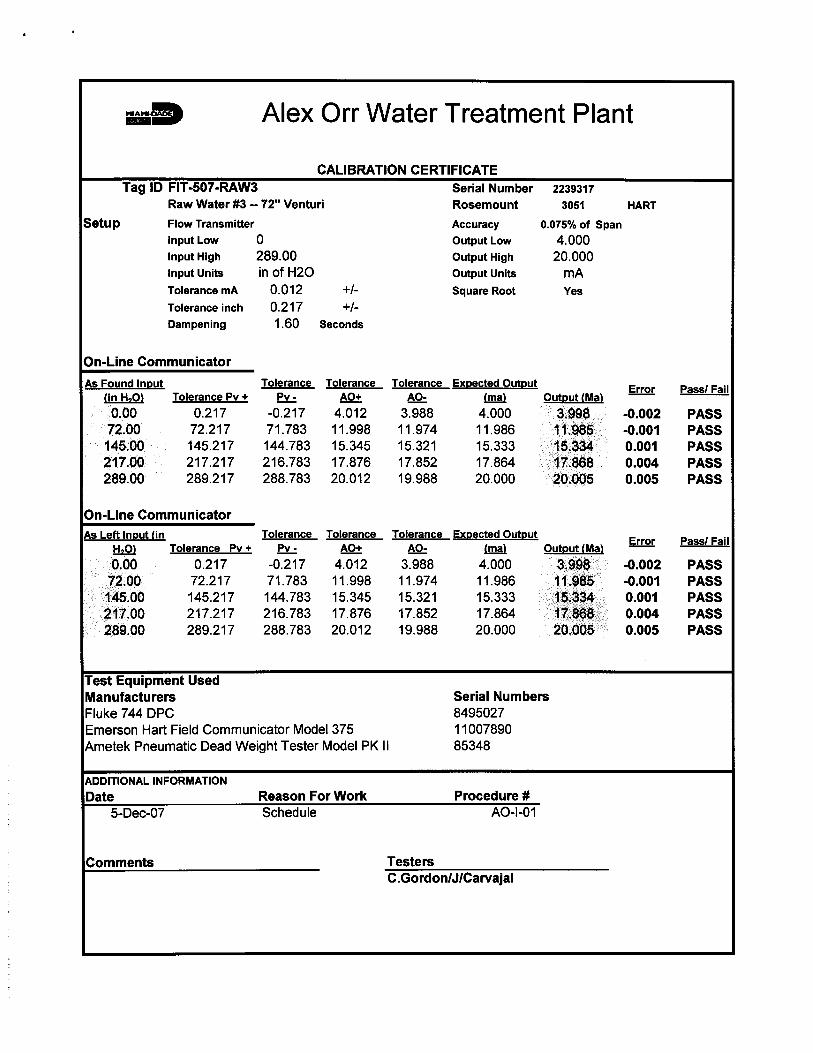
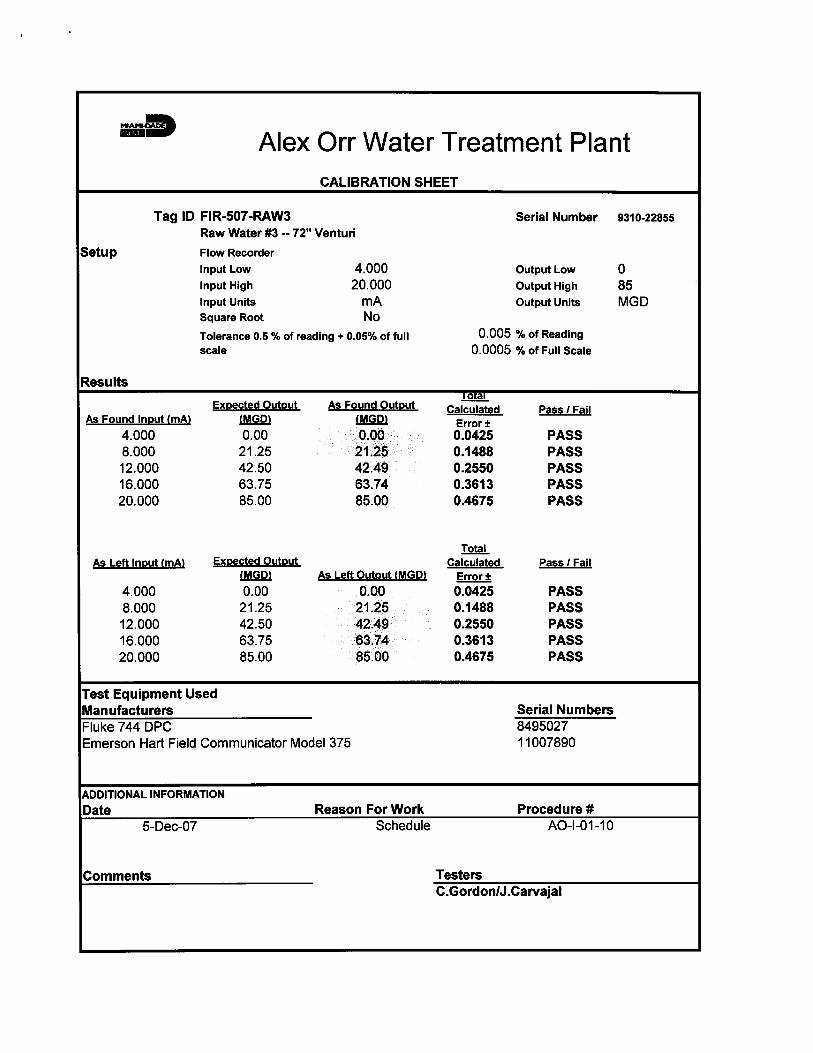
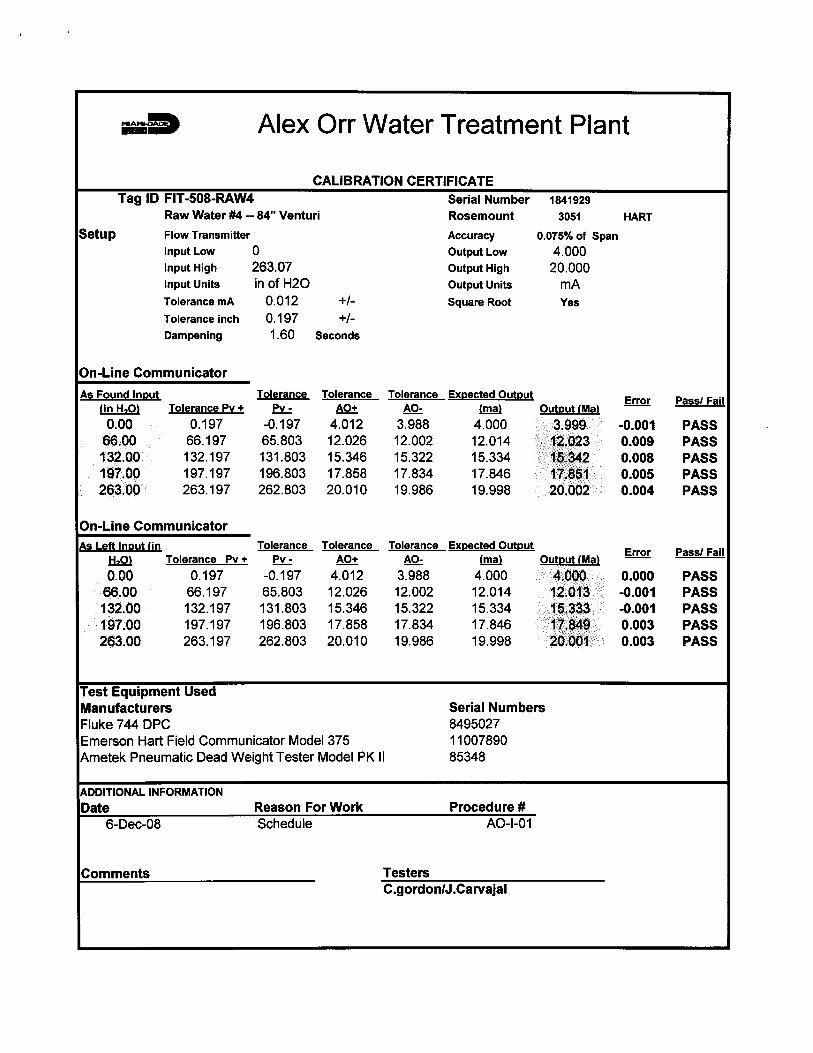
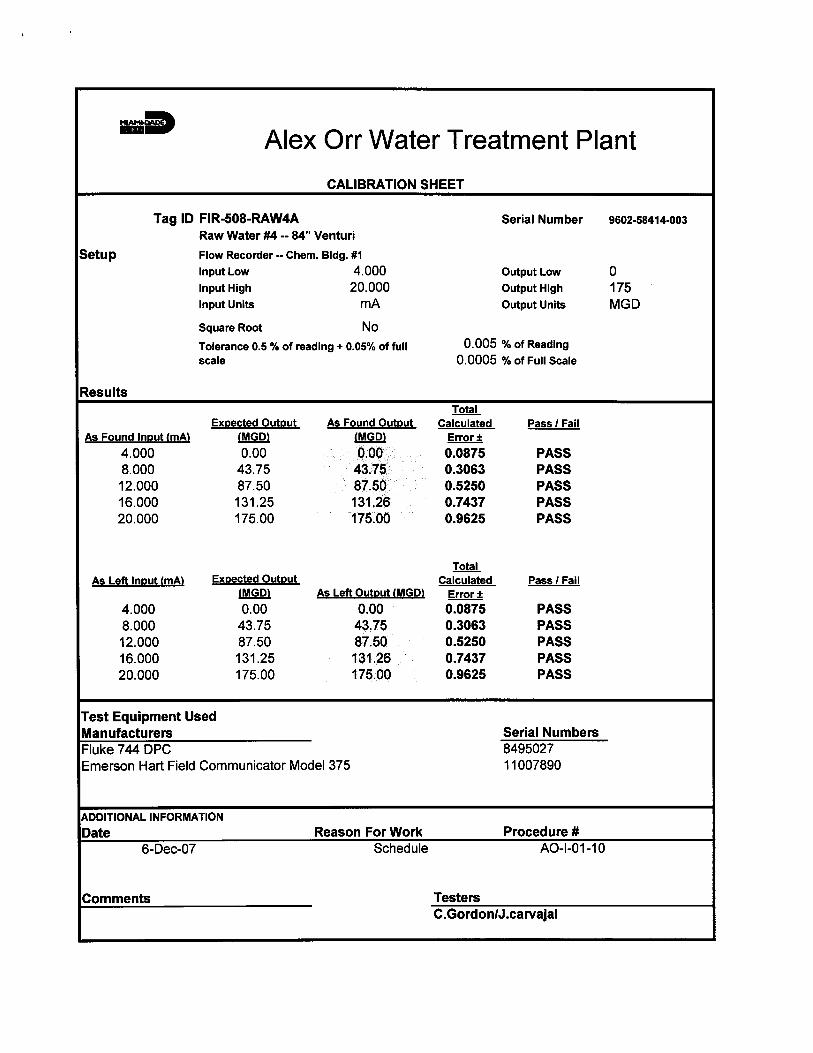
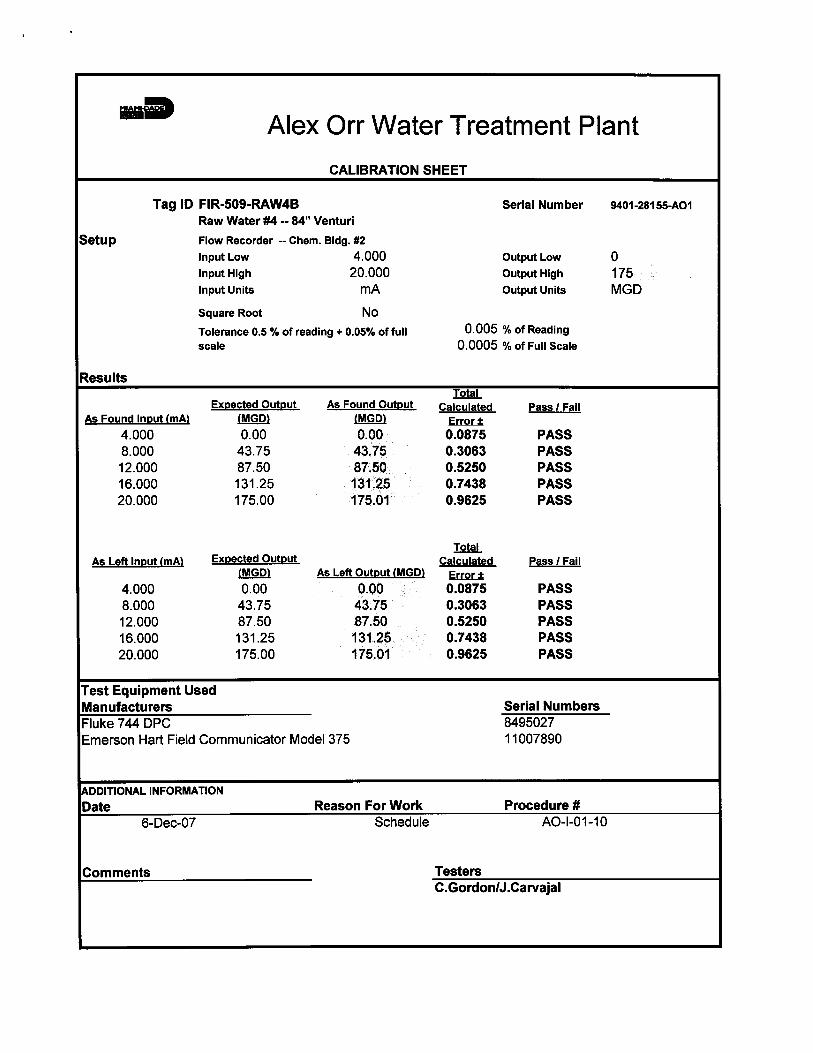

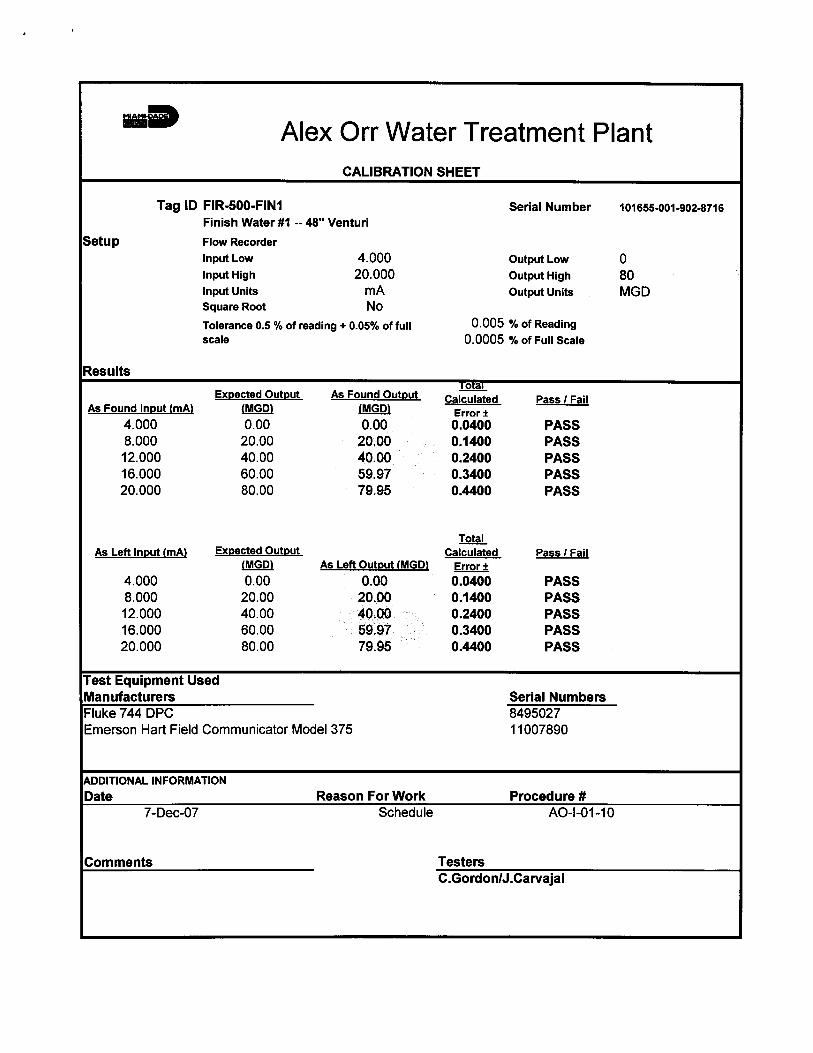
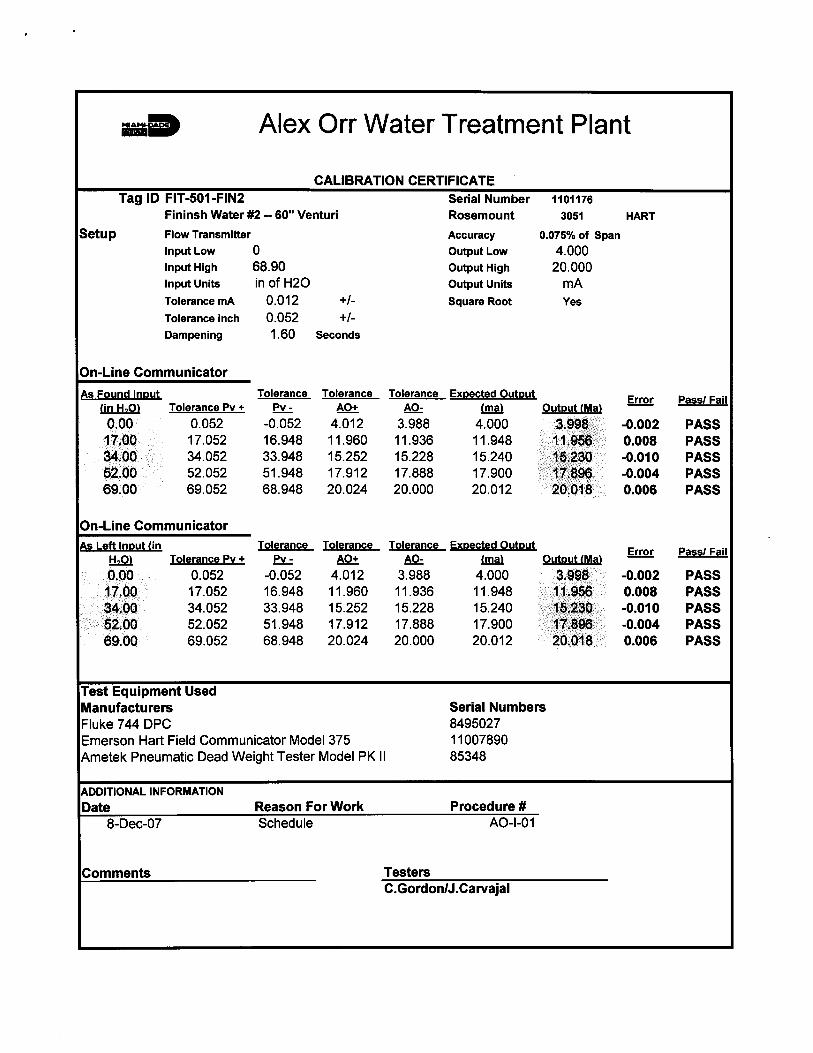

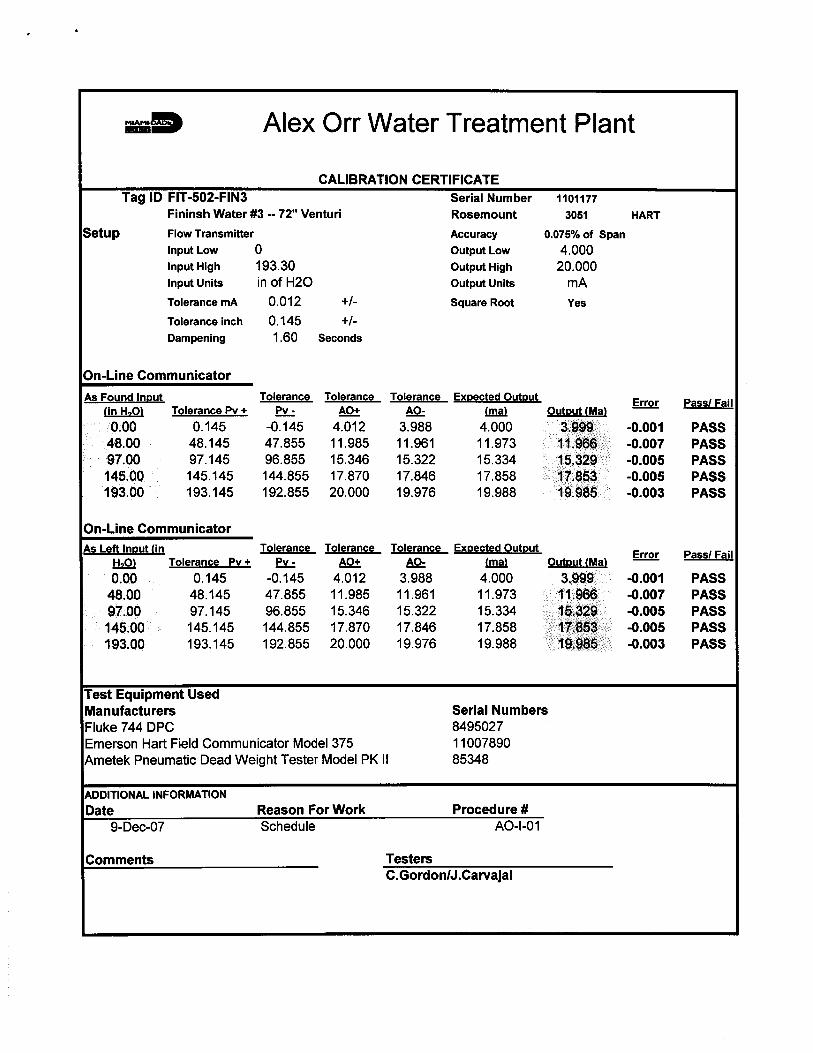


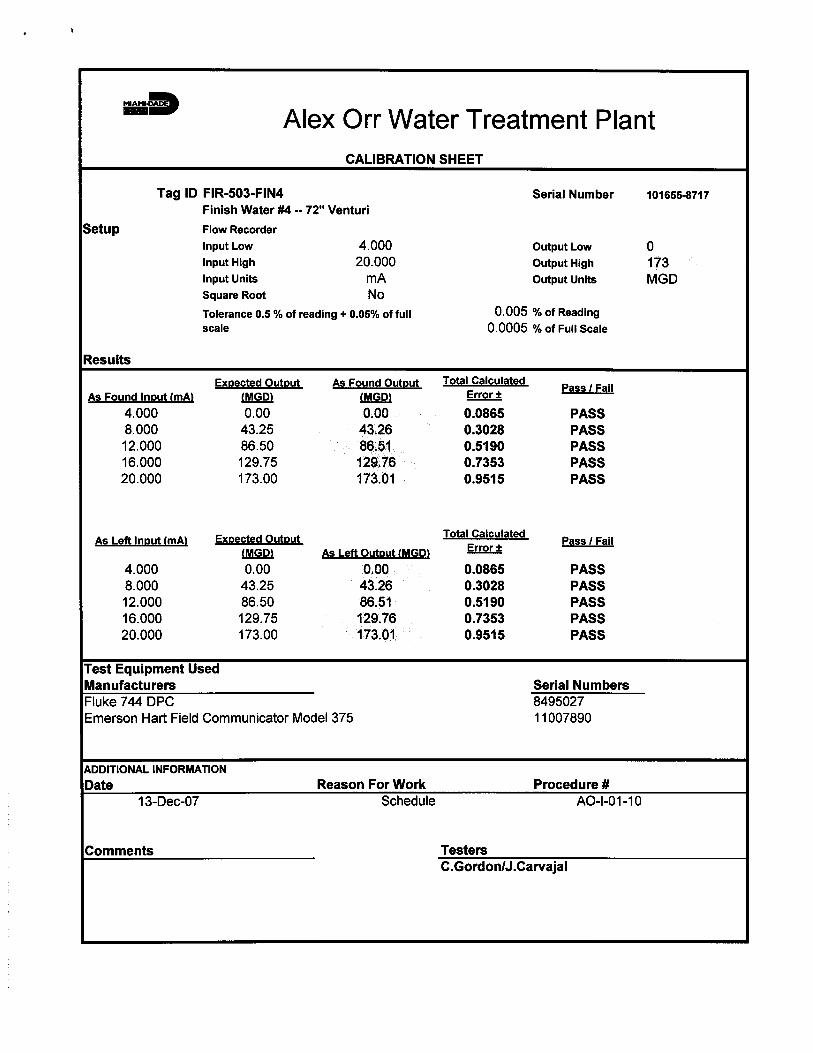
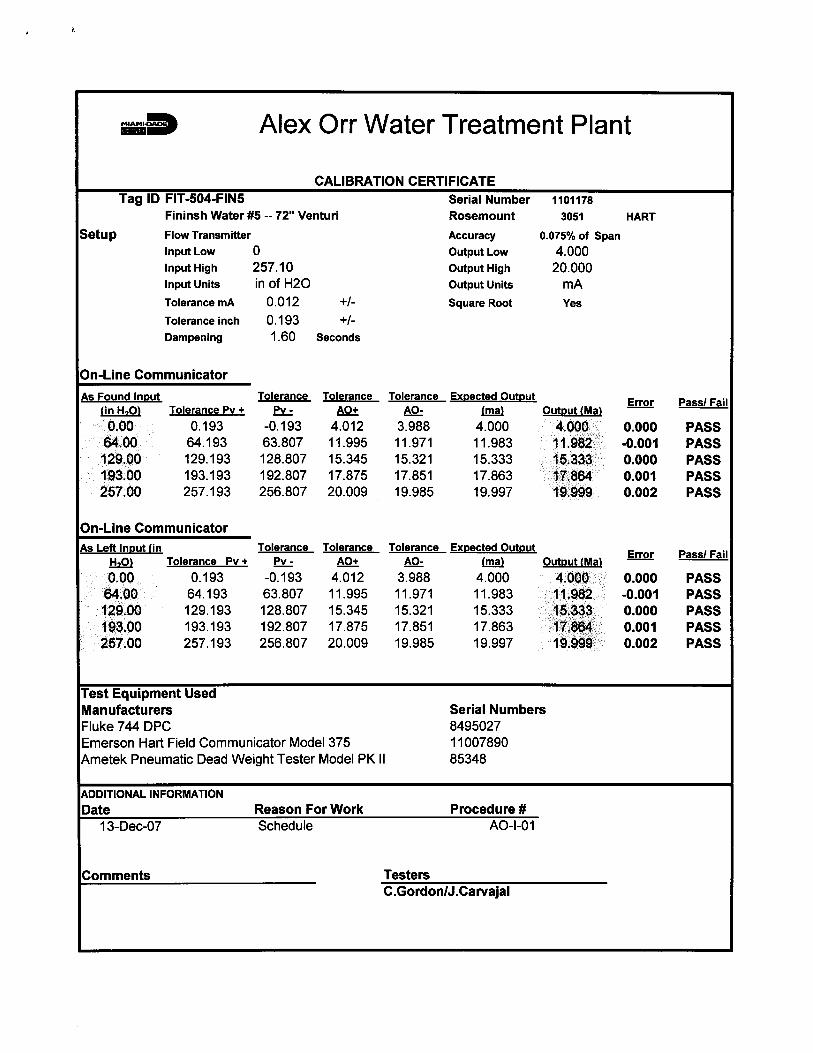

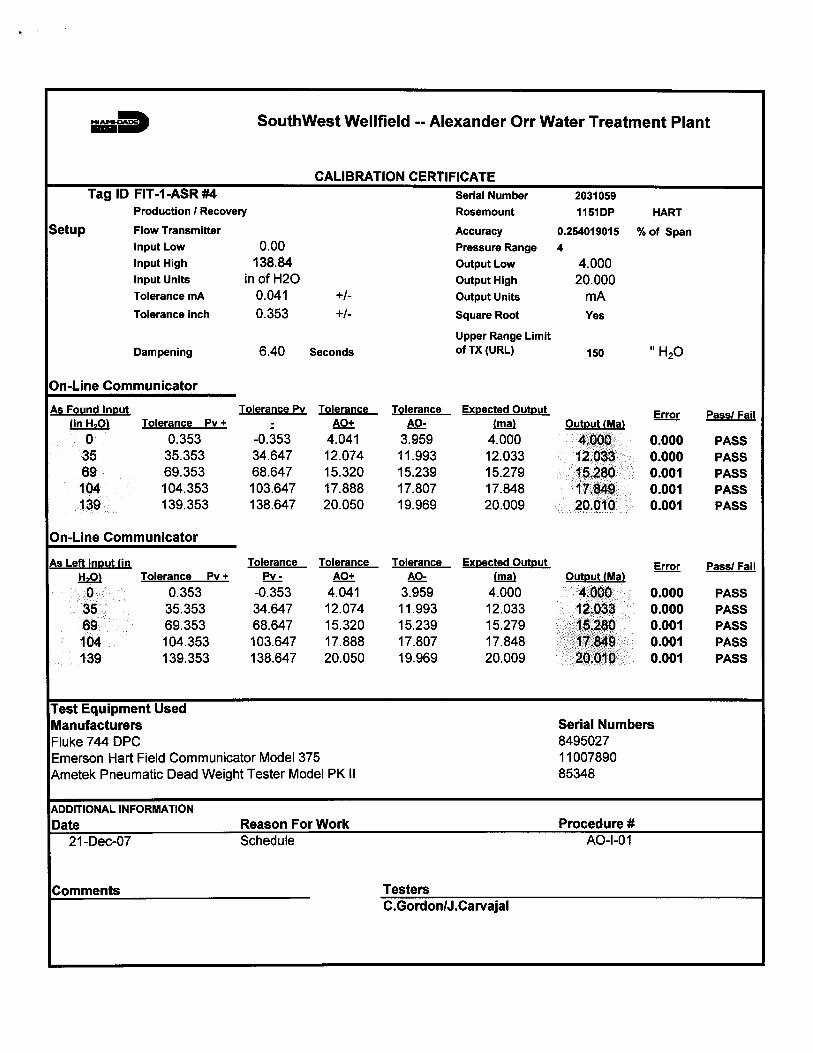
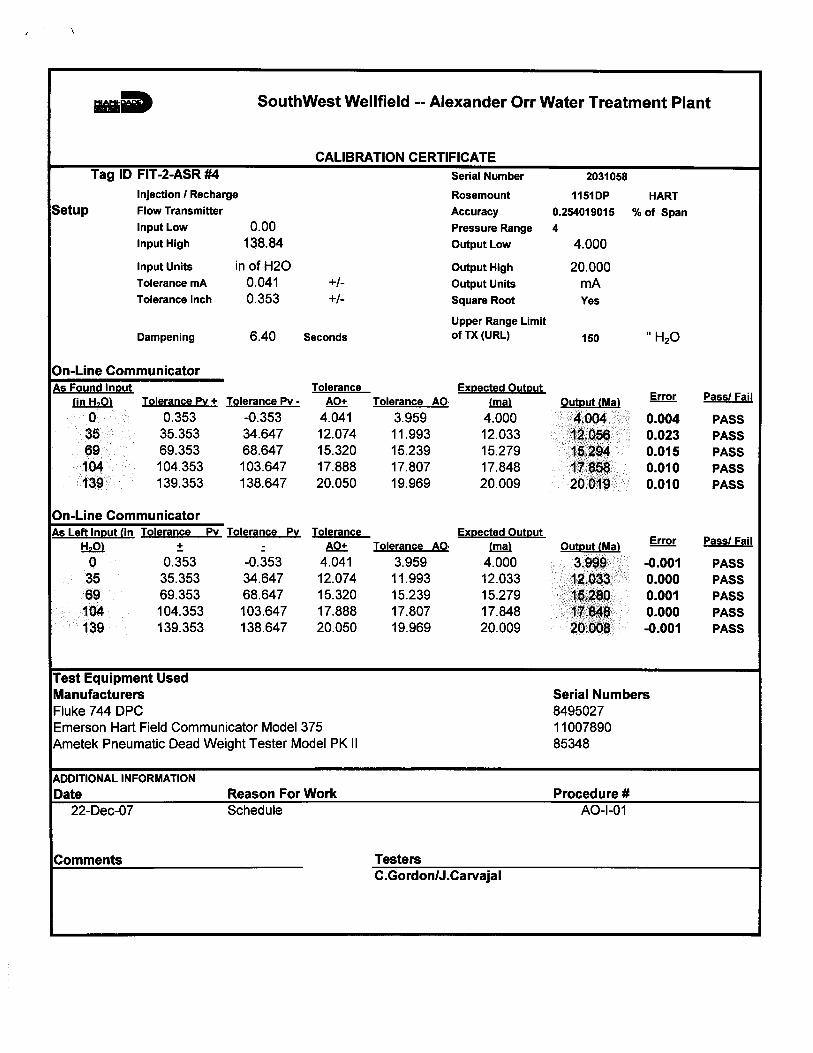

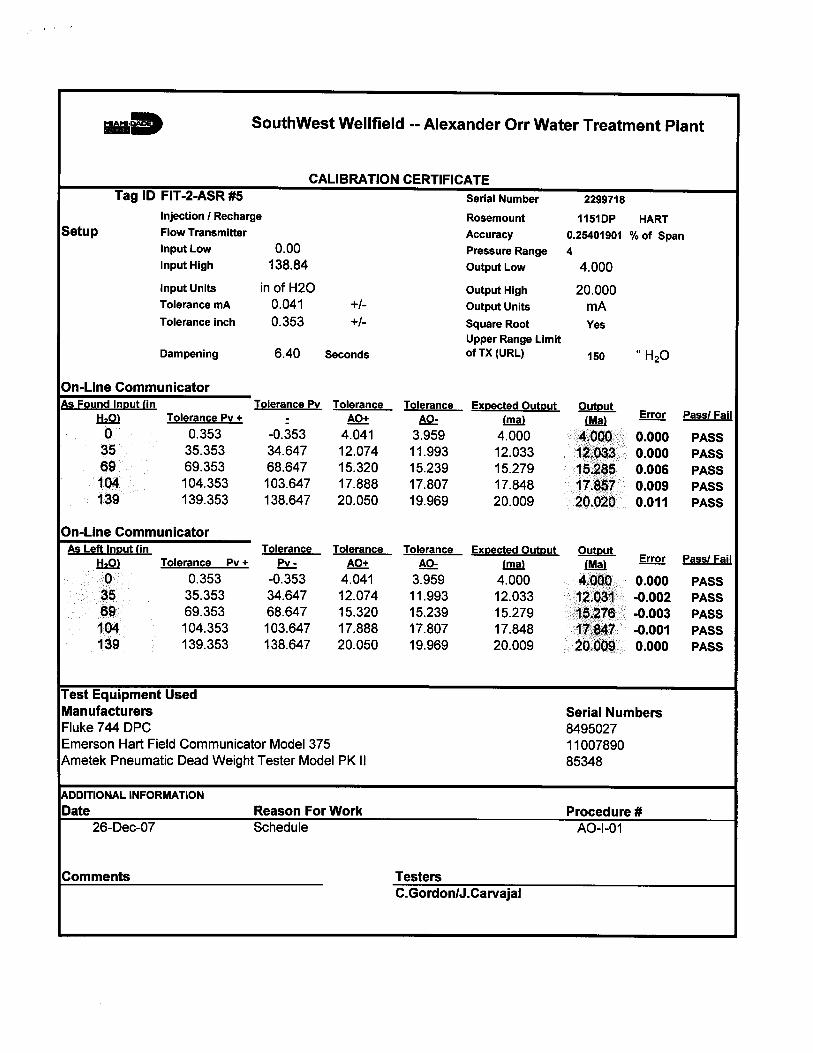

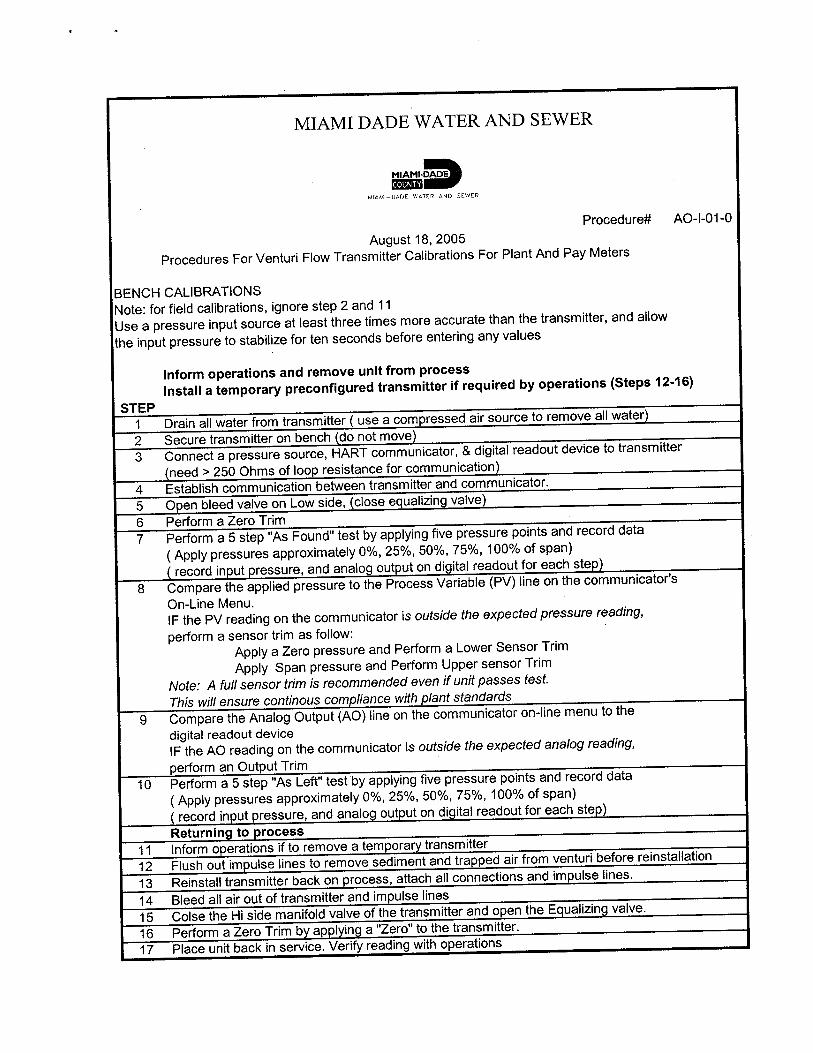
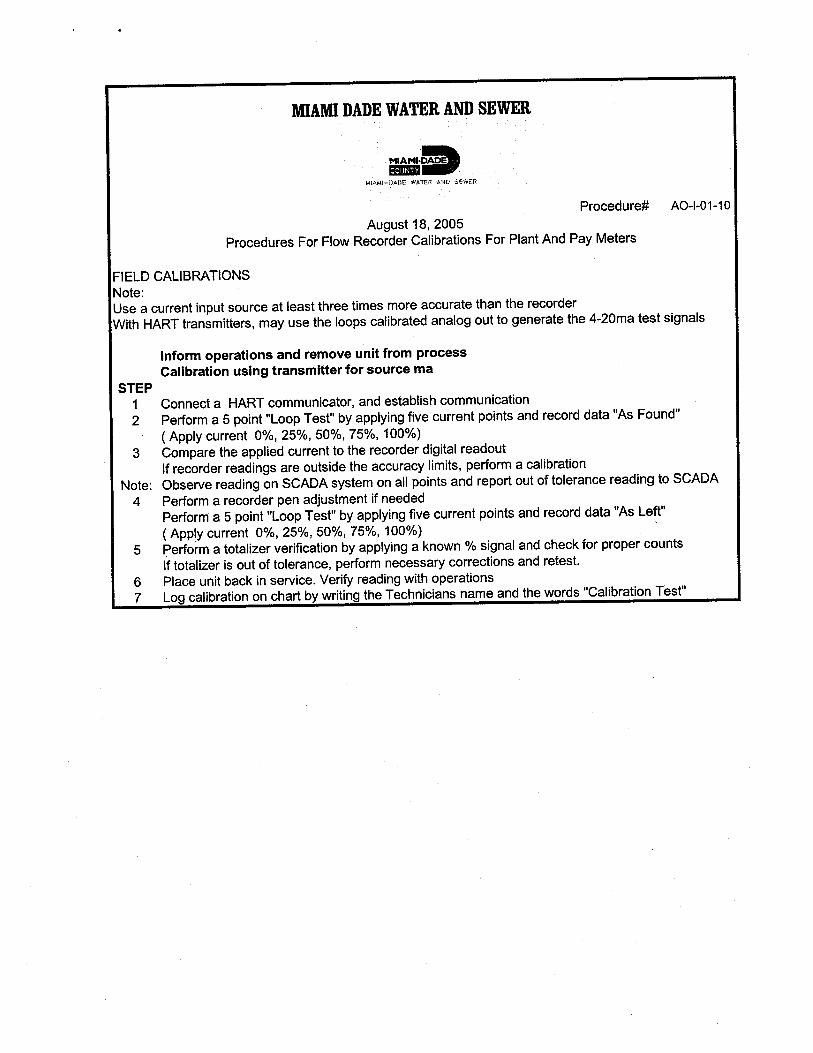
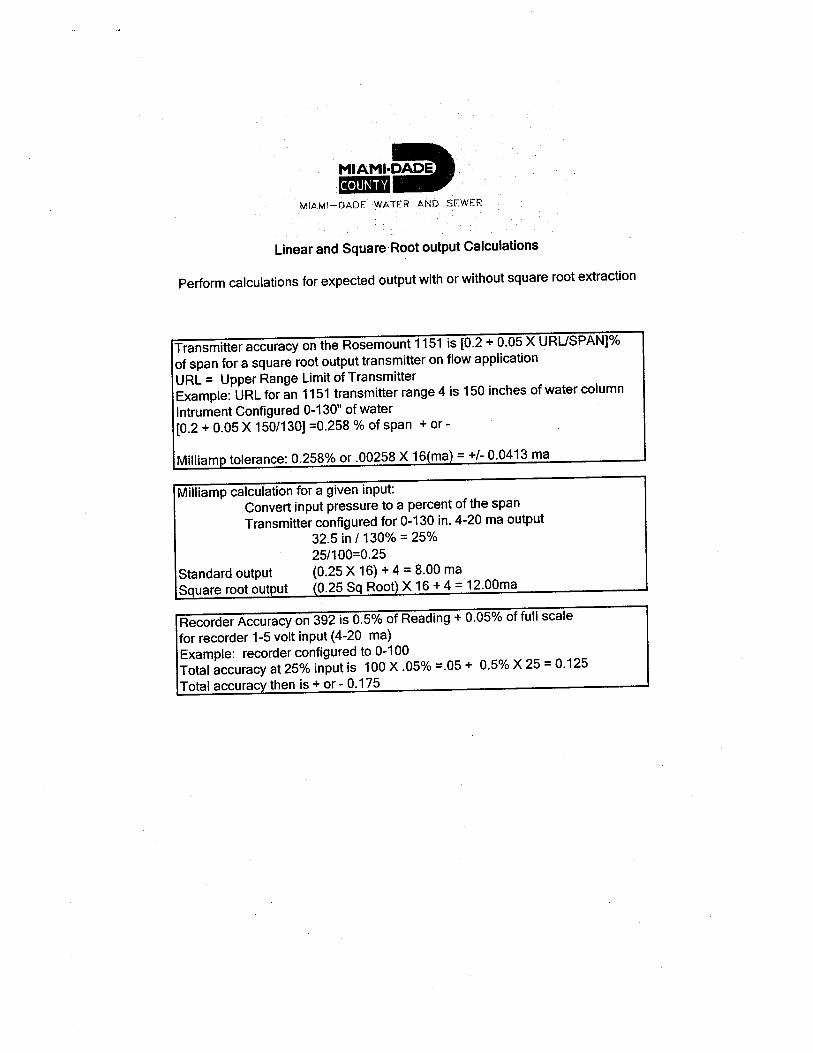
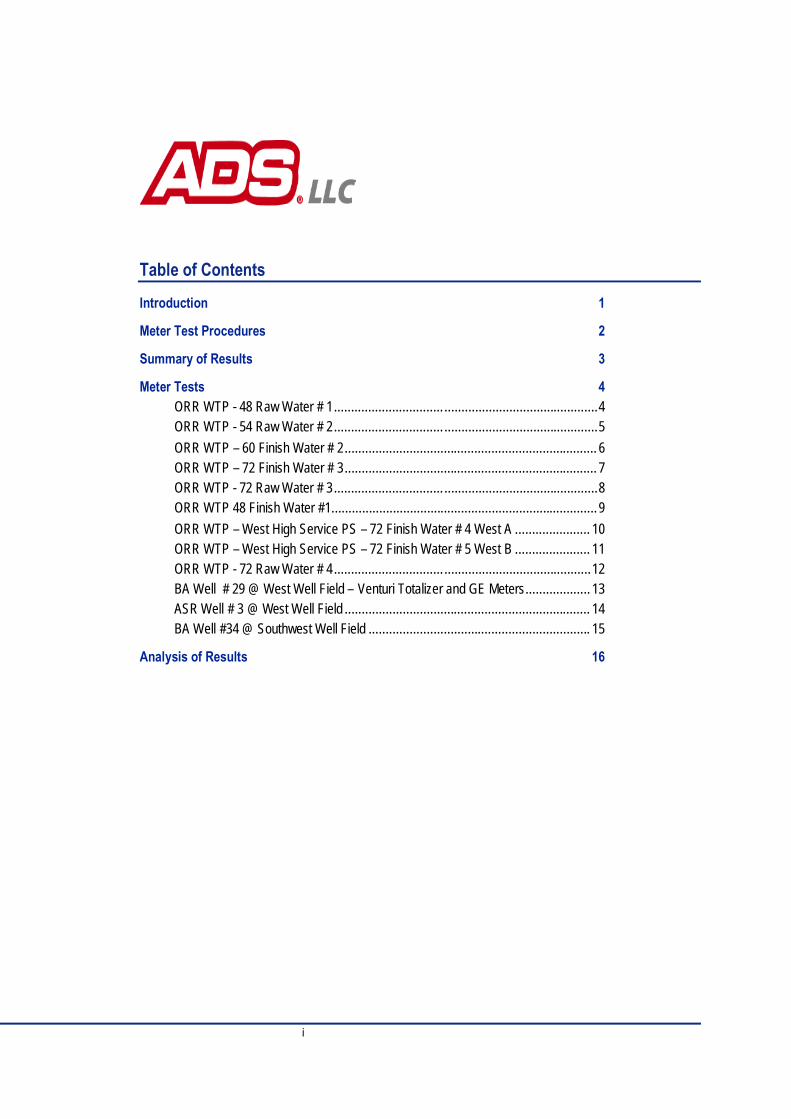
Table of Contents
i
Introduction 1
Meter Test Procedures 2
Summary of Results 3
Meter Tests 4ORR WTP - 48 Raw Water # 1................................ .............................................4ORR WTP - 54 Raw Water # 2................................ .............................................5ORR WTP – 60 Finish Water # 2.......................................................................... 6ORR WTP – 72 Finish Water # 3.......................................................................... 7ORR WTP - 72 Raw Water # 3................................ .............................................8ORR WTP 48 Finish Water #1.............................................................................. 9ORR WTP – West High Service PS – 72 Finish Water # 4 West A ...................... 10ORR WTP – West High Service PS – 72 Finish Water # 5 West B ...................... 11ORR WTP - 72 Raw Water # 4................................ ...........................................12BA Well # 29 @ West Well Field – Venturi Totalizer and GE Meters................... 13ASR Well # 3 @ West Well Field ........................................................................ 14BA Well #34 @ Southwest Well Field ................................................................. 15
Analysis of Results 16
Miami Dade, Florida Page 1Meter Testing Report
IntroductionADS, LLC has completed Pitometer Tests on production water meters at the Alexander Orr Water TreatmentPlant and well meters in the West Well field. The work consisted of the following:
Tested, in place, for accuracy four raw water meters and five finished water meters at the Alexander OrrWater Treatment Plant
Tested, in place, for accuracy three well meters in the West Well field. The preparation of this report detailing the results of the tests including velocity profiles of each of the
gauging points used to test the meters.
Miami Dade, Florida Page 2Meter Testing Report
Meter Test ProceduresMaster meter tests compared the registration on the meters at supply sources to Pitometer measurements.Pitometer measurements used a pitot tube that was inserted into a pipe carrying the same flow as the meter. Thepitot tube had two orifices, one facing upstream and the other facing downstream. The velocity of the flowingwater produced a differential pressure between the orifices. The water velocity was calculated from the followingequation:
The flow in a pipe can be calculated from the average velocity. Average velocities were measured by conductinga traverse, in which point velocities were measured along the diameter. The measurement points were chosen suchthat averaging the point velocities calculated the average velocity. The average velocity was divided by the centervelocity to calculate the velocity factor, a constant summarizing the shape of the profile.
Flow was calculated from center velocity measurements using the following equation:
Q = 0.6463 x VC x VF x A
Where:
Q = Quantity of flow in million gallons per day (MGD)
VC = Velocity at the center of the pipe in fps
VF = Velocity factor
A = Area of the pipe in square feet
V = c x (2 x g x d/12)0.5
Where:
V = Velocity in feet per second (fps)
c = A coefficient established by laboratory calibration
g = 32.174 feet per second per second
d = Differential pressure in inches of water
Miami Dade, Florida Page 3Meter Testing Report
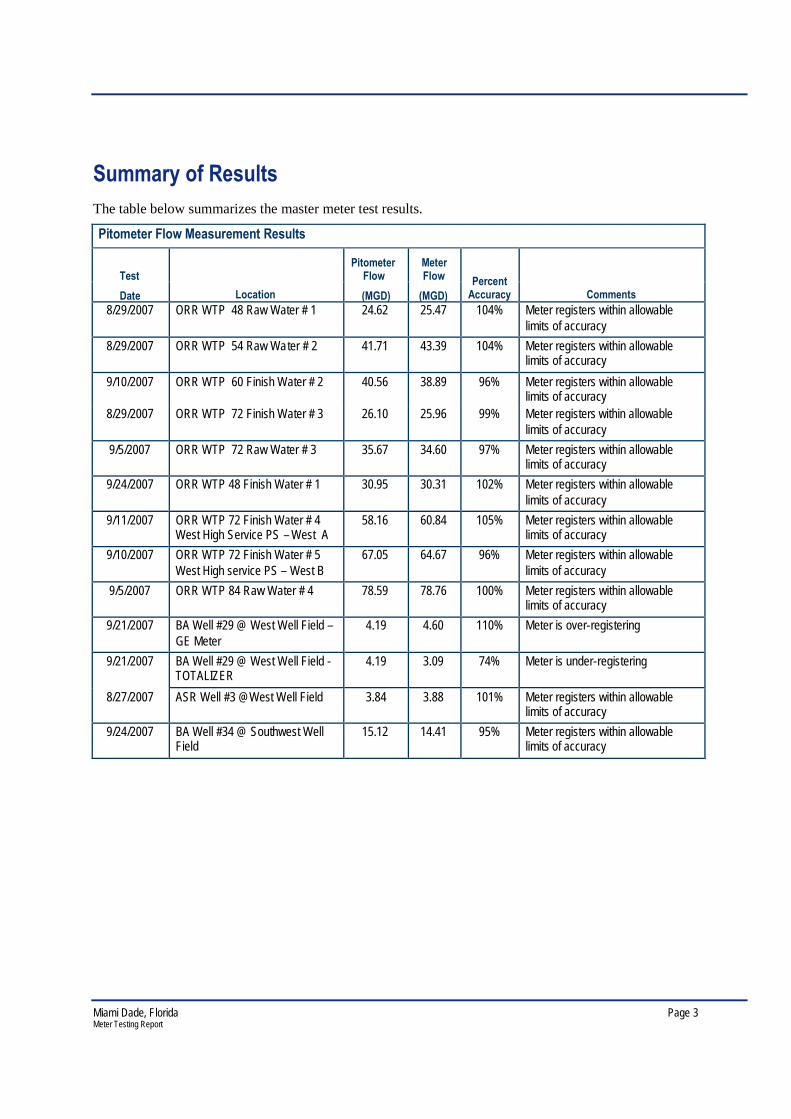
Summary of ResultsThe table below summarizes the master meter test results.
Pitometer Flow Measurement Results
TestPitometer
FlowMeterFlow
Date Location (MGD) (MGD)Percent
Accuracy Comments8/29/2007 ORR WTP 48 Raw Water # 1 24.62 25.47 104% Meter registers within allowable
limits of accuracy
8/29/2007 ORR WTP 54 Raw Water # 2 41.71 43.39 104% Meter registers within allowablelimits of accuracy
9/10/2007 ORR WTP 60 Finish Water # 2 40.56 38.89 96% Meter registers within allowablelimits of accuracy
8/29/2007 ORR WTP 72 Finish Water # 3 26.10 25.96 99% Meter registers within allowablelimits of accuracy
9/5/2007 ORR WTP 72 Raw Water # 3 35.67 34.60 97% Meter registers within allowablelimits of accuracy
9/24/2007 ORR WTP 48 Finish Water # 1 30.95 30.31 102% Meter registers within allowablelimits of accuracy
9/11/2007 ORR WTP 72 Finish Water # 4West High Service PS – West A
58.16 60.84 105% Meter registers within allowablelimits of accuracy
9/10/2007 ORR WTP 72 Finish Water # 5West High service PS – West B
67.05 64.67 96% Meter registers within allowablelimits of accuracy
9/5/2007 ORR WTP 84 Raw Water # 4 78.59 78.76 100% Meter registers within allowablelimits of accuracy
9/21/2007 BA Well #29 @ West Well Field –GE Meter
4.19 4.60 110% Meter is over-registering
9/21/2007 BA Well #29 @ West Well Field -TOTALIZER
4.19 3.09 74% Meter is under-registering
8/27/2007 ASR Well #3 @West Well Field 3.84 3.88 101% Meter registers within allowablelimits of accuracy
9/24/2007 BA Well #34 @ Southwest WellField
15.12 14.41 95% Meter registers within allowablelimits of accuracy
Miami Dade, Florida Page 4Meter Testing Report
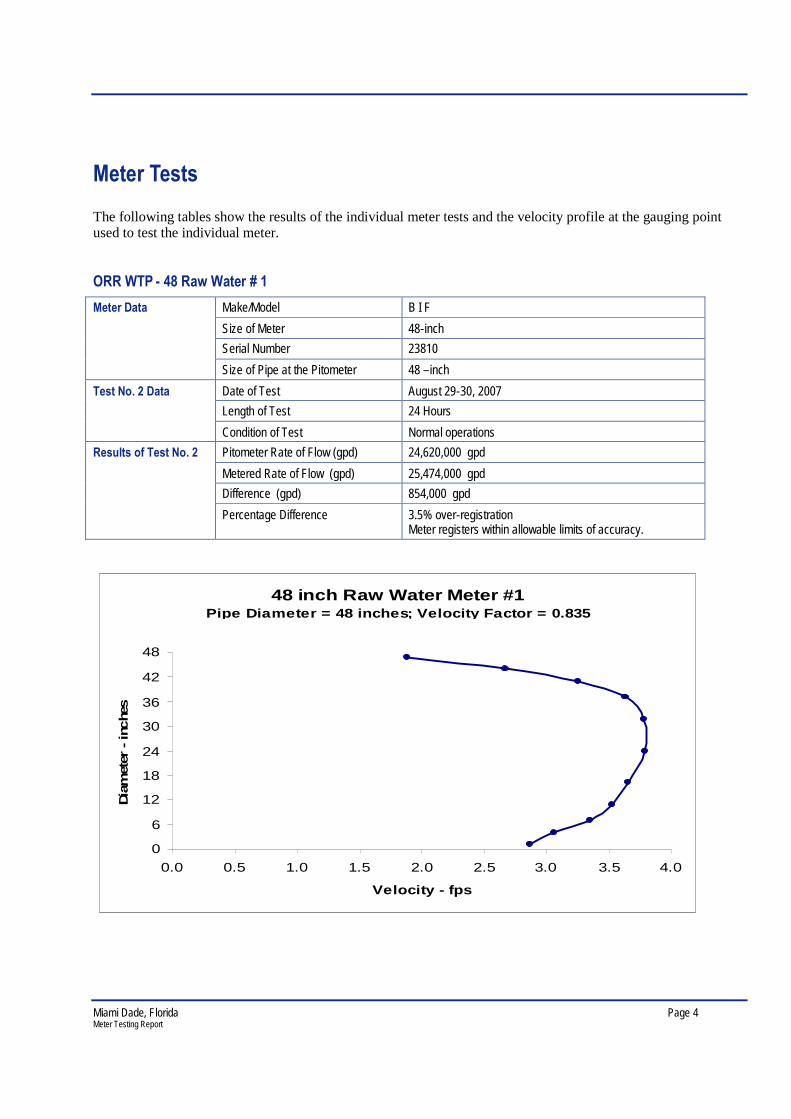
Meter Tests
The following tables show the results of the individual meter tests and the velocity profile at the gauging pointused to test the individual meter.
ORR WTP - 48 Raw Water # 1
Make/Model B I F
Size of Meter 48-inch
Serial Number 23810
Meter Data
Size of Pipe at the Pitometer 48 –inch
Date of Test August 29-30, 2007
Length of Test 24 Hours
Test No. 2 Data
Condition of Test Normal operations
Pitometer Rate of Flow (gpd) 24,620,000 gpd
Metered Rate of Flow (gpd) 25,474,000 gpd
Difference (gpd) 854,000 gpd
Results of Test No. 2
Percentage Difference 3.5% over-registrationMeter registers within allowable limits of accuracy.
48 inch Raw Water Meter #1Pipe Diameter = 48 inches; Velocity Factor = 0.835
0
6
12
18
24
30
36
42
48
0.0 0.5 1.0 1.5 2.0 2.5 3.0 3.5 4.0
Velocity - fps
Dia
met
er-in
che
s
Miami Dade, Florida Page 5Meter Testing Report
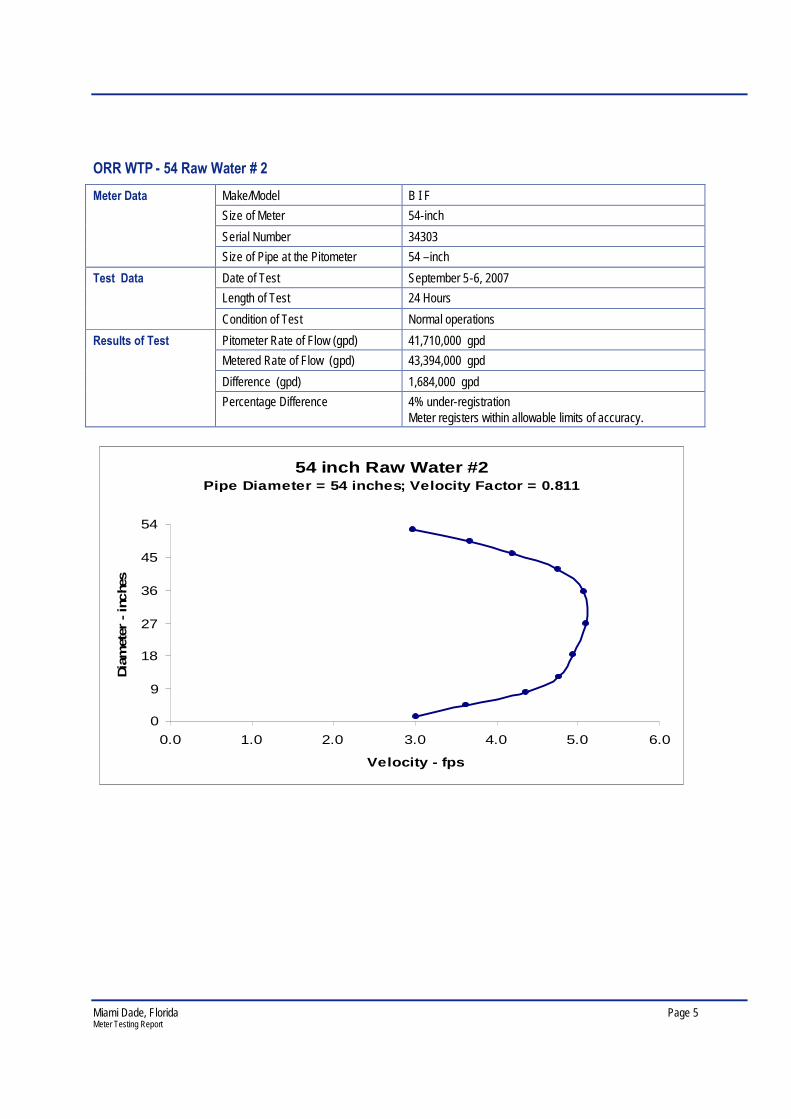
ORR WTP - 54 Raw Water # 2
Make/Model B I F
Size of Meter 54-inch
Serial Number 34303
Meter Data
Size of Pipe at the Pitometer 54 –inch
Date of Test September 5-6, 2007
Length of Test 24 Hours
Test Data
Condition of Test Normal operations
Pitometer Rate of Flow (gpd) 41,710,000 gpd
Metered Rate of Flow (gpd) 43,394,000 gpd
Difference (gpd) 1,684,000 gpd
Results of Test
Percentage Difference 4% under-registrationMeter registers within allowable limits of accuracy.
54 inch Raw Water #2Pipe Diameter = 54 inches; Velocity Factor = 0.811
0
9
18
27
36
45
54
0.0 1.0 2.0 3.0 4.0 5.0 6.0
Velocity - fps
Dia
met
er-in
che
s
Miami Dade, Florida Page 6Meter Testing Report
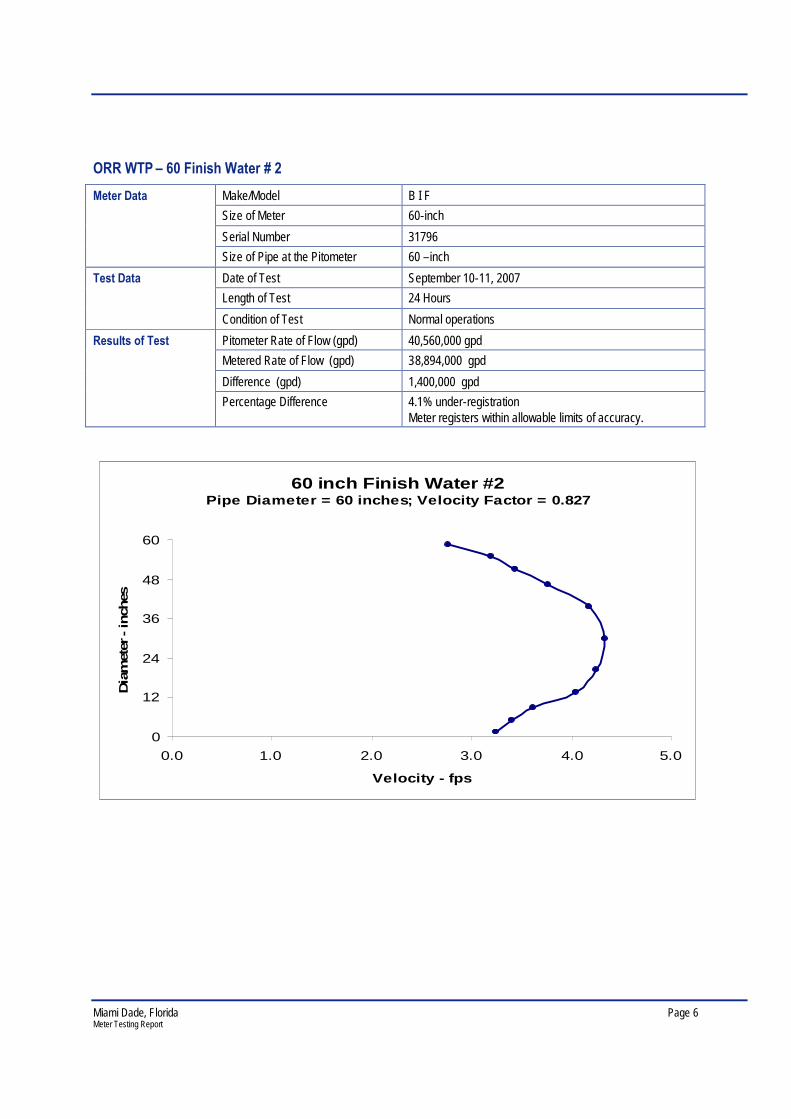
ORR WTP – 60 Finish Water # 2
Make/Model B I F
Size of Meter 60-inch
Serial Number 31796
Meter Data
Size of Pipe at the Pitometer 60 –inch
Date of Test September 10-11, 2007
Length of Test 24 Hours
Test Data
Condition of Test Normal operations
Pitometer Rate of Flow (gpd) 40,560,000 gpd
Metered Rate of Flow (gpd) 38,894,000 gpd
Difference (gpd) 1,400,000 gpd
Results of Test
Percentage Difference 4.1% under-registrationMeter registers within allowable limits of accuracy.
60 inch Finish Water #2Pipe Diameter = 60 inches; Velocity Factor = 0.827
0
12
24
36
48
60
0.0 1.0 2.0 3.0 4.0 5.0
Velocity - fps
Dia
met
er-in
ches
Miami Dade, Florida Page 7Meter Testing Report
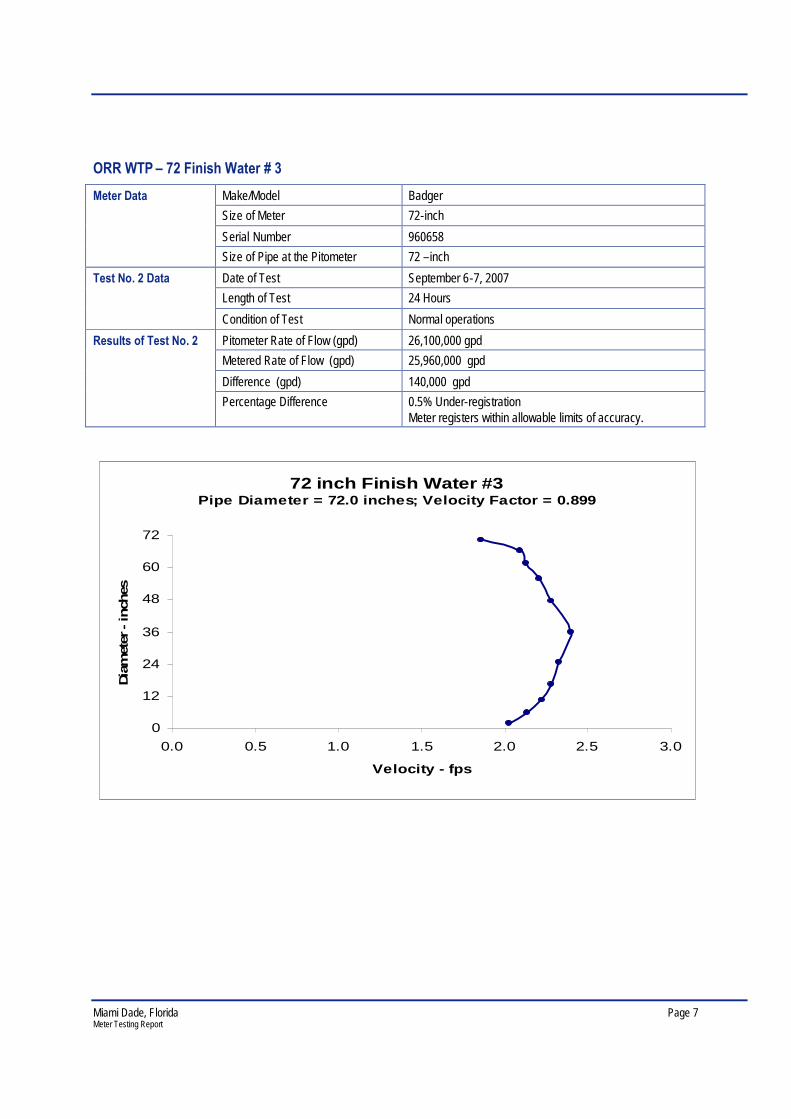
ORR WTP – 72 Finish Water # 3
Make/Model Badger
Size of Meter 72-inch
Serial Number 960658
Meter Data
Size of Pipe at the Pitometer 72 –inch
Date of Test September 6-7, 2007
Length of Test 24 Hours
Test No. 2 Data
Condition of Test Normal operations
Pitometer Rate of Flow (gpd) 26,100,000 gpd
Metered Rate of Flow (gpd) 25,960,000 gpd
Difference (gpd) 140,000 gpd
Results of Test No. 2
Percentage Difference 0.5% Under-registrationMeter registers within allowable limits of accuracy.
72 inch Finish Water #3Pipe Diameter = 72.0 inches; Velocity Factor = 0.899
0
12
24
36
48
60
72
0.0 0.5 1.0 1.5 2.0 2.5 3.0
Velocity - fps
Dia
met
er-in
ches
Miami Dade, Florida Page 8Meter Testing Report
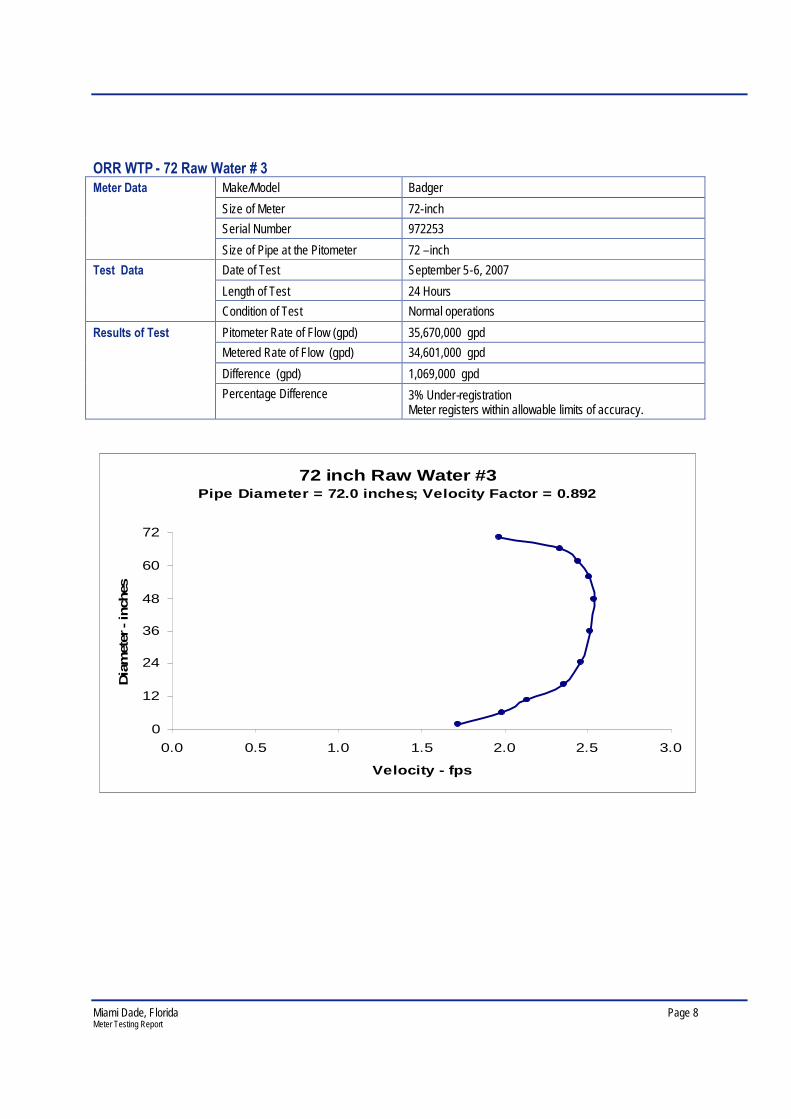
ORR WTP - 72 Raw Water # 3Make/Model Badger
Size of Meter 72-inch
Serial Number 972253
Meter Data
Size of Pipe at the Pitometer 72 –inch
Date of Test September 5-6, 2007
Length of Test 24 Hours
Test Data
Condition of Test Normal operations
Pitometer Rate of Flow (gpd) 35,670,000 gpd
Metered Rate of Flow (gpd) 34,601,000 gpd
Difference (gpd) 1,069,000 gpd
Results of Test
Percentage Difference 3% Under-registrationMeter registers within allowable limits of accuracy.
72 inch Raw Water #3Pipe Diameter = 72.0 inches; Velocity Factor = 0.892
0
12
24
36
48
60
72
0.0 0.5 1.0 1.5 2.0 2.5 3.0
Velocity - fps
Dia
met
er-in
ches
Miami Dade, Florida Page 9Meter Testing Report
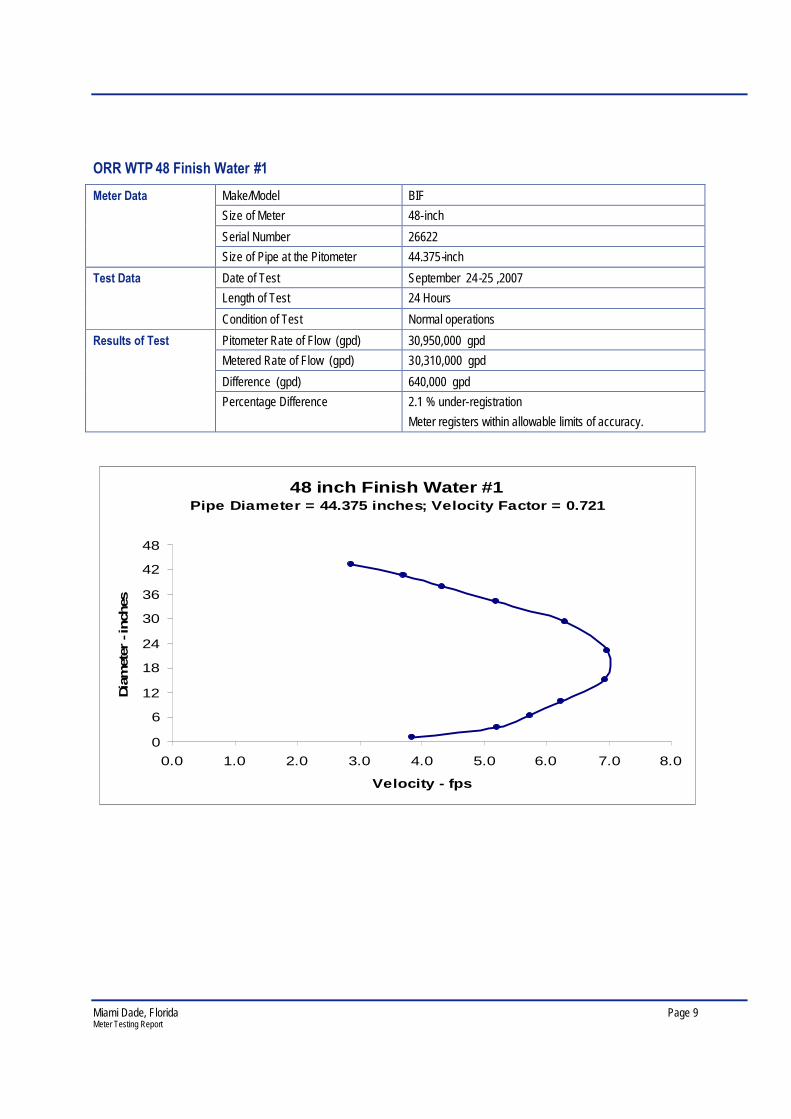
ORR WTP 48 Finish Water #1
Make/Model BIF
Size of Meter 48-inch
Serial Number 26622
Meter Data
Size of Pipe at the Pitometer 44.375-inch
Date of Test September 24-25 ,2007
Length of Test 24 Hours
Test Data
Condition of Test Normal operations
Pitometer Rate of Flow (gpd) 30,950,000 gpd
Metered Rate of Flow (gpd) 30,310,000 gpd
Difference (gpd) 640,000 gpd
Results of Test
Percentage Difference 2.1 % under-registration
Meter registers within allowable limits of accuracy.
48 inch Finish Water #1Pipe Diameter = 44.375 inches; Velocity Factor = 0.721
0
6
12
18
24
30
36
42
48
0.0 1.0 2.0 3.0 4.0 5.0 6.0 7.0 8.0
Velocity - fps
Dia
met
er-i
nch
es
Miami Dade, Florida Page 10Meter Testing Report
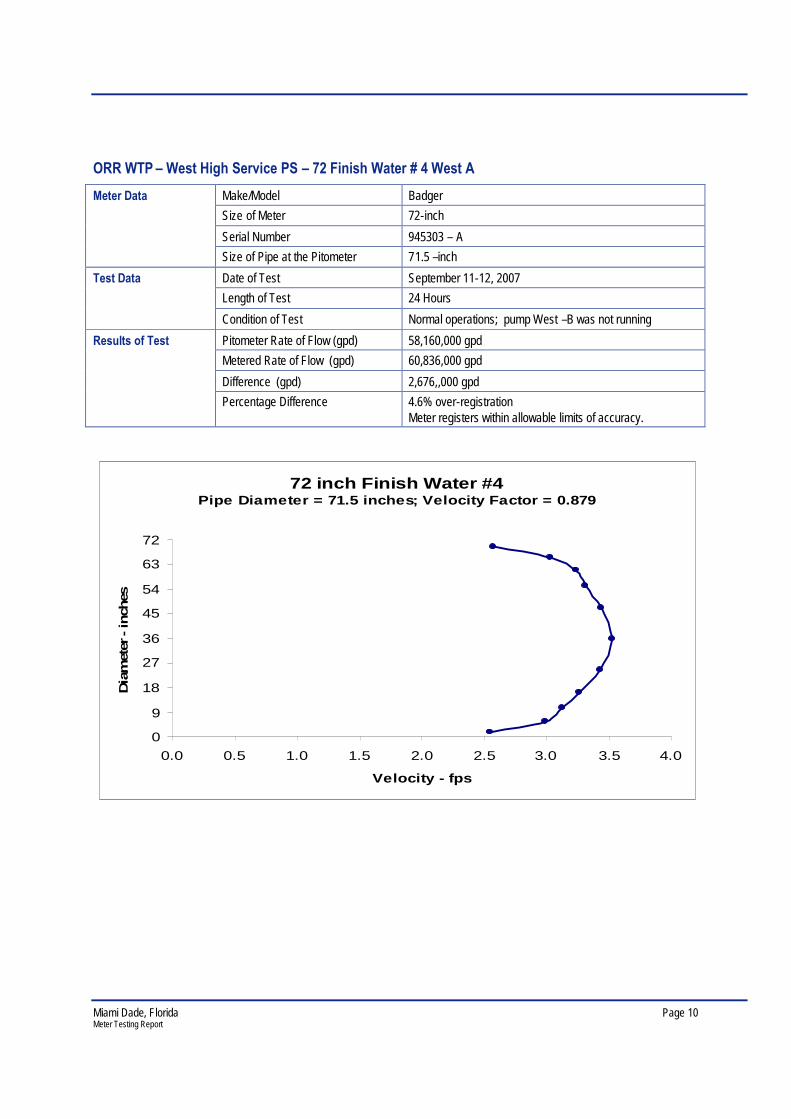
ORR WTP – West High Service PS – 72 Finish Water # 4 West A
Make/Model Badger
Size of Meter 72-inch
Serial Number 945303 – A
Meter Data
Size of Pipe at the Pitometer 71.5 –inch
Date of Test September 11-12, 2007
Length of Test 24 Hours
Test Data
Condition of Test Normal operations; pump West –B was not running
Pitometer Rate of Flow (gpd) 58,160,000 gpd
Metered Rate of Flow (gpd) 60,836,000 gpd
Difference (gpd) 2,676,,000 gpd
Results of Test
Percentage Difference 4.6% over-registrationMeter registers within allowable limits of accuracy.
72 inch Finish Water #4Pipe Diameter = 71.5 inches; Velocity Factor = 0.879
0
9
18
27
36
45
54
63
72
0.0 0.5 1.0 1.5 2.0 2.5 3.0 3.5 4.0
Velocity - fps
Dia
met
er-in
ches
Miami Dade, Florida Page 11Meter Testing Report
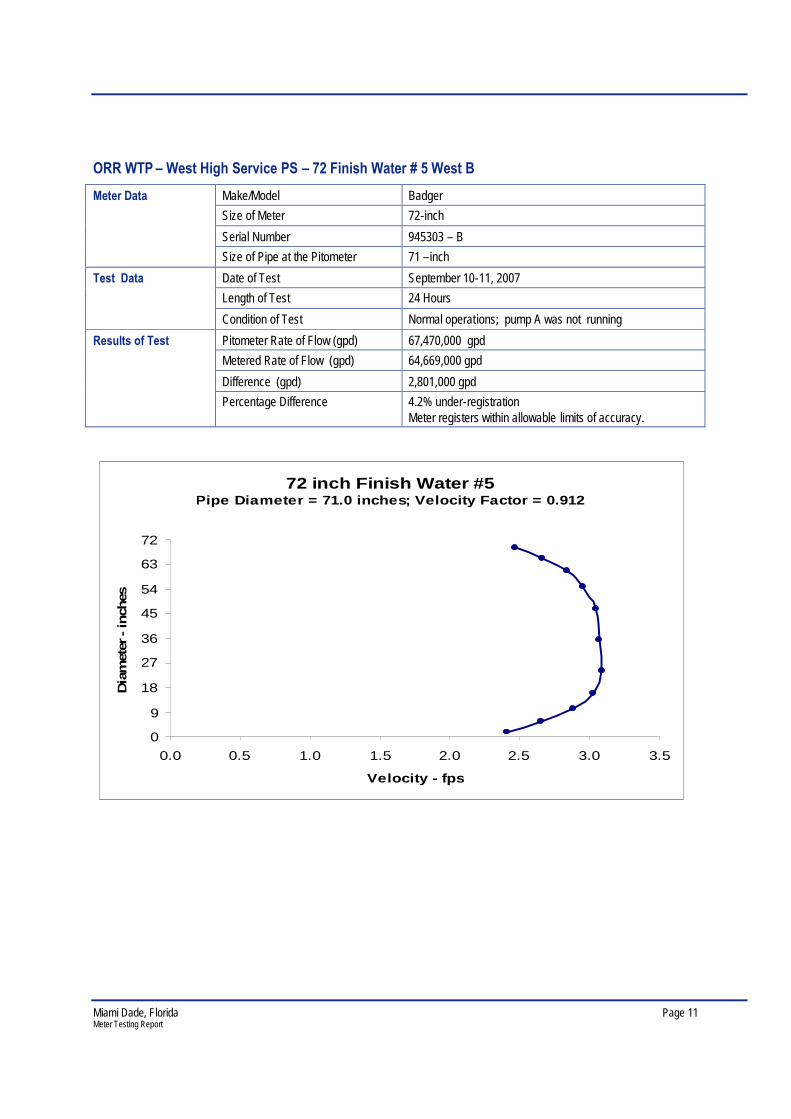
ORR WTP – West High Service PS – 72 Finish Water # 5 West B
Make/Model Badger
Size of Meter 72-inch
Serial Number 945303 – B
Meter Data
Size of Pipe at the Pitometer 71 –inch
Date of Test September 10-11, 2007
Length of Test 24 Hours
Test Data
Condition of Test Normal operations; pump A was not running
Pitometer Rate of Flow (gpd) 67,470,000 gpd
Metered Rate of Flow (gpd) 64,669,000 gpd
Difference (gpd) 2,801,000 gpd
Results of Test
Percentage Difference 4.2% under-registrationMeter registers within allowable limits of accuracy.
72 inch Finish Water #5Pipe Diameter = 71.0 inches; Velocity Factor = 0.912
0
9
18
27
36
45
54
63
72
0.0 0.5 1.0 1.5 2.0 2.5 3.0 3.5
Velocity - fps
Dia
met
er-in
ches
Miami Dade, Florida Page 12Meter Testing Report
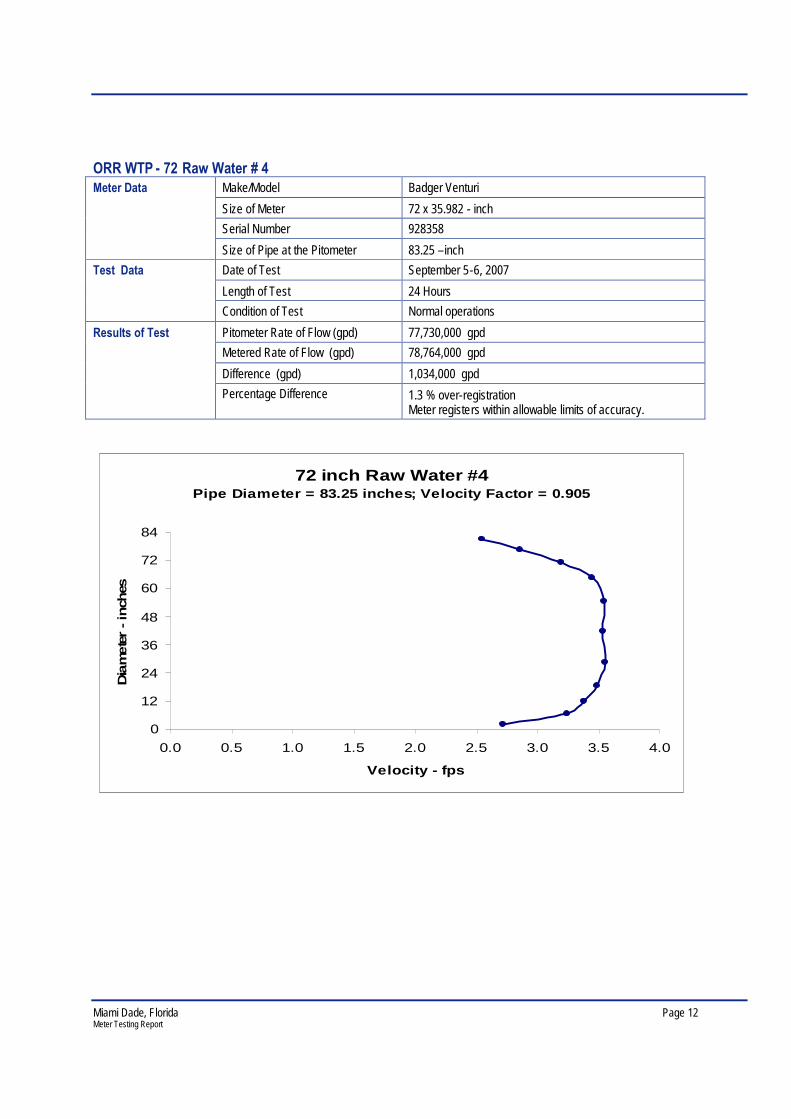
ORR WTP - 72 Raw Water # 4Make/Model Badger Venturi
Size of Meter 72 x 35.982 - inch
Serial Number 928358
Meter Data
Size of Pipe at the Pitometer 83.25 –inch
Date of Test September 5-6, 2007
Length of Test 24 Hours
Test Data
Condition of Test Normal operations
Pitometer Rate of Flow (gpd) 77,730,000 gpd
Metered Rate of Flow (gpd) 78,764,000 gpd
Difference (gpd) 1,034,000 gpd
Results of Test
Percentage Difference 1.3 % over-registrationMeter registers within allowable limits of accuracy.
72 inch Raw Water #4Pipe Diameter = 83.25 inches; Velocity Factor = 0.905
0
12
24
36
48
60
72
84
0.0 0.5 1.0 1.5 2.0 2.5 3.0 3.5 4.0
Velocity - fps
Dia
mete
r-in
ches
Miami Dade, Florida Page 13Meter Testing Report
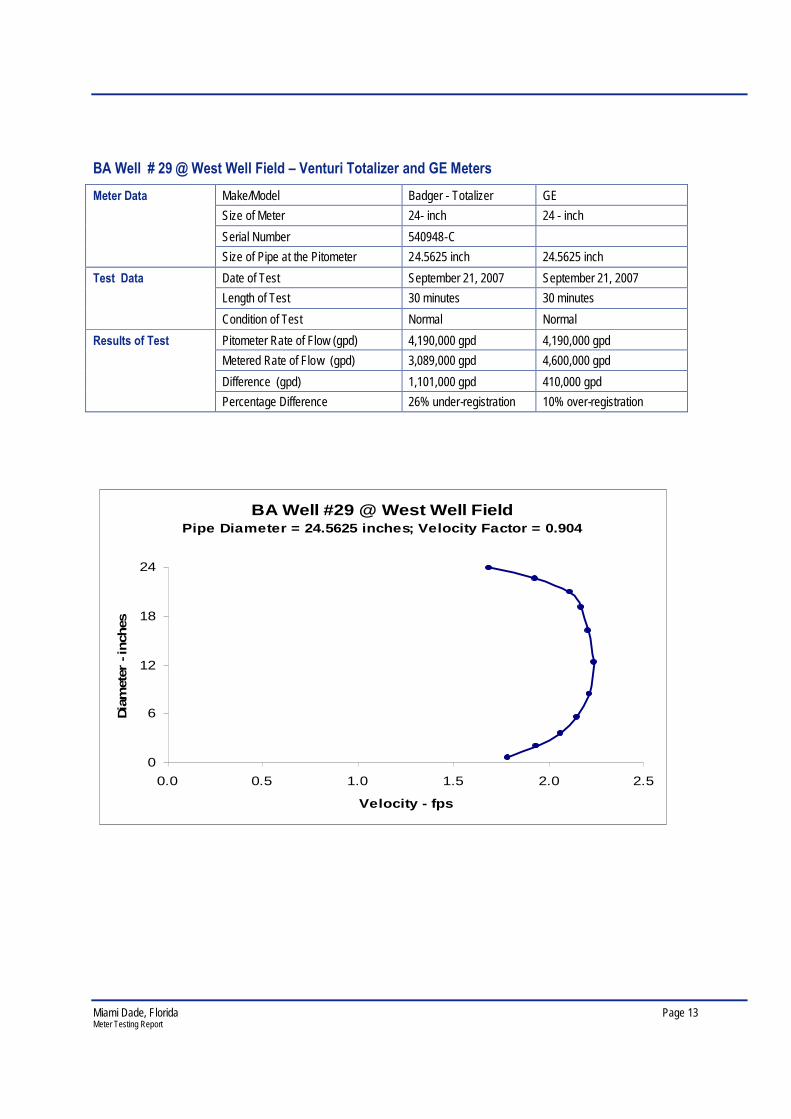
BA Well # 29 @ West Well Field – Venturi Totalizer and GE Meters
Make/Model Badger - Totalizer GE
Size of Meter 24- inch 24 - inch
Serial Number 540948-C
Meter Data
Size of Pipe at the Pitometer 24.5625 inch 24.5625 inch
Date of Test September 21, 2007 September 21, 2007
Length of Test 30 minutes 30 minutes
Test Data
Condition of Test Normal Normal
Pitometer Rate of Flow (gpd) 4,190,000 gpd 4,190,000 gpd
Metered Rate of Flow (gpd) 3,089,000 gpd 4,600,000 gpd
Difference (gpd) 1,101,000 gpd 410,000 gpd
Results of Test
Percentage Difference 26% under-registration 10% over-registration
BA Well #29 @ West Well FieldPipe Diameter = 24.5625 inches; Velocity Factor = 0.904
0
6
12
18
24
0.0 0.5 1.0 1.5 2.0 2.5
Velocity - fps
Dia
met
er-i
nch
es
Miami Dade, Florida Page 14Meter Testing Report
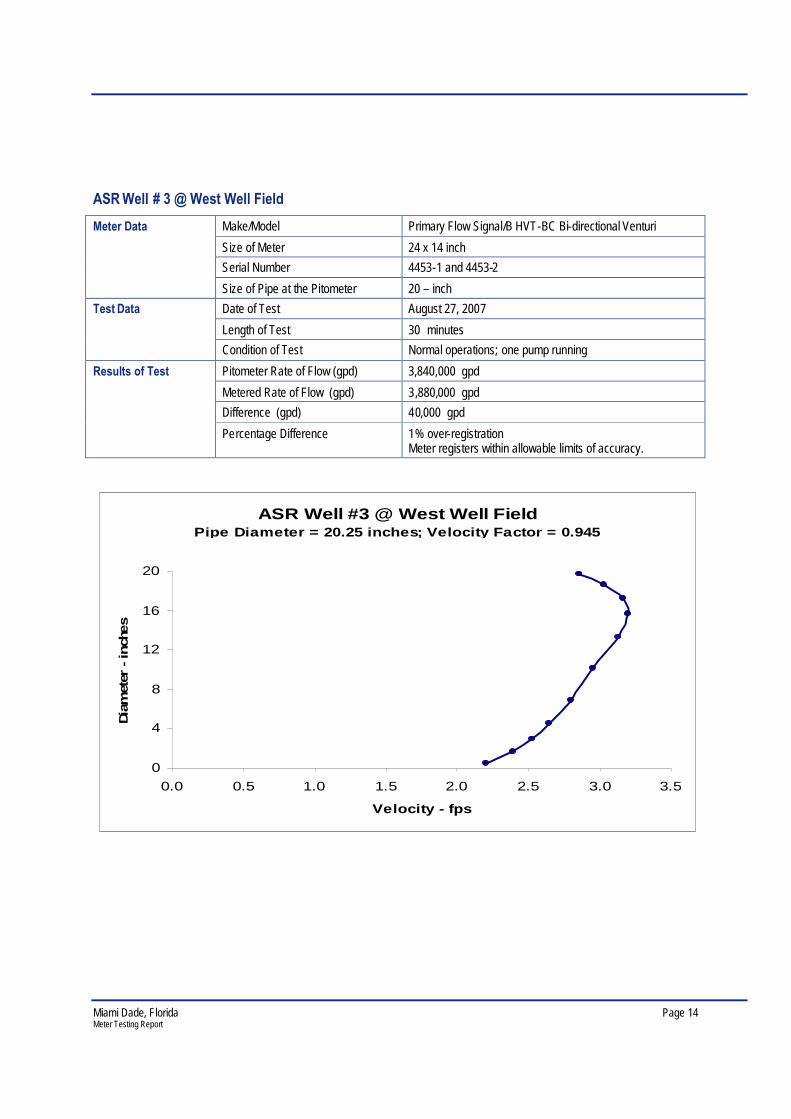
ASR Well # 3 @ West Well Field
Make/Model Primary Flow Signal/B HVT-BC Bi-directional Venturi
Size of Meter 24 x 14 inch
Serial Number 4453-1 and 4453-2
Meter Data
Size of Pipe at the Pitometer 20 – inch
Date of Test August 27, 2007
Length of Test 30 minutes
Test Data
Condition of Test Normal operations; one pump running
Pitometer Rate of Flow (gpd) 3,840,000 gpd
Metered Rate of Flow (gpd) 3,880,000 gpd
Difference (gpd) 40,000 gpd
Results of Test
Percentage Difference 1% over-registrationMeter registers within allowable limits of accuracy.
ASR Well #3 @ West Well FieldPipe Diameter = 20.25 inches; Velocity Factor = 0.945
0
4
8
12
16
20
0.0 0.5 1.0 1.5 2.0 2.5 3.0 3.5
Velocity - fps
Dia
met
er-in
ches
Miami Dade, Florida Page 15Meter Testing Report
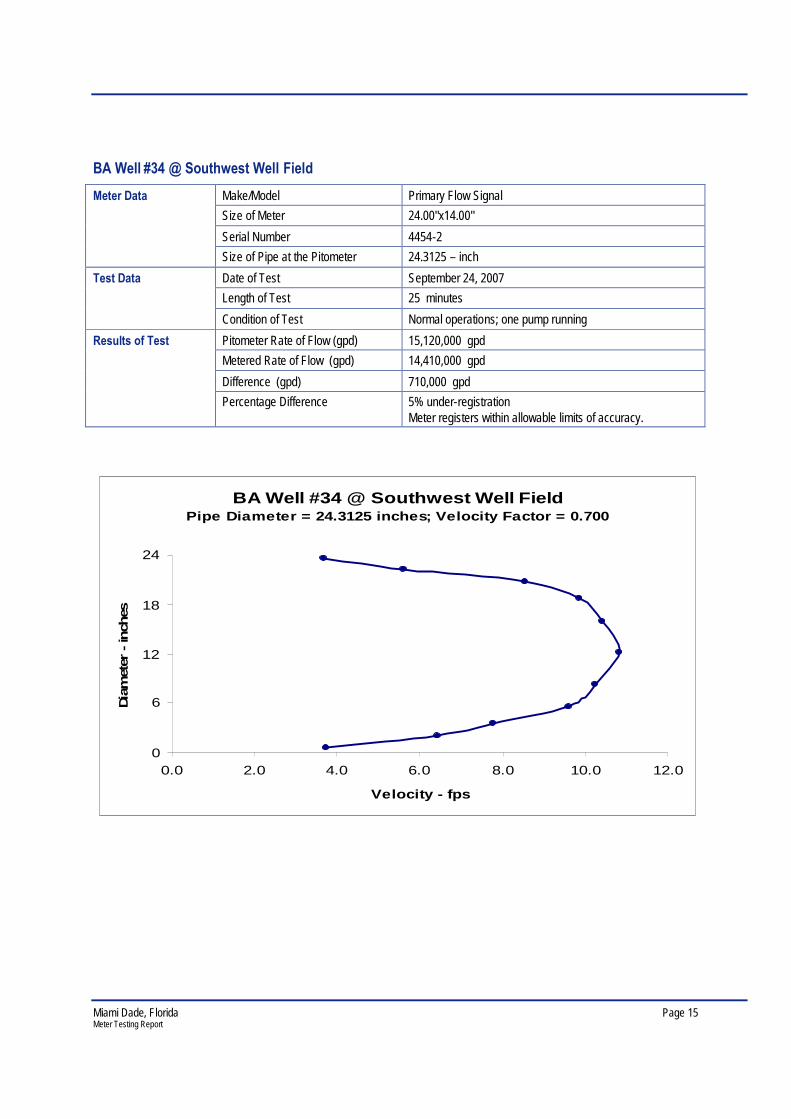
BA Well #34 @ Southwest Well Field
Make/Model Primary Flow Signal
Size of Meter 24.00"x14.00"
Serial Number 4454-2
Meter Data
Size of Pipe at the Pitometer 24.3125 – inch
Date of Test September 24, 2007
Length of Test 25 minutes
Test Data
Condition of Test Normal operations; one pump running
Pitometer Rate of Flow (gpd) 15,120,000 gpd
Metered Rate of Flow (gpd) 14,410,000 gpd
Difference (gpd) 710,000 gpd
Results of Test
Percentage Difference 5% under-registrationMeter registers within allowable limits of accuracy.
BA Well #34 @ Southwest Well FieldPipe Diameter = 24.3125 inches; Velocity Factor = 0.700
0
6
12
18
24
0.0 2.0 4.0 6.0 8.0 10.0 12.0
Velocity - fps
Dia
met
er-in
ches
Miami Dade, Florida Page 16Meter Testing Report
Analysis of ResultsEach of the venturi meters at Alexander Orr were tested for a period of twenty four (24) hours while each of thewest wells were tested for a thirty minute period. After the set up, Miami Dade instrumentation crew person wentto the operations center and took readings of the totalizer. Stopwatches at both locations were synchronized sothat readings at the totalizer and the PCR were taken during the same time period. The totalizer readings werecompared to the PCR results. Visual readings were taking from the transmitter at each of the wells. The meters atAlexander Orr are registering within allowable limits of accuracy. The 48 inch finished water meter wasdetermined to be accurate after the internal pipe diameter at the gauging point was measured to be 44⅜ inches. Two of the West Well Field meters, West Well field No. 34 and West Well field ASR 3, were registering withinallowable limits of accuracy. The West Well field No. 29 meter was not registering within allowable limits ofaccuracy. Two meters were tested at this well, the GE meter and the venturi meter. The GE meter is 10% over–registering when compared to the flow measured with the Pitometer while the venturi meter is 26% under-registering when compared to the flow measured with the Pitometer.


Water Treatment Division Data Evaluation and Automation Project
Project Overview
This effort is a prelude to; and in support of the systems analyses leading to the development of a Sequel Server DB and associated ASP.Net application for capturing the various data fields representing the activities associated with the production of potable water. The following information is task specific, based on report development needs. ASP.Net is suggested because of its ability to provide a secure multilevel data entrylquery environment for selectable data generation responsibilities and requirements. Additionally, the deployment of an application using this program provides a unique opportunity to better utilize network resources for periodic inquiries for essential process monitoring. The suggestion of Sequel Server DB is based on the need to maintain the data, from a historical perspective, in a manner which reduces problems with localized data retentionhestoration requirements, and also supports multilevel secure data interrogation without the additional requirement of an interface device such as a "Citrix" server. The use of these functional programs and data storage systems does however require a software interface for report generation. In the absence of clearly focused requirements, it is suggested that "Crystal Report Writer" and "Cognos" software products be evaluated for inclusion in this project. Each of these products can translate data strings in either "Oracle" or "Microsoft SQL" formats
The present system of capturing data for reporting purposes has been developed over a number of years and has evolved into an enormous task centered on a single reporting format managed by a single individual. The absence of uniquely trained staff is a major problem area in this regard. This enormous vulnerability has, and continues, to expose the regulatory reporting process to multiple failures. Conceptually, the systems as outline above eliminate this vulnerability by automating the data capture and report generation process and allows the data entry tasks to be apportioned throughout the treatment facilities. Management reports as well as operating reports will be available to authorized on-line users using ASP.NET routines. Data integrity can be managed effectively using "scripts" programmatically assigned to specific data entry fields. This also eliminates the need for local data storage capably because validated data is stored in a database which resides on mainframe storage.
Background
The Division is required to produce and submit a number of regulatory reports monthly. These reports are commonly referred to as MOR's (Monthly Operating Reports). The agencies that receive these reports are the Florida Department of Environmental Protection (DEP), the Florida Department of Health (DOH), Miami-Dade Department of Environmental Management (DERM) and the South Florida Water Management District (SFWMD). The completion of each of these respective report formats is the basis of the design effort for this project. These reports must be submitted to the above referenced agencies by the loth of the month following the data collection period. Additional, this data must be maintained in accordance with Florida Administrative Code (FAC) guidelines for a period of 10 years. This process also generates management data for inventory control and balancing
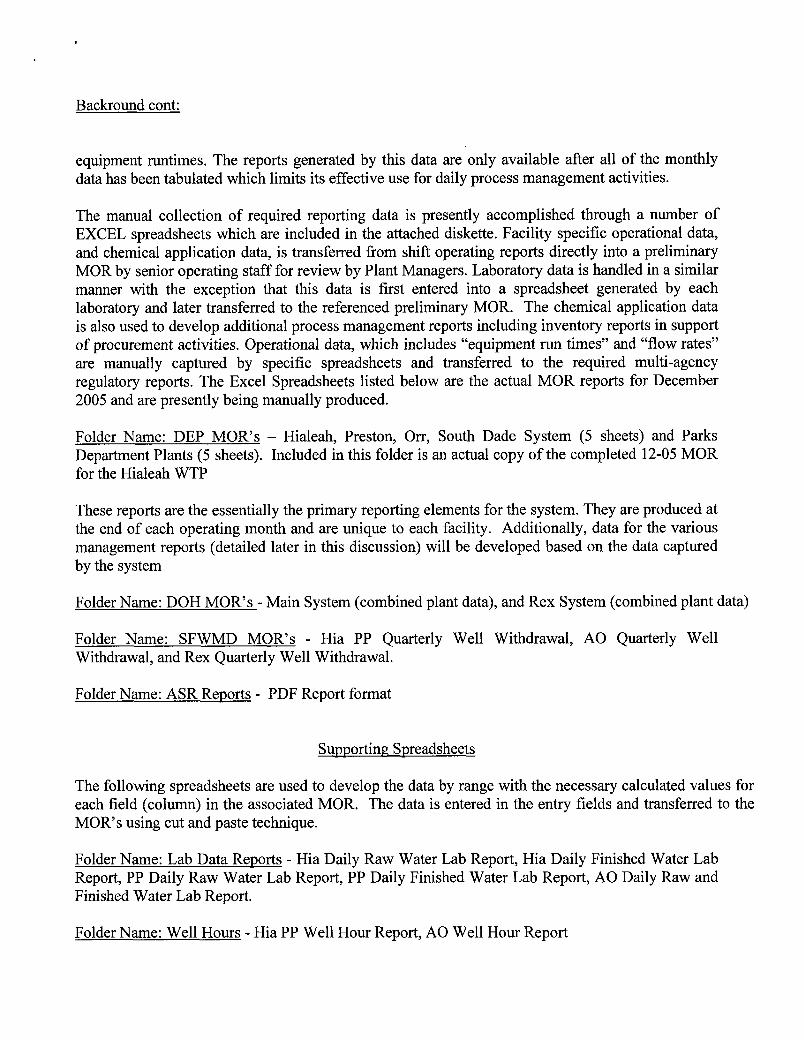
Backround cont:
equipment runtimes. The reports generated by this data are only available after all of the monthly data has been tabulated which limits its effective use for daily process management activities.
The manual collection of required reporting data is presently accomplished through a number of EXCEL spreadsheets which are included in the attached diskette. Facility specific operational data, and chemical application data, is transferred from shift operating reports directly into a preliminary MOR by senior operating staff for review by Plant Managers. Laboratory data is handled in a similar manner with the exception that this data is first entered into a spreadsheet generated by each laboratory and later transferred to the referenced preliminary MOR. The chemical application data is also used to develop additional process management reports including inventory reports in support of procurement activities. Operational data, which includes "equipment run times" and "flow rates" are manually captured by specific spreadsheets and transferred to the required multi-agency regulatory reports. The Excel Spreadsheets listed below are the actual MOR reports for December 2005 and are presently being manually produced.
Folder Name: DEP MOR's - Hialeah, Preston, Orr, South Dade System (5 sheets) and Parks Department Plants (5 sheets). Included in this folder is an actual copy of the completed 12-05 MOR for the Hialeah WTP
These reports are the essentially the primary reporting elements for the system. They are produced at the end of each operating month and are unique to each facility. Additionally, data for the various management reports (detailed later in this discussion) will be developed based on the data captured by the system
Folder Name: DOH MOR's - Main System (combined plant data), and Rex System (combined plant data)
Folder Name: SFWMD MOR's - Hia PP Quarterly Well Withdrawal, A 0 Quarterly Well Withdrawal, and Rex Quarterly Well Withdrawal.
Folder Name: ASR Reports - PDF Report format
Supporting Spreadsheets
The following spreadsheets are used to develop the data by range with the necessary calculated values for each field (column) in the associated MOR. The data is entered in the entry fields and transferred to the MOR's using cut and paste technique.
Folder Name: Lab Data Reports - Hia Daily Raw Water Lab Report, Hia Daily Finished Water Lab Report, PP Daily Raw Water Lab Report, PP Daily Finished Water Lab Report, A 0 Daily Raw and Finished Water Lab Report.
Folder Name: Well Hours - Hia PP Well Hour Report, A 0 Well Hour Report
Supporting; Spreadsheets cont:
Folder Name: Pumpage Balancing; Report - WTP Finished Water Balancing Report
Folder Name: Bulk Chemical Reports - Inventory Report for each WTP
Folder Name: ASR Reports - Operational data for ASR Facilities
Folder Name: Lime Plant Reports - Operational data for Lime Plants
As mentioned earlier, a number of these excel spreadsheets contain calc fields which generate data which is transfer to the actual report. At this juncture, it is anticipated that these calc fields will not be part of the MOR's reports; rather the values should be calculated programmatically, which will allow both the raw data and the calculated data to be accessed for reporting purposes. This concept includes any planned daily reports.
The MOR spreadsheets contain the name and licensing information for the plant staff at each respective WTP. For security and management purposes any data values entered for a specific operating shift should be linked to the actual personnel who reported the data. This is also true for Lab personnel, Water Administrative personnel, or other management staff that perform data entry. The application should also include a table for access authority for additional users which will be identified after the application is on-line.
The various spreadsheets which have been developed during the report generation process are also the data collection points for historical operating records mentioned earlier. This historical data must be preserved in its present "XLS" format because at this point, it appears that we will not be able to migrate or transfer this information to a Sequel Sever DB. In that regard, the data cannot be used for historical data inquiries used in the new application. This means that we must continue to store this data for kture reference until it becomes historically obsolete.
The following information is a general over-view of the data generation and input process.
Task 1
Plant Operators record Raw Water and Finished Water totalizer readings, Filter Operational Data, Well Hour Run Time Readings, and Chemical Addition Data including inventories, on the daily reports for each facility. Data entry personnel enter the totalizer reading into a excel spreadsheet (Plant Name - Balanced Raw and Finished Readings.xls). Well Hour run time readings which are taken by Plant Shift Operators and recorded on the Daily Report. They are manually entered into an Excel spreadsheet for each Month (Plant Name month year.xls). A special note regarding these spreadsheets; it contains the SFWMD ID# for each well and also it design rated capacity in MGD, which should be included in the finished application as separate tables which reduces the need for DB "Restructures" as equipment or facilities are added to Divisional responsibilities. There are several individual data and calc fields in these files which calculate the individual well pumpage
Task 1 cont:
rates based on run time in hours x capacity. The data is summed for an accuracy check against the daily Raw Water Purnpage for each plant. These fields are transferred (copylpaste) to the main Balanced Raw and Finished Water spreadsheet mentioned under Task 3. Chemical Data is entered into the calc fields on the MOR's which are outside of the printable ranges on the spreadsheet which populate the dosage fields and pound fields on the MOR. This data is also entered on the Bulk Chemical spreadsheet for accounting purposes.
Task 2
Laboratory Data for each day is entered on a preliminary MOR in the facilities operations room. This data is later entered manually into the MOR spreadsheet for each facility.
Task 3
The calculated data developed by the Balanced Raw and Finished spreadsheet is transferred to the MOR Spreadsheet. This data is also used to populate the fields on the SFWMD MOR spreadsheet. Special note concerning the Balanced Spreadsheet. It must be reconciled with anticipated values to ensure accuracy. An error at this point can cause the Raw and Finished Flow ranges on all associated spreadsheets to be understated or overstated. This is a glaring mistake that undermines the integrity of the submittals.
Task 4
The Lime Reconciliation spreadsheets are used to reconcile inventories plus purchased materials with actual treated water parameters. This report component is necessary because the instrumentation used to tabulate the actual amount of chemical fed is highly inaccurate.
Task 5
Aquifer Storage and Recovery (ASR) report is a relatively new component for the divisional reporting process. Originally, the data was tabulated manually by field visits supporting operational and laboratory records. The task has become extremely protracted, taking almost 1 week of administrative time per operating month to compile into a completed report. This task should be
Task 5 cont:
automated programmatically and reduce the exorbitant administrative time presently required. The Excel spreadsheets in the attached diskette are developed from data manually extracted from the SCADA system. Laboratory data is still being compiled and entered into the finished report manually.
Task 6
Shift operating data is compiled manually by plant staff for inclusion into the monthly report for each plant. The associated tables use generalized calc fields to determine production rates and operational costs.
Each of the tasks mention above interacts with each other to some extent. Although extreme diligence was used in preparing this project outline, there maybe a number of areas which were not thoroughly addressed or even mistakenly omitted. In addition, there are a number of time constraints which need to be considered. This is especially true for laboratory data. Generally lab data is available by noon for the previous operating day. Weekends and holidays are a notable exception. The availability of "SCADA" data is another area which needs further study. Informational requirements for other user Divisions also have not been addressed. Presently the MOR's are circulated to these Divisions, and they use whatever data they need to generate their respective reports.
There are several areas that also need to be addressed regarding interfacing additional sources of automated data. The Department operates an extensive Supervisory Control and Data Acquisition System "SCADA" system which in addition to its primary control functionality, can alternatively provide data logs for operational equipment. Data for reports is presently collected manually because of the lack of an effective automated data interface. This system utilizes both "SQL" and "Oracle" based formats for data storage. The Departments also operates a "LIMS" system for the management of its Laboratory data. This system stores data in an "Oracle" data base format. The system functionally uses a "Citrix" server to isolate data queries form the database structure for security purposes. Both of these active systems can provide a portion of the necessary data to populate fields used to produce regulatory and management reports while enhancing overall Water Treatment management activities by providing periodic observations of process or treatment system stability.
The development of this system is not intended to eliminate daily operational logs or manual data sheets presently used by any division. It is intended to eliminate the double and triple data entry tasks the Water Production Division currently uses. The realization of this system will require involvement of Departments MIS Division and Miami Dade County's ESTD as well as divisional data and MIS specialists. Once completed, the streamlined data management process will provide a vehicle to consistently meet regulatory reporting guidelines and provide easily assessable data for needs assessment the management of treatment plant activities.
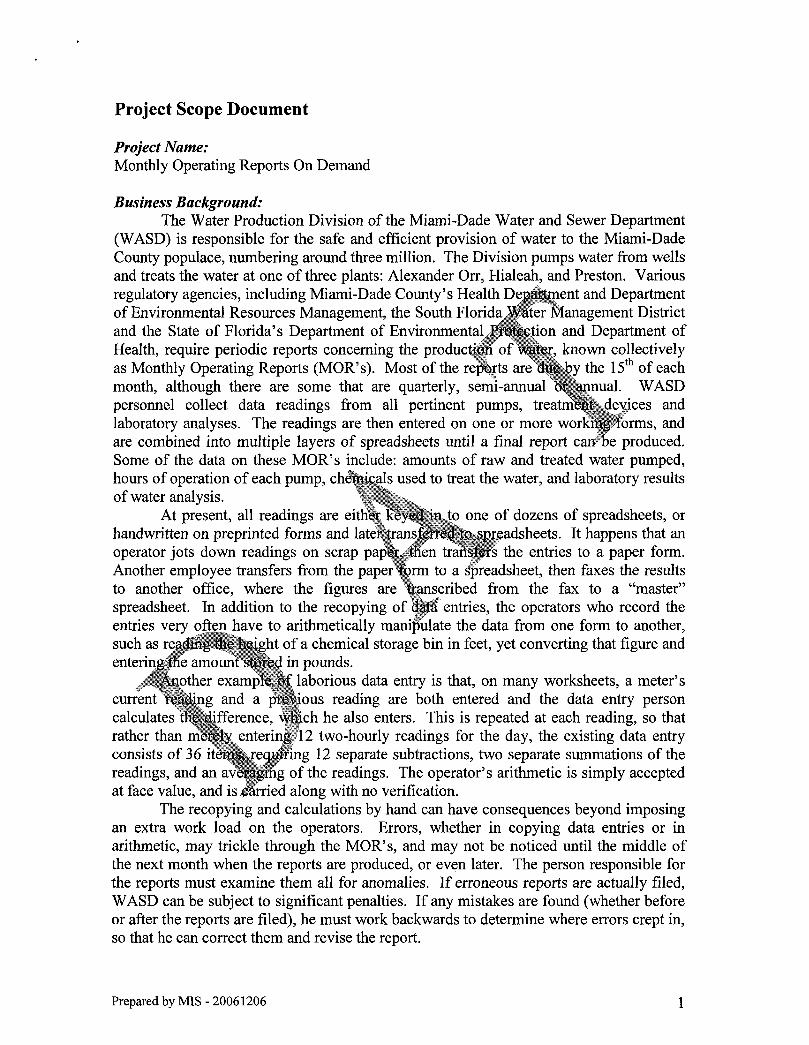
Project Scope Document
Project Name: Monthly Operating Reports On Demand
Business Background: The Water Production Division of the Miami-Dade Water and Sewer Department
(WASD) is responsible for the safe and efficient provision of water to the Miami-Dade County populace, numbering around three million. The Division pumps water from wells and treats the water at one of three plants: Alexander Orr, Hialeah, and Preston. Various regulatory agencies, including Miami-Dade County's Health nt and Department of Environmental Resources Management, the So and the State of Florida's Department of Environme Health, require periodic reports concerning the produc as Monthly Operating Reports (MOR's). Most of the month, although there are some that are quarterly, semi-annual personnel collect data readings from all pertinent pumps, tre laboratory analyses. The readings are then entered on one or more w are combined into multiple layers of spreadsheets Some of the data on these MOR's hours of operation of each pump, ch ed to treat the water, and laboratory results of water analysis.
At present, all readings are eit of dozens of spreadsheets, or handwritten on preprinted forms an eadsheets. It happens that an operator jots down readings on scrap p the entries to a paper form. Another employee transfers from to another office, where the figures are spreadsheet. In additio
a chemical storage bin in feet, yet converting that figure and
two-hourly readings for the day, the existing data entry consists of 36 i 12 separate subtractions, two separate summations of the
The recopying and calculations by hand can have consequences beyond imposing an extra work load on the operators. Errors, whether in copying data entries or in arithmetic, may trickle through the MOR's, and may not be noticed until the middle of the next month when the reports are produced, or even later. The person responsible for the reports must examine them all for anomalies. If erroneous reports are actually filed, WASD can be subject to significant penalties. If any mistakes are found (whether before or after the reports are filed), he must work backwards to determine where errors crept in, so that he can correct them and revise the report.
Prepared by M I S - 2006 1206
Project Objectives: This project's goal is to automate the handling of the data required for the
monthly and other reports to the extent possible, to make the reports quicker and simpler to produce, and to improve the integrity of the data reporting process. A guiding principle is that no datum should be entered more than once, and any calculations should be automatically verified or flagged if seemingly incorrect. To help insure accuracy in data entry, rules are to be developed and applied specifying allowable values, indicating unexpected inputs, and providing override permission as required. In addition, the entry and modification of data should be governed by specific rights, such as who can do so and when. Any changes that are made to database entries should leave a clear audit trail as to what was done, when and by whom it was done, and require an explanation as to why it was done. Finally, to the extent practicable, data entry and retrieval should be done via a web-based front end.
Four levels of reports are required: Exceptions, Trial, Final, and Revised. Exceptions reports ar should be produced on screen daily, showing s cted results that may be possible errors in the mo . By keeping current with these exceptions rep0 able to either document the explanations for questio h d and correct the causes if they are actual errors. Trial reports are to be g the required reports to the agencies mentioned above, and a1 $tool for tuning plant
month's end to prepare That is, at any time, the
roduced, incorporating nth's report should be loth of the month, etc. re problems can affect
2 (For example, recordings that show a ss than its capacity may not be erroneous - r repairs.) Producing such reports on an
discovering where the
Final reports, of course, can only be created when all data has been input. Revised reports can only be made after a final one has been prepared.
These last two types of reports are to be saved in report form for the same 10 year minimum as the raw data. Besides the Water Production personnel who create the reports, other users should be able to easily retrieve them via a web-based request. This is in contrast to the current situation wherein a user from another division has to ask Water Production for copies to be faxed, sometimes with no notice, yet with great urgency.
Prepared by MIS - 2006 1206
Justification: More efficient report handling
The basic aim of the project is, as the name indicates, the production of Monthly Operating Reports On Demand. The current regulatory requirements dictate the production of monthly reports. The reports are very time consuming to prepare, requiring the combined efforts of several people in order to meet the deadlines. Treatment Plant Operators (TPO's) enter the original data by pencil on dozens of disparate forms; any errors may not be noticed for weeks, or even years, when some governing agency investigates, or perhaps not ever A tangible benefit also accrues to the the avoidance of regulatory infractions. If we are found t regulation, we can be assessed fines of up broader viewpoint, users will be able to before the end of a month. More timely earlier discovery of errors and will provide reports to be made.
More efficient monitoring of plant operations The data collected for the MOR's is interc database to store readin combined. For example, he has many choices as nothing and hope it gets b the pH, or he can notice appropriate action for it. separate. By having th rrelated, we will receive the earliest possible warning of pr that may occur, and be in a better position to correct them
fficiently, and safely.
$-
Prepared by MIS - 2006 1206
Deliverables: Database This project will ultimately provide a relational SQL database to include tables of personnel, tasks, equipment, inventory, rules and readings, from which the MOR's can be generated at will. The database will support standard production security.
Interface For most users, the primary interface will consist of a series of data entry forms, suitable for easy viewing on a tablet or laptop PC. Some of the formsltasks would include:
Administrative adding employees revising employee assignments adding equipment
Supervisory modifying equipment parameters (e.g., maximum fl temperatures, etc.) preparing a MOR for review and for submittal adding inventory purchases
Operational entering readings (e.g f chlorine fed, pH of finished water, etc.) recording inventory
The forms should have a general el, and be easily navigable, such as by a "tab system" or on hey will be created in an ASP.Net framework and be avai een view, on a laptop or
ed to the WASD intranet. As a gured to use mobile devices for data
ected to the database and e database via a docking
4
s a LIMS (Laboratory Information Management System) personnel will produce emand will provide a n from the spreadsheet r them to incorporate a
new means of data entry, and certainly will not require any cut and paste or other resending of readings.
Reports There are various reports currently being produced for the State or County agencies mentioned before that will be d&icated in an "on demand" environment. Users will be able to generate these reports during the middle of the month, rather than having to wait until the end.
Prepared by MIS - 2006 1206
In addition, there will be new reports for internal use that will be created to improve the functioning of the TPO's. For example, a report will be compiled showing residual chlorine and chlorine flow - items that are currently tracked, but on different forms, perhaps in different places, and by different people. By having them on a single view, a TPO can adjust the flow to raise or lower the level of residual as necessary.
The deliverable for Reports, then, will consist of two steps. The first will deliver the report formats requested by TPO's or Water Production management. These reports will have sample (although realistic) data, and will serve to confirm the structure and handling of data for the reports. A second step will consist of the reports produced with real and current figures, which will confirm the actual gathering of data, and serve as a test of the project.
Training sessions Using the principle of "Trai ort series of sessions will be provided for the different levels of use
Liaison - ical background and
Administrative functions Report preparers - Treatment Plant Operator
Key Milestones: Milestones will include:
e of user interface illustrating the tasks that will able to
reports that can be produced On Demand lel to old method) producing MOR On rts. This will constitute the testing phase user acceptance.
Key Resource Requirements: The Water Production Division contacts and subject matter experts include:
Project Sponsor: Tom Segars Project Manager: John Spanioli Subject Matter Experts
Report Preparers: Art Baldwin, Sameena Ahmed Administrators: Jack Epaves, Ed Turner Plant Supervisors: Jon Hansen, Art Baldwin
The MIS analysts that have been provided for this project are: m Technical Lead: Yaakov Rudd
Technical Support: Arsenio Gonzalez
NetAdvantage for .Net, from Infragistics, is a software tool that has been identified as important to the project's success. This tool will enable rapid and consistent development of the user GUI interface, and will be useful in all future .Net projects.
Prepared by MIS - 2006 1206 5
Schedule: A schedule will be established to allow for the following:
Approval to proceed Requirements definition Completion of database design Delivery and acceptance of user interface illustrating the tasks that will be able to be done Delivery and acceptance of dummy regulatory forms and additional reports (automatically filled in by sample database data) Testing User Training completion and project adoption Production
Personnel Affected: This project will impact a variety of personnel i
In addition to "general" users who will have access to copies of reports, etc., the following groups of individuals will be direct1 in data entry, supervisory or administrative capacities:
Division Chief 1 Treatment Plant Chief Treatment Plant Supervisor Treatment Plant Operator I1 Treatment Plant Operator I
Constraints: The timeframe of this pr y the use of Infragistics'
NetAdvantage, a .Net development tool that in rapid application development. It is expected to be a re-usable part o signed in WASD. Without
expanded to allow for in-house development of the same
populates the MOR's generally comes from instrument assumption is that the readings will be used as the source
they may be overridden by individuals with sufficient des will need to be given a justification that will be made
that are currently being captured by a SCADA system, especially for the Aquifer Storage and Recovery (ASR) wells. However, there was no immediate interest in trying to use these readings or to increase the equipment that is being monitored. It may be that a future follow-up project will be requested to interface with current and/or future automatic data capture. The Water Production representatives indicated they do want the ASR wells to be included, but they preferred to delay inclusion of the ASR data until a later phase of this project.
IT contract staff will be retained for the duration of the project.
Prepared by MIS - 20061206
Risks: Additional equipment, such as pumps or chemical feeders, may be placed into
operation, and although the database is being developed to allow for such expansion, it is possible there may be unanticipated requirements for tracking the operation of the new equipment such that the database needs to be revised. If so, a then-current analyst will need to make the appropriate modifications.
Additional reports, or modifications of existing ones, may be required by external agencies, for which new interfaces would need to be developed. If so, a then-current analyst will need to accommodate the requirements.
Inability to keep IT contract staff will delay project completion.
Concerns: * Calculations by hand
Although most data entry consists of forms also demand some calculations. All o computer, and the results can be automaticall example, "the rate of chemical flow times the of chemical." Rather than automating this entirely, the mana they would prefer some calculations still to be done by ~ ~ k r a t o r s (TPO'S). Accordin culated results will (in the event of miscalculations) si are incorrect, but will not display the correct results. Thi e benefit of helping train the user, and also catching such incorrec imals, etc. The computer will compare the operator-entere ght" one, and signal when discrepancies occur; however, it see omputer's usefulness to still require such tasks as performing lon Not making use of SCADA
Each recopying of d re chances for entry errors, the minimization of which s of this project. It follows that the first transcription of a data reading creates the first opportunity for error. Some of the data is available through a SCADA system already in use. However, the Division's management prefers that even those readings be entered manually. They do, however, wish to use the SCADA data for a sort of verification, to insure readings entered by hand are "reasonable" when compared to the SCADA information. The use of SCADA to provide equipment readings would reduce the likelihood of entry errors wherever SCADA is available. If this is done, a backup method for data entry must be provided for those times when the SCADA system is not operational. Personnel supervision
The automation of the data collection and report preparation are the prime objectives of this project. However, the Water Production Division is asking to design the proposed solutions in such a way as to incorporate certain oversight functions, also.
For example, the division's management considers that there is a tendency for employees to assume all equipment is correctly working. At the end of a shift, readings for the entire shift might be entered all at one time, without actually having checked at the required intervals. Additionally, one employee might enter readings that his colleague should have made, "covering" for him and calling into
Prepared by MIS - 20061206 7
question the integrity of the entire data collection process. To prevent those types of misconduct, management has requested that the system enforce automatic logoffs after periods of inactivity, and require periodic logins of the operators, in addition to requiring the arithmetic to be done by the operator (as mentioned before), and setting time limits as to when readings can be entered.
It's true that one can claim benefits to such an approach (beyond being likely to catch employees not performing their assigned duties appropriately): TPO's will better understand the workings of the plant and be more likely to notice anomalies; requiring the entry of quite a few data items every hour or two can simply serve to make sure the TPO stays awake throughout his shift. Nonetheless, it is hard to escape the feeling that this is a use of technology to enforce what is essentially, and more properly, a personnel supervision issue.
Current Status: key personnel from the Water
collection and report preparation, and each meeting, Yaakov Rudd and Ars attendance representing the MIS Division. The main Wat el interviewed at each meeting are shown
Prepared by M I S - 2006 1206