.. 033001 file, i,,:1 Ii I I CONTENTS Page No. Summary' 1 1 • Introducti,on 2 2. Recent Test...
44
R. Murdoch:B. A.. I (Earth; Sc±ences) I. I ! ! I I ·1 033001 . - • Murdoch Geosciences, . 203 Main Road MAROOCHYDORE OLD 4558 1985. Report No. 1039 Telephone 071 433922 DofM M. C.G. E.D. D.S.lH. Registrar D.OIA. 1 7 JAN 1986 E&IL REF. No.£9: TO NOVEMBER 1985 A REPORT ON METALLURGICAL TESTWORK MATHINNA GOLD TAILINGS DUMPS - TASMANIA .. {O""h4 . (,4- "'I ,,( I I I I I I I I I I I I I I I I I I I I
Transcript of .. 033001 file, i,,:1 Ii I I CONTENTS Page No. Summary' 1 1 • Introducti,on 2 2. Recent Test...

R. Murdoch:B. A.. I (Earth; Sc±ences)
I.
I!
!
II
·1
033001
.-•
Murdoch Geosciences, .
203 Main RoadMAROOCHYDORE OLD 4558
Novemb~:r: 1985.
Report No. 1039
Telephone 071 433922
DofM M. C.G. E.D. D.S.lH.
RegistrarD.OIA.
1 7 JAN 1986 E&IL
DEPT.OF~
REF. No.£9:
TO NOVEMBER 1985
A REPORT ON METALLURGICAL TESTWORK
MATHINNA GOLD TAILINGS DUMPS - TASMANIA
~..
~2~j{~(
{O""h4
. (,4- "'I ,,(
IIIIIIIIIIIIIIIIIIII

......__ ...::.:"======-~~~
, i,
,:1
Ii
II
CONTENTS
Page No.
Summary' 1
1 • In troducti,on 2
2. Recent Test Work - All Involving 3
Cyanidation Tests
3 . Past Test Work 4
4. Head Grade 5
5. Agi,tation Cyanide Tests - 12
without Grinding
6. Heap Leaching 25
7 . Grinding & Agitated Leach 28
8 . Cyanidation After Classification 34
9. Flotation Test 36
1 0 . Summary of Results 39
1 1 • Conclusion 41
II J
IIIIIIIIIIIIIIIII'
Ii
•• 1 ••
033003
=.=./::;::2===..1;-~
I!
IIIII
,II,I-,!
- !
.i
1III[1
!II
I
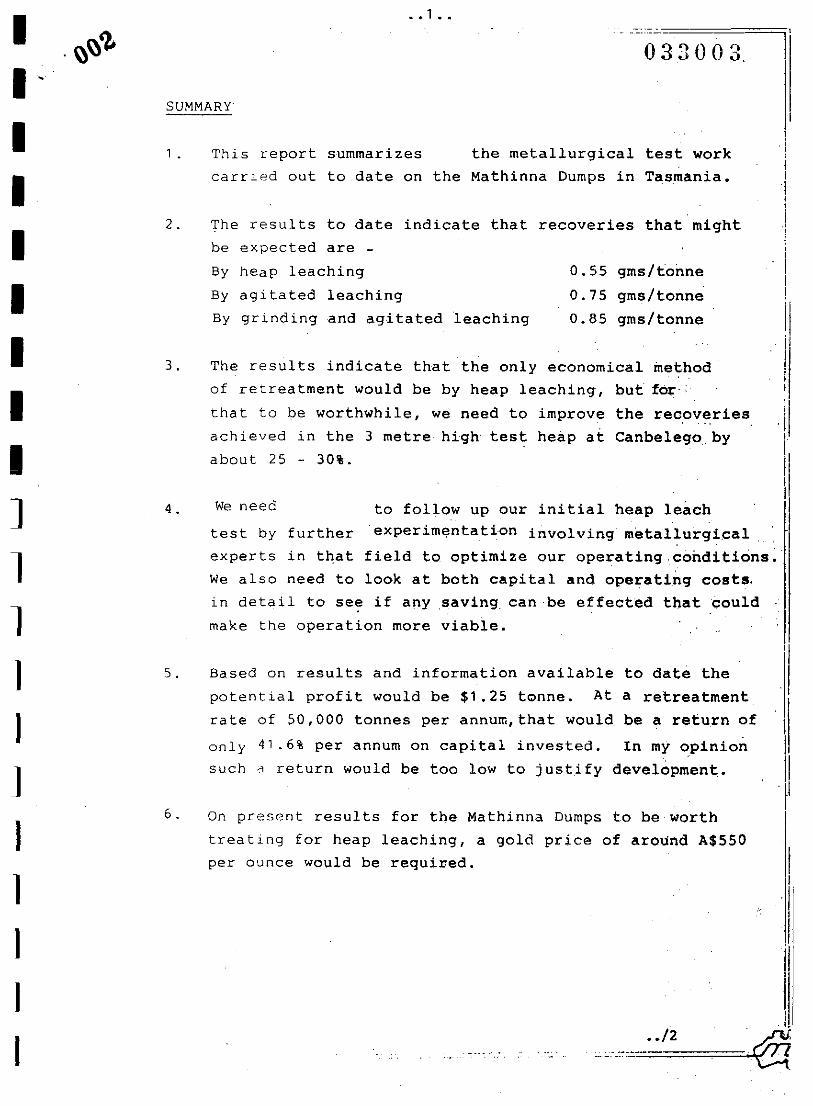
In my opinion
development.
0.55 gms/tonne
0.75 gms/tonne
0.85 gms/tonne
This report summarizes the metallurgical test work
carr led out to date on the Mathinna Dumps in Tasmania.
By heap leaching
By agitated leaching
By grinding and agitated leaching
The results to date indicate that recoveries that might
be expected are -
to follow up our initial heap leach
experim<;!ntation involving metallurgical
field to optimize our operating-conditions:
look at both capital and operating costs.
in detail to se~ if any saving can be effect$d that could .
make the operation more viable.
The results indicate that the only economical method
of retreatment would be by heap leaching, but for--
that to be worthwhile, we need to improve the recoveries
achieved in the 3 metre high test heap at Canbelegoby
On present results for the Mathinna Dumps to be worth
treating for heap leaching, a gold price of around A$5S0
per ounce would be requir,ed.
only 41.6% per annum on capital invested.
such d return would be too low to justify
SUMMARY
2.
1 •
about 25 - 30%.
4 . We need
test by further
experts in that
We also need to
3.
6.
5. Based on results and information available to date the
potential profit would be $1.25 tonne. At a retreatment
rate of 50,000 tonnes per annum, that would be a return of
II -IIIIIII]
11IIJI1III

='.=/3===Ji.~;~\
1.3 The results of this work, along with a summary of all the
previous testwork results completed by others, have been
incorporated in this report.
1.2 Over the past three months Epoch have been carrying out a
series of bulk metallurgical tests at their Canbelego pilot
plant facility in N.S.W. on samples taken from eight separat1
sections of the tailings dump.
033004-,,~-=,=--======;:'1
•• 2 ••
1. INTRODUCTION
1.1 The Gold Bearing Tailings Dumps at Mathinna, Tasmania have
been the subject of three separate phases of metallurgical
testing spread over the past 35 years. The 'initial testing
was carried out by the CSJRO in 1950, the second ~haseby
Tasminex in the early 1980's and the third phase ,by Epoch
Minerals Exploration in 1984 and 1985.
II'IIIIIIIIIIIIIIIIII

. .3. •
2. RECENT TEST WORK - ALL INVOLVING CYANIDATION TESTS
2.3 Heap leaching
iI,
I,II/.
II
gm sample trom each
mill and leached in a
'Itests involving about ~ drum of sample from [
To provide enough samples for effective
the pilot plant, some of the samples had to
Eight tests involving a small 50
site were ground in a laboratory
mechanically stirred beaker.
···--033005
(1) Agglomeration heap leaching - more samples have recently
been acquired from 30 new holes drilled on the site and
this test work is yet to be carried out.
= ..=1=4===-Jr(ii
I(1) Eight separate tests involving one drum of sample from I
each of eight sites. A ninth test involved a mixed set IIof splits from a drilling programme carried out by Epoch!
in 1984.
(1) A 1 metre high heap leach column (~ drum of eachsamplel.1
(1) Eight separate tests involving ~ drum from each site.
( 3 )
(2) A 3 metre high heap leach column (1~ drums of each
sample) .
(2) Eight check
each site.
grinding in
be combined.
(2) Eight comparitive laboratory tests with small 50 gmsamples.
2.4 The test work still to complete -
2.1 Grinding and agitated leach -
2.2 Agitated leaching without grinding -
IIIII]
1JI1J]
I]
IIIJ
1I
•• 4 ••
'i"
ii"
I,II'"
IIij"
II
Ii[jI'. ;tI:"f:II11!
I
, ,
(As shown ontwo areas.
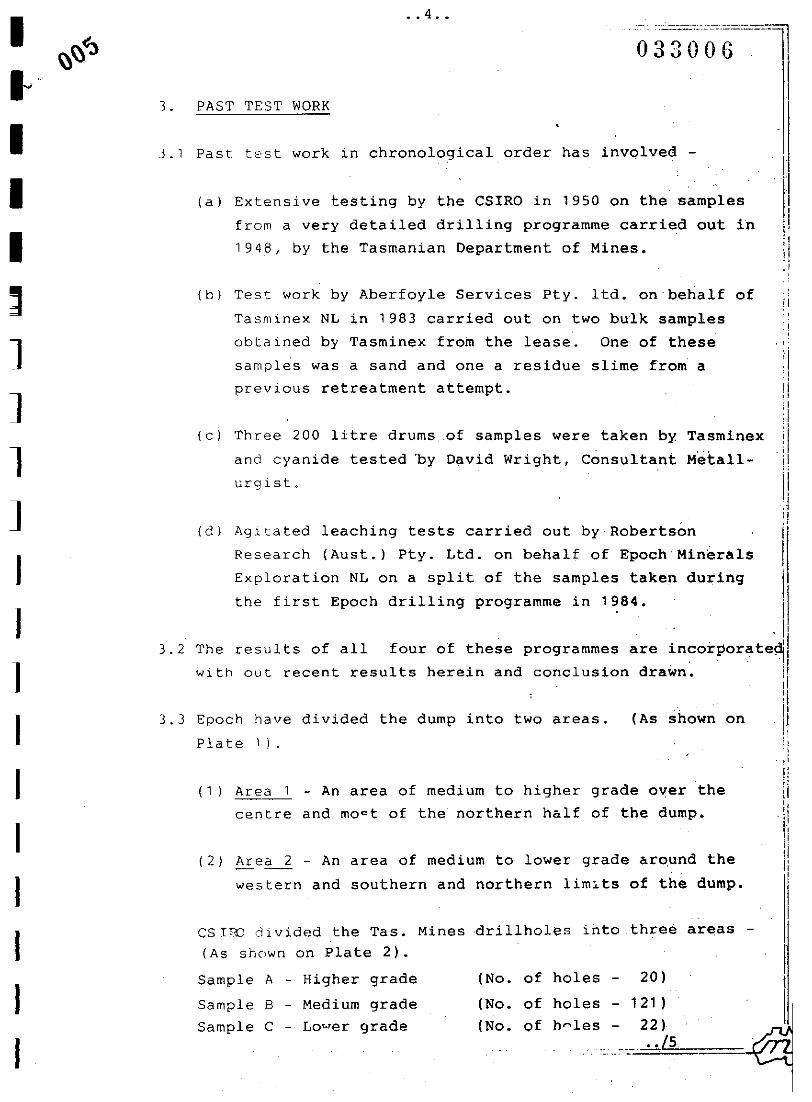
(No. of holes - 20)
(No. of holes - 121 )
(No. of h~les - 22),. .. /5
-
Higher grade
urg i s t.
Agltated leaching tests carried out by Robertson
Research (Aust.l Pty. Ltd. on behalf of EpochMin~rals
Exploration NL on a split of the samples taken during
the first Epoch drilling programme in 1984.
(1) Area 1 - An area of medium to higher grade over the
centre and moat of the northern half of the dump.
(d I
Sample A
Sample B - Medium grade
Sample C - Lower grade
CSI8J divided the Tas. Mines drillholes into three areas
(As shown on Plate 2).
Epoch have divided the dump into
Plate I).
(2) Are~ - An area of medium to lower grade around the
western and southern and northern lim~ts of the dump.
(al Extensive testing by the CSIRO in 1950 on the samples
from a very detailed drilling programme carried out in
1948, by the Tasmanian Department of Mines.
(c) Three 200 litre drums of samples were taken by
and cyanide tested by David Wright, Consultant
(bl Test work by Aberfoyle Services Pty. ltd. on behalf of
Tasminex NL in 1983 carried out on two bulk samples
obtained by Tasminex from the lease. One of these
samples was a sand and one a residue slime from a
previous retreatment attempt.
3. PAST TEST WORK
3.1 Past test work in chronological order has involved -
3.3
"":1
::::~~:x :1IiI;,1
11
II,il
. Ii3.2 The results of all four of these programmes are in?orporate~1
wi th ou t recent results herein and conclusion drawn. :1
HI'il":;"
. ~ i
I(-'
III~
]
]
1]
I11]
IIIIII

4. HEAD GRADE
i
i
I,i
IIiiiIi
II\I
.\~
1984 was
bulk samples
IIII
_______=.=,/=6==.==~&
gms/tonne )gms/tonne
gms/tonne
1 .98
1 • 6
1 .38
0.2% (total sulphur)
0.14%
0.9%
assays of the Tas. Mines 1948 holes the head grade
i
Drum 1 1 .5 gms/tonne IIDrum 2 3.08 gms/tonne Average 2.08 gmslt:onnei\Drum 3 1 .66 gms/tonne
033007
.. 5 .•
The head grade of the sample tested by R.R.A. in
1.2 gms/tonne. The estimated head grade of the
tested by· Epoch Minerals in 1985 were around 2
gms/tonne. (Average 2.2gms/tonne).
Assays of hand picked sulphur rich ore, indicated ~hat14%
of this sulphur was in the. form of ansenopyrite and 37% was
soluble sulphur.
Sample A
Sample B
Sample C
4.2 From fire
was --
Sample A
Sample B
Sample C
4.6
4.1 From fire assays of holes drilled by Epoch in 1984, the
head grade of Area 1 . samples was 1.7 gms/tonne. The head
grade of Area 2 was 1.2 gms/tonne.
4.5 The head grade of the samples tested by David Wright were -
4.4 The head grade of material tested by Aberfoyle was 2.0 gms/
tonne for the sand sample and 0,8 gms/tonne fOr the slimes .
sample.
4.3 The 1948 samples were also analysed for sulphur -
IIIIIII]
1IIIIJIIIJ
1I

J ~~"\..
t4 . 6
J11
J-I
J1]
]
]
]
iiIIIIII
•• 6 ••
033008
The Aberfoyle samples of sand and residue were analysed for
a range of elements and minerals after cyan{dation.
* Assays by fire assay method.
All other assays by rep
=.=.1=7===~rt.

= ..=1=8==~d
•. 7 ..
033009
l4.6 (continued)I
TABLE 2
HEAD ASSAY ANALYSIS OF MATHINNA TAILINGS i!
(AFTER ABERFOYLE 1983) I,I
WHOLE ROCK ANALYSIS Ii,
Sand Sample Slime Sample II
Si0 2 % 86.3 81 .5 IIAl 20 3 % 5.91 9.73
Ti02 % 0.30 0.52
Fe2
03
% 2.54 3.59
MnO % 0.05 .0.06
MgO % 0.44 0.69
CaO % 0.07 0.17
Na2
0 % 0.1 6 0.16
K20 % 1 .27 2.08
P20 % 0.60 . O. 3.0
C % 0.60 .0.30
Te ppm 50.00 5'O.OQ
IJj'''.
IIIIIIIIIIIIIIIIII
4.7 The Aberfoyle samples of sands and slimes were de-slimed
and examined under a stereo binocular microscope.
The descriptions were as follows -
Sands
A small amount of clay and traces of black porous organic
metter (carbonised woody material) are present in the
washings.
I
II

TABLE 3
SCREEN SIZING
(AFTER CSIRO 1950)
-- -_ .. _..__._- :::======jj033010
.. 8 •.
Sizing (microns)
+ 600
600/400
400/300
300/200
200/150
150/100
100/75
- 75
Slimes
Coarser material consists dominantly of quartz, with small
f ragmen ts of shale and carbonaceous / graphi tic sla.t.es, iron
stainec rock and quartz grains, compact geothite (probably
representing oxidised sulphides) and occasional quartz
pyrite grains. The As present was not specifically accounteq
for, but very probably occurs as an arsenate (e.g. scorodite~
in finely-divided form which is difficult to dete6t. No icarbonates were detected. I
!
I!
II
IIi
This sample is broadly similar to the sand, with minor
differences, it contains a higher proportion of shale/slate
fragments (as reflected in the Al z03
assay), and a lower·
proportion of carbonaceous/graphitic rock fragments. Clays
and carbonised organic matter reported in the washings.
The carbonaceous matter is almost certainly capable of
absorbing gold from solutions and could in fact be the main
source of both gold and silver.
4.8 CSIRO carried out sizing analysis on each of its 3 samples.
4.7 (continued)
I ~~~
IIII1]
11I1IIII1IIJ
I

•• 9 ••... -------_.=.=====il
II,
IIIIil11
10.9
6.6
82.5
22.3
8.9
68.8
0.07
0.05
0.40
1 .60
0.76
3.7
SAMPLE A
TABLE 4
ASSAY SIZING TEST
(AFTER CSIRO 1950)
31 .5
26.5
42.0
Further evidence on the mode of occurrence of the gold is
given in Aqua Regia leaching tests carried out by the CSIRO.
In hot aqua regia, sulphide oxides carbonates, tellurides
and natural gold ore all solublo. In general the residue
comprises quartz and stable silicates. The aqua ,regia t~st
therefore indicates whether the gold occurs in the sulphides I
or is locked up in the silicates as is the case at Canbelego·•. /. I
•. /io ~
033011
+ 200
200/75
- 75
A portion of the fractions of Samples A and B were assayed
for gold and sulphur.
Sample B representing the larger portion of the dump is
coarser grained than either A or C.
The two tests indicate that about 50% of th~ gold is fine
and about 20 - 40% is fairly coarse. The dis~ribution of
gold is also closely aligned to the distribution 6f .si.l1phur~
(continued)
,
--s-i-z-e-----%-W-e-i-g-h-t---G-O-l-d----%-.-s----%-D-i-s-t-r-i-b-u~t-i-o-n--II(micron) EE!!! Au sfl----------------=---....:..==---11
"
"I
SAMPLE B---------
+ 200 44 1. 33 0.08 35.8 30.4
200/75 28.5 0.97 0.0,7 16.9 1 7.3
- 75 27.5 2.82 0.22 47.9 52.3
4. 1 0
4.8
4.9
IIIIIIIIIIIIIIIIIIII

•• 1 0 ••
SCREEN SIZING
TABLE 5
7.4
1 4.4
16.3
6.3
55.7•• III ,4:;1
======~~~{
2.4
1 5.9
1 5.3
27 • 1
39.3
100.00
Dist.
( %)
0.57 gmsltonne
0.75 gmsltonne
iAFTER ABERFQYLE 1980)
033012
Sample A
Sample B
The residue assays after leaching in aqua regia were ~
- 600 micron head - 1.9 ppm Ave
Residue
+ 600 11 .74 0.5
+ 300/-600 10.44 1.1
+ 106/-300 16.66 0.8
T 38 / -106 12.48 0.4
- 38 49.18 0.9
In both cases the sample was treated wi thout grind<ing. From jthese results the CSIRO concluded that unless the tailings
were reground,no more than 1.42 gmsltonne could be extracted
(72% of the gold present) by cyanidation of Sample A and no
more than 0.85 gmsltonne (53%) from Sample B.
Size wt Au
(Microns )' ( %) ,ppm)
Sand+bUD 9.61 0.5
+ 300/ ·600 19.91 1 .6
+ 106/ ,<300 27.23 2.0
+ 38 / - 1 06 14.00 2.0
38 29.25 2.7
Head (Ceile) 100.00 2.0
4.10 (contlnued)
4.11 Aberfoyle also carried out sizing analysis on itsQulk
samples of sand and slimes.
1
-I ~
I1
II1
I1
I1
11IJ
IIJ1
I

Aberfoyle sizing analysis results are similar to CSIRO and
again ~bout half the gold was found in the fine grained
fraction.
.. 11 ..
- 600 mlcron head - 1.0 ppm Ave
I
II
IIII
i
I
i
t
033013
100.000.8100.00Head (Calc)
(contlf,ued)4 • 1 1
II ..
IIIIIIIIIIIIIII
.• /12 ~======~~
•. 1 2 ; •
033014
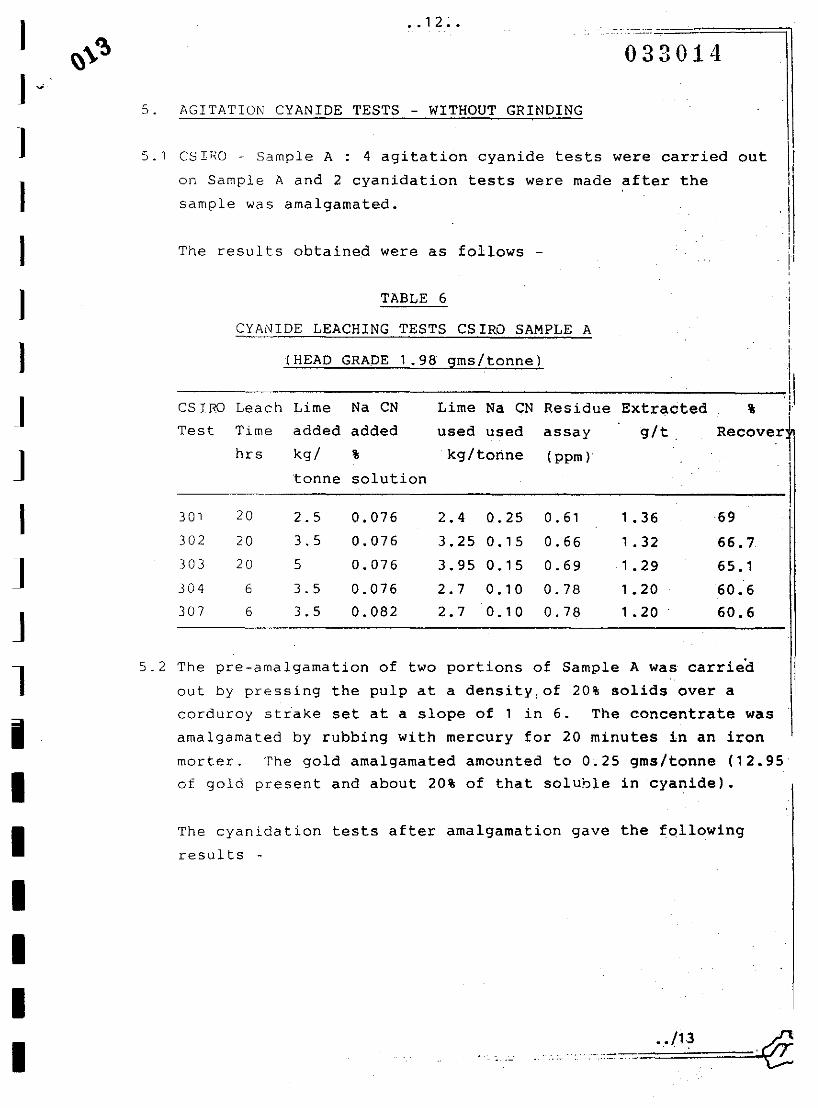
The cyanidation tests after amalgamation gave the following
results -
I,ij'
=..=./=13==~,€-
AGITATION CYANIDE TESTS - WITHOUT GRINDING
CSIRO - Sample A : 4 agitation cyanide tests were carried out
on Sample A and 2 cyanidation tests were made after the
sample was amalgamated.
TABLE 6
CYANIDE LEACHING TESTS CS IRO SAMPLE A
(HEAD GRADE 1 .98 gms/tonne) !
.11CSIRO Leach Lime Na CN Lime Na eN Residue Extracted % !Test Time added added used used assay 9/t. Recover I
hrs kg/ % kg/tonne (ppm)
tonne solution
301 20 2. 5 0.076 2.4 0.25 0.61 1 .36 69
302 20 3.5 0.076 3.25 0.1 5 0.66 1 .32 66.7
303 20 5 0.076 3.95 0.15 0.69 1. 29 65.1
304 6 3.5 0.076 2.7 0.10 0.78 1. 20 60.6
307 6 3.5 0.082 2.7 0.10 0.78 1. 20 60.6
The results obtaine4 were as follows -
The pre-amalgamation of two portions of Sample A was carried
out by pressing the pulp at a densitY,of 20% solids over a
corduroy strake set at a slope of 1 in 6. The concentrate was
amalgamated by rubbing with mercury for 20 minutes in an iron
morter. The gold amalgamated amounted to 0~25 gms/tonne (12.95
of gold present and about 20% of that soluble in cyanide).
5. 1
5.
5 _ 2
J
] "
JJ
IJ
J
JJI]
J1IIIIIII

,.13.',
J
5.2 (continued)
TABLE 8
CYANIDE LEACHING TESTS CSIRO SAMPLE B
(HEAD GRADE 1.6 gms/tonne)
5.3 CSIRO- Sample B
66.7
65.1
g/t
1 .32
1 .29
used used assay
kg/tonne ppm
Lime Na CN Residue Extracted
0.039 0.070 0.66
0.026 0.071 0.69
TABLE 7
%
0.073
0.077
(CSIRO SAMPLE A)
3.5
2.5
kg!hrs
20
6
CYANIDE LEACHING TESTS - AFTER AMALGAMATION
321 20 2.5 0.076 2.25 0.1 0.99 0.61 38.2
322 20 3.5 0.076 3.25 o. 1 0.99 '0.61 38.2
323 20 5.0 0.076 3,65 0.1 0.94 0.66 ,41.1,
324 6 3.5 0.076 3.25 0.1 1. 25 0.45 28.0
330 6 2.5 0.077 ' 1 .8 O. 1 1. 11 0.49 30.8
331 6 3.5 0.077 2.25 0.05 1. 15 0.45 38.00-•• /14
.,~ .-
305
306
CSIRO Leach Lime Na CN Lime Na CN Residue Extracted % ITest Time added added used used assay g/t Recover1
hrs kg! % kg/tonne ppm
tonne Solution
CSIRO Leach Lime Na CN
Test Time added added
SlX agitation cyanide leach tests were carried out on Sample Band two after amalgamation.
Ii,
These results show that if amalgamation preceeds cyanidation. II
the recovery is not markedly improved over 20 hours of leaching~
but there is an improvement of 5% where only 6 hours leaching !15 used. I
I
11
'II!:1
% I,;!
Recover~
Iftonne solution II
-----------------,-----1'il!
IIIIIIIIIIIIII

•• 1 4 ••
=.=./=1=5==~
iiIII!
I
* Cyanided after amalgamation.
The nbld amalgamation was 0.12 gms/tonne. (About 10' or 30%
of soluble gold).
325 * 20
326 * 6
TABLE 9
CYANIDE LEACHING TESTS CSIRO SAMPLE C I._-(HEAD GRADE 1. 38 gms/tonne)
I,CSIRO Leach Lime Na CN Lime Na CN Residue Extracted ,I
R.COVor~Test Time added added used used assay g/t
hrs kg/ % kg/tonne ppm
tonne solutionII------~-----
341 20 2.5 0.076 2.2 0.1 5 1 .02 0.36 26.1
342 20 3.5 0.076 2.85 0.1 5 1 .02 0.36 26.1
343 20 5.0 0.76 3.6 0.1 0.99 0.39 .. 28.3
344 6 3.5 0.076 2.4 0.1 1 .08 0.30 21.7
345 * 20 2.5 0.073 2.2 0.1 1 .03 0.34 25.0
346 * 6 2.5 0.077 1 .75 0.1 1 .1 4 0.24 17.4
-lI
ITABLE 8 (continued) I
--2-.-5--0-.-0-7-3--2-.1--0-.-0-5--0-.9---0-.-7-0---4-4-.-0-\
2.5 0.077 1.85 0.1 1.09 0.51 31.8 IiI
I* Cyanided after amalgamation
Some improvement with amalgamation (0.2 gms/tonne removed).
About 13% of total gold and 33% of soluble gold.
The results obtained were as follows -
Four agItation cyanide leach tests were made on original
Sample C and a further two tests after amalgamation.
5_4 CSIRO - Sample C
I ~\,~I ~
IIIIIIIIIIIIIIIIII

5.6 Aberfoyle initially carried out a series of laboratoryagitati,
tests in a conical flask under strong oxidizing conditions
using a magnetic bar stirrer on 2 portions of their sand
sample ar,d two portions of their slime sample. The tests
were carried out on minus 600 micron.material, the coarser
fraction being screened out. The pulp density was kept at
30%. The leaching time was 48.hours for each sample.
,
II
The res1due assays after 20 hours of leaching were slightly
higher for Sample C (Avg. 1.02 gms/tonne), than Sample B
(Avg. 0.95 gms/tonne). The residues for Sample A were the
lowest (Avg. 0.66 gms/tonne). The residue assays for C and B
tie fairly well into other test work. The residues for Sample
A appear a little light on and hence recoveries quoted for
Sample A may be a little too high. The recoveries quoted for
Sample B of around 40% tie in well with more recent test work
on the dump.
TABLE 10
The results are summarised as follows -
CYANIDE LEACH TEST - ABERFOYLE SAND AND SLIME SAMPLES
(HEAD GRADE - Sands 1.9 gms/tonne)
Slime 1.0 gms/tonne)
•• 1 5 ••
5.5 The CSIRO results indicate that there is not much difference
1n recovery with different lime additions. The amount of
cyanide added and used appears to be very low. From Epoch's
work we would have anticipated cyanide usage to be more like
1 kg/tonne. The 20 hour leach time gave an improved recovery
of around 5% on Samples A and C and perhaps slightly higher
for Sample 8.
Test cons&~Il>'t:ion Na CN Residue Solution Calculated
No. kg/tonne Solution Assay ppm * Head
% ppm
G 3.0 0.25 . 1 .15 1 .7 2 •.85Sand
2.7 0.25 1 .10 1 .4 2.5
Slimes{~ 2.3 0.25 0.5 0.35 0.85
3.0 0.25 0.65 .0 ..47 1 ·12 .r;(;* corrected for pulp density • ./16
IIIIIIIIIIIIIIIIIIII

.. 16 ..
Based on the Aberfoyle results the indicated recovery is -
uilIIII:1
iljI
II
56.6%
56%
40%
41 .4%
From calculated
head and residue
39.5%
42%
50%
35%
From Assay results
of head and residue
only
TABLE 11
ABERFOYLE LEACH TESTS - COMPARISON OF INDICATED RECOVERY
Test
higher than the 26 - 28% indicated for Sample C by the CSIRO
tests. A higher concentration of cyanide was ,used in the
Aberfoyle tests (around 5kg/tonne of solids compared to
lkg/tonne in the CSIRO tests'). It should be noted that the
CSIRO tests were carried out on a large number of drill
samples, whereas the Aberfoyle tests were on two bulk samples
only. As a result, the CSIRO results should be more
~} Sands
:) Slimes
oi~fo 1 8--- 11
. ./17
5.7 In these tests there is a significant disparity between the
head grade as assayed for the sands and that as calculated
from assays of final residue and solution. The slimes assays
are much better. A similar disparity with sand samples was
noted 1n Epoch test work.
jIIIIII,.I',I
representative of the dump as a whole. 1
5.9 Some bottle roll leach tests were also carried out by AberfOYle lusing 200 gram samples of both theaand and slimes collected.
Again the Na CN solution strength was 0.25% and the pH kept
to 10,0. Varying leach times were tried.
5.8 Among metallurgists the recoveries calculated from the assay
of head and residue (LH column) are generally more
acceptable. This .being the case then the indicated recovery
for the sands is around 40%, which is similar to that observed
by CSIRO for Sample B. Indicated recoveries from the slimes
are more variable, but average around 40% as well, somewhat
I'I'IIIIII~
JI1II1I1II

•• 1 7 • 0
The additions to the samples were
In his test, David Wright took 500 grams of dry sample from
each of the 3 drums of sample sent to him by Tasminex.
I
II. I!,!,
Solution *.
?
0.39 0.55 0.551
0.24 0.31 0.31 I
48%
0.7
0.8
72 hrs
2 kg/tonne
1,000 cc (pulp density 33%)
2.kg/tonne
205 grams
41%
48%
TABLE 12
0.8
0.5
48 hrs
Residue
1 • 1
005
24 hrs
, . 35
ppm
Head
ABERFOYLE LEACH TESTS - WITH VARYING LEACH TIMES
•• {1'3/ €.
033019 -\
Samples were agitated with water for 1 hout and then the lime
and cyanide were added. The samples were agitated for 22
hours and then carbon was added at this stage and the agitat'io
continuerl for 8 hours.
Lime
Water
Na CN
Carbon
Slimes 0.65
Sands
The results were -
(continued)
_*_c_o_r_r_e_c_t_e_d_f_o_r_p_u_l_p_d_e_n_s_i_t_y_o 1
Reco_v_e_r_y s_a_n_d_s S_l_i_m_e_s IBased on residues Ilafter 72 hrs)
Based on solutions
(after 72 hrs)
I!
------------------1,iI
24 hrs 48 hrs 72 hrs I
5.9
5. 1 0
IIIIIIIIIIIIIIIII.1II'

*** Comparison of solution assay with head grade.
~~=~~Ac::s~s!,.!;a!..y~s51. .,% .,
Recove~t
I
'I
i:Ii
·1[!,.
-C- c:-.,.:c.=--==--=c==-~~
033020 I
IIIilIIiI!!I
TABLE 13
•• 18 ••
CYANIDE LEACH TESTING
(D. WRIGHT'S SAMPLES)
60
80.8
43.7 **:-----------,..------------_- ...;'1.,
. ;;.,
RRA carried out agitated leach tests on a carefully split
representative sample of 1 kg collected in the first phase
of drilling carried out by Epoch Minerals in 1984;
,I
ii.1
-------._.,-
Drum Final Na CN Head Solution Gold *** Carbon
pH final Grade Assay * Recovery Gold
% ppm ppm
10.8 0.086 1 .5 1 .0 67% 0.9
2 1 0 . 1 0.050 3.08 2.5 82.2% 2 •. 49j 9.6 0.063 1 .66 1 .25 75.0% 0.72._--------
* Solution assay corrected for pulp density.
The results were -
1:H This sample contained a trace of oil detremental to carbon :J
'Irecovery. The recoveries' should not be lo.wer than the gold .1
:1recovered onto carbon. il
"
tl11
il"1"1In calculating )1is recoveries David Wright has used 'solution 'Ii:
assay and head grade and has not assayed the residue. It is :i1ipossible that the solution assay plus residue assay may be II!!
again higher than the head grade (as observed in Aberfoyle. i:,and Epoch's tests) and if this is the case, then the recoveri~~
. .Iquoted may be overstated. Ii
IiIIII
The sample was screened and the - 1 mm fraction pulped at II49% solids. 2 grams of lime and 2 grams of NA eN were added 1and the sample agitated in a bottle. roll for 8 hours. Furth tadditions of 1 gram of lime were made at ~hour and. 2t hours •
•• /19 ~
5. 1 2
S.10 (continued)
5 . 1 1
J1"II1I1JIIIIIII]
IIII

removed In the intermediate samples.
•• 1 9 ••
I
,,
Igold" I;
0330:n -~--l
I'II
0.86
35.8%
CYANIDE LEACH TESTS - ROBERTSON RESEARCH SAMPLE
TABLE 14
* Solctlon assay corrected for pulp density.
Leach solution after Solution Assa~ (ppm) *hour 0.36
2 hours 0.34
4 hours 0.43
8 hours 0.43
24 hours 0.48
The RRA conclusion, based on fire assays of solids was .that
recoveries"8re around 34%. Based on solution plus residue
the recovery was 36%.
After the 16 hours the leach pulp was split into 2 portions
and to one portion 10 grams of PICA 8 x 16 carbon was added.
The solutions were then agitated for a further 16 hours.
Sample were taken of solution at regular intervals.
CIP solution after 24 hours- 0.01 ppm
CIP residue after 24 hours - 0.83 ppm
Carbon after 24 hours - 0.205 milligrams of gold
Leach residue
Indicated recovery
In the results the calculated head assay given is based on
the weighed average of the 2 residue assays, the carbon
assay. the 24 hour leach and ClP solution as~ay plus the
5.13 RRA's sample was fairly low grade and the recoveries were
slightly less than the 40 - 45% observed by others. The
CSIRO tests on Sample C support the likelyhood of lower
recover.ies in lower grade material.
5.12 (continued)
IIIIIIIIIIIIIIIIIIII

TABLE 15
.. 20 ..
The results were as follows -
%
42
58
I
=~.• /21
Au extraction
g/t
0.39
0.55
03302:Illa half split of I,
IiIi'i"""ti"II,~ :\!
The residue was
onout by RRA
o. 86 ppm).
229.6
239.6
1000
mls/gm
(calc)residue
leached with concentrated HN0 3 , H Cl and water on a 1:1:1
ratlo for ~ hour at boiling point. It was then filtered to
spe lfadditlonal gold could be extracted.
The eight samples were tested by leaching for about 36 hours
in air agitated tanks with lime and cyanide. Two samples
tested weighed 85 kg and,six samples 50 kg, (corrected for
0101 sture content in Table 16 below). 200 grams of cyanide
sands) .
CIP
Acid leach solution
Acid leach residue
ACID LEACH TESTS OF CIP RESIDUE - RRA SAMPLE
____~ __'_ il
!1
0.095
0.57I0.94 '
,)CIP residue assay 0.83 . I
These results indicate that 42% of the gold in the resime could Jextracted by acid leaching. The total recovery cyanide plus Ii
acid leachlng would be 0.87 gms/tonne or 65%. The remaining I
gold is lnsoluble and impossible to extract. This compares 1
with aqua regia tests on CSIRO samples A and B where the Imaximum possible extractable. gold "Ias 7 2 % and. 53% . respectively.1
Wlthout gr-inding and assuming an average head grad~, of· around lj1 .7 gms I tonne, then the maximum extractable gold one' c6uld, Iie1<pect would be around 1.0 gm/tonne. To test this situation, !,Epoch Minerals Exploration NL carried out bulk tests on one IIhalf of a 200 litre drum of samples from each of 8 different Isites within the medium to high grade part of the dump. (Sim-I
ilar environment to CSIRO's samples A and Band Aberfoyle's ,I
III
1I!
5. 1 6
5.14 ACld leach tests were carried
a cyanide residue (head grade
5. 1 5
I.. ~
IIIIIIIIIIIIIIIIII

- - - - - - -- - - - - - - - ...'. -
. . 2 1 ••
TABLE 16
AIR AGITATED LEACH TEST . EPOCH MINERALS
.~--~_._-~--'._- ---~--- ------_.. ,----"-- . ----'_.,- ..-_..._----_. .._-- .. ---
Sample wt of dry Pulp pH Free Free Assay * Residue Calc. % Recovery
** Sample Density Cyanide Lime Grade ppm HeadSolution Grade
kg % % % ppm ppm
1 70.7 24 10.6 0.075 0.002 1 .28 0.78 2.06 62.1%
2 47.5 22 1 1 . 9 0.10 0.085 0.74 0.96 1 . 7 43.5%
3 48.4 22 11 . 3 0.10 ? 0.54 1 .60 2.1 4 25.2%
4 48.7 21 .5 12.0 0.1 0 0.06 0.54 1 .64 2.1 8 24.8%
5 46.2 25.5 10.7 O. 10 0.005 0.51*** 0.73 1 .30*** 43.8%
6 46.9 26.5 1 1 . 6 0.15 ? 0.49 *** 0.69 1.18*** 41.5%
7 70.7 19.7 1 1 . 9 0.09 0.028 3.47 1 .21 4.68 74. 1 %
8 45.8 25.3 1,1 . 9 0.1 5 ? 0.64 0.69 1. 33 48.1%
Avg. {Excluding 1 and 7 ) 0.59 1 .0 4 1 . ;;4 36%
Avg. (with 1 and 7 ). 1 .03 1 .04 2.07 49.7%
* Corrected for pulp density °1Wi
**.c.',:, ,
Samples 1· and 7 are slime samples.~I
*** Appear a little low Co":'
•• /22.,;._'-_--c-:.-_::~::::··-=-_=··=.:::=.. -- --------._. _.--.

TABLE 17
COMPARISON LAB BEAKER AGITATED AND BULK AIR AGITATED LEACH
The results obtained are presented in Table 16 on the follow
ing page.
... , ,... -',..7:=,'-===-===n1033024 11
II'Iil"I'.,"
!1:1;!'I
(for samples of' 50 kg this
per tonne and 12 kg of lime
•• 22 ••
and 600 qrams of lime were added
1S egulvalent to 4 kg of cyanide
per tonne).
TESTS - EPOCH MINERALS i,
11Sample No. Solution.Assay (ppm) Solution bulk test_._~~-_._.. _-_._----
(~llmes) 0.79 1.28II2 0.57 0.74
3 0.94 0.54 !4 0.60 0.54
5 0.64 0.57
6 0.. 83 0.49
7 (slimes) 1 .69 3.47
8 0.79 0.64
Avg, 0.86 1 .03
../=23===~
Assays ·CJf solution were by Epoch's Atomic Absorption Spectro- 'imeter at Canbelego and residue assays were undertaken by fire
assay by Australian Laboratory Services.
').1 b (contlnued)
'i. 18 The comparison indicates that for the slimes' the bulk test
was able to recover more gold than the lab test. The lab test
indicated that leaching in the air tanks of sample numbers I2, 3 and 6 and to a lesser extent 8 maY not have Qeen complete
and hence a higher recovery may be possible for these samples.,
5.17 Small samples of 50 grams each were lab tested by stirring in
a beaker with cyanide and lime and leaving to settle overnight.
The results were compared with those in Table 1~
IIII]
-I
1
]
1]
1
1II1
1
1
1
1
1

]
]
1]
IIIIIII]
IIIIIIII
•. 23 •• -_·_----_·_---=·=l033025
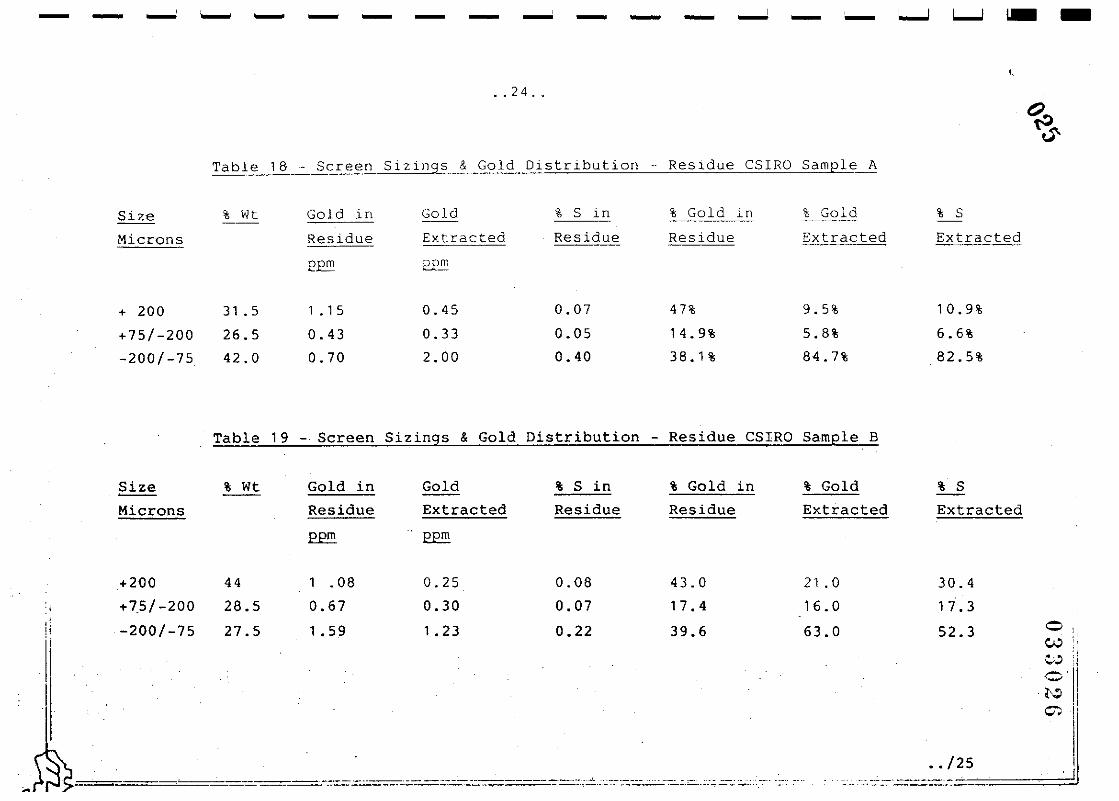
5.19 The CSIRO screen sized the residue of their cyanidation test
307 (sample A). The screen fractions were assayed for -90ldll
and sulphur. See Table 18 on next page. II,,,
Ai though 68.5% of the gold in Sample A orig'inally occurred i
in the - 75 microns fraction, 84.7% of the gold extracted
was from this fraction, whilst for the + 200 micron fraction,
the corresponding figures are 22.3% gold present and only- J
9.5% of the gold extracted. Comparison of_gold and sUlphur I,I!
percentages extracted show a very close relationship and ther_:
is considerable variation in assay of gold/sulphur in the Ii[I
residue over the 3 size ranges indicating that little of the
residual gold is associated with sulphur. This is supported I
/ 'Iby the aqua regia test results, where the 0.57 gmstonne I,
residue IS only 0.045 gms/tonne lower than the lowest residue I.!Iby direct cyanidation. 'I[Ii
5.20 The residue of CSIRO cyanidation test 330 (Sample B)- was also i
screen sized and the fractions assayed for gold and sulphur.
See Table 19 on next page.
46.9% of the gold in Sample B occurs in the - 75 micron
fractl0r: and 63% of the gold extracted comes from fraction;
whereas 35.8% of the gold occurs in the coarest fraction and
only 21.0% of the gold was extracted.
The assay ratio of gold to sulphur in the residue are similar'
for eactl size range suggesting that some of the gold left in
Sample B is assoG:iated with sulphides. II
5.21 Expressed in another way 93% of the gold in Sample A Which is IIsoluble In aqua regia can be extracted by cyanide, whilst jlonly 77% of gold in SampleB which is soluble can beextracte
by cyanidation. The gold sulphide association is more promin
ant in Sample B and may account for the drop in ;ercentage i
recoveries between the two sets of samples.
I_ II __ ._ ==_=,:.==./=,:24====~~
- - ,- - - - - - ,- - - - - -.. 24 ..
Table 18 - Screen Sizings & Gold Distribution - Resldue CSIRO Sample A
Size
Microns
+ 200
+75/-200
-200/-75
% Wt
31 .5
26.5
42.0
Gold in Gold
Residue Extracted
p£"l 2.Pm
1 • 15 0.45
0.43 0.33
0.70 2.00
% S in
Residue
0.07
0.05
0.40
% Gold in
Residue
47%
14.9%
38.1%
% Gold
Extracted
9.5%
5.8%
84.7%
% S
Extracted
10.9%
6.6%
82.5%
Table 19 - Screen Sizings & Gold Distribution - Residue CSIRO Sample B
Size % wt Gold in Gold % S in % Gold in % Gold % S
Microns Residue Extracted Residue Residue Extracted Extracted
~ P£"l
+200 44 1 .08 0.25 0.08 43.0 21 .0 30.4
:i +75/-200 28.5 0.67 0.30 0.07 17.4 16.0 1 7.3," -200/-75 27.5 1. 59 1. 23 0.221! 39.6 63.0 52.3'i
1
0 :iW 'i
C,o..:>ii
II0l'~ I,O? "I'
III
•• /25--_.-.-_...- ._- ---- ----'--._--.,.-_.---.....----'

II• ./26 ~======--<:.~
Ii. ,j
""I;IiIIi!II
i-:.1i'
"III!'I
I
solution pumped
2,125 litres or
.. 25 ..
HEAP LEACHING
over ene 9 days was
The total volume of
The results of the 3 metre heap are presented on. thefollo··nng page.
litre drums connected by 250mm pipe.
column filled with 2kg of fresh Pica
between the 1st and 2nd drum.
The dry sample weighed
were added. (Moisture
Two heap leach tests were tried in a specially constructed
heap leach test plant at Canbelego. The first test with a
1 metre high column was experimental, designed to test the
effectIve operation of the pilot plant. The second test
with a 3 metre high heap operated successfully and was
conrlnuedfor a total of 9 days.
6. 1
6.3
6 .
6.2 The test plant comprised a 3 metre high vertical water pipe
850mm in diameter, sealed· at the base. An outlet pipe near 'ithe base of the pipe was covered with a 100 mesh stainless
steel screen. A bed of sand300mm thick was placed at the
bottom of the pipe as a filter medium. 3 metres of sample
(2.2 tonnes), a composite of each of the 8 samples mixed with. i i
lime was placed in the pipe and flooded with cyanide i!,,
sol u tl on. The pregnant solution drained into three 200 If,,. : I
A horizontal steel .,:;
Carbon' was placed I:I
III
2.2 tonnes and 375 litres of SOlution!1
content 15%)'I!I
back through the heap il5.7 times the bed vOlumeH
.1
IIIII~
]
]
1]
]
]
1]
JII11I

___ LIIIII -
.. 26 ..
~ - '-- - -
Table 20 - 3 metre Heap Leach .Test - Epoch Minerals
Time 2!i Free Free Grade Grade Vol. Cyanide Lime---
days Cyanide % Lime % AA AA pumped Added Added---(Tl )** ('1'2 )** 1..1. tres (kgl Ikg)
~ 9.2 0.035 0 0.21 0.04 \25 3 6.2
9.0 0.065 0 0.39 0.04 125 0.2
1~ 9.3 0.065 0 0.32 0.05 125
2 9.5 0.065 0 0.22 0.05 125
2~ 9.5 0.065 0 0.1 9 0.05 125
3 9.6 0.07 0 0.1 4 0.04 125
3t 9.4 0.055 0 0.14 0.06 125
4 9.4 0.05 0 0.1 4 0.06 125 0.2
4~ 9.3 0.05 0 0.10 0.04 125 0.2
5 9.4 0.05 0 0.1 0 0.03 125 1 .0 0.6
5~ 9.4 0.05 0 0.096 0.03
6 9.3 0.05 0 0.072 0.03 125 1 .0 1 .0
6~ 9.5 0.06 0 0.10 0.04 125 1 .6
7 9.4 0.07 0 0.09 0.05 125 1 .6
H 9.6 0.09 0 0.07 0.04 125 0'WI,
8. 9.7 0.12. 0 0.08 0.04 125 CJ~il8t 9.8 0.15 0 0.04 0.02 125 ~!I9 9.7 0.16 0 0;07* 0.04* 125 Ii00 I,, HTOTAL 5.0kgs 11.6kgs il*N.B. From check assays from A.L.S. these grades were 0.05 and 0.03gms/tonne respectively ~--=--. I p::::np+nr~-~rhoII ffilUlii~2 afE~I earbon=-~OTUmn==---="-=-="·::,:,-=-==-cc·:c·.·===·.,-·--·--;--·--

6.4 After completion of the heap leach, two samples were taken
from the head and tail of the carbon column and assayed.
1 .1 3
0.90
1 .02
1 • 90
0.98
1 .24
0.75
Residue assay
ppm
925 gms/tonne
260 gms/tonne
592.5 gms/tonneAverage
Average:
top of column:
base of column:Carbon assay at
Carbon assay at
The results were -
•• 27 ••
Table 21 - 3 metre Heap Leach - Residue Assays
. ./28..
o - 0.5
0.5 - 1.0
1.0 - 1.5
1.5-2.0
2.0 - 2.5
2.5 - 3.0
!,
~-Total gold collected on 2kgs of carbon - 1. 185gms 11
This was recovered from 2.2 tonnes of solids - 0.54gms/tonnJ
Dlstance from top
of heap (metres)
Calculated head grade from'carbon and residue 1 .67gm~/tonne.
Estimated recovery by heap leaching 32.3%.
.,6.5 Samples of the residue were taken from various parts of ~
the heap and assayed by fire assay. The results as measured
from the top of the heap were as follows.
6.6 The heap leaching appears to have been more effectiv~in
the top and base of the leach than in the centre. The
reason for this is uncertain at this stage.
IIIII~
]
I]
II11]
I1J1I1
.. 28 •• -_- __-=-----='--'='-==---,0 ,033030
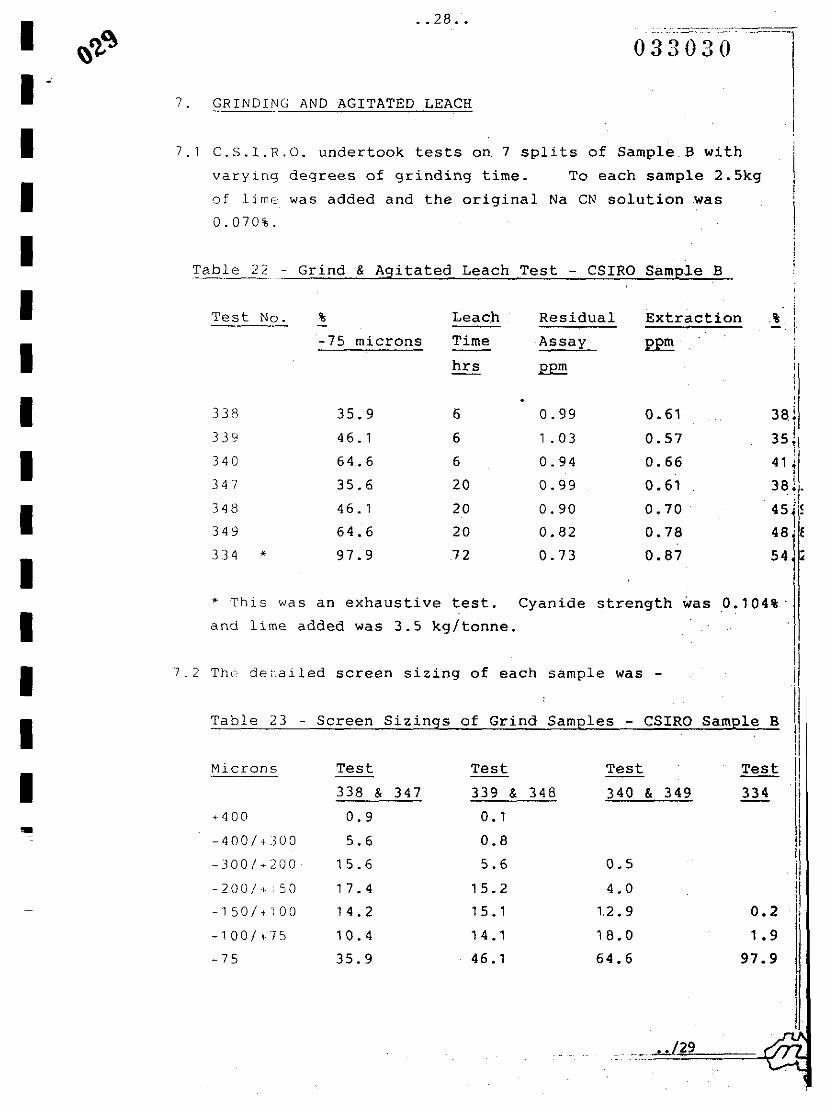
* This was an exhaustive test. Cyanide strength was 0.104%
and lime added was 3.5 kg/tonne.
I!!
II
i,,,,I
0.2
1.9
97.9
340 & 349
Test
0.5
4.0
12.9
1 8.0
64.6
Test No. % Leach Residual Extraction % iL- -I-75 microns Time Assay ~
hrs £E!!!
338 35.9 6 0.99 0.61 3si
339 46. 1 6 1 .03 0.57 351,340 64.6 6 0.94 0.66 41 il347 35.6 20 0.99 0.61 _38 :1.348 46. 1 20 0.90 0.70 45jl!349 64.6 20 0.82 0.78 48
1334 * 97.9 72 0.73 0.87 54 •
Microns Test Test
338 & 347 339 & 348
+400 0.9 0.1
-400/+300 5.6 0.8
-300/+200 1 5.6 5.6
-200/+:50 1 7.4 15.2
-150/+100 14.2 15.1
-100/+75 10.4 14.1
-75 35.9 46.1
iII
Table 23 - Screen Sizings of Grind Samples - CSIRO Sample B III',III11
IiII,I
III,,,
Table 22 - Grind & Agitated Leach Test - CSIRO Sample B
7.1 C.S.I.R.O. undertook tests on 7 splits of Sample B with
varying degrees of grinding time. To each sample 2.5kg
of lime was added and the original Na eN solution was
0.070%.
7. GRINDING AND AGITATED LEACH
7.2 The detailed screen sizing of each sample was -
I ~'l,,~
I -
IIIIIIIIIIIII
II
___ ..w.l29

7.4 Aberfoyle initially undertook grinding tests in bottle rolls!
on their sand samples ground to 100% minus 75 microns.
SpecIfIc results are unavailable but recoveries were
quotea as -
.. 29 •.
Table 24 - Aberfoyle Grinding Tests - % Recovery
I'l,,
iIII
(Again
used,
I,•• /30 ~
=~~
0.76 gms/tonne
35%
0.25%
10 - 10.5
1.7 gms/tonne
1.0 gm/tonne
200 gram samples were
Recovery
54%
64%
59%12 hours
24 hours
48 hours
Leactl Time
In this case recovery is about the same as that obtained
without grinding
fable 25 - Aberfoyle - 2nd Grinding Test
Pulp density
Na eN solution
03'3 0-!rr" II. . I
I
The C.,",.I.R.O. results indicate that the improvement in IIrecovery by grinding to 65% finer than 75 microns seems to IIbe about 0.17 gms/tonne in the 20 hour leach tests. Ultra Ifine grinding to 97 9% firier than 7S microns improve. the II'1,recovery by only another 0.09 gm/tonne.
100% mInus 75 microns).
Recovery % quoted were -
Based on residues 43%
Based on solutions 45%
pH
(a) Sands
Head grade
Residue
(after 72 hrs)
SolutIons
These J:p.sults indicate an imprOJement in the % recovery,
from 45% to around 60%.
7.3
7.5 Later another test was undertaken on the sands.
III~
J
1]
IIIIII1J
IJIJ
J

7.8 In Epoch's initial bulk tests, a drum of samples from each
of 8 different sites was ground to 100% minus 100 mesh
(150 mlcrons) in a small pilot plant roller mill, at a
pulp density of around 60%. From the mill the undersize
was pumped to an air agitated leach tank. Additional water
If
:1
ilIIIIIII
i!I
I
III
11
IIII
II
I•• /31 /f:):.==~
033032
1.37·gms/tonne
91.7%
0.8 gms/tonne
0.75 gms/tonne
0.33 gms/tonne
100%
10.8
0.083%
1 .5
on residues) 38%
on solutions) 42%
Table 26 - D. Wright's Grinding Test Results
% recovery (based
(based
.. 30 ..
The pregnant solutions were exposed to activated carbon.
Based on carbon assays, the recoveries were 42% and 46%
respectively. Again there is little improvement in
recovery as a result of grinding.
David Wright ground a 500 gram sample from his Drum. No. 1
and added the same reagents as quoted earlier. His
results were -
final pH
final Na eN
(bJ Sllmes
Head grade
Residue (72 hrs)
Solution (72 hrs)
In light of other results these appear artifically too
high a percentage recovery indicating that his head grade
assays may not have been an accurate representation.
Solution Assay
(Equiv to g/t)
Gold recovered per
solutlon
Actual gold recovered
onto carbon
Recovery %
7. 6
7.7
JII111I11I1
IIJ]
IIIII
.. 31. .
i,,!I
, ii
28
andsmall 50 gram samples were ground
The results are set out in Table1/
IIIIH
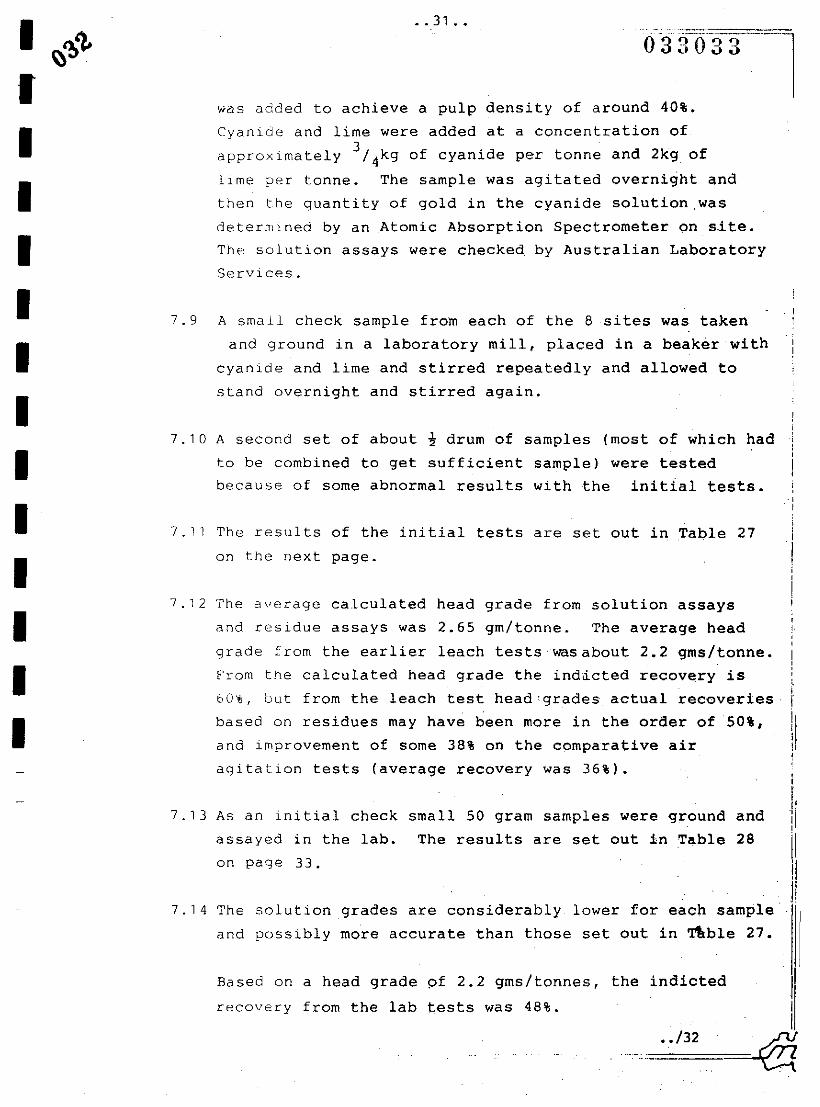
grades are considerably lower for each sample I
more accurate than those set out in ~ble 27.
on page 33.
was added to achieve a pulp density of around 40%.
Cyanide and lime were added at a concentration of
approximately 3/ 4k9 of cyanide per tonne and 2kg of
11me per tonne. The sample was agitated overnight and
then theguantity of gold in the cyanide solution ,was
det.ernll,ned by an Atomic Absorption Spectrometer on site.
The solution assays were checked by Australian Laboratory
Services.
A small check sample from each of the 8 sites was taken
and ground in a laboratory mill, placed in a beaker with
cyanide and lime and stirred repeatedly and allowed to
stand overnight and stirred again.
assayed in the lab.
7.9
033033
7.14 The solut.ion
and possibly
7.10 A second set of about t drum of samples (most of which had
t.o be combined to get sufficient sample) were tested
because of some abnormal results with the init!altests.
7.13 As an initial check
7.11 The results of the initial tests are set out in Table 27
on the next. page.
7.12 The average calculated head grade from solution assays
and residue assays was 2.65 gm/tonne. The average head
grade from the earlier leach tests wasabout 2.2 gms/tonne.
From the calculated head grade the ind~cted recovery is .
60'. but from the leach test head 'grades actual recoveries Ibased on residues may have been more in the order of 50%, \,',
and improvement of some 38% on the comparative airi
agitation tests (average recovery was 36%).
I ~~'}.
IIIIIIIIIIIII
the indictedBased on a head grade of 2.2 gms/tonnes,
recovery from the lab tests was 48%.JII
•. /32 /f;:!,,.._'--=~

______ a.J~
~ - - - - - - - - - -., -.. 32 ..
':'able 27 - Ground 250k5i.? Bulk Samples - Cyanide Leach Test (Epocht
Test No. Pulp pH Free Free Assay Check Residue % Rc:covery Calculated
Density Cyanide Lime Grades Assa-l Assav Head Grade
% ppm ALS
1 38~% 9.2 0.035% NIL 2.0 2.0 1.02 67% 3.0
2 34% 10 . 4 0.1% 0.0025% 1 .55 1. 63 5.70* 22.% 7.3*
3 44% 9.2 0.03% NIL 1. 52 1. 56 1 .0 61% 2.56
4 43% 10 . 1 0.06% 0.002% 1.66 1. 28 1 .04 55% 2.32
5 55% 10.1 0.085% 0.0012% 1 .39 4.73* 1.53 47.6% 2.92
6 42% 10.5 0.06% 0.0012% 1. 46 O. 11 ** 1.09 57% 2.55
7 43% 9.8 0.35% 0.0017% 4.0* 3.39* ? ? ?
8 32% 9.6 0.04% 4.46* 4.90* 0.72 87% 5.6*
9 39% 9.5 0.04% 2.22 2.29* 0.83 72% 3.1*
Avg. (excluding*) 1 .68 1.62 1 .03 61% 2.65
* These grades appear to be too high
** These grades appear to low to be accurate 0,'"Wi,"
~IIc.~ ".... 1
II'
.. /3=3====:!J'

.. /34
The results of the repeat combined tests were -
* corrected for pulp density
----~- - -- -------------,033035 I
III\1!i"!I
[III"""ilt!"
"
•• 33 ••
1.07 g/t
Solution Grade*
(ppm)
0.9
0.75
1 .1 3
0.83
1. 20
1 .28
1 .89
0.60
Lab Grinding & Cyanide Tests - Epoch
II\1'I
1
'1!ILI
IrI
6
2
",
.J
4
8
Table 28
Sample No.
Avg.
Table 29 - Repeat Grinding & Cyanide Tests - Epoch
Sample Solution Assays* Residue Head RecoveryNo. ~ Assay Grade %
Site ALS
0.9 1 .06 1. 00 2.06 51%
2 & 7 0.75 1 .20 0.76 1 .99 60%-'
4 & 8 0.63 0.93 0.91 1 .84 5,0%
5 & 6 0.64 0.93 ,0.63 1 .56 59.6%
7 2.76 3.81 0.87 4.68 81.4%
Average 0.96 1. 37 0.81 2.19 58,.9
* corrected for pulp density
I ~'"\)
] ~
JIIIIJII 7. 1 S
I1111IJ
J
J
I

8.3 Two tests were conducted and the results were -
[
I
•• /35 ~
=~~
Test 333
254 mm
30 sees.
3
74.3%
1.20 ppm
25.7%
1.60 ppm
Test 332
254 mm
45 sees.
3
77.7%
1.29 ppm
22.3% '
1.66 ppm
Table 30 - CSIRO Classification & Cyartide Tests
.. 34 .••
CYANIDATION AFTER CLASSIFICATION
Noting that 63% of the gold in Sample B is extracted from
the finest fraction and that a much smaller percentage is
extracted from the coarse fraction, the C.S.I.R.O. tried
to classify out the coarse sand and then to agitate the
slime portion only.
Depth decanted
Time of each decantation
No. of decantations
Wt of sand residue
Assay of sand residue
Wt of slimes
Assay of slimes
8.
8. 1
8.2 In the test a sample was pulped with cyanide solution in
a cylindrical vessel, stirred and alloweci to settle. The i
pulp above a certain level was decanted off, the process iI
repeated several times till the samples was free of .slimes. tI
The decanted pulp was thickened and agitated for 6 hours. !ILIiII
IJJJ
I]
JJ1I11]
~
IIIIII

8.4 Screen sizings were -
After cyanide agitation the composite tailing assay was
1.36 ppm for the sands and 1.30 ppm for the slimes. The
gold extracted was 0.24 ppm (sands) and 0.30 ppm (slimes),
being ollly 15.0 and 18.7% respectively of the head grade.
,.11I
III!IiI
. i
I. I
I
I
0.2%
0.9%
6.5%
92.4%
0.2%
0.2%
2.3%
97.3%
Slimes
Test No. Test No.
332 333333
3.7%
17.2%
19.3%
19.2%
15.7%
12.5%
7.3%
5.1%
332
4.4%
17.7%
19,5%
18.2%
1 4.6%
11.5%
5.2%
5.9%
Sand Residue
Test No. Test No.
• .l3f
·0 3:rO 37.. 35 ..
Microns
+600
+400/-600
+300/-400
+200/-300 *+150/-200
+100/-150
+75/-100
-75
Table 31 - CSIRO Classification Sand & Slimes Sizings
• for slime test + 200
8.5
IIIIIIIIIIIIIIIIIIII

.. 36 ..
"
"
I~
,II
II
III
IIilIIII
87.4%
Test 403
•• /37 ~
=~I(!.t
1 .0
87.4%
0.25
Test 401
1 .0
55.8%
Test 402
0.25
1.0
0.05 0.05 0.05 0.05
0.05 0.05 0.05 0.05
0.03 0.03 0.043 0.03
8 mm 8mm 8mm 8mm
8.3 8.3 . 8.3 8.5.
1 • 1 2.7 3.5 3:9
4.5 29.4 24.9 22~ 5.
(22.7%) 45.8. 53.9 53.0
98..9 97.3 96.5 96.1
(1.24) 0,97 0.78 b.B7
(77.3) 54.2 46.1 47~Q
28.1%
Test 404
Eucalypt',us
pH
Wt of conc.%
FLOTATION TEST
%-75 microns
% recovered
Table 32 - csiro Flotation Test Results
~ Added in ballmill
~~ Added in flotation stage
Assay of tails
% recov(~red
Na S
C.S.I.R.O. carried out four flotation tests on Sample B,
each with varying degrees of grinding.
Reagent 301
Assay of conc.
Soda Ash kg/tn * 1.0
CN S04 kg/tn * 0.25
Reagent 208
Tailings % wt
Flotation time
9. 1
9.
IIIIIIIIIIIIIIIIIIII

. ./38 ~
==..I;~
Table 33 ~ Tails, Sizings, Flotation Tests
I
11
i!,
II1/
Ii!
. rIIIIilI!!
I!
III
IIIiI
The overall
gms/tonne
Test Tests
402 401 and 403
3.2 O. 1
1 2.3 0.7
13.6 3.2
15.1 8.8
55.8 87.4
the sample had not been re-ground.
flotation and cyanidation was 0.55recovery of
(34.6%).
+ 200
200/150
100/150
75/100
-75
Microns
9.2 The screen sizings of the flotation tails were -
.. 37 ..
9.7 The recovery by flotation and cyanidation is only
marginally greater than by cyanidation alone. (Less than
0.1 gm/tonne).
9.4 Two flotation tailings were cyanided and the results are
set out on Table 34' on the next page.
9.3 The recovery by flotation is poor where the sample has not
been re-ground as in Test 404, but improves considerably
with fine grinding. There seems little difference in
recovery after grinding between cyandization and,flotation.
9.6 In test 404
9.5 In test 403, the sample had been ground to 87.4% minus
75 microns. The overall recovery by flotatipn and
cyanidation was 1.0 gm/tonne (62.7%).
IIIII~
]
J]
J
JJIIIIJIII

- - - - .. - - - - - - - - - - -.. 38 ..
Table 34 - Cyanidation of Flotation Tails
Test No. Time Lime Orig. Consumption Residue Extraction %
hrs added Sol. % kg/tonne Assay E£'f\. . Recovered
Na eN lime NaCN EJ2I!
403 6 2.5 0.077 1.6 0.1 5 0.6 0.27 31 . 1
404 6 2.5 0.077 1 .5 0.15 1 .05 o. 1 9 15.7
------_.~_...... __ ."._-_.. , .~._-- .. -~ .. _.-"-'--.-'---." - .....~---_.-

Sample Head Extracted Residue RecoveryGrade ill ill
1 • CSIRO A 1 .98 1 .36 0.61 69%
2 . CSIRO B 1 .60 0.61 0.99 38%
3 . CSIRO C 1 .38 0.36 1 .02 26%.
4. ABERFOYLE SAND 1. 90 0.78* 1, 12 41.0%
5 . ABERFOYLE SLIMES 1 .0 0.43 0.·57 43.0%
6. D. WRIGHT 2.08 1. 37 0.71 61.5%
7. RRA 1 .34 0.48 0.86 35.8%
8 . EPOCH 2.07 1 .03 1.04 49.7%
Extraction
* corrected for head grade and residue assay
•• 39 •.
III
I,
:1I,II";j
!j11i!:I
'IIiIiI'
IIItII[!
IIII11I,It
'1'1
I!
III
11
fI
. 1
1
SUMMARY OF RESULTS
. _ ..41ll.......-;::;-_._...... .
()3.~I041
...:.::.=.4=0::;:..=·='==..J;rti1
The results of the various cyanide leach tests that havebeen conducted, where no prior grinding has taken place'
and where lime and cyanide additions have been kept at a
reasonable level and where leach agitation has not
exceeded 24 hours, can be summarized as follows. (based
on flre assays of head grade and residue)
tonne.
Although not all tests are necess~rily as representative
as others, if we take the average of all the above~tests,
the average for the'head grades is .1,66·gms/tonhe, ~
figure close to the average for both drilling programmes
of 1.7 gms/tonne. The average for the extraction is
0.80 gms/tonne and the average for the residue 0.86 9ms/
The average recovery is then around 48%.
1 O. 1
1 O.
10. 2
1JJJJIJJJI]
J
II11J]
]
]

•• 40 ••
o:f:f042
10.5 A summary of the results of agitated cyanide leach after
grinding are -
48.8%
41 .1%
58.9%
,I":1
ilIiIiII
!!iJ.1qI,
!li:I!.ilII:r:1,I
:1i·'I'!!q
Recovery Ii0.82
1 .0
0.81
Residueg/t
0.78
0.7
1 .37
Extractedg/t
1. 98
1 .7
2.2
HeadGrade
tonne?
III
Based on· an average overall grade of the richer part of !II'
the dump, of 1.7 gms/tonne, it should be possible to extrac4
50% of the gold by grinding or 0.~5 gms/tonne. Again IIthe results indicate that in richer parts of the dump ~l·
the percentage recovery is likely to be higher and in the !I
poorer parts of the dump it is likely to be lower. 'II
. j-
ii!
2. ABERFOYLE SANDS
3. EPOCH
1. CSIRO B
I.. ='.=/=41==~·m
I
IlII
10.3 However, a figure I feel we could more comfortably use
for extraction of gold by cyanide leaching would be 45%
or 0.15 gms/tonne. In richer parts of the dumps. the
recovery is likely to be higher (up to 80%) and in poorer
parts of the dump it will be lower (down to 25%).
10.4 The only heap leach tests carried out so far are the
recent tests by Epoch which indicated a recovery of around
0.55 9ms/tonne or 32%. It would be unlikely .that
the heap leach recovery could exceed that of the agitated
leach, but with experimentation and refinement it may be
possible to get the recovery up to 0.6 or even 0.7 gms/
10.6
II]
IJ
II
-I
1J]
]
I~
IIIIII

:1
Ii
I'
':,I
::
poter:tialllprof~t j,
per tonneil
:1$1.25 !I
11INIL ii
!l!iH
I
NIL !1<I'':"!iI':1'ii!.;jii;tI'
, Ii
". ifI''iII
IIII
.=./=42=:,==~€i
0.55 gmS/tonne
0.75 gms/tonne
0.85 gms/tonne
$10.87
$12.30
$2.00
$4.75
.• 41. .
costs for a 50,000 tonne per annum plant
$10.00
$12.50
Capital Operating Amortization Gold(per tonne) per tonne 'Income
over 4yrs at $450per ounce
$150000 $6.00 $0.75 $8.00
CONCLUSION
By heap leaching
By agitated cyanide leaching
By grinding and agitated cyanide leaching
A further 30 holes have been drilled at Mathinna ,to
provide samples for further test work to see if the
recovery by heap leaching can be improved.
1 1 •
11.1 Metallurgical test work to date indicates that the
average gold extraction rate we might expect on the
Mathinna dumps -
11.2 As heap leaching is by far the lowest capital cost method
of retreatment, the object of further test work en the
dumps must be to try and get the rate of recovery by heap
leaching up to close to that achieved by agitated cyanide
leachIng.
1 1 . 5
11.4 If we can extract 0.7 gms/tonne by heap leach~ng then
the potental profit would increase to $3.40 per tonne
1$170,000 per annum) which is around the optimu. 100%
return per annum on capital invested.
are
HeapLeaching
AgitatedCyanideLeaching $400000
GrInding &I-,g i ta tedLeaching $750000
i~
]
JJ
JJJ
I1IIIIIJ
J
1J
J

•
.• 42 ••
11.6 At the same time we need to
and operating costs of heap
be reduced in this instance
look closely at the capital
leaching to see if they can
to improve cashflow.
.,.. ;1
• I.,,"
!j
il•, I: I
i!'I
r II"i:,.
I!i"
II3 II
!, i
.- I,
III'III... 'II,Iirj[!
!iI:d
..... iI, 'I
III', 1I,I,,I,
II"'" I
jI
. f,
11
~