Effect of the paste-anode interface under impressed ...
14
Effect of the paste–anode interface under impressed current cathodic protection in concrete structures Downloaded from: https://research.chalmers.se, 2021-10-21 08:16 UTC Citation for the original published paper (version of record): Zhang, E., Tang, L., Bernin, D. et al (2018) Effect of the paste–anode interface under impressed current cathodic protection in concrete structures Materials and Corrosion - Werkstoffe und Korrosion, 69(8): 1104-1116 http://dx.doi.org/10.1002/maco.201709908 N.B. When citing this work, cite the original published paper. research.chalmers.se offers the possibility of retrieving research publications produced at Chalmers University of Technology. It covers all kind of research output: articles, dissertations, conference papers, reports etc. since 2004. research.chalmers.se is administrated and maintained by Chalmers Library (article starts on next page)
Transcript of Effect of the paste-anode interface under impressed ...

Effect of the paste–anode interface under impressed currentcathodic protection in concrete structures
Downloaded from: https://research.chalmers.se, 2021-10-21 08:16 UTC
Citation for the original published paper (version of record):Zhang, E., Tang, L., Bernin, D. et al (2018)Effect of the paste–anode interface under impressed current cathodic protection in concretestructuresMaterials and Corrosion - Werkstoffe und Korrosion, 69(8): 1104-1116http://dx.doi.org/10.1002/maco.201709908
N.B. When citing this work, cite the original published paper.
research.chalmers.se offers the possibility of retrieving research publications produced at Chalmers University of Technology.It covers all kind of research output: articles, dissertations, conference papers, reports etc. since 2004.research.chalmers.se is administrated and maintained by Chalmers Library
(article starts on next page)

Received: 20 October 2017 | Accepted: 19 December 2017
DOI: 10.1002/maco.201709908
ARTICLE
Effect of the paste–anode interface under impressedcurrent cathodic protection in concrete structures
Emma Q. Zhang1 | Luping Tang1 | Diana Bernin2 | Helén Jansson1
1Department of Architecture and CivilEngineering, Chalmers University ofTechnology, Sven Hultins gata 6,Gothenborg 412 96, Sweden
2 Swedish NMR Center, PO Box 465Gothenburg 40530, Sweden
CorrespondenceDepartment of Architecture and CivilEngineering, Chalmers University ofTechnology, Sven Hultins gata 6,Gothenborg 412 96, Sweden.Email: [email protected]
Funding informationThe Swedish Research Council FORMAS,Grant number: 249-2011-1520; EUResearch and Innovation funding programFP7, Project DOSECOPS
Impressed current cathodic protection (ICCP) is a powerful method to prevent and
stop corrosion of steel in concrete structures. To evaluate the long-term effect of
ICCP, accelerated tests have been adopted using high current densities.A carbon fiber
reinforced polymermeshwas introduced as anode. The presented research focused on
the changes at the paste–anode interface as a consequence of applying current. The
treated samples were characterized by various techniques. Calcium dissolution was
found with an average thickness of 0.34 mm around the anode after charges of
6 × 10⁶ C/m2 were applied, equivalent to applying 4 mA/m2 of anode surface for
30 years. Calcium dissolution resulted in a white zone around the anode, where the
calcium silica ratio was lowered and almost no crystal phase was observed. NMR
results show clear Q3 and Q4 peaks in the white zone, which contained extended
branched and networked structures of hardened cement paste.An increased resistance
caused by the formation of the white zone may eventually make the system fail
because of insufficient current densities. CFRP has been proven suitable for ICCP
application even at a current density of 4 A/m2 of anode surface.
KEYWORDS
accelerated test, calcium dissolution, cathodic protection, CFRP anode, microstructure, paste–anodeinterface
1 | INTRODUCTION
Chloride-induced corrosion of steel reinforcement is a majorcause of premature failure for concrete structures. Among themany preventive and protective techniques, impressedcurrent cathodic protection (ICCP) has been proven to bean effective method to prevent and stop corrosion, even in ahighly corrosive environment.[1,2,3] In an ICCP system, theprotection of the steel is achieved by supplying direct currentto the steel bars embedded in the concrete, which induces acathodic polarization of the steel bars, in other words, it forcesthe potential to shift to a more negative level, where corrosioncan neither initiate nor propagate.[4]
It has been intensively studied and well-accepted thatICCP transforms the microstructure of the concrete around
the steel over a period of time due to the migration of ionicspecies and electrochemical reactions.[5,6] However, theeffects associated with the anode have not been fullyinvestigated.
It is well-known that if the material of the anode is inertand does not involve electrochemical reactions, the oxidationof hydroxide (OH−), and water occur, as given in Reactions(1) and (2).[7] When chlorides are present at the anode site,chlorine gas develops, as shown in Reaction (3).
These reactions contribute to a reduction in pH at the anodearea and involve the dissolution of solids in the hardenedcement paste (HCP). Studies have revealed the mechanism ofthe dissolution: the calcium hydroxide (Ca(OH)2) crystalsdissolve first, followed by the calcium oxide (CaO) layer in theC-S-H gel, which has been observed in naturally leached and
Materials and Corrosion. 2018;1–13. www.matcorr.com © 2018 WILEY-VCH Verlag GmbH & Co. KGaA, Weinheim | 1

carbonated concrete.[8,9] Regarding the dissolution caused byICCP,microscopic studies have observed an open spacewith athickness of 0.02–0.05 mm between the anode and the HCP,which indicates the dissolution of calcium hydroxidecrystals.[10] Similar observation has been found in specimensusing carbon-based conductive coating anodes. It has also beendiscovered that the observed amount of dissolution is muchlower than the theoretically calculated values, which possiblyinvolves other mechanisms.[11] On a macro-scale level, thedissolution of calciumhydroxidemay lead to a loss of adhesionbetween the anode and the concrete, which can cause the ICCPsystem to fail earlier than the designed service life.[12]
Nonetheless, there have been few studies focused on theanode area. The changes of microstructure in the HCP near theanode, however, are inevitable and are fundamentallyimportant to the performance of ICCP systems. Thereforethere is a strong need to investigate the effects and changes atthe paste–anode interface.
4OH� → 2H2Oþ O2 þ 4e� ð1Þ
2H2O→O2 þ 4Hþ4e� ð2Þ
2Cl� →Cl2 þ 2e� ð3Þ
In this study a new type of carbon-based anode has alsobeen introduced, which is the carbon fiber reinforcedpolymer (CFRP) anode. CFRP has excellent conductivity asan anode material and a reinforcing effect on the mechanicalproperties.[13] Attempts have been made to combine thesetwo functions together, which have demonstrated thesuccessful application of CFRP as anode material forICCP.[14–16] The CFRP anode can operate at 128 mA/m2
with a relatively low consumption rate,[17] and the ultimatestrength of concrete increases approximately 13.5% usingsurface-mounted CFRP fabric.[18] The degradation mecha-nism of a CFRP anode has been investigated in simulatedsolutions and a concrete environment.[19–21]. Based on theirresults, the authors in[22,23] suggest that the polymer matrixis sensitive to electrochemical degradation and the carbonfiber remains with very little loss of mass even at very highcurrent densities (up to 3 A/m2 of anode surface). However,studies of the microstructure at the paste–anode interfaceare scare.
In order to investigate the long-term effect of an ICCPsystem over the entire desired service life, for example, from50 to 100 years, accelerated methods are required to shortenthe evaluation time. For the purpose of examining the changes
ofmicrostructure in the HCP, high levels of impressed currentdensities have been adopted.[24] This accelerated method isused to determine the relation between the microstructurechanges and the amount of applied charge, and it could beapplied in engineering practice.
Hence the present study focuses on the microstructure ofthe HCP at the anode–paste interface, with the utilization ofCFRP as anode. The research presented here has used variouscharacterization techniques with the purpose of clarifying themicrostructural changes of the HCP caused by acceleratedICCP at the anode–paste interface.
2 | MATERIALS AND METHODS
2.1 | Anode material
The CFRP anode used in this research was manufactured bySGL Group and is commercially available as SIGRATEXGrid. The dimension of the cross-section of a CFRP bundlewas 3.0 mm in width and 0.6 mm in thickness. Thecircumference of a fiber bundle was 15 mm. Each samplecontained two bundles of fibers with an effective length of110 mm, which was buried in cement paste. The totaleffective anode surface area in each sample was 16 mm2. Themeasured resistivity per unit length was about 0.05Ω. Thetype of polymer coating was unknown. The mass percentageof polymer was 15%, as measured by thermogravimetricanalysis (TGA).
2.2 | Set-up of the ICCP system
A lab-scale ICCP system was developed for the purpose ofthis study. Ordinary Portland cement was used withoutadditives or cement replacement materials. The composi-tion of the Portland cement used in this study is given inTable 1. Cement paste specimens were mixed, with a watercement ratio (ω=c) of 0.4, and cast in customized plasticmolds. Each specimen contained a single Φ 10 mm plainsteel bar as cathode and two bundles of CFRP as anode.The dimension of a specimen is illustrated in Figure 1. Allsurfaces were coated by epoxy resin to prevent unwantedpenetration of chloride, except the curved surface in frontof the CFRP anode for one-dimensional chloride penetra-tion. The position of the uncoated surface is shown inFigure 1 as well.
Figure 2 shows an illustration of the experimental set-up. Specimens were partially immersed in a 3% NaClsolution during the test. Constant current was applied to the
TABLE 1 Cement composition
Chemical composition CaO SiO2 Al2O3 Fe2O3 MgO Na2O K2O SO3 Cl
wt% 64.5 22.5 3.1 4.0 1.3 0.12 0.58 2.6 0.01
2 | ZHANG ET AL.

specimens by a galvanostatic power supply. The bottom ofthe steel bars and CFRP anode were wrapped withinsulation tape. The current and potential between thecathode (steel) and the anode (CFRP) were monitored overthe period of the experiment.
2.3 | Accelerated tests
The principle of an accelerated test is based on the assumptionof that the effect of the ICCP is proportional to the total chargeapplied to the system, referred to as the “total charge density q[C/m2]” in this paper. The total charge density q can bedefined by
q¼ ia � ta ¼ in � tn ð4Þ
where q is the total amount of electrical charge applied to thesystem per unit area [C/m2], where C is the abbreviation forCoulomb; ia, the current density of the cathode surface oranode surface used in the accelerated tests [mA/m2]; ta, theduration of accelerated tests in seconds [s]; in, the currentdensity of cathode surface or anode surface in normal CPapplications [mA/m2]; tn, estimated service life of normal CPapplications in seconds [s].
As an example, if an accelerated test has been carried outusing a current density of 1 A/m2 for 10 days, the result of this
accelerated test could be used to evaluate CP operation at acurrent density of 10 mA/m2 for 1,000 days.
The advantage of accelerated tests is obviously theshortened experimental time when dealing with a long-termexperiment such as 50 years. However, there are also someside effects. Excessive applied current could cause unneces-sary corrosion or damage to the cable connections. Samplesare more sensitive to defects such as air voids or cracksbecause they can dramatically alter the distribution of current.Moreover, due to limitations of sample size and quantity, theuncertainty of the results therefore also increases. Because ofthe possible effects brought about by acceleration, thepredicted service life (tn) is generally underestimated, whichin fact is more conservative for engineering use of themethod.
Table 2 gives the details of the experiments. It should benoted that the current densities used in this experiment were20 and 40 times higher than the recommended maximumcurrent density for cathodic protection (108 mA/m2 recom-mended byNACEStandard Practice).[25] This could cause theearly deterioration of some of the samples due to spalling andelectrical connections.
The intended total charge density was 5:7� 106 and10� 106 C/m2 for Acc3 and Acc6 group, respectively.However, due to the fluctuation of the applied current, theactual applied total charge density was lower than expected. Forthe Acc3 group, the actual q almost reached the desired level,while for the Acc6 group, it was only about 55% of the desiredamount of charge applied to the samples. The estimated servicelife, if in were 4mA/m2, would be between 40 and 50 years forall samples.
FIGURE 1 A 3-view drawing of the specimen. Chloridepenetration direction is indicated by arrows. a = 7∼10 and b = 10∼15.All values are in mm
FIGURE 2 Experimental arrangement of the ICCP system. Steelas cathode is connected to negative terminal (−) and CFRP as anodeis connected to positive terminal (+). RE represents the referenceelectrode. The direction of chloride penetration is indicated by arrows
ZHANG ET AL. | 3

2.4 | Image analysis
Samples were sliced in the direction perpendicular to theanode. An image analysis of the paste–anode interface wasdone by an image processing program. As shown in Figure 3,the area of dissolution can be distinguished by colors anddefined by free-shape selection. After the area was selected,the value was calculated automatically with a pre-definedspatial scale.
Because the shapes of the dissolution areas were irregularand different at each location, the dissolution thickness Δdwas characterized by
Δd ¼ AC
ð5Þ
where A is the area of dissolution andC is the perimeter of theanode cross-section.
2.5 | Microstructure and chemical analysis
After the accelerated tests, the treated specimens wereprepared for topographical and chemical analysis. Topog-raphy imaging and elemental analysis were carried out by ascanning electron microscope with energy dispersiveX-ray spectroscopy (SEM-EDS). The determination ofthe distribution of chemicals over the cross-section of
specimens was carried out by laser ablation-inductivelycoupled plasma-mass spectroscopy (LA-ICP-MS) usingline-scanning mode.
The analyses of the crystal phases and molecularinteractions were conducted by X-ray diffraction (XRD) andnuclear magnetic resonance (NMR), respectively. Powdersamples were extracted from the white zone by carefullyscraping them from the bulk specimen. The collected powderwas ground and stored in a CO2-free environment.
2.5.1 | SEM-EDS
The topography of the polished samples was analyzed with byscanning electron microscopy (SEM). An FEI Quanta ESEM200 equipped with a field emission gun and an Oxford IncaEDS system was used to perform the analysis. The sampleswere vacuum dried and fine polished prior to analysis. Theelemental compositions were examined by the integratedenergy dispersive spectrometer (EDS) in a high vacuummode. The detection limits were about 0.1% with EDS(1,000 ppm). The accelerating voltage was 15–20 kV.
2.5.2 | LA-ICP-MS
Laser ablation-inductively coupled plasma-mass spectros-copy quantified the longitudinal changes in the distribution of
TABLE 2 Experimental program of accelerated tests
Sample ID I (mA) i (A/m2) ta (day) Q (C) q (C/m2) tnd(year)
Acc3-a 3 2.1 35a 8133 5.1 × 10⁶ 40
Acc3-b 3 2.1 37c 8144 5.1 × 10⁶ 40
Acc6-a 6 4.0 35b 9886 6.2 × 10⁶ 49
Acc6-b 6 4.0 37c 8584 5.2 × 10⁶ 42
aExperiment terminated due to surface cracks and spalling.bExperiment terminated due to damage to anode–cable connection.cExperiment terminated as planned.dWhen in equals 4 mA/m2.
FIGURE 3 Image analysis of the dissolution area
4 | ZHANG ET AL.

elements. The laser ablation analysis was performed using aNew Wave NWR213 laser ablation system coupled to anAgilent 7500a quadrupole ICP-MS.
A large format cell held samples up to a size of10 cm × 10 cm, combined with a 1 cm diameter ablationchamber at the ablation region, enabling fast washoutanywhere in the sample chamber. A 30 μm laser spot size,beam energy density of about 6 J/cm2, and a repetition rate of10 Hz was used in line-scanning mode (scan speed 60 μm/s).The samples were dried and fine polished prior tomeasurements.
Calibration was performed by frequently measuring theglass standard SRM NIST 610 using the values of Jochumet al.[26] Each measurement consisted of 30 s backgroundfollowed by400 s of signal collection.Dwell timeswere 20ms.
2.5.3 | NMR29Si solid state NMR under magic angle spinning (MAS) wasused to gain information about the present silicate species.Single pulse experiments with an excitation pulse of 25° and arepetition time of 30 s were recorded at an MAS rate of15 kHz using a 3.2 mm double resonance MAS probe at 14.7T (Agilent Inova).
It is well-established that a 29Si spectrum of the silicateanion is represented in the range of −70 to −76 ppm for Q0
(monomer), −78 for Q1 (dimer or end group in a chain), −81to −85 for Q2 (chain), −93 to −102 for Q3 (branchedstructure), and −107 to −115 for Q4 (networked struc-ture).[9,27,28] The average degree of C-S-H connectivity �n iscalculated as follows,[29]
�n ¼ Q1 þ 2Q2 þ 3Q3
Q1 þ Q2 þ Q3 : ð6Þ
A higher value of �n represents a higher degree ofpolymerization of the C-S-H. The mean chain length (MCL)or number of SiO4 tetrahedra in the C-S-H can be calculatedfrom Richardson's equation,[30]
MCL ¼ 2� Q1 þ Q2
Q1 ; ð7Þ
where the relative proportions of silicon associated with theQn units were determined by deconvolution of the spectra andmeasurement of the area associated with each peak using acurve-fitting technique.
2.5.4 | XRD
Characterization of crystalline phases in the cement pastewas carried out by XRD analysis. The measurements were
performed by using 0.015° per step and a time step of 12 s,resulting total measurement time of each sample was about24 h.
3 | RESULTS AND DISCUSSION
3.1 | Potential monitoring
Figure 4 illustrates the changes in the potential (φcell), current(I), and total resistance (Rt) over time. The total resistance Rt
was calculated as the potential divided by the current as givenin Equation (8), where φwater was the potential of waterelectrolysis and the value was 1.229 at pH of 14. Rt was a sumof three components: the surface resistance at the anode (ηsan),that at the cathode (ηscat) (both of which were induced bypolarization), and the mixed resistance ηp of the paste (whichwas relatively stable).
Rt ¼ φcell � φwater
I¼ ηsan þ ηscat þ ηp ð8Þ
The development of I and φcell of four samples followedthe same pattern. Here, only the specimen Acc6-a will bediscussed, as an example.
Figure 4c shows that φcell increased almost immediatelyafter polarization and reached its maximum potential afterten days. The current i stayed at 6.4 mA as planned for about10 days and then began to change. The current continued todrop. However, unexpectedly, it increased again betweenday 15 and day 25. After that, the current decreasedgradually and remained at a low point of 0.6 mA for 3 daysbefore the experiment was terminated due to cable damage.A possible explanation of this phenomenon between day 15and day 25 is that the conductivity of the pore solutions wasincreased because of the accumulation of chloride ions andat the same time the solubility of the calcium also increasedbecause of there being chloride ions instead of hydroxideions. However, chloride ions can form chlorine gas andescape from the system, which leads to the decrease ofconductivity again.
Over 35 days of the accelerated test, the total chargedensity passed through was 6� 106 C/m2 of the anodesurface, which was equal to 40:5 mol/m2 of electronsproduced at the anode. Rt of Acc6-a was enlarged about130 times, from originally 220Ω to 2:8� 105 Ω by the end ofthe experiment, which indicated chemical changes of the HCPand of the pore solutions. This increase of resistivity wouldlower the efficiency of the ICCP and might eventually causethe ICCP to fail because the protective current density wouldbecome insufficient. However, in this experiment, thespecimen Acc6-a, for example, having been maintained at0.6 mA until terminated, still experienced a current density of37.5 mA/m2, which was sufficient for protection.
ZHANG ET AL. | 5

Using the accelerated test to evaluate the long-termICCP effect, the overall consequence of a total chargedensity of 6� 106 C/m2 (of the anode surface) would give asimilar result to that of constantly applying 4 mA/m2 (to theanode surface) for 30 years, calculated as in Equation (4).A linear relation between the accelerated tests and normaloperations was adopted in the analysis. It is worthmentioning that the specimen was still under sufficientprotection when it was terminated, therefore the actualservice life should be longer.
3.2 | Phase changes in the HCP around anode
Since all four samples showed similar patterns, in this paperonly the results from sample Acc6-a will be presented, as anexample.
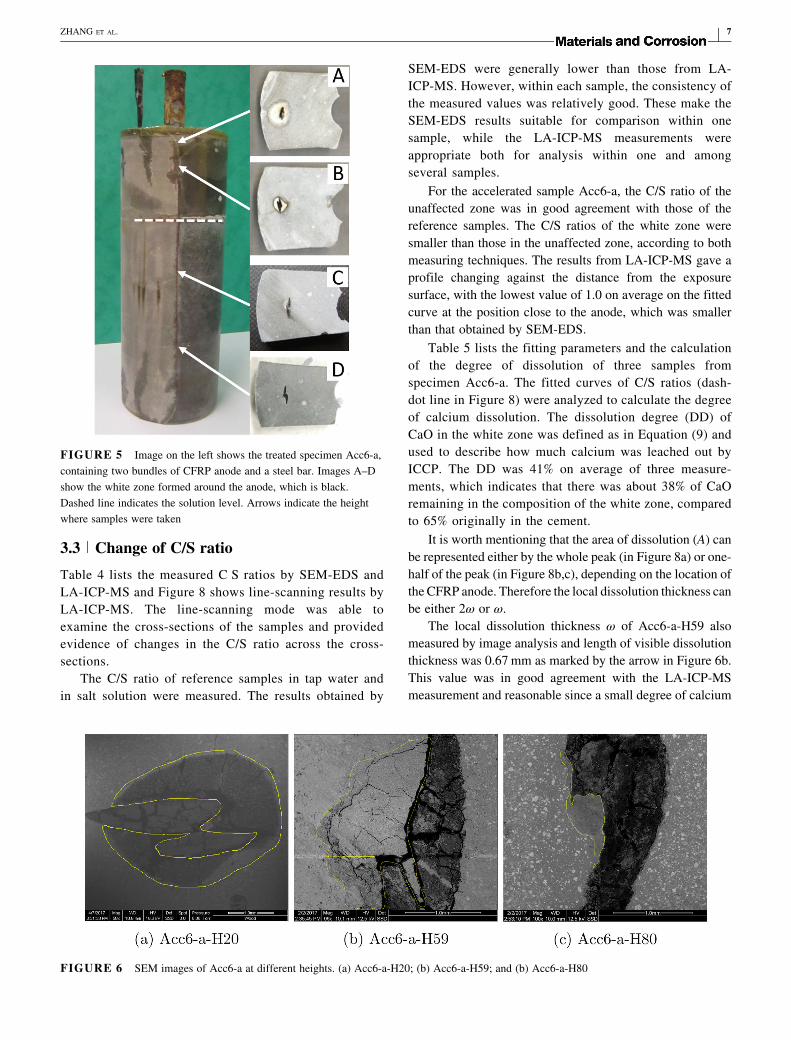
Figure 5 shows a new phase of white color formed aroundthe anode in the HCP. The size of the white zone increasedalong the y-axis of the specimen, that is, the white zone waseither not visible, or very small, in the lower part of thespecimen, while it appeared the greatest at the top.
It was clear that the ICCP caused a phase changearound the anode due to mass transport and electrochemi-
cal reactions. The phase change was not evenly distributedalong the anode, possibly because of the inhomogeneity ofthe HCP leading to an unevenly distributed electrical field.Moreover, the top part of the specimen has the shortestelectrical path, implying the lowest resistance andresulting in the greatest zone of phase change, while thelower part is the opposite.
Figure 6 shows the image analysis of the paste–anodeinterface, to which correspond images B–D in Figure 5. Thethree heights were chosen to represent the top, themiddle, andthe bottom part of a sample. The calculated areas ofdissolution (highlighted area) are 6.9, 0.3, and 2.4 mm2, atheights of 20, 59, and 80 mm, respectively. Table 3 gives asummary of all measured values of the areas and thicknessesof the four samples.
Figure 7 summarizes the dissolution thickness. Thesolution level was at the height of 25 ± 5mm. Most of thecalcium dissolution took place at and above the solution level.Below the solution level, the white zones tended to be smalland evenly distributed. The Acc3 group showed a betterpattern than the Acc6 group, implying that a current density of4 A/m2 could cause extra damage and increase the uncertaintyof the results.
FIGURE 4 Monitoring of the potential and current of treated specimens. Calculated total resistance and total charge density are also listed.(a) Acc3-a; (b) Acc3-b; (c) Acc6-a; and (d) Acc6-b
6 | ZHANG ET AL.
3.3 | Change of C/S ratio
Table 4 lists the measured C S ratios by SEM-EDS andLA-ICP-MS and Figure 8 shows line-scanning results byLA-ICP-MS. The line-scanning mode was able toexamine the cross-sections of the samples and providedevidence of changes in the C/S ratio across the cross-sections.
The C/S ratio of reference samples in tap water andin salt solution were measured. The results obtained by
SEM-EDS were generally lower than those from LA-ICP-MS. However, within each sample, the consistency ofthe measured values was relatively good. These make theSEM-EDS results suitable for comparison within onesample, while the LA-ICP-MS measurements wereappropriate both for analysis within one and amongseveral samples.
For the accelerated sample Acc6-a, the C/S ratio of theunaffected zone was in good agreement with those of thereference samples. The C/S ratios of the white zone weresmaller than those in the unaffected zone, according to bothmeasuring techniques. The results from LA-ICP-MS gave aprofile changing against the distance from the exposuresurface, with the lowest value of 1.0 on average on the fittedcurve at the position close to the anode, which was smallerthan that obtained by SEM-EDS.
Table 5 lists the fitting parameters and the calculationof the degree of dissolution of three samples fromspecimen Acc6-a. The fitted curves of C/S ratios (dash-dot line in Figure 8) were analyzed to calculate the degreeof calcium dissolution. The dissolution degree (DD) ofCaO in the white zone was defined as in Equation (9) andused to describe how much calcium was leached out byICCP. The DD was 41% on average of three measure-ments, which indicates that there was about 38% of CaOremaining in the composition of the white zone, comparedto 65% originally in the cement.
It is worth mentioning that the area of dissolution (A) canbe represented either by the whole peak (in Figure 8a) or one-half of the peak (in Figure 8b,c), depending on the location ofthe CFRP anode. Therefore the local dissolution thickness canbe either 2ω or ω.
The local dissolution thickness ω of Acc6-a-H59 alsomeasured by image analysis and length of visible dissolutionthickness was 0.67 mm as marked by the arrow in Figure 6b.This value was in good agreement with the LA-ICP-MSmeasurement and reasonable since a small degree of calcium
FIGURE 5 Image on the left shows the treated specimen Acc6-a,containing two bundles of CFRP anode and a steel bar. Images A–Dshow the white zone formed around the anode, which is black.Dashed line indicates the solution level. Arrows indicate the heightwhere samples were taken
FIGURE 6 SEM images of Acc6-a at different heights. (a) Acc6-a-H20; (b) Acc6-a-H59; and (b) Acc6-a-H80
ZHANG ET AL. | 7
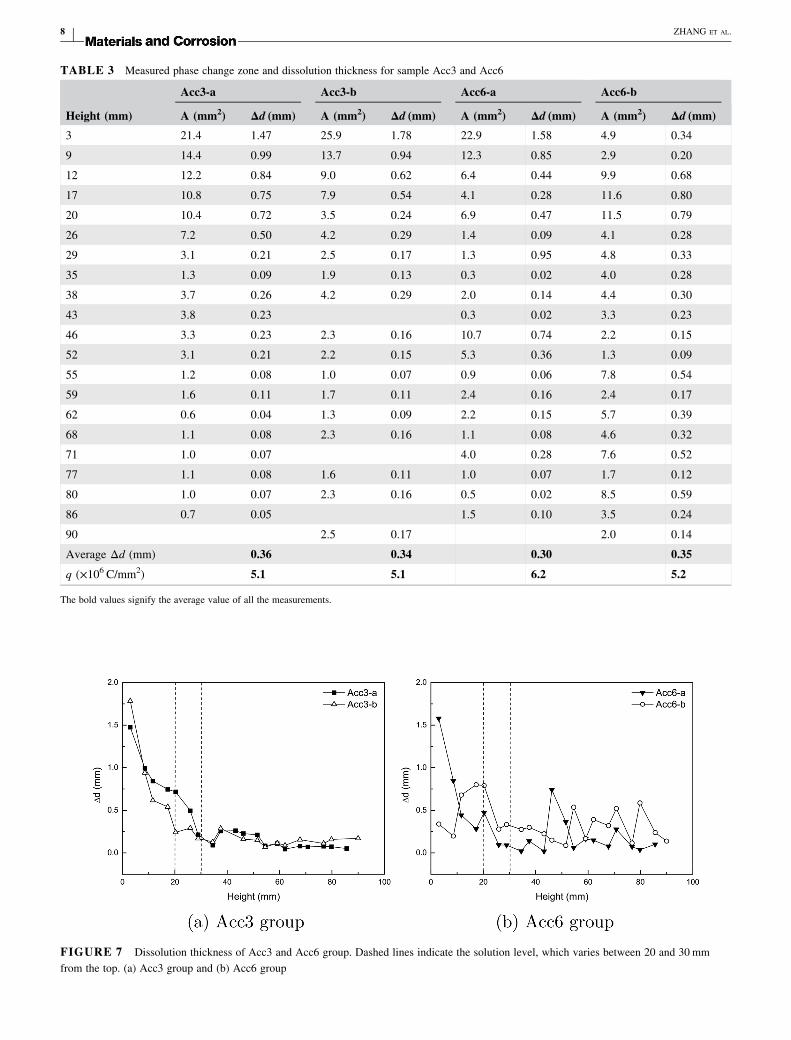
TABLE 3 Measured phase change zone and dissolution thickness for sample Acc3 and Acc6
Acc3-a Acc3-b Acc6-a Acc6-b
Height (mm) A (mm2) Δd (mm) A (mm2) Δd (mm) A (mm2) Δd (mm) A (mm2) Δd (mm)
3 21.4 1.47 25.9 1.78 22.9 1.58 4.9 0.34
9 14.4 0.99 13.7 0.94 12.3 0.85 2.9 0.20
12 12.2 0.84 9.0 0.62 6.4 0.44 9.9 0.68
17 10.8 0.75 7.9 0.54 4.1 0.28 11.6 0.80
20 10.4 0.72 3.5 0.24 6.9 0.47 11.5 0.79
26 7.2 0.50 4.2 0.29 1.4 0.09 4.1 0.28
29 3.1 0.21 2.5 0.17 1.3 0.95 4.8 0.33
35 1.3 0.09 1.9 0.13 0.3 0.02 4.0 0.28
38 3.7 0.26 4.2 0.29 2.0 0.14 4.4 0.30
43 3.8 0.23 0.3 0.02 3.3 0.23
46 3.3 0.23 2.3 0.16 10.7 0.74 2.2 0.15
52 3.1 0.21 2.2 0.15 5.3 0.36 1.3 0.09
55 1.2 0.08 1.0 0.07 0.9 0.06 7.8 0.54
59 1.6 0.11 1.7 0.11 2.4 0.16 2.4 0.17
62 0.6 0.04 1.3 0.09 2.2 0.15 5.7 0.39
68 1.1 0.08 2.3 0.16 1.1 0.08 4.6 0.32
71 1.0 0.07 4.0 0.28 7.6 0.52
77 1.1 0.08 1.6 0.11 1.0 0.07 1.7 0.12
80 1.0 0.07 2.3 0.16 0.5 0.02 8.5 0.59
86 0.7 0.05 1.5 0.10 3.5 0.24
90 2.5 0.17 2.0 0.14
Average Δd (mm) 0.36 0.34 0.30 0.35
q (×106 C/mm2) 5.1 5.1 6.2 5.2
The bold values signify the average value of all the measurements.
FIGURE 7 Dissolution thickness of Acc3 and Acc6 group. Dashed lines indicate the solution level, which varies between 20 and 30 mmfrom the top. (a) Acc3 group and (b) Acc6 group
8 | ZHANG ET AL.

dissolution may not be enough to alter the color, but yetenough to be detected by an analytic instrument.
DD ¼ content of dissolved calciumcontent of original calcium
ð9Þ
3.4 | Characterization of the white zone
Figure 9 illustrates the XRD analysis of the powders extractedfrom the reference and the white zones. The most apparentchange between the reference and the white zones was thedisappearance of Portlandite peaks and C-S-H peaks in thewhite zone. This is because C-S-H gel phases were poorlycrystallized, so they generally can be characterized in 2θ of29° to 33° and about 51°.[31] C-S-H gel phases presented inthe reference sample had almost disappeared in the whitezone, indicating a high degree of calcium depletion and thatmostly an amorphous silica-gel-like phase had formed. The
TABLE 4 Measured C/S ratios in reference and accelerated samples
SamplesLA-ICP-MS
SEM-EDS± St.Dev. Comment
Ref in tap water 3.1 2.9 ± 0.8 Avg. of 35points
Ref in saltsolution
3.1 2.3 ± 0.7 Avg. of 55points
Acc6-aunaffectedzone
3.2 2.5 ± 0.9 Avg. of 24points
Acc6-a-H20white zone
0.9
Acc6-a-H43white zone
0.8
Acc6-a-H59white zone
1.3 2.1 ± 0.1 Avg. of 26points
LA-ICP-MS is in line-scanning mode. Results from SEM-EDS are presented byaverage values ± standard deviation.
FIGURE 8 Profile of C/S ratio in the accelerated sample Acc6-a at different heights, subjected to a current density of 4.0 A/m2 (of anodesurface) for 35 days in 3% NaCl solution. Dash-dot lines are fitted curves. Shadowed areas indicate the location of the CFRP anode. Arrowmarks the thickness of decalcification. (a) Acc6-a-H20; (b) Acc6-a-H43; and (c) Acc6-a-H59
ZHANG ET AL. | 9

major identified crystalline phase in the treated sample wasgypsum, which was induced by the cement manufacturingprocess.
Powder from the white zone was also examined by NMRanalysis to provide information of the Si environment on anatomic scale. Figure 10 illustrates the chemical shift in thereference and the white-zone sample. As expected, in thereference sample only Q1 (chain end) and Q2 (within chain)peaks were visible, and neitherQ3 orQ4 were observed, sincechain structures were the major constituents in HCP.[28]
However, in the white zone, clear Q3 and Q4 peaks wereobserved, which indicated that branched and networkedstructures were formed due to a high degree of calciumdepletion.
The calculated connectivity �n for the reference sample was1.4 and for the white-zone powder was 2.1, indicating higherpolymerization of C-S-H and a lower C/S ratio,[32] which wereconfirmed by SEM-EDS and LA-ICP-MS in section 3.3. Theaverage MCL for the reference and the white-zone sample
were 3.2 and 2.7, respectively, indicating that the chain lengthscontained in the C-S-H gel were also reduced.
To summarize the results from XRD and NMR, it can besuggested that the formed white zone was a silica-gel-likephase, which was amorphous and had developed branchedand networked structures. The formation of such a phase wasdue to a high degree of calcium depletion as a consequence ofthe impressed current.
3.5 | Movement of chloride ions
Figure 11 illustrates the chloride profiles of Acc6 and thereference samples soaked in tap water and 3% NaCl solutionfor 35 days.
Cement clinker contained 0.01 wt% of chloride, whichwas the only chloride source in this case of tap water
TABLE 5 Fitting and calculation of calcium dissolution degree
Fitting andcalculation
Acc6-a-H20
Acc6-a-H43
Acc6-a-H59
Area A 1.39 0.30 1.51
Center xc 8.01 7.46 7.42
Width ω 0.50 0.10 0.72
Height h 2.19 2.37 1.98
Baseline y0 3.12 3.18 3.27
Area oforiginalcalcium
A0 ¼ y0� 2ω 3.17 0.63 4.69
Dissolutiondegree
DD ¼ AA0
43.9% 46.8% 32.3%
FIGURE 9 X-ray diffraction pattern of reference and the white-phase substance. Shadowed area indicates C-S-H phases. CH:portlandite, Ca(OH)2; CSH: calcium silicate and C-S-H gel; E:ettringite; G: gypsum; C: calcite, CaCO3
FIGURE 10 29Si solid state spectra of reference sample andwhite substance from the ring-pattern area. Q0 peak is assigned to amonomer, Q1 to dimer, Q2 to chain, Q3 to branched structures, andQ4 to networked structures
FIGURE 11 Chloride profiles of reference samples immersed intap water and 3% NaCl solution. Shadowed areas indicate the locationof the CFRP anode
10 | ZHANG ET AL.

immersion. At the position where the CFRP anode waslocated (x ¼ 7 mm), the content of the chloride was slightlyincreased, to about 0.06%.
In the case of 3% NaCl solution immersion, the chloridein the HCP showed a classic diffusion profile. At theposition of the CFRP anode (x ¼ 9 mm), the chloridecontent was much higher than that in the HCP. This couldbe explained by more voids or micro-gaps existing in theanode–paste interface, which would be equivalent to ahigher porosity at the interface, resulting in more chloridesthan that in the surroundings.
An Acc6 sample was taken from the top part close to thelevel of the submerging solution, in Figure 5C. The chlorideprofile was a result of a combined effect of diffusion andmigration. Between the exposure surface and x ¼ 5 mm, thetransportmechanismwas diffusion and the chloride content was
higher than that of the reference in salt solution. The CFRPanode was located at a position between 8.5 and 9.5mm, wherethe chlorides came close to the anode, and the transportmechanism was dominated by migration. Therefore thechlorides were forced to move towards the anode and thechloride content was about 10 times higher than the reference insalt solution, as shown in the inset graph in Figure 11.
3.6 | Movement of alkali ions
Figure 12 shows the distribution of sodium ions (Na+) andpotassium ions (K+) between the exposure surface(x ¼ 0 mm) and the steel reinforcement (x≈22 mm). Alkaliesaccumulated at the cathode site due to migration in which thesteel as cathode produces hydroxide (OH−) and attractedpositive ions. The overall effect of alkali accumulation at thecathode was also confirmed. Apparently this result wasdifferent from the modeling using low current densities.[12] InPeelen's model,[12] the overall flux of sodium ions was foundto be zero at 10 mA/m2 for 100 years (the calculation ofpotassium ions was not included). These two results are not inconflict, because they indicate that the choice of currentdensity is in fact an important key factor in regard todesigning and evaluating an ICCP system. At a high currentdensity, the mass transport is dominated by migration whilediffusion can be neglected. However, at a low current density,the mass transport is governed by the coupled processes ofmigration and diffusion. A concentration gradient is built upby migration and then back-diffusion takes places, whichresults in a overall zero flux of sodium ions, as discovered bymodeling.[12]
The accumulation of alkalis appeared near the whitezone as well. The explanation of this phenomenon couldbe as follows. The silica-gel-like white zone wasnegatively charged after calcium was leached, due tohydrogen formation and migration. When the experiment
FIGURE 12 Sodium, potassium, and carbon profiles ofaccelerated sample Acc6 subjected to a current density of 2 A/m2 for35 days in 3% NaCl solution. All molar concentrations arenormalized to silica. Shadowed areas indicate the appearance of awhite phase and the location of the CFRP anode. An image of sampleAcc6 is displayed in the corner. The arrow indicates the location ofthe line-scanning and its direction
FIGURE 13 CFRP anode after accelerated test. The white crystals appearing in the corner in (a) and next to the fiber in (b) are potassium(K+) and chloride (Cl−) enriched phases. (a) Image of the cross-section of CFRP. (b) Image of two single fibers with smooth surface
ZHANG ET AL. | 11

was terminated and the electrical potential disappeared,alkali ions immediately diffused towards the white zoneto keep electroneutrality because of their high ionicmobilities. As a consequence of migration and back-diffusion when the ICCP was terminated, alkali peaksnext to the white zone were observed, as shown inFigure 12.
3.7 | Degradation of the CFRP anode
Figure 13 shows the SEM results of the undamaged carbonfiber after the accelerated test. The polymer matrixdisappeared, leading to a higher porosity at the anode.During the drying process of preparation, pore solutionsevaporated through the pores between the fibers and the ionsin it eventually crystallized. The white crystals appearingaround the carbon fiber were potassium (K+) and chloride(Cl−) enriched phases.
4 | CONCLUDING REMARKS
This study focused on the microstructure analysis of thepaste–anode interface using an accelerated method (currentdensity of 2 and 4 A/m2 of anode surface) and an innovativeCFRP material as anode. The results showed that a totalcharge density of 6� 106 C/m2 can cause an averagethickness of calcium dissolution of 0.34 mm around the anodewithin 35 days of accelerated tests, or an equivalent operatingtime of 30 years at 4 mA/m2 (of anode surface) according to alinear conversion from the accelerated tests.
A white zone was formed around the anode, in which theC/S ratio decreased from 3.2 to 1.3. The formation of thiswhite zone was due to a severer calcium dissolution caused byelectrochemical reactions at the anode. The white-zonesubstance was, to a large extent, constituted of branched andnetworked structures and the C-S-H gel became polymerizedor more amorphous. The resistivity was also increased,mainly because of the formation of the white zone.
The accumulation of chloride ions at the anode andalkalies at the cathode was also confirmed by LA-ICP-MSanalysis. It has also been proven that LA-ICP-MS is a reliabletool to analyze major and trace elements in the HCP andconcrete materials.
The carbon fiber embedded in the specimen remainedundamaged under 4 A/m2, while the polymer matrix wasdegraded due to oxidation, which implies that CFRP can beused as an anode material for ICCP applications.
The conversion from an accelerated test to normaloperation has been taken to be linear in this study, whichobtained promising outcomes that could be suitable for along-term ICCP evaluation although it might overestimate thedamage to some extent.
ACKNOWLEDGMENT
The authors thank Dr. Thomas Zack from University ofGothenburg with the help of LA-ICP-MS instrument. Thisresearch was supported the Swedish Research CouncilFORMAS (grant number 249-2011-1520) and EuropeanUnion's Research and Innovation funding program FP7(project DOSECOPS).
ORCID
Emma Q. Zhang http://orcid.org/0000-0002-7504-6148
REFERENCES
[1] L. Bertolini, F. Bolzoni, A. Cigada, T. Pastore, P. Pedeferri,Corros. Sci. 1993, 35, 1633.
[2] N. C. Webb, Construction Building Mater. 1992, 6, 179.[3] A. A. Sohanghpurwala, Cathodic protection for life extension of
existing reinforced concrete bridge elements, NCHRP Synthesis ofHighwayPracticeNumber398.TransportationResearchBoard,2009.
[4] L. Bertolini, F. Bolzoni, P. Pedeferri, L. Lazzari, T. Pastore,J. Appl. Electrochem. 1998, 28, 1321.
[5] P. Pedeferri, Construction Building Mater. 1996, 10, 391.[6] T. Eichler, B. Isecke, G.Wilsch, S. Goldschmidt, M. Bruns,Mater.
Corros. 2010, 61, 512.[7] K. Davies, J. Broomfield, Cathodic Protection of Steel in Concrete
and Masonry, Vol. 41, 2nd ed., CRC Press, Boca Raton, FL 2013,pp. 41–55.
[8] K. Haga,M. Shibata,M. Hironaga, S. Tanaka, S. Nagasaki, J. Nucl.Sci. Technol. 2002, 39, 540.
[9] F.Matsushita, Y. Aono, S. Shibata,Cem. Concr. Res. 2004, 34, 1251.[10] R. Polder, T. Nijland, W. Peelen, L. Bertolini, “Acid formation in
the anode/concrete interface of activated titanium cathodicprotection systems for reinforced concrete and the implicationsfor service life, ” in 15th International Corrosion Congress (ICC),Granada, Spain, 22–27 September, 2002.
[11] R. Polder, W. Peelen, J. Leggedoor, G. Schuten,Microscopy studyof the interface between concrete and conductive coating used asanode for cathodic protection, 2003, European Federation ofCorrosion Publications Number 38, ch. 22, pp. 277–287.
[12] W. Peelen, R. Polder, E. Redaelli, L. Bertolini, Mater. Corros.2008, 59, 81.
[13] S. F. Brena, R. M. Bramblett, S. L. Wood, M. E. Kreger, Struct. J.2003, 100, 36.
[14] P. Lambert, C. Van Nguyen, P. S. Mangat, F. J. O'Flaherty, G.Jones, Mater. Struct. 2015, 48, 2157.
[15] J.-H. Zhu, G. Guo, L. Wei, M. Zhu, X. Chen, Materials 2016, 9,103.
[16] L. Tang, E. Q. Zhang, Y. Fu, B. Schouenborg, J. E. Lindqvist,Mater. Corros. 2012, 63, 1119.
[17] C. Van Nguyen, P. Lambert, P. Mangat, F. O'Flaherty, G. Jones,International Scholarly Research Network ISRN Corros. 2012,Article ID 814923.
[18] C. V. Nguyen, P. S.Mangat, P. Lambert, F. J. O. Flaherty, G. Jones,Concrete Repair, Rehabilitation and Retrofitting III, CRC Press,Boca Raton 2012, pp. 1179–1185.
12 | ZHANG ET AL.

[19] H. Sun, S. A. Memon, Y. Gu, M. Zhu, J.-H. Zhu, F. Xing, Mater.Struct. 2016, 49, 5273.
[20] H. Sun, L. Wei, M. Zhu, N. Han, J.-H. Zhu, F. Xing, ConstructionBuilding Mater. 2016, 112, 538.
[21] J.-H. Zhu, L. Wei, M. Zhu, H. Sun, L. Tang, F. Xing, Materials2015, 8, 4316.
[22] J.-H. Zhu, L. Wei, Z. Wang, C. K. Liang, Y. Fang, F. Xing,Construction Building Mater. 2016, 120, 275.
[23] H. Sun, G. Guo, S. A. Memon, W. Xu, Q. Zhang, J.-H. Zhu,F. Xing, Composites Part A 2015, 78, 10.
[24] J. Chang, Cem. Concr. Compos. 2002, 32, 657.[25] NACE SP0290-2007, “Impressed current cathodic protection of
reinforcing steel in atmospherically exposed concrete structures,”2007.
[26] K. P. Jochum, U. Weis, B. Stoll, D. Kuzmin, Q. Yang, I. Raczek,D. E. Jacob, A. Stracke, K. Birbaum, D. A. Frick, GeostandardsGeoanalytical Res. 2011, 35, 397.
[27] J. J. Kim, M. K. Rahman, M. M. Reda Taha, Appl. Nanosci. 2012,2, 445.
[28] K. Kurumisawa, T. Nawa, H. Owada, M. Shibata, Cem. Concr.Res. 2013, 52, 190.
[29] G. Le SaoÛt, E. Lécolier, A. Rivereau, H. Zanni, Cem. Concr. Res.2006, 36, 428.
[30] I. G. Richardson, Cem. Concr. Res. 1999, 29, 1131.[31] A. Babaahmadi, Durability of Cementitious Materials in Long-
Term Contact With Water, Chalmers University of Technology,Gotheborg 2015.
[32] X. Cong, R. J. Kirkpatrick, Adv. Cem. Based Mater. 1996, 3,144.
How to cite this article: Zhang EQ, Tang L, BerninD, Jansson H. Effect of the paste–anode interfaceunder impressed current cathodic protection inconcrete structures. Materials and Corrosion.2018;1–13. https://doi.org/10.1002/maco.201709908
ZHANG ET AL. | 13

![Hybrid anode concrete corrosion protection independent study · performance of impressed current cathodic protection systems [19]. A falling trend in corrosion rate combined A falling](https://static.fdocuments.in/doc/165x107/5c78e92609d3f2fb438c0443/hybrid-anode-concrete-corrosion-protection-independent-study-performance-of.jpg)