Anode Maturation Time for Attaining a Mature Anode Biofilm ...
24
Article Anode Maturation Time for Attaining a Mature Anode Biofilm and Stable Cell Performance in a Single Chamber Microbial Fuel Cell with a Brush Anode Huong V. H. Tran 1 , Eojin Kim 1 , Bonyoung Koo 1 , Sunghoon Sung 1 and Sokhee P. Jung 1, * 1 Department of Environment and Energy Engineering, Chonnam National University, Gwangju 61186, Republic of Korea; [email protected]; [email protected] * Correspondence: [email protected], [email protected]; Tel.: +82-62-530-1857 Both authors contributed equally to this manuscript Abstract: To obtain an accurate and reproducible experimental results in microbial fuel cell (MFC), it is important to know ‘anode maturation biofilm’ to produce a stable and maximum performance. For this purpose, four single chamber MFCs were tested in this study. The linear sweep voltammetry (LSV) polarization tests illustrated that maximum power densities of three MFCs became stable after 9 weeks. Although there were variations afterwards, such variations were negligible. Average maximum power densities from the 9 th to the 17 th week were 2,990 mW/m 2 (MFC-4), 2,983 mW/m 2 (MFC-2), 2,368 mW/m 2 (MFC-3) and 837 mW/m 2 (MFC-1). Polarization resistance shows that MFC-1 had much larger anode resistance (36.6-85.4 Ω) than the other MFCs (1.7-11.6 Ω). Anodic cyclic voltammetry (CV) shows that current production increased over time and MFC-1 had much smaller current production (24.4 mA) than the other MFCs (31.0-34.9 mA) at 17 th week. The increased current production indicates anode biofilm became more mature over time, but overall cell performance did not increased accordingly. Possibly due to the bad inoculation, MFC-1 showed the lowest performance. However, its performance was restored to the initial performance and anode resistance was reduced by 47% at 17 th week. This study shows that the optimum anode maturation time is 9 weeks and that bioanode performance is a key factor for MFC performance. This study also shows than LSV polarization and CV tests are accurate and non-destructive measurement methods for diagnosing anode performance. Keywords: anode maturation time; microbial fuel cell (MFC); linear sweep voltammetry (LSV) polarization; cyclic voltammetry (CV) 1. Introduction Since microbial electrical effects accompanying the decomposition of organic compounds was discovered in 1911 [1], the electrode reaction of Shewanella isolates were demonstrated by Kim et al. [2, 3]. Several years later, electricity generation using Geobacter isolate in microbial fuel cell (MFC) was also discovered [4]. MFC is an environmental technology innovation that converts organic wastewater into electricity with a simultaneous wastewater treatment [5-8]. Due to undivided attention to global climate and energy crisis in recent decades, MFC technology has been increasingly concerned about in environmental and energy fields. In MFC, anodic microbial biofilm can electrochemically decompose organic compounds. This electrogenic anode biofilm functions as an anodic catalyst, a key part for producing current from waste organic matter. The anode biofilm mainly consists of electrogenic microorganisms that perform extracellular electron transfer reaction [9]. In MFC experiments, a sufficiently mature anode biofilm is very important for producing stable and reproducible data [10]. In routine lab scale MFC tests, the anode is inoculated with wastewater microbial biota. The anodic film is then enriched in a synthetic medium. Preprints (www.preprints.org) | NOT PEER-REVIEWED | Posted: 17 June 2020 doi:10.20944/preprints202006.0209.v1 © 2020 by the author(s). Distributed under a Creative Commons CC BY license.
Transcript of Anode Maturation Time for Attaining a Mature Anode Biofilm ...
Article
Anode Maturation Time for Attaining a Mature Anode
Biofilm and Stable Cell Performance in a Single
Chamber Microbial Fuel Cell with a Brush Anode
Huong V. H. Tran 1, Eojin Kim 1, Bonyoung Koo 1, Sunghoon Sung 1 and Sokhee P. Jung 1,*
1 Department of Environment and Energy Engineering, Chonnam National University, Gwangju 61186,
Republic of Korea; [email protected]; [email protected]
* Correspondence: [email protected], [email protected]; Tel.: +82-62-530-1857
Both authors contributed equally to this manuscript
Abstract: To obtain an accurate and reproducible experimental results in microbial fuel cell (MFC), it
is important to know ‘anode maturation biofilm’ to produce a stable and maximum performance. For this
purpose, four single chamber MFCs were tested in this study. The linear sweep voltammetry (LSV)
polarization tests illustrated that maximum power densities of three MFCs became stable after 9 weeks.
Although there were variations afterwards, such variations were negligible. Average maximum power
densities from the 9th to the 17th week were 2,990 mW/m2 (MFC-4), 2,983 mW/m2 (MFC-2), 2,368 mW/m2
(MFC-3) and 837 mW/m2 (MFC-1). Polarization resistance shows that MFC-1 had much larger anode
resistance (36.6-85.4 Ω) than the other MFCs (1.7-11.6 Ω). Anodic cyclic voltammetry (CV) shows that
current production increased over time and MFC-1 had much smaller current production (24.4 mA)
than the other MFCs (31.0-34.9 mA) at 17th week. The increased current production indicates anode
biofilm became more mature over time, but overall cell performance did not increased accordingly.
Possibly due to the bad inoculation, MFC-1 showed the lowest performance. However, its performance
was restored to the initial performance and anode resistance was reduced by 47% at 17th week. This
study shows that the optimum anode maturation time is 9 weeks and that bioanode performance is a
key factor for MFC performance. This study also shows than LSV polarization and CV tests are
accurate and non-destructive measurement methods for diagnosing anode performance.
Keywords: anode maturation time; microbial fuel cell (MFC); linear sweep voltammetry (LSV)
polarization; cyclic voltammetry (CV)
1. Introduction
Since microbial electrical effects accompanying the decomposition of organic compounds was
discovered in 1911 [1], the electrode reaction of Shewanella isolates were demonstrated by Kim et al. [2,
3]. Several years later, electricity generation using Geobacter isolate in microbial fuel cell (MFC) was also
discovered [4]. MFC is an environmental technology innovation that converts organic wastewater into
electricity with a simultaneous wastewater treatment [5-8]. Due to undivided attention to global climate
and energy crisis in recent decades, MFC technology has been increasingly concerned about in
environmental and energy fields.
In MFC, anodic microbial biofilm can electrochemically decompose organic compounds. This
electrogenic anode biofilm functions as an anodic catalyst, a key part for producing current from waste
organic matter. The anode biofilm mainly consists of electrogenic microorganisms that perform
extracellular electron transfer reaction [9]. In MFC experiments, a sufficiently mature anode biofilm is
very important for producing stable and reproducible data [10]. In routine lab scale MFC tests, the anode
is inoculated with wastewater microbial biota. The anodic film is then enriched in a synthetic medium.
Preprints (www.preprints.org) | NOT PEER-REVIEWED | Posted: 17 June 2020
© 2020 by the author(s). Distributed under a Creative Commons CC BY license.
Preprints (www.preprints.org) | NOT PEER-REVIEWED | Posted: 17 June 2020 doi:10.20944/preprints202006.0209.v1
© 2020 by the author(s). Distributed under a Creative Commons CC BY license.
2
However, how long the anode biofilm should be enriched for a stable performance remains unclear. In
this study, for a clearer concept, we define anode maturation time as the operation time encompassing
the initial inoculation and the biofilm development time until the MFC produces a relatively stable
performance.
In a two-chambered MFC with a plain porous carbon paper anode and a Pt-coated plain carbon paper
cathode, by using nutrient medium during the development phase, voltage generation increased
appreciably after 3 days (70 h), reaching a stable state after 5.2 days (125 h) [11]. In another two chamber
MFC study, nine closed-circuit MFCs and three open-circuit MFCs were tested along with three
different substrates, in which anode biofilms were enriched for 16 days [9, 12].
In contrast, for simpler MFC configurations (i.e., single-chamber cell or two-chamber cell), the anode
maturation times were only a few days. In a single-chamber MFC, a carbon paper anode required about
4-8 days to obtain a stable voltage output. After 2 days of inoculation with a solution including
wastewater, nutrient medium and sodium acetate, MFCs could have stable power outputs after 2-3
batches (1-2 days per batch) filled with nutrient medium and acetate [13]. In another single-chamber
MFC test with a Pt-coated carbon cloth cathode, a carbon cloth anode were inoculated with full-strength
brewery wastewater for four batches. By using only wastewater or the combination of wastewater and
PBS, reactors’ voltage became stable and reproducible after about 10 days (230 ± 30 h) from the initial
inoculation. However, its operational voltage continued to increase gradually until 18 days (420 h) [14].
A stacked MFC required a total of 131 days to achieve a stable phase of anode. It seemed the stacked
MFC system with a large volume and a complex construction needed a long time for anode to be mature
[15].
Anode maturation times reported so far varies a lot depending on many factors, ranging from a few
days to several months. It is important to know the appropriate operation time for attaining a mature
anode biofilm and stable performance because it allows reliable data production. And it is very
important to know it in a most common condition, that is, a single chamber cubic MFC.
In this study, to investigate a representative anode maturation time in a single-chamber cell with a
graphite brush anode and an air-cathode, four MFCs were tested to figure out their anode maturation
time. This cell configuration has been widely used because of its simple structure, small size, easy
operation and high performance [16, 17]. Four replicate MFCs were tested and a series of
electrochemical analyses were carried out to explore their performance and electrochemistry. Our
results shows that the representative anode maturation time in a single chamber MFC with a brush
anode was 63 days (9 weeks).
Preprints (www.preprints.org) | NOT PEER-REVIEWED | Posted: 17 June 2020 Preprints (www.preprints.org) | NOT PEER-REVIEWED | Posted: 17 June 2020 doi:10.20944/preprints202006.0209.v1
3
2. Materials and methods
2.1. Electrode fabrication
Activated carbon based air-cathode using polyvinylidene fluoride (PVDF) as a binder was used in this
study [18]. Catalyst mixture contained 10% PVDF solution loading of 1 mL, carbon black (Vulcan XC-
72, Cabot Co., USA) loading of 30 mg and activated carbon (Norit SX plus, Norit Americas Inc., TX, USA)
loading of 300 mg. This mixture was spread directly on a stainless-steel mesh (60 mesh, SUS 304, a
projected cross-sectional area of 7 cm2, a total area of 11.3 cm2). Subsequently, the cathode was dipped
in distilled water for 15 minutes to induce a phase inversion reaction. It was then dried at room
temperature for 8 h. A brush anode (2.5 cm in both length and diameter) was constructed as previously
described [19, 20]. A carbon fiber (T700, TORAYCA, Japan) was twisted on a titanium wire (length: 7
cm; 17 gauge; #2 grade; Seoul Titanium, South Korea) to fabricate a brush. The brush anode was heat-
treated at 450 °C for 30 minutes in a furnace (FX/FHX, DAIHAN, South Korea) before being inoculated.
2.2. MFC construction and operation
MFC construction
To investigate when an inoculated anode in MFC reached its stable performance, four replicate MFCs
designated as MFC-1, MFC-2, MFC-3 and MFC-4 were tested. A polycarbonate single-chamber cube-
shaped MFC was used with an anode and a cathode placed on opposite sides. A cubic chamber was 4
cm in length and 3 cm in diameter with an empty cylindrical bed volume of 28 mL [16, 20]. To achieve
the maximum power generation, a brush anode was installed at a distance of 12 mm horizontally to the
cathode [20]. A titanium plate (10 × 25 mm, G2, Seoul titanium, South Korea) was used as a current
collector. A cathode had a projected area of 7 cm2 in the medium. A nonwoven fabric was attached onto
the projected side of the cathode to prevent a short circuit [21].
Inoculation phase, developing phase and stable phase
For inoculation, domestic wastewater was obtained from Gwangju Wastewater Treatment Plant with a
ratio of primary sedimentation to activated sludge of 1:4 [22]. Anodic compartments were inoculated
with the mixture wastewater mentioned above and operated with a fixed external resistance of 1,000-Ω
at room temperature (30°C). After one week, MFC systems were operated in a fed-batch mode using 50-
mM phosphate buffer solution (PBS) as medium. The medium for MFC operation contained 2 g/L of
sodium acetate in 50-mM PBS (NaH2PO4, 2.34 g/L; Na2HPO4, 4.33 g/L; NH4Cl, 0.31 g/L; KCl, 0.13 g/L;
trace minerals, 1 mL/L and vitamins, 1 mL/L) which was replaced every day [12, 23]. Hence, from day
0 to the 1st week, it was called an inoculation phase. From the 1st week until MFC reaching a stable state,
it was called a developing phase. After this time, it was called a stable phase (Figure 1). In the stable
phase, MFCs would have the optimum practical performance.
2.3. Electrochemical analysis
MFC voltage was measured every minute using a computer-based multi-meter (3706A, Keithley
Instrument, USA). When the voltage declined below 20 mV, fresh medium was fed. All electrochemical
measurements were performed after replacing the new medium and after stable cell voltage was
achieved. Measurements of LSV polarization test and cyclic voltammetry (CV) were performed using a
potentiostat (ZIVE SP1, Wonatech, South Korea). An Ag/AgCl electrode (RE-1B, ALS, Japan; -209 mV
vs. SHE) was installed as a reference electrode in all experiments. After every two weeks of operation,
all reactors were tested at 3, 5, 7, 9, 11, 13, 15 and 17 weeks.
To observe the maximum power density of MFCs, LSV polarization test was carried out. An MFC
reactor was operated in open circuit mode for 90 minutes. It was then connected to the potentiostat with
the following programming: scan rate of 1 mV/s and voltage ranging from OCV to 0 V versus Ag/AgCl.
The MFC was connected to the potentiostat as a cathode to a working lead, an anode to a counter lead
Preprints (www.preprints.org) | NOT PEER-REVIEWED | Posted: 17 June 2020 Preprints (www.preprints.org) | NOT PEER-REVIEWED | Posted: 17 June 2020 doi:10.20944/preprints202006.0209.v1
4
and an AI+ lead, a reference electrode to an AI- lead.
Cyclic voltammetry measurements were carried out with an electrochemical potentiostat equipped a
standard three-electrode system at room temperature (measured between -600 and 100 mV (vs.
Ag/AgCl), a scan rate of 1 mV/s). In brief, the anode was used as the working electrode while the cathode
and the Ag/AgCl electrode were used as the counter and reference electrodes, respectively.
2.4. Calculation
Power density (p, mW/m2) of each MFC system was calculated using the following equation:
𝑝 =I.V
A
,where I is current (mA), V is voltage (mV) and A is a projected cathode area (7 cm2) [15].
Current density (i, mA/m2) was also calculated based on the cathode projected area with the following
equation:
𝑖 = 𝐼
𝐴
The optimum external resistance (Ropt, Ω) found for each MFC reactor was calculated with the following
equation:
Ropt = 𝑉𝑜𝑝𝑡
𝐼𝑜𝑝𝑡 =
𝑝𝑚𝑎𝑥
(𝐼𝑜𝑝𝑡)2
,where Vopt is the optimum cell voltage (V), Iopt is the optimum current (A), pmax is the maximum power
(W). Polarization resistance of electrodes was calculated from linear part of the polarization curve.
3. Results
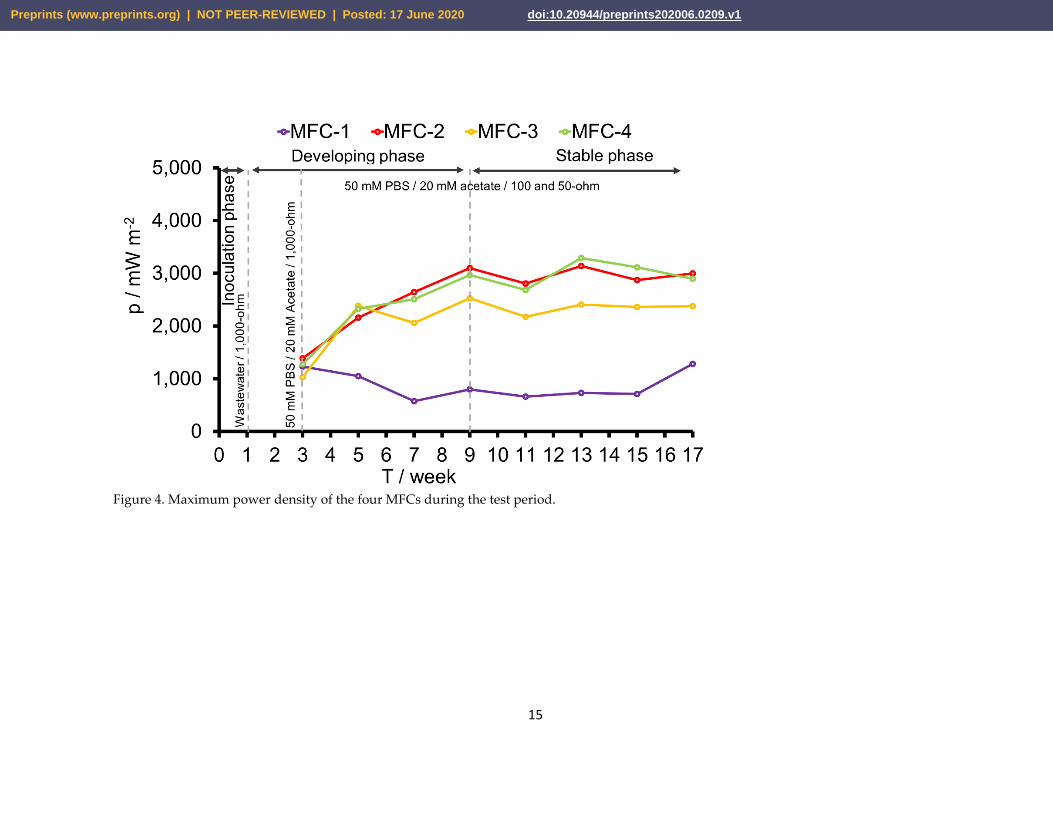
3.1. Operation cell voltage profile
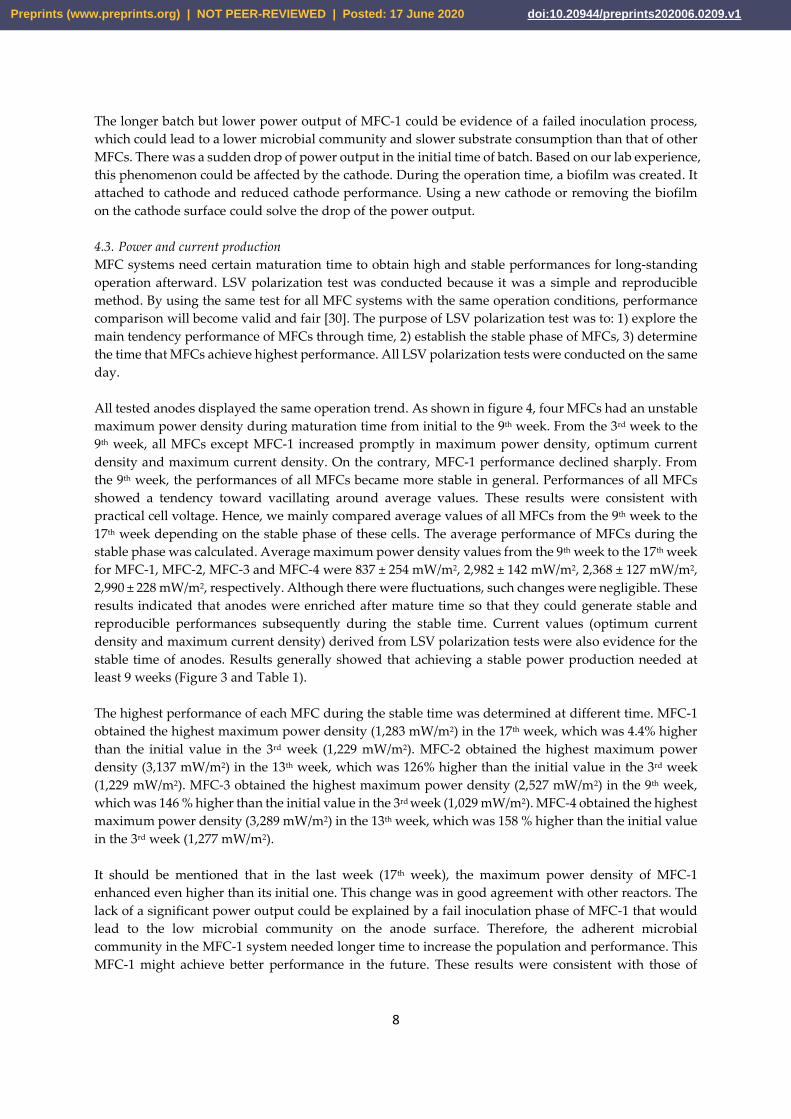
The average cell voltage was recorded during our study (except for the inoculation phase) (Figure 1).
As expected, we filled the synthetic medium after one week, the MFC voltage increased drastically.
From the 1st week to the 3rd week, MFC-1, MFC-2, MFC-3 and MFC-4 cells voltage increased from 217
mV to 483 mV, from 216 mV to 477 mV, from 212 mV to 432 mV, from 186 mV to 462 mV, respectively.
Cell voltage decreased gradually when we replaced the lower optimum external resistance from the 3rd
week. It was found that the actual power generation become stable from the 9th week.
3.2. Power and current production
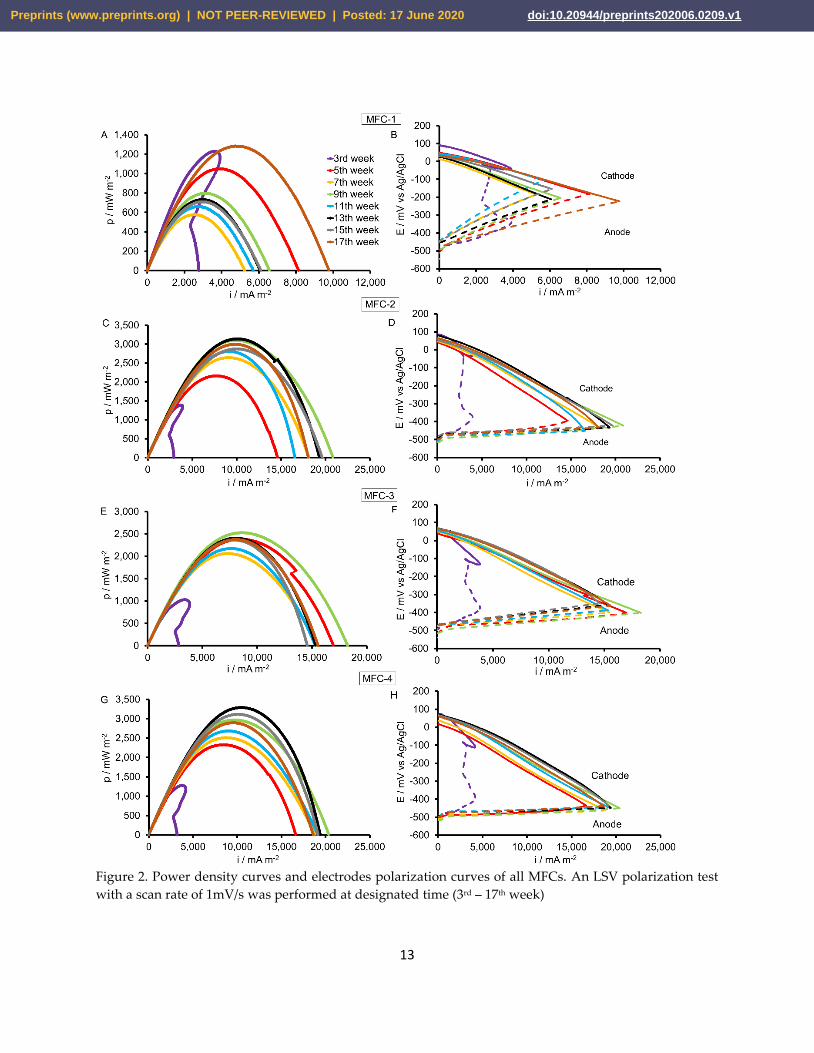
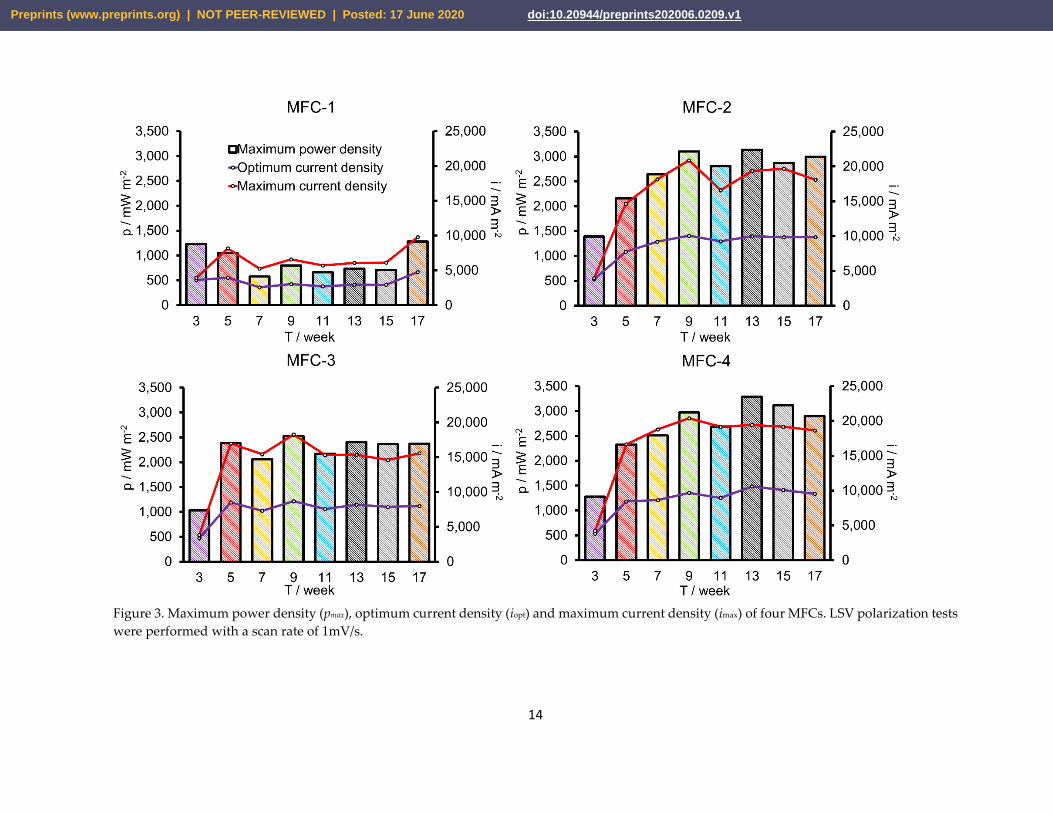
To evaluate MFC performance at each week, LSV polarization test was performed. The maximum
power density (pmax), optimum current density (iopt) and maximum current density (imax) of all MFCs
were compared. Optimum current density is the current density when an MFC produces the maximum
power during an optimum operation. From the initial time to the 7th week, the power density of all
reactors had an unstable tendency.
Power overshoots were detected at the 3rd week for all MFCs (Figures 2-A, 2-C, 2-E, 2-G). To prevent
this phenomenon, we conducted the optimum external resistance to cells. By performing LSV
polarization test, we could determine the optimum external resistance based on LSV polarization data
(Table 1).
In the 3rd, 5th, 7th, 9th, 11th, 13th, 15th and 17th weeks, MFC-1 produced the maximum power densities (pmax)
of 1,229 mW/m2, 1,050 mW/m2, 557 mW/m2, 798 mW/m2, 662 mW/m2, 732 mW/m2, 710 mW/m2 and 1,283
Preprints (www.preprints.org) | NOT PEER-REVIEWED | Posted: 17 June 2020 Preprints (www.preprints.org) | NOT PEER-REVIEWED | Posted: 17 June 2020 doi:10.20944/preprints202006.0209.v1
5
mW/m2, respectively (Figure 2-A). Its optimum current densities (iopt) were 3,610 mA/m2, 3,957 mA/m2,
2,559 mA/m2, 3,025 mA/m2, 2,708 mA/m2, 2,946 mA/m2, 2,942 mA/m2 and 4,747 mA/m2, respectively. Its
maximum current densities (imax) were 3,918 mA/m2, 8,158 mA/m2, 5,249 mA/m2, 6,579 mA/m2, 5,707
mA/m2, 6,081 mA/m2, 6,104 mA/m2 and 9,772 mA/m2, respectively (Figure 3 and Table 1).
In the 3rd, 5th, 7th, 9th, 11th, 13th, 15th and 17th weeks, MFC-2 produced the maximum power densities (pmax)
of 1,338 mW/m2, 2,160 mW/m2, 2,642 mW/m2, 3,099 mW/m2, 2,807 mW/m2, 3,137 mW/m2, 2,873 mW/m2
and 2,997 mW/m2, respectively (Figure 2-C). Its optimum current densities (iopt) were 3,774 mA/m2, 7,733
mA/m2, 9,186 mA/m2, 10,040 mA/m2, 9,239 mA/m2, 9,961 mA/m2, 9,838 mA/m2 and 9,838 mA/m2,
respectively. Its maximum current densities (imax) were 3,945 mA/m2, 14,633 mA/m2, 18,152 mA/m2,
20,869 mA/m2, 16,575 mA/m2, 19,350 mA/m2, 19,667 mA/m2 and 18,086 mA/m2, respectively (Figure 3
and Table 1).
In the 3rd, 5th, 7th, 9th, 11th, 13th, 15th and 17th weeks, MFC-3 produced the maximum power densities (pmax)
of 1,029 mW/m2, 2,382 mW/m2, 2,061 mW/m2, 2,527 mW/m2, 2,173 mW/m2, 2,405 mW/m2, 2,362 mW/m2
and 2,374 mW/m2 respectively (Figure 2-E). Its optimum current densities (iopt) were 3,356 mA/m2, 8,498
mA/m2, 7,306 mA/m2, 8,680 mA/m2, 7,566 mA/m2, 8,182 mA/m2, 7,865 mA/m2 and 7,993 mA/m2,
respectively. Its maximum current densities (imax) were 3,844 mA/m2, 16,967 mA/m2, 15,431 mA/m2,
18,271 mA/m2, 15,325 mA/m2, 15,342 mA/m2, 14,603 mA/m2 and 15,567 mA/m2, respectively (Figure 3
and Table 1).
In the 3rd, 5th, 7th, 9th, 11th, 13th, 15th and 17th weeks, MFC-4 produced the maximum power densities (pmax)
of 1,277 mW/m2, 2,327 mW/m2, 2,509 mW/m2, 2,969 mW/m2, 2,684 mW/m2, 3,289 mW/m2, 3,114 mW/m2
and 2,896 mW/m2 respectively (Figure 2-G). Its optimum current densities (iopt) were 3,807 mA/m2, 8,446
mA/m2, 8,622 mA/m2, 9,671 mA/m2, 8,944 mA/m2, 10,591 mA/m2, 10,084 mA/m2 and 9,547 mA/m2,
respectively. Its maximum current densities (imax) were 4,188 mA/m2, 16,642 mA/m2, 18,799 mA/m2,
20,393 mA/m2, 19,174 mA/m2, 19,420 mA/m2, 19,174 mA/m2 and 18,636 mA/m2, respectively (Figure 3
and Table 1).
To sum up, data from actual power production and results from LSV polarization tests showed that all
MFCs started to produce relative stable power and current from the 9th week (Figures 1 and 4). Therefore,
average values were calculated from the 9th week to the 17th week to evaluate the overall cell
performance in this study. Based on actual power production, MFC-4 achieved the highest cell voltage
of 222 ± 9 mV, followed by MFC-2 of 217 ± 29 mV, MFC-3 of 209 ± 12 mV and MFC-1 of 193 ± 36 mV.
Based on LSV polarization results, MFC-4 also achieved the highest power production with a stable
maximum power density of 2,990 ± 228 mW/m2 and maximum current density of 19,359 ± 645 mA/m2,
followed by MFC-2 (2,982 ± 142 mW/m2 and 18,909 ± 1,638 mA/m2, respectively), MFC-3 (2,368 ± 127
mW/m2 and 15,822 ± 1,417 mA/m2, respectively) and MFC-1 ( 837 ± 254 mW/m2 and 6,849 ± 1,663 mA/m2,
respectively).
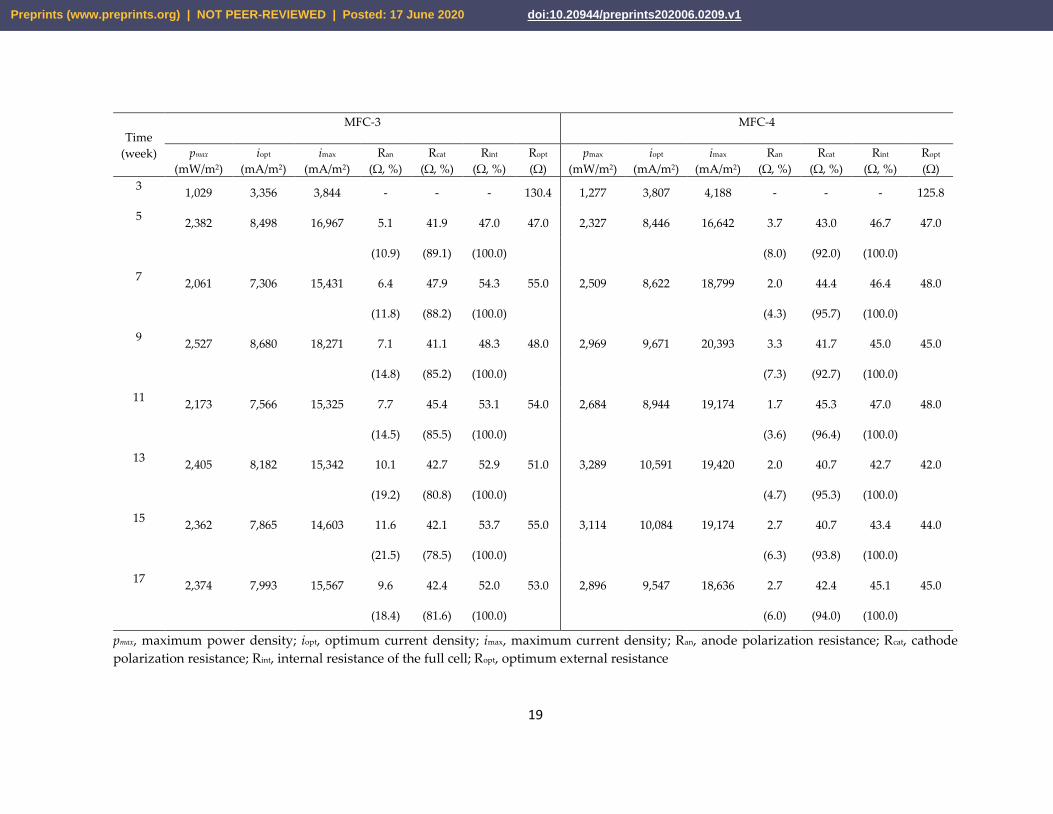
3.3. Polarization resistance
Electrodes polarization resistances, internal resistance of the full cell and optimum external resistance
for maximum power generation were calculated from electrode polarization curves (i.e., Ran, Rcat, Rint,
Ropt, respectively) (Table 1).
In the 5th, 7th, 9th, 11th, 13th, 15th and 17th weeks, MFC-1 showed anode polarization resistances (Ran) of
52.0 Ω, 70.7 Ω, 61.9 Ω, 85.4 Ω, 58.0 Ω, 68.6 Ω and 36.6 Ω, respectively. Its cathode polarization resistances
(Rcat) were 44.9 Ω, 56.9 Ω, 54.6 Ω, 38.7 Ω, 60.1 Ω, 45.9 Ω and 41.4 Ω, respectively. Its full cell internal
Preprints (www.preprints.org) | NOT PEER-REVIEWED | Posted: 17 June 2020 Preprints (www.preprints.org) | NOT PEER-REVIEWED | Posted: 17 June 2020 doi:10.20944/preprints202006.0209.v1
6
resistances (Rint) were 96.9 Ω, 127.6 Ω, 116.4 Ω, 124.1 Ω, 118.1 Ω, 114.4 Ω and 78.0 Ω, respectively. Its
optimum external resistances (Ropt) were 96.0 Ω, 126.0 Ω, 125.0 Ω, 129.0 Ω, 120.0 Ω, 117.0 Ω and 81.0 Ω,
respectively.
In the 5th, 7th, 9th, 11th, 13th, 15th and 17th weeks, MFC-2 showed anode polarization resistances (Ran) of 5.7
Ω, 3.0 Ω, 5.0 Ω, 2.6 Ω, 2.6 Ω, 3.1 Ω and 3.0 Ω, respectively. Its cathode polarization resistances (Rcat) were
45.7 Ω, 42.0 Ω, 39.4 Ω, 44.9 Ω, 41.1 Ω, 37.6 Ω and 41.0 Ω, respectively. Its full cell internal resistances
(Rint) were 51.4 Ω, 45.0 Ω, 44.4 Ω, 47.4 Ω, 43.7 Ω, 40.7 Ω and 44.0 Ω, respectively. Its the optimum external
resistances (Ropt) were 52.0 Ω, 45.0 Ω, 44.0 Ω, 47.0 Ω, 45.0 Ω, 42.0 Ω and 44.0 Ω, respectively.
In the 5th, 7th, 9th, 11th, 13th, 15th and 17th weeks, MFC-3 showed anode polarization resistances (Ran) of 5.1
Ω, 6.4 Ω, 7.1 Ω, 7.7 Ω, 10.1 Ω, 11.6 Ω and 9.6 Ω, respectively. Its cathode polarization resistances (Rcat)
were 41.9 Ω, 47.9 Ω, 41.1 Ω, 45.4 Ω, 42.7 Ω, 42.1 Ω and 42.4 Ω, respectively. Its full cell internal resistances
(Rint) were 47.0 Ω, 54.3 Ω, 48.3 Ω, 53.1 Ω, 52.9 Ω, 53.7 Ω and 52.0 Ω, respectively. Its optimum external
resistances (Ropt) were 47.0 Ω, 55.0 Ω, 48.0 Ω, 54.0 Ω, 51.0 Ω, 55.0 Ω and 53.0 Ω, respectively.
In the 5th, 7th, 9th, 11th, 13th, 15th and 17th weeks, MFC-4 showed anode polarization resistances (Ran) of 3.7
Ω, 2.0 Ω, 3.3 Ω, 1.7 Ω, 2.0 Ω, 2.7 Ω and 2.7 Ω, respectively. Its cathode polarization resistances (Rcat) were
43.0 Ω, 44.4 Ω, 41.7 Ω, 45.3 Ω, 40.7 Ω, 40.7 Ω and 42.4 Ω, respectively. Its full cell internal resistances
(Rint) were 46.7 Ω, 46.4 Ω, 45.0 Ω, 47.0 Ω, 42.7 Ω, 43.4 Ω and 45.1 Ω, respectively. Its optimum external
resistances (Ropt) were 47.0 Ω, 48.0 Ω, 45.0 Ω, 48.0 Ω, 42.0 Ω, 44.0 Ω and 45.0 Ω, respectively.
Since anode characteristics were main objects of this study, anode polarization resistance was
emphatically indicated. To sum up, MFC-1 showed the lowest anode polarization resistance in the 17th
week while MFC-2 showed the lowest anode polarization resistance in the 11th and 13th weeks. MFC-3
and MFC-4 showed the lowest anode polarization resistance in the 5th week and the 11th week,
respectively. We selected the 9th to 17th week as the stable time, consistent with actual operation data
and LSV polarization results. The stable anode polarization resistance, cathode polarization resistance,
full cell internal resistance and optimum external resistance of MFC-1 were 62.1 ± 17.7 Ω, 48.1 ± 9.0 Ω,
110.2 ± 18.4 Ω and 114.4 ± 19.2 Ω, respectively. Those of MFC-2 were 3.3 ± 1.0 Ω, 40.8 ± 2.7 Ω, 44.1 ± 2.4
Ω and 44.4 ± 1.8 Ω, respectively. Those of MFC-3 were 9.2 ± 1.8 Ω, 42.8 ± 1.6 Ω, 52.0 ± 2.2 Ω and 52.2 ±
2.8 Ω, respectively. Those of MFC-4 were 2.5 ± 0.6 Ω, 42.2 ± 1.9 Ω, 44.7 ± 1.7 Ω and 44.8 ± 2.2 Ω,
respectively.
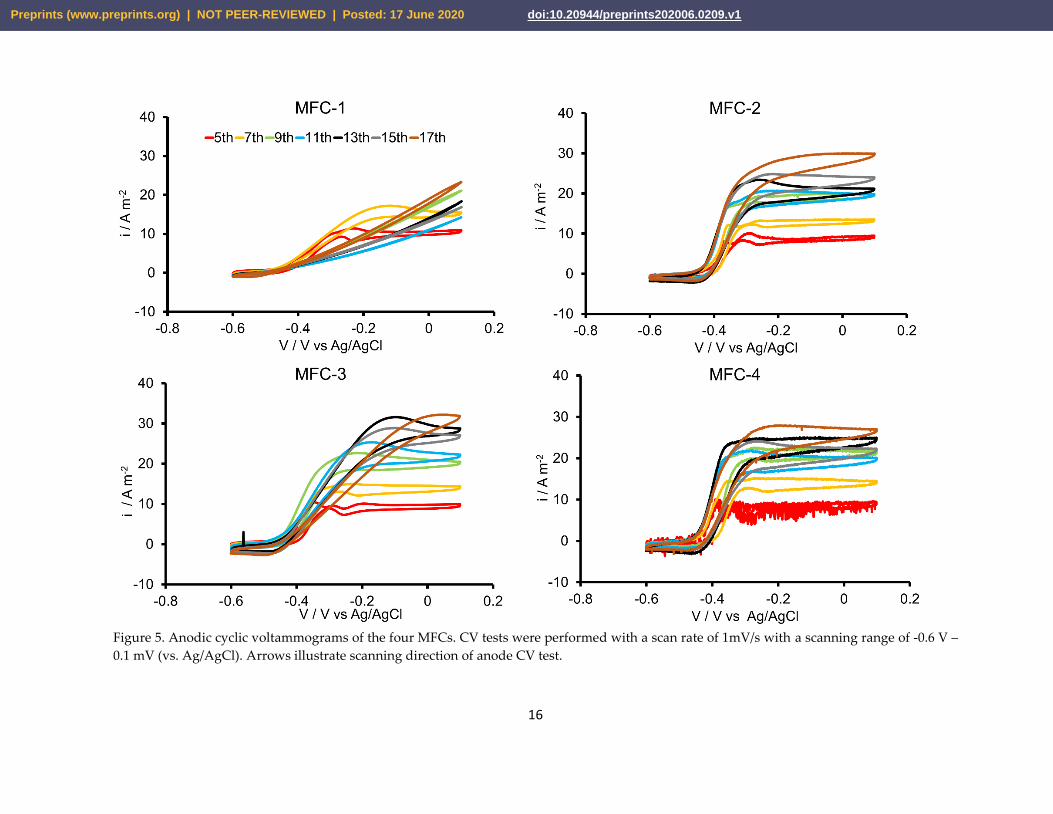
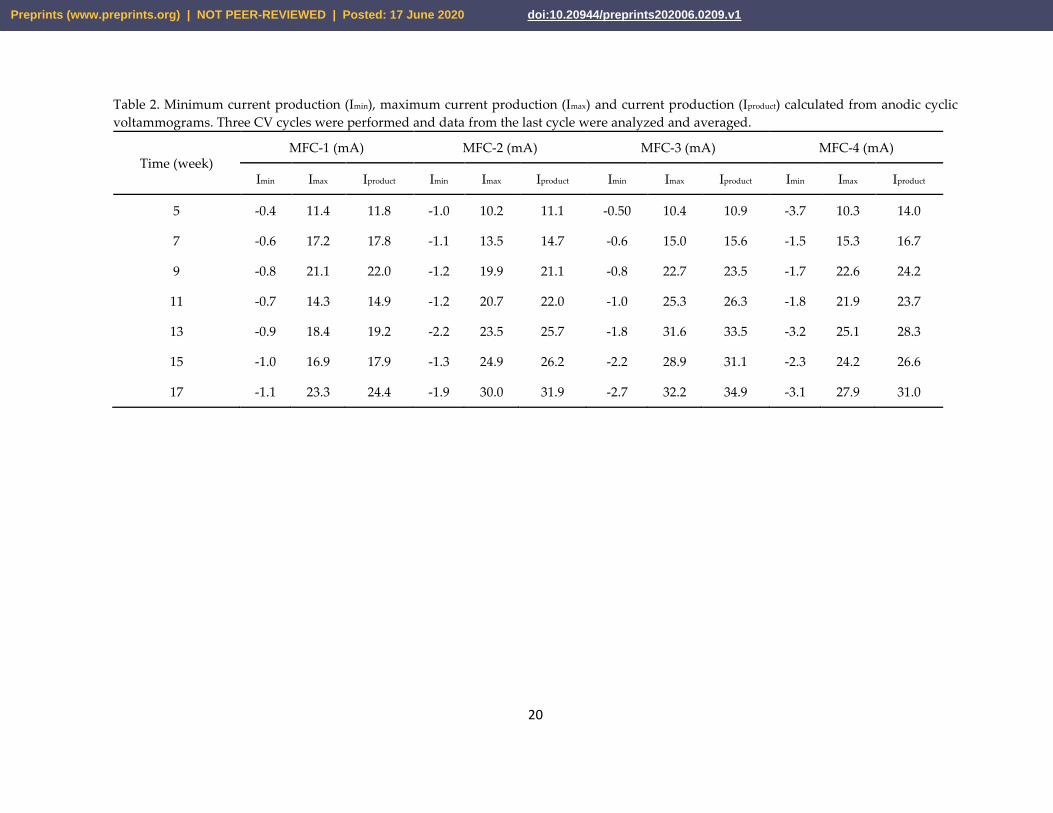
3.4. Cyclic voltammetry test
Anode cyclic voltammetry (CV) experiments were conducted to explore electrocatalytic activities of
four reactors. Anode CV was measured in three cycles. Data of the last cycle were used (Figure 5 and
Table 2). The value of current production (Iproduction) was determined as the difference between the
maximum current production (Imax) and the minimum current production (Imin).
In the 5th, 7th, 9th, 11th, 13th, 15th and 17th weeks, MFC-1 current productions were 11.8 mA, 17.8 mA, 22.0
mA, 14.9 mA, 19.2 mA, 17.9 mA and 24.4 mA, respectively. MFC-2 current productions were 11.1 mA,
14.7 mA, 21.1 mA, 22.0 mA, 25.7 mA, 26.2 mA and 31.9 mA, respectively. MFC-3 current productions
were 10.9 mA, 15.6 mA, 23.5 mA, 26.3 mA, 33.5 mA, 31.1 mA and 34.9 mA, respectively; MFC-4 current
productions were 14.0 mA, 16.7 mA, 24.2 mA, 23.7 mA, 28.3 mA, 26.6 mA and 31.0 mA, respectively.
With increasing operating time, anode current productions in MFC-2, MFC-3 and MFC-4 also increased.
Their cyclic voltammograms showed an S-shape and a current plateau in all measurement time.
Preprints (www.preprints.org) | NOT PEER-REVIEWED | Posted: 17 June 2020 Preprints (www.preprints.org) | NOT PEER-REVIEWED | Posted: 17 June 2020 doi:10.20944/preprints202006.0209.v1
7
However, MFC-1 showed an S-shape and a current plateau in the 5th and 7th weeks. After that, it
produced a cyclic voltammogram close to a straight line, resulting in the lowest current production.
4. Discussion
4.1. Analysis of power overshoot
At the early time of anode maturation period, maximum power densities of all MFCs were quite low.
An unexpected power overshoot phenomenon was observed in all LSV polarization tests in the 3rd week.
This might be because external resistances were too high or because the anode did not have enough
time to be mature [24]. Other factors such as poor acclimation of bioanode to the high external resistance
[25], high cell internal resistance [26, 27]; and immature bioanode, insufficient organic loading, or
insufficient conductivity [28] might have also led to the power overshoot phenomenon. In this study,
the power overshoot phenomenon was explored as type D when the power density doubled back to a
low current density [25]. According to this previous study, type D power overshoot could be excluded
by conducting MFCs with lower external resistance. By using a lower external resistance (i.e., the
optimum external resistance in this study), the biofilm displayed higher electrochemical oxidation and
improved current production. Using the lower external resistance has been the simplest solution to
solve the power overshoot phenomenon. If this method does not help, we could apply other solutions
such as cultivate the anode for a longer time because the immature bioanode at that time could lead to
this phenomenon [28], or we could supply assistance current to the anode [29].
Based on results of LSV polarization tests in the 3rd week, we changed the external resistance from 1,000-
Ω to 100-ohm in MFC-1 and to 50-ohm in MFC-2, MFC-3 and MFC-4. For longer operation time (after 5
weeks), when LSV polarization tests were carried out, the power overshoot situation did not occur again.
It indicated that by using the lower external resistance which evidently affected anode biofilm
communities and properties, current production increased and electron generation depletion in the 3rd
week was eliminated [9].
4.2. Operation cell profile
Actual cell performance is one aspect used to verify three phases of MFCs operation (inoculation phase,
developing phase and stable phase). As can be seen from Figure 1, period of 0-1 week was the
inoculation phase. After one week, when we used synthetic medium instead of wastewater to have
reproducible data, cell voltage showed obvious increases. The duration from when we started to use
PBS medium until the time that cell voltage became stable was established as the developing phase.
During this phase, although high cell voltage was achieved with PBS medium, high external resistance
led to power overshoot and it could adversely affect the anode biofilm. Therefore, the lower external
resistance (i.e., the optimum external resistance) was used for the cell as the solution to solve the power
overshoot problem. Afterward, cell voltage showed decreases gradually until it reached a stable state
from the 9th week. From the 9th week, cell performance slightly vacillated (Fig. 1) and stable phase started.
On average from the 9th week to the 17th week, actual cell voltages of MFC-1, MFC-2, MFC-3 and MFC-
4 were 193 ± 36 mV, 217 ± 29 mV, 209 ± 12 mV and 222 ± 9 mV, respectively.
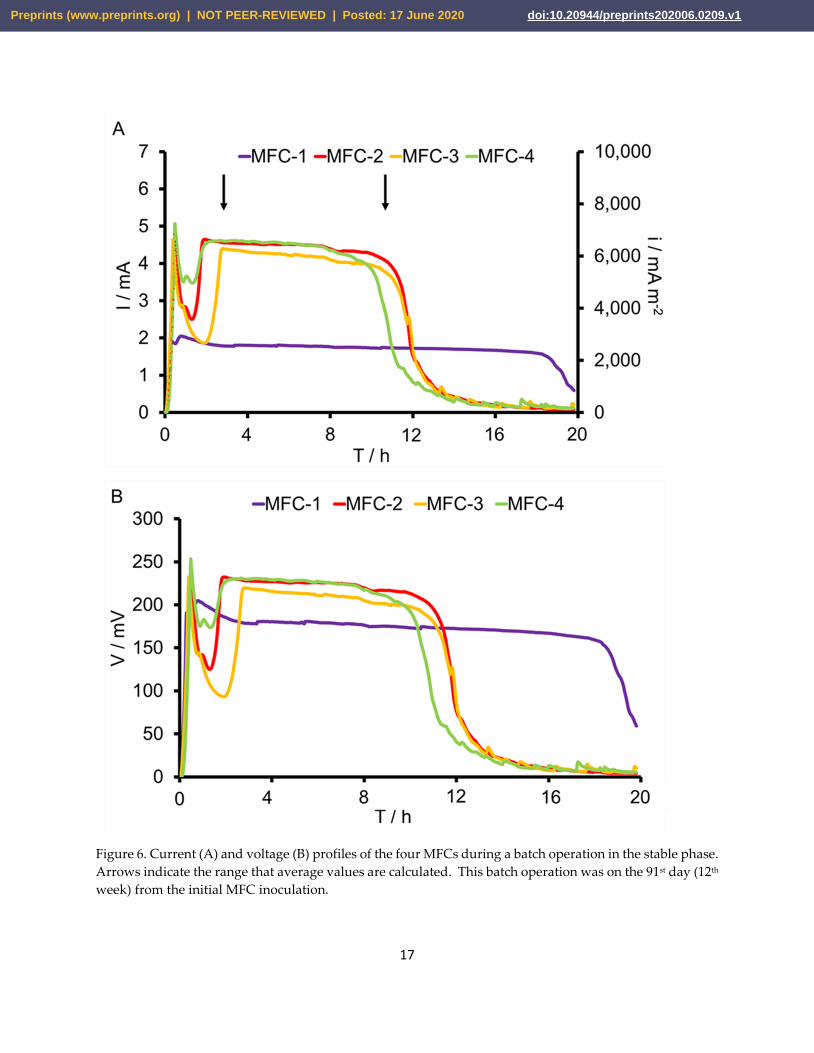
Figure 6 illustrates practical operation of reactors during one batch in the stable phase. Because of the
longer acclimation time with the optimum external resistance than in LSV polarization test, the practical
power output MFCs declined gradually. Average data were calculated from the stable stage (~ 10 h)
when MFCs operated with the optimum external resistance. MFC-1 showed the lowest performance
with an average produced current of 1.8 mA, current density of 2,452 ± 30 mA/m2 and cell voltage of
178 ± 2 mV. The produced current, current density and cell voltage of MFC-2 were 4.5 ± 0.1 mA, 6,374 ±
123 mA/m2 and 223 ± 4 mV, respectively. Those of MFC-3 were 4.2 ± 0.1 mA, 5,995 ± 169 mA/m2 and 210
± 6 mV, respectively. Those of MFC-4 were 4.4 ± 0.2 mA, 6,346 ± 250 mA/m2 and 222 ± 9 mV, respectively.
Preprints (www.preprints.org) | NOT PEER-REVIEWED | Posted: 17 June 2020 Preprints (www.preprints.org) | NOT PEER-REVIEWED | Posted: 17 June 2020 doi:10.20944/preprints202006.0209.v1
8
The longer batch but lower power output of MFC-1 could be evidence of a failed inoculation process,
which could lead to a lower microbial community and slower substrate consumption than that of other
MFCs. There was a sudden drop of power output in the initial time of batch. Based on our lab experience,
this phenomenon could be affected by the cathode. During the operation time, a biofilm was created. It
attached to cathode and reduced cathode performance. Using a new cathode or removing the biofilm
on the cathode surface could solve the drop of the power output.
4.3. Power and current production
MFC systems need certain maturation time to obtain high and stable performances for long-standing
operation afterward. LSV polarization test was conducted because it was a simple and reproducible
method. By using the same test for all MFC systems with the same operation conditions, performance
comparison will become valid and fair [30]. The purpose of LSV polarization test was to: 1) explore the
main tendency performance of MFCs through time, 2) establish the stable phase of MFCs, 3) determine
the time that MFCs achieve highest performance. All LSV polarization tests were conducted on the same
day.
All tested anodes displayed the same operation trend. As shown in figure 4, four MFCs had an unstable
maximum power density during maturation time from initial to the 9th week. From the 3rd week to the
9th week, all MFCs except MFC-1 increased promptly in maximum power density, optimum current
density and maximum current density. On the contrary, MFC-1 performance declined sharply. From
the 9th week, the performances of all MFCs became more stable in general. Performances of all MFCs
showed a tendency toward vacillating around average values. These results were consistent with
practical cell voltage. Hence, we mainly compared average values of all MFCs from the 9th week to the
17th week depending on the stable phase of these cells. The average performance of MFCs during the
stable phase was calculated. Average maximum power density values from the 9th week to the 17th week
for MFC-1, MFC-2, MFC-3 and MFC-4 were 837 ± 254 mW/m2, 2,982 ± 142 mW/m2, 2,368 ± 127 mW/m2,
2,990 ± 228 mW/m2, respectively. Although there were fluctuations, such changes were negligible. These
results indicated that anodes were enriched after mature time so that they could generate stable and
reproducible performances subsequently during the stable time. Current values (optimum current
density and maximum current density) derived from LSV polarization tests were also evidence for the
stable time of anodes. Results generally showed that achieving a stable power production needed at
least 9 weeks (Figure 3 and Table 1).
The highest performance of each MFC during the stable time was determined at different time. MFC-1
obtained the highest maximum power density (1,283 mW/m2) in the 17th week, which was 4.4% higher
than the initial value in the 3rd week (1,229 mW/m2). MFC-2 obtained the highest maximum power
density (3,137 mW/m2) in the 13th week, which was 126% higher than the initial value in the 3rd week
(1,229 mW/m2). MFC-3 obtained the highest maximum power density (2,527 mW/m2) in the 9th week,
which was 146 % higher than the initial value in the 3rd week (1,029 mW/m2). MFC-4 obtained the highest
maximum power density (3,289 mW/m2) in the 13th week, which was 158 % higher than the initial value
in the 3rd week (1,277 mW/m2).
It should be mentioned that in the last week (17th week), the maximum power density of MFC-1
enhanced even higher than its initial one. This change was in good agreement with other reactors. The
lack of a significant power output could be explained by a fail inoculation phase of MFC-1 that would
lead to the low microbial community on the anode surface. Therefore, the adherent microbial
community in the MFC-1 system needed longer time to increase the population and performance. This
MFC-1 might achieve better performance in the future. These results were consistent with those of
Preprints (www.preprints.org) | NOT PEER-REVIEWED | Posted: 17 June 2020 Preprints (www.preprints.org) | NOT PEER-REVIEWED | Posted: 17 June 2020 doi:10.20944/preprints202006.0209.v1
9
previous studies while the time for anode performance achieved the highest power density and became
stable were different.
4.4. Polarization resistances
Because of the power overshoot problem observed in the 3rd week, there were no electrode potential
linear ranges to calculate the polarization resistances. Therefore, polarization resistance were not
calculated for the 3rd week.
As shown in Table 1, anode polarization resistance data indicated that anode could affect the full cell
performance. Anode polarization resistance seemed to be one explanation for the low power production
of MFC-1 and the higher power generation of other MFC reactors. While three-fourths of MFCs with
higher power output (MFC-2, MFC-3 and MFC-4) showed that the anode polarization resistance
accounted for a minor portion of the full cell internal resistance (3.6 – 21.5 %). MFC-1 with a lower
performance showed that anode polarization resistance accounted for a major portion of the full cell
internal resistance (46.9 % - 68.8 %). Anode and cathode were connected to each other. Thus, one had a
main impact on the other, and vice versa. A high ratio of anode resistance to the full cell resistance of
MFC-1 indicated that the anode electrode had a great effect on cathode. This was also clearly shown by
polarization curves (Fig. 1-B, 1-D, 1-F, 1-H). In Figure 1-B corresponding to MFC-1, anode polarization
curve varied sharply, leading to the variation of cathode polarization. The high anode polarization
resistance contributed to a high internal resistance of the full cell and caused a low power production
as a result. In contrast, in MFC-2, MFC-3 and MFC-4 reactors, although cathode polarization resistance
values were similar to that of MFC-1, they accounted for a major portion of the total internal resistance.
In these MFC systems, successful inoculated anode apparently only played a minor role in the overall
MFC performance. It was previously evidenced that mature anodes had a small effect on the MFC
performance in our test. Previous studies have also indicated that MFC performance is mainly affected
by the cathode performance [14]. Hence, making a mature anode is necessary to lower the initial internal
resistance.
For MFC-1 case, from the 17th week, results indicated that both cell internal resistance and anode
polarization resistance decreased. The cathode polarization resistance gradually became similar with
other cathode polarization resistance (45.9 Ω in the 15th week, 41.4 Ω in the 17th week). An intrinsic
adaption of microbes could explain such decrease. Since the same MFC construction, electrodes
configuration and operation conditions were applied to all MFC, evolution of the microbial community
on the anode surface would be one main factor that affected cell internal resistance and anode
polarization resistance. In this MFC-1, microbial community required a longer time than in others MFCs
to adapt to the environment, resulting in a mature biofilm. Because of the intrinsic heterogeneity of
microbes, it will be difficult to predict MFC performance, especially anode. The calculated optimum
external resistance of MFC-1 was unstable over time. Remarkably, the optimum external resistance
decreased significantly in the 17th week, which was corresponding to a power enhancement. It once
more indicated that the microbial community of biofilm in MFC-1 demanded longer time for increment,
thus having a strong effect on the anode function.
4.5. Anode cyclic voltammetry test
To observe electrocatalytic activities of MFC systems, anode CV test was performed for reactors.
Current production data from CV test enhanced over time and introduced the increasing in anode
performance. All reactors in the final week produced the highest current among all periods (Table 2).
In the 17th week, current production of MFC-1 was 24.4 mA, which was 106.8% higher than that in the
3rd week (11.8 mA). Current production of MFC-2 in the 17th week was 31.9 mA, which was increased
187.4% from that in the 3rd week (11.1 mA). Current production MFC-3 in the 17th week was 34.9 mA,
Preprints (www.preprints.org) | NOT PEER-REVIEWED | Posted: 17 June 2020 Preprints (www.preprints.org) | NOT PEER-REVIEWED | Posted: 17 June 2020 doi:10.20944/preprints202006.0209.v1
10
which was increased 220.2% from that in the 3rd week (10.9 mA). For MFC-4, current production in the
17th week was 31 mA, which was increased 121.4% from that in the 3rd week (14 mA). Average current
production from the 9th week to the 17 week of MFC-1, MFC-2, MFC-3 and MFC-4 were 19.7 mA, 25.4
mA, 29.9 mA and 26.8 mA, respectively, with MFC-2, MFC-3 and MFC-4 showing better anode
performance. Our test results indicated that the maturation process had an important effect on anodic
current production. An optimum biofilm on electrode surface can promote anode performance and the
overall MFC system performance afterward. For instance, MFC-1 with bad biofilm also had lower
anodic current production. Measured currents produced by MFC-1 were lower than those produced by
other MFCs, consistent with its lower power production and higher full cell internal resistance as
mentioned above. The same anode after 17 weeks produced higher current, illustrating an ongoing
maturation time. The microorganism community on the anode might become stronger with better
efficiency as the time went by.
Although CV anode indicated an enhance in anode performance by time, LSV polarization test showed
that all MFCs gradually increased their power output until the highest power was reached (MFC-2 in
the 13th week, MFC-3 in the 9th week and MFC-4 in the 13th week) and then decreased slightly afterward.
The long-time cathode operation could be the cause for the reduction in cell performance. Therefore, in
spite of cathode degradation problem encountered in this study, due to the enhanced anode
performance as a reward, we still obtained quite stable cell performance. Results of CV anode tests
showed that all anodes at the 17th week kept producing higher current than previous time.
5. Conclusion
In our study, the effect of anode maturation time appeared to be an initial factor for long-term MFC
operation afterward. In practice, a brush anode was used to determine how long a single-chamber MFC
system could accomplish the maximum and stable performances. One of the worth results was that one
of our four anodes might have a failed inoculation process. It meant that the successful inoculation
percentage was 75%. An immature anode could lead to a high full cell internal resistance, resulting in a
low power production. An ideal anode should have a small effect on a full cell power output while
cathode performance has a main impact on MFC performance. Although LSV polarization test implied
that after 9 weeks from the initial inoculation, the power generation became stable, CV anode test
indicated that anode performance kept increasing after 17 weeks. Due to the correlation between
cathode and anode performances, the enhancement of anode performance could compensate the
degradation of cathode performance and led to the quite stable overall cell performance. Hence, in our
study, an inoculated anode needed more than 17 weeks to attain the fully mature state.
Preprints (www.preprints.org) | NOT PEER-REVIEWED | Posted: 17 June 2020 Preprints (www.preprints.org) | NOT PEER-REVIEWED | Posted: 17 June 2020 doi:10.20944/preprints202006.0209.v1

11
Acknowledgments
This research was funded by Basic Science Research Program through the National Research
Foundation of Korea (NRF) funded by the Ministry of Education (NRF-2018R1D1MFC-1B07050567) and
a research grant from Gwangju Green Environment Center in Ministry of Environment (17-04-10-14-12).
Preprints (www.preprints.org) | NOT PEER-REVIEWED | Posted: 17 June 2020 Preprints (www.preprints.org) | NOT PEER-REVIEWED | Posted: 17 June 2020 doi:10.20944/preprints202006.0209.v1
12
Figure 1. Average voltage of all MFCs operated with different medium and external resistance.
Preprints (www.preprints.org) | NOT PEER-REVIEWED | Posted: 17 June 2020 Preprints (www.preprints.org) | NOT PEER-REVIEWED | Posted: 17 June 2020 doi:10.20944/preprints202006.0209.v1
13
Figure 2. Power density curves and electrodes polarization curves of all MFCs. An LSV polarization test
with a scan rate of 1mV/s was performed at designated time (3rd – 17th week)
Preprints (www.preprints.org) | NOT PEER-REVIEWED | Posted: 17 June 2020 Preprints (www.preprints.org) | NOT PEER-REVIEWED | Posted: 17 June 2020 doi:10.20944/preprints202006.0209.v1
14
Figure 3. Maximum power density (pmax), optimum current density (iopt) and maximum current density (imax) of four MFCs. LSV polarization tests
were performed with a scan rate of 1mV/s.
Preprints (www.preprints.org) | NOT PEER-REVIEWED | Posted: 17 June 2020 Preprints (www.preprints.org) | NOT PEER-REVIEWED | Posted: 17 June 2020 doi:10.20944/preprints202006.0209.v1
15
Figure 4. Maximum power density of the four MFCs during the test period.
Preprints (www.preprints.org) | NOT PEER-REVIEWED | Posted: 17 June 2020 Preprints (www.preprints.org) | NOT PEER-REVIEWED | Posted: 17 June 2020 doi:10.20944/preprints202006.0209.v1
16
Figure 5. Anodic cyclic voltammograms of the four MFCs. CV tests were performed with a scan rate of 1mV/s with a scanning range of -0.6 V –
0.1 mV (vs. Ag/AgCl). Arrows illustrate scanning direction of anode CV test.
Preprints (www.preprints.org) | NOT PEER-REVIEWED | Posted: 17 June 2020 Preprints (www.preprints.org) | NOT PEER-REVIEWED | Posted: 17 June 2020 doi:10.20944/preprints202006.0209.v1
17
Figure 6. Current (A) and voltage (B) profiles of the four MFCs during a batch operation in the stable phase.
Arrows indicate the range that average values are calculated. This batch operation was on the 91st day (12th
week) from the initial MFC inoculation.
Preprints (www.preprints.org) | NOT PEER-REVIEWED | Posted: 17 June 2020 Preprints (www.preprints.org) | NOT PEER-REVIEWED | Posted: 17 June 2020 doi:10.20944/preprints202006.0209.v1
18
Table 1. Electrochemical data calculated from polarization data of the four MFCs. Values in brackets illustrate percentages of individual electrode
polarization resistance to the total internal resistance.
Time
(week)
MFC-1 MFC-2
pmax
(mW/m2)
iopt
(mA/m2)
imax
(mA/m2)
Ran
(Ω, %)
Rcat
(Ω, %)
Rint
(Ω, %)
Ropt
(Ω)
pmax
(mW/m2)
iopt
(mA/m2)
imax
(mA/m2)
Ran
(Ω, %)
Rcat
(Ω, %)
Rint
(Ω, %)
Ropt
(Ω)
3 1,229 3,610 3,918 - - - 134.8 1,388 3,774 3,945 - - - 139.2
5 1,050 3,957 8,158 52.0
(53.7)
44.9 96.9 96.0 2,160 7,733 14,633 5.7 45.7 51.4 52.0
(46.3) (100.0)
(11.1) (88.9) (100.0)
7 577 2,559 5,249 70.7 56.9 127.6 126.0 2,642 9,186 18,152 3.0 42.0 45.0 45.0
(55.4) (44.6) (100.0)
(6.7) (93.3) (100.0)
9 798 3,025 6,579 61.9 54.6 116.4 125.0 3,099 10,040 20,869 5.0 39.4 44.4 44.0
(53.1) (46.9) (100.0)
(11.3) (88.7) (100.0)
11 662 2,708 5,707 85.4 38.7 124.1 129.0 2,807 9,239 16,575 2.6 44.9 47.4 47.0
(68.8) (31.2) (100.0)
(5.4) (94.6) (100.0)
13 732 2,946 6,081 58.0 60.1 118.1 120.0 3,137 9,961 19,350 2.6 41.1 43.7 45.0
(49.1) (50.9) (100.0)
(5.9) (94.1) (100.0)
15 710 2,942 6,104 68.6 45.9 114.4 117.0 2,873 9,838 19,667 3.1 37.6 40.7 42.0
(59.9) (40.1) (100.0)
(7.7) (92.3) (100.0)
17 1,283 4,747 9,772 36.6 41.4 78.0 81.0 2,997 9,838 18,086 3.0 41.0 44.0 44.0
(46.9) (53.1) (100.0)
(6.8) (93.2) (100.0)
Preprints (www.preprints.org) | NOT PEER-REVIEWED | Posted: 17 June 2020 Preprints (www.preprints.org) | NOT PEER-REVIEWED | Posted: 17 June 2020 doi:10.20944/preprints202006.0209.v1
19
Time
(week)
MFC-3 MFC-4
pmax
(mW/m2)
iopt
(mA/m2)
imax
(mA/m2)
Ran
(Ω, %)
Rcat
(Ω, %)
Rint
(Ω, %)
Ropt
(Ω)
pmax
(mW/m2)
iopt
(mA/m2)
imax
(mA/m2)
Ran
(Ω, %)
Rcat
(Ω, %)
Rint
(Ω, %)
Ropt
(Ω)
3 1,029 3,356 3,844 - - - 130.4 1,277 3,807 4,188 - - - 125.8
5 2,382 8,498 16,967 5.1 41.9 47.0 47.0 2,327 8,446 16,642 3.7 43.0 46.7 47.0
(10.9) (89.1) (100.0) (8.0) (92.0) (100.0)
7 2,061 7,306 15,431 6.4 47.9 54.3 55.0 2,509 8,622 18,799 2.0 44.4 46.4 48.0
(11.8) (88.2) (100.0) (4.3) (95.7) (100.0)
9 2,527 8,680 18,271 7.1 41.1 48.3 48.0 2,969 9,671 20,393 3.3 41.7 45.0 45.0
(14.8) (85.2) (100.0) (7.3) (92.7) (100.0)
11 2,173 7,566 15,325 7.7 45.4 53.1 54.0 2,684 8,944 19,174 1.7 45.3 47.0 48.0
(14.5) (85.5) (100.0) (3.6) (96.4) (100.0)
13 2,405 8,182 15,342 10.1 42.7 52.9 51.0 3,289 10,591 19,420 2.0 40.7 42.7 42.0
(19.2) (80.8) (100.0) (4.7) (95.3) (100.0)
15 2,362 7,865 14,603 11.6 42.1 53.7 55.0 3,114 10,084 19,174 2.7 40.7 43.4 44.0
(21.5) (78.5) (100.0) (6.3) (93.8) (100.0)
17 2,374 7,993 15,567 9.6 42.4 52.0 53.0 2,896 9,547 18,636 2.7 42.4 45.1 45.0
(18.4) (81.6) (100.0) (6.0) (94.0) (100.0)
pmax, maximum power density; iopt, optimum current density; imax, maximum current density; Ran, anode polarization resistance; Rcat, cathode
polarization resistance; Rint, internal resistance of the full cell; Ropt, optimum external resistance
Preprints (www.preprints.org) | NOT PEER-REVIEWED | Posted: 17 June 2020 Preprints (www.preprints.org) | NOT PEER-REVIEWED | Posted: 17 June 2020 doi:10.20944/preprints202006.0209.v1
20
Table 2. Minimum current production (Imin), maximum current production (Imax) and current production (Iproduct) calculated from anodic cyclic
voltammograms. Three CV cycles were performed and data from the last cycle were analyzed and averaged.
Time (week) MFC-1 (mA) MFC-2 (mA) MFC-3 (mA) MFC-4 (mA)
Imin Imax Iproduct Imin Imax Iproduct Imin Imax Iproduct Imin Imax Iproduct
5 -0.4 11.4 11.8 -1.0 10.2 11.1 -0.50 10.4 10.9 -3.7 10.3 14.0
7 -0.6 17.2 17.8 -1.1 13.5 14.7 -0.6 15.0 15.6 -1.5 15.3 16.7
9 -0.8 21.1 22.0 -1.2 19.9 21.1 -0.8 22.7 23.5 -1.7 22.6 24.2
11 -0.7 14.3 14.9 -1.2 20.7 22.0 -1.0 25.3 26.3 -1.8 21.9 23.7
13 -0.9 18.4 19.2 -2.2 23.5 25.7 -1.8 31.6 33.5 -3.2 25.1 28.3
15 -1.0 16.9 17.9 -1.3 24.9 26.2 -2.2 28.9 31.1 -2.3 24.2 26.6
17 -1.1 23.3 24.4 -1.9 30.0 31.9 -2.7 32.2 34.9 -3.1 27.9 31.0
Preprints (www.preprints.org) | NOT PEER-REVIEWED | Posted: 17 June 2020 Preprints (www.preprints.org) | NOT PEER-REVIEWED | Posted: 17 June 2020 doi:10.20944/preprints202006.0209.v1
21
References
1. Potter, Michael C. "Electrical Effects Accompanying the Decomposition of Organic Compounds."
Proceedings of the royal society of London. Series b, containing papers of a biological character
84, no. 571 (1911): 260-76.
2. Kim, Byung-Hong, Hyung-Joo Kim, Moon-Sik Hyun, and Doo-Hyun Park. "Direct Electrode
Reaction of Fe (Iii)-Reducing Bacterium, Shewanella Putrefaciens." Journal of Microbiology and
Biotechnology 9 (1999): 127-31.
3. Kim, Byung Hong, HS Park, HJ Kim, GT Kim, IS Chang, J Lee, and NT Phung. "Enrichment of
Microbial Community Generating Electricity Using a Fuel-Cell-Type Electrochemical Cell."
Applied microbiology and biotechnology 63, no. 6 (2004): 672-81.
4. Bond, Daniel R, and Derek R Lovley. "Electricity Production by Geobacter Sulfurreducens
Attached to Electrodes." Appl. Environ. Microbiol. 69, no. 3 (2003): 1548-55.
5. Jung, Sokhee Philemon. "Practical Implementation of Microbial Fuel Cells for Bioelectrochemical
Wastewater Treatment." J. Korean Soc. Urban Envrion 13, no. 2 (2013): 93-100.
6. Lee, Taeho, Akihiro Okamoto, Sokhee Jung, Ryuhei Nakamura, Jung Rae Kim, Kazuya Watanabe,
and Kazuhito Hashimoto. "Microbial Electrochemical Technologies Producing Electricity and
Valuable Chemicals from Biodegradation of Waste Organic Matters." In Manual of Environmental
Microbiology, Fourth Edition, edited by Nakatsu C Yates M, Miller R, Pillai S, 5.1.4-1-5.1.4-14:
American Society of Microbiology, 2016.
7. Jung, Sokhee P., and Soumya Pandit. "Chapter 3.1 - Important Factors Influencing Microbial Fuel
Cell Performance." In Microbial Electrochemical Technology, edited by S. Venkata Mohan, Sunita
Varjani and Ashok Pandey, 377-406: Elsevier, 2019.
8. Pandit, Soumya, Nishit Savla, and Sokhee P. Jung. "16 - Recent Advancements in Scaling up
Microbial Fuel Cells." In Integrated Microbial Fuel Cells for Wastewater Treatment, edited by
Preprints (www.preprints.org) | NOT PEER-REVIEWED | Posted: 17 June 2020 Preprints (www.preprints.org) | NOT PEER-REVIEWED | Posted: 17 June 2020 doi:10.20944/preprints202006.0209.v1
22
Rouzbeh Abbassi, Asheesh Kumar Yadav, Faisal Khan and Vikram Garaniya, 349-68:
Butterworth-Heinemann, 2020.
9. Jung, Sokhee, and John M Regan. "Influence of External Resistance on Electrogenesis,
Methanogenesis, and Anode Prokaryotic Communities in Microbial Fuel Cells." Applied and
environmental microbiology 77, no. 2 (2011): 564-71.
10. Ping, Fang Herbert Han, and Zhang Tong. Anaerobic Biotechnology: Environmental Protection
and Resource Recovery: World Scientific, 2015.
11. Kim, Jung Rae, Sok Hee Jung, John M Regan, and Bruce E Logan. "Electricity Generation and
Microbial Community Analysis of Alcohol Powered Microbial Fuel Cells." Bioresource
technology 98, no. 13 (2007): 2568-77.
12. Jung, Sokhee, and John M Regan. "Comparison of Anode Bacterial Communities and Performance
in Microbial Fuel Cells with Different Electron Donors." Applied microbiology and biotechnology
77, no. 2 (2007): 393-402.
13. Liu, Hong, Shaoan Cheng, Liping Huang, and Bruce E Logan. "Scale-up of Membrane-Free Single-
Chamber Microbial Fuel Cells." Journal of Power Sources 179, no. 1 (2008): 274-79.
14. Feng, Yujie, Xin Wang, Bruce E Logan, and He Lee. "Brewery Wastewater Treatment Using Air-
Cathode Microbial Fuel Cells." Applied microbiology and biotechnology 78, no. 5 (2008): 873-80.
15. Aelterman, Peter, Korneel Rabaey, Hai The Pham, Nico Boon, and Willy Verstraete. "Continuous
Electricity Generation at High Voltages and Currents Using Stacked Microbial Fuel Cells."
Environmental science & technology 40, no. 10 (2006): 3388-94.
16. Liu, Hong, and Bruce E Logan. "Electricity Generation Using an Air-Cathode Single Chamber
Microbial Fuel Cell in the Presence and Absence of a Proton Exchange Membrane." Environmental
science & technology 38, no. 14 (2004): 4040-46.
17. Nam, Taehui, Sunghoon Son, Bonyoung Koo, Huong Viet Hoa Tran, Jung Rae Kim, Yonghoon
Choi, and Sokhee P Jung. "Comparative Evaluation of Performance and Electrochemistry of
Preprints (www.preprints.org) | NOT PEER-REVIEWED | Posted: 17 June 2020 Preprints (www.preprints.org) | NOT PEER-REVIEWED | Posted: 17 June 2020 doi:10.20944/preprints202006.0209.v1
23
Microbial Fuel Cells with Different Anode Structures and Materials." international journal of
hydrogen energy 42, no. 45 (2017): 27677-84.
18. Yang, Wulin, Weihua He, Fang Zhang, Michael A Hickner, and Bruce E Logan. "Single-Step
Fabrication Using a Phase Inversion Method of Poly (Vinylidene Fluoride)(Pvdf) Activated Carbon
Air Cathodes for Microbial Fuel Cells." Environmental Science & Technology Letters 1, no. 10
(2014): 416-20.
19. Feng, Yujie, Qiao Yang, Xin Wang, and Bruce E Logan. "Treatment of Carbon Fiber Brush Anodes
for Improving Power Generation in Air–Cathode Microbial Fuel Cells." Journal of Power Sources
195, no. 7 (2010): 1841-44.
20. Kang, Heunggu, Jaesik Jeong, Prabuddha L Gupta, and Sokhee P Jung. "Effects of Brush-Anode
Configurations on Performance and Electrochemistry of Microbial Fuel Cells." international
journal of hydrogen energy 42, no. 45 (2017): 27693-700.
21. Zhang, Fang, Jia Liu, Ivan Ivanov, Marta C Hatzell, Wulin Yang, Yongtae Ahn, and Bruce E Logan.
"Reference and Counter Electrode Positions Affect Electrochemical Characterization of Bioanodes
in Different Bioelectrochemical Systems." Biotechnology and bioengineering 111, no. 10 (2014):
1931-39.
22. Jung, Sokhee P, Eojin Kim, and Bonyoung Koo. "Effects of Wire-Type and Mesh-Type Anode
Current Collectors on Performance and Electrochemistry of Microbial Fuel Cells." Chemosphere
209 (2018): 542-50.
23. Jung, Sokhee. "Impedance Analysis of Geobacter Sulfurreducens Pca, Shewanella Oneidensis Mr-
1, and Their Coculture in Bioeletrochemical Systems." Int J Electrochem Sci 7, no. 11 (2012):
11091-100.
24. Koo, Bonyoung , Heunggu Kang, Taehui Nam, Eojin Kim, Sunghun Son, and Sokhee Philemon
Jung. "Performance Enhancement of a Microbial Fuel Cell by Physico-Chemical Treatments of
Preprints (www.preprints.org) | NOT PEER-REVIEWED | Posted: 17 June 2020 Preprints (www.preprints.org) | NOT PEER-REVIEWED | Posted: 17 June 2020 doi:10.20944/preprints202006.0209.v1
24
Activated-Carbon Catalyst of an Air Cathode." Journal of the Korean Society of Urban
Environment 16, no. 4 (2016): 431-39.
25. Hong, Yiying, Douglas F Call, Craig M Werner, and Bruce E Logan. "Adaptation to High Current
Using Low External Resistances Eliminates Power Overshoot in Microbial Fuel Cells." Biosensors
and Bioelectronics 28, no. 1 (2011): 71-76.
26. Ieropoulos, Ioannis, Jonathan Winfield, and John Greenman. "Effects of Flow-Rate, Inoculum and
Time on the Internal Resistance of Microbial Fuel Cells." Bioresource technology 101, no. 10
(2010): 3520-25.
27. Liu, Lihong, Chin-Yu Lee, Kuo-Chuan Ho, Po-Chin Nien, Ay Su, Aijie Wang, Nanqi Ren, and
Duu-Jong Lee. "Occurrence of Power Overshoot for Two-Chambered Mfc at Nearly Steady-State
Operation." international journal of hydrogen energy 36, no. 21 (2011): 13896-99.
28. Winfield, Jonathan, Ioannis Ieropoulos, John Greenman, and Julian Dennis. "The Overshoot
Phenomenon as a Function of Internal Resistance in Microbial Fuel Cells." Bioelectrochemistry 81,
no. 1 (2011): 22-27.
29. Kim, Bongkyu, Junyeong An, and In Seop Chang. "Elimination of Power Overshoot at Bioanode
through Assistance Current in Microbial Fuel Cells." ChemSusChem 10, no. 3 (2017): 612-17.
30. Koo, Bonyoung, Seung-Mok Lee, Sang-Eun Oh, Eun Jung Kim, Yuhoon Hwang, Dongjune Seo,
Jin Young Kim, Yung Ho Kahng, Yong Woon Lee, and Seon-Yong Chung. "Addition of Reduced
Graphene Oxide to an Activated-Carbon Cathode Increases Electrical Power Generation of a
Microbial Fuel Cell by Enhancing Cathodic Performance." Electrochimica Acta 297 (2019): 613-
22.
Preprints (www.preprints.org) | NOT PEER-REVIEWED | Posted: 17 June 2020 Preprints (www.preprints.org) | NOT PEER-REVIEWED | Posted: 17 June 2020 doi:10.20944/preprints202006.0209.v1