Effect of Farmyard Manure and Inorganic Fertilizers on the
27
American Journal of Research Communication www.usa-journals.com Effect of Farmyard Manure and Inorganic Fertilizers on the Growth, Yield and Moisture Stress Tolerance of Rain-fed Lowland Rice Tilahun-Tadesse F 1* , Nigussie-Dechassa R 2 , Wondimu Bayu 3 , Setegn Gebeyehu 4 1 Amhra Region Agricultural Research Institute, Ethiopia. 2 Haramaya University, Ethiopia 3 ICARDA, Ethiopia. 4 Ethiopian Institute of Agricultural Research, Ethiopia * Corresponding author: [email protected] Abstract The effect of integrated farmyard manure (FYM) and inorganic nitrogen (N) and phosphorous (P) fertilizers on growth, yield, and terminal moisture stress tolerance of rain-fed lowland rice was assessed in a field experiment carried out at Fogera plains, in north-western Ethiopia during the main cropping seasons of 2010 and 2011. Treatments were factorial combinations of three rates of FYM (0, 7.5, and 15 t ha -1 ), three rates of nitrogen (0, 60, 120 kg N ha -1 ) and three rates of phosphorus (0, 50, and 100 kg P 2 O 5 ha -1 ). The experiment was laid out as a randomized complete block design replicated three times per treatment. Data were collected on rice yield and yield components. Leaf area index (LAI), Crop Growth Rate (CGR), Net Assimilation Rate (NAR) and harvest index (HI) were computed. Economic analysis was also performed by estimating costs of alternative uses of FYM and inorganic fertilizers as well as grain and straw prices. Analysis of the results revealed that applying FYM at 15 t ha -1 combined with 120 kg N ha -1 and 100 kg P 2 O 5 ha -1 increased grain yield by 123% and 38% compared to the negative (0- 0-0 kg ha -1 FYM-N-P 2 O 5 ) and positive (0-120-100 kg ha -1 FYM-N-P 2 O 5 ) controls, respectively. Similarly; LAI, CGR, NAR, the number of filled spikelets per panicle, N and P uptake,biomass yield, and grain protein content as well as agrophysiological efficiency of N and P were significantly enhanced in response to increasing the rates of FYM and inorganic N and P fertilizers. It was observed that 15 t ha -1 FYM combined with 120 kg N ha -1 and 100 kg P 2 O 5 ha -1 resulted in the maximum grain yield, grain protein content, and terminal moisture stress escape. Though grain yield continued increasing significantly upto the highest combinations, results of the economic analysis showed that the maximum net benefit was obtained in response to the application of 7.5 t ha -1 FYM combined with 120 kg N ha -1 and 100 kg P 2 O 5 ha -1 . Key words: FYM, integrated,lowland, nitrogen, phosphorous, rain-fed, rice. Tilahun, et al., 2013: Vol 1 (4) [email protected] 275
Transcript of Effect of Farmyard Manure and Inorganic Fertilizers on the

American Journal of Research Communication www.usa-journals.com
Effect of Farmyard Manure and Inorganic Fertilizers on the Growth, Yield
and Moisture Stress Tolerance of Rain-fed Lowland Rice
Tilahun-Tadesse F1*, Nigussie-Dechassa R2, Wondimu Bayu3, Setegn Gebeyehu4
1Amhra Region Agricultural Research Institute, Ethiopia. 2Haramaya University, Ethiopia 3ICARDA, Ethiopia. 4Ethiopian Institute of Agricultural Research, Ethiopia
*Corresponding author: [email protected]
Abstract
The effect of integrated farmyard manure (FYM) and inorganic nitrogen (N) and phosphorous
(P) fertilizers on growth, yield, and terminal moisture stress tolerance of rain-fed lowland rice
was assessed in a field experiment carried out at Fogera plains, in north-western Ethiopia during
the main cropping seasons of 2010 and 2011. Treatments were factorial combinations of three
rates of FYM (0, 7.5, and 15 t ha-1), three rates of nitrogen (0, 60, 120 kg N ha-1) and three rates
of phosphorus (0, 50, and 100 kg P2O5 ha-1). The experiment was laid out as a randomized
complete block design replicated three times per treatment. Data were collected on rice yield and
yield components. Leaf area index (LAI), Crop Growth Rate (CGR), Net Assimilation Rate
(NAR) and harvest index (HI) were computed. Economic analysis was also performed by
estimating costs of alternative uses of FYM and inorganic fertilizers as well as grain and straw
prices. Analysis of the results revealed that applying FYM at 15 t ha-1 combined with 120 kg N
ha-1 and 100 kg P2O5 ha-1 increased grain yield by 123% and 38% compared to the negative (0-
0-0 kg ha-1 FYM-N-P2O5) and positive (0-120-100 kg ha-1 FYM-N-P2O5) controls, respectively.
Similarly; LAI, CGR, NAR, the number of filled spikelets per panicle, N and P uptake,biomass
yield, and grain protein content as well as agrophysiological efficiency of N and P were
significantly enhanced in response to increasing the rates of FYM and inorganic N and P
fertilizers. It was observed that 15 t ha-1 FYM combined with 120 kg N ha-1 and 100 kg P2O5 ha-1
resulted in the maximum grain yield, grain protein content, and terminal moisture stress escape.
Though grain yield continued increasing significantly upto the highest combinations, results of
the economic analysis showed that the maximum net benefit was obtained in response to the
application of 7.5 t ha-1 FYM combined with 120 kg N ha-1 and 100 kg P2O5 ha-1.
Key words: FYM, integrated,lowland, nitrogen, phosphorous, rain-fed, rice.
Tilahun, et al., 2013: Vol 1 (4) [email protected]
275

American Journal of Research Communication www.usa-journals.com
{Citation: Tilahun-Tadesse F, Nigussie-Dechassa R, Wondimu Bayu, Setegn Gebeyehu. Effect
of farmyard manure and inorganic fertilizers on the growth, yield and moisture stress tolerance
of rain-fed lowland rice. American Journal of Research Communication, 2013: Vol 1 (4): 275-
301} www.usa-journals.com, ISSN: 2325-4076.
1. Introduction
Rice (Oryza sativa L.) is the most important cereal crop in the world. The crop is a staple food
crop for nearly half of the world’s population, most of whom living in developing countries. Rice
is mostly grown in the lowlands under fully irrigated or rain-fed conditions. Rain-fed lowland
rice occupies approximately 35% of the global rice area. Moisture stress and multiple nutrient
deficiencies are among the key factors constraining sustainable rain-fed rice production in many
countries (Satyanarayana et al., 2002). It is estimated that 50% of the world rice production is
affected more or less by drought. As the global climate change continues, water shortage and
drought have become an increasingly serious constraints limiting rice production worldwide
(Guan et al., 2010). Rice is particularly sensitive to drought stress and even mild drought stress
can result in significant yield reduction (Guan et al., 2010). Flowering and heading are the most
sensitive stages to drought as water stress at these stages leads to high spikelet sterility (Tsuda et
al., 2010). Once sterility occurs, there is no way for the plant to compensate, thus incomplete
grain filling and finally greater yield reduction is inevitable (Yoshida 1981; Tsuda et al., 2010).
To combat the challenges of drought, various adaptation strategies such as establishment of
irrigation facilities, rain water harvesting, and use of drought resistant rice varieties have been
used (Haefele and Bouman, 2009; Guan et al., 2010; Dejene and Lemlem, 2012). Another
important mechanism to moderate drought damage is improved nutrient management (Haefele
and Bouman, 2009). There are strong indications for the positive interactions between plant
nutrient status and yield performance under drought (Haefele and Bouman, 2009). Mineral-
nutrient status of plants plays a critical role in increasing plant resistance to drought stress
(Haefele and Bouman, 2009; Tsuda et al., 2010; Waraich et al., 2011). Under low nutrient
concentrations in soil, plants have to absorb more water to be able to take up the same amount of
mineral nutrients than they would from soil with satisfactory fertility (Waraich et al., 2011).
Tilahun, et al., 2013: Vol 1 (4) [email protected]
276
American Journal of Research Communication www.usa-journals.com
Even in intensive cultivation with excessive use of chemical fertilizers, reduction in soil fertility
and yield of rice has become common (Singh and Singh, 2000; Satyanarayana et al., 2002).
Continuous use of inorganic fertilizers leads to deterioration in soil chemical and physical
properties, biological activity and generally in soil health (Mahajan et al., 2008). Nutrients
supplied exclusively through chemical sources, though enhance yield initially, lead to
unsustainable productivity over the years (Satyanarayana et al., 2002; Mahajan et al., 2008). The
negative impacts of chemical fertilizers, coupled with their high prices, have prompted the
interest in the use of organic fertilizers as source of nutrients (Satyanarayana et al., 2002;
Mahajan et al., 2008). Organic materials such as FYM have traditionally been used by rice
farmers (Satyanarayana et al., 2002). FYM application has been reported to improve crop growth
by supplying plant nutrients including micronutrients as well as improving soil physical,
chemical, and biological properties (Dejene and Lemlem, 2012). FYM provides a better
environment for root development by improving the soil structure. Ibrahim et al. (2010) reported
a significant increase in rice root length and root volume with FYM application which indicates
that the better root development would allow the plant to exploit more water under water stress
conditions (Dejene and Lemlem, 2012). Faster water infiltration rate due to enhanced soil
aggregation is the other benefit of FYM amendments to soil (Bhatacharyya et al., 2008). In this
way, water becomes available to rice plants for a longer duration. Under conditions of drought,
plants supplied with FYM will take longer time to wilt than plants not supplied with the organic
fertilizer (Singh and Singh, 2000). Nevertheless, animal manures cannot meet crop nutrient
demands over large areas because they contain limited quantities of available nutrients and are
labour-intensive for processing and application due to their bulky nature (Jobe, 2003).
Many research findings have shown that neither inorganic fertilizers nor organic sources alone
can result in sustainable productivity (Satyanarayana et al., 2002; Jobe, 2003). Furthermore, the
price of inorganic fertilizers is increasing and becoming unaffordable for resource-poor
smallholder farmers. The best remedy for soil fertility management is, therefore, a combination
of both inorganic and organic fertilizers, where the inorganic fertilizer provides nutrients and the
organic fertilizer mainly increases soil organic matter and improves soil structure and buffering
capacity of the soil (Jobe, 2003). The combined application of inorganic and organic fertilizers,
usually termed integrated nutrient management, is widely recognized as a way of increasing
Tilahun, et al., 2013: Vol 1 (4) [email protected]
277

American Journal of Research Communication www.usa-journals.com
yield and or improving productivity of the soil sustainably (Mahajan et al., 2008). Several
researchers (Singh and Singh, 2000; Mahajan et al., 2008) have demonstrated the beneficial
effect of integrated nutrient management in mitigating the deficiency of many secondary and
micronutrients. Identifying the optimum dose of integrated nutrient application is, however,
required for maintaining adequate supply of nutrients for increased yield. Different
recommendations on the rates of organic-inorganic fertilizer combination have been given for
rice production in different parts of the world. Ethiopia is an importer of inorganic fertilizers. On
the otherhand, the country has high population of livestock and FYM is readily available. These
scenarios necessitate the use of integrated nutrient management in rice production. However,
research on integrated nutrient management for rice production has not been yet conducted in
Ethiopia. This study was, therefore, conducted to study the effect of the combined application of
FYM and inorganic N and P fertilizers on the growth, yield, and moisture stress tolerance of
rain-fed lowland rice and to determine optimum rates of combined FYM and inorganic N and P
fertilizers for improved productivity of the crop.
2. Materials and methods
2.1. The study site
The study was conducted at Fogera plain in northwestern Ethiopia during the 2010 and 2011
cropping seasons. Fogera plain is located at 130 19’ latitude, 370 03’ longitude, and at the altitude
of 1815 m above sea level. Eleven-year (2001-2011) meteorological data of the area indicates
that in the main cropping season (June-October) the area has mean annual minimum and
maximum temperatures of 13.50C and 26.10C, respectively. Rainfall of the area is uni-modal,
mainly falling from June to October, and amounts to 1205 mm. The soil is Vertisol with a clay
content of 71.25%. It is slightly acidic (pH 5.90) and the 20 cm soil horizon contains 0.22% total
N, 12.64 ppm available P (Olsen), 0.93 cmol (+) kg-1exchangeable K, 3% organic carbon and
52.9 cmol (+) kg-1 CEC. According to Bernard (1993), the total N and available P contents of the
soil are medium while the organic matter content is low. According to Roy et al (2006), the
exchangeable potassium content and CEC are high.
Tilahun, et al., 2013: Vol 1 (4) [email protected]
278

American Journal of Research Communication www.usa-journals.com
2.2. Tretaments and Experimental Design
Treatments consisted of three rates of FYM (0, 7.5, and 15 t ha-1), three rates of N (0, 60, 120
Kg N ha-1) and three rates of P (0, 50, 100 kg P2O5 ha-1). The experiment was laid out as a
randomized complete block design in a factorial arrangement and replicated three times per
tretament. Gross and net plot sizes were 4 m x 5 m and 3 m x 4 m, respectively. Treatments were
assigned to each plot randomly. Sun-dried FYM collected from Andasa Livestock Research
Center was applied on a dry weight basis a month before planting and thoroughly mixed with the
soil. The N, P and K contents of the FYM used in the experiment and the relative N, P, and K
additions to the soil were determined (Tables 1 and 2). All the P and half of the N fertilizers for
the respective inorganic N and P treatments were applied at planting. The remaining half of the
inorganic N fertilizer was applied at tillering stage. Prior to planting, surface (0–20 cm) soil
samples, from twelve spots across the experimental field, were collected, composited, and
analyzed for determining soil physicochemical properties following the procedure outlined by
Page et al. (1982). The rice seed was broadcast by hand at the seed rate of 140 kg ha-1. Weeds
were removed by handweeding three times (at early tillering, maximum tillering, and booting
stages). No insecticide or fungicide was applied since no serious insect or disease incidences
occurred. Harvesting was done manually using hand sickles. Urea, Diammonimum phosphate,
and TSP were used as inorganic N and P sources, whereas FYM was used as an organic
fertilizer. A rice variety called X-Jigna was used as a test crop.
Data on leaf area at heading was measured and calculated following the method of Yoshida
(1981):
Leaf area (cm2) = L × W × K
Where, L is leaf length, W is maximum width of the leaf and K is a correction factor of 0.75.
Leaf area index (LAI) was also calculated by employing the formula of Yoshida (1981):
Tilahun, et al., 2013: Vol 1 (4) [email protected]
279

American Journal of Research Communication www.usa-journals.com
Crop Growth Rate (CGR) and Net Assimilation Rate (NAR) for the duration from planting to
heading were computed using the equations developed by Hunt (1978) as cited by Ahmad et al.
(2009):
and
Where, A is area of land, is change in Dry matter, is time variations in day, LA is total
leaf area per unit area of land. CGR is expressed as g dry matter m-2 land area day-1and NAR is
expressed as g dry matter m-2 leaf area day-1 (Ahmad et al., 2009).
Data on the number of days to maturity, number of filled spikelets per panicle, grain and above
ground biomass yields were collected from the net plot area at maturity. Grain yield was adjusted
to 14% moisture content. N and P concentrations in the aboveground biomass were determined
from plant samples collected from each plot at maturity.
N and P uptakes were calculated as:
Agrophysiological Efficiency (APE) is defined as the economic yield (grain) obtained per unit
of nutrient absorbed (Ladha et al., 2005). It is calculated as:
-1
Where “NUf plot” is nutrient use of fertilized plot and “NUu plot” is nutrient use of unfertilized plot. Harvest index (HI) was calculated as the ratio of grain yield to above ground dry biomass yield.
Rough rice grain protein content was determined using “Infratec 1241-NIR Analysis for Grain
and Flour” instrument (FOSS Company, Denmark).
Data were subjected to analysis of variance using the SAS software (SAS Institute, 2003).
Homogeneity of variance was tested using Barlett’s test as described by Gomez and Gomez
Tilahun, et al., 2013: Vol 1 (4) [email protected]
280

American Journal of Research Communication www.usa-journals.com
(1984) and the F-test was not significant. Thus, combined analysis of the two-year data was
performed. Differences among treatment means were comapraed using the least significant
difference test at 5% level of significance. To identify the economic optimum rate of fertilizer
combinations economic analysis was done using the CIMMYT partial budget analysis
methodology (CIMMYT, 1988). Average grain price of ETB 7 kg-1 and straw price of ETB 60
t-1 and Diammonium phosphate (DAP),urea and FYM costs of ETB 12 kg-1, ETB 10 kg-1, and
ETB 500 t-1, respectively were used for the analysis. It was estimated that 3 and 4 mandays
were needed to apply 7.5 t ha-1 and 15 t ha-1 FYM, respectively. The labour cost for FYM
application was estimated to be Birr 30 per manday’s. Following the CIMMYT partial budget
analysis methodology, total variable costs (TVC), gross benefits (GB) and net benefits (NB)
were calculated. Then treatments were arranged in an increasing TVC order and dominance
analysis was performed to exclude dominated treatments from the marginal rate of return
(MRR) analysis. A treatment is said to be dominated if it has a higher TVC than the treatment
which has lower TVC next to it but having a lower net benefit. A treatment which is non-
dominated and having a MRR of greater or equal to 50% and the highest net benefit is said to
be economically profitable.
Table 1. Organic matter (OM), N, P, and K composition of the FYM used in the experiment
Year OM (%) N (%) P (%) K (%) 2010 10.5 1.83 0.49 1.92 2011 11.3 2.02 0.58 2.75
Table 2. OM, N, P, and K additions to the soil form the FYM
7.5 t ha-1 FYM 15t ha-1 FYM Year OM
(kg ha-1) N
(kg ha-1) P
(kg ha-1)K
(kg ha-1)OM
(kg ha-1)N
(kg ha-1) P
(kg ha-1)K
(kg ha-1)2010 787.5 137.3 36.8 144.0 1575.0 274.5 73.5 288.0 2011 847.5 151.5 43.5 206.3 1695.0 303.0 87.0 412.5
Tilahun, et al., 2013: Vol 1 (4) [email protected]
281

American Journal of Research Communication www.usa-journals.com
3. Results
3.1 Phenological and growth parameters
The number of days required for the rice plants to mature was influenced by the main effect of
FYM, nitrogen, and phosphorus as well as by the interactions of N x P and FYM x N x P (Table
3). When the rates of phosphorus and manure were kept at zero, increasing the rate of nitrogen
from 0 to 60 kg N ha-1 did not change the number of days required to reach maturity. However,
at these rates of phosphate and manure; increasing the rate of nitrogen from 60 to 120 kg N ha-1
significantly hastened maturity of the rice plants. At the nil level of phosphate, increasing the
rate of manure from 0 to 7.5 or 15 t ha-1, hastened maturity of the rice plants in when the rates of
N were increased to 60 and 120 kg N ha-1. However, at nil rates of P and N application, maturity
of the crop was prolonged across all levels of manure application. Further increases in the
phosphate fertilizer across all rates of manure and nitrogen generally led to shortened days to
maturity of the rice crop. The smallest numbers of maturity days were recorded for the
treatments of 15 t manure-1 combined with 60 or 120 kg N ha-1 with or without any phosphate
application. The most prolonged numbers of days for the maturity of the crop were recorded for
the treatments with nil application rates of all three fertilizers as well as the treatment with 60 kg
N ha-1 with no phosphate and nitrogen application (Table 4). The analysis of variance revealed
that leaf area index (LAI) at heading responded significantly to the main effects of FYM, N, P
as well as the interaction effects of FYM x N and FYM x N x P (Table 3). The highest LAI at
heading was recorded when the highest rates of FYM, N and P were applied in combination. The
lowest LAI occurred in response to the application of the lowest rates of nitrogen or FYM or
phosphorus (Table 4). However, increasing the rate of nitrogen and manure to the highest levels
without applying phosphorus also led to the lowest leaf area index (Table 4).
Significant differences in CGR were observed for the main effects of FYM, N and P and for the
interaction effect of FYM x N x P (Table 3). When the rates of phosphate and manure were kept
at nil, increasing the rates of nitrogen from 0 to 60 kg N ha-1 increased CGR significantly, but no
maximum value of the parameter was attained. However, when phosphorus was increased to 50
or 100 kg P2O5 ha-1, the highest CGR values were obtained already at the combined application
of 15 t ha-1 manure and 120 kg N ha-1 and the combined application of 15 t manure ha-1 with 60
Tilahun, et al., 2013: Vol 1 (4) [email protected]
282

American Journal of Research Communication www.usa-journals.com
kg P2O5 ha-1 and 120 kg N ha-1. This shows that increasing the rate of phosphorus had a more
determining effect on CGR than increasing the rate of either manure or nitrogen (Table 5).
Similarly, net assimilation rate (NAR) was significantly influenced by the main effects of FYM
and N as well as by the interaction effects of FYM x N x P interaction (Table 3). The highest
NAR values were recorded when 7.5 t manure ha-1 was combined with 60 or 120 kg N ha-1 and
100 kg P2O5 ha-1 or when 15 t ha-1manure was combined with 60 or 120 kg N ha-1 and 0, 50, or
100 kg P2O5 ha-1. This shows that dry matter was most influenced by manure application (Table
5).
The number of filled spikelets per panicle responded significantly to the single effects of FYM
and N, as well as to the interactions of N x P and FYM x N x P (Table 6). When the rates of
phosphate and manure were kept at nil, the number of filled spikelet increased significantly in
response to increasing the rate of nitrogen from 0 to 60 kg N ha-1. However, at theses rates of
phosphate and manure, the number of filled spikelet remained unchanged when the rate of
nitrogen was further increased to 120 kg N ha-1. However, at nil level of P application, increasing
the level of manure to 7.5 t ha-1 significantly increased the number of filled spikelet over all three
nitrogen rates. The highest number of filled spikelet with nil application of phosphate was
obtained in response to the combined application of the highest rate of manure (15 t ha-1) with 60
or 120 kg N ha-1. However, when the level of phosphate was increased to 50 and 100 kg P2O5 ha-
1, the highest number of filled spikletes was obtained already at the combined application of only
half of the highest rate of manure (7.5 t ha-1) over all three rates of N application; as well as with
combined application of 15 t ha-1 FYM to the three N levels and 50 and 100 kg ha-1 P2O5. Even
the combined application of the 15 t ha-1 FYM with 50% of the inorganic fertilizer (60 kg ha-1 N
and 50 kg ha-1 P2O5) resulted in significantly higher number of filled spikelets compared to
applying 100% inorganic fertilizer (120 kg ha-1 N and 100 kg ha-1 P2O5) alone (Tables 7).The
lowest numbers of filled spikelet were recorded for the combined application of nil rates of
manure, nitrogen, and phosphorus as well as 120 kg N ha-1. Nil rate of manure combined with all
rates of nitrogen and 50 or 100 kg P2O5 ha-1 also resulted in the lowest number of filled spikelet
(Tables 7).
Tilahun, et al., 2013: Vol 1 (4) [email protected]
283
American Journal of Research Communication www.usa-journals.com
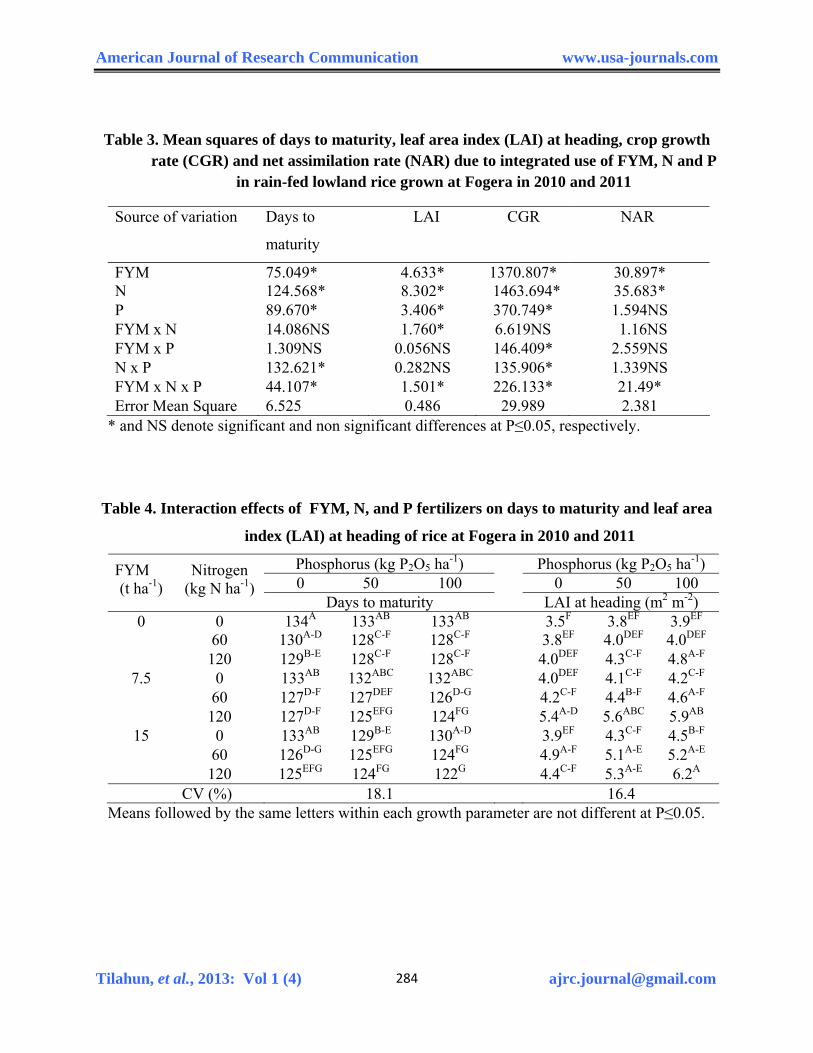
Table 3. Mean squares of days to maturity, leaf area index (LAI) at heading, crop growth rate (CGR) and net assimilation rate (NAR) due to integrated use of FYM, N and P
in rain-fed lowland rice grown at Fogera in 2010 and 2011
Source of variation Days to
maturity
LAI CGR NAR
FYM 75.049* 4.633* 1370.807* 30.897* N 124.568* 8.302* 1463.694* 35.683* P 89.670* 3.406* 370.749* 1.594NS FYM x N 14.086NS 1.760* 6.619NS 1.16NS FYM x P 1.309NS 0.056NS 146.409* 2.559NS N x P 132.621* 0.282NS 135.906* 1.339NS FYM x N x P 44.107* 1.501* 226.133* 21.49* Error Mean Square 6.525 0.486 29.989 2.381
* and NS denote significant and non significant differences at P≤0.05, respectively.
Table 4. Interaction effects of FYM, N, and P fertilizers on days to maturity and leaf area
index (LAI) at heading of rice at Fogera in 2010 and 2011
Phosphorus (kg P2O5 ha-1) Phosphorus (kg P2O5 ha-1) 0 50 100 0 50 100
FYM (t ha-1)
Nitrogen (kg N ha-1)
Days to maturity LAI at heading (m2 m-2) 0 0 134A 133AB 133AB 3.5F 3.8EF 3.9EF 60 130A-D 128C-F 128C-F 3.8EF 4.0DEF 4.0DEF 120 129B-E 128C-F 128C-F 4.0DEF 4.3C-F 4.8A-F
7.5 0 133AB 132ABC 132ABC 4.0DEF 4.1C-F 4.2C-F 60 127D-F 127DEF 126D-G 4.2C-F 4.4B-F 4.6A-F 120 127D-F 125EFG 124FG 5.4A-D 5.6ABC 5.9AB
15 0 133AB 129B-E 130A-D 3.9EF 4.3C-F 4.5B-F 60 126D-G 125EFG 124FG 4.9A-F 5.1A-E 5.2A-E 120 125EFG 124FG 122G 4.4C-F 5.3A-E 6.2A CV (%) 18.1 16.4
Means followed by the same letters within each growth parameter are not different at P≤0.05.
Tilahun, et al., 2013: Vol 1 (4) [email protected]
284

American Journal of Research Communication www.usa-journals.com
Table 5. Interaction effects of FYM, N and P fertilizers on Crop Growth Rate (CGR) and
Net Assimilation Rate (NAR) of rice at Fogera in 2010 and 2011
Phosphorus (kg P2O5 ha-1) Phosphorus (kg P2O5 ha-1) 0 50 100 0 50 100
FYM (t ha-1)
Nitrogen (kg N ha-1)
CGR (g dry matter m-2 land area day-1) NAR (g dry matter m-2 leaf area day-1)
0 0 7.6K 8.9JK 11.6IJK 3.5G 4.9FG 5.4D-G 60 10.7IJK 18.1E-I 19.0E-I 5.2E-G 6.8B-F 6.9B-F 120 13.4H-K 15.2G-K 22.3D-H 5.6C- G 5.7C-G 6.7B-F
7.5 0 11.0IJK 11.6IJK 18.3E-I 5.3D-G 5.0FG 6.9B-F 60 26.0B-F 26.7B-E 26.9B-E 6.6B-F 7.0B-F 7.8A-D 120 22.7C-G 30.1BCD 30.9BCD 6.7B-F 7.6B-E 8.1ABC
15 0 15.1G-K 17.5F-J 18.5E-I 6.1B-F 6.1B-F 6.4B-F 60 30.5BCD 31.3BC 33.8AB 8.3AB 8.4AB 8.3AB 120 24.2C-F 34.5AB 42.6A 8.5AB 8.6AB 10.2A CV (%) 18.0 22.78
Means followed by the same letter for each growth parameter are not significantly different at 5% level of significance.
Table 6. Mean squares of number of filled spikelet per panicle due to integrated use of
FYM, N and P in rain-fed lowland rice grown at Fogera in 2010 and 2011
Source of variation Number of filled spikeletes per panicle
FYM 33855.424* N 3705.003* P 1185.831NS FYM x N 55.130NS FYM x P 69.792NS N x P 3278.794* FYM x N x P 7283.744* Error Mean Square 533.176
* and NS denote significant and non significant differences at P≤0.05, respectively.
Tilahun, et al., 2013: Vol 1 (4) [email protected]
285

American Journal of Research Communication www.usa-journals.com
Table 7. The interaction effect of FYM, N and P fertilizers application on the number of
filled spikelets per panicle of rice at Fogera in 2010 and 2011
Phosphorus (kg P2O5 ha-1) 0 50 100
FYM (t ha-1)
Nitrogen (kg N ha-
1) Number of filled spikelet per 0 0 88J 94J 91J 60 132E-I 118HIJ 114HIJ 120 105IJ 122G-J 123F-J
7.5 0 136D-I 133E-I 150C-H 60 148D-H 157B-G 157B-G 120 148D-H 162A-E 162A-E
15 0 106 IJ 163A-E 169A-E 60 171A-D 187ABC 186ABC 120 171A-D 191AB 197A CV (%) 22.8
Means followed by the same letters within each growth parameter are not different at P≤0.05.
3.2 Aboveground biomass yield, grain yield, and grain protein content
Aboveground biomass yield significantly responded to the main effects of FYM, N and P and to
the interaction effects of N x P and FYM x N x P (Table 8). Keeping the rate of phosphate
application at nil and increasing the rates of manure and nitrogen did not result in consistent
increases in aboveground biomass yield of the rice crop. However, when the rate of phosphorus
was increased to 50 kg P2O5 ha-1, increasing the rates of both manure and nitrogen consistently
increased aboveground biomass yield. When the rate of phosphate was increased further to 100
kg P2O5 ha-1, the aboveground biomass yield increased further significantly with the increase in
the rates of both fertilizers. Thus, the highest aboveground biomass yields were obtained in
response to the combined application of the highest rate of phosphate (100 kg P2O5 ha-1) and the
highest rate of manure (15 t ha-1) with 60 or 120 kg N ha-1.
Keeping the rates of phosphate and manure application at nil over all three rates of nitrogen
application did not increase grain yield. Similarly, increasing the rate of manure to 7.5 t ha-1 and
keeping both N and P rates at nil did not result in any increase in grain yield. However, at the nil
Tilahun, et al., 2013: Vol 1 (4) [email protected]
286

American Journal of Research Communication www.usa-journals.com
rate of phosphate, increasing the rates of manure to 7.5 and the rates nitrogen to 60 or 120 kg N
ha significantly increased grain yield of the rice crop. Increasing the rate of manure to 15 t ha-1 at
nil rate of phosphate further increased grain yield of the crop over all three rates of nitrogen
application. Increasing the rate of nitrogen from 0 to 60 and up to 120 kg N ha-1 and that of
phosphate to 50 kg P2O5 ha-1 did not increase grain yield when the rate of manure remained nil.
However, when the rate of manure was increased from 0 to 7.5 t ha-1 at 50 kg P2O5 ha-1, the grain
yield increased significantly over all three rates of nitrogen. Increasing the rate of phosphate to
100 kg P2O5 ha-1 and that of nitrate from zero to 60 kg N ha-1 did not increase grain yield when
the rate of manure remained nil. However, at this level of phosphate supply, when the rate of
manure was increased to 7.5 t ha-1, increasing the rate of nitrogen significantly increased grain
yield. Increasing the rate of manure further to 15 t ha-1 at 100 kg P2O5 ha-1 further increased grain
yield over all rates of nitrogen. Hence, the highest grain yield was attained at the combined
application of the highest rates of all three fertilizers i.e., 15 t manure ha-1 with 100 kg P2O5 ha-1
and 120 kg N ha-1 (Table 9).
Harvest index did not respond to any of the treatments and their interactions (Table 8). However,
increasing trends in harvest indices with the increased application rates of the combined
fertilizers were observed where harvest indices of 0.24 for the negative control and 0.41 for the
highest fertilizer combination (15 t ha-1FYM, 120 kg N ha-1and 100 kg P2O5 ha-1) were recorded.
The main effects of FYM and nitrogen significantly influenced protein concentration in the rice
grain, However, this parameter was not affected by the main effect of phosphorus. FYM and
phosphorus interacted to influence protein concentration in rice grains. The interaction effect of
the three fertilizers (FYM x N x P) also influenced this parameter (Table 8). The highest protein
concentration in the grains was obtained in response to the combined application of the highest
rates of the three fertilizers whereas the lowest was recorded for the combined application of nil
rates of manure and nitrogen over all three rates of phosphorus (Table 10).
Tilahun, et al., 2013: Vol 1 (4) [email protected]
287

American Journal of Research Communication www.usa-journals.com
Table 8. Mean squares of aboveground biomass yield, grain yield, harvest index and grain
protein content due to integrated use of FYM, N and P in rain-fed lowland rice
grown at Fogera in 2010 and 2011
Source of variation Above ground biomass yield
Grain yield Harvest index Grain protein
FYM 12.835* 3.589* 0.033NS 0.284* N 48.021* 6.254* 0.038NS 0.745* P 29.428* 11.700* 0.012NS 0.021NS FYM x N 2.818NS 0.119NS 0.025NS 0.069* FYM x P 3.203NS 2.157* 0.041NS 0.043NS N x P 15.112* 3.822* 0.055NS 0.066* FYM x N x P 8.115* 5.112* 0.042NS 0.102* Error Mean Square 3.918 0.193 0.023 0.025 * and NS denote significant difference and non significant difference at P≤0.05, respectively.
Table 9. The interaction effect of integrated FYM, N and P application on aboveground
biomass and grain yields of rice at Fogera in 2010 and 2011
Phosphorus (kg P2O5 ha-1) Phosphorus (kg P2O5 ha-1) 0 50 100 0 50 100
FYM (t ha-1)
Nitrogen (kg N ha-1)
Aboveground biomass yield (t ha-1) Grain yield (t ha-1) 0 0 9.7HI 9.5I 11.2E-I 2.27J 2.29 J 2.32 J 60 10.5GHI 10.5GHI 12.5C-G 2.35 J 2.44 IJ 2.51 IJ 120 12.0C-G 13.5BCD 12.7C-G 2.48 IJ 2.57 IJ 3.67DE
7.5 0 10.8F-I 10.5GHI 9.5I 2.34J 3.10FGH 3.42EFG 60 11.5D-I 11.7C-I 11.9C-H 2.92GHI 3.48EF 4.26CD 120 11.8C-H 13.3B-E 13.8B-E 3.16FG 3.76DE 4.42C
15 0 10.8F-I 11.0F-I 10.5GHI 2.92GHI 3.44EF 3.43EF 60 12.5C-G 12.8B-F 15.0AB 3.23FG 4.21CD 4.93B 120 11.0F-I 13.0B-F 15.8A 3.49EF 3.87DE 5.01A CV (%) 19.70 12.68
Means followed by the same letters within each growth parameter are not different at P≤0.05.
Tilahun, et al., 2013: Vol 1 (4) [email protected]
288

American Journal of Research Communication www.usa-journals.com
Table 10. The interaction effect of FYM, N and P fertilizers on the grain protein content
(%) of rice grains at Fogera in 2010 and 2011
Phosphorus (kg P2O5 ha-1) FYM (t ha-1)
Nitrogen (kg N ha-1) 0 50 100
0 0 7.00I 7.23F-I 7.17HI 60 7.27FGH 7.33D-H 7.30E-H 120 7.34D-H 7.40D-H 7.57BCD
7.5 0 7.17HI 7.17HI 7.43C-G 60 7.33D-H 7.47C-F 7.53B-E 120 7.33D-H 7.53B-E 7.77B
15 0 7.20GHI 7.40D-H 7.47C-F 60 7.20GHI 7.43C-G 7.53B-E 120 7.40D-H 7.67BC 8.17A CV (%) 17.14
Means followed by the same letters are not different at P≤0.05.
3.3 Nitrogen and Phosphorus uptake and use efficiency
Aboveground biomass N uptake was significantly affected by the main effects of FYM and N as
well as the interaction effects of FYM x N, N x P, and FYM x N x P (Table 11). The
aboveground biomass P uptake was significantly affected by the main effects of FYM and P and
the interaction effects of FYM x P, N x P and FYM x N x P (Table 11). The highest N uptake
was recorded for the combined application of the highest rates of the three fertilizers. The lowest
N uptake was scored for the combined application of nil rate of manure and nil and 60 rates of
nitrogen over all rates of phosphorus. The highest value of N uptake was closely followed by the
N uptake value recorded for the combined application of 15 t manure with 60 kg N ha-1 and 100
kg P2O5 ha-1 (Table 12) The N uptake obtained in response to the highest rates of the three
fertilizers exceeded the uptake of the nutrient recorded in response to nil application rates of the
three fertilizers 2.34-fold. When the rates of P and manure application were kept at nil,
increasing the rate of nitrogen from zero to 50 or 120 did not change the magnitude of P uptake.
Similarly, at zero level of phosphate and nitrogen, increasing the level of manure to 7.5 t ha-1 did
not increase P uptake. However, at zero level of phosphate increasing the rate of manure from
zero to 7.5 to 15 t ha-1 significantly enhanced P uptake over all three rates of nitrogen. Further
Tilahun, et al., 2013: Vol 1 (4) [email protected]
289

American Journal of Research Communication www.usa-journals.com
increases in phosphate and manure rates increased P uptake over all three nitrogen rates. Thus,
the highest P uptake values were recorded for the combined application of 15 t manure ha-1, 60
or 120 kg N ha-1 with 100 kg P2O5 ha-1. These values were closely followed by the values of P
uptake recorded for the combined application of 15 t manure ha-1, 60 or 120 kg N ha-1 with 50 kg
P2O5 ha-1 (Table 12). The P uptake obtained in response to the highest combined application of
manure and phosphate with 60 kg N ha-1 significantly exceeded the P uptake recorded in
response to nil application rates of the three fertilizers 3-fold.
Nitrogen APE showed significant response to the main and interaction effects except for P and
its interaction with FYM (Table 11). Similarly, phosphorous APE responded significantly to all
main and interaction effects of treatments except for N and its interaction with FYM (Table 11).
Agro physiological efficiency for N was highest for the integrated application of of 15 t FYM ha-
1, 60 kg N ha-1 and 50 kg P2O5 ha-1, 15 t FYM ha-1, 60 kg N ha-1 and 100 kg ha-1 P2O5, 15 t FYM
ha-1, 120 kg N ha-1, and 100 kg ha-1 P2O5. In addition, nill application of all three fertilizers also
led to the highest APE of nitrogen. The lowest APE values of nitrogen were recorded for 0 rate
of P ha-1 combined with 60 and 120 kg N ha-1 with all rates of manure (Table 13).
When the rates phosphate was kept at 50 kg P2O5 ha-1 and that of manure remained nil,
increasing the rate of nitrogen from 0 to 60 kg N ha-1 did not change the APE of P. However, at
this level of phosphate, increasing the rate of nitrogen to 120 kg N ha-1 significantly increased
APE of P. The APE of P remained unchanged up to the highest level of manure combined with
all rates of nitrogen except at the rate of 60 kg N ha-1 and 120 kg N ha-1. The highest APE of P
was recorded at the combined application of 50 kg P2O5 ha-1 and 15 t manure ha-1 with 60 kg N
ha-1. However, at the combined application of 50 kg P2O5 ha-1, 15 t manure ha-1, and 120 kg N
ha-1, APE of P reduced significantly. Increasing the rate of phosphate to 100 kg P2O5 ha-1 did not
improve APE of P markedly. The lowest APE of P was recorded for the treatments with nil rates
of nitrogen and manure combined with 100 kg P2O5 ha-1 (Table 14). Thus, the highest APE of the
pre-coded treatment of 50 kg P2O5 ha-1 and 15 t manure ha-1 with 60 kg N ha-1 exceeded the
lowest APE of the nutrient recorded at nil rates of nitrogen and manure combined with 100 kg
P2O5 ha-1 by about 336% (Table 14).
Tilahun, et al., 2013: Vol 1 (4) [email protected]
290

American Journal of Research Communication www.usa-journals.com
Table 11. Mean squares of rice biomass N and P uptakes, and nitrogen and phosphorous
agro-physiological efficiencies (APE) of due to integrated use of FYM, N and P in
rain-fed lowland rice grown at Fogera in 2010 and 2011
Source of variation Plant N uptake Plant P uptake Nitrogen APE Phosphorous APE FYM 50416.235* 4168.338* 115.219* 1200.837* N 33788.569* 74.951NS 112.696* 128.220NS P 321.109NS 1761.358* 38.128NS 817.804* FYM x N 1974.733* 56.17NS 105.034* 212.321NS FYM x P 239.041NS 694.708* 48.684NS 710.804* N x P 1430.731* 313.157* 62.476* 581.018* FYM x N x P 1520.849* 254.213* 69.817* 531.776* Error Mean Square 472.837 89.714 19.207 119.663
* and NS denote significant and non significant differences at P≤0.05, respectively.
Table 12. Interaction effects of FYM, N and P application on rice biomass N and P uptake
of rice at Fogera in 2010 and 2011
Phosphorus (kg P2O5 ha-1) Phosphorus (kg P2O5 ha-1) 0 50 100 0 50 100
FYM (t ha-1)
Nitrogen (kg N ha-1)
N uptake (kg N ha-1) P uptake (kg P ha-1) 0 0 81.6K 79.4K 91.8JK 26.5P 28.4OP 35.4K-O 60 93.4JK 95.6JK 112.2IJK 28.0P 30.6NOP 43.4F-I 120 122.2HIJ 145.5GHI 125.1HIJ 33.8L-P 40.8I-L 43.2G-J
7.5 0 122.6HIJ 114.7H-K 110.1IJK 33.1M-P 42.6H-K 39.7I-M 60 149.1FGH 161.9EFG 161.5EFG 36.0J-N 46.9E-I 50.3D-G 120 162.0EFG 197.1CDE 199.2CD 43.4F-I 52.2DE 60.0BC
15 0 138.7GHI 135.0GHI 136.1GHI 45.4E-I 48.5D-H 54.6CD 60 181.7DEF 193.3CDE 246.6AB 50.6DEF 62.5B 81.7A 120 194.0CDE 225.1BC 272.6A 44.4F-I 62.6B 80.6A CV (%) 14.51 19.68
Means followed by the same letters within each growth parameter are not different at P≤0.05.
Tilahun, et al., 2013: Vol 1 (4) [email protected]
291

American Journal of Research Communication www.usa-journals.com
Table 13. Interaction effect of FYM, N and P fertilizers on the agrophysiological efficiency
(APE) of nitrogen in rice at Fogera in 2010 and 2011
Phosphorus (kg P2O5 ha-1) FYM (t ha-1)
Nitrogen (kg N ha-1) 0 50 100
0 60 22.11ABC 17.37CDE 16.13C-F 120 8.13G 15.04C-G 17.16CDE
7.5 60 9.63FG 15.06C-G 14.92C-G 120 11.08EFG 12.90D-G 18.48BCD
15 60 9.60FG 24.86AB 28.43A 120 10.85EFG 11.15EFG 27.49A CV (%) 27.18
Means followed by the same letters are not different at P≤0.05.
Table 14. Interaction effect of FYM, N and P fertilizers on the agrophysiological efficiency (APE) of phosphorous in rice at Fogera in 2010 and 2011
Phosphorus (kg P2O5 ha-1) FYM (t ha-1)
Nitrogen (kg N ha-1) 50 100
0 0 40.82E 18.99F 60 41.34DE 51.30B-E 120 46.81B-E 53.29B-E
7.5 0 51.46B-E 57.06B-E 60 59.23BCD 53.61B-E 120 57.91B-E 61.03BC
15 0 53.18B-E 41.31DE 60 82.90A 48.19BCD 120 44.27CDE 64.69B
CV (%) 21.24
Means followed by the same letters are not different at P≤0.05.
Table 15. Results of the economic analysis for integrated use of FYM, N and P in rain-fed lowland rice grown at Fogera in 2010 and 2011
FYM (tha-1) N (kg ha-1) P2O5 (kg ha-1) TVC (Birr ha-1) NB (Birr ha-1) MRR (%) 0 0 0 0 16336 - 0 120 100 4368 21864 126.6 7.5 60 100 6528 23751 87.3 15 60 100 9993 25121 39.6
Tilahun, et al., 2013: Vol 1 (4) [email protected]
292

American Journal of Research Communication www.usa-journals.com
3.4 Economic analysis
Results of the economic analysis showed that the maximum net benefit (ETB 23751 ha-1) with an
acceptable MRR was obtained from the combined application of 7.5 t FYM ha-1, 120 kg N ha-1
and 100 kg P2O5 ha-1 (Table 15). This combination has resulted in a net benefit advantage of Birr
7415 ha-1 over the control treatment (0-0 N-P2O5 kg ha-1).
4. Discussion
4.1. Phenological and growth parameters
Due to poor soil fertility management, delayed maturity is common in farmers’ fields, which
often exposes the crop to terminal moisture stress. . The fertilizers had synergistic effect on the
number of days required for the maturity of the crop. The longest durations for maturity of the
rice crop were recorded for the treatments with nil application of all three fertilizers as well as
the treatment with the application of 60 kg N ha-1 with no phosphate and nitrogen application On
the other hand, the shortest durations of maturity were recorded for the treatments of 15 t-1 FYM
combined with 120 kg ha-1 N and 100 kg ha-1 P2O5. The stated treatment shortened the maturity
duration by 12 and 6 days compared to no fertilizer application (0-0 N-P2O5 kg ha-1) and
application of 120-100 N-P2O5 kg ha-1 inorganic fertilizer, respectively. Thus, maturity was
hastened markedly when inorganic fertilizer was applied in combination with FYM. This result
implies that rice crop fertilized with the combined application of FYM and inorganic N and P
matured earlier, signifying that it would escape terminal moisture stress which is a common
occurrence in the area. Therefore, the use of FYM and inorganic fertilizers in the production of
lowland rice could be used as a strategy to enable the crop to escape terminal moisture stress. In
line with this finding, Wonprasaida et al. (2006) also reported a reduction in days to maturity in
rice in response to combined FYM and inorganic fertilizer application.
LAI determines the efficiency of photosynthesis and photosynthetic surface area and thus, is an
important determinant of plant productivity (Yoshida, 1981). However, in farmers’ fields, owing
to poor soil fertility management, it is common to see small and narrow leaves of the rice crop.
Tilahun, et al., 2013: Vol 1 (4) [email protected]
293
American Journal of Research Communication www.usa-journals.com
This has obviously contributed to the poor productivity and yield of the crop under farmers’
management condition. Nevertheless, in the present investigation LAI had increased by about
77% with the combined application of 15 t ha-1 FYM, 120 kg ha-1 N and 100 kg ha-1 P2O5 over
the no fertilized crop. This increase in LAI could be attributed to enhanced production of
carbohydrate, which might have resulted in increased leaf expansion. In agreement to this result,
Naing et al. (2010) reported that combined application of 10 t ha-1 FYM with 50-22 N-P kg ha-1
resulted in a 41.3 % increase in LAI of rice at heading compared to no fertilizer application. Aziz
et al. (2010) also reported a two-fold increase in leaf area index in rice with the application of 15
t ha-1FYM. In the present study, the maximum rice LAI of 6.06 at heading was observed with the
application of 15 t ha-1 FYM together with 120 kg ha-1 N and 100 kg ha-1 P2O5. According to
Yoshida (1981), a rice crop can attain maximum LAI values of 10 or greater at heading time. A
LAI of 5–6 is the critical optimum to achieve maximum photosynthesis during the reproductive
stage of rice (Yoshida, 1981). Therefore, in this study, the rice plants attained critical leaf area
indices for higher productivity at the highest rates of FYM and nitrogen with or without P
application. This results also signified the more prominent roles played by nitrogen and FYM
than phosphorus in enhancing leaf area index of the crop. In fact, phosphorus enhances leaf
expansion and leaf area index (Marschner, 2012). However, the relatively low role of phosphorus
in enhancing leaf area index of the rice plants in this study may be attributed to the relatively
higher availability of the nutrient than nitrogen in the soil (medium level) as exhibited by the soil
test results. Increased CGR and NAR were recorded with the combined application of FYM and
N and P fertilizers. Increasing the rate of phosphorus had a more determining effect on CGR than
increasing the rate of either manure or nitrogen The increased leaf area observed with the
application of FYM and N and P fertilizers could have resulted in higher radiation use efficiency
which in turn might have led to higher photoassimilate production and thus to increased CGR
and NAR (Naing et al., 2010). Similarly, Ahmad et al. (2009) reported increases in LAI, leaf
photosynthesis, CGR and NAR of rice with proper soil nutrient management.
Rice is very sensitive to poor soil fertility and moisture stress and in cases the crop would be
exposed to poor soil fertility and moisture stress, the proportion of unfilled spikelet will
extremely increase (Satyanarayana et al., 2002; Naing et al., 2010). This would have negative
consequences on the productivity of the crop. It is common to see such scenarios in farmers’ rice
Tilahun, et al., 2013: Vol 1 (4) [email protected]
294

American Journal of Research Communication www.usa-journals.com
fields in Fogera due to farmers’ poor soil fertility management practices. However, in the present
experiment, the number of filled spikelets per panicle increased by as much as 82-124% with the
combined application of FYM and N and P fertilizers over the no fertilized crop. This implies
that through simple improved soil fertility management practices, the productivity of rice could
be increased because of reduced number of unfilled spikeletes. This result is supported by that of
Naing et al. (2010) who stated that the potential number of grains per panicle was influenced by
the plants’ nutritional status. Naing et al. (2010) further reported that combined application of 10
t ha-1 FYM with 50-22 kg N-P ha-1 resulted in a 30.7% increase in rice filled grains number per
panicle as compared to no fertilizer application.
4.2. Aboveground biomass yield, grain yield, and grain protein concentration
Rice straw is an important resource for livestock feed and construction of houses in the Fogera
plain (Tilahun et al., 2012). Improvement in the rice biomass yield has great implication for the
Fogera farmers where mixed crop-livestock farming is predominant as it means an increased
availability of livestock feed. The observed increase in biomass yield with integrated application
of FYM and inorganic N and P fertilizers is believed to help the farmers by ensuring more
supply of rice straw as a feed resource particularly during the dry season. On top of being feed of
high value for livestock e and for its utility in plastering of walls of houses in construction, the
straw will generate more household income through sale (Tilahun et al., 2012). However, due to
no rate fertilizer application and frequent terminal moisture stress, farmers in Fogera plain are
getting lower rice straw and grain yields. In the current experiment, it was observed that the
combined application of 15 t ha-1 FYM together with 120 kg ha-1 N and 100 kg ha-1 P2O5
produced additional 2.79 and 1.39 t ha-1 rice grain compared to the negative (0-0-0 kg ha-1 FYM-
N-P2O5) and positive (0-120-100 kg ha-1 FYM-N-P2O5) controls, respectively. This has yield
advantages of 123% and 38% compared to the respective controls. The result further revealed
that optimum straw and grain yields of the crop were attained at the highest combined
application rates of the three fertilizers. These results are consistent with that of Mahajan et al.
(2008) and Naing et al. (2010) who reported increased straw and grain yields in rice with the
combined application of FYM and inorganic fertilizers. In the present research, applying 50% of
the N and P fertilizer rates (60 kgha-1 N and 50 kg ha-1 P2O5) in combination with 15 t ha-1 FYM
Tilahun, et al., 2013: Vol 1 (4) [email protected]
295

American Journal of Research Communication www.usa-journals.com
resulted in a 15% increase in grain yield over the crop which received 100% of the N and P
fertilizer rates (120 kgha-1 N and 100 kg ha-1 P2O5) alone. This implies that by combining
inorganic fertilizers with FYM farmers could reduce the need for inorganic fertilizers while still
increasing their productivity. Similarly, Bodruzzaman et al. (2010) also reported that plots with
10 t ha-1 FYM plus 75% NPKSZn produced equivalent or higher rice yields as 100% NPKSZn.
The significant increase in grain yield in response to the combined application of organic and
inorganic fertilizers could be attributed to increased nutrient and soil moisture availability and
thus increased uptake of nutrients by plant roots. This might be attributed to the nutrient
supplying capacity of the FYM as well as its propensity to improve the soil physio-cochemical
properties. Neither FYM nor chemical fertilizers alone could be sufficient to increase yield
sustainability under cropping system where nutrient turnover in soil plant system has been much
higher (Satyanarayana et al., 2002). However, in an integrated nutrient managment, FYM can
maintain plant nutrients in the available forms for longer periods due to improved soil organic
matter (SOM) and soil physico-chemical and biological characteristics (Singh and Singh, 2000;
Aziz et al., 2010). Chemical fertilizers, on the other hand, offer nutrients which are readily
soluble in soil solution and thereby make nutrients instantly available to plants (Aziz et al.,
2010). FYM is also reported to be a good source of nutrients such as phosphorus, potassium, and
silica (Yoshida 1981; Mahajan et al., 2008) and also it enhances availability of secondary and
micronutrients (Aziz et al., 2010; Bodruzzaman et al., 2010).
It is known that sufficient nutrient supply would improve the grain protein concentration in rice
grains (Salem, 2006). In the current study, rice grain protein concentrations increased by 1.17
and 0.6% with the combined application of 15 t ha-1 FYM, 120 kg ha-1 N and 100 kg ha-1 P2O5
over the negative (0-0-0 kg ha-1 FYM-N-P2O5) and positive (0-120-100 kg ha-1 FYM-N-P2O5)
controls, respectively. Most commercial rice varieties have grain protein concentrations below
10%. However, there are variations in rice grain protein concentration because of management
factors like fertilizer applications (Chandel et al., 2011). Similar to the present observation,
Chandel et al. (2011) reported high grain protein concentration in rice grains in response to the
combined application of FYM and inorganic fertilizers.
Tilahun, et al., 2013: Vol 1 (4) [email protected]
296

American Journal of Research Communication www.usa-journals.com
4.3. Nitrogen and Phosphorus nutrients uptake and use efficiency
The chemical composition of any plant is an important parameter to compare the performance of
treatments applied. In this study, both N and P uptake values were higher with the combined
applications of FYM and N and P fertilizers. Nitrogen and phosphorus uptakes values have
increased by as much as 202-234% and 204-208%, respectively with the combined application of
FYM and N and P fertilizers over the no fertilized crop. The increase in N uptake could be
ascribed to slow and continued supply of the nutrients, coupled with reduced N losses via
denitrification or leaching, which may have improved the synchrony between plant N demand
and supply from the soil. This proposition is consistent with that of Haile et al. (2012) who
reported that N uptake by wheat crop was significantly enhanced when application of the highest
dose of N fertilizer was done synchronized with the time high demand of the plant for uptake of
the nutrient. The higher P uptake could be attributed to the increased P availability and increased
root growth of the crop. According to Aziz et al. (2010) root growth in plants receiving FYM is
higher and hence would increase nutrient uptakes. Yassen et al. (2010) further suggested that,
FYM application increased the transfer of elements between the solid phase and soil solution
which again could be a reason for the higher nutrient uptakes. It was also indicated that the
activity of soil microorganisms under higher FYM applications which gain might have led to
increased nutrient uptake (Yassen et al., 2010). The present finding is in agreement with the
findings of Hossain et al. (2010) who reported higher N and P uptakes in rice with FYM
application over no fertilizer and inorganic fertilizers application.
Application of 15 t ha-1 FYM, 60 kg ha-1 N and 100 kg ha-1 P2O5 is among some of the
treatments that gave highest nitrogen agro-physiological efficiency. On the other hand the
highest phosphorus agro physiological efficiency was recorded for the integrated application of
15 t ha-1 FYM, 60 kg ha-1 N and 0 kg ha-1 P2O5. In line with the present finding, Naing et al.
(2010) reported that significantly higher agro-physiological N and P use efficiencies of rice were
observed with organic-inorganic mixed fertilizers compared to chemical fertilizers alone. Higher
uptake efficiency contributes directly to the better use of applied nutrients and reduced losses
from the system (Naing et al., 2010).
Tilahun, et al., 2013: Vol 1 (4) [email protected]
297
American Journal of Research Communication www.usa-journals.com
4.4 Economical analysis
Farmers in Fogera plain are producing rice year after year with application of neither inorganic
fertilizers nor FYM. This scenario has led to soil nutrient depletion and deterioration in the
physical quality of the soil. The farmers may have the opportunity to enhance their crop yields
and improve their livelihoods through adopting proper soil fertility management practices. For
instance, in the current study, with the combined application of 7.5 t ha-1 FYM, 120 kg ha-1 N
and 100 kg ha-1 P2O5, a 45% increase in net benefit was attained over the control treatment,
which implies a very high increase in farmers’ income with a simple improvement in crop
management. However, though, the economic maximum was found at the application of 7.5 t ha-
1 FYM with 120 kg N ha-1 and 100 kg P2O5 ha-1, it would be sensible to recommend application
of 15 t ha-1 FYM in view of sustaining the physico-chemical properties of the soil. In line with
this Naing et al. (2010) reported that even though the estimated net income for combined FYM-
inorganic fertilizer application is not attractive as compared to inorganic fertilizers alone, farmers
should consider that the long term use of inorganic fertilizers to pre-empt deterioration in soil
physical and chemical properties. Therefore, they should apply higher rates of FYM together
with inorganic fertilizers so as to improve both rice production and soil fertility.
Conclusion
Generally, it is understood that the positive impacts of FYM application on crop yield and soil
properties can be realized after long term applications. However, the current results from a single
year FYM addition highlighted the potential of FYM in improving the productivity of rice. In
addition to improving the long term productivity of the soil, this soil fertility management
approach has resulted to a large cost saving of mineral fertilizers. The combined use of FYM and
inorganic fertilizers enhanced rice productivity and yield through increasing LAI, filled
spikeletes number, by increasing nutrient uptake and utilization. Using FYM in combination with
inorganic fertilizers has also shortened days to maturity, which is a good strategy to enable the
plant to escape terminal moisture stress in rain-fed lowland rice production. Thus, considering
the poor soil fertility management by resource poor smallholder farmers and the high cost of
mineral fertilizers, combined use of FYM and mineral fertilizers at justifiable rates is central to
Tilahun, et al., 2013: Vol 1 (4) [email protected]
298

American Journal of Research Communication www.usa-journals.com
enhance the productive capacity of the soil and to improve rice productivity. From sustainable
rice production and immediate economic point of view, combined application of 7.5 t ha-1 FYM,
120 kg ha-1 N and 100 kg ha-1 P2O5 is recommended for rice production in the study area.
References
Ahmad A, Iqbal S, Ahmad S, Khaliq T, Nasim W, Husnain Z, Hussain A, Zia-Ul-Haq M and Hoogenboom G (2009) Seasonal growth, radiation interception, its conversion efficiency and biomass production of Oryza sativa L. Under diverse agroenvironments in Pakistan. Pakistan Journal of Botany, 41(3): 1241-1257.
Aziz T, Ullah S, Sattar A, Nasim M, Farooq M and Mujtabakhan M (2010). Nutrient Availability and Maize (Zea mays) Growth in Soil Amended with Organic Manures. International Journal of Agriculture and Biology 12(4):621–624.
Bernard PK (1993) Evaluation and interpretation of soil analytical data. National Soil service project, FAO/UNDP/ETH/87/010. Ministry of Agriculture, Addis Ababa, Ethiopia. 78Pp.
Bhatacharyya R, Kundu S, Prakash V, and Gupta HS (2008) Sustainability under combined application of mineral and organic fertilizers in a rainfed soybean-wheat system of the Indian Himalayas. European Journal of Agronomy 28: 33-46.
Bodruzzaman M, Meisner CA, Sadat MA and Hossain MI (2010) Long-term effects of applied organic manures and inorganic fertilizers on yield and soil fertility in a wheat-rice cropping pattern. 19th World Congress of Soil Science, Soil Solutions for a Changing World 1 – 6 August 2010, Brisbane, Australia. P 23-44.
Chandel G, Banerjee S, See S, Meena R, Sharma DJ and Verulkar SB (2011) Effects of Different Nitrogen Fertilizer Levels and Native Soil Properties on Rice Grain Fe, Zn and Protein Contents. Rice Science 17(3): 213-227.
CIMMYT (1988) From Agronomic Data to Farmer Recommendations. An Economic Training Manual. Completely Revised Edition. CIMMYT, Mexico, D. F., Mexico. 79 pp.
Dejene M and Lemlem M (2012) Integrated Agronomic Crop Managements to Improve Tef Productivity Under Terminal Drought. Water stress. Ismail Md. Mofizur Rahman and Hiroshi Hasegawa (eds.). Published by InTech Open Science. Pp 235-254.
Gomez KA and Gomez AA (1984) Statistical Procedures for Agricultural Research. 2nd Edn., John Wiley and Sons Inc., New York, pp 328-332.
Guan YS, Serraj R, Liu SH, Xu JL, Ali J, Wang WS, Venus E, Zhu LH and Li ZK (2010) Simultaneously improving yield under drought stress and non-stress conditions: a case study of rice (Oryza sativa L.). Journal of Experimental Botany 61(15):4145–4156.
Haefele SM and BAM Bouman (2009) Drought-prone rain-fed lowland rice in Asia: Limitations and management options. In: Serraj J, Bennett J, Hardy B, editors. Drought frontiers in rice: crop improvement for increased rain-fed production. Singapore: World Scientific Publishing and Los Baños (Philippines): International Rice Research Institute. Pp 211-232.
Haile D, Dechassa N and Ayana A (2012) Nitrogen use efficiency of bread wheat: Effects of nitrogen rate and time of application. Journal of Soil Science and Plant Nutrition, ahead of print Epub 25-Sep-2012.
Tilahun, et al., 2013: Vol 1 (4) [email protected]
299

American Journal of Research Communication www.usa-journals.com
Hossain AT, Rahman F, Saha PK and Solaiman ARM (2010) Effects Of Different Aged Poultry Litter on the Yield and Nutrient Balance In Boro Rice Cultivation. Bangladesh Journal of Agricultural Research 35(3) : 497-505.
Hunt R (19780 Plant Growth Analysis. The Inst. of Bio. Studies in Bio. Edward Arnold (Pub.) Ltd. pp 8-38.
Ibrahim M, Hassan A, Arshad M and Tanveer A (2010) Variation in root growth and nutrient
element concentration in wheat and rice: Effect of rate and type of organic materials. Soil and Environment 29(1): 47 – 52.
Jobe (2003) Integrated Nutrient Management for Increased Rice Production in the Inland Valleys of The Gambia. In: Sanyang S., A. Ajayi and A.A. Sy (eds). Proceedings of the Second Biennial Regional Rice Research Review. WARDA Proceedings Series no. 2 Vol 1. Pp 35-41.
Ladha JK, Pathak H, Krupnik TJ, Six J and Kessel C (2005) Efficiency of fertilizer nitrogen in cereal production: retrospects and prospects. Advances in Agronomy, 87:85-156.
Mahajan A, Bhagat RM and Gupta RD (2008) Integrated nutrient management in sustainable rice-wheat cropping system for food security in India. SAARC Jnournal of Agriculture 6(2):29-32.
Marschner P (2012) Marschner’s Mineral Nutrition of Higher Plants, 3rd ed. London, UK: Academic.
Naing A, Banterng P, Polthanee A and Trelo-Ges V (2010) The effect of different fertilizers management strategies on growth and yield of upland black glutinous rice and soil property. Asian Journal of Plant Sciences 9(7):414-422.
Page AL, Miller RH and Keeney DR (1982) Methods of Soil Analysis. Part 2. Chemical and Microbiological Properties. 2nd edn. Soil Science Society of America; Madison, Wisconsin, U.S.A.
Roy RN, Finck A, Blair GJ and Tandon HLS (2006) Plant nutrition for food security. A guide for integrated nutrient management. Food and Agricultural Organization of United Nations. FAO Fertilizer and Plant Nutrition Bulletin 16. Rome.348p.
Salem AKM (2006) Effect of Nitrogen Levels, Plant Spacing and Time of Farmyard Manure Application on the Productivity of Rice. Journal of Applied Sciences Research 2(11): 980-987.
Satyanarayana V, Prasad PV, Murthy VRK and Boote KJ (2002) Influence of integrated use of farmyard manure and inorganic fertilizers on yield and yield components of irrigated lowland rice. Journal of Plant Nutrition 25(10):2081–2090.
SAS Institute (2003) SAS Version 9. 1.2 © 2002-2003. SAS Institute, Inc., Cary, NC. Sewagegne T (2011) An Overview of Rice Research in Ethiopia. In: Kebebew Assefa Dawit
Alemu, Kiyoshi Shiratori and Abebe Kirub (eds). Challenges and Opportunities of Rice in Ethiopian Agricultural Development. FRG II Project, Empowering Farmers' Innovation Series No. 2. ©EIAR/JICA, Addis Ababa, Ethiopia. Pp 33-38.
Singh VP and Singh RK (2000) Rainfed Rice: A Sourcebook of Best Practices and Strategies in Eastern India. International Rice Research Institute. 292 p.
Tilahun G, Berhe K, Hoekstra D and Bogale A (2012) Rice value chain development in Fogera woreda based on the IPMS experience. Nairobi, Kenya: ILRI. 23pp.
Tsuda M, Endo and Hirai Y (2010) Effects of Top Dressing on Growth and Panicle Dry Weight as Affected by Soil Water Stress at the Early Panicle-Development Stage in Rice (Oryza sativa L.). Plant Production Science 13(1): 37-44.
Tilahun, et al., 2013: Vol 1 (4) [email protected]
300

American Journal of Research Communication www.usa-journals.com
Tilahun, et al., 2013: Vol 1 (4) [email protected]
301
Waraich AE, Ahmad R, Saifullah MY and Ehsanullah A (2011) Role of mineral nutrition in alleviation of drought stress in plants. Australian Journal of Crop Science 5(6):764-777.
Wonprasaida S, Khunthasuvona S, Sittisuangb P and Fukai S (2006) Performance of contrasting rice cultivars selected for rainfed lowland conditions in relation to soil fertility and water availability. Field Crops Research 47(2–3):267–275.
Yassen A, Khaled A, Sahar SM and Zaghloul M (2010) Response of wheat to different rates and ratios of organic residues on yield and chemical composition under two types of soil. Journal of American Science 6(12):858-864.
Yoshida S (1981) Fundamentals of rice crop science The International Rice Research Institute, Los Baños, Laguna, Philippines. 269 Pp.