Brampton AD Report public - Brampton and Beyond...
94
Greenacres Energy Ltd Company no. 06983884 VAT no. 111 0565 70 Registered Office: 6 Brunswick Street, Carlisle, Cumbria, CA1 1PN, UK Rob Skinner: M: 07775 764263 E: [email protected] Gunter Woltron: 07739 456547 E: [email protected] Anaerobic Digestion Feedstock Study for Brampton and Beyond Energy Limited Issued to: Timothy Coombe, Project Chair for the Brampton AD, Brampton and Beyond Energy Limited Brampton Community Centre, Union Lane, Brampton, Cumbria, CA8 1BX T: 01697 745023 E: [email protected] Public Version Jan. 2014 Report produced by: Funded by: Greenacres Energy Ltd The Cooperative Enterprise Hub Supported by:
Transcript of Brampton AD Report public - Brampton and Beyond...

Greenacres Energy Ltd ·∙ Company no. 06983884 ·∙ VAT no. 111 0565 70 Registered Office: 6 Brunswick Street, Carlisle, Cumbria, CA1 1PN, UK
Rob Skinner: M: 07775 764263 ·∙ E: [email protected] Gunter Woltron: 07739 456547 ·∙ E: [email protected]
Anaerobic Digestion Feedstock Study
for
Brampton and Beyond Energy Limited
Issued to: Timothy Coombe, Project Chair for the Brampton AD, Brampton and Beyond Energy Limited
Brampton Community Centre, Union Lane, Brampton, Cumbria, CA8 1BX
T: 01697 745023 ·∙ E: [email protected]
Public Version
Jan. 2014
Report produced by: Funded by:
Greenacres Energy Ltd The Co-‐operative Enterprise Hub
Supported by:

BABE – Brampton AD Feedstock Study
Public Version page 2 of 94
Confidential
This document contains proprietary and confidential information. All data submitted to Brampton and Beyond Energy Limited (the “Recipient”) is provided in reliance upon its consent not to disclose, duplicate or distribute any information contained herein (without the express written permission of Greenacres) except in the context of its business dealings with its professional advisors. The Recipient agrees to inform present and future employees or board members of Brampton and Beyond Energy Limited and professional advisors who view or have access to its content of its confidential nature.
The information in this publication has been supplied in all good faith and believed to be correct. However, all advice, analysis, calculations, information, forecasts and recommendations are supplied for the assistance of the Recipient and are not to be relied on as authoritative or as in substitution for the exercise of judgement by that Recipient or any other reader. Greenacres Energy Ltd nor any of its personnel engaged in the preparation of this Report shall have any liability whatsoever for any direct or consequential loss arising from use of this Report or its contents and give no warranty or representation (express or implied) as to the quality or fitness for the purpose of any process, material, product or system referred to in the report.
Any liability arising out of use by a third party of this document for purposes not wholly connected with the Recipient shall be the responsibility of that party who shall indemnify Greenacres Energy Ltd against all claims, costs, damages and losses arising out of such use.
All rights reserved. No part of this publication may be reproduced or transmitted in any form or by any means electronic, mechanical, photocopied, recorded or otherwise, or stored in any retrieval system of any nature without the written permission of the copyright holder.
By acceptance of this document, the recipient agrees to be bound by the aforementioned statement.
Motto
"The waste management industry sits at the heart of the development of a Circular Economy"
David Palmer-‐ Jones, chairman of the Environment Services Association (ESA)

BABE – Brampton AD Feedstock Study
Public Version page 3 of 94
Content
Confidentiality Notice
Chapter 1 Preliminaries
1.1 Acknowledgements 05
1.2 Abbreviations 05
1.3 Glossary 06
1.4 Translations 09
Chapter 2 Executive Summary 10
Chapter 3 Introduction
3.1 Context 12
3.2 Scope 13
Chapter 4 Feedstock Assessment
4.1 Resource Survey Basics 15
4.1.1 Supply Source Area 15 4.1.2 Land Classifications and Designations 16 4.1.3 Energy Content of Biogas Substrates 21 4.1.4 Assessment Criteria 22 4.1.5 Initial Feedback 22
4.2 Stage 1: Farms with available Livestock and Land 24
4.3 Stage 2: Feedstock Potential – Qualities and Quantities 26
4.3.1 Feedstock Potential from Livestock Manures and Slurry 26 4.3.2 Feedstock Potential form Grass Silage 29 4.3.3 Feedstock Potential from ‘Other Substrates’ 31 4.3.1 Supply Source Area 15 4.3.4 Conclusion 32 4.3.5 EWC Listing 33
4.4 Stage 3: Potential Biogas Yield and Digestate Output 34
4.4.1 Biogas Yields – Apples and Pears? 34 4.4.2 Methods to establish the Biogas Potential 35 4.4.3 Biogas Yield Estimates 39 4.4.4 Digestate Yield Estimates 40
4.5 Stage 4: Electrical and Thermal Output 42
4.5.1 Background Assumptions 42 4.5.2 Calorific Energy 43 4.5.3 Output Calculations 44 4.5.4 Parasitic Energy Demand and Exportable Energy 47
Chapter 5 Risks and Impacts
5.1 Feedstock Compatibility 49
5.2 Feedstock and Consents 51
5.2.1 The Planning Permit 51 5.2.2 The Planning Route 51 5.2.3 Key Environmental Impacts 52 5.2.4 The Environmental Permit 57

BABE – Brampton AD Feedstock Study
Public Version page 4 of 94
5.2.5 Management Plans 53 5.2.6 Quality Control for Digestate Use 65 5.2.7 Accreditation for Quality Digestate 66
5.3 Feedstock-‐related Infrastructure 68
5.3.1 Systems Recommendations 68 5.3.2 Slurry Storage Volume Calculation 68 5.3.3 Silage Clamp Volume Calculation 68 5.3.2 Digestate Storage Volume Calculation 69
5.4 Feedstock Yields: Worst/Best Case Scenario 70
5.4.1 The ‘Worst Case’ Scenario 71 5.4.2 The ‘Best Case’ Scenario 74 5.4.3 Impact on CHP Selection and Plant Expansion 77
5.5 Security of Supply 78
5.5.1 Contract Strategy 78 5.5.2 Contracted Volume 78 5.5.3 Back-‐up Feedstock 79 5.5.4 Contract Risks 79
Chapter 6 Considerations
6.1 Supply Contract Terms 82
6.1.1 Contract Advice 82 6.1.2 Relevant Contract Terms 82
6.2 Financial Aspects 87
6.2.1 Cost Factor and Value of Silage 87 6.2.2 Cost Factor and Value of Digestate 87
6.3 Operational Considerations 88
6.3.1 Best Practice 88 6.3.2 Land Management 88 6.3.3 Silage Clamp Management 88 6.3.4 Feedstock Reception and Handling 89 6.3.5 Feedstock Measurement and Quality Control 90 6.3.6 H&S, OPRA and the competent Person 91 6.3.7 Machinery 91 6.3.8 Future Proof 91
6.4 Community 92
6.5 Sustainability 93
Appendices
App A: References and Literature 95
App B: Potential Feedstock Suppliers 97
App C: Applied Assumptions 98
App D: Industry Contacts 101
App E: Traffic Movements 103
App F: Best Practice Guidance 104
App G: Supply Contract – Heads of Terms 105
App H: Authors 114

BABE – Brampton AD Feedstock Study
Public Version page 5 of 94
1. Preliminaries
1.1. Acknowledgements
The assistance and support of the following people during the course of the study is gratefully acknowledged.
Eleanor Fielding, Environment Officer Cumbria, Environment Agency Gillan Way, Penrith 40 Business Park, Penrith, Cumbria, CA11 9BP; <eleanor.fielding@environment-‐agency.gov.uk
Mark Holtmann, Project Manager UK & IRL 2G Energietechnik GmbH, Benzstrasse 10, 48619 Heek, DE; <m.holtmann@2-‐g.de>
Maggie Mason, Senior Planner, Planning and Sustainability, Environment, Cumbria County Council County Offices, Busher Walk, Kendal, Cumbria, LA9 4RQ; <[email protected]>
Barbara McCarthy, Team Leader, Geographical Information & Analysis Services Team Natural England; <[email protected]>
Lucy Nattrass, Senior Consultant, NNFCC Biocentre, York Science Park, Innovation Way, Heslington, York, YO10 5DG; <[email protected]>
1.2. Abbreviations
ABP animal by-‐products
ABC ABC Budgeting & Costings Book
AD anaerobic digestion
ADBA The Anaerobic Digestion and Biogas Association Ltd
AFBI Agri-‐Food and Biosciences Institute
AHDB Agricultural & Horticultural Development Board
BABE Brampton and Beyond Energy Limited
BMP biological methane potential (test)
CH4 methane
CHP -‐ combined heat and power
CO2 carbon dioxide
DairyCo DairyCo, a division of the AHDB
DEFRA Department for Environment, Food and Rural Affairs
DM dry mater (content)
EA Environment Agency
FiT Feed-‐in Tariff(s)
FYM farmyard manure
FW fresh weight, also abbreviated as WW – wet weight
GHG green house gases
HRT hydraulic retention time
KTBL Kuratorium für Technik und Bauwesen in der Landwirtschaft e.V.
LfL Bayrische Landesanstalt für Landwirtschaft (Bavarian Institute for Agriculture)
kW kilowatt

BABE – Brampton AD Feedstock Study
Public Version page 6 of 94
kWe kilowatt electric
kWh kilowatt hour
kWh el kilowatt hour electric
kWh th kilowatt hour thermal
ME metabolic energy
MJ megajoule (1 MJ = 1000 kJ = 106 J)
MW megawatt
MWe megawatt electric
NFU National Farmers Union
Nl norm(al) litre
Nm3 norm(al) cubic metre
NNFCC The National Non-‐Food Crops Centre
NPK nitrates, phosphates, potassium
NVZ Nitrate Vulnerable Zone
oDM organic dry matter
ORL organic loading rate
PGC purpose grown crops (i.e. energy crops)
PPA Power Purchase Agreement (or Power Uptake Agreement)
STP Standard Temperature and Pressure, describing Standard Conditions for gas
RASE Royal Agricultural Society of England
t metric tonne at 1,000 kg
WRAP Waste & Resource Action Programme
1.3. Glossary
This document will use the following terms for the expressions listed below:
Anaerobic digestion in accordance with EA & WRAP means the process of controlled decomposition of biodegradable materials under managed conditions:
• Where free oxygen is absent,
• At temperatures suitable for naturally occurring mesophilic or thermophilic anaerobic and facultative bacteria species,
• That convert the inputs to biogas and whole digestate
Anaerobic digestion in accordance with Feed-‐in Tariffs (Specified maximum Capacity and Functions) Order 2010 means the bacterial fermentation of organic material in the absence of free oxygen (excluding anaerobic digestion from sewage and material in a landfill).
Agricultural manure are also referred to as livestock manures and means slurries and solid manures, including farmyard manures. (A definition from the Codes of Good Agricultural Practice also includes ‘dirty water’.)
Biodegradable means capable of undergoing biologically mediated decomposition.
Biowaste means waste of animal or plant origin, which can be decomposed by micro-‐organisms, other larger soil-‐borne organisms or enzymes.
Carbon to Nitrogen ration (C:N) refers to the relationship between the amount of carbon and

BABE – Brampton AD Feedstock Study
Public Version page 7 of 94
nitrogen present in organic materials.
Calorific value is also referred to as ‘heating value’ or ‘energy value’ and means the energy value of a substance, e.g. methane, from its heat released during the combustion of a specified amount under standard conditions. The calorific value is measured in units of energy per unit of the substance. Of the two versions, the ‘higher calorific’, ‘gross calorific’ or ‘upper’/superior heating’ value and ‘lower calorific’, ‘net calorific’ or ‘inferior heating’ value the latter one is applied.
Capacity (or installed capacity) means the maximum load a generating unit (like a CHP unit) or other electrical apparatus is rated to carry. The capacity can be based on the nameplate rating or the declared net (dependable) capacity.
Chemical oxygen demand (COD) means an indirect measure of the amount of organic compounds in a substance, in which a sample of the substance is incubated with a strong chemical oxidant under specific temperature conditions and for particular period of time.
Combined Heat and Power (CHP) means the simultaneous conversion of implanted energy into mechanical/electrical energy and usable heat and power. In accordance with the FiT scheme, a CHP engine or turbine (and alternator) is part of the ‘generating equipment’ within an AD installation, which converts (bio)gas formed by the anaerobic digestion of material (which is neither sewage nor material in a landfill) into electricity.
Digestate is also referred to as ‘whole digestate’ or ‘raw digestate’ and means the material (or residue) remaining after the anaerobic digestion process, which has not undergone a post-‐digestion treatment (or separation) to derive separated liquor and separated fibre.
Dirty water means dilute washings from dairy and milking parlours and run-‐off from yard areas slightly contaminated by manure, slurry or used animal bedding.
Dry matter (DM) is also referred to as total solids (TS) and is a measure for dry solids, opposite to the moisture content (under the BS EN 14346 method of test). Under European Standard DM is defined as dry residue after drying according to the specified drying process; it is expressed as percentage or in grams per kilogram. Dry matter applies to the material left after an evaporation period and its subsequent drying in a drying oven at 110˚C and cooling off, all procedures over defined periods. Dry matter consists of ‘Total Suspended Solids’ and ‘Total Dissolved Solids’.
Feed-‐in Tariffs (FiT) means a GB-‐wide scheme under which licensed electricity suppliers will pay small-‐scale generators (of up to 5MWe installed capacity) of renewable electricity at prescribed tariffs for the amounts of electricity that they generate and the amounts that they export to the distribution network.
Hydraulic retention time (HRT) means the average time that material stays in the digester vessel or tank, determined by the loading rate and operational digester capacity.
Historic Environment means ancient monuments (scheduled and unscheduled), archaeological sites and landscapes, historic buildings (listed and unlisted and those within Conservation Areas), historic gardens and designed landscapes and includes their context and settings.
Input material means biodegradable material intended for feeding, or fed, into an AD process, it should be source segregated and not include contaminated wastes, products or materials.
Full load hours means the period of an installation at full output performance, where the correlation of total working hours and average output efficiency within one year is expressed as part of 100% efficiency or as equivalent hours per year.
Manures or solid manures include farmyard manure (FYM) and means material consisting of covered straw yards, excreta with a lot of bedding material, typically straw, in it, or solids from mechanical

BABE – Brampton AD Feedstock Study
Public Version page 8 of 94
slurry separators. Solid manures can generally be stacked. (In some literature ‘manure’ is used as collective term for solid manure and slurry.)
Mesophilic means a temperature range for organisms for which optimum growth temperatures are within the spectrum of 30°C to 45°C.
Methane number means the gas resistance of knocking in a combustion engine. By definition, methane has a methane number of 100 while carbon dioxide (in the biogas mix) increases this value.
Micro-‐generation or Micro-‐renewables means the generation, from low or zero-‐carbon sources, of electricity of up to 50kW capacity and heat of up to 45kW capacity, as set by the Electricity Act 2004.
Mixed farming (system) means, as defined by the World Health Organisation (WHO), is where cropping and livestock rearing are linked activities, in which more than 10% of the dry matter fed to the livestock comes from crop by-‐products or stubble, or where more than 10% of the total value of production comes from non-‐livestock farming activities. Defra’s definition is ‘where crops account for 1/3, but less than 2/3 of total standard gross margin and livestock accounts for 1/3, but less than 2/3 of total standard gross margin’.
Norm(al) cubic metre (Nm3) means the amount of gas in a volume of a cubic metre under norm(al) or standard conditions, i.e. 0°C, 0% humidity and 1.01325 bar pressure level
Organic dry matter (oDM) is also referred to as volatile solids (VS) or loss of ignition (LOI) and is a measure for organic matter and means those solids in a sample of material that are lost on ignition of the dry solids at 550˚C within a high temperature muffle furnace and over a defined time (applying the BS EN 15169 method of test). The remaining material (of the test) is ash made up of inorganic material (e.g. grit, minerals, salts, etc) and also referred to as fixed solids (FS)
Organic loading rate (OLR) means the fresh weight of organic matter fed to a unit volume of the digester per unit time, usually per day
Pasteurization means a process step during which the numbers of pathogenic bacteria, viruses and other harmful organisms in material undergoing anaerobic digestion are significantly reduced or eliminated by heating the material to a critical temperature for a minimum specified period of time.
pH-‐value means a measure for the acidity or alcality of a substance or input material
Project means the proposed Brampton AD plant by Brampton and Beyond Energy Limited
Raw biogas means the biogas in the raw state immediately after the AD process and before any upgrade process and refers rather to AD plants where biogas is adjusted to bio-‐methane for gas grid injection or vehicle fuel rather than for combustion in a CHP unit
Recipient means Brampton and Beyond Energy Limited.
Retention time means the time that a substrate resides in the digester; it is expressed in days
Renewables Obligation Certificate (ROC) means a scheme based on the Renewables Obligation (RO) legislation, which requires licensed electricity suppliers to source a specific and annually increasing percentage of the electricity they provide from renewable sources, each megawatt hour certified by one Renewables Obligation Certificate (ROC). Where suppliers have insufficient ROCs to meet their obligation, they have to make a payment into a buy-‐out fund, whose proceeds are paid back to suppliers in proportion to how many ROCs they have presented. Different renewable technologies attract different ROC values. From 1st April 2013 only renewable generating stations with over 5MWe installed capacity are entitled for the RO system, installations generating less than 5MWe are exclusively catered for by Feed-‐in Tariffs.

BABE – Brampton AD Feedstock Study
Public Version page 9 of 94
Slurry means a material consisting of excreta produced by livestock in a yard or building optionally mixed with rainwater and wash water and in some cases, waste bedding material and feed. Slurries can be pumped or discharged by gravity.
Source segregated means the input materials or biowastes of the types and sources sought, that are stored, collected and not subsequently combined with any non-‐biodegradable wastes, or any potentially polluting or toxic materials or products, during treatment or storage (whether storage is before or after treatment).
Study means this report.
Supply agreement means a contract between an AD facility operator and a supplier of digestable input materials, that specifies suitable material types, quality, options and actions to be taken in the event of contamination, and other criteria that facilitate input material control
Thermophilic means a temperature range for organisms for which optimum growth temperatures are within the spectrum of 45°C to 80°C
Trust means Brampton and Beyond Community Trust
Wobbe Index means a quality reference of combustion gases. Similar Wobbe values point to the interchangeability of gases, e.g. without further modification of combustion nozzles.
1.4. Translations
Considering the number of German technology providers operating in UK, the following industry terms might help to avoid any communication being lost in translation.
anaerobic digester, AD plant Biogasanlage (BGA)
combined heat and power plant Blockheizkraftwerk (BHKW)
digestate Gärreste, Endsubstrat
digestibility value (DV) Verdauungsquotient (VQ)
dry matter (DM) Trockenmasse (TM), Trockensubstanz (TS)
ear emergence, panicles ripening Rispenschieben
farmyard manure (FYM) Festmist, Tretmist
first cut erste Fruchtfolge
fresh weight (FW) Frischmasse (FM)
full load hours Volllaststunden, Vollbenutzungsstunden
generation of electricity Verstromung
input, throughput Durchsatz
input material Einsatzstoffe
livestock unit (LSU or LU) Grossvieheinheit (GVE or GV)
lower calorific/inferior heating value unterer Heizwert
nitrates, phosphates, potassium Stickstoff, Phosphor, Kalium
organic dry matter (oDM) organische Trockenmasse (oTM), org. Trockensubstanz (oTS)
organic loading rate (OLR) Raumbelastung
retention time Verweildauer, Verweilzeit
rye grass Weidelgras
slurry Gülle
whole crop silage (WCS) Ganzpflanzensilage (GPS)

BABE – Brampton AD Feedstock Study
Public Version page 10 of 94
2. Executive Summary
The report presents the results of a study into the detailed feedstock availability for the Brampton AD project based on a catchment area of 5 km within the Townfoot Industrial Estate to the South East of Brampton. The feedstock study followed the following methodology:
Identify land and livestock-‐based supplies of input material for the AD Assess the suitability of input material in regard to quantity, quality and compatibility Assess the yield or output potential in for AD Substantiate the supplies’ contractual, environmental, operational and regulatory impact
Findings
The study identified sufficient input material to sustain a commercial anaerobic digester and a highly compatible feedstock mix. The feedstock is sourced from four farms with 369 acres in principle available to supply energy crops (grass silage) and ten farms supplying livestock manures (dairy slurry). All silage supply areas are marginal land, currently allowing for improvements in agricultural standards for biogas production and not used for direct food production. The break crop, as part of a wider agricultural management plan, would be whole crop or clover mixture.
The conservative yield for grass silage is expected to be 5,427 tons of fresh weight at 25% of dry matter content. The total access to dairy slurry is 24,375 m3 before any dilution from rain or wash water, a volume far in excess to what can be utilised in a ‘silage AD’ system. The technology provider to-‐be will have to determine the actual volume of slurry required for optimal operational conditions.
A minor feedstock source in the form of brewery waste, located on the bespoke industrial estate, would be disregarded. The absence of food waste in the feedstock supply should simplify planning (HACCP and EIA), regulatory compliance (PAS110) and operation (no pasteurisation).
From a planning and permitting perspective the Brampton AD scheme represents a non-‐farm AD based on agricultural input material. The cluster of suppliers mirrors In effect a ‘Central AD’ (CAD) model, which lends itself favourably to cooperative ownership and energy and digestate usage.
The biogas potential of the identified feedstock would result, given ideal (weather) conditions, in a CHP unit in the range of 250kWe capacity. The Study applied several restrictions on the availability of land, the silage yield and the quality of slurry and adjusted the biogas potential to a more realistic and continuously achievable level. This potential is matched with a CHP engine of an installed capacity of 200kWe. The thermal capacity of 199kWth is applied for the highest RHI bandwidth.
The estimated typical plant output per year (before parasitic demand is deducted) from the given input material is 1,560,000kWh (or 1,566MWh) electric and 1,552,200kWh (or 1,552MWh) thermal, with a small margin for electrical and performance uncertainties already considered.
The impact of the proposed AD scheme on the environment would be none (landscape) or minimal (transport), while the carbon reduction from the generation of renewable electricity and heat would be significant. The industrial estate would absorb the installation of a silage clamp, digester tank(s) and plant periphery. The impact on local farming would be positive as the AD scheme nurtures traditional farming methods and provides local farms with long-‐term source of income and fertiliser.
Focus Points
The type of feedstock supply arrangement, with an agricultural land lease preferred over a tonnage-‐based supply contract, will be crucial for the level of land management and the control over it.
The timing for land preparation, harvest and silage is to be streamlined with the plant start-‐up.
The compliance regime for the distribution of digestate would be simplified if all supply farms would own an even nominal share of the SPV.

BABE – Brampton AD Feedstock Study
Public Version page 11 of 94
Summary Table
The following table summarizes the findings for a typical year of operation, the generated output are raw figures are before any output uncertainties are deducted.
Table 1: Summary of findings
1) LfL applies different values for first and second grass cuttings, which could not be displayed in the spreadsheet
2) Efficiency values are from a 200kWe CHP unit
3) Raw figures before any final risk considerations are applied

BABE – Brampton AD Feedstock Study
Public Version page 12 of 94
3. Introduction
3.1. Context
Brampton and Beyond Community Trust is a community trust based in the east of Cumbria, established with the aim to promote and demonstrate a sustainable way of art, health and work.
One of its projects is to establish an asset in the form of an anaerobic digestion facility, set up and operated in a sustainable and cost effective manner. It aims to utilize locally available agricultural surplus material and optionally discarded food resources and to generate renewable energy. Along goes a vision for community engagement, covering cooperative ownership, supply partnership and a cooperative use of plant outputs like heat. Such a successful project would put Brampton on the forefront of sustainability in a rural context.
The Trust commissioned an initial feedstock assessment and a generic capability study. The topics covered by the study of the University of Newcastle, outside the scope of this Study, are:
• Environmental and agronomic benefits of AD
• Financial mechanisms for AD
• Political framework of renewable energy
• Technical design concepts
The subsequent view of how an AD plant could function within the local community is, also for the sake of clarity, compacted in the following illustration. It shows in principle the material and energy movements of a (wet) AD plant as envisaged for the Brampton AD scheme.
Illustration 1: Schematic material and energy flow of an agricultural AD plant
The initial results provided the Trust with sufficient know how and confidence to establish a dedicated development organisation, aptly named ‘Brampton and Beyond Energy Limited’. It gained its incorporation in December 2012 as an Industrial and Provident Society (IPS). Throughout the Study Brampton and Beyond Energy Limited is abbreviated as ‘BABE’.
BABE opted for an AD technology type – a wet and continuous system – and for a preferred location of the proposed Brampton AD plant, the Townfoot Industrial Estate at the outskirts of Brampton. The development would be located wholly within the boundaries of the industrial estate and not within

BABE – Brampton AD Feedstock Study
Public Version page 13 of 94
any flood risk zone. The industrial and light industrial use of the Industrial estate would offer wide-‐ranging opportunities for the sale of power and heat.
As a next step the Brampton AD Project requires a detailed feedstock study to confirm and amplify the findings of the preliminary feedstock assessment and draft business plan. Such a detailed supply resource assessment will feed into planning, technical design and a refined business and finance plan. The latter will require robust information to present an internal risk assessment and to handle the scrutiny of a due diligence exercise by finance providers.
The Study is undertaken with a backdrop of an increasing interest in community renewables and agricultural AD, which puts BABE in the centre of interest. BABE has recognised the need voiced by funders, both from a private and institutional background, for realistically achievable and contractually secured supply volumes.
3.2. Scope
The AD business is unusual by having practically no exposure to risks from end users because of payment system offered by Feed-‐in Tariffs. (The same applies to AD businesses in countries, which have implemented the same or a similar tariff system.) Naturally such conditions have created a boom over the last few years, which can be witnessed on numerous conferences and exhibition with an ever-‐increasing audience. Despite the growing maturity of the sector not everything is going according to plan: the number of completed AD facilities is lacking behind predictions, a few operational plants are clearly behind commercial expectations, some AD development companies have closed down and a good number of permitted AD projects are not attracting funding.
The above situation applies to AD projects based on agricultural feedstock as well as food waste. While both sectors have in common an evolving attitude by developers and funders to risks and profits associated with AD, the agricultural AD sector faces an additional hurdle. Putting aside the different lingos and cultures between the finance and farming world, the ‘feedstock security issue’ has been identified as one of the key issues for successful project finance.
While both sides are trying to find creative farming and financial solutions for bridging the gap between short-‐term cropping practises and the need for long-‐term supply contracts, the contribution from community and farming groups or cooperatives ought to be of even more interest to the industry. Any cooperative approach should have a wider arsenal of creative solutions at its disposal than a single ownership perspective.
The internal and external risks associated with feedstock or ‘input material’ for AD are numerous. The aim of this Study is to provide facts in line with our approach of ‘risk equals measurable uncertainty’; to achieve this aim we apply the first two phases of the following methodology. (The latter two phases are to be dealt with during live operations.)
• Risk identification
• Risk evaluation
• Risk management and risk diversification
• Risk controlling
The risk exposure in regard to input material is at the beginning of a chain of several energy conversions in an AD plant, which are:
• Cultivating and/or capturing calorific energy from Input material, which includes harvesting/ collecting and silage making/storing of slurry
• Converting calorific energy from carbon-‐based material to biogas through the anaerobic digestion process
• Combusting methane to electricity (and heat) in a CHP unit

BABE – Brampton AD Feedstock Study
Public Version page 14 of 94
The illustration below shows the remit of the Study within this energy conversion chain and factors impacting on the energy carrying material:
Illustration 2: Thematic scope (coloured area) within the AD plant energy conversion chain
Crucially, any risk leading to energy potential lost in an early phase cannot be regained in the next phase. Therefore any risk affecting the loss of quantity or quality (and the continuity) of feedstock cannot be compensated at a later phase.
The AD Feedstock Study is an integrated field and desktop study and consists of two main sections: the first part will assess the feedstock potential and its energy potential, the second section will investigate any regulatory, technical, commercial and legal risks and impacts for the identified feedstock selection. The main objectives of the Study are:
• To determine the types, the quantity and quality of AD-‐suitable feedstock that could be supplied from farms within an agreed supply source area
• To estimate the AD plant’s energy output using a biogas-‐fuelled CHP engine
• To estimate the cost to the AD project from acquiring feedstock
• To evaluate risks and impacts to the feedstock from different farming methods
• To evaluate risks and impacts to the feedstock from regulatory and financial aspects
• To prepare a template for a supply contract that could be used for any potential supplier.
• To recommend how different forms of feedstock should be stored and prepared prior to being used in the AD plant

BABE – Brampton AD Feedstock Study
Public Version page 15 of 94
4. Feedstock Assessment
At the very outset of this feedstock study all parties committed themselves to work with an open mind to first identify any available sources of input material and decide on their usefulness after the information gathering. During a feedback meeting halfway through the feedstock data collection phase the BABE project board announced a change of strategy in so far as to abandon the search for food waste and ABP material from e.g. abattoirs.
The following chapters are going to reflect on the redefined focus on livestock manures and slurries, grass silage and agricultural surplus material, either on-‐farm organic agricultural waste or off-‐farm process waste of agricultural material.
In order to identify and manage any individual risk factor, the feedstock study follows the following methodology:
To identify land and livestock capable of supplying input material for the AD project
To assess the potential quantity and quality of the supply material
To assess the potential biogas yield and digestate output from the anaerobic digester
To estimate the likely electric and thermal output from the attached CHP unit
4.1. Resource Survey Basics
4.1.1. Supply Source Area
The study focussed on potential agricultural feedstock suppliers within an agreed supply source search area, a 5km radius of the proposed plant location, the Townfoot Industrial Estate, Brampton, Cumbria, CA8 1SW. Brampton is 117m above sea level.
The BABE project board chose the Townfoot Industrial Estate for its convenient access, unused land available for rental and near-‐by grid connection points.
At the start of the study a web site listed 20 businesses located at the industrial estate, which offered a prospect of on-‐site heat and power sales. The industrial estate might further offer rental opportunities fur future community enterprises utilising and benefitting from heat in the form of hot water from the proposed anaerobic digester.
The coordinates of the Townfoot Industrial Estate are:
OS X (Eastings): 352199
OS Y (Northings): 560991
The designation of the envisaged plant location not being a ‘working farm’ means that the project cannot be defined as ‘on-‐farm AD’, even if its input material would entirely consist of energy crops and agricultural manures. Nevertheless, with the absence of any food waste the AD plant would be classified as ‘agricultural’ plant. Such differentiation can be of relevance for environmental permitting and planning regulations.
The reasons for the 5km limitation for supply of input material were based on sustainability considerations, in particular on the concept of ‘food miles, which aims to keep the amount of transport distance and traffic frequency of the supply chain to a minimum. In the context of an AD plant any consideration for traffic movements also applies to digestate spreading.
The following map shows the identified supply source area with the Townfoot Industrial Estate marked at its centre.

BABE – Brampton AD Feedstock Study
Public Version page 16 of 94
Map 1: AD Supply Source Area with Brampton’s Townfoot Industrial Estate at its centre © Crown copyright and database rights 2013 Ordnance Survey 0100031673
4.1.2. Land Classification and Designations
As an overall description, the area in consideration consists mainly of hillside farming on grass land with a mix of small holdings and medium-‐sized livestock farms reflecting the economic ‘in-‐need-‐of-‐investment’ status of Brampton as the local hub.
The Land Classification for Agriculture (LCA) categorises the agricultural land capability; the LCA within the supply source area can mainly be attributed to:
• Grade 3, Sub-‐grade 3a – good quality agricultural land
• Grade 3, Sub-‐grade 3b – moderate quality agricultural land
and smaller areas of:
• Grade 2 – very good quality agricultural land – alongside the River Irthing
• Grade 4 – poor quality agricultural land – and significant areas North and West and
• Grade 5 – very poor quality agricultural land – pockets of land to the North West

BABE – Brampton AD Feedstock Study
Public Version page 17 of 94
Map 2: Land Classification for Agriculture for the wider Brampton area; © Natural England
As shown below, the predominant use of agricultural land is for grassland with a mixture of pasture land and fields for intensive and extensive crop growing; land near the River Irthing is used for whole crop silage.
Map 3: Dudley Stamp Land Use Inventory; © Environment Agency; use by kind permission

BABE – Brampton AD Feedstock Study
Public Version page 18 of 94
Environmental and landscape designations can have an adverse impact – from noise, odour, light pollution etc. – on any proposed AD plant location as well as on any farm land supplying energy crops where a significant change in landscape occurs.
The following snapshots are based from 1:250,000 maps by http://magic.defra.gov.uk/ under the Central Government Public Sector Mapping Agreement (PSMA).
Whilst the proposed AD location is under no impact from statutory landscape designations like National Parks or Areas of Outstanding Natural Beauty (AONB), the South West of the supply source area is affected by the Northern Pennines AONB any visual impact from land use for the AD will have to be taken into consideration.
Map 4: Location and boundaries for AONB, NNR and Moorland line © Crown Copyright and database rights 2013. Ordnance Survey
Map 5: Locations and boundaries for SSSI and SAC © Crown Copyright and database rights 2013. Ordnance Survey

BABE – Brampton AD Feedstock Study
Public Version page 19 of 94
In regard to environmental designations, the most relevant Sites of Special Scientific Interest (SSSI) are the White Moss, Crosbymoor SSSI to the East of Brampton, and the Unity Bog SSSI, the Gelts Wood SSSI and the Cairnbridge Sand Pit SSSI to the South of Brampton. The Walton Moss National Nature Reserve (NNR) plus the Walton Moss Special Area of Conservation (SAC), a status of European importance, is a raised bog at the North West of Brampton. The NNR and the SSSIs will have to be taken into account if there is any change of agricultural practice adverse to the purpose of designation.
Of more impact for the supply source area will probably be the buffer zone of the Hadrian Wall, a World Heritage Site (WHS) with its course from to the West to the East in the North of Brampton. The buffer zone is not arranged by a fixed distance to the Hadrian Wall, but takes geographical features affecting the visibility of the Wall into account.
Map 6: Boundaries for the Hadrian Wall World Heritage Site © Crown Copyright and database rights 2013. Ordnance Survey
Map 7: Locations of historic statutory sites © Crown Copyright and database rights 2013. Ordnance Survey
BABE – Brampton AD Feedstock Study
Public Version page 20 of 94
Map 7 shows the content of map 6 with the additional layer of Scheduled Monuments.
Archaeological sites and WW2 aircraft sites have not been included on maps, as with no relevant change in farming practices – unless a field will be ploughed for the very first time – no impact from sub-‐soil objects is expected.
In regard to agro-‐environmental schemes, many farms have entered into Entry Level or Countryside Stewardship Schemes and farmers might not want to loose financial benefits arising from them, this may result in a slight reduction of land available for silage production and will have to be considered for crop yield calculations.
Geographical features like altitude, exposure, topography and steepness of slope might effect grass seed selection, cutting frequency and yield. Those impacts where applicable are considered in the overall productivity figures.
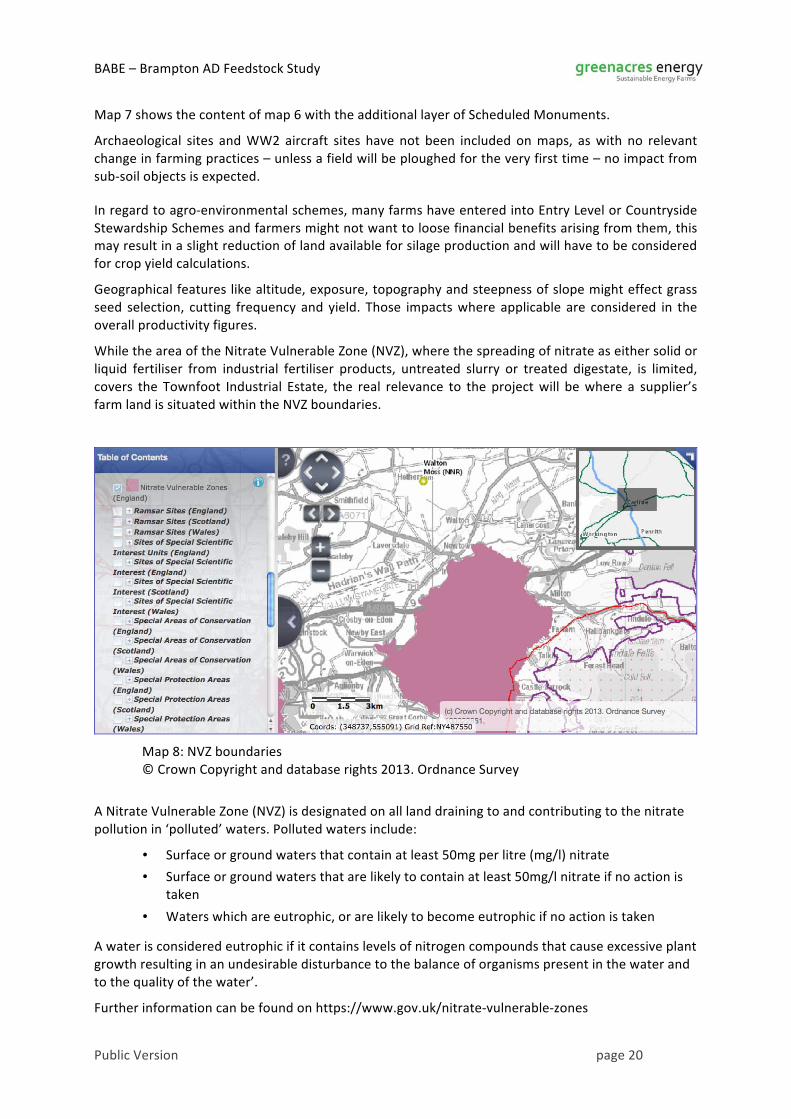
While the area of the Nitrate Vulnerable Zone (NVZ), where the spreading of nitrate as either solid or liquid fertiliser from industrial fertiliser products, untreated slurry or treated digestate, is limited, covers the Townfoot Industrial Estate, the real relevance to the project will be where a supplier’s farm land is situated within the NVZ boundaries.
Map 8: NVZ boundaries © Crown Copyright and database rights 2013. Ordnance Survey
A Nitrate Vulnerable Zone (NVZ) is designated on all land draining to and contributing to the nitrate pollution in ‘polluted’ waters. Polluted waters include:
• Surface or ground waters that contain at least 50mg per litre (mg/l) nitrate
• Surface or ground waters that are likely to contain at least 50mg/l nitrate if no action is taken
• Waters which are eutrophic, or are likely to become eutrophic if no action is taken
A water is considered eutrophic if it contains levels of nitrogen compounds that cause excessive plant growth resulting in an undesirable disturbance to the balance of organisms present in the water and to the quality of the water’.
Further information can be found on https://www.gov.uk/nitrate-‐vulnerable-‐zones

BABE – Brampton AD Feedstock Study
Public Version page 21 of 94
4.1.3. Energy Content of Biogas Substrates
The overarching aim is to generate as much raw bio-‐methane as possible from anaerobic digestion, the fermentation of carbon-‐based biomass. To obtain the maximum biogas yield, we are looking for material with the highest energy content within its specific substrate category.
For livestock manure and slurry the energy content corresponds mainly with freshness, dry matter content. From an AD perspective the absence of chemical detergents, antibiotics or other chemicals and elements harmful is vital for anaerobic bacteria. To raise the awareness about the different purposes, qualities and treatment of grass, the following table gives an overview about the different grass cultivation treatments.
Purpose of Grass Grass for grazing G. silage f. dairy G. silage f. horse G. silage for AD
Heading varying heading dates (to extend grazing season)
May May uniform ripening, May
Grass type standard varieties standard varieties standard varieties high sugar & high mass varieties
Cutting length n/a long, ca 230-‐290mm
long, ca 230-‐290mm
short, ca 7mm
1st cut grazing as required
before or at ear emergence
betw. ear emerg. and blooming
before ear emergence
2nd cut grazing as required
4-‐6 weeks following 1st cut
4-‐6 weeks following 1st cut
4-‐6 weeks following 1st cut
Silage method n/a round bale or clamp
round bale clamp
Table 2: Comparison of grass silage harvest practices
The energy potential for grass silage, which could be described as a form of preserved grass, depends mainly on the dry matter content (DM) of the total or fresh weight (FW) and its digestibility value (DV). The latter is characterised by a high sugar level. A DV is achieved by maintaining anaerobic conditions during the ensilage of forage, as only under those conditions lactic acid bacteria can dominate the fermentation process.
In the last few years grass types with a high energy content are specifically developed for biogas applications. Higher FW values are also achieved by a harvesting practice, which varies slightly from harvesting methods for livestock feeds. Numerous agricultural organisations and research institutions like ADAS, DEFRA, NFU, The Grass Institute as well as seed and equipment companies and have produced literature explaining the relevance of soil management, fertilising, seed selection, re-‐seeding, cutting time, harvesting and silage making.
The next illustration shows how the grasses energy potential, from the point of biogas generation, develops over its maturity or growth, which also demonstrates why the above mentioned harvest timing is crucial.
The illustration shows the development in relation to age from younger grass to older grass.

BABE – Brampton AD Feedstock Study
Public Version page 22 of 94
Illustration 3: Comparison of grass silage harvest practices (Source: Murphy)
4.1.4. Assessment Criteria
Each farm with an interest in providing input material was assessed against a number of criteria for quality and quantity of potential feedstock, environmental issues, long-‐term farm plans and legal issues like unregistered titles, complex ownership structures, divorce and inheritance issues.
The criteria for livestock farms were:
• Livestock type
• Slurry volume and manure volume
• Housing system and bedding material type
• Seasonal variance of volumes (summer / winter)
• Dry matter content (from existing lab analysis or estimate)
• Dirty water and effluents volume
• Wash water and wash water detergents
• Slurry storage capacity and slurry storage cover
• Ability to pump slurry directly from slats (when slurry storage tank contains dirty water)
The criteria for silage farms were:
• Size of agricultural holding and current land use
• Operator / staff
• Steepness of slope with access limitations for machinery
• Altitude and exposure to extreme weather conditions
• Topographical issues: crags’, cliffs, water courses
• Flooding
• Environmental and landscape designations, incl. archaeological sites
• Agro-‐environmental management schemes (Countryside Stewardship Scheme)
• Other restrictions, e.g. permission from the EA for ploughing of pastures
• Security of title and long-‐term intentions for farm and outlook over next 20 years
4.1.5. Initial Feedback
The timing for approaching farmers was in the midst of lambing, ploughing, sowing or other preparatory fieldwork. Postponing the fieldwork would not have made a difference to farmers,

BABE – Brampton AD Feedstock Study
Public Version page 23 of 94
considering an unpredictable weather and an ongoing heavy workload. Facing the practicalities of farming life, the feedstock surveyor had to work round such constraints and consequently farmers were approached in their farmhouse, on a tractor en route to work or on the field.
It turned out that some potential suppliers were ‘hard-‐to-‐reach’. It took several failed attempts to understand that farmers had abandoned full time farming and taken up part or full time employment in Carlisle; they were only approachable after regular office hours or on weekends. Unsurprisingly, such farming style, or rather life style, is found on extensive grassland.
The survey brought another unexpected feedback from dairy famers: while in other parts of Cumbria dairy farmers are faced with the issue of disposing slurry, the situation around Brampton is more diverse: Some farms are able to spread all slurry on their own holding, some are relying partly on third party land and some are approached for their slurry as fertiliser for arable third party land.
Within the supply source area some whole crop silage and even some maize is harvested. Considering the few AD plants in the area and the lack of experience in trading feedstock for AD purposes there was little surprise to find no willingness from crop farmers to engage with supply contracts for the proposed BABER AD project. As with other regions where AD is successfully introduced and a feedstock supply chain is established, we expect attitudes towards commercial feedstock contracting will change over years. As a consequence the feedstock survey was narrowed down to grass silage and livestock slurries.
Chapter summary:
• The defined Supply Source Area covers an area of medium to poor quality agricultural land.
• The main statutory designation potentially affecting suitable land is the Hadrians Wall, a World Heritage Site.
• Only a smaller part of the Supply Source Area is affected by NVZ regulations.

BABE – Brampton AD Feedstock Study
Public Version page 24 of 94
4.2. Stage 1: Farms with available Livestock and Grass Land
Several farms have been identified as potential supply sources following their owner’s (repeated) confirmation of interest to supply the proposed AD plant. Their details are listed in Appendix B. The survey has resulted in registering the potential for ten slurry suppliers and four silage suppliers. The findings for slurry supplies and silage supplies are presented in separate tables as these two input streams follow different procedures and routines.
Livestock Farms
The following table lists livestock farms interested in supplying slurries and their herd sizes.
Site no. Farm (abbrev.)
Livestock Type
ave. herd number
Housing system
Slurry storage
ave. heifers (0-‐1y, 1-‐2y)
1 Glebe Dairy cows ca 1000 slats available 20% of herd
2 Middle Dairy cows ca 200 slats available 20% of herd
3 Cumcatch Dairy cows ca 250 slats available 20% of herd
4 Seat Dairy cows ca 250 slats available 20% of herd
5 Lane Dairy cows ca 150 slats available 20% of herd
6 Byegill Dairy cows ca 200 slats available 20% of herd
7 Burtholme Dairy cows ca 200 slats available 20% of herd
8 Cross Dairy cows ca 150 slats available 20% of herd
9 Rigg Dairy cows ca 250 slats available 20% of herd
10 Walton Dairy cows ca 250 slats available 20% of herd
Table 3: Farms with livestock manures
Arable Farms
The next table lists farms interested in supplying silage and shows their approach to silage making.
Site no. Land type LCA -‐ land category
Acres Farming business
Ploughing Crop rotation
A. Armstrong
extensive grass land
3 140 extensive mixed farm’
occasionally currently not applied
B. Routledge
extensive grass land
3 094 subsidiary income
no currently not applied
C. Forster
extensive grass land
3 060 subsidiary income
occasionally not applied
D. Palmer
extensive grass land
3 150 extensive mixed farm’
occasionally currently not applied
Table 4: Farms with grass silage

BABE – Brampton AD Feedstock Study
Public Version page 25 of 94
Other Supply Sources
The following table lists ‘other supply sources’, defined as being neither livestock manure and slurry nor energy crops, identified through the survey.
Site No. Industry Location Substrate category
Substrate type
Generated on-‐site
Z Brewery Brampton food waste hop mash yes
Z Brewery Brampton food waste yeast wash yes
Table 5: Supply sources for ‘other substrates’
All above identified supply source locations are shown on the map below.
Map 9: Supply source locations © Crown copyright and database rights 2013 Ordnance Survey 0100031673

BABE – Brampton AD Feedstock Study
Public Version page 26 of 94
4.3. Stage 2: Feedstock Potential – Quantities and Qualities
The second stage of the feedstock study is to assess the quantities and qualities of any potentially available input material. For a better understanding of the background assumptions used the different input streams are presented separately.
4.3.1. Feedstock Potential from Livestock Manures and Slurry
The assumptions for the calculation of manure and slurry volumes as shown in the table below are:
• The dairy herd consists of milking cows with an average milk yield of 6,000 -‐ 9,000 l/a.
• Cows in this category produce excreta of 53 kg or litre per day (Sources: ADAS, DairyCo)
• Slurry volumes are calculated as undiluted from dirty water and effluents
• Slurry is assumed to be ‘fresh’, meaning available for the digester within 24 hours
• The density factor for slurry is assumed as ‘1’. (Source: DairyCo) Literature references for slurry density are given between 0.9 and 1, depending on its dry matter content and its dilution factor.
Site No. Excess FYM available
Potential slurry
Housing time
Actual slurry
Slurry for AD (est.)
Slurry for AD
ton m3 = ton months m3 = ton % m3 = ton
1. 0 19,345 12 19,345 100% 19,345
2 0 03,869 06 01,935 30% 00,580
3 0 04,836 06 02,418 30% 00,725
4 0 04,836 06 02,418 30% 00,725
5 0 02,902 06 01,451 30% 00,435
6 0 03,869 06 01,935 30% 00,580
7 0 03,869 06 01,935 30% 00,580
8 0 02,902 06 01,451 30% 00,435
9 0 04,836 06 02,418 20% 00,484
10 0 04,836 06 02,418 20% 00,484
Total 24,375
Table 6: Available volumes of undiluted, fresh slurry
In the absence of any measurement for e.g. daily slurry volume by the farm, UK-‐wide standard figures for slurry production are the most accurate way forward. Such average figures take into account that all herds have over-‐and under yielding cows due to age, health, calving and farm management practices (housing, nutrition).
The total volume of fresh dairy slurry available for AD purposes is estimated to be 24,375 m3. This volume is more than sufficient to as part of a feedstock mix in a silage-‐based AD plant. The entire volume however is spread unevenly across the year due to different housing length on the farms.
The all year round availability of cattle slurry, or rather the lack of it during the grazing period of the summer months, has also been identified as on of the barriers for on-‐farm AD by the Royal

BABE – Brampton AD Feedstock Study
Public Version page 27 of 94
Agricultural Society of England (RASE). The next table shows the seasonal variance of all available slurry, incorporating, where applicable, a six months housing period of October to March.
Month 1 2 3 4 5 6 7 8 9 10 11 12
Slurry (ton)
2450 2450 2450 1612 1612 1612 1612 1612 1612 2450 2450 2450
Table 7: Seasonal variance of slurry volumes
With many silage AD system providers typically requiring 10 – 30% of slurry as part of the entire feedstock mix, provided that the rest is silage, the available minimum of 1,612 tons / m3 per month seems more than adequate.
The main concerns among AD operators using slurries are the issues of dilution with rainwater or dirty water and the inclusion of chemical substances attacking the anaerobic bacteria. The issue regarding rainwater is primarily an economical one. Water being processed through the AD system provides no biogas, but creates infrastructure cost for e.g. enlarged tank size and additional digestate storage. Water is sometimes used as input material to reduce the overall dry matter content of the digester tank where there is no slurry available or the planning permit prohibits the use of livestock slurries – unlikely scenarios for the BABE AD plant.
The sources for potential and volumes for dilution and contamination of slurries are:
• The volume for applicable ‘dirty water’, which is ‘run-‐off’ from contaminated or concreted areas and includes rainwater, also referred to as storm water or roof water, depends on the affected roof and yard area, the on-‐site drainage system and local rainwater volume. Its volume has not been calculated or estimated; it is relevant when joining the slurry stream.
• The volume for parlour wash water depends on the type of hose in use. The standard volume for a high pressure hose is 20l/cow in milk/day (or 30l for a high volume hose). (Source: DairyCo) Milking parlour wash water contains (legally dischargeable) biocides and disinfectants; it is relevant when joining the slurry stream.
• Water containing pharmaceuticals are depending on disease prevention schemes and out-‐brakes of livestock diseases and are therefore varied and seasonal. Its volume has not been calculated or estimated; it is relevant when joining the slurry stream.
• The volume for effluents from housing, storing or transporting slurry and farmyard manure has not been estimated as it depends on the farm management, farm layout and on-‐site drainage system arrangements.
• The combined volume of dirty water, wash water and effluents has to be calculated together with measured or estimated or values for its N, P and K content, which have to be taken into account if discharged within an NZV.
Dirty water, wash water and effluents can mix with the livestock slurry at various points. In principle they can be located at the:
• Slats
• Man holes/drains
• Slurry store (tank, lagoon or other structure)
It will be vital for future slurry supply agreements to understand the livestock husbandry of each supply farm and to define the preferred slurry collection points for undiluted and uncontaminated material.

BABE – Brampton AD Feedstock Study
Public Version page 28 of 94
The next table shows, where reasonably possible, the likely volumes for dilution and contamination and the impact on slurry volumes. Although some figures can only be determined by a detailed assessment of roof surfaces, local rain fall figures, husbandry practices and housing conditions, but are listed for the sake of completeness. ‘Mixing point’ refers to the place where dirty water etc and slurry finally mix.
Table 8: Possible volumes of dilution and contamination
The sheer volume of non-‐slurry liquids – almost 60% of raw slurries, storm/roof water and effluents not even included – highlights the issue of processing contaminated ‘water’ through the AD plant: hardly any benefit, but cost implications for the extra tank volume and infrastructure requirement.
However, the survey highlighted that any dirty water, milking parlour wash water and effluents do not mix with the raw slurry at the slats, but at the slurry storage tank. Therefore, as long as fresh slurry can be pumped directly from the slats into the digester, there would be no need for any additional drainage, pipe work or other infrastructure change.
The future operator will need assurances that (pump) access to the slats can be provided when required and that any slurry provided for the AD facility will be free from detergents, antibiotics and other livestock pharmaceuticals. In case of farm infrastructure repair or failure the technology provider and the operator will have to decide whether the robustness of the AD system would cope with some or all of these contaminants.
Generally speaking, there has been no incentive for farmers to separate the various waste water sources from slurry. Farm no. 1 was considering separating the dirty waters from slurry while this was not a priority issue for all other farms.
Regarding the overall solidity or dry matter (DM) content of fresh, undiluted dairy slurry – figures are typically within the range of 8.5% DM to 10% DM (Sources: ADAS, KTBL, LfL, etc). Laboratory analysis’s from working farms have shown figures for undiluted slurry of up to 11% DM, whilst figures for diluted dairy slurry can be as low as 6% DM. It should be noted that the type of cattle feed also has an impact on the slurry DM.
Site No. Dirty water /roof water
Parlour washing
Pharma’ water
Effluents Accumul. dilution vol.
Mixing point
m3 = ton m3 = ton m3 = ton m3 = ton m3 = ton
1. t.b.c. 07,300 t.b.c. t.b.c. 07,300 slurry store
2 t.b.c. 01,730 t.b.c. t.b.c. 01,730 slurry store
3 t.b.c. 01,913 t.b.c. t.b.c. 01,913 slurry store
4 t.b.c. 01,913 t.b.c. t.b.c. 01,913 slurry store
5 t.b.c. 01,548 t.b.c. t.b.c. 01,548 slurry store
6 t.b.c. 01,730 t.b.c. t.b.c. 01,730 slurry store
7 t.b.c. 10,730 t.b.c. t.b.c. 01,730 slurry store
8 t.b.c. 10,548 t.b.c. t.b.c. 10,548 slurry store
9 t.b.c. 10,913 t.b.c. t.b.c. 01,913 slurry store
10 t.b.c. 10,913 t.b.c. t.b.c. 01,913 slurry store
Total 14,238 14,238

BABE – Brampton AD Feedstock Study
Public Version page 29 of 94
As a matter of caution we have chosen the lowest figure of 8.5% from the above quoted range for our further calculations.
4.3.2. Feedstock Potential from Grass Silage
The following table list the land available for feedstock supply and deducts a reasonable percentage for potential land taken aside for environmental stewardship schemes. The figure will eventually depend on the overall field layout and on any impact from archaeological findings to be discussed with the County archaeologist.
Site No. Target crop for AD
Designation Environ’ Stewardship
Land ownership
Land reduction
Land for production
acres % acres
A grass silage Hadrian Wall, etc
yes 140 5% 133.0
B grass silage -‐ yes 094 5% 089.3
C grass silage -‐ yes 075 5% 071.3
D grass silage -‐ yes 060 5% 057.0
Total 369 5% 350.6
Table 9: Land potential for AD
Following the identification of available land the next step is to identify its productivity in form of silage yield figures. Yield figures will vary for many reasons, e.g. fertilising regime, land management, weather, seed mix or age of type and age of sward.
An NNFCC study on farm-‐scale AD in England confirms a yield of 45 fresh tonnes of grass silage per hectare, equivalent to 18.2 t/acre. Across the country such yield may be achieved with different number of cuts.
In line with local harvest figures we assume the following typical figures for ‘dry tonne’ and fresh weight yields for grass silage. (Additional sources: ABC, AFBI) Naturally, the yield for individual cuts may vary.
Grazing grass yield 4.25 t DM/acre with three cuts: 8.0+6.0+3.0 = 17 t/ac FW @ 25% DM
Average yield 4.50 t DM/acre with three cuts: 8.5+6.5+3.0 = 18 t/ac FW @ 25% DM
Biogas grass yield 5.00 t DM/acre with three cuts: 9.5+7.5+3.0 = 20 t/ac FW @ 25% DM
The Study aims to be on the ‘safe side’ with only two cuts per season, totalling in tons/acre of FW from ‘biogas grass’. Any grass silage from a third cut would be seen as input material in reserve for future use.
Local yield figures are illustrated in a lab analysis for grass silage from a farm adjacent to one of the identified supply farms in Appendix D.
For the benefit of comparison, it should be mentioned that farmers in the North West of England and in other regions have yielded 6 tons of dry matter per acre of grass silage intended for AD purposes. In those circumstances the land benefitted from freshly seeded grass, grass types developed for biogas, and professional harvesting methods. Considering the age of the existing grass on the identified pastures, in some swards over seven years, a reseeding scheme combined with an appropriate soil treatment and fertilising programme, would seem necessary.

BABE – Brampton AD Feedstock Study
Public Version page 30 of 94
The Study assumes that any energy loss from fresh cut grass to silage in a well-‐managed silage clamp is minimal and can be neutralised by silage additives. Therefore at that stage no corrective factor for energy loss is applied.
The following table shows a staged yield increase from reseeding a quarter of the arable land by utilising two cuts.
Site No. Productive acres
Current yield/acre
Reseeding expected
Reseeding for yr 1
ave. Yr 1 yield/acre
Yr 1 yield/farm
Acres t of FW % of acres t of FW t of FW
A 133.0 13.00 uncertain -‐ 13.00 1,729
B 089.3 13.00 yes 25% 14.00 1,250
C 057.0 13.00 yes 25% 14.00 0.798
D 071.3 13.00 yes 25% 14.00 0.998
Total 350.6 4,775
Table 10: Yield improvement for grass harvest in year 1
Due to a yield reduction of grass harvest from the ageing of the grass roots a reseeding is done every four years with a break crop of similar biogas yield, e.g. whole crop wheat or barley.
The next table shows the consecutive yield increase over the second and third year.
Site No. Reseeding for yr 2
ave. Yr 2 yield/acre
Yr 2 yield/farm
Reseeding for yr 3
ave. Yr 3 yield/acre
Yr 3 yield/farm
% of acres t of FW t of FW % of acres t of FW t of FW
A -‐ 13.00 1,729 -‐ 13.00 1,729
B 50% 15.00 1,340 75% 16.00 1,429
C 50% 15.00 0.855 75% 16.00 0.912
D 50% 15.00 1,069 75% 16.00 1,140
Total 4,992 5,210
Table 11: Yield improvement for grass harvest in years 2 and 3
The yield figures at completion of the initial reseeding programme in year four will be used as standard figures for the entire AD plant life cycle.
The Digestibility Value (‘DV’) is a grass yield benchmarks indicating the energy value of biomass; we assume a minimum DV-‐of 69, but would target a minimum DV level of 73 units.
Table 12 shows the yield increase from reseeding in the fourth year and gives an overview over the aforementioned yield benchmarks.

BABE – Brampton AD Feedstock Study
Public Version page 31 of 94
Farm No. Reseeding for yr 4
exp. Yr 4 yield/acre
exp. Yr 4 yield/farm
D-‐Value minimum
D-‐Value expected
n/a
% of acres t of FW t of FW unit unit
A -‐ 13.0 1,729 66-‐69 73+
B 100% 17.0 1,518 66-‐69 73+
C 100% 17.0 0,969 66-‐69 73+
D 100% 17.0 1,211 66-‐69 73+
Total 5,427
Table 12: Grass harvest yield improvement in year 4
The year following ‘year 4’ will trigger a new reseeding cycle, with a break crop keeping the crop yield and the resulting energy potential at a constant level.
Therefore the figures in ‘year 4’ will be applied as the typical annual throughput and form the basis for calculating the typical annual plant performance.
4.3.3. Feedstock Potential from ‘Other Substrates’
The search for input material, which is neither energy crop nor livestock manures and slurry, referred to as ‘other substrates’, was not seen as priority due to the increased contractual and regulatory complexity level. Nevertheless some material was identified from a local micro brewery in close proximity to the proposed AD location For the sake of understanding of the associated issues with food waste these findings are included in the study. The substrates concerned are listed in the table below:
Site No. Substrate Volume Volume DM DM n/a
t/week t/yr % t/yr
Z hop mash 0.125 6.5 -‐ -‐ -‐
Z yeast wash 0.125 6.5 -‐ -‐ -‐
Table 13: Feedstock potential from ‘other substrates’
The survey showed that the brewery closes for two weeks in autumn for general refurbishment of the infrastructure and that there is an increased output to the season running up to Christmas. Looking at the bigger picture with about 5,500 tpa of grass silage, this variance of brewery waste supply, shown below on a monthly basis, is negligible.
Month 1 2 3 4 5 6 7 8 9 10 11 12
mash 0.54 0.54 0.54 0.54 0.54 0.54 0.54 0.54 0.27 0.54 0.83 0.54
wash 0.54 0.54 0.54 0.54 0.54 0.54 0.54 0.54 0.27 0.54 0.83 0.54
Table 14: Seasonal variance of ‘other substrates’, measured in tonnes

BABE – Brampton AD Feedstock Study
Public Version page 32 of 94
4.3.4. Conclusion
The following annual feedstock potential could be identified for the proposed BABE AD plant, whereby the figures shown below do not take any actual slurry requirement during live operation into consideration. A density factor is added to convert the measure for weight in volume.
Substrate category
Substrate type
Total FW/t All substrate share of total
Density factor Total FW/m3
livestock slurry dairy slurry 24,375 081.8% 100% 24,375
energy crops grass silage 05,427 018.2% 085% 06,384
food waste mash + wash 00,013 000.0% 100% 00,013
Total 29,815 100.0% 30,772
Table 15: Summary of all identified AD input material and their share of total material
The quality of the crop and the subsequent silage is demonstrated in two more values: dry matter and organic dry matter:
The dry matter content (DM) shows the share of biomass without any water content. For grass it is dependent on the weather situation in the build-‐up to and at the cropping. The traditional practice of 24 hours wilting, weather permitting, before delivery to the silage clamp will reduce the moisture level.
Considering the regionally prevailing wet conditions we assume a DM of 25%, but target 28%. For the sake of comparison, in the dry harvest season of 2012 the average DM for grass in Cumbria exceeded 30%. (Source: NFU, farmers’ lab tests)
The organic dry matter (oDM), also termed ‘volatile solids’ (VS) indicates the level of digestible organic substances of the dry matter.
Table 16 shows the DM and oDM values applied to the identified input material. (Sources: LfL, Baserga, Wittmaier, own database)
FW DM DM oDM (=VS) oDM (=VS) FW select.
Unit t % t % t t
Slurry fresh, total
24,375 08.5% 1) 2,072 85.0% 1,761
Slurry fresh 30% of total
(02,326) 08.5% (0,198) 85.0% (0,168) 2,326
Grass silage total
05,427 25.0% (minimum)
1,357 87.0% 2) (average)
1,183 5,427
Hop mash 0,0 006.5 18.0 % 3) 0,001,2 90.0 % 3) 0,001,1
Yeast wash 0,0 006.5 3.0 % 0,000.2 75.0 % 0,000.1
Total 29,815 3,430 2,945 7,753
Table 16: Dry matter and organic dry matter values of all identified AD input material

BABE – Brampton AD Feedstock Study
Public Version page 33 of 94
1) Even assuming the Project is able to obtain a equal mix of undiluted slurry with 10% DM and diluted slurry with 7% DM, such combination will be in the area of 8.5% DM.
2) A combination of figures for first and second cut (see chapter 4.4.2)
3) The figures for hop mash are taken from dried spent hops.
4.3.5. EWC Listing
The following table provides a classification of substrate categories according to the European Waste Classification (EWC) system, which is also used for planning and permitting purposes and for proof of eligibility for payment by Feed-‐in Tariffs.
EWC code Category Types of waste
02 Wastes from agricultural, horticultural, hunting. Fishing, and aquacultural, primary production, food preparation and processing
02 01 Primary food production waste
02 01 06 Animal faeces, urine, manure including spoiled straw, collected separately and treated off-‐site
Poultry droppings Pig and cattle slurry Manure Old straw
02 07 Wastes from production of alcoholic and non-‐alcoholic beverages (except tea, coffee)
02 07 01 Wastes from washing, cleaning and mechanical reduction of raw materials
Brewing waste, food processing waste, fermentation waste
02 07 04 Materials unsuitable for consumption or processing
Brewing waste, food processing waste, fermentation waste, beer, alcoholic drinks, fruit juice stored for too long
Table 17: Input material types according to the European Waste Classification
Chapter summary:
• The entire slurry supply potential is over 24,000 tons per year, far in excess of requirement.
• All dairy herd are housed for 12 months, ensuring a continuous slurry supply.
• While the slurry on all farms is diluted in the slurry storage tank, it can be pumped off before reaching this tank, providing an undiluted slurry material.
• After deducting setting-‐aside land for other farm activities and agro-‐environmental schemes 350 acres (142 hectares) of grass land remain available for AD purposes. As a precaution only ca 2/3 of the land is assumed to be available for re-‐seeding.
• 17 tons/acre of fresh weight, equalling 5 tons/acre of dry weight, is accepted as achievable long-‐ term yield, resulting in 5,427 tons of fresh weight per year as AD feedstock.
• A realistic assumption of feedstock yields have allowed for two cuts out of three possible; leaving an optional third cut as back-‐up for either plant or farm.

BABE – Brampton AD Feedstock Study
Public Version page 34 of 94
4.4. Stage 3: Biogas Yield and Digestate Output Estimates
The biogas potential and the digestate volumes of each source of feedstock will be assessed using published standard figures and industry experience. Those figures will be of importance for the evaluation of the AD substrates and for the design, finance and benchmarking of the AD plant.
The biogas yield is a factor of a substrate’s content of carbohydrates, proteins and fats plus their respective digestibility.
The elements of interest for the digestate output are mainly its volume reduction in relation to the original input material volume – which is of relevance to specify storage or separation equipment – and its fertilising qualities, typically described by nitrogen, phosphate and potassium (N:P:K) values.
4.4.1. Biogas Yields – Apples and Pears?
There are several ways to calculate the methane potential of grass silage and the Study aims to be transparent on this crucial topic. The need for transparency is because of a large spectrum of yield figures in circulation, mainly caused by:
• A use of different AD systems, retention times and operating temperatures
• A diversity of source materials, i.e. grass varieties developed for different purposes, like for pasture, forage or biogas
• Variations in preparing the source material, i.e. grass samples are cut at various maturity stages or moisture levels, inadequate silage making
• Co-‐digestion of substrates, which (can) provide different biogas yields to a substrate fermented on its own
• The non-‐adherence to standardised parameters, e.g. norm volume for gases
Additionally, the testing for the potential of biogas or methane in small batches of 50 or 100 litres (or smaller) is sometimes challenged by operators, arguing that such results cannot be reliably transferred to large digester tanks with volumes of thousands of cubic metres.
The range of biogas yield figures for e.g. grass silage is highlighted in a meta-‐study listing biogas yields for grass from 400 – 1100 Nm3/kg of oDM, a difference of almost 300%. (Source: Comparing Biogas Yield from Grass Silage; )
This Study aims to differentiate between primary and secondary sources of biogas or methane yield figures. Primary sources can be:
• Lab testing under norm conditions (and standardised deductions there from)
• Field surveys using live data from a representative sample of operational plants, e.g. by KTBL or the consulting firm bioreact, taking hundreds of plants into account, and
Secondary sources for biogas or methane yield figures can be:
• Lab testing under random conditions
• Operational data from an ‘one-‐off’ AD plant (or several non-‐identical plants), unsuitable for generalisation
The purpose for this differentiation is to understand the ‘gravity’ of published figures for biogas potential as technical and financial decisions are relied upon..
As an example, the values stated for cubic metres of biogas illustrate the issue with compatibility around biogas volume output. As the volume of gases is relative to e.g. atmospheric pressure and temperature, ‘norm gas’ has been introduced to ensure compatible values. The biogas volume from standard conditions (‘STP’) for gas at fixed parameters, in short 0°C (as with DIN 1343), 0% humidity

BABE – Brampton AD Feedstock Study
Public Version page 35 of 94
and 1.01325 bar atmospheric pressure, must be adjusted to the actual conditions of the biogas when processed in the CHP. Such adjustment often goes along with a decrease of energy level as biogas at 0°C has a higher energy potential than at the typical 55°C in an AD plant.
Any conversion of non-‐standardised into standardised figures would take into account the following factors:
• Measured gas volume (in m3)
• Measured gas temperature (in ˚C)
• Measured air pressure (abs.) (in mbar)
• Relative gas humidity (in %(
A free-‐to-‐use calculation tool can be found on www.lfl.bayern.de/iba/energie/049691/index.php and www.biogas-‐forum-‐bayern.de/online-‐anwendungen/volumenumrechnung. Such calculation can only be applied on an operational plant and for that reason any figures derived form plants with the same or similar system design and feedstock mix will have to be taken into more serious consideration.
While this Study has to refer to a specific yield figure source, the figures finally applied for the design and finance of the plant will have to be accepted by the technology provider, funder(s) and insurance company. All will have to agree on a performance warranty using specific biogas or methane output figures. Therefore, most or all substrates from a range of contracted suppliers will be tested to their satisfaction before the plant design stage to ensure the plant specifications are tailored to the throughput volume.
BABE might witness a balance act between an AD technology supplier’s push for higher yield figures to display a strong performance of its system and for lower yield figures when guaranteeing performance levels.
4.4.2. Methods to establish the Biogas Potential
The biogas and methane content can be estimated or calculated by various methods, which will be briefly discussed:
• BIogas or methane in cubic metre per tonne of fresh weight
• Biogas or methane in cubic metre per tonne (or litre per kg) of oDM
• Calculation of COD and its conversion into kWh
Calculating the biogas potential by fresh weight alone might work as a rough guidance figure, but would hardly provide a reliable basis for any design or investment decision, as long as the dry matter and the organic dry matter content of the fresh weight remain undefined. Care has also to be taken by using a substrate’s methane content as many published figures are based on the assumption of a methane content of 60% or 65%. Those percentage figures rather apply for AD plants based on food waste and not on AD plants using agricultural feedstock.
Alternatively there is a two-‐step approach of assessing firstly the dry matter and subsequently its organic dry matter content. This can be done by calculation or tests. One such method of establishing the biogas yield is by factoring in a digestibility value (‘DV’). The background for this method is the recognition that the digestion capability of a cow’s rumen is not complete, otherwise no energy would remain in FYM and slurry. The DV of any given (feed) substrate is available from feedstock industry tables. However, in regard to silage feed the DV will vary as it strongly depends on the individual harvest material.
Just like a ruminant’s stomach an anaerobic digester – depending on pre-‐treatment, retention time, enzyme addition and operating temperature – will not ferment or convert all of the potentially available material. Hence there was the need to establish its digestible or fermentable share.

BABE – Brampton AD Feedstock Study
Public Version page 36 of 94
From an AD point of view the components of any substrate’s DM can be broken down into carbohydrates, protein and fats. The DV percentage of the mass of e.g. raw fat provides the fermentable fat. The digestible carbohydrates, protein and fats amount to the organic dry matter. Crucially, the biogas yields for one kilogramme of digestible carbohydrates, fats and proteins (790, 1250 and 700 litres) and their relevant methane content (50%, 68% and 71%) applies regardless of the substrate. This groundbreaking method was established by Baserga, whose formula can be viewed in detail on e.g. www.lf.bayern.de/iba/energie/031560/. The terms ‘organic dry matter’ and ‘fermentable organic dry matter’ are used synonymously.
The above described method is the preferred approach for the purpose of this Study. Nevertheless, it is worth mentioning that this method, despite robust in its approach, is criticised (for various reasons like overlooking minor oDM elements) for its too low yield figures in comparison to numerous test results.
Whilst the biogas or methane yield based on the oDM of a particular feedstock can vary with the subtlety of the calculation or test method, there is a direct correlation between methane and the chemical oxygen demand (COD). This correlation is referred to as stochiometric methane potential (SMP). On that basis exactly 0.35 litres of methane is produced from 1kg of COD dissolved. (Source: Aqua Enviro) This approached is favoured to bypass the more lengthy 28 days long biochemical methane potential (BMP) test.
Despite some advantages of the COD approach the Study sees more benefits in using terminology local farmers are familiar with and are able to translate into their farm management and feedstock supply agreements.
Some companies only apply a generic AD feedstock conversion rate of e.g. 90% when calculating the biogas output. By shortcutting the retention time (e.g. 65 days instead of 100+ days) some capital cost savings will be achieved from reduced tank sizes. This is an individual finance decision not for this Study to make.
Table 18 below gives an overview of some published biogas and methane potential values; the survey cannot claim to cover the entire material in the public domain.
For a sharper differentiation of grass varieties, standard grass varieties (prior to the development of biogas specific varieties) and biogas specific grass varieties (below as ‘Rye grass silage’) are shown in separate columns. Some of the research listed below has been conducted with e.g. Timothy-‐based or similar grass types, which yield inferior to modern grass varieties purposely developed for use in AD.
Data source Unit Dairy slurry Grass silage Rye grass sil. Comment
KTBL 1) Biogas Nl/kg oDM
315 @ 55% CH4
455 @ 52% CH4
survey of live data
LfL Bavaria 2) Biogas Nl/kg oDM
280 @ 55% CH4
various 602.3 @ 54.6% CH4
calculated 2nd cut only.
LfL Bavaria Biogas Nl/kg oDM
various 574 @ 55% CH4
as above, 2nd cut only
Technology provider 3)
Biogas Nl/kg oDM
600 @ 52% CH4
own live data, 3 cuts comb.
Technology provider 4)
Biogas Nl/kg oDM
300 @ 28% DM
560 @ 53% CH4
own live data, 3 cuts comb.

BABE – Brampton AD Feedstock Study
Public Version page 37 of 94
Table 18: Biogas and methane yield figures from a variety of sources
1) www.ktbl.de/index.php?id=1054 or http://daten.ktbl.de/dslkr/start -‐ an English database is at: http://daten.ktbl.de/euagrobiogasbasis/startSeite.do?selectedAction=start
Arge Kompost Biogas 5)
Biogas Nl/kg oDM
280 @ 56% CH4
350 @ 55% CH4
2008
Biogas Handbook 6)
Biogas Nl/kg oDM
200-‐300 560 T. Al Seadi, 2001
NNFCC 7) Biogas m3/ton FW-‐
25 170 @ 40% DM
185 Info folder, Nov. 2011
Andersons (2008, 2010) 8)
Biogas m3/ton FW-‐
15 – 25 @ 10% DM
160 – 200 @ 28% DM
third party data
Aqua Enviro9) Biogas m3/ton FW-‐
25 185 185 operator data
WRAP 10) Biogas m3/ton FW-‐
25 185 185 third party data
Teagasc 11) Biogas m3/ton FW-‐
19.69 @ 8%DM
189 (if fresh) @ 37% DM
NFU, REA, ADBA 12)
Biogas m3/ton FW-‐
160 – 200 160 – 200
LfL Bavaria 2) Biogas Nm3/ton FW-‐
20.2 @ 55% CH4
various 132.2 @ 54.6% CH4
1st cut only
LfL Bavaria Biogas Nm3/ton FW-‐
various 123.7 @ 55% CH4
2nd cut only
IEA Bioenergy Task 37 13)
CH4 m3/ton oDM-‐
298 – 467 390 – 410 Braun 2007, publ. 2011
NNFCC 14) CH4 m3/ton oDM
298 – 467 390 – 410 Report, 2011
Swedish Gas Centre 15)
CH4 Nl/kg oDM
300 @ 35% DM
Nationwide survey, 2007-‐
CROPGEN 16) CH4 m3/ton oDM
233 306 EU research project
Greenfinch (DECC, 2005)17
CH4 m3/ton oDM-‐
357 own trial
Swedish Gas Centre
CH4 m3/ ton FW
14 @ 9% DM
95 @ 35% DM
2007 and 2012
LfL Bavaria CH4 m3/ ton FW
202 @ 40% DM
@ 53.6% CH4
Swedish Gas Centre
MWh per ton FW
0.93 @ 35% DM
2007

BABE – Brampton AD Feedstock Study
Public Version page 38 of 94
2) Bayrische Landesanstalt für Landwirtschaft, on: www.lfl.bayern.de/iba/energie/049711/
3) confidential information, recent data
4) confidential information, recent data
5) www.kompost-‐biogas.info -‐ in German, data based on a 90% (gas) extraction rate
6) Biogas Handbook; Teodorite Al Seadi (Editor), Esbjerg 2008; (part of the bIG>East project)
7) Anaerobic Digestion Factsheet -‐ Renewable Fuels and Energy, NNFCC, Nov. 2011
8) (NNFCC 101): A detailed economic Assessment of Anaerobic Digestion Technology and its Suitability to UK Farming and Waste Systems (2nd edition); (note: 1st edition f. April 2008, Is essentially a FIT update); on: www.organics-‐recycling.org.uk
9) The Feedstock; Matthew Smith, Aqua Enviro Ltd, 2012; from: Yeatman, 2007
10) WRAP, www.wrap.org.uk
11) TEAGASC Factsheets, Tillage No. 11; TEAGASC (Ireland)
12) The Case for Crop Feedstocks in Anaerobic Digestion; NFU, REA, ADBA, CLA; Nov. 2011
13) Biogas from Crop Digestion; J Murphy, P Weiland, R Braun, A Wellinger; IEA Bioenergy/
Task 37, September 2011
14) Farm-‐Scale Anaerobic Digestion Plant Efficiency; NNFCC, 2011
15) Basic Data on Biogas 2007, Swedish Gas Centre Basic Data on Biogas 2012, Swedish Gas Centre; on: www.sgc.se/en/?pg=1445664 and www.energigas.se/Publikationer/Infomaterial
16) see: www.cropgen.soton.ac.uk/deliverables.htm Tests done with Timothy-‐based grass; UK research partner was University of Southampton
17) Greenfinch & DECC, 2005
Differences in biogas yields can be explained easily: Older tests have been undertaken with standard grass varieties including rye grass, simply because they were conducted before the uptake of commercially developed biogas grass types. In recent years the AD industry sees a constant competition between grass and maize ‘breeders’ for varieties producing the highest biogas yields. It comes as no surprise then that AD system providers with extensive grass experience assume a higher biogas potential for on purpose developed varieties for use in an AD environment than for ‘standard’ varieties. Another factor is that – unlike most grass harvested for research purposes – AD operators, who invest into reseeding with ‘biogas grass’, rigorously apply best practice in regard to digestate fertiliser, harvesting time, cut length and ensilaging.
Unfortunately, data from the extensive research done by UK universities in the 1990s do not seem to be publicly available. Apart from newly developed tools provided by WRAP (partly in association with ADBA), there are only a few comprehensive and original tools available to calculate the biogas or methane potential. These applications are often enhanced to provide a complete financial feasibility.
• NNFCC, see: www.nnfcc.co.uk (select ‘Anaerobic Digestion Economic Assessment Tool’ by The Anderson Centre, with a section for biogas yield calculation)
• CROPGEN, see: www.cropgen.soton.ac.uk/deliverables.htm (select D4 -‐ Database of Values)
• KTBL, see either www.ktbl.de/index.php?id=1054 or http://daten.ktbl.de/dslkr/start or
http://daten.ktbl.de/euagrobiogasbasis/startSeite.do?selectedAction=start (in English)
• LfL Bavaria, see: www.lfl.bayern.de/iba/energie/049711/
• ARGE Kompost Biogas, see: www.kompost-‐biogas.info

BABE – Brampton AD Feedstock Study
Public Version page 39 of 94
From the above list the Study opts for data provided by LfL Bavaria because if its unparalleled detail on grass in regard to grass types, maturity stages, cuttings and dry matter content.
4.4.3. Biogas Yield Estimates
As outlined before the biogas yield will be estimated by the following route:
• Identify the fresh weight of the various substrates, the dry matter of the fresh weight and the organic dry mater content of the dry matter (see Table 16)
• Establish the oDM’s biogas potential and calculate the biogas yield estimate
• Establish the methane component of biogas and calculate the methane yield estimate
The next table lists the annual and daily biogas yield estimate (where known) and the annual, daily and hourly methane yield estimate of all identified input material. The
oDM Biogas potential
Biogas/a CH4 content CH4/a CH4/d
t Nm3/t oDM Nm3 % of biogas, Nm3/t oDM
Nm3 Nm3
Slurry fresh, total
1,761 280 0,493,099 55% 271,205 0,743
Grass sil., 1st,
2nd cut 1,711 1,472
602 574
0,428,064 0,270,630
54.6% 55.0%
233,723 148,847
0,640 0,408
Hop mash 0,001 t.b.c. t.b.c. 500 000,527 0,002
Yeast wash 00,000.1 t.b.c. t.b.c. 600 000,088 0,000
Grand Total 2,945 1,191,794 1) ca 55% 654,389 2) 1,793
Table 19: Biogas and methane yield estimates from all identified input material
1) Sum is calculated with ‘t.b.c.’ = 0
2) Sum as displayed in Excel
As the use of over 24,500 tons of slurry is an unrealistic perspective the next table shows the biogas and methane yields for a feedstock mix with a more realistic contribution of slurry at 30% of the total annual throughput and without any brewery waste input material.
oDM Biogas potential
Biogas/a CH4 content CH4/a CH4/d
t Nm3/t oDM Nm3 % Nm3 Nm3
Slurry fresh, 30% of total
0,168 280 047,055 55% 025,880 71
Grass sil., 1st,
2nd cut 1,711 1,472
602 574
428,064 270,630
54.6% 55.0%
233,723 148,847
0,640 0,408
Plant Total 1,351 745,750 ca 55% 408,450 1,119
Table 20: Biogas and methane yield estimates from selected input material

BABE – Brampton AD Feedstock Study
Public Version page 40 of 94
The methane volume of all identified feedstock sources within the defined supply search area would yield about 1,192,000 m3 biogas and 650,000 m3 methane per year; a more likely scenario of feedstock usage – only 30% of slurry in relation to the total throughput and omitting any brewery waste – would provide 745,750 m3 biogas and 408,450 m3 methane annually.
4.4.4. Digestate Yield Estimates
The anaerobic fermentation causes a break-‐up of molecules and creates a liquid sludge, which has less volume than the original input material. With a feedstock mix of e.g 70% grass silage and 30% slurry the volume reduction for each substrate differs, with grass silage having the obvious larger shrinkage.
Overall a volume reduction rate for the entire throughput of 20% is applied to calculate the digestate volume. The annual plant throughput as in Table 16 (‘FW select.’) and Table 20 above – with 30% of total volume being slurry and no brewery waste – is reduced from 7,753 tons or 8,711 m3 to 6,969 m3.
The original untreated digestate can be further processed for on-‐site recycling or because of demand by regulations. If treated then digestate is usually termed ‘raw digestate’ or ‘whole digestate’. It can e.g. be separated into a solid and a liquid faction. Such separation would allow a more refined use as fertiliser tailoring the digestate’s N:P:K components to soil requirements or for recycling the solids part on-‐site and the liquid parts in an AD plant as ‘re-‐circulate’. Any excess liquid faction of digestate could also be evaporated in a digestate dryer.
The background assumptions for this calculation the digestate volume and its factions are:
• Density factor of 1.0 for slurry and 0.85 for grass silage– see Table 15
• A 20% volume reduction from anaerobic fermentation
• An appropriate retention time suitable for processing of grass silage
• The raw/whole digestate to consist of a 8% solid fraction and a 92% liquid fraction
Plants with lower and higher solids factions are known, as the 8:92 ratio seems the average value, the Study assumes for raw digestate to consist of an 8% solid fraction and a 92% liquid fraction.
The following table illustrates the calculated digestate volume.
Input FW
Throughput volume
Volume reduction
Raw digestate
Digestate solids part
Digestate liquid part
t m3 % m3 m3 m3
Slurry fresh, 30%
2,326 2,326 -‐ -‐ -‐ -‐
Grass silage total
5,427 6,384 -‐ -‐ -‐ -‐
Plant Total 7,753 8,711 -‐20% 6,969 557 6,411
Table 21: Digestate volumes of raw digestate and separated factions
The annual throughput volume will be of consideration for the plant design whilst the digestate volume will be the basis for any storage management, which might include a secondary digester.

BABE – Brampton AD Feedstock Study
Public Version page 41 of 94
Chapter summary:
• The energy potential of all input materials, which is used to calculate the biogas yield estimate, is based on figures provided by LfL Bavaria.
• The methane content of the biogas is 55%, typical for an AD plant with agricultural input material.
• A ‘grand total’ yield (for all identified input material) is calculated to be 1,192,000 m3 biogas and 650,000 m3 methane per year.
• A more realistic ‘plant total’ yield (for a manageable selection of input material) is calculated at 745,750 m3 biogas and 408,450 m3 methane.
• An input material volume reduction of 20% would create a digestate volume of 6,969 m3.

BABE – Brampton AD Feedstock Study
Public Version page 42 of 94
4.5. Stage 4: Electrical and Thermal Output
This chapter deals with the final energy conversion stage in an AD environment (as outlined on page 13), a stage where strategic business decisions will have to be made. Following the assessment of the methane potential from available input material the Study now aims to identify the methane’s energy potential in the form of electrical and thermal output.
4.5.1. Background Assumptions
Following the brief to focus on bankable, (in relation to the plant size) commercially feasible and locally deployable technology some technology routes are outside the Study’s considerations:
• The purification of biogas to bio-‐methane for the export to the gas grid
• The purification of biogas to compressed natural gas (CNG) for the use as vehicle fuel
• The purification of biogas to a combination of bio-‐methane and bio-‐hydrogen
• The addition of oxygen into biogas in combination with unique bacteria, which might shift the ratio of CH4 to CO2 in biogas from 55:45 to possibly 90:10
• The combination of algae units with AD, where otherwise unused CO2 and cleansed digestate serves as algae feedstock to create an energy loop with in return algae waste works as AD feedstock
• An Organic Ranke Cycle (ORC) engine to utilise spare heat and convert it to electricity
• A fuel cell storage to tailor electricity export according to more profitable hours within a 24-‐hour cycle
• A tri-‐generation system, consisting of an absorption unit, which in addition to electricity and heat of the CHP unit converts (surplus) heat into cooling
Assuming that electricity export to the distribution network is feasible, an internal combustion engine with a generator and a waste heat boiler recovering heat from exhaust would run at a constant load and provide the own ‘parasitic’ electricity and low grade heat demand for the AD plant.
The co-‐generation of heat and power is arranged by a CHP (‘combined heat & power’) engine, while larger units beyond the feedstock potential identified above would be called CHP turbines. In simple terms, whilst a CHP engine provides low grade heat in the form of hot water for space heating or for the heat load of an AD plant or similar equipment, a CHP turbine provides high(er) grade heat in the form of steam.
Considering the current 200kWth boiler capacity limit for RHI eligibility we exercise a restriction at 199kWth installed capacity and disregard any excess capacity in order to keep all commercial option open.
The heat from a CHP unit derives from the engine and the exhaust. A lack of heat usage or financially unfeasible heat scenarios might want the owner/operator not to capture any radiation or exhaust heat. This would reduce the available heat by about one third of its original potential (ignoring any 199kW cap), but also reduce capital cost for installation and heat dissipation equipment. Such a scenario is ignored for the heat calculations below.
The delivery options for a CHP unit – containerised, housed in a purpose-‐built engine room or in an existing structure – are ignored, as there is no impact on the performance.
The table below lists some of the available standard CHP engines optimised for biogas within the range of 150kW – 250kW together with their electrical and thermal efficiency factors. CHP engines optimised for landfill gas or natural gas are not considered for this purpose.

BABE – Brampton AD Feedstock Study
Public Version page 43 of 94
Electrical Output
Thermal Output
CHP Unit Type
OEM Electrical efficiency
Thermal efficiency
Combined efficiency
150 kW 179 kW 2G filius 206 2G/MAN 38.2% 45.6% 83.8%
165 kW 205 kW Cento T160 CON
TEDOM /MAN
37.8% 46.9% 84.7%
180 kW 209 kW Cento T180 CON
TEDOM /MAN
39.1% 45.3% 84.4%
190 kW 218 kW 2G 190 BG 2G/MAN 38.7% 44.4% 83.1%
200 kW 230 kW Cento T200 CON
TEDOM /MAN
39.2% 45.2% 84.4%
220 kW 232 kW 2G agenitor 206
2G/Deutz 40.6% 42.8% 83.4%
250 kW 265 kW 2G agenitor 306
2G/MAN 41.0% 43.5% 84.5%
Table 22: Selection of biogas CHP modules, available in the UK, and their efficiency values
Other European CHP manufacturers and providers for units within this capacity range could be found, but they have either no (known) representation in the UK or are focused on biogas from sewage and landfill gas, sectors which follow different specifications and regulations. Additional information can also be found on e.g. www.deutz-‐engine.com, www.guascor.com or www.cumminspower.com.
4.5.2. Calorific Energy
In order to convert the methane volume from norm(al) cubic meter to energy one needs to apply the calorific value for methane. The calorific value defines the energy, which is released when burning one norm(al) cubic meter of the gas and can be given as a unit of joule (J) or watt hours (Wh) or respectively their equivalents of mega joule (MJ) and kilo watt hours (kWh).
The calorific value can also be stated as upper calorific value or lower calorific value. The upper calorific value refers to the energy content when the steam in the fumes is condensed. The Study refers to the lower calorific value, also more widely used, which corresponds to the energy content when any steam in the fumes is not condensed.
The typical norm(al) cubic metre of biogas has a calorific value of 9.97kWh, which is all contributed to the methane component assumed that it is the only combustible component, while carbon dioxide has none. The energy content of biogas is therefore directly related to the methane content.
While the biogas of a food waste AD plant might have a methane content of 60%, 65% or more, the methane content of a silage-‐based AD plant will have (up to) 55%. In this case the energy potential of such methane is around 5.48 kWh per cubic metre.
The following table illustrates the calorific values for biogas at different methane content levels and electricity and heat generation for various CHP engines. The electricity and heat generation calculation is tailored for the appropriate methane content level of 55% for the BABE Project, which coincides with the majority of agricultural AD plants. The energy value for 1Nm3 biogas at 55% methane content is then applied to the energy conversion efficiencies of a selected range of CHP engines listed in Table 23.

BABE – Brampton AD Feedstock Study
Public Version page 44 of 94
Background Energy value Energy potential
1kWh = 3.6MJ
1Nm3 biogas @ 100% CH4 (= 1Nm3 CH4)
1Nm3 CH4 = 9.97kWh
9.97 * 3.6 = 35.892 MJ
1Nm3 biogas @ 50% CH4 35.892 * 50% =
17.964 MJ
1Nm3 biogas @ 55% CH4 35.892 * 55% =
19.7406 MJ
1Nm3 biogas @ 60% CH4 35.892 * 60% =
21.5352 MJ
1Nm3 biogas @ 65% CH4 35.892 * 65% =
23.3298 MJ
energy value of 1Nm3 biogas @ 55% CH4
19.7406 / 3.6 = 5.4835 kWh
electricity generation (190kW CHP) 38.7% efficiency of conversion
5.4835 *38.7% = 2.1221 kWh/m3
electricity generation (200kW CHP) 39.2% efficiency of conversion
5.4835 *39.2% = 2.1495 kWh/m3
electricity generation (220kW CHP) 40.6% efficiency of conversion
5.4835 *40.6% = 2.2153 kWh/m3
heat generation (in CHP) ca. 45% efficiency of conversion
5.4835 *45% = 2.4676 kWh/m3
losses (in CHP) ca. 15 – 20%
Table 23: Calorific values for biogas at different methane levels and CHP output values
Applying the highlighted figures above, 745,750 Nm3 of biogas at 55% methane would be equivalent to 1,602,990 kWh electric utilising a 200kW CHP unit or 1,652,060 kWh el with a 220kW CHP unit. The difference between the two CHP engines and the calculated electricity output lies in their varying energy conversion efficiency rates. Nevertheless, other factors within the process of energy generation need to be taken into consideration, therefore a more detailed route for establishing the electrical and thermal output is presented.
4.5.3. Output Calculations
The detailed energy output calculation for the AD plant is done in several steps: Firstly is to establish the energy content of the annually available 408,450m3 methane (see Table 20), assuming:
• A consistent quantity and (good) quality of methane
• A calorific value of 1 Nm3 methane is 9.96kWh
Secondly is to establish the ‘potential capacity’ by dividing the annual energy potential by the 8,760 hours per year. This figure will illustrate the theoretical capacity the generating system can deliver, before any conversion losses are taken off.

BABE – Brampton AD Feedstock Study
Public Version page 45 of 94
• Note: There are two separate principles at work: methane is generated in the anaerobic digester on a regular and non-‐stop basis over 8,760 hours per year, whilst the actual combustion of biogas does not work on a 8,760 hours basis. The burning of biogas can be arranged on demand; it will be stopped during maintenance work or other down time and the biogas in excess to the gas holding capacity will be flared off.
• Note: kWh / h = kW
Thirdly is to establish the ‘calculated capacity’ by applying the CHP efficiency factors – of an engine type likely to be employed – to the potential capacity.
Finally is to adjust the ‘calculated capacity’ to electrical and thermal efficiency factors of a suitable CHP engine available on the market. This will provide the ‘installed capacity’. If another CHP type will be chosen at a later stage, then the efficiency factors and other data will have to be amended accordingly.
• Note: kW potential / (electrical) efficiency factor = calculated capacity in kW
The next table shows the figures for the calculations as described:
Total energy p.a.
Total h/a Potential capacity
Efficiency factor
Calculated capacity
Installed capacity
Unit –> kWh hours kW % kW kW
electrical 39.20 182 200
thermal 45.20 210 199
Total 4,072,248 8760 465 84.40
Table 24: Calculation of installed capacity
The installed thermal capacity is limited to 199kW th in order to remain eligible for the highest Renewable Heat Incentive (RHI) bandwidth, which currently lists 199kW th as upper eligibility threshold. All CHP types listed in Table 22 from 165kWe upwards would need to be restricted in its thermal capacity for that purpose. The installed thermal capacity of the 200kWe CHP unit is stated as 230kW th.
In addition to the above steps one needs to consider any output risks from potential losses, of which three will need to be investigated further:
• Methane specifications: The CHP manufacturer will have to confirm whether the CHP output figures based on the specific methane content stated on the datasheet can be upheld or need to be amended in accordance with the methane content of the AD plant’s biogas of ca. 55%.
• Altitude: The efficiency factor of the to-‐be-‐selected CHP engine is valid at 0m altitude, a higher altitude will reduce the efficiency values. Townfoot Industrial Estate is situated at an altitude of 117m ASL, hence a minimal performance reduction is possible. On the other hand, efficiency factors of CHP engines are slightly increasing almost every year; by the time the Brampton AD goes live a higher electrical efficiency will likely be available. Therefore the Study upholds the manufacturer’s current efficiency factor. Nevertheless, the manufacturer’s representative will needs to be consulted at a later stage.
• On-‐site losses: Engine and transformer losses occurring up to the export meter. Such losses depend on local circumstances and between 0.5% and 1.0% of total generation

BABE – Brampton AD Feedstock Study
Public Version page 46 of 94
have been deducted at other projects. As there are several grid connection options at and close-‐by the Townfoot Industrial Estate, losses seem to be negligible and this Study will rather rely on a detailed grid assessment before coming to a conclusion.
It seems prudent to take some element of the above risks into consideration and the Study, in the absence of further information, allocates a risk buffer of 1% of electricity generation. (see: Table 25)
The calculation of the CHP unit’s installed capacity follows the estimate for the energy generation.
Taking away the maintenance requirement for the CHP, the operational ‘uptime’ of a CHP engine might be e.g. 8,550 hours per year. During its uptime the engine will not always run on full load, i.e. the entire installed capacity, due to grid issues or operational fluctuations of the digester or the engine. Therefore the Study differentiates between ‘general uptime’ and ‘runtime at full load’.
Financial forecasting for AD plants with state-‐of-‐art CHP engines will frequently aim for a performance benchmark of a full load runtime in the region of 7,500 to 8,200 hours per year. Furthermore, performance warranties are frequently given for either 90% of 8,760 hours, i.e. 7,884 hours, or for 8,000 hours, i.e. 91.3% of 8,760 hours. 7.900 hours p.a. are in between those two figures.
The next table shows the expected electricity generation figures for a 200kWe CHP and a comparison of its expected performance in relation to the calculated energy potential.
Installed capacity
Full load runtime
Generation per year
Generation per day
Generation per hour
Available generation
Generation risk buffer
kW hours/a kWh/a kWh/d kWh/h kWh %
200 kWe 7,9oo 1,580,000 kWh el
4,329 kWh el
180 kWh el
1,596,321 kWh el
1.03% of kWh el
199 kWth 7,900 1,552,200 kWh th
4,253 kWh th
17 kWh th
-‐ -‐
Table 25: Electrical and thermal output
The feedstock resources identified earlier allow for 7,900 hours per year runtime at full load, an achievement of 90.18% output over the full annual cycle, whilst maintaining a small buffer for various risks. The proposed AD plant should conservatively generate 1,580,000kWh (or 1,588MWh) of electricity and 1,552,200kWh (or 1,552MWh) of heat.
Based on those annual output figures the daily electricity output is 4,329kWh (or 4.3MWh) and the daily thermal output is 4,253kWh (or 4.3MWh).
Realistically, half of the spare generation potential, about 10kW or 87,600kWh will be utilised by over-‐production of silage whenever suitable weather conditions during harvest seasons occur. The other half of the spare generation potential is set aside for CHP maintenance and equipment replacement. The operator/funder will need to consider whether the spare capacity offered by a 200kWe CHP is sufficient for a future plant expansion scheme or an upfront installation of a 220kW or 250kW CHP is a feasible option.
A cross-‐check between the figure for electricity generation stated in connection with Table 23, 1,602,990 kWh, and the declared available generation of 1,596,321 kWh stands up for scrutiny. The difference is simply from the fact that the former figure, for the ease of calculation, is entirely based on 55% methane content for all input materials, while the latter acknowledges 54.6% methane content for the first cut of grass silage.

BABE – Brampton AD Feedstock Study
Public Version page 47 of 94
4.5.4. Parasitic Energy Demand and Exportable Energy
This sub-‐chapter follows the simple equation of:
Generated energy/electricity
– Parasitic energy/electricity
Exportable energy/electricity
The exportable electricity and heat is of relevance for payments from the Export FiT Tariff (or Export PPA) and the RHI scheme. However, without electrical specifications and machinery workload schedules the parasitic energy demand can only be estimated vaguely. The plant-‐internal electricity consumption depends on multiple factors, for example:
• Overall AD plant design (pump design; pumping, stirring and feeding frequency, etc.)
• Accumulated load of the electrical equipment
For further calculations we assume a parasitic electrical demand of 8% and would expect any plant with a higher demand to investigate any possible power savings.
The plant-‐internal heat consumption depends for example on:
• Overall AD plant design (heating design, etc.)
• Operating temperature (mesophilic or thermophilic), and the
• Amount of the CHP heat recovery
The heat use of a modern silage-‐based AD plants ranges from 30% (or lower) to 35%, with some systems in demand of up to 50% of CHP-‐generated heat. For further calculations we assume a parasitic heat demand of (up to) 35%, unless operating within the thermophilic temperature range.
In the absence of a heat strategy (which would follow after a feedstock assessment) and an AD system design concept the Study assumes:
• Heat is utilised/collected up to the threshold of 199kW th, but not beyond
• Heat demand is constant throughout any 24-‐hour cycle (day and night temperatures),
• Heat demand is constant throughout the seasons (summer and winter temperatures)
and ignores the two peak scenarios of a:
• Winter 24-‐hour day (maximum heat demand and minimum heat dissipation),
• Summer 24-‐hour day (minimum heat demand and maximum heat dissipation).
The next table shows the generated heat resource, the parasitic heat demand and the available or exportable heat estimate.
Generated energy p.a.
Parasitic demand
Parasitic demand
Exportable energy
-‐ -‐
Unit –> kWh % kWh kWh
electrical 1,580,000 08 126,400 1,453,600
thermal 1,552,200 35 543,270 1,008,930
Table 26: Calculation of parasitic and available heat for export

BABE – Brampton AD Feedstock Study
Public Version page 48 of 94
As mentioned above, a heat strategy aiming not to utilise the thermal energy from the CHP engine exhaust would result in ca 1/3 less generated heat and some minor equipment cost savings.
For further commercial considerations it should be mentioned that the regular generation of electrical and thermal energy like in an AD plant could match an overall annual energy demand on paper, but may not cope with irregular sharp peaks in energy demand. If an energy user has such ‘demand spikes’, then any financial calculations will have to consider some temporary electricity import from the grid.
Chapter summary:
• The generated biogas would allow a theoretical capacity of 182kWe at 100% (i.e. 8,760 hours p.a.) annual availability, but considering downtime and output fluctuations the electricity generation is best arranged with a CHP of 200kWe installed capacity.
• The total electricity generation potential is 1,596,321kWh, which includes a 1% buffer for uncertainties in regard to AD processes, CHP and grid.
• With the CHP performing at full load of 7900 hours, i.e. 90.2% of annual availability, the generated electricity is estimated at 1,560,000kWh/a, 4,329kWh/d and 180kWh/h.
• The installed thermal capacity of the same CHP engine would be 230kW th, however is downgraded to 199kW th to remain eligible for the RHI scheme.
• With the CHP performing at full load of 7900 hours, i.e. 90.1% of the year, the generated heat is estimated at 1,552,200kWh/a, 4,253kWh/d and 177kWh/h.
• The plant-‐internal consumption reduces the exportable electricity by ca 8% and the exportable heat by ca 35% of the relevant generated energy.
• Depending on a plant expansion strategy and on the likelihood of surplus feedstock, the installation of a 220kWe or 250kWe CHP unit is valid consideration.

BABE – Brampton AD Feedstock Study
Public Version page 49 of 94
5. Feedstock Risks & Impacts:
5.1. Feedstock Compatibility
Compatibility risks occur with feedstock in regard to the selection of input materials and with appropriate technology. The typical issues raised at this point are:
• Are the various input materials within the identified feedstock mix compatible with each other?
• What is their optimum mix?
• Are there a suitable AD technologies available for the identified feedstock mix
• Does the identified feedstock mix allow for future flexibility in regard to other input materials?
Energy crops or ‘purpose grown crops’, for our purposes this includes grass silage, can be fermented either on their own or in combination with other materials in either a ‘wet AD’ or a ‘dry AD’ set-‐up. ‘Wet AD’ refers to a digester DM content of <15% and ‘dry AD’ to >15% digester DM content. Slurries typically have a high nutrient component, but low solids content, usually within the range of 5 – 10%, depending on animal type, feeding routine and dilution form rain and wash water. Wet AD systems are mostly designed as continuous feed systems, typically in ‘continuously stirred tank reactors’ (CSTR), in preference over batch systems. Such system types are available from several technology providers giving BABE sufficient choice for its systems selection process.
As many wet AD systems find a grass silage-‐only environment too challenging, a combination with livestock manures is a more ‘stirrer-‐friendly’, tried and tested approach. Such co-‐digestion of silage with slurry and/or FYM provides a crucial process buffering capacity. This balancing effect on the AD biology can be seen on several process parameters including a balance of the carbon to nitrogen (C:N) ratio and a reduction of the risk to ammonia inhibition.
Additionally, the combination of silage and slurry has another positive impact: Experienced operators have noticed a (slight) increase of methane yields from co-‐digestion, compared to methane yields of silage and slurries digested on their own. The following quote illustrates this:
“The combination of crop feedstock for AD with animal manures, particularly fresh dairy slurry, produces gas yields better than expected from the individual components.” St. Temple, Copy Green Fm, from: The Case for Crop Feedstocks in Anaerobic Digestion; ADBA, CLA, NFU and REA; 2011
This experience by operators over the last 20 years has been confirmed by scientific research. The following quote refers to a co-‐digestion of slurry with a combination of beet root tops, grass silage based on Timothy grass varieties and oat straw.
“The higher specific methane yields in co-‐digestion compared with digestion of manure alone may also be due to synergy effects owing to a more balanced nutrient composition and C/N ratio in the feedstock.” CROPGEN: Renewable energy from crops and agrowastes. D17: Database on the methane production potential from mixed digestion; 2007
Another report sums up the benefits of the by sometimes financial-‐only perspective derided slurry:
“Slurry acts as an excellent ‘balancer’, reducing risks of foaming etc. and has an ideal blend of microbes to act as a base feedstock, keeping the balance of microbes healthy.”

BABE – Brampton AD Feedstock Study
Public Version page 50 of 94
The Andersons Centre: A detailed economic Assessment of Anaerobic Digestion Technology and its Suitability to UK Farming and Waste Systems, 2nd Edition; 2010
Modern AD plants using the same or very similar feedstock mix are in operation covering a range from 150kW to 2MW. About 10% of Germany’s 8,000 (as of end 2012) agricultural AD plants, mostly located in peripheral areas, similar to Brampton, are based on grass silages.
The appropriate proportion between silages and slurries is to be decided by the system provider’s and the operator’s preference to use additional enzymes for process stabilisation. Industry figures on the ratio of grass silage to (fresh) dairy slurry vary vastly from 40:60 to 90:10. Experienced technology providers will cope with a feedstock mix in the region of 60:40 to 90:10. Our above calculation was therefore based on a 70:30 ratio to allow for a wider spectrum of AD technologies.
A list of appropriate technology system providers is provided in Appendix C.
Over a 20-‐year period the input mix might evolve because of technological advancements or commercial and weather-‐related changes. The proposed mix shows sufficient flexibility or ‘forward compatibility’ by the ability to substitute grass silage with whole crop silage, either as break crop or permanently. The addition of grass mixed with red clover and/or locally sourced farmyard manure, preferably with straw as bedding material, would also provide a welcome enrichment to the feedstock mix. Furthermore, with operating experience gained over the years, some slurry may be replaced with a substrate of higher energy value without jeopardising the plant biology.
Chapter summary:
• The identified feedstock mix is a proven set-‐up within the AD industry with a range of AD systems available.
• A co-‐digestion of grass silage and dairy slurry provides reliable process stability and has no adverse impact on gas yields.
• The exact ratio between grass silage and dairy slurry has to be arranged with the technology provider.
• The feedstock mix offers flexibility to accommodate other locally sourced input material in future.

BABE – Brampton AD Feedstock Study
Public Version page 51 of 94
5.2. Feedstock and Consents
This chapter will briefly investigate the impact and possible mitigation measures of the preferred feedstock selection on the relevant consents required:
• Planning permit
• Environmental permit
• Digestate certification
The typical feedstock-‐related issues associated with the permitting regime are:
• Would the feedstock mix trigger any planning conditions?
• Would the feedstock mix have any influence on the type of environmental permit?
• Would there be any environmental impacts, either from planning or permitting, which are costly to mitigate, especially in regard to odour and air emissions, noise and traffic?
• What is the impact of the input material on the AD operation, with e.g. pasteurisation?
• What is the impact of the input material on the legal status of digestate?
In general, the planning system focuses on whether the development itself is an acceptable use of the land and the effects of those uses, whilst the permitting regime seeks to safeguard and control the processes or any emissions to the environment themselves. The planning procedure scrutinises whether the development’s considerations of the quality of land, air or water, possibly leading to an effect on health, are capable of being a ‘material consideration’ leading to its constraint or rejection. In other words, the planning permit is a grant to build a specific undertaking, whilst the environmental permit is a licence to operate a specific undertaking at a site.
5.2.1. The Planning Permit
National planning policy has been and still is subject to significant changes with the publishing of the National Planning Policy Framework (NPPF) in March 2012, replacing the previous national planning policy and – gradually – regional planning policy.
So is Section 10 of the NPPF, relating to ‘Meeting the challenge of climate change, flooding and coastal change’, superseding for example the:
• Planning Policy Statement 1: Planning and Climate Change Energy – Supplement to PPS1
• Planning Policy Statement 22: Renewable Energy (PPS22)
Section 11 of the NPPF, relating to ‘Conserving and enhancing the natural environment’, supersedes for example the:
• Planning Policy Statement 23: Planning and Pollution Control (PPS23)
• Planning Policy Guidance 24: Planning and Noise (PPG24)
Of relevance for the proposed AD plant is a presumption in favour of sustainable development. It is recommended that Local Plans and planning decisions taken should reflect this presumption and the integrated social, environmental and economic orientation the NPPF envisages. Paragraph 15 of the NPPF states to “proactively drive and support sustainable economic development to deliver the homes businesses and industrial units, infrastructure and thriving local places that the country needs.”
Section 10 highlights that the delivery of renewable and low carbon energy is key to the economic, environmental and social dimensions of sustainable development. Paragraph 97 of the NPPF epitomises this approach by stating:

BABE – Brampton AD Feedstock Study
Public Version page 52 of 94
“To help increase the increase the use and supply of renewable and low carbon energy, local planning authorities should recognise the responsibility on all communities to contribute to energy generation from renewable or low carbon sources. They should:
● have a positive strategy to promote energy from renewable and low carbon sources;
● design their policies to maximise renewable and low carbon energy development while ensuring that adverse impacts are addressed satisfactorily, including cumulative landscape and visual impacts;
● …
● support community-‐led initiatives for renewable and low carbon energy, including developments outside such areas being taken forward through neighbourhood planning; and
● identify opportunities where development can draw its energy supply from decentralised, renewable or low carbon energy supply systems and for co-‐locating potential heat customers and suppliers.”
Apart from the National Planning Policy Framework, the Cumbria Minerals & Waste Development Framework and the Local (Transport) Plan will to be taken into consideration.
5.2.2. Planning Route
Assuming upfront that the project will not qualify for planning permit under any Permitted Planning regulations, the first actions will be to identify the determining planning authority and the scope of the planning exercise.
Contact has been established with Development Control at Cumbria County Council’s planning department, where it has been confirmed that County Council is the appropriate planning authority to seek planning permission. Where an AD development uses either input material from outside its premises or landholding or agricultural by-‐products and is therefore categorised as a ‘waste application’, the application will be dealt with on county and not on district (or equivalent) level.
In line with the Town and Country Planning (Environmental Impact Assessment) (England and Wales) Regulations 1999 (as amended), a ‘screening opinion’ will be requested from the determining Local Planning Authority. This represents a written statement of opinion as to whether the proposed AD development would constitute an EIA (Environmental Impact Assessment) development, likely to have significant effects on the environment by virtue of its nature, size and location.
A possible outcome, based on planning decisions with a feedstock mix – livestock manures and energy crops without any food waste – and supply sourced from several farm holdings (all subject to no significant unmitigatable environmental impacts), could classify the proposed scheme as a ‘Schedule 2’ development as described in 11 (b) of the above regulations, meeting the criteria of column 2 of this schedule (i.e. being over 0.5ha and within 100m of controlled waters) and not being an EIA development.
The inclusion of brewery waste as food waste would add additional layers of planning preparations (HACCP), plant design and infrastructure requirements like ‘clean’ and ‘dirty’ access, egress and yard areas, waste reception infrastructure, bunding and the public perception of a ‘food waste plant’.
5.2.3. Key Environmental Impacts
A range of potential environmental impacts will be investigated in more detail, limited to feedstock issues.

BABE – Brampton AD Feedstock Study
Public Version page 53 of 94
5.2.4. Noise
Regarding legislation and national policy, noise nuisance in the UK is principally governed by Statutory Nuisance legislation under the Environmental Protection Act (1990 – as amended). No legal standards regarding noise levels are applied; however, noise assessments are accepted on guidelines provided through British Standards (BS) and by the World Health Organisation (WHO). Noise nuisance is generally policed by Local Authority Environmental Health Departments.
The ‘Planning Policy Guidance Note (PPG) 24: Planning and Noise’ guides local authorities in England on the use of their planning powers to minimise the adverse impact of noise. It outlines the considerations to be taken into account in determining planning applications both for noise-‐sensitive developments and for activities, which generate noise.
As a matter of good practice, initially a baseline, background sampling of nose will be undertaken in accordance with the British Standard BS4142-‐1997 ‘Method of rating industrial noise affecting mixed residential and industrial areas’ to assess the impact of the site and then the overall suitability of the site for the proposed AD development. In other words, its aim is to establish the sound landscape and to provide systems to manage noise emissions at the nearest receptor to standards expressed in any planning condition.
Noise originating from feedstock related activity, the concern of this Study, is restricted to traffic noise. It originates from vehicle movements during supply delivery and digestate take-‐away. The vehicle movements are restricted to tractor and trailers, no HGVs are envisaged to be used. The impact of vehicle movements can be reduced by a carefully planned site layout with short distances between entrance and silage clamp and digester tank as well as a traffic plan only allowing a one-‐way traffic flow. These measures will reduce the potential for nuisance noise greatly.
A noise modelling scheme will have to assume vehicle movements to be restricted at daytime hours and tractors to have a sound power level of 83dBA, according to BS5228:2009. Such scheme will take into account a total of 1,829 vehicle movements (‘trips’) per year, the spreading of traffic movements over the year depending on the silage supply system. (See: the ‘Transport’ paragraph)
Map 10: Indicative location of the nearest domestic receptors for noise (and odour) © Crown copyright and database rights 2013 Ordnance Survey 0100031673

BABE – Brampton AD Feedstock Study
Public Version page 54 of 94
The above illustration highlights the nearest domestic receptors to the East of the Industrial Estate in the distance of approximately 780 metres. The Study has not gained certainty whether the caravan park to the North East of the industrial estate has a permanent dwelling located on its premises; if so it would be closer to the proposed AD plant with a distance of approximately 610 metres.
Construction noise is not part of the above considerations; operational noise from the weighbridge and bleeps from a tractor or telescope reversing at the silage clamp is optional and will need to be considered at a later stage.
Any noise causing nuisance to the adjacent commercial/light industrial tenants on the industrial estate would have to be duly mitigated.
Traffic – Routes and Frequencies
Any traffic impact would be restricted to an area within a radius of five kilometres of the Townfoot Industrial Estate. Impact areas can be established by identifying traffic routes and traffic frequencies.
The expected traffic routes are presented for silage suppliers only, as no discussion has taken place yet as to what amount of slurry will be required by the technology provider. The proposed supply routes aim to avoid any built-‐up area where possible, and are as such bypassing Irthington and Brampton completely. All transport is concentrated on the A69 and the connecting road to the Townfoot Industrial Estate at the South West of Brampton.
Any digestate distributed back to the silage supply farms would follow the same routes.
The indicative – no discussion has taken place with the planning authority on that subject – traffic routes for silage suppliers are shown below. It should be noted that five of the ten slurry supply locations are directly en route of the silage supply routes.
Map 11: Indicative traffic routes for silage suppliers (copyright same as Map 10)
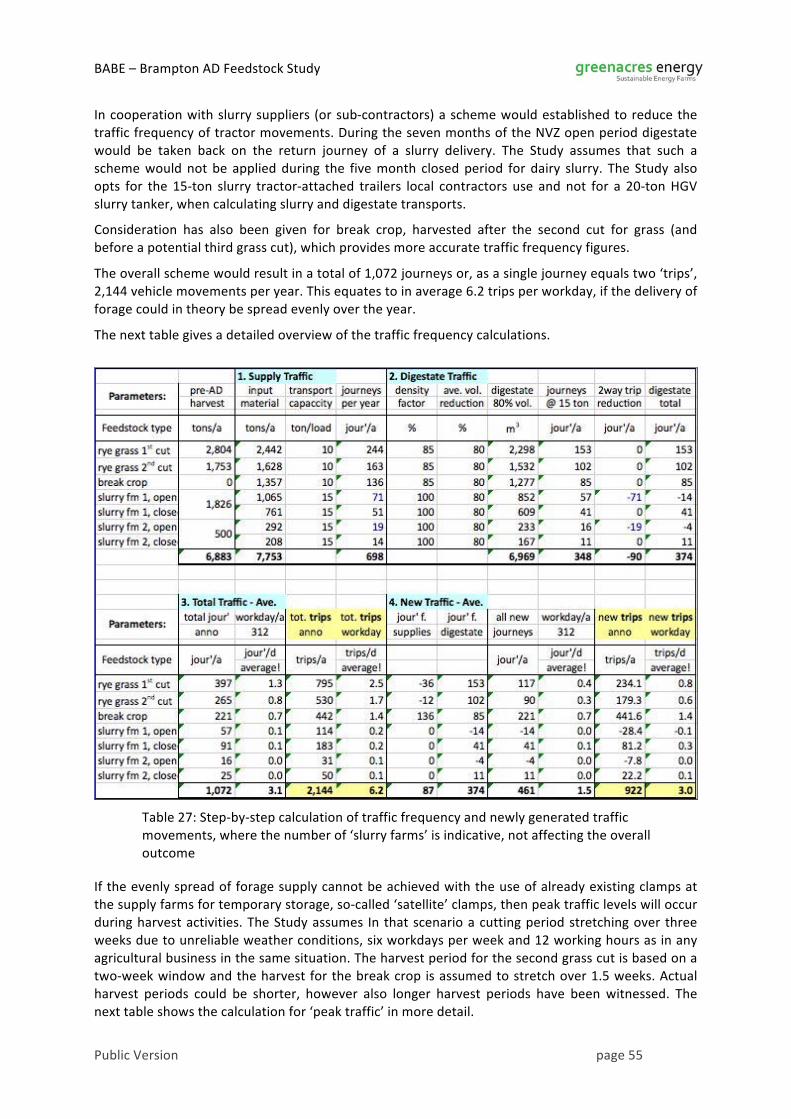
BABE – Brampton AD Feedstock Study
Public Version page 55 of 94
In cooperation with slurry suppliers (or sub-‐contractors) a scheme would established to reduce the traffic frequency of tractor movements. During the seven months of the NVZ open period digestate would be taken back on the return journey of a slurry delivery. The Study assumes that such a scheme would not be applied during the five month closed period for dairy slurry. The Study also opts for the 15-‐ton slurry tractor-‐attached trailers local contractors use and not for a 20-‐ton HGV slurry tanker, when calculating slurry and digestate transports.
Consideration has also been given for break crop, harvested after the second cut for grass (and before a potential third grass cut), which provides more accurate traffic frequency figures.
The overall scheme would result in a total of 1,072 journeys or, as a single journey equals two ‘trips’, 2,144 vehicle movements per year. This equates to in average 6.2 trips per workday, if the delivery of forage could in theory be spread evenly over the year.
The next table gives a detailed overview of the traffic frequency calculations.
Table 27: Step-‐by-‐step calculation of traffic frequency and newly generated traffic movements, where the number of ‘slurry farms’ is indicative, not affecting the overall outcome
If the evenly spread of forage supply cannot be achieved with the use of already existing clamps at the supply farms for temporary storage, so-‐called ‘satellite’ clamps, then peak traffic levels will occur during harvest activities. The Study assumes In that scenario a cutting period stretching over three weeks due to unreliable weather conditions, six workdays per week and 12 working hours as in any agricultural business in the same situation. The harvest period for the second grass cut is based on a two-‐week window and the harvest for the break crop is assumed to stretch over 1.5 weeks. Actual harvest periods could be shorter, however also longer harvest periods have been witnessed. The next table shows the calculation for ‘peak traffic’ in more detail.

BABE – Brampton AD Feedstock Study
Public Version page 56 of 94
Table 28: Calculation of peak traffic figures
The traffic frequency during all three harvests is around four trips per hour per workday, making all three periods ‘peak’ time. Despite little time for digestate spreading during cutting, nutrient feed within 24 or 48 hours of cutting is vital for continuous plant growth, therefore the calculation is based on ongoing slurry and digestate traffic.
Odour
The UK has no statutory standards for assessing odour nuisance and it is part of the duty of care for the operator to ensure that odour emissions are prevented and minimized in accordance with the recommendations from e.g. “A Code of Good Agricultural Practice for farmers, growers and land managers’ (DEFRA, 2009) and its predecessor The Air Code (1998, MAFF now DEFRA).
From a planning perspective the proposed plant background levels of odour will be consistent with the rural and agricultural surroundings in which ongoing agricultural practices of spreading slurry, poultry litter and FYM generate clearly detectable odorants. Anaerobic digestion is regarded as a technology to reduce odour emissions from slurry, already recognised in The Air Code, where it states that “in a properly designed and run system, the odour emitted … (from) anaerobically digested slurry will be reduced by up to 80%.”
Additionally, the only external, that is not enclosed in sealed units, process is the process of silage formation from forage. Whilst silage is closed in highly airtight clamps, aerobic and anaerobic fermentation takes place, giving rise to potential odour. Such odour would be released only when feedstock was taken from the ‘face’ of the silage probably twice a day. Where odour could arise, the distance to sensitive areas seems such that any impacts on domestic receptors (as shown in Map 10 above) would be extremely unlikely.
Landscape and Visual Impact
The landscape and visual impact of the proposed AD plant is for the purpose of the Study limited to the structure of the silage clamp. Any clamp design as part of the overall plant layout and design will have to ensure no adverse affect on the natural and historic landscape. This can be achieved by integrating already existing features of the surrounding industrial estate into the design of plant structures and screening the visibility of the clamp with suitable plantation.
Section 7 of the NPPF relating to ‘Requiring Good Design’ emphasises the importance of good design for the character and amenity of places and areas in which a development is situated.
The nearest residential dwelling located within a caravan park is sited about 600m away from the proposed development, a distance sufficient to prevent any undue loss of amenity arising to

BABE – Brampton AD Feedstock Study
Public Version page 57 of 94
properties by way of either overbearing or overshadowing, especially considering other units of the Townfoot Industrial Estate placed in between.
In summary, the ‘feedstock element’ of the AD plant should be compliant with any planning policy requirements.
5.2.5. The Environmental Permit
Permitting Regime
The proposed AD plant is expected to require a permit to operate under the provisions of the Environmental Permitting (England and Wales) Regulations 2010 (SI2010 No.65). The permitting regulation sets out how the Environment Agency will apply waste regulatory controls to the anaerobic digestion of agricultural manure and slurry and the use of the resulting digestate as a fertiliser on agricultural land in England and Wales.
National planning policy has been and still is subject to significant changes with the publishing of the National Planning Policy Framework (NPPF) in March 2012, replacing the previous national planning policy and – gradually – regional planning policy.
The Environmental Permitting Regulations 2010 (EPR) are also subject to change: A public consultation has been made public in 2013, but to date the outcome is not yet published. Expected amendments are due to a deeper understanding of the AD industry. Further expected is a closer integration with planning procedures and a lifting of the compulsory publishing of environmental permits by local authorities.
The EPR requires the operator of a facility, which undertakes environmental activity falling within the scope of the regime to obtain an Environmental Permit from the Environment Agency, or register an exemption from doing so, if applicable, before it can operate lawfully.
The aim of the regime is to ensure the proper regulation of activities which pose a risk to the environment or to human health, and which have the potential to cause damage to the surrounding area. The regulations also seeks to ensure that the operator follows ‘best practice’ when managing the facility, whilst monitoring operator competence through regulatory supervision.
The agency responsible for Environmental Permit matters is the Environment Agency. As the proposed AD plant is situated in Brampton the Environment Agency’s branch in charge is the Northern Area Office for the North West based in Penrith, Cumbria.
Reference Documents
The Environmental Permitting Regulations (EPR) are laid out and explained in a wide range of documents, some of the most relevant are:
• DECC and DEFRA, Anaerobic Digestion Strategy and Action Plan (v. 2011-‐12 and updates)
• Environment Agency, Position Statement 029: Anaerobic digestion of agricultural manure and slurry. Oct. 2010
• Environment Agency, How to comply with your Environmental Permit; vers. 6, June 2013
• The Environment Agency’s ‘regulatory’ guidance papers
• The Environment Agency’s sector cross-‐cutting or ‘horizontal’ guidance papers, e.g.:
o H1 – Environmental risk assessments o H2 – Energy efficiency o H3 – Noise o H4 – Odour o H5 – Site condition report guidance

BABE – Brampton AD Feedstock Study
Public Version page 58 of 94
Permitting Route
The permitting regulation reflects the Environment Agency’s risk based approach to benefits and risks to the environment. The authorisations can be:
• Exemptions, which are free of charge and reserved for lower risk activities
• Permits, which are chargeable and for medium and higher risk activities
To ease the complexity of the permitting regulations the description moves from the simplest levels of compliance to most complex:
The two specific waste exemptions for anaerobic digestion, named T24 and T25, are targeted at very low risk small scale AD operations. The exemption type T24 covers treatment of manures and slurries at premises used for agriculture. It is limited by a quantity of 1,250 cubic metres of waste (which includes any digestate) at one time and demands a minimum retention time of 28 days. The T25 regulates anaerobic digestion at premises not used for agriculture, widens the list of eligible input materials, but limits the quantity to 50 cubic metres per day.
Energy crops, which are per definition purpose grown and include grass silage, are neither regarded as waste nor as non-‐waste and are therefore automatically eligible for any type of exemption or permit under the Environmental Permitting Regulations.
There are two main types of permit under the EPR:
• Standard Rules permits, which impose a set of generic rules applicable to all activities of a certain type
• Bespoke permits with conditions specific to the site or a mobile plant activity
Standard rules permits impose a set of rules and risk assessments which apply to sites carrying out activities of a certain type such as composting, or waste storage, as long as they meet the screening criteria. For example, they may need to be a certain distance from housing or protected sites, species and habitats. A standard permit has one condition that says which standard rules set or sets the operator must comply with.
Part of a standard rules permit is the requirement for a site-‐specific management system. For example, there is a standard rules set for waste storage and anaerobic treatment of up to 75,000 tonnes per year and up to this level the same set of standard rules will apply. The management system must identify and control how much of each specific waste type the site can safely handle whilst minimising the risk of pollution.
If an operator cannot meet the standard rules criteria one must apply for a bespoke permit. Bespoke permit applications have a detailed site-‐specific determination process. The permit will usually contain conditions specific to the operation and site. The first condition states the need for a management system. A bespoke permit for a number of activities can also include standard rules sets.
The following table compares the most relevant licence types and lists their main criteria.
Type of Licence Key Criteria
T24 Exemption
Anaerobic digestion and burning of resultant biogas at premises used for agriculture
Operator can store or treat up to 1,250 cubic metres of waste at any one time
Waste types only include manures, slurries and plant tissue (‘energy crops’)
Waste must remain in the digester for min 28 days
-‐

BABE – Brampton AD Feedstock Study
Public Version page 59 of 94
The combustion appliance must have a net rated thermal input of less than 0.4 MW
Any gas produced by the digester must be collected and then burnt in an appliance
T25 Exemption
Anaerobic digestion and burning of resultant biogas at premises not used for agriculture
Operator can store or treat up to 50 cubic metres of waste at any one time
Waste types only include manures, slurries and plant tissue/vegetation and catering wastes
Waste must remain in the digester for a minimum of 28 days
The combustion appliance must have a net rated thermal input of less than 0.4 MW
Any gas produced by the digester must be collected and then burnt in an appliance
-‐
Standard Rules SR2012 No 10
Waste recovery operation – on farm
Anaerobic digestion and use of resultant biogas at premises used for agriculture
Treatment capacity of waste must be less than 100 tonnes on any one day
Waste types only from on-‐farm activities (EWC 02 01 01, 02 01 03, 02 01 06, 02 05 01 and 02 05 02)
Maximum throughput of animal waste must be less than 10 tonnes per day
The combustion appliance must have a net rated thermal input of less than 5 MW
Standard Rules SR2012 No 12
Waste recovery operation – off farm
Anaerobic digestion and use of resultant biogas at premises not used for agriculture
Treatment capacity of waste must be less than 100 tonnes on any one day
Waste types only from on-‐farm activities
Maximum throughput of animal waste must be less than 10 tonnes per day
The combustion appliance must have a net rated thermal input of less than 5 MW
Bespoke Permit – Tier 3
Waste recovery operation
Anaerobic digestion and burning of resultant biogas at premises not used for agriculture
A Tier 3 Bespoke Permit specially concerned about ‘operational conditions’ and applies if the accepted waste is e.g. either:
• not of a type and quantity as listed (in tables 2.1 and 2.3) in the Stand. Rules SR2012 No12
• not conforming to the description in the documentation supplied by the producer and holder
• not biodegradable
• from animal by-‐products or contain animal by-‐products and are not handled and processed in accordance with any requirements and restrictions imposed by the animal by-‐ products legislation
Table 29: A selection of relevant environmental permit authorisations

BABE – Brampton AD Feedstock Study
Public Version page 60 of 94
The feedstock eligible for a permit under SR2012 No10 (‘on farm’) are listed below in order to demonstrate the regulators understanding of ‘on-‐farm’ and to show the type of possible permit if the proposed AD site would have been an operating farm.
In theory a Tier 2 Bespoke Permit is concerned about ‘location conditions’ and applies if the permitted activities are not be carried out within:
• 10 metres of any watercourse
• a groundwater source protection zone 1, or if a source protection zone has not been defined then within 50 metres of any well, spring or borehole used for the supply of water for human consumption. This must include private water supplies.
• 200 metres from the nearest sensitive receptor
Furthermore, the gas engine stack must be a minimum of 3 metres in height and must not be located within 200 metres of a European Site or a Site of Special Scientific Interest (excluding any site designated solely for geological features).
In practice however, any Bespoke Permit for an AD facility will automatically be a Tier 3 Bespoke Permit.
Feedstock and Permit Types
Some help can be obtained from the EA publication ‘How to comply with your Environmental Permit (Version 6.0, June 2013)’
Each permit allows for a specific set of input material to be processed in an AD facility as tabled below.
European Waste Code (EWC)
Description
02 Wastes from Agriculture, Horticulture, Aquaculture, Forestry, and Hunting, Fishing, Food Preparation and Processing
02 01 Wastes from agriculture, horticulture, aquaculture, forestry, hunting and fishing
02 01 01 Sludge from washing and cleaning – vegetables, fruit and other crops
02 01 03 Plant tissue waste -‐ husks, cereal dust, waste animal feeds, off-‐cuts from vegetable and fruit and other vegetation waste
02 01 06 Animal faeces, urine, manure including spoiled straw
02 05 Wastes from the dairy products industry
02 05 01 Biodegradable materials unsuitable for consumption or processing (other than those containing dangerous substances) − solid and liquid dairy products, milk, food processing wastes, yoghurt, whey from dairies
02 05 02 Sludge from dairies effluent treatment
Table 30: Input material eligible under Standard Rule R2012 No10
Table 30 illustrates that all identified feedstock types, with the exemption of brewery waste, hop mash and yeast wash, are compliant with the Standard Rule R2012 No10 permit.

BABE – Brampton AD Feedstock Study
Public Version page 61 of 94
The input material eligible under permit under SR2012 No12 (‘off farm’) cast a much wider net and allow for waste from a variety of sectors. The most relevant are listed below, the full list can be found on the Environment Agency website.
European Waste Code (EWC)
Description
02 Wastes from Agriculture, Horticulture, Aquaculture, Forestry, and
Hunting, Fishing, Food Preparation and Processing
02 01 Wastes from agriculture, horticulture, aquaculture, forestry, hunting and fishing
02 01 01 – 03, 02 01 06 – 07, 02 01 99
02 02 Wastes from the preparation and processing of meat, fish and other foods of animal origin
02 02 01 – 04, 02 01 99
02 03 Wastes from fruit, vegetables, cereals, edible oils, cocoa, coffee, tea and tobacco preparation and processing; conserve production; yeast and yeast extract production, molasses preparation and fermentation
02 03 01, 02 03 04 – 05, 02 03 99
02 04 Wastes from sugar processing
02 04 03, 02 04 99
02 05 Wastes from the dairy products industry
02 05 01 – 02
02 06 Wastes from the baking and confectionery industry
02 06 01, 02 06 03
02 07 Wastes from the production of alcoholic and non-‐alcoholic beverages (except coffee, tea and cocoa)
02 07 01 – 02, 02 07 03 – 04, 02 07 99
Table 31: Selection of input material eligible under Standard Rule R2012 No12
Additional eligible input material is e.g. paper and cardboard – production waste or waste package (without non-‐biodegradable coating or preserving substance), de-‐inked paper pulp, paper fibre, glycerol, digestate from other anaerobic digestion treatments, kitchen and canteen waste as well as edible oil and fat. A complete list can be found on www.nwcpo.ie/forms/EWC_code_book.pdf � and explanations on www.biffa.co.uk/assets/files/Content%20PDF/EWC_Paper-‐v1.09.pdf �.
Brewery waste, hop mash and yeast wash, would be eligible under this type of environmental permit.
Permit Charges
In regard to the charges for applying and maintaining an environmental permit (or exemption), the application of an exemption is free of charge, followed by the Standard Permit for on-‐farm and then

BABE – Brampton AD Feedstock Study
Public Version page 62 of 94
off-‐farm. An application for the Bespoke Permit is the most complex and costliest of the three licence types.
The Standard Rules permit charges for the SR2012 No10 (‘on farm’) are:
• Application fee: £1,590
• Subsistence fee: £1,540 (per year)
The Standard Rules permit charges for the SR2012 No12 (‘not on-‐farm’) are:
• Application fee: £1,590
• Subsistence fee: £2,420 (per year)
An AD-‐related Bespoke Permit will be calculated by use of an operational risk appraisal (OPRA) score:
• Derived from OPRA weighing factors and
• Multiplied by a relevant OPRA multiplier
Additional charges arise for any transfer of e.g. permit holder and surrender of the permit.
All input material identified for the proposed BABE AD plant is in accordance with Standard Rules SR2012 No10 and therefore with SR2012 No12. However, there is a question of the nearest receptor, possibly a business unit at the Townfoot Industrial Estate and less than 100 metres from the proposed site boundary, which is indicated with a magenta-‐coloured circle in Map 10.
The ‘nearest sensitive receptor’ refers to the nearest place to the permitted activities where people are likely to be for prolonged periods. This term would therefore apply to dwellings and associated gardens, including farmhouses and to many types of workplaces. The Environment Agency would not normally regard a place where people are likely to be present for less than six hours at one time as being a sensitive receptor.
The term does not apply to the operators of the permitted facility, their staff when they are at work or to visitors to the facility, as their health is covered by Health and Safety at Work legislation. The applicant needs to demonstrate to the EA that people would be in the receptor’s place for less than six hours at any one time, otherwise the proposed AD plant is likely to be licensed under a Tier 2 Bespoke Permit rather than a permit under SR2012 No12.
Summary
For the sake of understanding, the possible environmental permit route is presented in a cascading order:
• A Standard Permit under SR2012 No 10 (‘on-‐farm’) is applicable if:
o The input material is restricted to slurry and silage without any brewery waste and o The AD plant would be on a farm and o The distance of the AD plant to the nearest receptor would be over 200m
• A Standard Permit under SR2012 No 12 (‘not on-‐farm’) is applicable if:
o The input material is slurry and silage and includes brewery waste and o The AD plant is not on a farm and o The distance of the AD plant to the nearest receptor would be over 200m
• A Bespoke Permit is applicable:
o Regardless of the input material and o Regardless of the site location and o If the distance to the nearest receptor would be under 200m

BABE – Brampton AD Feedstock Study
Public Version page 63 of 94
5.2.6. Management Plans
The application for the EP will have to contain management plans for any possible environmental impacts, which will be identified through the form ‘H1 Environmental Risk Assessments’.
As the Environment Agency states, emissions or any other form of impact from the operator’s activities shall be free from noise, vibration, odour, etc. at levels likely to cause pollution outside the defined site, as perceived by an authorised officer of the Environment Agency, unless the operator has used appropriate measures, including, but not limited to, those specified in any approved management plan to prevent or where that is not practicable, to minimise, the specific pollutant source.
A management plan requires the operator to take appropriate measures to prevent or minimise any identified pollutant. The measures required need to be what are reasonable, good practice and balances the costs and benefits to prevent or minimise noise. If there is a pollution problem at the site, and the operator has already implemented some measures, there may be a case to justify further measures or restriction of the activity, depending on the severity of the problem and the cost. Even if the operator is following normal standards and guidance but the impact is unreasonable, then one will have put in place further measures and the EA will judge with the operator what is reasonable and to what extent further measures are possible, required or justified.
If the operator is likely to cause any significant noise beyond the site boundary, one should have a written management plan. This plan should first of all show what the sources and the risks to receptors are, the measures one will employ and how one will respond to prevent or minimise the pollutant.
It should also contain some ‘reflective’ information about:
• A demonstration that the indicative ‘best available technique’ (BAT) requirements are applied
• An identification of any circumstances or conditions, which might compromise the ability to prevent or minimise the specific annoyance, and a description of the actions that will be taken to minimise the impact.
The most likely pollution types from AD feedstock are discussed in the following paragraphs.
Noise and Vibration
Where noise issues are likely to be relevant, the operator will be required to provide information on the following:
• The main sources of noise and vibration that will fall within the AD facility and also on Infrequent sources of noise and vibration
• The nearest noise-‐sensitive sites
• Conditions or limits imposed under other regimes
• The local noise environment
• Any environmental noise measurement surveys or modelling
• Any specific local issues and proposals for improvements
The guidance on noise pollution, the ‘H3 Noise Assessment and Control’ will suggest some attenuation provided by trees and hedges and a limit to certain processing operations like the filling of the hopper with grass silage to normal working hours.
Appropriate measures to reduce or control noise may include:
• Timing, e.g. avoiding noisy work during evenings and at certain hours during weekends
BABE – Brampton AD Feedstock Study
Public Version page 64 of 94
• Siting away of weighing station, delivery or vehicle routes from sensitive receptors
• Maintaining vehicles and equipment specifically to reduce noise levels
• Switching off vehicles when not in use
(Fugitive) Emissions to Air
The majority of fugitive emissions, which include particulates, odour and bio-‐aerosols, occur during the acceptance of input material, storage areas, mechanical pre-‐treatment of wastes (which is not applicable to any scenario in this Study), from the transfer of input material to the digester and when removing digestate from the digester. Suitable operational procedures should minimise fugitive emissions during these operations. The Study authors are of the opinion that such procedures should be appropriate and not excessive to an e.g. surrounding agricultural environment.
Examples of sources of fugitive emissions are:
• Delivery of silage in uncovered trailers (which is standard procedure in agriculture)
• Sampling activities
• Spillages
• Unloading and loading of trailers, tanks and containers
• Open or uncovered storage areas, e.g. clamps, stock piles, tanks, vessels, lagoons
• Displaced vapour from receiving tanks
• Transferring of bulk material from the silage clamp to the digester
A management plan dealing with (fugitive) emissions to air would be practically identical with odour emissions, which are described in more detail in the following paragraphs.
Odour
An AD site may produce odour as a result of normal operations of its feedstock management and may cause offence beyond the site boundary. In that case the operator should have an odour management plan containing information about odour sources and substances, locations or release points, impacts, sensitive receptors as well as complaints, remedies and monitoring procedures. The guidance ‘H4 Odour Management’ is an essential tool for understanding odour management plans.
The measures in relation to contain and mitigate odour arising from feedstock are likely to be:
• Slurry is delivered in sealed slurry tanks
• Slurry is pumped straight into a sealed and below ground reception pit or holding tank
• The slurry reception area is concrete and sloped to collect any spillages and redirect them back to the slurry reception pit
• If the reception pit is not entirely below ground, then the reception area would be bunded to contain spillages within a restricted area
• All tanks on site are enclosed to ensure an anaerobic environment and contain odour.
• Forage material is cut uniformly to a short chopping length of about 7mm to minimise air ingress
• Forage material will be stored in storage bays of the silage clamp with typically 3-‐4m high walls
• The silage clamp should be sited away form the nearest neighbours, to create a distance for odour dispersal
• Forage material will be covered airtight with plastic sheets and weighed down with old tyres, a practice common with agricultural silage clamps, to minimise air ingress or gas

BABE – Brampton AD Feedstock Study
Public Version page 65 of 94
and odour egress
• Silage effluents will be collected and drained (below ground) to the slurry reception pit
• The use of silage cutters or ‘silage grab’ when taking away silage for the digester will cut an even surface so reduce the exposed surface area to air. This limits air ingress to the silage and with it ‘secondary fermentation’ and ‘secondary odour’.
• After taking off silage from the silage clamp the exposed side will be covered again with sheeting.
It should be noted that the term secondary fermentation is only used out of convenience, as fermentation is an anaerobic process. Once the silage clamp is opened and the silage is beginning to be removed, on the surface the anaerobic environment changes to aerobic conditions. The starting aerobic processes are actually termed as ‘deterioration’.
Emissions to Groundwater, Surface Water and Drainage
A sustainable drainage system (SUDS) should prevent releases of harmful substances from silage effluents and slurry spillage to the aquatic environment. Any discharge to surface water drainage or any groundwater activity requires either an environmental permit or must be an exempt groundwater activity.
It is standard procedure for an AD facility to collect effluents and dirty water separately; effluents would then be piped to the digester and dirty water either to the digester or, where permitted, to the digester storage facility.
Other Pollution Types
These can be, among others:
• Dust, possibly from vehicle traffic
• (Point source) Emissions to air, of no relevance to feedstock as typically connected with combustion exhaust emissions from CHP engines and stand-‐by flares
• Light, possibly from light sources at the feedstock reception area
• Vermin, which is unlikely in the absence of food waste
5.2.7. Quality Control for Digestate Use
Not Waste – Non-‐Waste – Waste
Agricultural manure and slurry is not considered waste when it is used directly as a fertiliser on land. However, when agricultural manure or slurry is destined for a treatment process like composting or AD, it is waste and will be subject to regulatory control. Thus, when the feedstock to an AD plant is waste then the resulting digestate and biogas are also waste until put to their final use.
The Environment Agency however has finally taken a different approach for agricultural manure and slurry, recognizing that the digestate produced from manure and slurry has superior fertilising properties and will have less of an environmental impact than undigested manure and slurry.
Hence the AD digestate output is not considered to be waste if:
• The only waste feedstock to an AD plant is agricultural manure and slurry and it is spread as a fertiliser on agricultural land
• Agricultural manure and slurry is mixed with a non-‐waste feedstock e.g. crops grown specifically for AD and it is spread as a fertiliser on agricultural land.

BABE – Brampton AD Feedstock Study
Public Version page 66 of 94
If the manure and slurry feedstock is mixed with other waste feedstock, then the resultant digestate will be waste and subject to environmental permitting regulations.
Any crop however, which is grown specifically for use as a fuel for heat, power or combined heat and power (CHP) generation, is not a waste. Anaerobic digestion in an AD plant to produce energy meets this requirement. If the main purpose of the plant is to recover energy from biogas, the biogas will also always be a non-‐waste. In order to be considered as non-‐waste, other output material must meet three criteria; they must be:
• Certain to be used
• Without any prior processing, and
• Part of a continuing process of production (i.e. this does not apply to wastes produced as an incidental part of the operation, for example clean down wastes)
In these circumstances a permit or exemption is not required for the AD process.
For the avoidance of doubt, crops grown for food and other purposes which are diverted to an AD facility, for example because there is a crop surplus, they become spoiled or there is a failure to move them off-‐farm in time, are considered waste and therefore must go to a permitted site.
5.2.8. Accreditation for Quality Digestate
Whilst the Environmental Permit (or Exemption) deals with the treatment of waste by anaerobic digestion the Biofertiliser Certification Scheme (BSC) provides an industrial standard accreditation for anaerobic digestate as a safe fertiliser product.
The Biofertiliser Certification Scheme (BCS) is in place to certify AD plants in England, Wales and Northern Ireland against the PAS110:2010 and the Anaerobic Digestion Quality Protocol (AD QP) for the production and use of quality outputs from the anaerobic digestion of source-‐separated biodegradable waste. In comparison, AD plants in Scotland will be certified against the PAS110, not the QP, with further conditions specified by Scottish Environment Protection Agency (SEPA).
The PAS110 can be found at: www.biofertiliser.org.uk/certification/england-‐wales/pas110 and is managed by the Environment Agency.
The AD Quality Protocol is on: www.wrap.org.uk/content/quality-‐protocol-‐anaerobic-‐digestate
The Quality Protocol sets out criteria for the production of quality outputs from anaerobic digestion of material that is biodegradable waste. Quality outputs from anaerobic digestion include the whole digestate, the separated fibre and the separated liquor. If these criteria are met, quality outputs from anaerobic digestion will normally be regarded as having been fully recovered and to have ceased to be waste when it has been dispatched to the customer.
The adherence to PAS110:2010 and the AD Quality Protocol means that the digestate, classified as waste, reaches end-‐of-‐waste status and becomes a product. Among other measures, the PAS110 requires all digestate, regardless of the input material type, to be pasteurised, a process which benefits are questioned if all input material is energy crops and agricultural slurry and manure. Therefore the EA has arranged for any digestate created in an AD facility under a T24 or T25 exemption can be spread under a ‘spreading exemption’ termed U10. The U10 however limits the volume of digestate in line with the T24, the digestate to be spread on the ‘same land’ where the input material originated and the area of spreading to agricultural land.
If all suppliers are part of the social enterprise owning the land and the enterprise can demonstrate that the farmers have an appropriate say in the steering of the AD plant despite a minimal investment, as oppose to a symbolic ownership, then their farms, technically the combined land encompassing their agricultural holding numbers, is referred to as ‘own land’ or the ‘same land’.

BABE – Brampton AD Feedstock Study
Public Version page 67 of 94
It is worth mentioning, that the amount of spreading digestate on the individual parcels of the ‘own land’ is not related to the share of input material each supplier provided. This allows digestate spreading according to the nutrient requirements of each farmland.
An operator is not obliged to comply with the Quality Protocol and its demand to pasteurise the entire digestate. In the case of non-‐compliance, the quality outputs from anaerobic digestion (also referred to as ‘quality digestate’) will be considered to be waste and waste management controls will apply to their handling, transport and application.
The intention of the regulation is to ensure a standardised product quality from input material consisting of food waste to provide a confidence on the market place for the use of whole digestate or its liquid and dried components. On a local level however, it is not expected that all suppliers from the same farming community would distrust each other’s feedstock quality and be reluctant to use the combined feedstock mix, having undergone anaerobic treatment, as fertiliser.
The PAS110 and the AD QP have both been published in 2010, their uptake has not been phenomenal, 13 plants are listed as BSC members, and despite their right intentions to create a market place for digestate there has been criticism from the agricultural AD sector for the perceived inflexibility towards agricultural practices. Following the end of the public consultation for the PAS110:2010, the Environment Agency is expected to issue a new position statement in regard to digestate, which is expected to have an effect on the classification and usage of digestate in an agricultural and non-‐agricultural context.
Detailed guidance on waste management controls can be obtained from the EA’s National Customer Contact Centre on 08708 506506 or from www.environment-‐agency.gov.uk/subjects/waste
Chapter summary:
• The exclusion of brewery waste will simplify planning and plant design.
• Environmental considerations for planning and permitting are similar: noise, odour, visual impact, traffic, which will require careful preparation.
• The feedstock mix would have no impact on the permit type, as the decisive factor is proximity of the nearest sensitive receptor; however management plans without food waste would simplify.
• The exclusion of brewery waste avoids digestate pasteurisation when not adhering to PAS110; digestate regulations are expected to evolve by the time the proposed plant is operational.

BABE – Brampton AD Feedstock Study
Public Version page 68 of 94
5.3. Feedstock-‐related Infrastructure
This selection of feedstock will have an impact on the site infrastructure and on the technology components. The issues usually connected with this topic are:
• What to consider for slurry, silage and digestate?
• how to calculate the storage for slurry, silage and digestate?
5.3.1. Systems Recommendations
This Study does neither recommend any plant or pre-‐treatment system nor recommend any specialist professional in design or construction; BABE is in the fortunate position that Cumbria hosts plenty of experienced professionals and there seems little need to import expertise from further away.
Whether a silage clamp is part of the turnkey package or the operator’s sole responsibility is up to the negotiation between the operator and funder. A similar approach works for the slurry and digestate storage. Part of the decision making process could be the availability of on-‐site or second hand infrastructure, the use of satellite clamps or a further processing of digestate.
Apart from planning and permitting considerations, any slurry storage, silage clamp and digestate storage has to comply with the ‘SSAFO Regulations, short for The Water Resources (Control of Pollution) (Silage, Slurry and Agricultural Fuel Oil) (England), DEFRA 2010.
5.3.2. Slurry Storage Volume Calculation
The storage net volume required for the slurry or ‘liquid reception pit’ is based on a:
• Expected slurry volume per annum of 2,326 m3 and
• Storage requirement of 10 days (typically between one and two weeks)
and can be calculated in accordance with the formula:
liquid throughput per year / storage requirement in days
The formula applied for 2,326 m3 / 365 d * 10 d results in a pit net volume of 64 m3. ‘Net volume’ refers to the space for slurry only; the final dimensions will incorporate some additional space for the access of a slurry stirrer, space for movements of the stirred substrate and gas emissions.
Additional space may be considered for effluents and/or not dischargeable dirty water collected from the site.
5.3.3. Silage Clamp Volume Calculation
The calculation for the net volume required for a walled silage storage clamp is based on:
• Annual silage volume of 5,427 tonnes or 6,384 m3
• Average throughput per month of 452 tonnes or 532 m3
• A density factor for silage of 85%, i.e. 850kg to 1 m3
• A ‘typical harvest year’ split into a first and second cut for grass silage and 25% of forage is made of break crop (with similar volume properties), harvested in August
and can be calculated as in the next table. The calculation does not apply for an open clamp, which is usually larger dimensioned and contained by a half or one metre wall on two or three sides. There are also other clamp models in use, e.g. two-‐walled clamps or earth clamps, where the volume calculation needs to be adapted.

BABE – Brampton AD Feedstock Study
Public Version page 69 of 94
Table 32: Silage clamp volume calculation for a ‘typical year’
Whilst the calculation identifies a peak storage demand of 4.258 m3 for August, the actual storage volume will need to be higher due to an uneven, ‘mound’ shaped compaction practice. Assuming the 4,258 m3 to make 90% of the net volume, then the actual net volume would be 4,731 m3.
The silage clamp should further allow for a month of surplus feedstock. The above table does not take this into consideration. A feedstock buffer is especially relevant during the month of the first cut, typically May, as bad weather might delay the harvest and about six weeks of silage fermentation need to be bridged as well.
A second consideration is the ‘better than typical year’ of harvest and following chapter ‘Worst/Best Case Scenario’ explores this in more detail. Whichever of the various discussed scenarios may occur –more land for reseeding, three cuts or a combination of various factors – as a rule of thumb a clamp volume of 125% compared to a standard or typical harvest year is recommended. To assume a 125% volume, equalling 5,322 m3, only applies if the operator would not raise the monthly throughput – a decision the Study cannot anticipate.
It should be noted that literature frequently states a density factor for grass silage of about 65%, but this refers to long cut grass, which is not usable in an AD system. Short chopped grass at 6-‐7mm has a density factor of about 80-‐92%; the Study uses 85%.
An online application (in German language) calculating the clamp space capacity can be found on www.lfl-‐design3.bayern.de/ilb/technik/42471/
5.3.4. Digestate Storage Volume Calculation
The most recent guidance by the Environment Agency, currently in public consultation, titled ‘How to comply with your environmental permit. Additional guidance for: Anaerobic Digestion’ states that where digestate is stored on agricultural land within a Nitrate Vulnerable Zone (NVZ), sufficient storage capacity must be available to span the winter ‘no spread’ periods. In accordance with NVZ regulations storage requires at least:
• Five months (1 October to 1 March inclusive) storage capacity for cattle slurry (and digestate resulting from it, including from energy crops)
• Six months (1 October to 1 April inclusive) storage capacity for livestock manures like pig slurry, poultry manure (and digestate resulting from it, including from food waste)
For various reasons, losses of methane and nutrients during storing and handling of digestate are possible. In order to prevent gaseous emissions, storage infrastructure should be covered with a gastight cover. Roof structures, or roof membranes can be fitted to concrete or steel structure stores, and flexible covers can be fitted to lagoons. All such storage areas (including those for the storage of solid fractions) should be provided with appropriate emissions control and abatement systems.
The storage net volume required for a digestate tank is based on a:

BABE – Brampton AD Feedstock Study
Public Version page 70 of 94
• Total throughput of per annum of 8,711 m3
• Estimated volume reduction of 80% during the AD process
• Five months storage requirement
and can be calculated in accordance with the formula:
throughput per year in m3 * volume reduction factor / storage requirement
The formula applied for 8,711 m3 * 80% / 5 months results in a pit net volume of 2,904 m3. ‘Net volume’ refers to the actual space for digestate, the final dimensions will incorporate some additional space for the access of a digestate stirrer, space for movements of the stirred substrate and gas emissions.
Existing slurry tanks, unused with the introduction of an AD plant – a scenario more likely for a working farm than an industrial estate – or the inner segment of a ring-‐in-‐ring digester designated as storage tank while acting as secondary digester, can count towards the required digestate storage volume.
Additional space may be considered for not dischargeable dirty water collected from the site.
Chapter summary:
• The inclusion of silage, slurry and digestate storage in an AD turnkey package needs to be clarified between the operator, funder and technology provider.
• The calculations for the storage volume of a slurry reception pit, a silage clamp and a digestate tank are provided in the chapter.
• The calculated net volume of storage space is only part of the total volume requirement, which differ for clamp for each storage facility.

BABE – Brampton AD Feedstock Study
Public Version page 71 of 94
5.4. Feedstock Yields: Worst / Best Case Scenario
The following chapter investigates the risks and impacts from feedstock yield variations by under-‐ and over-‐supply. Such variations need to be considered for developing contingency plans in regard to capacity, technology and costs.
5.4.1. The ‘Worst Case’ Scenario
Building on a typical cropping year applying all assumptions as mentioned in chapter 3.2 and 3.3, we have identified some risks which might yield a lower than expected feedstock energy potential.
The assumed risk of relevance is:
• The gradual implementation of the initial seeding programme over four rears
We have however NOT considered the following risks as relevant:
• Loss of a slurry supplier – there are more slurry suppliers available than can be utilised
• A reduction of grass silage dry matter – our assumption is already based below average DM values of 28% for professionally cut forage
• Loss of annually declining yields from grass seeds – a crop and land rotation plan will be in place
• An additional buffer for less productive land – the 5% reduction of productive land for Environmental Stewardship set-‐asides caters for that
• An buffer for ‘unknown risks’ – the slight, but constant increase in methane yield of grass varieties specifically developed for anaerobic digestion purposes has not been factored in and will make up for this
• Losses from poor silage clamp management – the operator will have a good practice scheme and regular checks in place
The implementation of an initial land management plan involving ploughing and seeding takes over a period of four years, starting ideally in the autumn prior to the commercial start of the plant. This land management programme will trigger a gradual increase in volume and biogas potential of the silage. The programme stretches over four years, with one quarter of the available land affected each year, for reasons of sustainability and the spreading of any risk associated with crop selection. The detailed procedure is shown in chapter 4.5.
The improvement from poor yielding land to higher yielding land is scheduled over four consecutive years. On completion of this schedule the cropping yield is expected to stay the same for the duration of the plant life cycle with land management practices in place to achieve this.
The expected yield shortfall in year 1 is not expected to cause any actual decrease in plant output as the first year of operation includes the biological start-‐up period of typically three month – or longer, depending on the start-‐up method. The demand on feedstock during the first year is about 90% of a typical year of operation.
It should be noted that ‘Year 1’ is the year or plant season prior to the plant going live. Such timing would reduce the impact of the initial seeding by one year. This would only leave years 2 and 3 of operation exposed to a shortage of grass silage. Timely provisions will need to be made to compensate the shortfall with alternative feedstock, e.g. grass cuttings from the set-‐aside land or grass silage from a third cut
The following four tables show the likely year-‐on-‐year output rise during the initial reseeding period; the key data are highlighted in yellow.

BABE – Brampton AD Feedstock Study
Public Version page 72 of 94
Table 33: Seeding transition year 1 and impact on overall plant output
Table 34: Seeding transition year 2 and impact on overall plant output

BABE – Brampton AD Feedstock Study
Public Version page 73 of 94
Table 35: Seeding transition year 3 and impact on overall plant output
Table 36: Completion of initial seeding programme with typical annual crop yields

BABE – Brampton AD Feedstock Study
Public Version page 74 of 94
The table below compares and summarises the key output figures from the tables above with the yield expectations from a ‘typical year’.
The shortfall in year 1 will be of no concern due to the usually reduced demand for input material during the start-‐up period; the gap in years 2 and 3 will need to be compensated. To achieve this several options are available, like silage from the year prior to start-‐up, from neighbouring farmers or utilisation of the set-‐aside land or a partial third cut.
Table 37: Output comparison during initial reseeding years against a typical year
5.4.2. The ‘Best Case’ Scenario
After having taken all precautions as described earlier, the Study aims to demonstrate the potentially generated energy if neither a single risk factor or none of these risks apply.
Table 38: Supply scenario with all four suppliers participating in the initial seeding scheme

BABE – Brampton AD Feedstock Study
Public Version page 75 of 94
Table 39: Supply scenario with a higher, but still average dry matter yield for the first and second grass cutting
Table 40: Supply scenario with utilising three grass cuttings

BABE – Brampton AD Feedstock Study
Public Version page 76 of 94
The next table shows the – rather unlikely, but not impossible – scenario of all three risk factors displayed above not occurring. That is all four supply farms opting for the initial seeding programme, a average and achievable dry matter content and three instead of two grass cuts per season.
Table 41: Supply scenario with the three previous scenarios combined The next table puts all three ‘positive’ scenarios plus their combined occurrence in perspective and compares them with the yield figures the study has adopted as typical. This shows an achievable over-‐production of feedstock and generated energy in the region of 110% -‐ 120%.
It also illustrates that from all possible scenarios the achievement of an average dry matter content would in proportion generate the highest amount of energy with a minimum on input volume.
Table 42: Comparison of scenarios against the ‘typical’ year

BABE – Brampton AD Feedstock Study
Public Version page 77 of 94
5.4.3. Impact on CHP Selection and Plant Expansion
In consideration of all risk factors and scenarios presented, the earlier selection in chapter 4 for a 200kWe CHP unit still seems the most appropriate approach, unless a owner/operator is willing to risk over-‐capacity without the necessary security of feedstock.
The combined scenarios, as presented in the table below, show the ‘typical’ year for input material still leaves a margin for expansion, but carries little risk of under-‐capacity.
Table 43: Comparison of all risk scenarios against the ‘typical’ year
Deploying a 200kWe CHP unit would in a typical year provide approximately an electrical output efficiency of 91% and 7,982 full load hours. The ‘all seeding’ and the ‘higher DM’ scenarios would in theory deliver 100% electrical output efficiency with 8,760 full load hours, which however is in practice unachievable. From a conservative approach this would provide just the feedstock security to achieve performance targets of 8,000 full load hours and the ‘extra’ for over-‐achieving them.
A 220kWe CHP unit would run on 83% of electrical output efficiency with 7,256 full load hours. From a conservative attitude to risk such approach would require each year some overachievement of forage harvesting, which would put the AD plant at constant mercy of the local weather or local silage prices.
On the other hand an approach aiming at constant expansion with accepting the risk that this might take place in the first year, the 220kWe unit seems the right pathway and the 200kWe seems curtailing this ambition. The silage production in a ‘bumper year’ should create sufficient input material back up for the surplus needed for over a year, even with a poorer harvest. The Study cannot speak for the risk appetite of the owner/operator and keeps to its earlier selection for a 200kWe CHP unit. The table below shows the wider background for this discussion.
Table 44: Electrical output efficiency and full load hours with a 200kWe and a 220kWe CHP against a variety of feedstock harvest scenarios. (Note: figures for 200kW are slightly above, for 220kW slightly below detailed calculations)

BABE – Brampton AD Feedstock Study
Public Version page 78 of 94
5.5. Security of Supply
For everyone with a financial involvement in an AD plant the ‘security of supply” or ‘feedstock security’ has probably become the biggest risk factor in the deployment of AD. This chapter aims to identify and discuss some risk factors associated with supply and supply arrangements.
Funders, whether cooperative, institutional or private, will want to understand:
What are the cornerstones of supply contracts?
How much feedstock could be secured contractually and how much will have to be bought in on the open market?
Where to get additional feedstock in case of emergency?
What about term, price and penalties?
Are there any AD specific risks?
5.5.1. Contract Strategy
Whilst agreeing on slurry seems comparatively straightforward, securing silage can be done in several ways. In principle the operator may lease the land through an agricultural lease and work the land by itself or hire a contractor, or alternatively buy the forage from a supplier without any interest in the land.
Both routes have advantages and disadvantages and the following table gives an overview:
Land Lease Supply of Products
Typical contract duration (for illustration only)
Agricultural lease typically for 10 years
Variable, any term between 2 – 20 years
Farming work done by Operator (or farmer acting as contractor)
Farmer (or contractor)
Control of best practice farming Best practice for oneself (quality control for contractor)
Needs quality control (quality control for contractor)
Supply risk Supply risk is with oneself Supply risk is with farmer
Cost Costs only Costs plus end product margin
Cost control risk If operator uses several contractors
Costs plus end product margin
Administration Multiple payments possible (land lease, works)
Single payment (product)
Table 45: Risk comparison of contract strategies
Different operators will suit different contract strategies, operators with skills, equipment and a keen interest in working the land will rather opt for a land lease type contract, operators with a reliable supply partner might confidently outsource all agricultural work to supply partners.
5.5.2. Contracted Volume

BABE – Brampton AD Feedstock Study
Public Version page 79 of 94
The questions of how much feedstock volume to contract and the ratio of sourcing it from long-‐term contracts or from ad-‐hoc open market deals have to be agreeable to the funder.
The question of the overall volume required for the operation of the AD plant would normally be a straightforward response of ‘100%’, where ‘required’ refers to an annual electricity generation of e.g. 90% of CHP run time or 8000 hours of full load hours.
In consideration of an unreliable weather and whether assumptions have been made in a cautious or optimistic manner, 100% of feedstock volume (at a given quality) might not be sufficient or might be more than required. With that in mind some funders demand 110% of feedstock volume under control, whereby the excess 10% are either intended as buffer for a lower than expected harvest or as surplus for the following year. Some funders are content with less than 100% as they have developed their own secure feedstock supply chain, while some funders, at the other end of the spectrum, actually expect 120% from an ‘investable’ AD project.
On the issue of ‘contract mix’, the favoured approaches seem to be either an arrangement of 100% input material secured by fixed long-‐term contracts or a ratio of 80% fixed contracts and 20% open market short-‐term procurement arrangements. The reason for the latter is the access to feedstock deals, which can be outstanding value for money.
From the point of security of supply in terms of contracted supply volume, the answer, as often, lies with the risk appetite of the funder or operator.
5.5.3. Back-‐up Feedstock
Any AD operator will have to prepare a back-‐up plan to obtain additional feedstock in case of shortage. If a supplier delivers less than contractually agreed then the operator might either charge the supplier for compensation or they work together to source additional input material.
By opting for the latter they might seek to address the shortfall in a sequence presented by the ‘supply source pyramid’, with the easiest route to supply on the top:
The Supply Source Pyramid
FYM, horse muck
Silage from last year
Extra silage from a third cut
Other supplier: silage from last year
Other supplier: extra silage from a third cut
Local third party: available FYM, forage or silage
Local third party: any other seasonal input material
Substitute products on the open market outside the locality
Table 46: Sources of additional input material in order of the ease of purchasing
Another collaborative way forward In case the supplier is e.g. physically unable to produce the crop, then the operator reserves the right to hire a contractor to fulfil the contractual arrangements.
5.5.4. Contract Risks

BABE – Brampton AD Feedstock Study
Public Version page 80 of 94
Default
There are a variety of strategies to cope with default. The definition of default in the context of a supply contract for AD feedstock is in the line of:
If the supplier fails to complete deliveries as set out in a delivery schedule and within the delivery period, the quantity not delivered against the (minimum) contract quantity shall be deemed in default. The buyer may (after giving prior written notice,) either:
• Purchase against such default and the supplier shall make good the loss (if any) of such purchase
or
• Claim damages to be agreed mutually or settled by arbitration and such damages shall not to exceed the difference between the supply contract price and the market price on the date of default. 5.1.2
Contract terms could also refer to ‘penalty payments’ or allow the buyer to claim for consequential loss.
The issue at the core of the default term is: are penalties jeopardising or ensuring security of supply?
Dealing with a default situation is often a balance act as much between the need for supply security and the revenue stream from compensation claims as well as between the cultures of arable farmers and finance professionals. A successful supply contract requires a degree of cooperation between the parties, unlike e.g. a land lease for a wind turbine or wind farm. Here both sides negotiate, or rather poker, with their respective legal advisors for their exclusive benefit. After all, the only energy input is wind and who would sue the climate for a weak wind year? Industry specialists for AD advocate strong farm integration into any agricultural based AD project to achieve long-‐term success. Such integration can only develop from collaboration and creating win-‐win situations.
By enshrining an unreasonable amount for penalty payments a farmer would rather contractually oblige to a smaller than achievable supply quantity and quality just in order to avoid any possible risk. Consequently, if the considerable product surplus is not managed fairly in the supply contract, any surplus product will be available for other buyers.
Overproduction
The lower the guaranteed minimum delivery quantity is set, the higher will be the likelihood for overproduction. In such case of overproduction an exclusivity clause should apply where the supplier shall not approach any other AD scheme, possibly competing for feedstock. Within the terms of a pre-‐agreed pricing mechanism, the supplier will offer the buyer the right of first refusal to the surplus products.
Any overproduction volume outside an agreed threshold can be sold to the buyer or any third party on a competitive basis.
In the case of overproduction of a member of a supply cooperative, a same arrangement could apply for the organisation, acting on behalf of its members.
Supply Cooperative
Key benefits of a supply cooperative are to provide a mechanism for underproduction of an individual supply member and know how sharing. If the cooperative includes equipment ‘sharing’ as part of its service then it might rather be set up as a ‘machinery ring cooperative’.
The key benefit for a funder in dealing with a ‘supply coop’ seems to be its risk mitigation capacity in case of a member’s underproduction: One member’s insufficient delivery volume can be balanced, or

BABE – Brampton AD Feedstock Study
Public Version page 81 of 94
‘buffered, by deliveries from another member. Thereby the overall contracted supply quantity is achieved. In legal jargon, where deliveries of individual member’s consignments reach a tonnage within tolerance of the contractual quantity, the contract with the supply cooperative’s member shall be considered to have been completed.
The drawback of a supply cooperative is an extra layer of administration; it will also need to ensure a neutral steering of the organisation and be fair and equally beneficial to all members.
Term and Price
The term of a supply contract is one of the first hurdles to overcome in achieving security of supply. The minimal contract term will need to cover the phase up to Investment payback plus a buffer period or ‘tail’ of one or rather two years. The contract duration should however be for 20 or 25 years, which practically stretches over a half a working generation.
The issue with the price paid for the products is more its arrangement over the whole term and less the initial price level. Every funder hopes for a price collapse and every farmer hopes for a price spike – both seem to occur in regular intervals once or twice a decade. The strategy forward seems to be either to acknowledge price drops a rises and risk supply cost insecurity or to ignore them, agree on a long term stable price and benefit from supply cost stability with a focus on the energy market.
Property and Risk
The usual due diligence exercise for registering a supply contract in the title has to be undertaken. There is still a large number of farms who so far have not seen the need to digitally record all fields with HM Land Registry. Without such proof and without registration of the supply contract a security of supply cannot be established in case of sale, succession or demise. Any third party holding a claim on the title will need to approve in writing of the titleholder entering the supply contract; the same procedure applies for a landlord and an agricultural lessee.
In legal jargon, the titleholder warrants to the buyer that it has good title to any product to be supplied to the buyer and that such product is free and clear of any lien, encumbrance or rights of any third party. The supplier shall indemnify and hold harmless the buyer from and against any loss, cost, expense, claim, injury, damage or proceeding incurred by the buyer as a result of any breach of the warranty contained herein.
Chapter summary:
• Sourcing input material can be arranged either via an agricultural land lease arrangement or by supply contract; a management decision needs to be made about the is preferable route.
• The decision about a secure level supply volume will eventually be taken by the funder(s), however to achieve 100% or 110% of required feedstock by long-‐term supply contracts seems good practice.
• The terms and conditions, especially about duration, under-‐ and overproduction need to be balanced and fair in order to achieve a long-‐term cooperation with suppliers.
• The AD specific risk lies in the feedstock supply and a supply cooperative might reduce the supply risk by buffering any under-‐production from individual suppliers within its own resources.

BABE – Brampton AD Feedstock Study
Public Version page 82 of 94
6. Considerations
The topics discussed in this chapter are not considered as ‘risks’, but rather as feedstock related issues to be dealt with as part of the project development.
6.1. Supply Contract Issues
6.1.1. Contract Advice
Support with industry specific background knowledge, negotiation and contract procedure management can be provided by the English Food and Farming Partnerships (EFFP). One of the organisation’s strength lies in securing raw agricultural produce. (See Appendix C for contact details.)
The supply agreement is likely to cover the (not exhaustive list of) topics set out below; it assumes a contract between the buyer and an individual supplier. A sample heads of terms can be found in Appendix E.
The key terms are mostly explained in non-‐legal jargon and cannot be taken as legal document. Any party intending to enter into a supply contract is advised to obtain independent professional legal advice.
6.1.2. Relevant Contract Terms
The Parties
The parties to a supply contract will be BABE or an AD project SPV and the farming business. Throughout the document the party supplying the product, i.e. the input material for the AD plant, will be termed e.g. ‘Supplier’ and the party purchasing and receiving the product(s) will be named as e.g. ‘Buyer’.
Term or Duration
This clause defines the commencement day, when the rights and obligations of the parties shall take effect. It may further specify a ‘service commencement day’ when the first delivery of goods is due. This can be of relevance if the next forage cut and the start-‐up of the AD plant are not occurring at the same time and the buyer secures the right or exclusivity over the produce of the land until the start-‐up phase. In the meanwhile the forage or silage may be stored either in the supplier’s or the buyer’s silage clamp.
It will also define the duration of the contract, which is expected to be ten to 25 years or the time of any loan repayment plus typically one or two years added to buffer any risk with a delayed repayment. The term has to cover e.g. ten harvest seasons, not just ten calendar years.
Finally, the clause defines the expiry date or termination date.
Extension and ‘Long Stop Date
Optionally, there can be some arrangement for both parties to serve a written notice for a variation (or extension) of the contract expiry date for a number of years. This procedure can be repeated e.g. every five years, if agreed by both parties. A ‘long stop date’ can be introduced as a final and compulsory contract termination date, regardless the circumstances.
Provision of Supplies

BABE – Brampton AD Feedstock Study
Public Version page 83 of 94
This clause describes the obligation of the supplier to provide goods and the obligation of the buyer to purchase the goods. It also covers several product descriptions or ‘specifications’ of the supply arrangement.
Specification
This clause specifies the type of goods supplied in accordance with the European Waste Category list, its quality and quantity (or volume), (such information further used for reporting to OFGEM and planning and permitting authorities). Quality parameters may include certain energy related or feedstock specific indicators like dry matter, digestibility value, metabolic energy or contamination levels e.g. from pharmaceuticals or heavy metals. Where already stored grass silage is supplied an age limit might be stated.
It will list minimum quality thresholds or cut-‐off limits and where appropriate, e.g. with dry matter of grass silage, maximum thresholds.
Non-‐conformity and Rejection
This clause sets out the condition for non-‐conformity of supplies if they not within agreed quality specifications, the right and condition (e.g. proof, time limit) of the buyer for rejection of goods and the financial consequences for the supplier.
Circumstances can be defined where inferior material might also accepted at a lower price.
Rejection of goods can occur during delivery at the ‘gate’, i.e. the weighbridge or storage facility, or days later after the return of a lab test.
Tolerance (or: Variation)
In consideration that crop yield estimates for new seed types or biogas yields are not entirely predictable and that delays to the biological start-‐up of the plant may occur, a tolerance to the agreed quantity for under-‐ and over-‐production can be introduced. This variation can be valid for a limited period of time, e.g. the first year or for the entire term. This clause will define the quantity thresholds and regulate the applicable procedures.
The supplier may offer a certain percentage of supplies, e.g. 15% above the agreed volume and the buyer may buy this additional volume to the same or another in advance agreed price and payment conditions.
In reverse, the supplier might only able to provide e.g. 95% of the agreed supply volume and not be subject to a breach of contract and the buyer not entitled to invoke a claim for damages.
The upper and lower tolerance thresholds do not need to be symmetrical and will reflect the parties’ risk approach and the default clause.
Default
This clause deals with the consequences of the supplier delivers less than the agreed quantity or agreed minimum threshold, if a tolerance volume has been agreed, when the supplier is then deemed to be in default and shall compensate the buyer.
The clause will define a chain of actions and present options to instigate a demand for damages against the undelivered product.
Transportation
This clause will define legal responsibilities during the supply delivery and stipulate the adherence to conditions as imposed by the planning or permitting authority, which could include:

BABE – Brampton AD Feedstock Study
Public Version page 84 of 94
• Transport routes
• Type of vehicles used for transportation, e.g. HGV or tractor and trailer
• Emergency routes in case the standard transport routes are unusable
• Book keeping of accidents, emergencies, spillages and re-‐directions
• Clean up operation following spillages or product loss
• Annual notifications of traffic frequency and transported volumes
Delivery or Collection
This clause describes the point or points of delivery at which the supplier deposits the supplies. This ‘hand over point’ defines the legal change of ownership and the eligibility for payment, which will be with the drop-‐off of forage (or silage) at a silage clamp or with the pumping of slurry into a reception pit.
Alternatively, where slurry is collected from a farm by a sub-‐contractor appointed by the buyer, the hand over point is the start of pumping into its slurry tanker.
Quality Control and Measurement
The buyer has the right to sample each delivery, or ‘supply load’, to the premises without advance notification to the supplier. The buyer has the right to apply any sampling method as described by e.g. PAS110 and demanded by regulatory bodies like WRAP or the Biofertiliser Certification Scheme. The buyer will decide when a product sample will be either tested on-‐site by the site operator or sent to a lab for more detailed analysis. The buyer will inform the supplier of any test results without reasonable delay.
The delivery will be weighed at entry and exit of the premises on a weighbridge or by a trailer with an in-‐built measuring system can be used. In any case a ticket shall be issued to the supplier as proof of delivery quantity and where possible quality. Such ticket shall conform to requirements issued by regulatory bodies.
In case of local or satellite clamps used, the buyer shall have right of access during office hours to take product samples for testing. In case of the buyer (or an appointed sub-‐contractor) picking up slurry from a supplier’s farm, it shall have right of access during office hours to take product samples for testing.
It is the buyer’s obligation to keep the weighbridge, measuring and testing equipment calibrated at any time and in accordance with calibration and maintenance schedules issued by the relevant manufacturer. The buyer is obliged to display or show to the supplier any updated calibration certificate or confirmation. The buyer is obliged to display or show to the supplier annual proof of accreditation of any testing laboratory where product samples are sent for analysing.
Administration
This clause deals with the obligation and procedures by the buyer to administer:
• Weighing tickets
• Product testing
• Supply invoicing
• Supply payments
• Balancing payments
• Issuing of schedules
• Forward planning

BABE – Brampton AD Feedstock Study
Public Version page 85 of 94
• Health & Safety updates and
• Reporting to the suppliers.
Delivery Schedule
In case of using satellite clamps both parties will agree on detailed delivery volumes for a rolling twelve-‐month period, such period starting initially with either the start-‐up of the AD plant or with a cut of forage. Delivery volumes and times will take into account the feedstock demand of the AD plant, the capacities of the on-‐site and satellite clamps, harvest volumes and surplus input material from a previous period. The exact volumes and delivery times will be set out in an annexed ‘delivery schedule’.
If all harvest material is delivered directly from harvest to the silage clamp at the AD plant no separate delivery schedule to that extent is required.
Digestate take-‐off
The supplier is obliged to take away digestate of 80% of the product volume delivered. If applicable, the timing for digestate take-‐off shall be arranged either in regular intervals or in accordance with ‘open periods’ of the Nitrate Vulnerable Zone (NVZ). If several parties are taking off digestate then a separate take-‐off schedule could be prepared.
Spillage Management
It will be the responsibility of the supplier or appointed sub-‐contractor to clean and clear any spillage occurring during the transport to the site or delivery activities (pumping) of slurry to a reasonable extent, which is defined as to the satisfaction of Environment Agency standards and expectations.
For the avoidance of doubt, any activity with the supplies immediately following the hand over, e.g. the evenly distribution in the silage clamp area, compacting of forage or stirring of slurry in the reception pit are within the responsibilities of the buyer.
Any dispersal of remaining, i.e. not delivered, forage or silage from the trailer or any spillage of remaining slurry from the slurry tanker during exiting the site will however be the responsibility of the supplier.
It will be the responsibility of the supplier or appointed sub-‐contractor to clean and clear any spillage occurring during off-‐take activities (pumping) of digestate or its transport off the site to a reasonable extent, which is defined as to the satisfaction of Environment Agency standards and expectations.
Price
This clause sets out the price payable by the buyer for the supplier for the products delivered under the supply contract. The price for grass (silage) could be arranged on the basis of either fresh weight, dry matter, digestibility value, calorific value, methane volume or electricity generation. The Study promotes a language suitable to farmers and therefore recommends a combination of fresh weight, dry matter and digestibility value in correlation with local market value.
A second price should be agreed for an inferior product and for a product within the supply volume tolerance.
Standard practice should be an annual price adjustment by linking it to the inflation index and some acknowledgement of national price developments by a regular e.g. five-‐year or ten-‐year review with prices published in the Farmers Weekly or a publication of similar standing.
Payment

BABE – Brampton AD Feedstock Study
Public Version page 86 of 94
This clause sets out the payment procedures of the supplied product by the buyer to the supplier. For the sake of understanding, payment could be arranged in e.g. the following sequence:
• Payment shall be in monthly instalments in each calendar month during the contract term in accordance with the clause ‘Administration’ and shall be full and final consideration payable to the supplier for the product supplied under the contract.
• Payment shall be calculated in accordance with the clause ‘Price’ and shall not be amended or revised except as a result of a change set out in the supply contract. The buyer shall notify the supplier of the accumulated monthly supply cost within an agreed number of days following the end of each calendar month.
• The supplier shall submit an invoice for payment each month during the contract term.
• Payment shall be made within an agreed number of days of receipt of the supplier’s invoice.
Property
Property in the product shall pass to the buyer upon payment (including part payment, in which case property shall pass in that product to which such part or ratio the payment relates) or upon delivery at a defined ‘supply delivery area’, whichever shall first occur.
Health & Safety Compliance
Both parties shall – and shall procure that all sub-‐contractors shall – comply with the requirements of any relevant health & safety legislation.
General warranties, ‘boilerplate’ clauses and project specific annexes will make up the remainder of a supply contract. Every substrate or type of input material might require a variation of the clauses for e.g. specification, transport, price or quality control and measurement.

BABE – Brampton AD Feedstock Study
Public Version page 87 of 94
6.2. Financial Aspects
6.2.1. Cost Factor and Value of Silage
The NNFCC states an average grass silage production cost for the UK of just below £25 per ton of fresh weight at 25% dry matter, which equates to £1 per unit of dry matter. This usually includes a profit margin for the producer of £5 per ton of fresh weight. (Source: NNFCC) Adjusting the above price with inflation for the publishing date of the Study should give a cost figure of £25.
Significant regional difference might apply, but care is to be taken: where labour cost might be higher, fuel and fertiliser costs might be lower. Land lease prices, which are usually factored into the calculation, will vary not only with a North-‐South divide, but also with local demand for grassland. Another cost factor influencing forage or silage prices will be the time of purchase for fertiliser, which is often bought more expensively at the time of application instead during off-‐season.
The value of silage can be calculated according to kWh of electricity produced per unit of fresh weight or dry matter.
6.2.2. Cost Factor and Value of Digestate
The spreading cost of digestate consist of machinery, fuel and labour; charges as stated by the National Association of Agricultural Contractors provide a useful guideline.
The value for digestate for some might be a cost factor for others. Its net value has to deduct the value of slurry. The difference is calculated merely in the higher nutrient value, ignoring other advantages of digestate over slurry. Like any agricultural commodity, fertiliser prices react to availability and demand and always increase when spring, the time for its peak demand, approaches.
When calculating the fertiliser value, assumptions have to be made on readily available nutrients. The nutrient value will vary depending on the choice of input material. The following table is based on www.wrap.org.uk/content/compost-‐calculator. Approaches and market prices will vary.
Nitrogen (N)
Phosphate (P2O5)
Potash (K2O)
Total
Market price for fertilisers (£/kg) as per FARM BRIEF/WRAP 0.76 0.54 0.43
Digestate bio-‐fertiliser:
Readily available nutrient content as per FARM BRIEF/WRAP (kg/tonne digestate)
4.00 0.25 1.60
Financial value of readily available nutrients (£/tonne digestate) 3.03 0.14 0.69 £3.86
Readily available nutrient content as per forage digesters (kg/tonne digestate)
4.00 0.80 3.50
Financial value of readily available nutrients (£/tonne digestate) 3.03 0.43 1.51 £4.97
Table 47: Value calculation for digestate, based on nutrient content only

BABE – Brampton AD Feedstock Study
Public Version page 88 of 94
6.3. Operational Considerations
This chapter briefly discusses wider implications in regard to the identified feedstock sources without favour for any system design in mind. The following aspects will be covered:
• Land management
• Silage clamp management
• Feedstock measuring
• Competency, H&S
6.3.1. Best Practice
In dealing with the above raised issues, it is a recommended to organise all work practices and methods as ‘good practice’ instructions. When formulating such good practice there is no need ‘to reinvent the wheel’; many tasks have undergone a considerable learning curve by the biogas industry and such recommendations are condensed in ‘best practice’ documentations.
A good practice or best practice approach demonstrates an understanding for risk management and will pay dividends for example from:
• A more streamlined workflow
• Reduced exposure to H&S risks
• A better acceptance by the Environment Agency and
• Reduced insurance premiums.
A summary of best practice guidance documents is presented in Appendix F.
6.3.2. Land Management
The land management will have to incorporate the following aspects:
• Soil management including soil testing and soil preparation
• Seed selection
• Reseeding and crop rotation
• Fertiliser applications
All work done to test and prepare the soil and arrange the seeding would need to be done in autumn in order to get the first grass cutting the next May. Any permit for ploughing the land would need to be arranged in time.
As mentioned earlier, the proposed reseeding programme is a four-‐year crop rotation cycle, covering a quarter of the available land each year. Two uses of a two-‐year Italian ryegrass – or grass type with similar yield – would fit into a four-‐year crop rotation cycle.
The break crop could be, depending on soil conditions and requirements, whole crop forage wheat or barley, (red) clover or triticale.
Fertilising will have to be, where applicable, in accordance with NVZ regulations.
6.3.3. Silage Clamp Management
The silage clamp management covers the organisational and operational management of silage clamp.
From an organisational point of view, the use of a single, larger ‘centralised’ silage clamp adjacent to the digester needs to be compared to the scenario of using existing ‘satellite’ clamps at supply farms

BABE – Brampton AD Feedstock Study
Public Version page 89 of 94
and a smaller clamp at the plant. A preferred option based on environmental impacts (increase of supply journeys) and financial impacts (additional costs for clamp use and journeys from any satellite clamp to the AD plant) will need to be assessed in more detail.
The advantages of a satellite clamp scenario are delivery-‐on-‐demand or supply-‐as-‐you-‐go, where traffic to and from the AD plant could be spread evenly throughout the year, and a reduced clamp size at the AD location in the industrial estate. In other words, the disadvantages would be a doubling of silage-‐related traffic volume – firstly the transport to the satellite clamp and secondly the transport from there to the AD plant, which triggers more labour, fuel and machinery costs. Furthermore, it requires additional supervision that grass is ensilaged to best practice instructions. From a financial perspective initial capital cost savings would be balanced against higher operational costs.
The Study has currently not identified a single supplier with spare clamp capacity, however this might change when feedstock contract will be negotiated or when a farm sells off all livestock due to being uneconomical.
From an operational point of view, the objective is to ensure ideal silage conditions from reception to feeding. This includes the:
• Clamp design ensuring structural ability and H&S compliance and supervision thereof
• Collection and re-‐use of effluents and supervision thereof
• Ticketing and sampling of supply loads
• Compacting of freshly delivered grass (or break crop)
• Airtight and storm-‐proof enclosure of silage
• Processing of silage
• Covering up of the clamp face and
• Cleaning of area between clamp and feedstock hopper
6.3.4. Feedstock Reception and Handling
The infrastructure requirements for the proposed AD plant are based around the feedstock composition and the need for pasteurisation.
The liquid substrates like slurry and yeast wash will be delivered into an underground concrete reception pit, closely attached to the digester, from where it is later on pumped into the digester tank. The co-‐storage of slurry and yeast wash would only be on the basis of no adverse reaction triggered by mixing the two substrates. It is standard practice however that any input material classified as food waste is delivered in a enclosed structure, an additional cost factor which would rule it out as input material straight away.
Slurry will be delivered by tractors with modern slurry tanks of a capacity of about 15 tons. The slurry will be pumped into the reception tank, a task done by the supplier. Any accidental slurry run-‐off will be contained by the slope constructed around the tank and is redirected into the reception tank. Once the slurry is stored in the tank it will be stirred according to pre-‐arranged settings.
The solid substrates like grass or hop mash will be delivered into a walled silage clamp, situated as close to the solids hopper, which in turn is adjacent to the digester. The small volumes of hop mash might not require a storage facility as they could be delivered on the same day of delivery straight – in theory into a pasteurisation unit or – into the hopper.
Grass will be delivered by tractors and trailers with a capacity of ten tons. The grass will be unloaded in the silage clamp by the supplier. The weighing of any incoming load can be done either by a weighbridge or a trailer with an in-‐built weighing device, especially developed for agricultural

BABE – Brampton AD Feedstock Study
Public Version page 90 of 94
purposes. Each load or batch of loads will be then compacted by the operator to ensure an oxygen-‐free environment to prevent early aerobic decomposition. A range of best practice measures is in place to retain the energy content of the grass. After a fermentation process lasting about six weeks the grass is ready for use in the digester.
The silage will then be transported with a telescopic loader or tractor into a solids feeder or hopper, specifically designed to operate in connection with an anaerobic environment, from where it is fed into the digester tank.
Alternatively, slurry and silage can be pre-‐mixed in a mixing tank and then pumped into the digester tank.
Slurries will be delivered either from a supply farmer or agricultural contractor, who pumps the slurry into the reception pit. Delivery agreements will stipulate that any spillage on site has to be dealt with by the supplier.
Comprehensive best practice guidelines for silage construction and management have been compiled by e.g. ADAS and Böck, listed in Appendix F.
6.3.5. Feedstock Measurement and Quality Control
Any supply delivery arriving at the Premises will be measured at entry and exit, either by weighbridge or purpose-‐designed trailer with a in-‐built weight-‐measuring device, and issued with a ticket to the Supplier as proof of supply. Each weighing ticket will be processed in a format compatible with any requirement by OFGEM and the Biofertiliser Certification Scheme, the PAS110 administrator, and will show the following information:
Date and time of delivery
Weigh ticket number
Haulier name
Vehicle registration number
Supplier and supply coop (if any), equals to ‘place of origin’
Product type including EWC number
Weight/Volume
Optionally: whether the load is rejected
Any sample taken from a load will be taken in equal measure from either the two ends or from the two ends and the middle of the trailer and mixed thoroughly.
Any test result from equipment located on the Premises or returned form a laboratory will be comprised in a lab ticket, showing – where applicable – the following results:
Date
Supplier and supply coop (if any)
Product type
Dry matter content
Organic dry matter content
Digestibility value
N P K values
COD and BOD values
Metal values

BABE – Brampton AD Feedstock Study
Public Version page 91 of 94
The weighing ticket and the lab ticket will form the basis for the monthly payment for supplies delivered at the previous month. The weighing ticket will also be the basis for any reports to OFGEM, the Environment Agency and the planning authority.
The plant operator will have to organise regular service work and calibrations for any weighing and testing equipment in line with the manufacturers’ schedules and display any certificates or confirmations as ongoing proof of compliance with the manufacturers quality standards.
6.3.6. H&S, OPRA and the competent Person
The main factors affecting the work conditions of the operator’s and third parties’ staff on site is the Health & Safety Act including updates and the operator competency requirements of the Environmental Permitting Regulations in accordance with the operator competence scheme developed and managed by the Chartered Institutions of Wastes Management (CIWM) and WAMITAB. Different types of facilities and the waste they accept present different levels of environmental risk. The CIWM/WAMITAB scheme categorises them into three ‘risk tiers’ – High, Medium and Low. AD facilities fall into the medium risk tier.
The AD facility will need to have register a ‘competent person’ in charge of operating the facility, with the competent person and the operation linked together in a management plan. The competent person has to acquire a CIWM/WAMITAB operator competence certificate, a statutory award in order to undertake certain roles in the waste industry.
The operator, i.e. the operating company, must have enough trained and competent staff or an appropriate maintenance contract, to manage and operate the site to ensure compliance with its environmental permit. Any contractors working on the site must also have the skills and knowledge they need. This must be written into the management plan. All staff working on permitted activities must be trained on what the management plan means. It must be easily available to staff and contractors.
Sufficient competent persons will have to demonstrate in written records their defined roles and responsibilities, skill sets and work instructions.
6.3.7. Machinery
A frequently overlooked element of operating an AD plant is the farm machinery on site used to transfer the clamped silage from the storage area to the digester. It is stating the obvious that a telescopic loader or a tractor with implements used for that purpose requires an adequate service plan and insurance cover, but when sharing machinery with a farm or agricultural contractor such actions can get overlooked. It is good practice to keep records of ownership, maintenance schedules and insurance cover periods.
By demonstrating ‘good practice’ to the insurer it is common that insurance premiums, like for business interruption and associated loss of income, will be reduced. A similar approach ought be used for storage infrastructure and silage.
6.3.8. Future Proof
On the question of expansion, the AD industry has encountered a phenomena that once an AD plant is up and running then its operators are offered additional previously not accessible feedstock. A later modest expansion of an installed capacity of up to 250kW – either by engine replacement or a second smaller engine – would not alter the FiT band or level. A higher biogas output can be achieved by reducing the slurry volume and replacing it with additional silage intake, whereby no plant infrastructure changes need to be made. Such consideration needs to be discussed with the technology provider upfront.

BABE – Brampton AD Feedstock Study
Public Version page 92 of 94
6.4. Community
This chapter is mainly concerned with the societal element of sustainability. Ownership, participation and integration into society are expressions of sustainability and an AD plant can be measured on those criteria like any other undertaking.
The general understanding of a community (group) and a community project differentiates between a community based on geography, e.g. the people of Brampton, and a community based on a shared interest, e.g. anyone with an interest in renewable energy, energy saving or farming. Those two approaches can of course overlap.
However, it is not the only the orientation of a community, which makes a community (group) ‘stand out of the crowd’, it is also its organisation. There are several current legal structures to choose from and the following definition comes from one of the older traditions, the community organised as cooperative.
“A co-‐operative is an autonomous association of persons united voluntarily to meet their common economic, social, and cultural needs and aspirations through a jointly-‐owned and democratically-‐controlled enterprise. Co-‐operatives are based on the values of self-‐help, self-‐responsibility, democracy, equality, equity and solidarity. In the tradition of their founders, co-‐operative members believe in the ethical values of honesty, openness, social responsibility and caring for others.” Source: International Co-‐operative Alliance Statement on the Co-‐operative Identity
On the other hand, OFGEM’s definition of a community interest group is naturally more in relation to eligibility for the Feed-‐in Tariff; it states that an energy project has to be undertaken by a:
• Community interest group (CIC)
• Cooperative society
• Community benefit society
In addition, a further restriction has recently been introduced in regard to FiTs:
“To be defined as a community energy project within the FITs scheme, eligible entities must have no more than 50 employees.” Source: www.fitariffs.co.uk/FAQs/item/663/)
It is worth noting that BABE fits into OFGEM’s description being an IPS and having less than 50 employees.
Other potential interest groups around the AD plant could be a cooperative of feedstock suppliers or of AD heat users.
A supply contract could also be arranged between the AD plant owner/operator and a cooperative of several suppliers. This would require a separate membership agreement for the individual suppliers and so create an extra layer of administration. However, the benefit to both parties of the supply contract is that any individual under-‐supply could be counter-‐balanced by other suppliers from the supply cooperative. This approach would spread the risk of under-‐supply from a single supplier to the whole organisation. Furthermore, it could be arranged that any over-‐supply could be traded to favourable terms and conditions among the supply group.
Such supply cooperative would probably require an independent moderator, beyond any conflict of interests, to negotiate the interests of the individual members.
A ‘heat user cooperative’ would be focused around the surplus heat from the CHP, which could be utilised in greenhouses. It could enable a community supported agriculture (CSA) initiative and raise

BABE – Brampton AD Feedstock Study
Public Version page 93 of 94
awareness for sustainable agriculture by linking and blurring the line between producers and consumers by creating ‘prosumers’.
6.5. Sustainability
Sustainability is usually assessed from an integrated perspective combining the economic, environmental and social aspects. Caution has to be applied when announcing sustainability indicators for an AD plant out of context of its wider environment, ignoring the socio-‐economic and cultural dimensions of sustainability.
A renewable energy installation can only be sustainable if the energy value of the output produced is greater than the energy required to produce it. Generic studies and specific case studies examining the energy balances and ecological footprint of AD installations, and sometimes even their entire supply chain, have been undertaken in the UK and other European countries, but the choice of feedstock and technology make a direct comparison with the BABE AD project at this pre-‐commissioning state very imprecise. (Source: D30b: Assessment of the potential for crop-‐derived biogas as an energy source in the EU, taking into account technical and environmental issues and socio-‐economic impact. CROPGEN, 2007)
Nevertheless, the sustainability benefits of the BABE AD project will be have an effect locally through:
• The generation of a long-‐term income for the local agricultural community, e.g. farmers, agricultural contractors and haulage, landscaping
• Short and long-‐term employment in the area in the supply chain, including:
o Surveying, architecture and civil engineering o Accounting and legal o Metal fabrication, welding, construction works, equipment hire, concrete supply,
construction management and construction material supply o Mechanical & electrical installation and maintenance
• The transformation and disposal of farm slurry alongside the reduction of fertiliser cost through quality controlled digestate product. All of the micro-‐ and macronutrients that were present in the original feedstock are still present after the AD process and in the digestate. During the AD process chemical changes take place that can alter the chemical structures (e.g. nitrates – nitrites) in which the nutrients enhance their availability. This enhanced availability results in greater crop uptake, therefore increased yield. There is a reduced risk of nutrient run off intro waterways and nitrogen volatisation into the atmosphere due to the more liquid properties of the digestate compared to cattle slurry. Pathogens are greatly reduced and weed seed annihilated, the higher the operating temperature, the better will be the result.
• The generation of renewable energy, which has a CO2 saving of 0,53kg per kWh el (DEFRA etc), where the projected 1,560,000kWh of the Brampton AD would constitute a carbon saving of about 827 tons per year or 16,536 tons over a 20 year plant lifetime.
The projected electricity generation from the Brampton AD plant would power 472 households, a calculation based on 3,300kWh, OFGEM’s most recent ‘typical domestic annual consumption’ figure. (Source: OFGEM, Factsheet 96)

BABE – Brampton AD Feedstock Study
Public Version page 94 of 94