Downstream & Chemicals
15
© 2018 Chevron Corporation Downstream & Chemicals Pierre Breber Executive Vice President
Transcript of Downstream & Chemicals

© 2018 Chevron Corporation
Downstream & ChemicalsPierre Breber
Executive Vice President

2© 2018 Chevron Corporation
Profitable downstream & chemicals portfolio
Fuels refining & marketing
Focused, regional optimization
Petrochemicals
Advantaged feed, scale and technology
Lubricants & additives
Strategic positions serving global markets
Refinery
Integrated fuels value chain
Olefins / Polyolefins complex
World-scale additives plant
Premium base oil plant integrated with refinery
Aromatics complex

3© 2018 Chevron Corporation
Strategy focused on leading returns
World-class operational excellence
Grow earnings
across the value chain
Target investments
Lead the industry in returns

4© 2018 Chevron Corporation
Demand growth, 2018–2022 Compound annual growth rate
-3% 0% 3% 6%
Finished lubricants
Additives
Premium base oil
Aromatics
Ethylene
Fuel oil
Gasoline
LPG/Naphtha
Distillate
Global product demand
Sources: Wood Mackenzie, NexantThinking™ Petroleum and Petrochemicals Economics program, Klein & Company
Global economic growth
supports product demand
Petrochemicals grow
faster than fuels
Evolving fuels and
lubricants specifications
IMO impacts fuel oil demand
See Appendix: slide notes for definitions, source information, calculations, and other.
Fuels
Petrochemicals
Lubricants
& additives

5© 2018 Chevron Corporation
2
1
1
113
6
2013 2014 2015 2016 2017
Financial performance
5
10
2013 2014 2015 2016 2017
14.1%13.0%24.8%15.3%10.5%
Reported earnings$ billions
Adjusted earnings per barrel$/bbl
Asset sales and other special items
Adjusted earnings
$2.89
CVX ranking relative to IOC competitors, 1 being the highest
IOC competitor range: BP, RDS, XOM
Independents: ANDV, MPC, PSX, VLO
Adjusted ROCE
See Appendix: reconciliation of non-GAAP measures and slide notes for definitions,
source information, calculations, and other.
6© 2018 Chevron Corporation
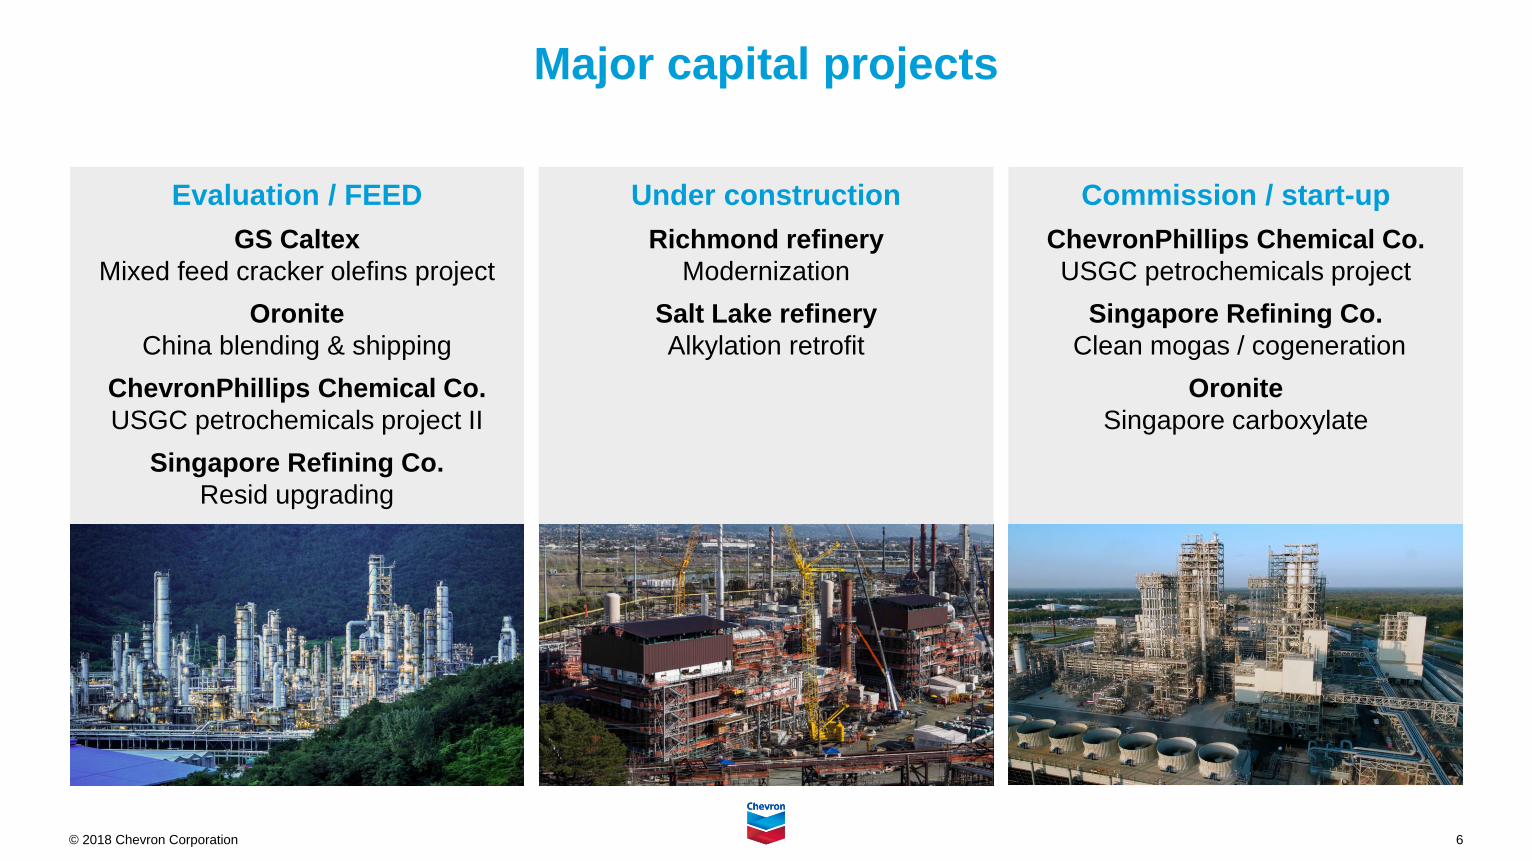
Major capital projects
Evaluation / FEED
GS Caltex
Mixed feed cracker olefins project
Oronite
China blending & shipping
ChevronPhillips Chemical Co.
USGC petrochemicals project II
Singapore Refining Co.
Resid upgrading
Commission / start-up
ChevronPhillips Chemical Co.
USGC petrochemicals project
Singapore Refining Co.
Clean mogas / cogeneration
Oronite
Singapore carboxylate
Under construction
Richmond refinery
Modernization
Salt Lake refinery
Alkylation retrofit

7© 2018 Chevron Corporation
Integrated fuels value chains
South
Korea
Malaysia
Thailand
Singapore
Philippines
Equity
crude
Richmond
Salt
Lake
El Segundo
To Central America
Mexico
Central
America
Equity
crude
Pascagoula
Colombia
U.S. West Coast
• #1 brand share in Western U.S.
• Mexico retail market entry
• San Joaquin Valley equity crude
• Tightly integrated supply chain
U.S. Gulf Coast
• Leading brand in Central America
• Top net cash margin refinery
• GOM / Venezuelan equity crudes
• Opportunity to integrate Permian
Asia Pacific
• Long-standing partnerships
• World-class manufacturing
• Strengthening refinery flexibility
and marketing positions

8© 2018 Chevron Corporation
Fuels marketing activities
Mexico retail market entry
• Plan to grow by up to 350 sites
• Developing key branded
marketer relationships
• Integrated with USWC supply chain
Asia marketing position
• Plan to grow by up to 300 sites
• Enhance customer / retail offering
ExtraMile c-store joint venture
• JV with Jacksons Food Stores Inc.
• Expand existing franchise offering
• Plan to double Western U.S.
footprint to ~1,400 sites by 2027

9© 2018 Chevron Corporation
22
2 2
1
80
120
2008 2010 2012 2014 2016 2017
Refinery performance
Energy efficiencyIndex
CVX ranking relative to competitors
Competitor range
CVX ranking relative to competitors
Competitor range
Sources: Solomon Associates and Chevron data
Net cash marginIndex
4
2
5 4
1
0
35
2008 2010 2012 2014 2016
CVX ranking relative to competitors
Competitor range
See Appendix: slide notes for definitions, source information, calculations, and other.
11 2
2
2
70%
90%
2008 2010 2012 2014 2016 2017
UtilizationPercent

10© 2018 Chevron Corporation
Petrochemicals portfolio
ChevronPhillips Chemical
Advantaged feed, scale & technology
• #1 HDPE marketer
• Leading NAO producer
• MarTECH™ Loop Slurry
GS Caltex
Scale, location advantage
• 4th largest aromatics single site
• Integration with refining
• Proximity to Asian demand
Aromatics
U.S. Gulf Coast Middle East
Olefins / Polyolefins
Asia Pacific
Saudi Arabia
Qatar
Texas
See Appendix: slide notes for definitions, source information, calculations, and other.

11© 2018 Chevron Corporation
Advantaged feedstock
Petrochemicals profitability
Oil / gas price ratio continues to
benefit lighter feedstocks
North America ethane maintains
advantage over Asia naphtha
Integrated polyethylene margins
remain strong
500
1,000
Ethylene cash costs$ per metric ton
2013–2017 average 2018–2022 projected average
Middle East
ethane
Asia
naphtha
North America
ethane
Source: NexantThinking™ Petroleum and Petrochemicals Economics program

12© 2018 Chevron Corporation
ChevronPhillips Chemical performance
Reported earnings$ billions
UtilizationPercent
60%
80%
100%
2012 2013 2014 2015 2016 2017
CPChem Industry average
Source: NexantThinking™ Petroleum and Petrochemicals Economics program
Days away from work rate
CPChem American Chemical
Council average
0.0
0.1
0.2
2012 2013 2014 2015 2016 2017
CPChem 100%
See Appendix: slide notes for definitions, source information, calculations, and other.
0
2
4
2012 2013 2014 2015 2016 2017

13© 2018 Chevron Corporation
Lubricants and additives
Premium base oil
Leading producer, global slate
Finished lubricants
Formulation technology expertise
Strong global brands
Additives
Leading global supplier
Targeting key growth marketsPremium base oil plant integrated with refinery
Equity blend plants Additives manufacturing and supply
Base oil distributive area with 15 supply hubs
See Appendix: slide notes for definitions, source information, calculations, and other.

14© 2018 Chevron Corporation
Lubricants and additives activities
Premium base oil
• Reliable, global operations
• Improved average yield ~25%
• Lowered supply chain costs ~15%
Additives growth
• World-class reliability
• Award winning
passenger car additives
• Positioned for China growth
ICONIC™ Lubricantes
• JV with Ipiranga in Brazil
• Ipiranga and Texaco brands
• ~23% market share

15© 2018 Chevron Corporation
Technology
Manufacturing
• ISOALKY™ technology
• Next generation
hydro-processing catalyst
Digital solutions
• Customer experience
& mobile pay
• Global e-commerce platform
• Sensors & predictive
maintenance
Product development
• Techron®
• OEM partnerships
• Renewable fuels