DOTTORATO DI RICERCA IN SCIENZE E TECNOLOGIE AGRARIE...
205
e di – iei di g DOTTORATO DI RICERCA IN SCIENZE E TECNOLOGIE AGRARIE, AMBIENTALI E ALIMENTARI Ciclo XXVI Settore Concorsuale di afferenza: 07/A1 – ECONOMIA AGRARIA ED ESTIMO Settore Scientifico disciplinare: AGR/01 – ECONOMIA ED ESTIMO RURALE TITOLO TESI ENTREPRENEURSHIP INFLUENTIAL FACTORS IN DEVELOPMENT OF RURAL TOURISM AS DIVERSIFIED RURAL ACTIVITY IN REPUBLIC OF MACEDONIA Presentata da: Kiril Todorov Esame finale anno 2015 Coordinatore Dottorato Prof. Giovanni Dinelli Relatore Prof. Andrea Segr Correlatore Dr. Matteo Vittuari
Transcript of DOTTORATO DI RICERCA IN SCIENZE E TECNOLOGIE AGRARIE...
e di – i e i di g
DOTTORATO DI RICERCA IN
SCIENZE E TECNOLOGIE AGRARIE, AMBIENTALI E ALIMENTARI
Ciclo XXVI
Settore Concorsuale di afferenza: 07/A1 – ECONOMIA AGRARIA ED ESTIMO
Settore Scientifico disciplinare: AGR/01 – ECONOMIA ED ESTIMO RURALE
TITOLO TESI
ENTREPRENEURSHIP INFLUENTIAL FACTORS IN DEVELOPMENT OF
RURAL TOURISM AS DIVERSIFIED RURAL ACTIVITY IN REPUBLIC OF
MACEDONIA
Presentata da: Kiril Todorov
Esame finale anno 2015
Coordinatore Dottorato
Prof. Giovanni Dinelli
Relatore
Prof. Andrea Segre
Correlatore
Dr. Matteo Vittuari
2
Table of Contents
LIST OF TABLES ................................................................................................................... 5
LIST OF FIGURES ................................................................................................................. 7
LIST OF ABBREVIATIONS AND ACRONYMS ................................................................ 8
ACKNOWLEDGEMENTS .................................................................................................. 10
ABSTRACT AND KEYWORDS ........................................................................................ 11
1. INTRODUCTION ............................................................................................................ 12
1.1. Research motivation, objectives and problems addressed ...............................12
1.2. Outline of the thesis ..........................................................................................................15
2. RESEARCH QUESTIONS AND METHODOLOGY ................................................... 18
2.1. Rational and research framework ..............................................................................18
2.2. Research questions ...........................................................................................................20
2.3. Methodology ........................................................................................................................20
2.3.1. Methodology outline .............................................................................................................. 20
2.3.2. Desk research ........................................................................................................................... 21
2.3.3. Qualitative research – life story interviews ................................................................. 22
2.3.4. Quantitative research – Data collection and PLS-SEM ............................................ 23
2.3.5. Methodological research limitation ................................................................................ 27
3. RURAL TOURISM AND RURAL DEVELOPMENT – INSTITUTIONAL
FRAMEWORK IN THE EU AND THE REPUBLIC OF MACEDONIA ....................... 30
3.1. European Union Rural Development Policy and enlargement process.........30
3.1.1. Defining ‘rurality’ in the EU context ................................................................................ 30
3.1.2. CAP and Rural Development Policy ................................................................................. 33
3.1.3. EU enlargement instruments ............................................................................................ 41
3.2. Tourism in European perspective ...............................................................................44
3.2.1. Tourism as part of EU economy and policy .................................................................. 44
3.2.2. Rural Tourism in EU............................................................................................................... 49
3.3. Republic of Macedonia - Overview of the country .................................................56
3.3.1. Macro- and Socio- economic situation in the country ............................................. 56
3
3.3.2. Entrepreneurship and Business opportunities in Republic of Macedonia ..... 59
3.3.3. Entrepreneurship institutional framework ................................................................. 62
3.3.4. Rural areas in Republic of Macedonia ............................................................................ 64
3.3.5. Agricultural sector in the Republic of Macedonia ..................................................... 67
3.3.6. Rural Tourism in Republic of Macedonia ...................................................................... 69
Legal framework ............................................................................................................................................... 70
Rural tourism market in the Republic of Macedonia ........................................................................ 72
4. ENTREPRENEURSHIP DEVELOPMENT, THEORIES AND ECONOMIC
GROWTH ............................................................................................................................. 77
4.1. Entrepreneurship theories, components and context .........................................77
4.1.1. Emergence and historical development of entrepreneurship ............................ 77
4.1.2. Entrepreneurship theories and schools ........................................................................ 79
4.1.3. Context of entrepreneurship .............................................................................................. 83
4.2. Entrepreneurship and economic growth..................................................................85
4.3. Rural entrepreneurship ..................................................................................................88
4.4. Entrepreneurship in tourism and hospitality .........................................................90
5. FACTORS INFLUENCING BUSINESS AND ENTREPRENEURSHIP SUCCESS . 95
5.1. Defining business success ..............................................................................................95
5.2. Critical success factors ....................................................................................................97
6. DATA ANALYSIS ......................................................................................................... 106
6.1. First stage data analysis qualitative research – life story interviews ......... 106
6.2. Second stage data analysis quantitative research .............................................. 110
6.2.1. Descriptive statistics ............................................................................................................ 110
Missing data ...................................................................................................................................................... 112
6.2.2. Partial Least Squares – Structural Equation Modeling .......................................... 113
6.2.2.1. Structural model ............................................................................................................................. 115
6.2.2.2. Constructs development and measures................................................................................ 118
Human Capital ............................................................................................................................................ 118
Social Capital ............................................................................................................................................... 120
Personality .................................................................................................................................................... 122
Business environment .............................................................................................................................. 123
Entrepreneurial success .......................................................................................................................... 124
6.2.2.3. Model fit – measurement models ............................................................................................ 126
Assessment of reflective measurement model ................................................................................ 126
Assessment of formative measurement model ............................................................................... 130
4
6.2.2.4. Model fit – structural model ....................................................................................................... 136
6.2.2.5. Evaluation of unobserved heterogeneity ............................................................................. 142
6.2.2.6. Importance-Performance Matrix Analysis .......................................................................... 144
6.2.2.7. Mediation analysis .......................................................................................................................... 146
6.2.2.8. Continuous moderator analyses .............................................................................................. 148
6.2.2.9. Categorical moderators analysis .............................................................................................. 150
Gender as grouping variable ................................................................................................................. 151
Place of business as place of birth (PBB) .......................................................................................... 154
Tourism as additional activity (TAA)................................................................................................. 154
Age and education of participants ...................................................................................................... 157
Registration form ....................................................................................................................................... 159
6.2.3. Results of hypothesis tests ................................................................................................ 161
6.3. Discussion ......................................................................................................................... 164
7. CONCLUSIONS .......................................................................................................... 170
7.1. Main findings .................................................................................................................... 170
7.2. Policy implications ......................................................................................................... 173
8. REFERENCES ............................................................................................................... 174
ANNEXES ........................................................................................................................... 197
ANNEX 1 QUESTIONNAIRE ................................................................................................... 197
ANNEX 2 TABLES ..................................................................................................................... 200
5
LIST OF TABLES
Table 2.1 Multivariate Research Methods
Table 3.1. EU Rural development Policy 2007-2013 Axis and Measures
Table 3.2. EU Funds and Actions for support and development of tourism
Table 3.3. Comparative evaluation of the definitional components of rural tourism
Table 3.4. Rural versus Urban typology
Table 3.5. Urban and Rural tourism characteristics
Table 3.6. Municipalities by type according to the Law on territorial organization
Table 3.7. Macroeconomic data 2000-2012
Table 3.8. Active enterprises by category according to territorial organization
Table 3.9. Number of active business entities by regions NUTS 3
Table 3.10. Rural areas according to OECD definition and National definition
Table 3.11. Population (2012) by age according to OECD definition
Table 3.12. Agriculture land area in ‗000 ha
Table 3.13. Number of agricultural holdings and available area/LSU (2012)
Table 3.14. Number of tourist and overnight stays in RM, 2013
Table 4.1. Key contributions of economic authors on the role of entrepreneurs
Table 4.2. Contributions of the disciplines to entrepreneurship
Table 4.3. Summary of approaches for describing entrepreneurship
Table 6.1. Life-Story influential success factors coding
Table 6.2. TAA and PBB distribution
Table 6.3. Gender distribution and Age categories
Table 6.4. Number of beds group distribution
Table 6.5. Number of rooms group distribution
Table 6.6. Initial Analysis Outer loadings
Table 6.7. Fornell-Larcker criterion analysis
Table 6.8. Indicators cross-loadings
Table 6.9. CVR indicator values
Table 6.10. Redundancy analysis scores
Table 6.11. Variance Inflation Factor results
Table 6.12. Significance and relevance of the indicators of formative constructs
Table 6.13. Structural model Inner VIF values
6
Table 6.14. Significance testing results of the structural model path coefficients
Table 6.15. R square Mean, STDEV, T-Values, P-Values
Table 6.16. Effect sizes f2
and q2
Table 6.17. R2
and Q2 values
Table 6.18. Blindfolding and Assessment of the predictive relevance Q2
Table 6.19. Unobserved heterogeneity with two segments – FIMIX-PLS
Table 6.20. Fit Indices FIMIX-PLS
Table 6.21. Significance analyses of path coefficients without the mediators
Table 6.22. VAF values for Mediation analysis
Table 6.23. Henseler‘s Multi-Group Analysis test results
Table 6.24. Path Coefficients, t values and p values for males and females
Table 6.25. Welch-Satterthwait Test results
Table 6.26. Path Coefficients, t values and p values for PBB and TAA
Table 6.27. Path Coefficients, t values and p values for Age and Education
Table 6.28. Henseler‘s Multi-Group Analysis
Table 6.29. Path Coefficients, t values and p values for males and females
Table 6.30. Welch-Satterthwait Test – Registration form as grouping variable
7
LIST OF FIGURES
Fig. 2.1 Methodological theory approach
Fig. 2.2 Hypothesis Structural Model
Fig. 3.1 The European Commission territorial typology, 2010, NUTS 3 level
Fig. 3.2. Regional Indicators EU 27
Fig. 3.3. Farm structure: average farm in the EU-27
Fig. 3.4. CAP structure Agenda 2000 Reform
Fig. 3.5. Structure of Rural Development Policy 2007-2013
Fig. 3.6. Total EAFRD expenditures 2007-2013 by Axis
Fig. 3.7. RDP 2014-20120 priorities
Fig. 3.8. Instruments for facilitating adhesion process
Fig. 3.9. IPARD allocation of funds by measures
Fig. 3.10. Macedonia and EU27
Fig. 3.11. GDP real growth rate %
Fig. 4.1. Specification of alternative growth models
Fig. 4.2. Nascent entrepreneurship versus per capita income in PPP, the U-curve
Fig. 4.3. Tourism and hospitality family entrepreneurship model
Fig. 5.1. Analytical framework of business characteristics
Fig. 5.2. Categories of business owners
Fig. 5.3. Personal Characteristics and Environment of Small Business Model
Fig. 6.1. Republic of Macedonia NUTS3 regions and Life-story Interviews locations
Fig. 6.2. Percentage of participants in the sample according to NUTS3 level
Fig. 6.3. Missing values summary
Fig. 6.4. Hypothesis Model
Fig. 6.5. Composite reliability
Fig 6.6. Segment 1 Structural Model, Standardized Path Coeficients, R Square Values
Fig 6.7. Segment 2 Structural Model, Standardized Path Coeficients, R Square Values
Fig. 6.8. IPMA of constructs – target construct Success
Fig. 6.9. IPMA of Indicators – target construct Success
Fig. 6.10. Interaction Model Social capital (Indicator) -> Human capital
Fig. 6.11. Interaction effect of Social and Human Capital on Business Environment
Fig. 6.12. Interaction effect of Social and Human Capital on Personality
8
LIST OF ABBREVIATIONS AND ACRONYMS
AESRM - Agency for Entrepreneurship Support of the Republic of Macedonia
AVE - Average Variance Extracted
CAP - Common Agricultural Policy
CARDS - Community Assistance for Reconstruction, Development and Stabilisation
CB-SEM – Covariance Based Structural Equation Modeling
CEECs – Central Eastern European Countries
CEFTA - Central European Free Trade Agreement
DG - Directorate General
EAFG - European Agriculture Fund for Guarantee
EAFRD - European Agricultural Fund for Rural Development
EC - European Commission
EU - European Union
FAO – Food and Agriculture Organization
GDP – Gross Domestic Product
GEM - Global Entrepreneurship Monitor
GNP - Gross National Product
GVA - Gross Value Added
IPA - Instrument for Pre-accession Assistance
IPARD - Instrument for Pre-Accession Assistance in Rural Development
LAU - Local Administrative Unit
LEADER - Liaison Entre Actions de Developpement de l'Économie Rurale
LFA - Less Favored Areas
LSU – Livestock Units
MS - Member States
NGO – Non-Government Organizations
NMS – New Member States
NPARD - National Program for Agriculture and Rural Development
NSRT - National Strategy for Rural Tourism
NSTD - National Strategy for Tourism Development
NUTS - Nomenclature of Territorial Units for Statistics
OECD - Organization for Economic Co-operation and Development

9
OLS – Ordinal Least Squares
PHARE - Poland and Hungary Assistance for Restructuring their Economies
PLS - Partial Least Squares
PLS-SEM - Partial Least Squares Structural Equation Modeling
RDP - Rural Development Policy
RM – Republic of Macedonia
SAPARD - Special Accession Programme for Agriculture and Rural Development
SEM - Structural Equation Modeling
SME – Small and Medium Enterprises
SNA - System of National Accounts
SPS – Single Payment Scheme
SSO – State Statistical Office
TAA - Tourism as Additional Activity
TEA - Total Early-Stage Entrepreneurial Activity
TSA - Tourism Satellite Accounts
TSG - Tourism Sustainability Group
UNDP – United Nations Development Program
USAID - United States Agency for International Development
VAF – Variance Accounted For
VIF - Variance Inflation Factor
WTO - World Trade Organization

10
ACKNOWLEDGEMENTS
My most sincere thanks go to my advisors and mentors, Dr. Matteo Vittuari for his
constant and unselfish support and to Prof. Andrea Segrè who gave me the
opportunity to perform this research.
I would also like to thank Francesca Regoli, as an expert in rural tourism her
suggestions were always extremely useful.
I would like to express my gratitude to all participants in the telephone survey and
personal interviews. Without their willingness to devote their time to share with me
their opinions, this research would have never been possible.
I would like to express my eternal gratitude to my family, especially my wife Slavica
Todorova, for her generous support, encouragement and understanding.
I want to express sincere gratitude to the Director of the Agency for Financial Support
of Agriculture and Rural Development of Republic of Macedonia, Toni Dimovski and
Biljana Vuković who were extremely tolerant and support me in my work.
Finally, I owe thanks to all my colleagues, friends and relatives who directly or
indirectly helped me in this scientific work.
11
ABSTRACT AND KEYWORDS
Rural tourism is relatively new product in the process of diversification of the rural
economy in Republic of Macedonia. In the recent years several studies have identified
the entrepreneurs and their motives of engagement in rural tourism accommodation
business. However, none of the previous studies have identified and measured the
factors that influence success of the entrepreneurs in rural tourism. This study used
desk research and life story interviews of rural tourism entrepreneurs as qualitative
research method to identify prevalent success influential factors. Further, quantitative
analysis was applied as second stage of the research in order to measure the strength
of influence of identified success factors. The primary data for the quantitative
research was gathered using telephone questionnaire composed of 37 questions with
5-points Likert scale. The data was analyzed using Partial Least Squares Structural
Equation Modeling (PLS-SEM) by SmartPLS 3.1.6. Results indicated that human
capital, social capital, entrepreneurial personality and external business environment
are predominant influential success factors. However, human capital has non-
significant direct effect on success (p 0.493) nonetheless the effect was indirect
with high level of partial mediation through entrepreneurial personality as mediator
(VAF 73%). Personality of the entrepreneur, social capital and business environment
have direct positive affect on entrepreneurial success (p 0.001, 0.003 and 0.045
respectably). Personality also mediates the positive effect of social capital on
entrepreneurial success (VAF 28%). Opposite to the theory the data showed no
interaction between social and human capital on the entrepreneurial success. This
research suggests that rural tourism accommodation entrepreneurs could be more
successful if there is increased support in development of social capital in form of
conservation of cultural heritage and natural attractions. Priority should be finding the
form to encourage and support the establishment of formal and informal associations
of entrepreneurs in order to improve the conditions for management and marketing of
the sector. Special support of family businesses in the early stages of the operation
will also have a particularly positive impact on the success of rural tourism. From the
external business environment most prevalent factors of success would be investment
in local infrastructure, access to the financial instruments and destination marketing.
Keywords: rural tourism, entrepreneurship, success factors, life story interviews,
PLS-SEM, social capital, human capital, entrepreneurial personality, business
environment
12
1. INTRODUCTION 1.1. Research motivation, objectives and problems addressed
Republic оf Macedonia (RM) similarly to other countries in the Balkan Peninsula is
struggling with migration and depopulation of the rural spaces (Bornarova & Janeska,
2012; Grečić & Kaludjerović, 2012; Jakimovski, 2002; Janeska & Bojnec, 2011;
Kostadinova-Daskalovska & Noshpalovska, 2000; Pearce & Davis, 2000). Rural-
urban migration trends and dynamics are not very different even from those registered
in some of the CEECs countries that joined European Union (EU) in 2004 (Baláž &
Kusá, 2012; Drbohlav & Rákoczyová, 2012; Okólski & Topińska, 2012) and EU
2007 enlargement countries (Abadjieva, 2008; Alexe, Horváth, Noica, & Radu, 2012;
Bogdanov & Rangelova, 2012). In order to face this condition and to find a solution,
the Republic of Macedonia implements numerous actions in the form of policy
measures for support and development of rural areas and decreasing rural-urban
differences (Bojnec, 2012; Todorov & Vittuari, 2010). Most of these policy measures
as a result of the European Union (EU) integration process are designed similar to the
measures in the EU Rural Development Policy (RDP), second pillar of the Common
Agricultural Policy (CAP) that can be considered as a major milestone for the rural
policy of the countries in the region as it has been an important milestone for the
CEECs in the 1999-2004 period. This is evident in the National Program for
Agriculture and Rural Development (NPARD) 2013-2017 of Republic of Macedonia
that is characterized by variety of policy measures. Some of them related to more
broader concept as investments in the development of various types of hard and soft
infrastructure in rural areas considering that infrastructure is important factor
influencing directly and indirectly the development and economic grow of rural areas
(Janvry, Sadoulet & Murgai 2002; Jakimovski, 2004). Others measures are related to
another important EU RDP concept as rural development through support of
diversification of economic activities (Clark & Chabrel, 2007; Hjalager, 1996;
Sharpley & Vass, 2006). In this regard Republic of Macedonia, as a result of
enormous cultural and natural heritage, has identified rural tourism as significant
13
diversified economic activity and as an opportunity for rural development.
Consequently rural tourism has been earning its place in the local development
strategies. The concept of rural tourism was framed on a national level by adopting
the National Strategy for Tourism Development (NSTD) 2009-2013 and National
Strategy for Rural Tourism (NSRT) 2012-2017.
The NSRT 2012-2017 is a most comprehensive document delivered in the last decade
in the field of Republic of Macedonia‘s rural tourism. It provides definitions, analyses
the trends in rural tourism with more in depth attention to the situation in the country,
the institutional capacity and the legal framework. The NSRT suggests determining
the strategic framework for the development of rural tourism in Macedonia focused
on achieving three key strategic objectives: (1) increased capacity in rural tourism, (2)
increased employment in rural tourism, and (3) increased tourist offer in rural areas.
The second key strategic objective is directly linked to the development of human
capital in rural tourism that is identified as one of the most important inputs in the
sector. Therefore the NSRT sets list of activities that should be performed for
reaching certain goals in the sector as development of specific human capital. It
suggests creation of a project for raising awareness of younger groups of the rural
population, prospects for career development in rural tourism, creation of action plan
for raising awareness of the rural population about the importance of tourism in rural
areas, developing a plan for the implementation of training activities by regional and
local needs etc. In brief, the NSRT at the macro level provides clear guidance for
continuous and sustainable development of rural tourism with exact actions, however
at the micro level there are still gaps to be filled.
On international theoretical aspect rural tourism is closely linked to small ventures,
agriculture, landscape, tradition and action and innovation of individuals not only for
personal purposes like increasing revenue and providing lifestyle, but also supporting
the community and preserving the environment. Therefore the position of the
entrepreneur in rural tourism business is milestone (Clark & Chabrel, 2007; Getz &
Carlsen, 2005; Lundberg & Fredman, 2012; McAreavey & McDonagh, 2011;
Sharpley & Jepson, 2011). The entrepreneur is key figure in every venture moreover
in rural tourism due to the combination of social, environmental and economic
activities that should be preformed (J. Ateljevic & Page, 2009; Nancy G. McGehee,
14
Kim, & Jennings, 2007; Rogoff, Lee, & Suh, 2004). Complexity of rural tourism as
an economic activity immediately raises the question of: Who is the person behind
this activity? What are his motivations? Which are the factors that influenced him and
in what meaner? Are there any groups that are substantially different based on success
factors?
Some of these questions raised are already answered as a result to different studies in
RM. Metodijeski (2012) performs literature research on concepts of rural tourism and
how these concepts could be implemented most successful in the field of rural tourism
in the RM. It determines the potential of different regions in the RM. The research of
Metodijevski (2012) structured as three independent researches using descriptive,
inductive, historical, qualitative and quantitative methods, is giving answer to: (1)
Who do it and what are his/her motivations? – Profiling entrepreneurs offering
accommodation services in rural tourism in the RM. (2) Marketing and the role of
travel agencies in the development of rural tourism in RM and (3) The role of the
rural women in creation and development of rural tourism and creative industries.
Further, Taskov at al. (2013) researched prevalence of rural tourism in mountainous
areas, Dimitrov & Petrevska (2012) researched rural tourism development zones in
RM and Kostadinov (2012) researched the state of rural entrepreneurship in RM.
However, one of the gaps that are understudied on national level in RM is the
understanding of rural tourism entrepreneur, their development, behavior and the
factors that are determining their success and vice versa how success is modeling the
development of the sector. There is still missing more targeted research on rural
tourism entrepreneurship that would give answers to the questions: What are the
crucial factors that are influencing rural tourism entrepreneur success? Are there
interactions between the factors? To what extend they are influencing the success?
Understanding the factors that are influencing the entrepreneurs in this sector is
crucial hoop in the chain of development of the sector. Consequently determining
success factors and measuring their influence on success is in the center of the
development of the sector.
Bearing in mind that on national level in Republic of Macedonia there is a wide gap
of understudied factors that are influencing entrepreneurs in the rural tourism sector
the intention of this research is through analysis of previous similar international
studies in this field to develop theory and determine most crucial external and internal
15
factors that have influence in the process of success of rural tourism entrepreneur.
Internationally there are numerous researches‘ identifying and measuring influential
factors on entrepreneurs in general and rural tourism entrepreneurs in particular.
(Hughes & Carlsen, 2010; Li, Wu, & Bai, 2012; Lundberg & Fredman, 2012; N G
McGehee, 2004; Pearce & Davis, 2000; Rogoff et al., 2004; Sidik, 2012; Simpson,
Tuck, & Bellamy, 2004; Walker, 2004; Watson, Hogarth-Scott, & Wilson, 1998;
Wijewardena & Tibbits, 1999; Wilson, Fesenmaier, Fesenmaier, & Van Es, 2001;
Wong, 2005). They all served as an inspiration for filling the identified gap in the
literature in RM.
As a consequence of the exploratory character of the research it was set as three-phase
research: theory development, qualitative and quantitative research. Each phase of the
research have goals to be reached and the results to be used in the consequent phase.
The primary goal of the research is to define list of factors and to structure them in
groups in accordance to their interactions concerning relevant theories of
entrepreneurship, rural development and tourism. Second goal of the research is to
test and prove the theory using qualitative and quantitative primary data analysis and
to quantify the strength of influence on individually each factor and the groups of
factors. Therefore research aims to explain and quantify the correlation between
measured variables, and to measure latent unobserved variables. The overall goal of
the research is to give answers to the questions stated above and by doing so to
recommend more targeted actions that can be implemented in various support policies
for substantial increase of operators in the sector of rural tourism and increase in the
national economy share of the sector contributing to the rural development through
diversification.
1.2. Outline of the thesis
The thesis is structured in 8 chapters starting with broader elaboration of the theory of
entrepreneurship, rural development and tourism continuing to more focused research
of rural tourism success factors.
16
The first chapter introduces the main issues of the thesis and elaborates in brief the
problems addressed, objectives and goals to be reached explaining the aim and
motivation of the research.
The second chapter of the research describes the research questions as a consequence
of the problems addressed by the research continuing in the methodology
development of the research explaining the methods used for data collection and
analysis.
The chapters 3 and 4 are dedicated to extended existing theory analysis. Starting with
rural development comparative theory and country analysis between EU and RM with
in depth analysis of the role of rural tourism in the economy continuing with
entrepreneurship and economic growth theory analysis. The main objective of these
chapters is to identify the core theory of rural tourism entrepreneurship.
Chapter 5 identifies the crucial influential factors of entrepreneurship success in the
theory of rural tourism entrepreneurship. This chapter is explaining the theoretical
concept of success in SME‘s in general and more specific in the tourism continuing
with identification of success factors by examination of previous research in the field
of success factors.
Moving from existing theory analysis to explorative research and theory development
for the study area, chapter 6 explains the two stages of the research preformed in
Republic of Macedonia. This chapter elaborates qualitative and quantitative research,
analysis of the data ending with discussion of the results. Consequently to the
discussion and results from the research, chapter 7 presents the main evidence from
the research setting a series of recommendations.
The last chapter ―Bibliography‖ lists the scientific books, articles, journals, policies,
programs and web sites that are elaborated in the thesis.

17
18
2. RESEARCH QUESTIONS AND METHODOLOGY
2.1. Rational and research framework
Worldwide trends of industrialization and growth are central urban approach of
development. In parallel, the stress of the urban lifestyle contributes to the syndrome
counter urbanization. All this leads to an increased interest in rural areas and it
specific livelihood. Increased development of tourism worldwide is associated with
the potential development of rural tourism. Rural tourism is one of the few activities
that can offer solutions to social problems in rural areas, especially the problem of
high unemployment and cultural conservation. In addition, there are other factors that
divert focus to rural tourism as: increased interest in cultural heritage and raising the
level of environmental awareness. These conditions created a challenge to promote
rural tourism as the primary tourism product that would spread tourism and its socio-
economic benefits for rural areas. Essentially, rural tourism is an activity that takes
place outside of urban areas. As such, it is a complex activity and it may include: farm
tourism, nature tourism, adventure tourism, ecotourism and others. Contrary to
conventional, rural tourism has certain specific features. It is oriented towards specific
experience, the locations of rural tourism are less populated and is mostly a natural
environment, it has seasonal character in relation with local events and is based on the
preservation of culture, heritage and traditions.
Rural tourism cannot be developed anywhere and by anyone. There is a need of
meeting a number of factors, which are requirement for the development of this type
of alternative tourism. The essential factors that allow the existence of rural tourism
can be formulated as follows:
1. Existence of anthropogenic (e.g. cultural, historical, archaeological,
ethnographic) and natural tourism resources (e.g. geomorphological,
hydrographic, biogeographically)
2. Appropriate accommodation facilities (e.g. rural houses with traditional
architecture; apartments and rooms in houses with modern architecture; Eco
agricultural household and rural small family hotels)
3. Human factors - Tourism creates great opportunities for employment in both
primary and secondary sectors of the economy. It creates direct employment
19
in restaurants, hotels and other tourism facilities and indirect employment
referring to people who are engaged in activities dependent on tourism as
construction workers, doctors, retailers, gas stations etc. Third is the induced
additional employment of local residents and are calculated from the
additional income earned.
4. Institutional support - in terms of central and local government financial and
non financial support, NGO sector development and external support e.g
USAID, IPARD
5. Built social and production infrastructure (e.g. transport, communications,
water etc)
6. The existence of constant travel demand, ensuring constant demand of rural
tourism products and effective use of accommodation
Although all this factors are allowing the creation of the rural tourism and are
preconditions for development of the sector as in any other economic sector that is
dependent on creation and existence of SME the milestone of the presence of the rural
tourism is the entrepreneur. The entrepreneur combines and allocates the existing
resources, interact on the market and produces new added value products and
services. Their ability of recognition and identification of the opportunity, knowledge
of specific and general resources allocation makes their enterprises successful. The
entrepreneur is the core of the rural tourism sector. As a result to this conclusion the
entrepreneurs are in the center of this research.
As indicated by Regoli, Vittuari and Segrè (2011) proper exploitation of the natural,
human and social resources is contributing to the sustainable development of rural
tourism. Taking this into account and considering that in the core of the exploitation
of the resources is the entrepreneur the basic hypothesis structured in this research is
that human, social and natural resources are influencing rural tourism entrepreneurial
success. Later, due to the extended literature review and existing theory exploration
this list of resources was extended with business environment referring to the external
factors that are fostering or suppressing SME development in the rural tourism sector.
Based on the review of the literatures on tourism, rural development, rural tourism,
entrepreneurship, social and human psychology this research examines the theoretical
relationship among human capital, social capital, personality and business
environment and their effect on entrepreneurial success in rural tourism.
20
2.2. Research questions
Rural development although depending on many different sorts of actions its
sustainable development is closely linked to the development of entrepreneurship.
Sustainable development of entrepreneurship is perceived as major milestone in
decreasing of rural-urban differences, confirmed by numerous actions in the form of
policy measures. In this regard Republic of Macedonia, as a result of enormous
cultural and natural heritage, has identified rural tourism as significant diversified
economic activity and as an opportunity for rural development. This research aims at
assessing the theory of tourism, entrepreneurship and rural development finding the
overlaps and communalities between the existing theories with focused attention on
the entrepreneur as a key figure and a point of interest centering the theories on this
point. Entrepreneur in this research is seen as developer or person that sees the
opportunity and creates new possibilities out of existing and available resources.
Therefore this research aims at answering the following questions:
1. Is rural tourism recognized and supported by the existing policies in RM?
2. What is the position of entrepreneur in the development of rural tourism?
3. What are the crucial factors that are influencing rural tourism entrepreneur
success?
4. To what extend they are influencing the success?
5. Are there interactions between the influential factors?
6. Are there any groups that are substantially different based on success factors?
2.3. Methodology
2.3.1. Methodology outline
Methodological research is divided into three phases. The first phase is the desk
research that summarized all previous research in the area and the relevant existing
theories. The second phase includes a qualitative survey of entrepreneurs involved in
rural tourism incorporating all previously acquired knowledge about the connection of
relevant theories and focusing on entrepreneurial experiences and stimuli. The third
21
and final phase of the research related to qualitative research on the factors that
influence the success of entrepreneurs in rural tourism. All three phases of the study
are related to each other and consequently enabling easy and logical traceability and
focus on the research and results.
2.3.2. Desk research
The research of previous work in the field of rural tourism was starting point and the
widest part of the study. This was due to the complexity of the issues addressed and
questions raised that the research should provide answers. The purpose of this part of
the research was to link existing theories of rural development, entrepreneurship and
tourism and to find their similarities setting entrepreneurs in the center of the
research. Given that the entrepreneurs are at the center of the research the desk
research was extended on related behavior theory, self-efficacy and needs theory
developed in the field of psychology and closely related to human behavior.
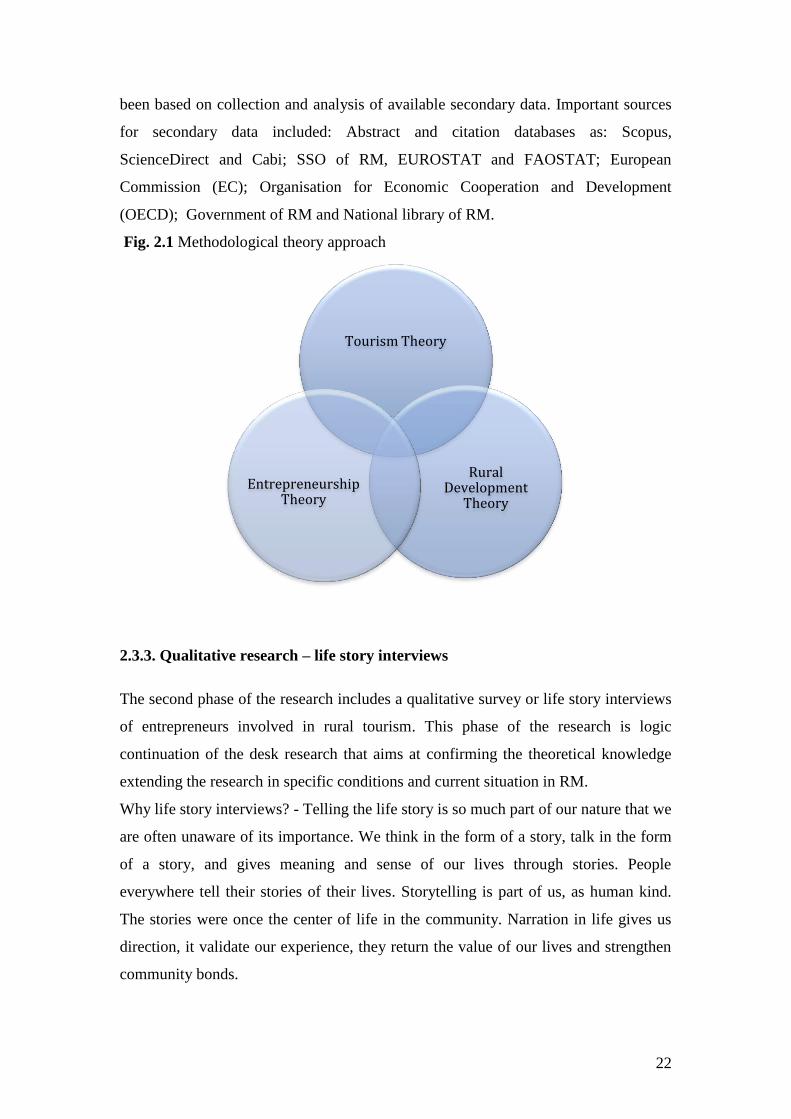
The desk research tends to give a clear picture of the geography area in which
research is conducted. Makes a comparison between the existing theories for defining
rural areas at the level of OECD and EU countries linking it to the regulation for
defining rural areas in RM.
Creating comparison of the agricultural sector between the EU and RM the research
focuses deeper on the RDP two periods 2007-2013 and 2014-2020. The focus is on
the RDP due to the fact that the development of the rural tourism sector is closely
related to the rural development and supported through RDP. Consequently the desk
research manages to link RDP of EU and RM and the effect of the enlargement
instrument of EU on rural tourism development in RM. Further the desk research is
closely linking the theory of tourism and leisure to the theory of rural development
and makes comparison of both policies on EU and RM level.
Exploring the theory of entrepreneurship the study challenges to interlink rural
development and tourism theory to the entrepreneur as a key figure in
entrepreneurship theory. The last part of the desk research summarized the existing
theory on entrepreneurial success addressing the factors that are influencing the
entrepreneurial success in rural tourism, tourism and general entrepreneurial success.
Substantial amount of consistent secondary data as research papers, reports, scientific
books, statistical databases and web sites has been referred. The desk research has
22
been based on collection and analysis of available secondary data. Important sources
for secondary data included: Abstract and citation databases as: Scopus,
ScienceDirect and Cabi; SSO of RM, EUROSTAT and FAOSTAT; European
Commission (EC); Organisation for Economic Cooperation and Development
(OECD); Government of RM and National library of RM.
Fig. 2.1 Methodological theory approach
2.3.3. Qualitative research – life story interviews
The second phase of the research includes a qualitative survey or life story interviews
of entrepreneurs involved in rural tourism. This phase of the research is logic
continuation of the desk research that aims at confirming the theoretical knowledge
extending the research in specific conditions and current situation in RM.
Why life story interviews? - Telling the life story is so much part of our nature that we
are often unaware of its importance. We think in the form of a story, talk in the form
of a story, and gives meaning and sense of our lives through stories. People
everywhere tell their stories of their lives. Storytelling is part of us, as human kind.
The stories were once the center of life in the community. Narration in life gives us
direction, it validate our experience, they return the value of our lives and strengthen
community bonds.
Tourism Theory
Rural Development
Theory
Entrepreneurship Theory
23
The stories can attest, evaluate and support our experience in social framework and
clarify our relationship with those around us. They emphasize the norms of moral
order and shape according to the individual needs of society. Stories help us to
understand the differences and our similarities and relationships with others. Stories
develop a sense of community.
Scientists in many academic disciplines conducted interviews life story before it
become recognized. It can be said that the life story interview evolved from oral
histories, life histories and other ethnographic approaches. It is a qualitative research
method for gathering information about the subjective essence of the life of the
individual.
2.3.4. Quantitative research – Data collection and PLS-SEM
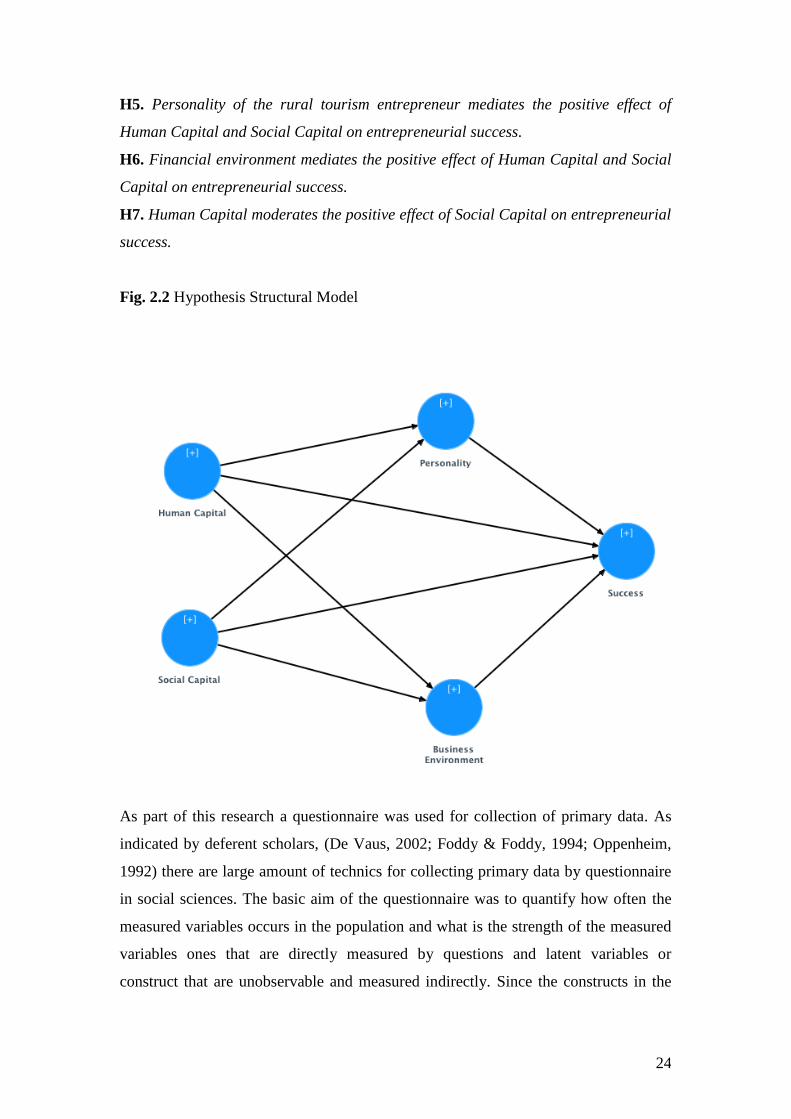
The research is based on structural model that illustrates the hypothetical relationship
between the constructs that will be examined in this research. The sequence of the
constructs in the structural model is based on the theory previously examined and
developed through literature review, logic, experiences and partially concluded by the
use of qualitative research (first step of the research applied life story interviews with
rural tourism entrepreneurs). Fig 1 illustrates the basic diagram of the hypothesized
constructs that influence entrepreneurial success in rural tourism.
Based on the review of the literatures on tourism, rural development, rural tourism,
entrepreneurship, social and human psychology this research examines the theoretical
relationship among human capital, social capital, personality and business
environment and their effect on entrepreneurial success in rural tourism. The key
relationships in the structural model are expressed in the following null hypotheses:
H1. Human Capital of the rural tourism entrepreneur is positively related to his/her
entrepreneurial success.
H2. Personality of the rural tourism entrepreneur is positively related to his/her
entrepreneurial success.
H3. Social Capital of the rural tourism entrepreneur is positively related to his/her
entrepreneurial success.
H4. External financial environment is positively related to his/her entrepreneurial
success.
24
H5. Personality of the rural tourism entrepreneur mediates the positive effect of
Human Capital and Social Capital on entrepreneurial success.
H6. Financial environment mediates the positive effect of Human Capital and Social
Capital on entrepreneurial success.
H7. Human Capital moderates the positive effect of Social Capital on entrepreneurial
success.
Fig. 2.2 Hypothesis Structural Model
As part of this research a questionnaire was used for collection of primary data. As
indicated by deferent scholars, (De Vaus, 2002; Foddy & Foddy, 1994; Oppenheim,
1992) there are large amount of technics for collecting primary data by questionnaire
in social sciences. The basic aim of the questionnaire was to quantify how often the
measured variables occurs in the population and what is the strength of the measured
variables ones that are directly measured by questions and latent variables or
construct that are unobservable and measured indirectly. Since the constructs in the
25
research are developed by the use of theory and qualitative research and the aim of the
research was to measure the relationship between the constructs the process of
measurement required use of scaled closed-ended questions. As most frequently used
scale in social sciences for qualitative research is Likert scale this scale was used in
the main section of the questionnaire. The questionnaire was design in 2 sections
composed of 37 questions. It started with introductory paragraph of the research
explaining to the respondents the aims and objectives of the research, persons and
institutions involved, instruction of answering and ethical issues of the questionnaire.
The content of the questionnaire was structured in two paragraphs. First content
paragraph of the questionnaire evaluating the success crucial influential factor was
composed of 23 question: 19 question on 5-points Likert scale (―Strongly disagree‖,
―Disagree‖, ―Neither agree nor disagree‖, ―Agree‖ and ―Strongly agree‖) and 4
questions on 10 point scale. Second content paragraph of the questionnaire measured
the grouping variables as: form of registration, size of business, gender, education,
geographic position, utilized capacity, employment and included other demographic
characteristics.
The list participants was composed of entities registered for rural tourism in the
national chamber of commerce registers, municipality registers, local web pages
information‘s, local tour operators and National Farmers Federation. The final list
included 268 enterprises and natural persons involved in rural tourism
accommodation sector. All sources for survey population evaluation indicated that
best possible way of contacting the respondents was by telephone because most of
them did not have access to Internet for Internet survey and the post is usually high
time consuming and the respond rate is low. Therefore as best possible choice it was
used telephone survey.
Pilot testing of the questionnaire was undertaken as a preface in order to test the
quality of the questionnaire, get additional independent, assess the content of the
questions and explore the structure of the questionnaire. With the use of piloting the
questionnaire was checked for redundancy, scalability, wording, meaning, flow and
timing. Pilot testing of the questionnaire is preformed with random sampling of ten
participants from the list of population. Additionally subject matter experts preformed
pilot testing in order to preform content validity of the constructs. All data and
26
suggestions gathered from pilot testing was evaluated and used in defining the final
version of the questionnaire.
All listed possible participants were contacted by telephone revealing that 23 listed
participants were out of work and 152 agreed to participate in research and answered
the questionnaire. The respondent rate was 62%, which was good respondent rate for
social sciences telephone survey.
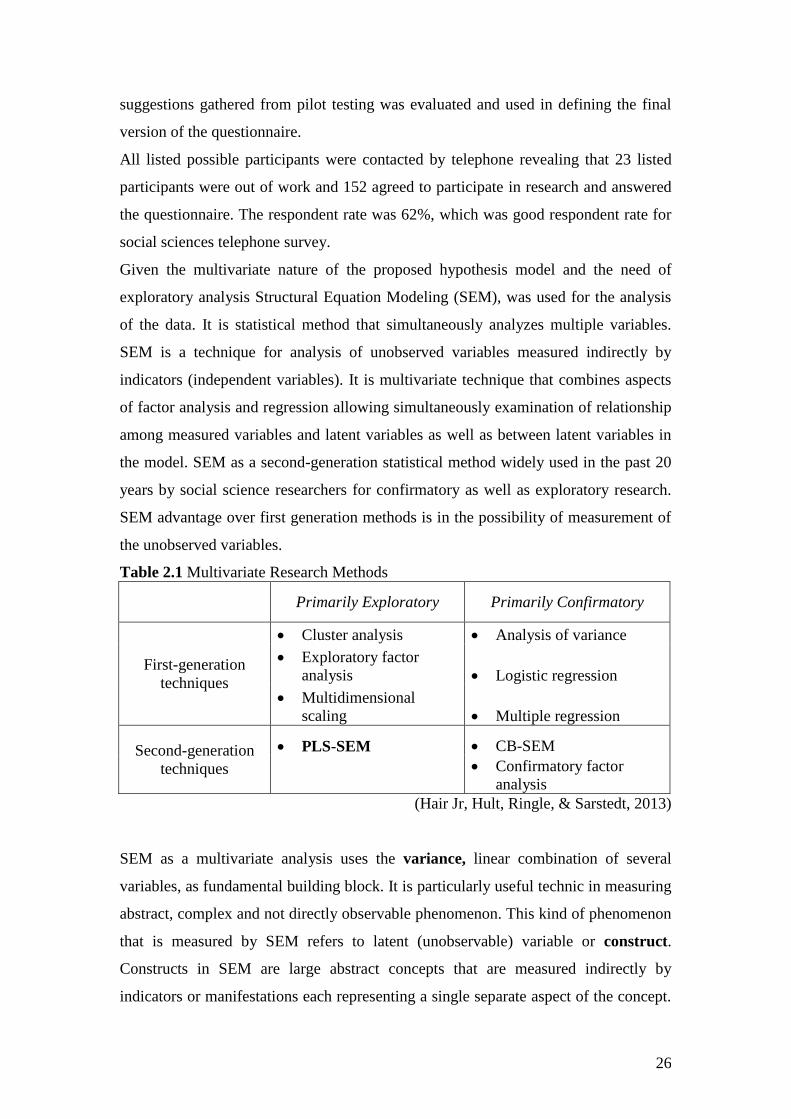
Given the multivariate nature of the proposed hypothesis model and the need of
exploratory analysis Structural Equation Modeling (SEM), was used for the analysis
of the data. It is statistical method that simultaneously analyzes multiple variables.
SEM is a technique for analysis of unobserved variables measured indirectly by
indicators (independent variables). It is multivariate technique that combines aspects
of factor analysis and regression allowing simultaneously examination of relationship
among measured variables and latent variables as well as between latent variables in
the model. SEM as a second-generation statistical method widely used in the past 20
years by social science researchers for confirmatory as well as exploratory research.
SEM advantage over first generation methods is in the possibility of measurement of
the unobserved variables.
Table 2.1 Multivariate Research Methods
Primarily Exploratory Primarily Confirmatory
First-generation
techniques
Cluster analysis Analysis of variance
Exploratory factor
analysis Logistic regression
Multidimensional
scaling Multiple regression
Second-generation
techniques
PLS-SEM CB-SEM
Confirmatory factor
analysis
(Hair Jr, Hult, Ringle, & Sarstedt, 2013)
SEM as a multivariate analysis uses the variance, linear combination of several
variables, as fundamental building block. It is particularly useful technic in measuring
abstract, complex and not directly observable phenomenon. This kind of phenomenon
that is measured by SEM refers to latent (unobservable) variable or construct.
Constructs in SEM are large abstract concepts that are measured indirectly by
indicators or manifestations each representing a single separate aspect of the concept.
27
In other words constructs in SEM are measured indirectly by combining several
items. Combining several item for measurement of the construct makes the measure
more accurate taking into account different aspects of the concept which reduces
measurement error.
There are two types of Structural Equation Modeling (SEM). Covariance-Based SEM
(CB-SEM) is primarily used for confirmatory theory analysis based on systematic
relationships between multiple variables that can be tested empirically. CB-SEM
determines how well the proposed theoretical model can estimate the covariance
matrix for a sample data set. The second type of SEM is Partial Least Squares SEM
(PLS-SEM) a method that is focusing on explaining the variance in the dependent
variables and by that primarily used for development of theories in exploratory
research. This type of SEM is more useful in situations where theory is less
developed. The variance based PLS-SEM algorithm was developed by Herman Wold
(1975; 1982; 1985) and later extended by Lohmoler (1989). Its statistical properties
are determent by OLS regression based estimation.
For the analysis of the data in this study PLS-SEM was used applying SmartPLS
3.1.6. SmartPLS 3 was chosen as much more advanced and sophisticated PLS-SEM
software than others on the market at the moment.
PLS-SEM generally achieves high levels of statistical power (renders specific
relationship significant when it is in fact significant in the population) with small
sample size although there are minimum requirements in sample size considering
different level of statistical power (Cohen 1992). PLS-SEM makes no distributional
assumptions and uses data that have normal and non-normal distributional properties.
The PLS-SEM measurement model generally requires metric data but also works well
with ordinal scales (Likert scale) and binary coded data (dummy variables) as ones
used in this research.
2.3.5. Methodological research limitation
The research is focused on specific geographic region referring to the country of
interest, Republic of Macedonia, and more niche economic sector, therefore it has
some general country related constraints and specific sector constraints.
28
As a general constraints to this research and any other research in Republic of
Macedonia is the scarcity of reliable and official statistical data. Last census
preformed by the State Statistical Office was in 2002 and the data from there forward
is estimated data. Therefore most of the secondary data used in the research is
estimated data however in order to overcome this problem the core of the research
uses primary data.
The previous research in the field of entrepreneurship, moreover in rural tourism
entrepreneurship in Republic of Macedonia, although small in size and range, is
lacking in systematic national database on previous research. Therefore there were
limitations collecting and tabulating all previous research in the field. However out of
the available and reviewed research for the time being the topic of this research
wasn‘t elaborated in none of the previous studies.
The implementation of life story interviews as a part of the qualitative research faced
limitations in terms of time and budgeting. Although considerable amount of
personal social capital of the researcher was used the persons that were interviewed
were still vary bashful and uncomfortable to discus personal data. Therefore the
period of interviewing sometimes lasted several days with long acquaintance between
the researcher and the respondent.
And last in the part of the qualitative research there were questions in the
questionnaire that even in the preface and piloting were considered as sensitive
nature. These were the questions linked to the income analysis and as expected the
income values were with extended amount of missing data and therefore were not
incorporated in the analysis.

29
30
3. RURAL TOURISM AND RURAL DEVELOPMENT – INSTITUTIONAL FRAMEWORK IN THE EU AND THE REPUBLIC
OF MACEDONIA
3.1. European Union Rural Development Policy and enlargement process
3.1.1. Defi i g ‘ urality’ in the EU context
Diversity is EU‘s great resource, especially in rural areas. The EU rural areas
are diverse in many aspects: physical, socio-economic, environmental and
institutional. Nevertheless this diversity creates great challenges for the EU authorities
to accurately define rural areas across the EU (ENRD TWG 1, 2010b).
The starting point in defining rural areas in the EU context has been to
characterize rural areas in accordance to the Organization for Economic Co-operation
and Development (OECD), which is the only internationally recognized definition.
The OECD (2006) regional typology classified regions in three categories: (1)
predominantly urban, (2) predominantly rural and (3) intermediate. This was done by
using three criteria and two-step approach (ENRD TWG 1, 2010a):
(A) First step is identification of municipalities as rural:
1. Population density. A community is defined as rural if its population
density is below 150 inhabitants per km2 (500 inhabitants for Japan due to
the national density which is above 300 inhabitants per km2)
(B) Second step is identification of the regions on NUTS3 and NUTS4 level:
2. Regions by % population in rural communities. A region is classified
as predominantly rural if more than 50% of its population lives in rural
communities, predominantly urban if less than 15% of the population
lives in rural communities, and intermediate if the share of the population
living in rural communities is between 15% and 50%.
3. Urban centers. A region that would be classified as rural on the basis of
the general rule is classified as intermediate if it has an urban center of
more than 200,000 inhabitants representing no less than 25% of the
regional population. A region that would be classified as intermediate on
the basis of the general rule is classified as predominantly urban if it has
31
an urban center of more than 500,000 inhabitants representing no less than
25% of the regional population.
The OECD definition of rural areas in the early process of defining ―rurality‖ in
the EU was only taken up by a minority of national and regional Rural Development
Programs of Member States during the period 2007-2013 (ENRD TWG 1, 2010b).
Member States (MS) or regions were free to modify the OECD definition or to adopt
their own definition, which was the case for many MS. This was justified in regard to
the limited ability of the OECD definition to describe the socio-geographical needs of
the country or regional diversity and the desire for a more relevant national distinction
between rural and urban areas in the accurate use of policy tools for specific area
needs (ENRD TWG 1, 2010b).
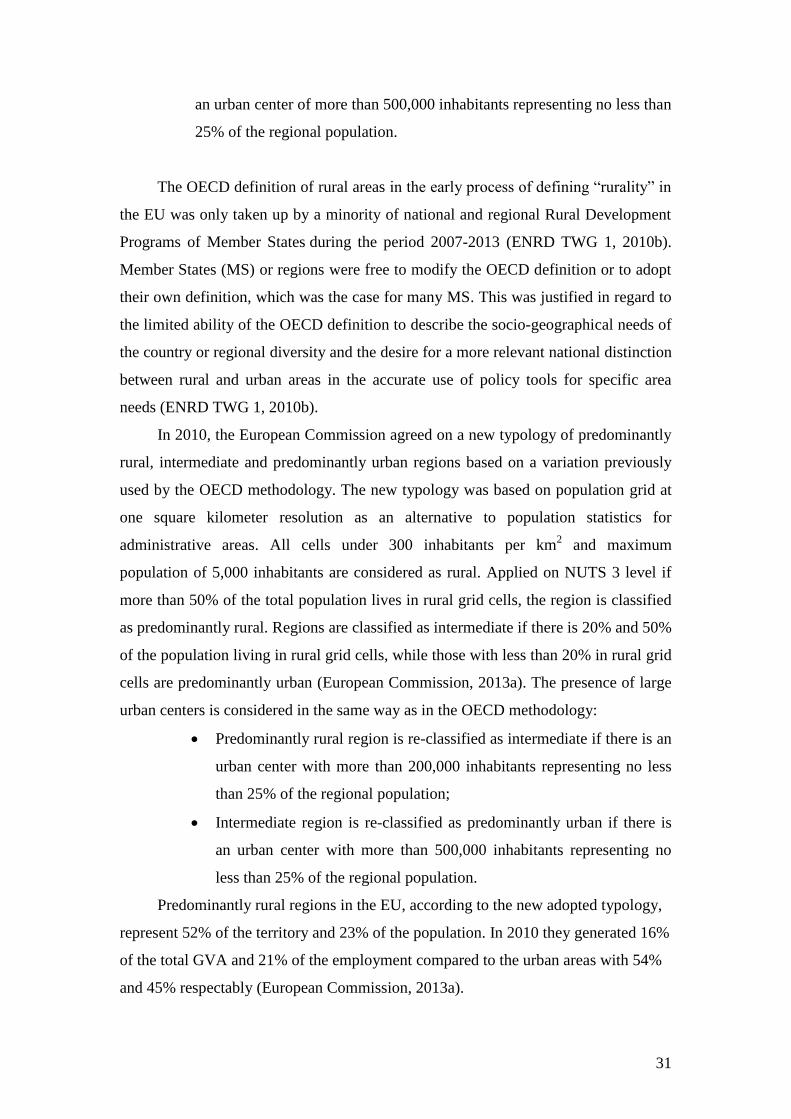
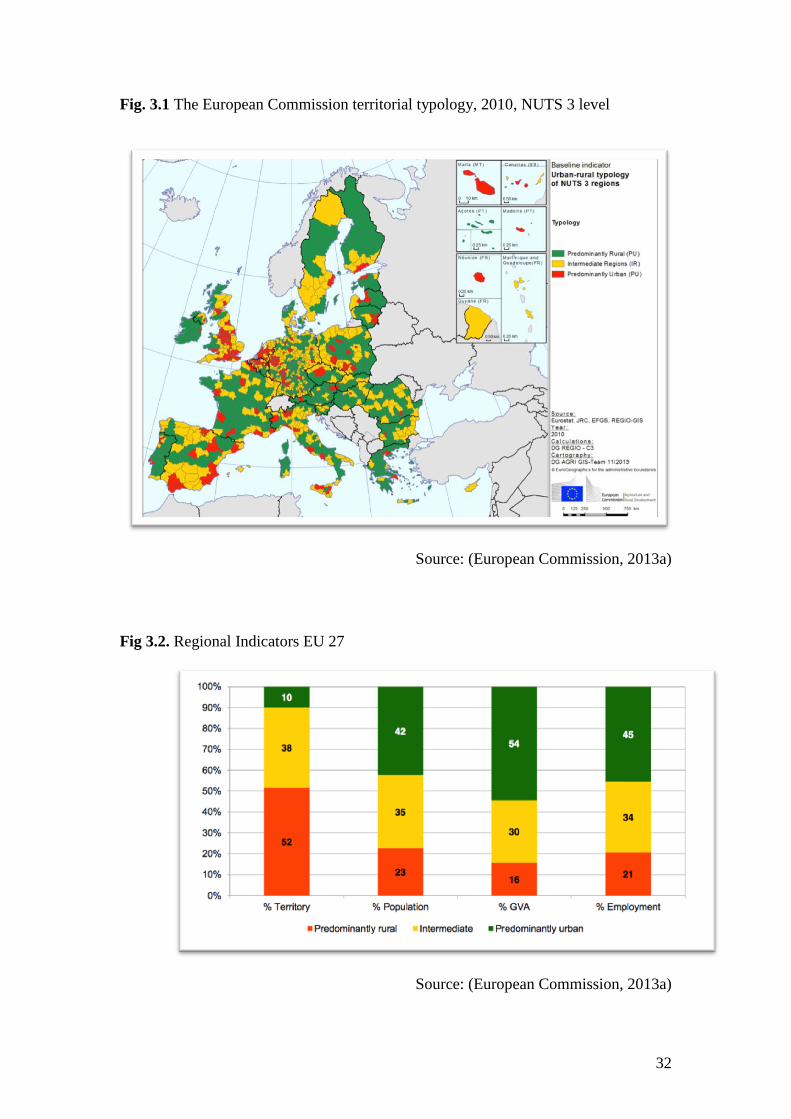
In 2010, the European Commission agreed on a new typology of predominantly
rural, intermediate and predominantly urban regions based on a variation previously
used by the OECD methodology. The new typology was based on population grid at
one square kilometer resolution as an alternative to population statistics for
administrative areas. All cells under 300 inhabitants per km2 and maximum
population of 5,000 inhabitants are considered as rural. Applied on NUTS 3 level if
more than 50% of the total population lives in rural grid cells, the region is classified
as predominantly rural. Regions are classified as intermediate if there is 20% and 50%
of the population living in rural grid cells, while those with less than 20% in rural grid
cells are predominantly urban (European Commission, 2013a). The presence of large
urban centers is considered in the same way as in the OECD methodology:
Predominantly rural region is re-classified as intermediate if there is an
urban center with more than 200,000 inhabitants representing no less
than 25% of the regional population;
Intermediate region is re-classified as predominantly urban if there is
an urban center with more than 500,000 inhabitants representing no
less than 25% of the regional population.
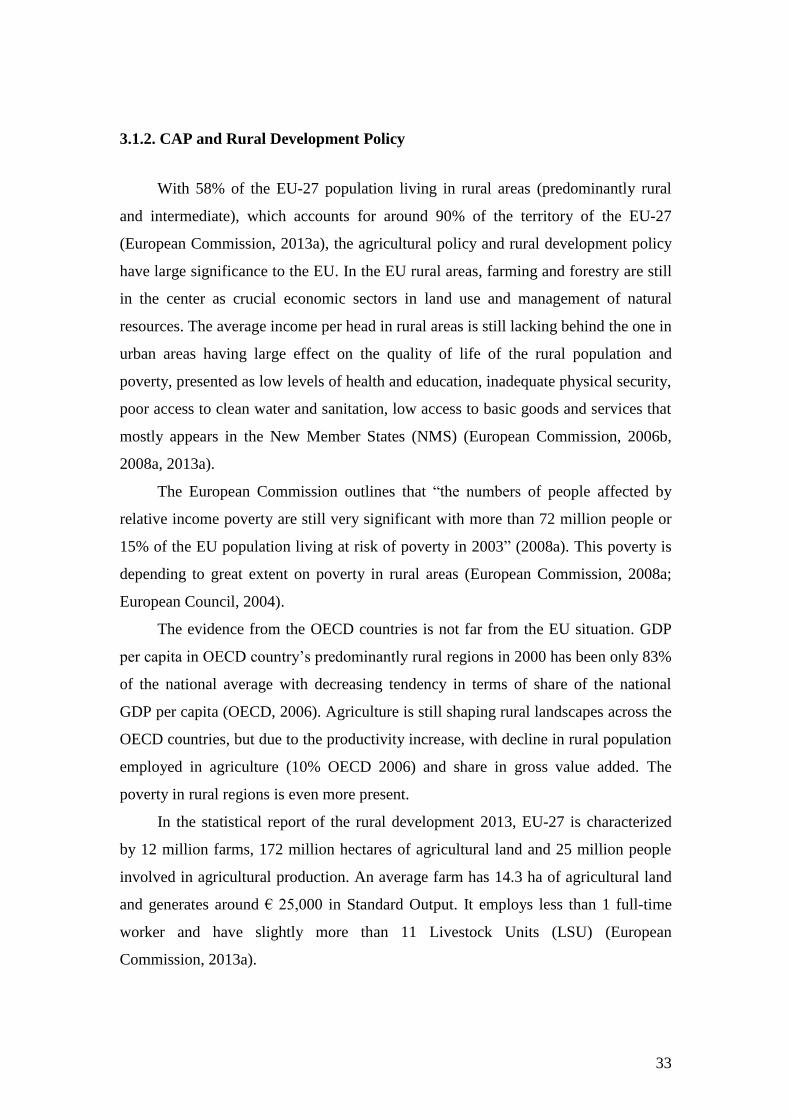
Predominantly rural regions in the EU, according to the new adopted typology,
represent 52% of the territory and 23% of the population. In 2010 they generated 16%
of the total GVA and 21% of the employment compared to the urban areas with 54%
and 45% respectably (European Commission, 2013a).
32
Fig. 3.1 The European Commission territorial typology, 2010, NUTS 3 level
Source: (European Commission, 2013a)
Fig 3.2. Regional Indicators EU 27
Source: (European Commission, 2013a)
33
3.1.2. CAP and Rural Development Policy
With 58% of the EU-27 population living in rural areas (predominantly rural
and intermediate), which accounts for around 90% of the territory of the EU-27
(European Commission, 2013a), the agricultural policy and rural development policy
have large significance to the EU. In the EU rural areas, farming and forestry are still
in the center as crucial economic sectors in land use and management of natural
resources. The average income per head in rural areas is still lacking behind the one in
urban areas having large effect on the quality of life of the rural population and
poverty, presented as low levels of health and education, inadequate physical security,
poor access to clean water and sanitation, low access to basic goods and services that
mostly appears in the New Member States (NMS) (European Commission, 2006b,
2008a, 2013a).
The European Commission outlines that ―the numbers of people affected by
relative income poverty are still very significant with more than 72 million people or
15% of the EU population living at risk of poverty in 2003‖ (2008a). This poverty is
depending to great extent on poverty in rural areas (European Commission, 2008a;
European Council, 2004).
The evidence from the OECD countries is not far from the EU situation. GDP
per capita in OECD country‘s predominantly rural regions in 2000 has been only 83%
of the national average with decreasing tendency in terms of share of the national
GDP per capita (OECD, 2006). Agriculture is still shaping rural landscapes across the
OECD countries, but due to the productivity increase, with decline in rural population
employed in agriculture (10% OECD 2006) and share in gross value added. The
poverty in rural regions is even more present.
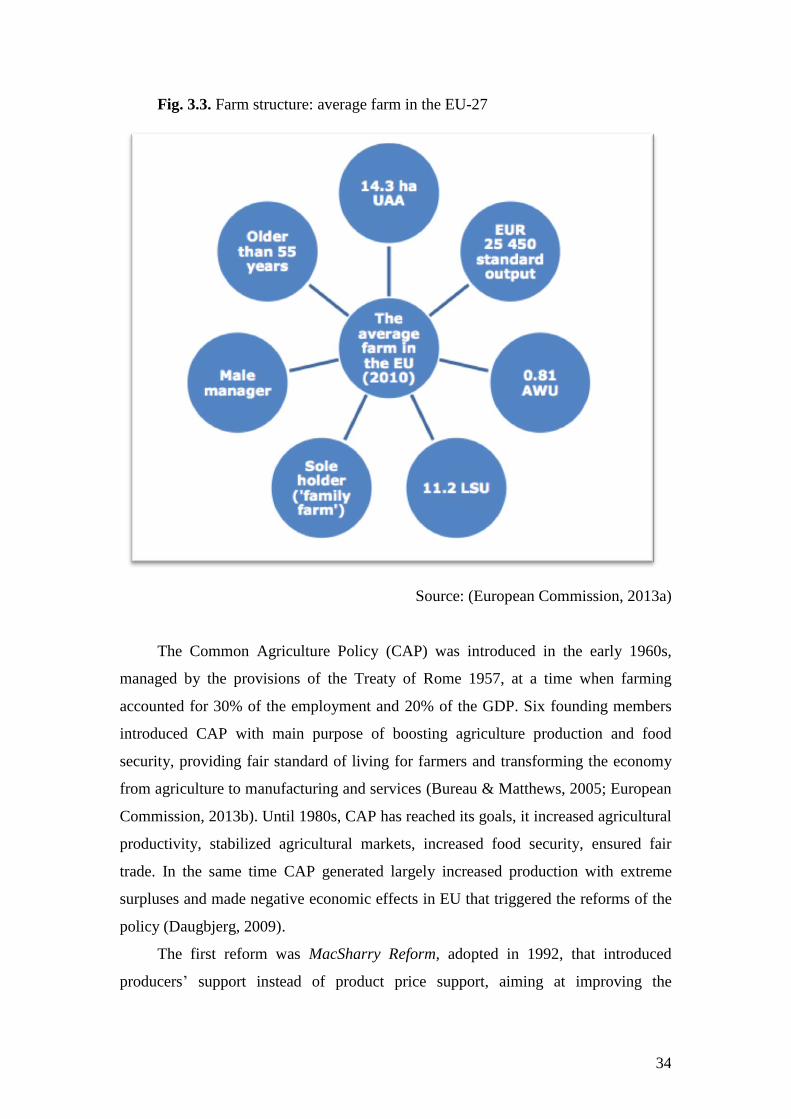
In the statistical report of the rural development 2013, EU-27 is characterized
by 12 million farms, 172 million hectares of agricultural land and 25 million people
involved in agricultural production. An average farm has 14.3 ha of agricultural land
and generates around € 25,000 in Standard Output. It employs less than 1 full-time
worker and have slightly more than 11 Livestock Units (LSU) (European
Commission, 2013a).
34
Fig. 3.3. Farm structure: average farm in the EU-27
Source: (European Commission, 2013a)
The Common Agriculture Policy (CAP) was introduced in the early 1960s,
managed by the provisions of the Treaty of Rome 1957, at a time when farming
accounted for 30% of the employment and 20% of the GDP. Six founding members
introduced CAP with main purpose of boosting agriculture production and food
security, providing fair standard of living for farmers and transforming the economy
from agriculture to manufacturing and services (Bureau & Matthews, 2005; European
Commission, 2013b). Until 1980s, CAP has reached its goals, it increased agricultural
productivity, stabilized agricultural markets, increased food security, ensured fair
trade. In the same time CAP generated largely increased production with extreme
surpluses and made negative economic effects in EU that triggered the reforms of the
policy (Daugbjerg, 2009).
The first reform was MacSharry Reform, adopted in 1992, that introduced
producers‘ support instead of product price support, aiming at improving the
35
competitiveness and stabilizing the market of agricultural products (Daugbjerg, 2009;
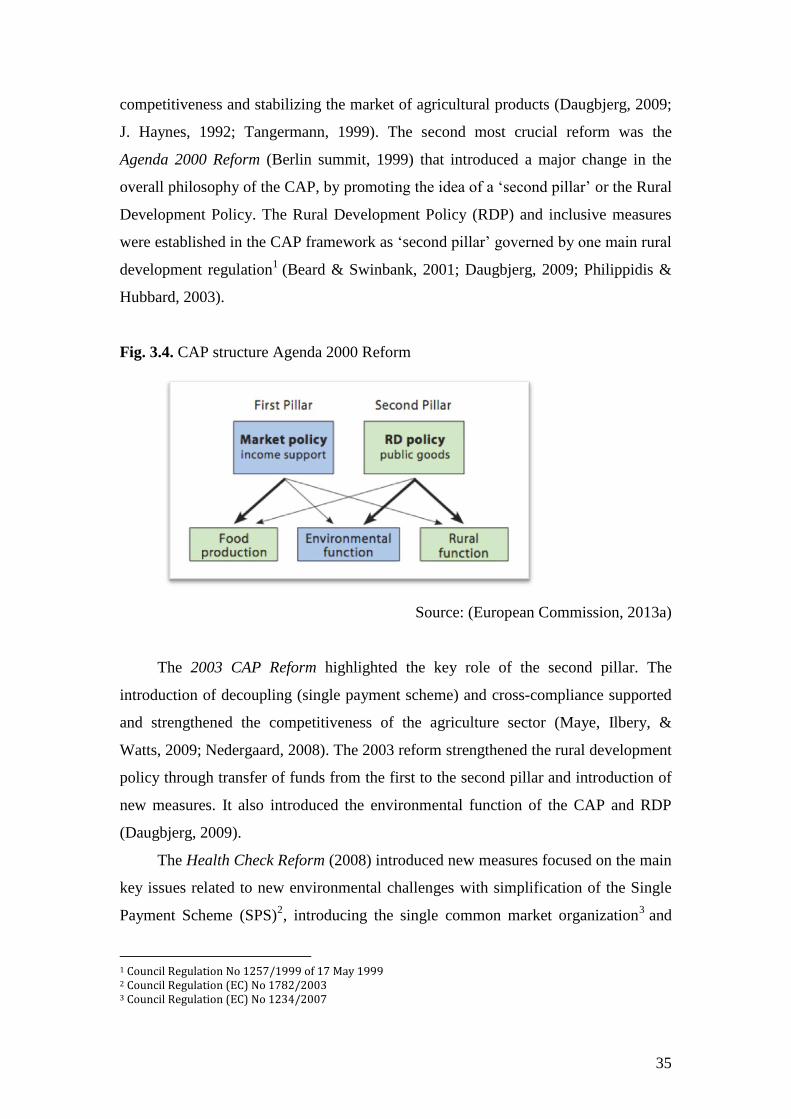
J. Haynes, 1992; Tangermann, 1999). The second most crucial reform was the
Agenda 2000 Reform (Berlin summit, 1999) that introduced a major change in the
overall philosophy of the CAP, by promoting the idea of a ‗second pillar‘ or the Rural
Development Policy. The Rural Development Policy (RDP) and inclusive measures
were established in the CAP framework as ‗second pillar‘ governed by one main rural
development regulation1 (Beard & Swinbank, 2001; Daugbjerg, 2009; Philippidis &
Hubbard, 2003).
Fig. 3.4. CAP structure Agenda 2000 Reform
Source: (European Commission, 2013a)
The 2003 CAP Reform highlighted the key role of the second pillar. The
introduction of decoupling (single payment scheme) and cross-compliance supported
and strengthened the competitiveness of the agriculture sector (Maye, Ilbery, &
Watts, 2009; Nedergaard, 2008). The 2003 reform strengthened the rural development
policy through transfer of funds from the first to the second pillar and introduction of
new measures. It also introduced the environmental function of the CAP and RDP
(Daugbjerg, 2009).
The Health Check Reform (2008) introduced new measures focused on the main
key issues related to new environmental challenges with simplification of the Single
Payment Scheme (SPS)2, introducing the single common market organization
3 and
1 Council Regulation No 1257/1999 of 17 May 1999 2 Council Regulation (EC) No 1782/2003 3 Council Regulation (EC) No 1234/2007
36
reform of the RDP that resulted in adoption of the Rural Development Programme
2007-20134
(Daugbjerg & Swinbank, 2011; Moss, Binfield, Patton, Zhang, &
Westhoff, 2008)
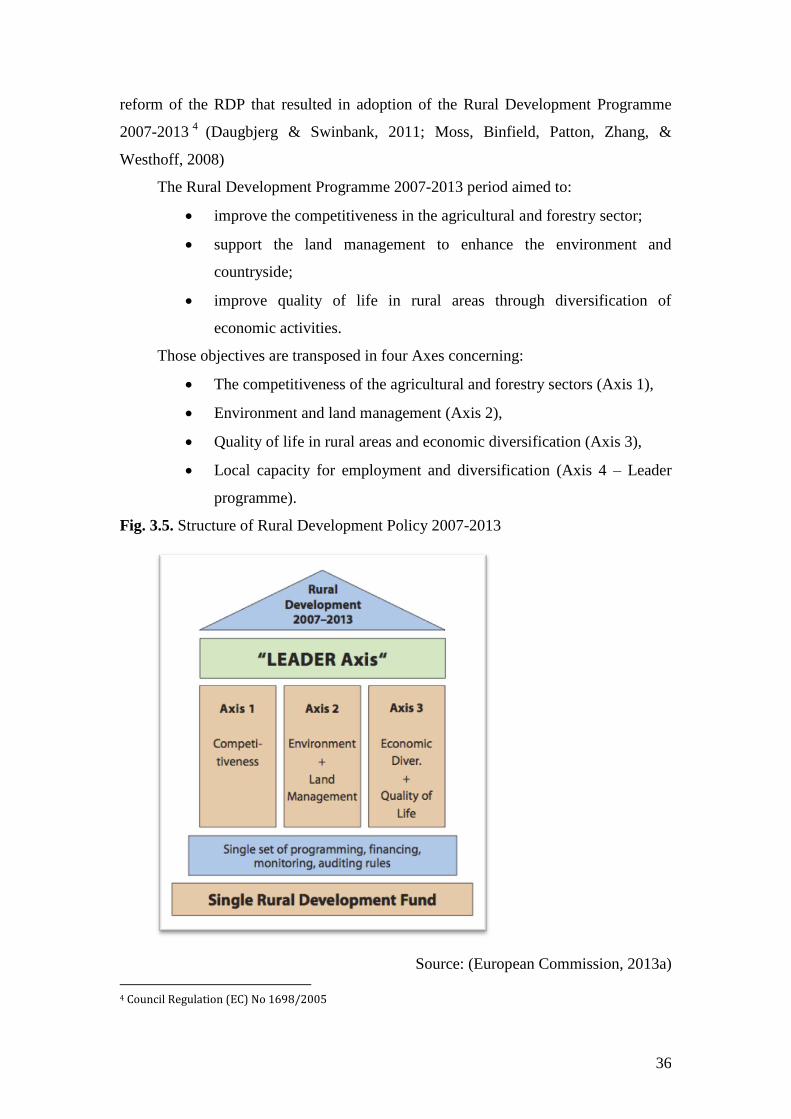
The Rural Development Programme 2007-2013 period aimed to:
improve the competitiveness in the agricultural and forestry sector;
support the land management to enhance the environment and
countryside;
improve quality of life in rural areas through diversification of
economic activities.
Those objectives are transposed in four Axes concerning:
The competitiveness of the agricultural and forestry sectors (Axis 1),
Environment and land management (Axis 2),
Quality of life in rural areas and economic diversification (Axis 3),
Local capacity for employment and diversification (Axis 4 – Leader
programme).
Fig. 3.5. Structure of Rural Development Policy 2007-2013
Source: (European Commission, 2013a)
4 Council Regulation (EC) No 1698/2005
37
The measures in RDP led to investment in physical and human capital,
preservation and development of high nature value, balanced access to productive
assets, markets and services, and more participatory and accountable institutions
(Bradley, Dwyer, & Hill, 2010; Mihalache, 2013; Peters & Gregory, 2014; Sadowski
& Czubak, 2013). National and regional strategies had to be structured in accordance
to the RDP 2007-13 and approved by the European Commission (EC). Moreover, the
rule of complementarity between Community instruments had to be fulfilled. MS
should have ensured complementarity and coherence between structural, employment
and rural development policy (European Regional development Fund, Cohesion Fund,
Social Fund, European Fisheries Fund and EAFRD). Nevertheless, to guarantee
balanced strategy reflecting the main objectives, the EC fixed a minimum funding for
each thematic axis: 10% - Axis 1 and Axis 3; 25% - Axis 2; 5% - Axis 4. As a result
to the low minimum percentages, each Member State could have highlight the priority
Axis that it considered the most relevant fitting to the country situation (ENRD TWG
1, 2010b; European Commission, 2006b).
In the process of the preparation of the national programs each Member State
had to consider six strategic guidelines:
1. Improving the competitiveness of the agricultural and forestry sectors.
2. Improving the environment and countryside.
3. Improving the quality of life in rural areas and encouraging diversification.
4. Building local capacity for employment and diversification.
5. Translating priorities into programs.
6. Complementarity between Community instruments
(European Commission, 2006b).
The RDP and the Axis are composed of set of measures as described in Table 3.1.
38
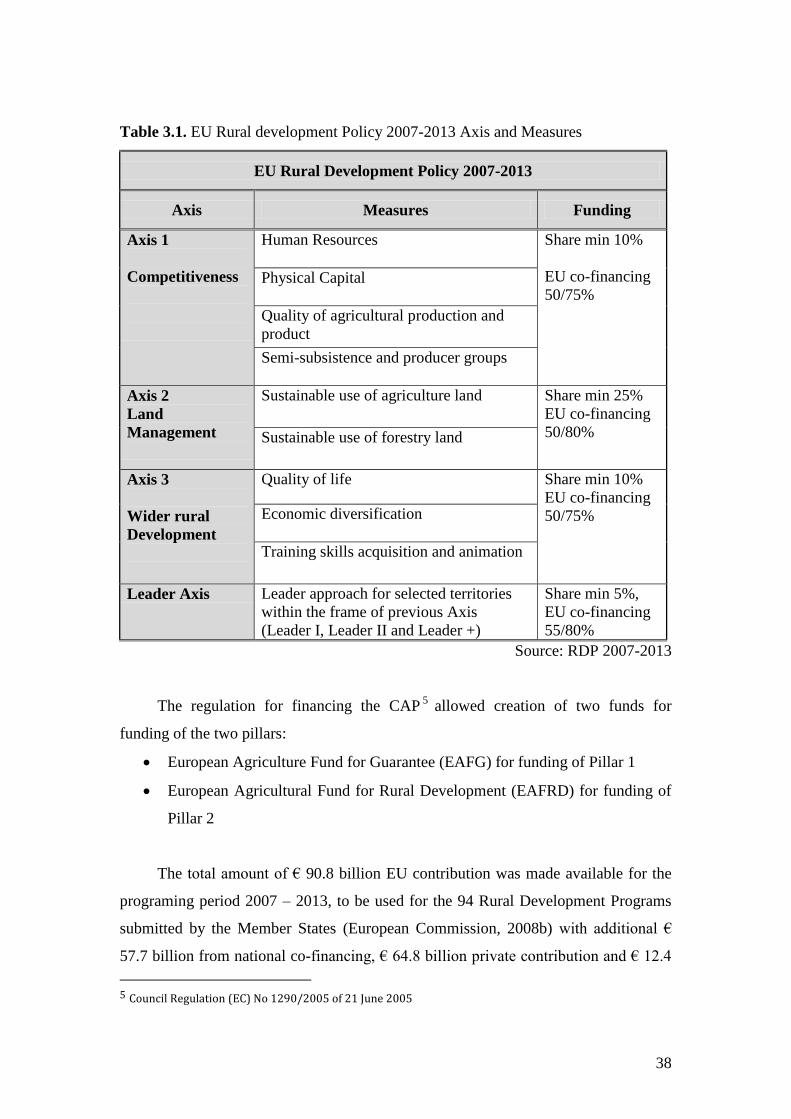
Table 3.1. EU Rural development Policy 2007-2013 Axis and Measures
EU Rural Development Policy 2007-2013
Axis Measures Funding
Axis 1
Competitiveness
Human Resources Share min 10%
EU co-financing
50/75%
Physical Capital
Quality of agricultural production and
product
Semi-subsistence and producer groups
Axis 2
Land
Management
Sustainable use of agriculture land Share min 25%
EU co-financing
50/80%
Sustainable use of forestry land
Axis 3
Wider rural
Development
Quality of life Share min 10%
EU co-financing
50/75%
Economic diversification
Training skills acquisition and animation
Leader Axis Leader approach for selected territories
within the frame of previous Axis
(Leader I, Leader II and Leader +)
Share min 5%,
EU co-financing
55/80%
Source: RDP 2007-2013
The regulation for financing the CAP5 allowed creation of two funds for
funding of the two pillars:
European Agriculture Fund for Guarantee (EAFG) for funding of Pillar 1
European Agricultural Fund for Rural Development (EAFRD) for funding of
Pillar 2
The total amount of € 90.8 billion EU contribution was made available for the
programing period 2007 – 2013, to be used for the 94 Rural Development Programs
submitted by the Member States (European Commission, 2008b) with additional €
57.7 billion from national co-financing, € 64.8 billion private contribution and € 12.4
5 Council Regulation (EC) No 1290/2005 of 21 June 2005
39
billion national top-ups ending with a total of € 225.7 billion. Most Member States
submitted a single national RDP while Belgium submitted 2 RDPs, Germany 14
RDPs, Spain 17 RDPs, Italy 21 RDPs and the United Kingdom submitted 4 RDPs.
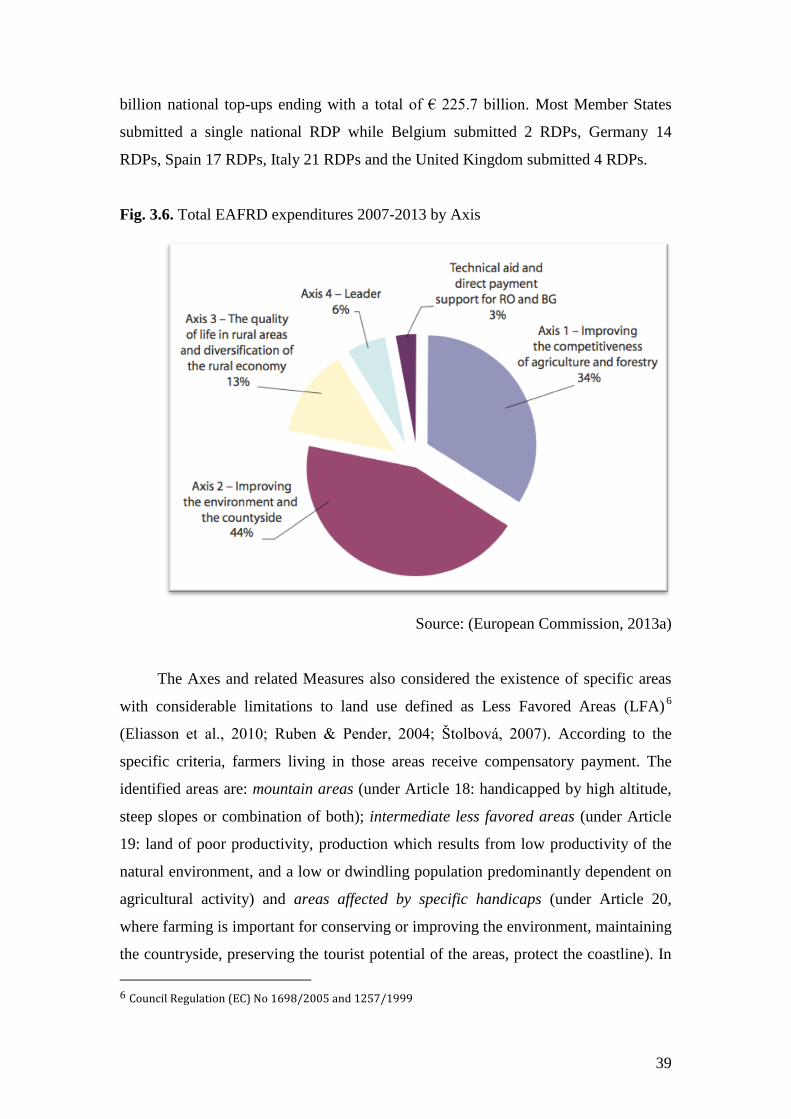
Fig. 3.6. Total EAFRD expenditures 2007-2013 by Axis
Source: (European Commission, 2013a)
The Axes and related Measures also considered the existence of specific areas
with considerable limitations to land use defined as Less Favored Areas (LFA)6
(Eliasson et al., 2010; Ruben & Pender, 2004; Štolbová, 2007). According to the
specific criteria, farmers living in those areas receive compensatory payment. The
identified areas are: mountain areas (under Article 18: handicapped by high altitude,
steep slopes or combination of both); intermediate less favored areas (under Article
19: land of poor productivity, production which results from low productivity of the
natural environment, and a low or dwindling population predominantly dependent on
agricultural activity) and areas affected by specific handicaps (under Article 20,
where farming is important for conserving or improving the environment, maintaining
the countryside, preserving the tourist potential of the areas, protect the coastline). In
6 Council Regulation (EC) No 1698/2005 and 1257/1999

40
the EU-27, more than half of the total Utilized Agriculture Area (54%) has been
classified as LFA. The highest share concerns LFA‘s under Article 19 and 20 (34%),
followed by mountain LFA (16%).
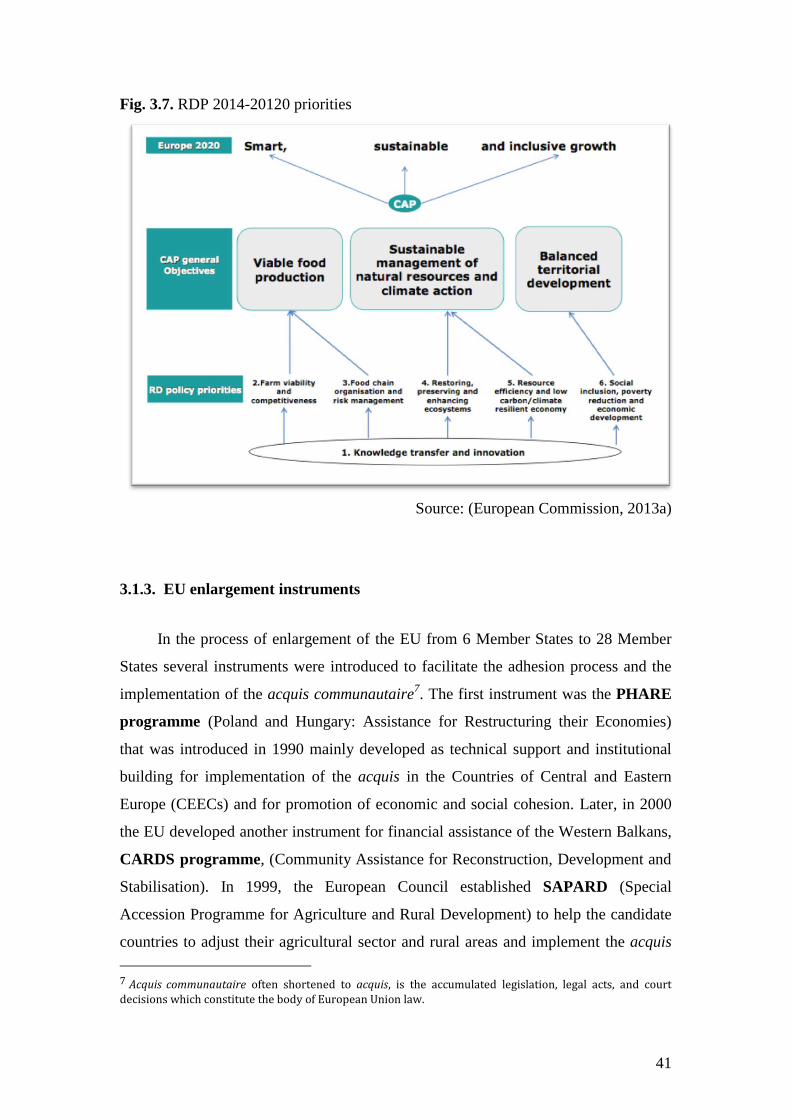
The Rural Development Policy 2014-2020 was adopted in late 2013. In the
new RDP the general concept of the policy remains the same as previous but as a
replacement of the Axis and minimum spending per axis, member states can decide
on their own concerning the measures (17 measures plus LEADER) that will use in
the National Rural Development Programs in order to achieve targets set against six
broad "priorities" and their more detailed "focus areas" (sub-priorities) as follows:
1. Fostering knowledge transfer and innovation in agriculture, forestry, and
rural areas
2. Enhancing farm viability and competitiveness of all types of agriculture in
all regions and promoting innovative farm technologies and sustainable
management of forests
3. Promoting food chain organization, including processing and marketing of
agricultural products, animal welfare and risk management in agriculture
4. Restoring, preserving and enhancing ecosystems related to agriculture and
forestry
5. Promoting resource efficiency and supporting the shift towards a low
carbon and climate resilient economy in agriculture, food and forestry
sectors
6. Promoting social inclusion poverty reduction and economic development
in rural areas
41
Fig. 3.7. RDP 2014-20120 priorities
Source: (European Commission, 2013a)
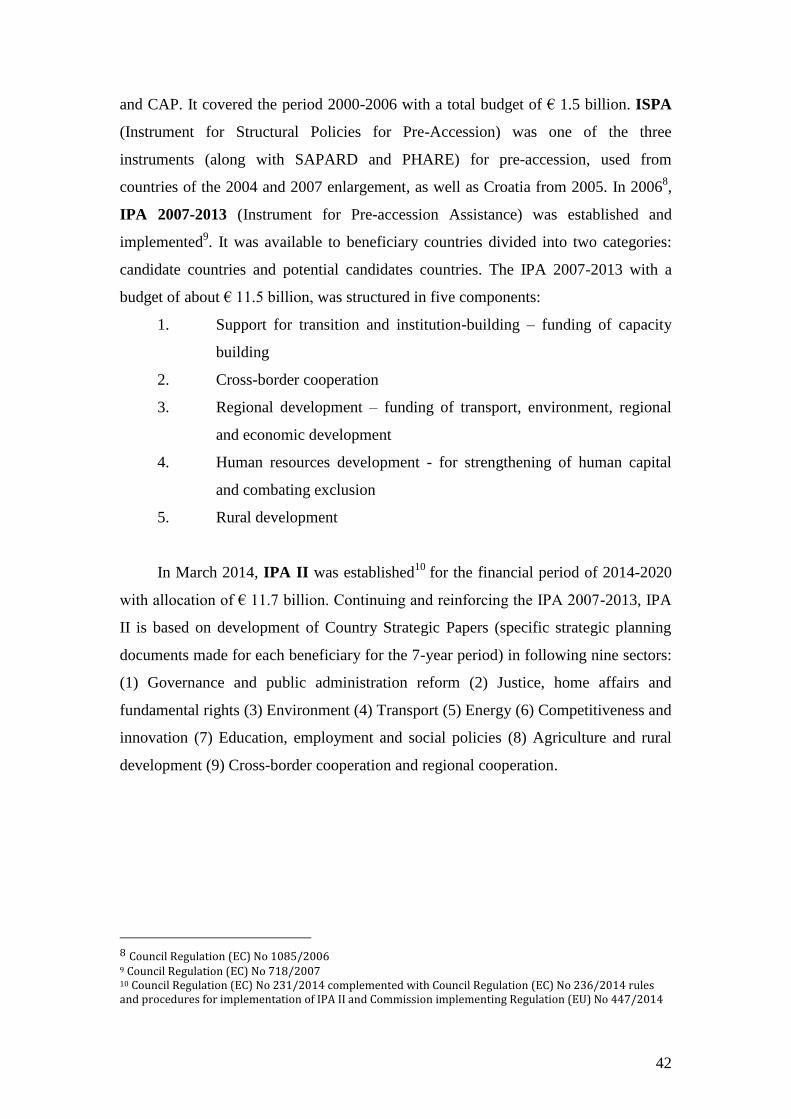
3.1.3. EU enlargement instruments
In the process of enlargement of the EU from 6 Member States to 28 Member
States several instruments were introduced to facilitate the adhesion process and the
implementation of the acquis communautaire7. The first instrument was the PHARE
programme (Poland and Hungary: Assistance for Restructuring their Economies)
that was introduced in 1990 mainly developed as technical support and institutional
building for implementation of the acquis in the Countries of Central and Eastern
Europe (CEECs) and for promotion of economic and social cohesion. Later, in 2000
the EU developed another instrument for financial assistance of the Western Balkans,
CARDS programme, (Community Assistance for Reconstruction, Development and
Stabilisation). In 1999, the European Council established SAPARD (Special
Accession Programme for Agriculture and Rural Development) to help the candidate
countries to adjust their agricultural sector and rural areas and implement the acquis
7 Acquis communautaire often shortened to acquis, is the accumulated legislation, legal acts, and court decisions which constitute the body of European Union law.
42
and CAP. It covered the period 2000-2006 with a total budget of € 1.5 billion. ISPA
(Instrument for Structural Policies for Pre-Accession) was one of the three
instruments (along with SAPARD and PHARE) for pre-accession, used from
countries of the 2004 and 2007 enlargement, as well as Croatia from 2005. In 20068,
IPA 2007-2013 (Instrument for Pre-accession Assistance) was established and
implemented9. It was available to beneficiary countries divided into two categories:
candidate countries and potential candidates countries. The IPA 2007-2013 with a
budget of about € 11.5 billion, was structured in five components:
1. Support for transition and institution-building – funding of capacity
building
2. Cross-border cooperation
3. Regional development – funding of transport, environment, regional
and economic development
4. Human resources development - for strengthening of human capital
and combating exclusion
5. Rural development
In March 2014, IPA II was established10
for the financial period of 2014-2020
with allocation of € 11.7 billion. Continuing and reinforcing the IPA 2007-2013, IPA
II is based on development of Country Strategic Papers (specific strategic planning
documents made for each beneficiary for the 7-year period) in following nine sectors:
(1) Governance and public administration reform (2) Justice, home affairs and
fundamental rights (3) Environment (4) Transport (5) Energy (6) Competitiveness and
innovation (7) Education, employment and social policies (8) Agriculture and rural
development (9) Cross-border cooperation and regional cooperation.
8 Council Regulation (EC) No 1085/2006 9 Council Regulation (EC) No 718/2007 10 Council Regulation (EC) No 231/2014 complemented with Council Regulation (EC) No 236/2014 rules and procedures for implementation of IPA II and Commission implementing Regulation (EU) No 447/2014
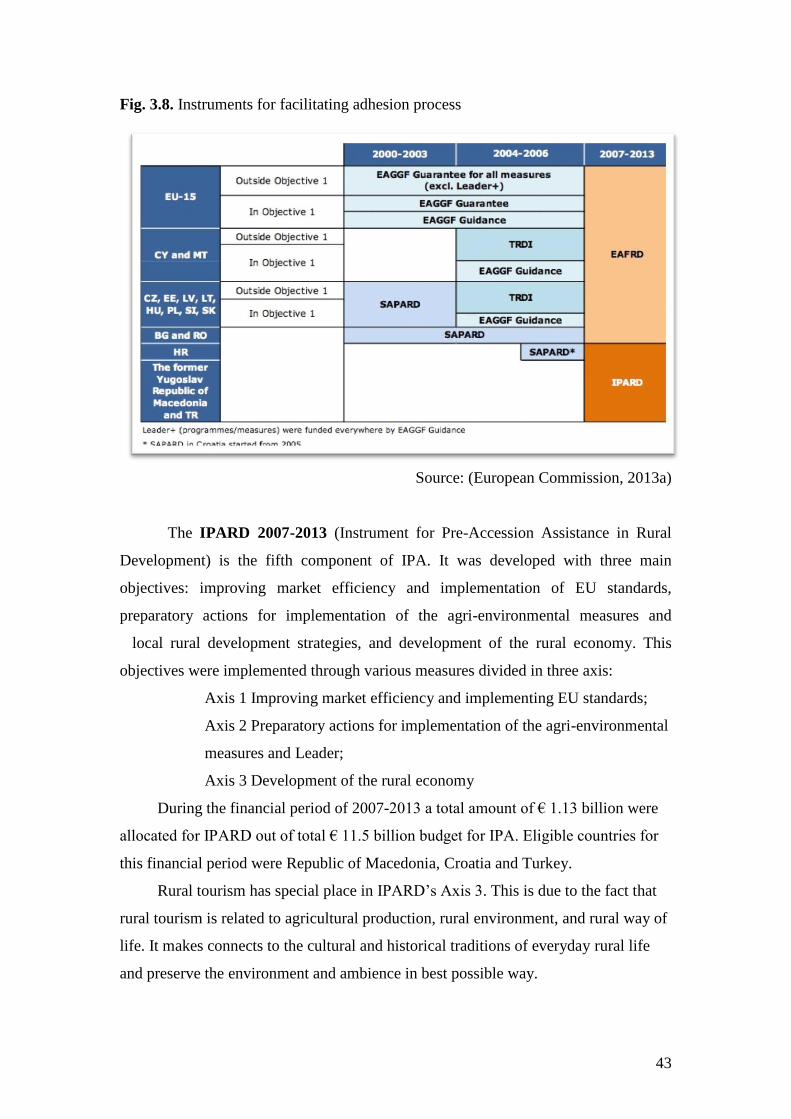
43
Fig. 3.8. Instruments for facilitating adhesion process
Source: (European Commission, 2013a)
The IPARD 2007-2013 (Instrument for Pre-Accession Assistance in Rural
Development) is the fifth component of IPA. It was developed with three main
objectives: improving market efficiency and implementation of EU standards,
preparatory actions for implementation of the agri-environmental measures and
local rural development strategies, and development of the rural economy. This
objectives were implemented through various measures divided in three axis:
Axis 1 Improving market efficiency and implementing EU standards;
Axis 2 Preparatory actions for implementation of the agri-environmental
measures and Leader;
Axis 3 Development of the rural economy
During the financial period of 2007-2013 a total amount of € 1.13 billion were
allocated for IPARD out of total € 11.5 billion budget for IPA. Eligible countries for
this financial period were Republic of Macedonia, Croatia and Turkey.
Rural tourism has special place in IPARD‘s Axis 3. This is due to the fact that
rural tourism is related to agricultural production, rural environment, and rural way of
life. It makes connects to the cultural and historical traditions of everyday rural life
and preserve the environment and ambience in best possible way.
44
Fig. 3.9. IPARD allocation of funds by measures
Source: (European Commission, 2013a)
3.2. Tourism in European perspective
3.2.1. Tourism as part of EU economy and policy
Tourism has an important role in many countries‘ economies. In the OECD
countries, tourism accounts for 4.7% of GDP; 6% of employment; and 21% of exports
of services (OECD, 2014). In the EU, as a number one tourist destination accounting
for over half of all international tourist arrivals worldwide in 2011 (European Union,
2013), tourism has a significant impact on many member states‘ economic
development. According to the EC (2013c) and the use of Tourism Satellite Accounts
(TSA) indicators in 17 Member State countries that account for close to 90% of
tourism activity in Europe, tourism generates more then 10 million jobs (12
countries available data) (Eurostat estimation 17 million jobs) and 3.9% GVA
generating 10% of the EU GDP with 2.44 billion nights spent in 2011 of which
57.3% were by domestic tourists (European Union, 2013).
It is well known that tourism has interdisciplinary structure and creates linkages
with other sectors and fields as education, youth, culture, environment etc. (Darbellay
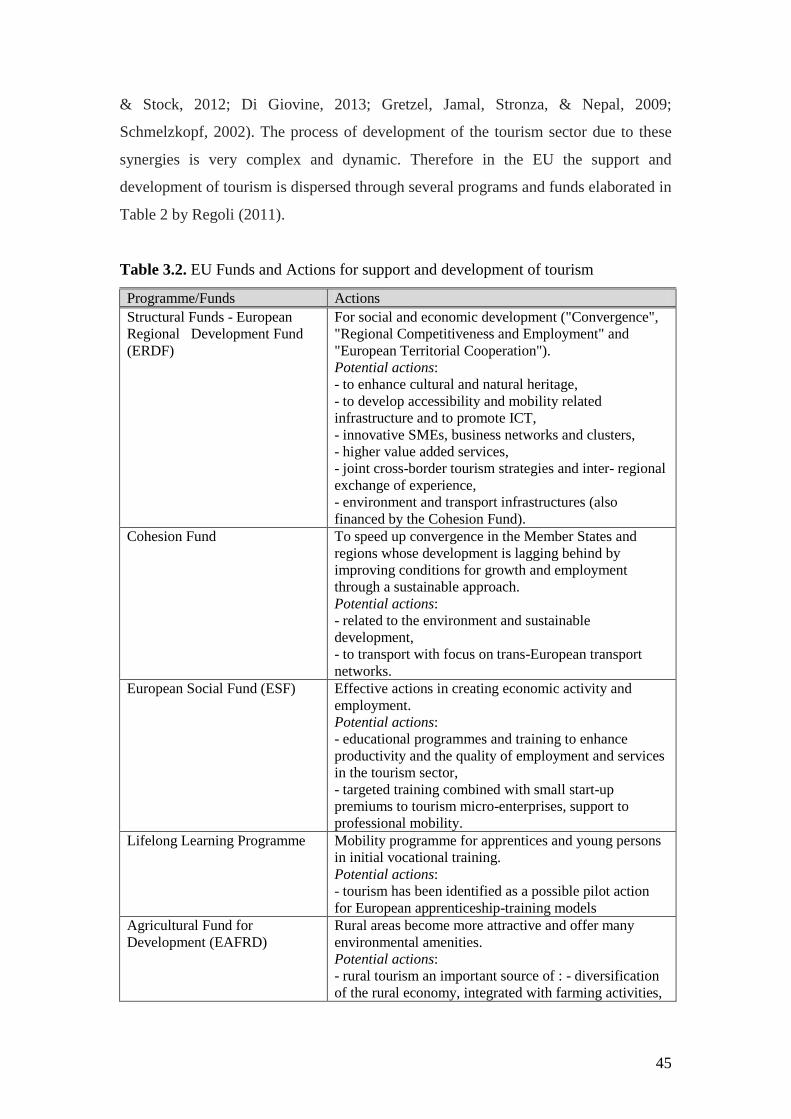
45
& Stock, 2012; Di Giovine, 2013; Gretzel, Jamal, Stronza, & Nepal, 2009;
Schmelzkopf, 2002). The process of development of the tourism sector due to these
synergies is very complex and dynamic. Therefore in the EU the support and
development of tourism is dispersed through several programs and funds elaborated in
Table 2 by Regoli (2011).
Table 3.2. EU Funds and Actions for support and development of tourism
Programme/Funds Actions
Structural Funds - European
Regional Development Fund
(ERDF)
For social and economic development ("Convergence",
"Regional Competitiveness and Employment" and
"European Territorial Cooperation").
Potential actions:
- to enhance cultural and natural heritage,
- to develop accessibility and mobility related
infrastructure and to promote ICT,
- innovative SMEs, business networks and clusters,
- higher value added services,
- joint cross-border tourism strategies and inter- regional
exchange of experience,
- environment and transport infrastructures (also
financed by the Cohesion Fund).
Cohesion Fund To speed up convergence in the Member States and
regions whose development is lagging behind by
improving conditions for growth and employment
through a sustainable approach.
Potential actions:
- related to the environment and sustainable
development,
- to transport with focus on trans-European transport
networks.
European Social Fund (ESF) Effective actions in creating economic activity and
employment.
Potential actions:
- educational programmes and training to enhance
productivity and the quality of employment and services
in the tourism sector,
- targeted training combined with small start-up
premiums to tourism micro-enterprises, support to
professional mobility.
Lifelong Learning Programme Mobility programme for apprentices and young persons
in initial vocational training.
Potential actions:
- tourism has been identified as a possible pilot action
for European apprenticeship-training models
Agricultural Fund for
Development (EAFRD)
Rural areas become more attractive and offer many
environmental amenities.
Potential actions:
- rural tourism an important source of : - diversification
of the rural economy, integrated with farming activities,
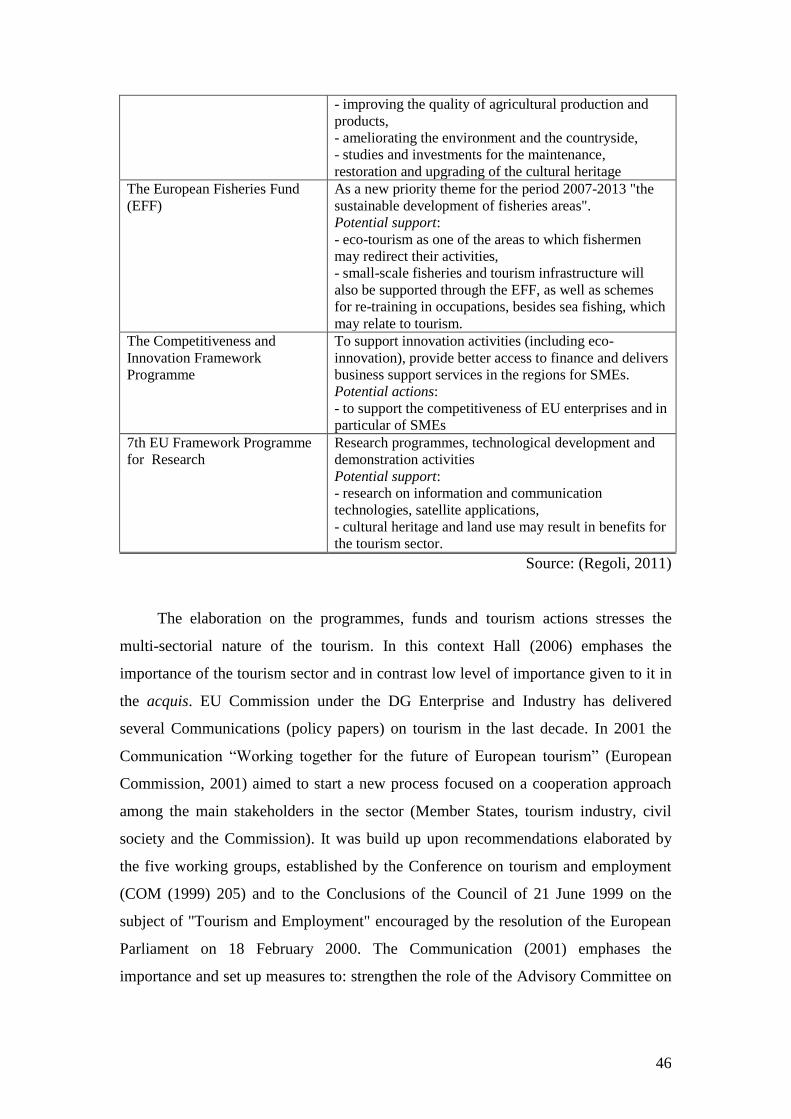
46
- improving the quality of agricultural production and
products,
- ameliorating the environment and the countryside,
- studies and investments for the maintenance,
restoration and upgrading of the cultural heritage
The European Fisheries Fund
(EFF)
As a new priority theme for the period 2007-2013 "the
sustainable development of fisheries areas".
Potential support:
- eco-tourism as one of the areas to which fishermen
may redirect their activities,
- small-scale fisheries and tourism infrastructure will
also be supported through the EFF, as well as schemes
for re-training in occupations, besides sea fishing, which
may relate to tourism.
The Competitiveness and
Innovation Framework
Programme
To support innovation activities (including eco-
innovation), provide better access to finance and delivers
business support services in the regions for SMEs.
Potential actions:
- to support the competitiveness of EU enterprises and in
particular of SMEs
7th EU Framework Programme
for Research
Research programmes, technological development and
demonstration activities
Potential support:
- research on information and communication
technologies, satellite applications,
- cultural heritage and land use may result in benefits for
the tourism sector.
Source: (Regoli, 2011)
The elaboration on the programmes, funds and tourism actions stresses the
multi-sectorial nature of the tourism. In this context Hall (2006) emphases the
importance of the tourism sector and in contrast low level of importance given to it in
the acquis. EU Commission under the DG Enterprise and Industry has delivered
several Communications (policy papers) on tourism in the last decade. In 2001 the
Communication ―Working together for the future of European tourism‖ (European
Commission, 2001) aimed to start a new process focused on a cooperation approach
among the main stakeholders in the sector (Member States, tourism industry, civil
society and the Commission). It was build up upon recommendations elaborated by
the five working groups, established by the Conference on tourism and employment
(COM (1999) 205) and to the Conclusions of the Council of 21 June 1999 on the
subject of "Tourism and Employment" encouraged by the resolution of the European
Parliament on 18 February 2000. The Communication (2001) emphases the
importance and set up measures to: strengthen the role of the Advisory Committee on
47
Tourism, promotion of better interface between tourism industry and other
stockholders, increased interaction between stakeholders, introduce of TSA,
promotion of sustainable development of tourism and implementation of Agenda 21.
In 2003 the European Commission delivered Communication (COM (2003)
716 final), ―Basic orientations for the sustainability of European tourism‖ (European
Commission, 2003). This Communication set-up the basis for initiation of the
Tourism Sustainability Group (TSG), established later in 2004. The TSG is composed
of representatives of the various stakeholders and has the task of drafting a detailed
framework for action, which gives specific activities to the individual stakeholders.
Later in 2006 a new communication ―Renewed EU tourism policy: towards a
stronger partnership for European tourism‖ (European Commission, 2006a) outline
the importance of the tourism sector in growth and job creation and the facing
challenges as aging population and sustainability. This communication clearly defines
that there is a need of cohesive tourism policy at EU level with following main focus
areas:
1. Mainstreaming measures affecting tourism with better regulation,
policy-coordination and improving the use of available European
financial instrument;
2. Promoting tourism sustainability, which was already in the
Communication 2003. For this purpose the Commission lunched
European Agenda 21 for tourism and set up TSG in 2004;
3. Enhancing the understanding and the visibility of tourism through use
of TSA and support to the promotion of European destinations.
In 2007, the EU adopted the ―Agenda for a sustainable and competitive
European Tourism‖ (European Commission, 2007) in order to emphasize the
importance of sustainability for European tourism and to contribute to the
implementation of the Lisbon Strategy for Growth and Jobs and of the Sustainable
Development Strategy.
―Europe, the world's No 1 tourist destination – a new political framework for
tourism in Europe‖ European Commission Communication on tourism was adopted in
2010 (European Commission, 2010). It set up ambitious objectives of more
sustainable growth of tourism sector in EU and four groups of actions:
48
1. Stimulate competitiveness in the European tourism sector through
promoting diversification of the supply of tourist services, developing
innovation in the tourism industry, improving professional skills,
encouraging an extension of the tourist season and consolidating the
socioeconomic knowledge base for tourism;
2. Promote the development of sustainable, responsible and high-quality
tourism;
3. Consolidate the image and profile of Europe as a collection of
sustainable and high-quality tourist destinations;
4. Maximize the potential of EU financial policies and instruments for
developing tourism.
In line with the previous and in order to face the global challenges and to
guarantee a responsible development of tourism ―Roadmap 2010-2020‖ for tourism
identifies five fields of actions: support tourism demand (in terms of improving
quality service, skills, creating a brand of Europe); stimulate innovation and
entrepreneurship; combine available resources more efficiently; ensure that
development of tourism is sustainable; provide oxygen to the industry (stimulate the
use of financial instruments, to reduce administrative burden) (ECORYS, 2009). In
the frame of those actions, several EU programmes and projects have been developed.
The CALYPSO project focused on social tourism, thus allowing as many people
as possible to go on holiday and therefore, increasing tourism accessibility for
additional strata of the European population. This approach favors the development of
off-season tourism, to promote regional development thanks to the increased mobility
flows of new tourist groups. As a follow up of the Calypso initiative which clearly
highlighted how senior tourism can contribute to combat seasonality the Commission
launched in May 2012 a pilot phase for a ―Senior Tourism Initiative‖, to define the
framework conditions to enhance senior citizens‘ travel in Europe. The ―50.000
tourist initiative‖ was developed with collaboration of EU and the governments of
Argentina, Brazil and Chile, the industry and airlines by using spare airline and hotel
capacity during low season. In 2008 the Network for competitiveness and
sustainability of European tourism was established. EDEN - European Destinations
of Excellence was launched in 2006. The project aims to promote sustainable tourism
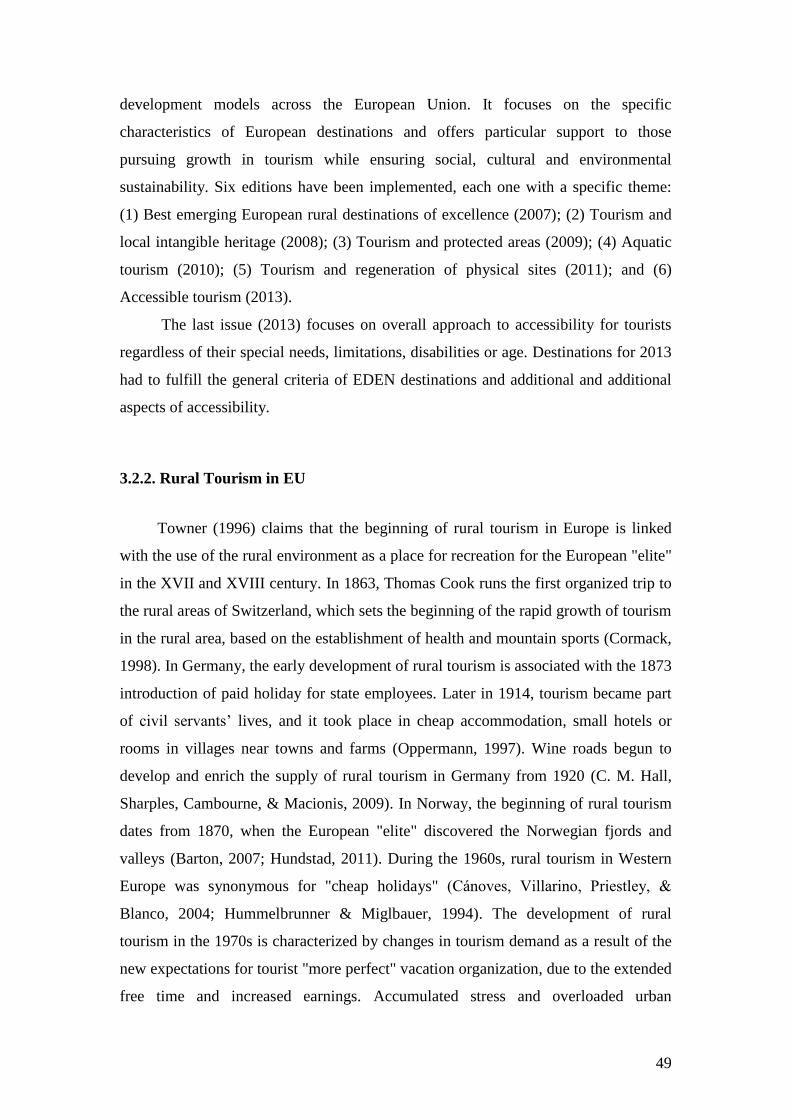
49
development models across the European Union. It focuses on the specific
characteristics of European destinations and offers particular support to those
pursuing growth in tourism while ensuring social, cultural and environmental
sustainability. Six editions have been implemented, each one with a specific theme:
(1) Best emerging European rural destinations of excellence (2007); (2) Tourism and
local intangible heritage (2008); (3) Tourism and protected areas (2009); (4) Aquatic
tourism (2010); (5) Tourism and regeneration of physical sites (2011); and (6)
Accessible tourism (2013).
The last issue (2013) focuses on overall approach to accessibility for tourists
regardless of their special needs, limitations, disabilities or age. Destinations for 2013
had to fulfill the general criteria of EDEN destinations and additional and additional
aspects of accessibility.
3.2.2. Rural Tourism in EU
Towner (1996) claims that the beginning of rural tourism in Europe is linked
with the use of the rural environment as a place for recreation for the European "elite"
in the XVII and XVIII century. In 1863, Thomas Cook runs the first organized trip to
the rural areas of Switzerland, which sets the beginning of the rapid growth of tourism
in the rural area, based on the establishment of health and mountain sports (Cormack,
1998). In Germany, the early development of rural tourism is associated with the 1873
introduction of paid holiday for state employees. Later in 1914, tourism became part
of civil servants‘ lives, and it took place in cheap accommodation, small hotels or
rooms in villages near towns and farms (Oppermann, 1997). Wine roads begun to
develop and enrich the supply of rural tourism in Germany from 1920 (C. M. Hall,
Sharples, Cambourne, & Macionis, 2009). In Norway, the beginning of rural tourism
dates from 1870, when the European "elite" discovered the Norwegian fjords and
valleys (Barton, 2007; Hundstad, 2011). During the 1960s, rural tourism in Western
Europe was synonymous for "cheap holidays" (Cánoves, Villarino, Priestley, &
Blanco, 2004; Hummelbrunner & Miglbauer, 1994). The development of rural
tourism in the 1970s is characterized by changes in tourism demand as a result of the
new expectations for tourist "more perfect" vacation organization, due to the extended
free time and increased earnings. Accumulated stress and overloaded urban
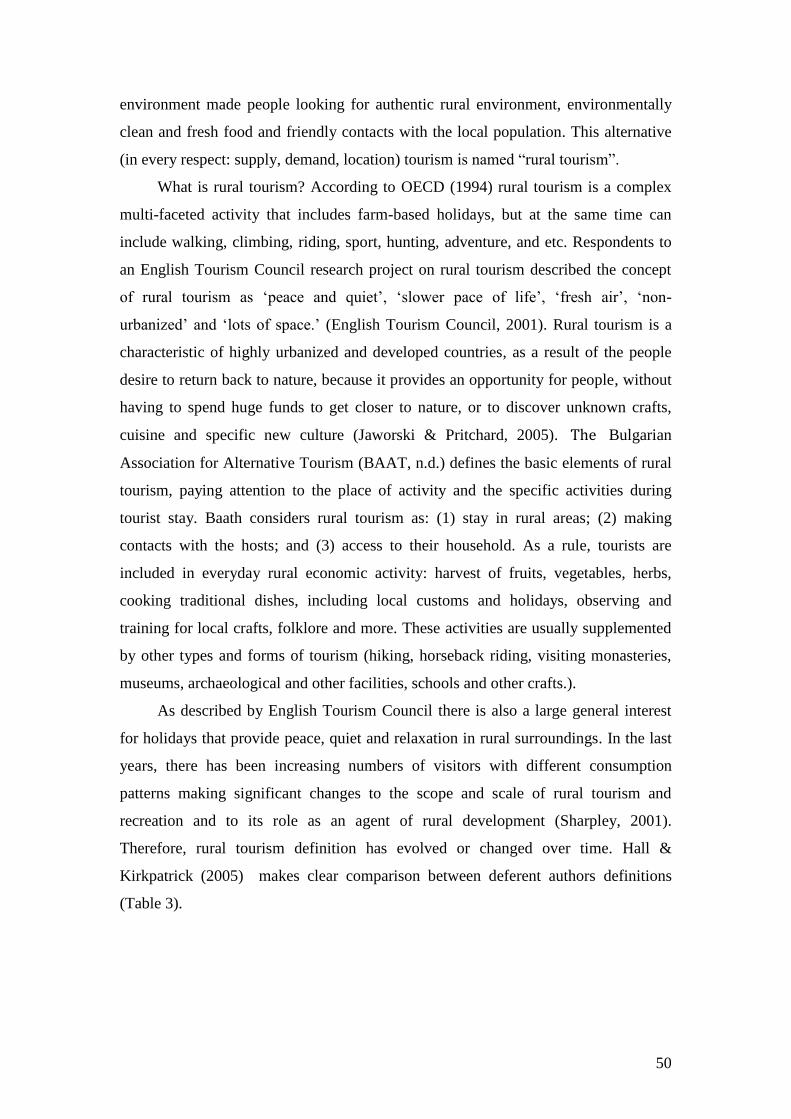
50
environment made people looking for authentic rural environment, environmentally
clean and fresh food and friendly contacts with the local population. This alternative
(in every respect: supply, demand, location) tourism is named ―rural tourism‖.
What is rural tourism? According to OECD (1994) rural tourism is a complex
multi-faceted activity that includes farm-based holidays, but at the same time can
include walking, climbing, riding, sport, hunting, adventure, and etc. Respondents to
an English Tourism Council research project on rural tourism described the concept
of rural tourism as ‗peace and quiet‘, ‗slower pace of life‘, ‗fresh air‘, ‗non-
urbanized‘ and ‗lots of space.‘ (English Tourism Council, 2001). Rural tourism is a
characteristic of highly urbanized and developed countries, as a result of the people
desire to return back to nature, because it provides an opportunity for people, without
having to spend huge funds to get closer to nature, or to discover unknown crafts,
cuisine and specific new culture (Jaworski & Pritchard, 2005). The Bulgarian
Association for Alternative Tourism (BAAT, n.d.) defines the basic elements of rural
tourism, paying attention to the place of activity and the specific activities during
tourist stay. Baath considers rural tourism as: (1) stay in rural areas; (2) making
contacts with the hosts; and (3) access to their household. As a rule, tourists are
included in everyday rural economic activity: harvest of fruits, vegetables, herbs,
cooking traditional dishes, including local customs and holidays, observing and
training for local crafts, folklore and more. These activities are usually supplemented
by other types and forms of tourism (hiking, horseback riding, visiting monasteries,
museums, archaeological and other facilities, schools and other crafts.).
As described by English Tourism Council there is also a large general interest
for holidays that provide peace, quiet and relaxation in rural surroundings. In the last
years, there has been increasing numbers of visitors with different consumption
patterns making significant changes to the scope and scale of rural tourism and
recreation and to its role as an agent of rural development (Sharpley, 2001).
Therefore, rural tourism definition has evolved or changed over time. Hall &
Kirkpatrick (2005) makes clear comparison between deferent authors definitions
(Table 3).
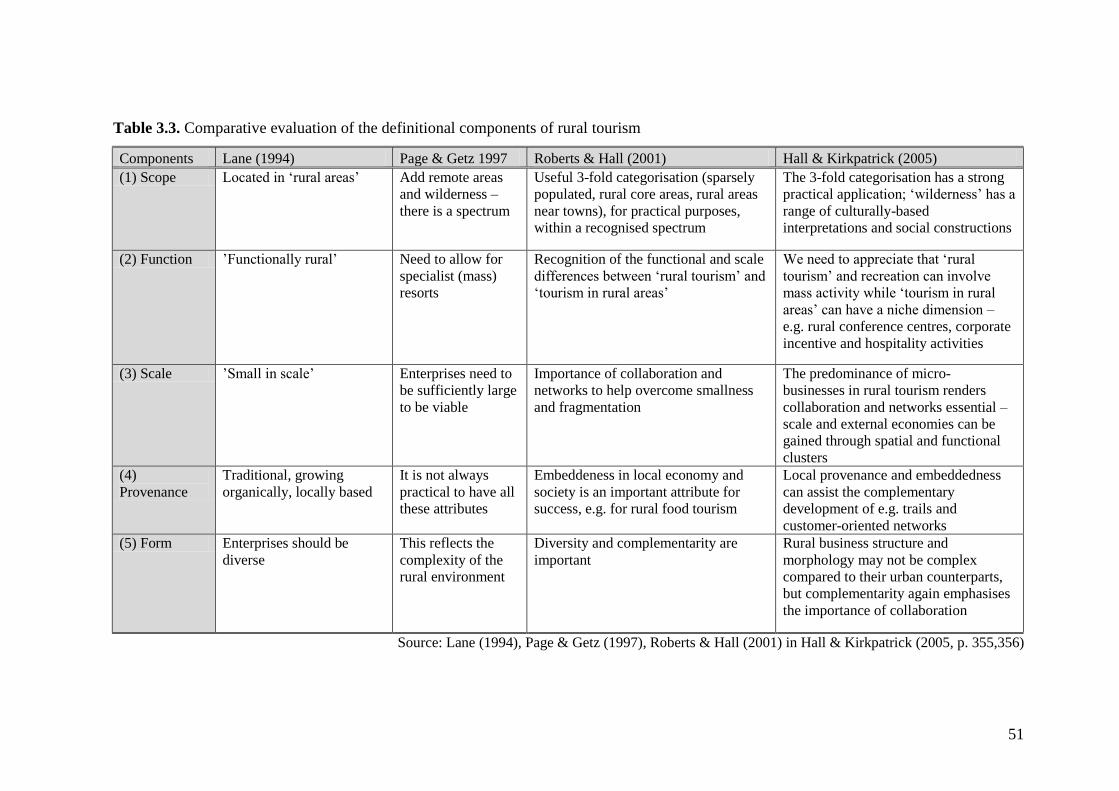
51
Table 3.3. Comparative evaluation of the definitional components of rural tourism
Components Lane (1994) Page & Getz 1997 Roberts & Hall (2001) Hall & Kirkpatrick (2005)
(1) Scope Located in ‗rural areas‘ Add remote areas
and wilderness –
there is a spectrum
Useful 3-fold categorisation (sparsely
populated, rural core areas, rural areas
near towns), for practical purposes,
within a recognised spectrum
The 3-fold categorisation has a strong
practical application; ‗wilderness‘ has a
range of culturally-based
interpretations and social constructions
(2) Function ‘Functionally rural‘ Need to allow for
specialist (mass)
resorts
Recognition of the functional and scale
differences between ‗rural tourism‘ and
‗tourism in rural areas‘
We need to appreciate that ‗rural
tourism‘ and recreation can involve
mass activity while ‗tourism in rural
areas‘ can have a niche dimension –
e.g. rural conference centres, corporate
incentive and hospitality activities
(3) Scale ‘Small in scale‘ Enterprises need to
be sufficiently large
to be viable
Importance of collaboration and
networks to help overcome smallness
and fragmentation
The predominance of micro-
businesses in rural tourism renders
collaboration and networks essential –
scale and external economies can be
gained through spatial and functional
clusters
(4)
Provenance
Traditional, growing
organically, locally based
It is not always
practical to have all
these attributes
Embeddeness in local economy and
society is an important attribute for
success, e.g. for rural food tourism
Local provenance and embeddedness
can assist the complementary
development of e.g. trails and
customer-oriented networks
(5) Form Enterprises should be
diverse
This reflects the
complexity of the
rural environment
Diversity and complementarity are
important
Rural business structure and
morphology may not be complex
compared to their urban counterparts,
but complementarity again emphasises
the importance of collaboration
Source: Lane (1994), Page & Getz (1997), Roberts & Hall (2001) in Hall & Kirkpatrick (2005, p. 355,356)
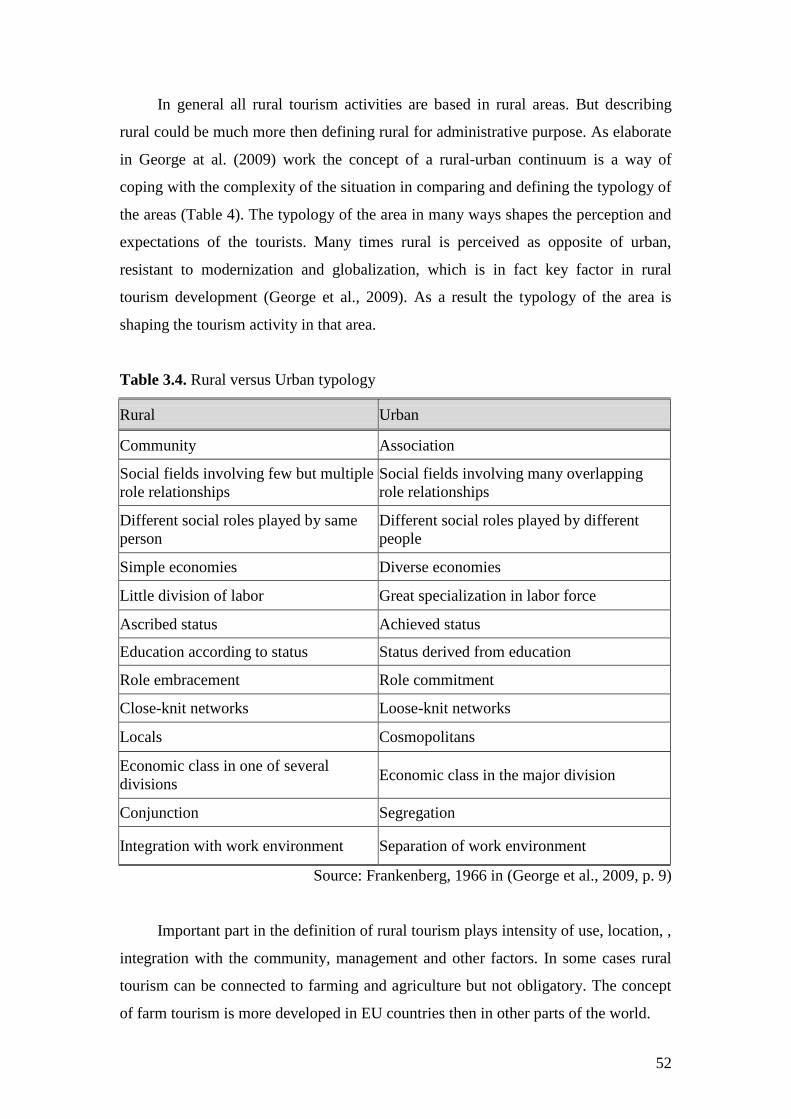
52
In general all rural tourism activities are based in rural areas. But describing
rural could be much more then defining rural for administrative purpose. As elaborate
in George at al. (2009) work the concept of a rural-urban continuum is a way of
coping with the complexity of the situation in comparing and defining the typology of
the areas (Table 4). The typology of the area in many ways shapes the perception and
expectations of the tourists. Many times rural is perceived as opposite of urban,
resistant to modernization and globalization, which is in fact key factor in rural
tourism development (George et al., 2009). As a result the typology of the area is
shaping the tourism activity in that area.
Table 3.4. Rural versus Urban typology
Rural Urban
Community Association
Social fields involving few but multiple
role relationships
Social fields involving many overlapping
role relationships
Different social roles played by same
person
Different social roles played by different
people
Simple economies Diverse economies
Little division of labor Great specialization in labor force
Ascribed status Achieved status
Education according to status Status derived from education
Role embracement Role commitment
Close-knit networks Loose-knit networks
Locals Cosmopolitans
Economic class in one of several
divisions Economic class in the major division
Conjunction Segregation
Integration with work environment Separation of work environment
Source: Frankenberg, 1966 in (George et al., 2009, p. 9)
Important part in the definition of rural tourism plays intensity of use, location, ,
integration with the community, management and other factors. In some cases rural
tourism can be connected to farming and agriculture but not obligatory. The concept
of farm tourism is more developed in EU countries then in other parts of the world.
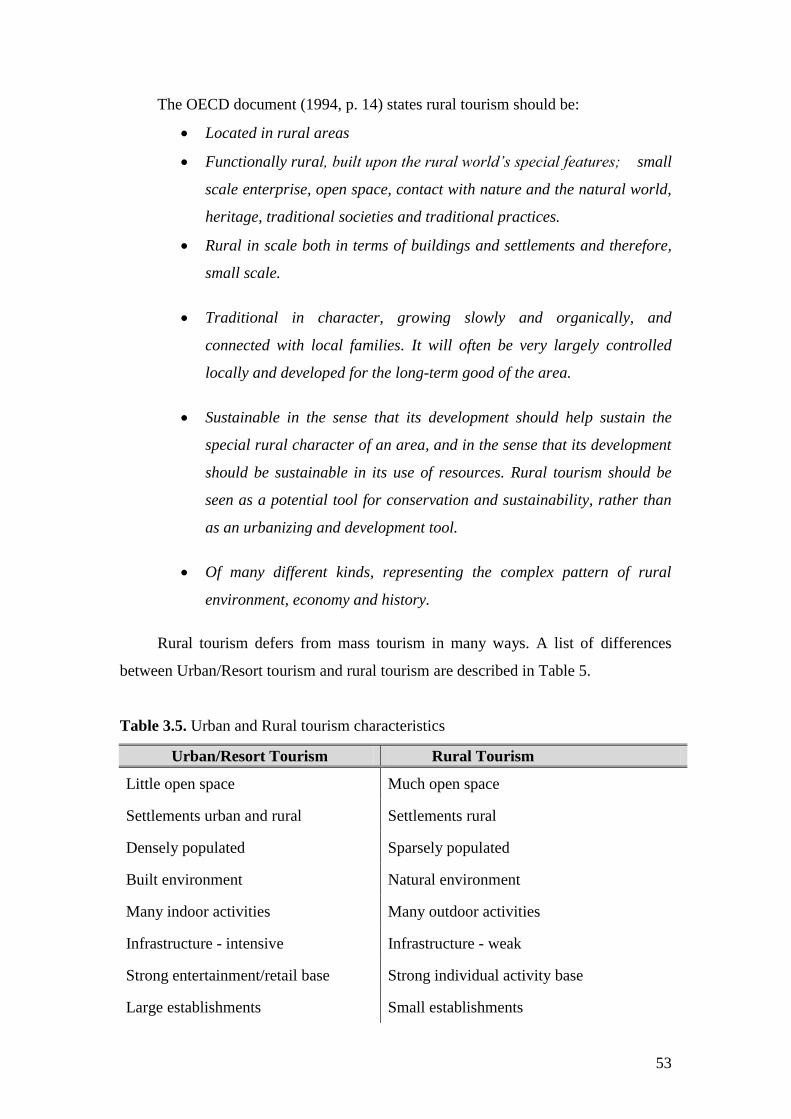
53
The OECD document (1994, p. 14) states rural tourism should be:
Located in rural areas
Functionally rural, built upon the rural world’s special features; small
scale enterprise, open space, contact with nature and the natural world,
heritage, traditional societies and traditional practices.
Rural in scale both in terms of buildings and settlements and therefore,
small scale.
Traditional in character, growing slowly and organically, and
connected with local families. It will often be very largely controlled
locally and developed for the long-term good of the area.
Sustainable in the sense that its development should help sustain the
special rural character of an area, and in the sense that its development
should be sustainable in its use of resources. Rural tourism should be
seen as a potential tool for conservation and sustainability, rather than
as an urbanizing and development tool.
Of many different kinds, representing the complex pattern of rural
environment, economy and history.
Rural tourism defers from mass tourism in many ways. A list of differences
between Urban/Resort tourism and rural tourism are described in Table 5.
Table 3.5. Urban and Rural tourism characteristics
Urban/Resort Tourism Rural Tourism
Little open space Much open space
Settlements urban and rural Settlements rural
Densely populated Sparsely populated
Built environment Natural environment
Many indoor activities Many outdoor activities
Infrastructure - intensive Infrastructure - weak
Strong entertainment/retail base Strong individual activity base
Large establishments Small establishments
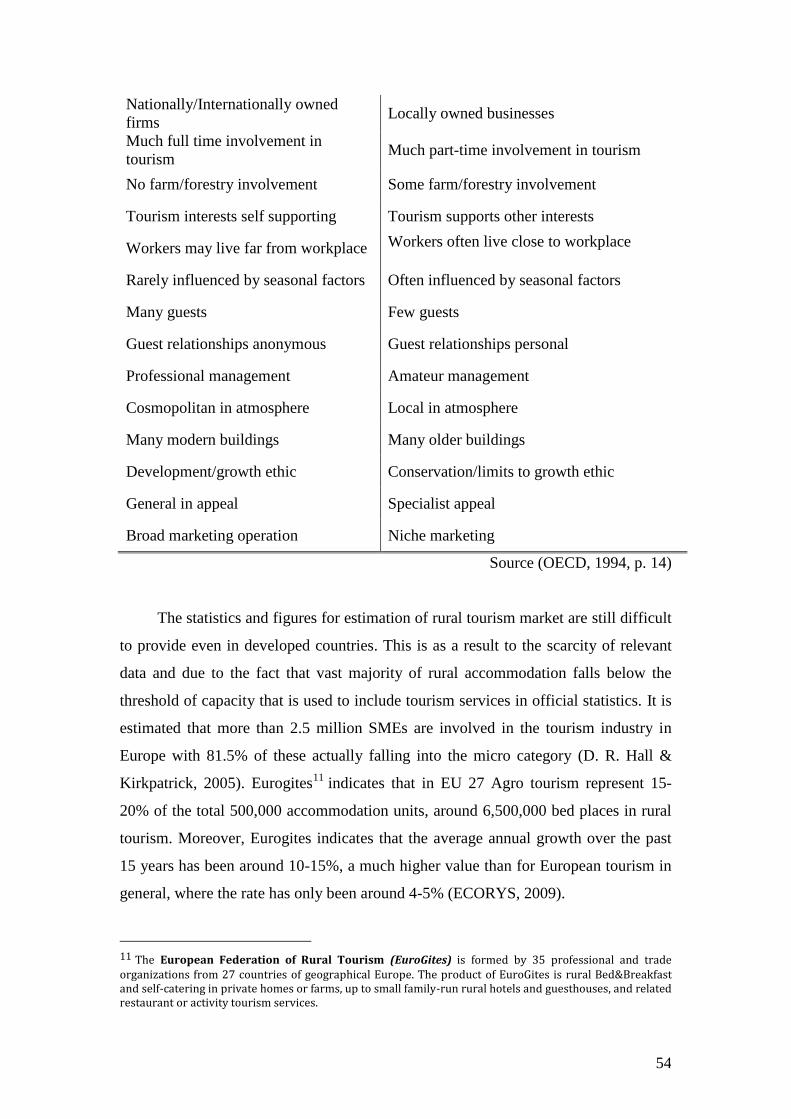
54
Nationally/Internationally owned
firms Locally owned businesses
Much full time involvement in
tourism Much part-time involvement in tourism
No farm/forestry involvement Some farm/forestry involvement
Tourism interests self supporting Tourism supports other interests
Workers may live far from workplace Workers often live close to workplace
Rarely influenced by seasonal factors Often influenced by seasonal factors
Many guests Few guests
Guest relationships anonymous Guest relationships personal
Professional management Amateur management
Cosmopolitan in atmosphere Local in atmosphere
Many modern buildings Many older buildings
Development/growth ethic Conservation/limits to growth ethic
General in appeal Specialist appeal
Broad marketing operation Niche marketing
Source (OECD, 1994, p. 14)
The statistics and figures for estimation of rural tourism market are still difficult
to provide even in developed countries. This is as a result to the scarcity of relevant
data and due to the fact that vast majority of rural accommodation falls below the
threshold of capacity that is used to include tourism services in official statistics. It is
estimated that more than 2.5 million SMEs are involved in the tourism industry in
Europe with 81.5% of these actually falling into the micro category (D. R. Hall &
Kirkpatrick, 2005). Eurogites11
indicates that in EU 27 Agro tourism represent 15-
20% of the total 500,000 accommodation units, around 6,500,000 bed places in rural
tourism. Moreover, Eurogites indicates that the average annual growth over the past
15 years has been around 10-15%, a much higher value than for European tourism in
general, where the rate has only been around 4-5% (ECORYS, 2009).
11 The European Federation of Rural Tourism (EuroGites) is formed by 35 professional and trade organizations from 27 countries of geographical Europe. The product of EuroGites is rural Bed&Breakfast and self-catering in private homes or farms, up to small family-run rural hotels and guesthouses, and related restaurant or activity tourism services.
55
In Europe, [...] both domestic and international demand for
recreational use of the countryside continues to increase. Despite inconsistent
and incomplete data, an emerging pattern internationally shows that visitors
are already the largest contributors to many rural economies.
(D. R. Hall & Kirkpatrick, 2005, p. 361)
The forces behind the growth of rural tourism are more long term in nature,
therefore it is not an accidental or temporary growth phenomenon. The OECD (1994)
defines 14 key factors responsible for rural tourism growth: (1) Increasing levels of
education (2); A growing interest in heritage; (3) Increases in leisure time; (4)
Transport and communications; (5) Health consciousness; (6) better outdoor clothing;
(7) A growing interest in specialty food; (8) Green issues; (9) Authenticity; (10) Peace
and tranquility; (11) Ageing but active populations; (12) REAL travel (rewarding,
enriching, adventuresome and a learning experience); (13) Individualism; and (14)
The rural agencies.
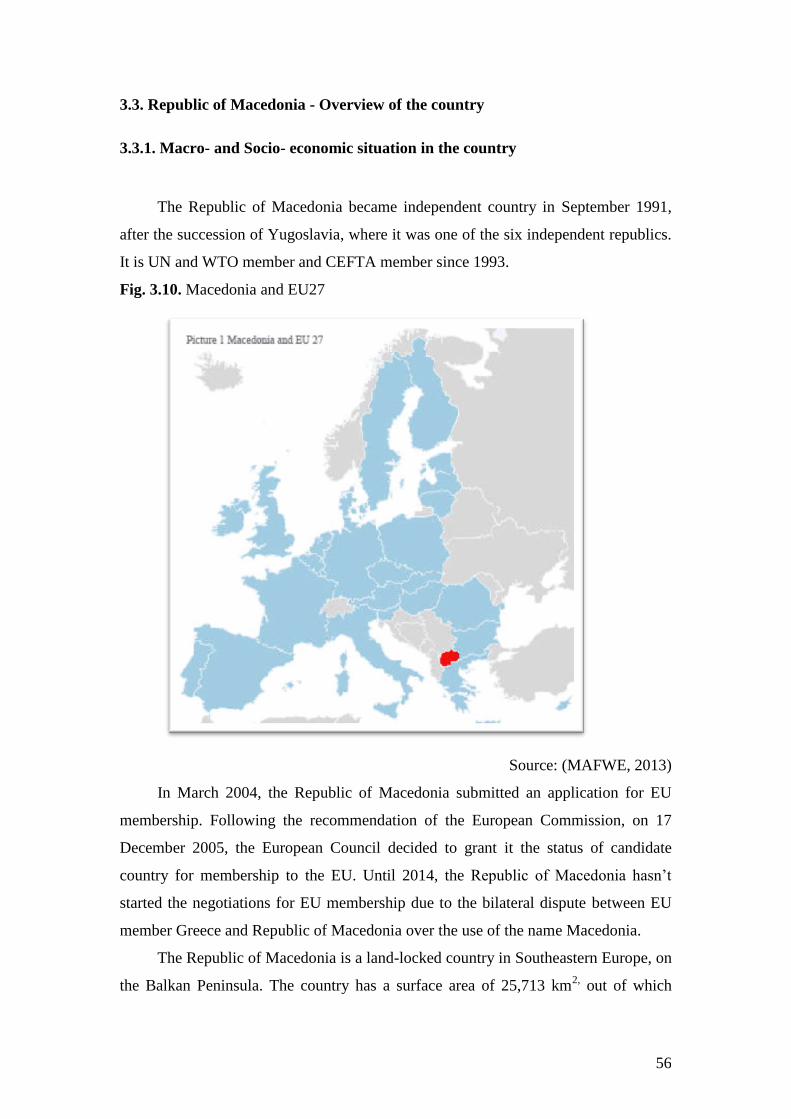
56
3.3. Republic of Macedonia - Overview of the country
3.3.1. Macro- and Socio- economic situation in the country
The Republic of Macedonia became independent country in September 1991,
after the succession of Yugoslavia, where it was one of the six independent republics.
It is UN and WTO member and CEFTA member since 1993.
Fig. 3.10. Macedonia and EU27
Source: (MAFWE, 2013)
In March 2004, the Republic of Macedonia submitted an application for EU
membership. Following the recommendation of the European Commission, on 17
December 2005, the European Council decided to grant it the status of candidate
country for membership to the EU. Until 2014, the Republic of Macedonia hasn‘t
started the negotiations for EU membership due to the bilateral dispute between EU
member Greece and Republic of Macedonia over the use of the name Macedonia.
The Republic of Macedonia is a land-locked country in Southeastern Europe, on
the Balkan Peninsula. The country has a surface area of 25,713 km2,
out of which

57
1.9% water surfaces, 19.1% plains and 79% hilly and mountainous terrains12
and
population of 2,022 millions13
.
Territorial division of the country has undertaken two major changes from 1965
until today, first one in 1996 when the number of municipalities was raised from 34 to
123 municipalities and second one in 2004 when the number of municipalities was set
on 84 divided in 8 statistical regions whit 34 towns. According to the last country‘s
territorial division14
, municipalities are classified as urban (with headquarters in
towns) and rural (with headquarters in villages) and the city of Skopje is
conglomerate of 10 municipalities. In accordance to this typology, there are 41
municipalities with rural centers and 33 municipalities with urban centers and the city
of Skopje with 10 municipalities.
Out of 84 municipalities in total, there are 53 municipalities, which are
surrounding urban centers that in general have better human resource potential and
better opportunities for business development. The situation, however, varies
significantly according to the size and performance of the urban center, as well as the
connection infrastructure and distance.
Table 3.6. Municipalities by type according to the Law on territorial organization
Administrative
division
Number of
municipalities
Total
number of
settlements
Number of
settlements
bellow 30 000
inhabitants
Population
(2002)
Territory Population
Density
Km2 Inhabitants/km2
Rural
municipalities 41 744 744 397,446 10,162.0 39.1
Urban
municipalities 33 971 962 1,118,172 14,969.0 70.1
- of which
villages / 938 938 362,950
The city of
Skopje 10 61 56
506,929 582.6 870
- of which
villages / 51 51 101,792
Total 84 1,776 1,762 2,022,547 25,713 78.65
Source: SSO of RM
12 44% of the territory is between 500-1000 m above see level and 30.5% of the territory is above 1000 m with height point 2,764 m above see level 13 SSO estimation 2011 made on the basis of the total population from the last census in 2002. According to the latest official census, preformed in 2002, the country had a total population of 2,022,547 in 564 296 total numbers of households (3.6 persons per household); with an average population density of 79 per,ons per km2 14 Low on territorial organization of the local self-government of Republic of Macedonia (Official Gazette 55/2004)
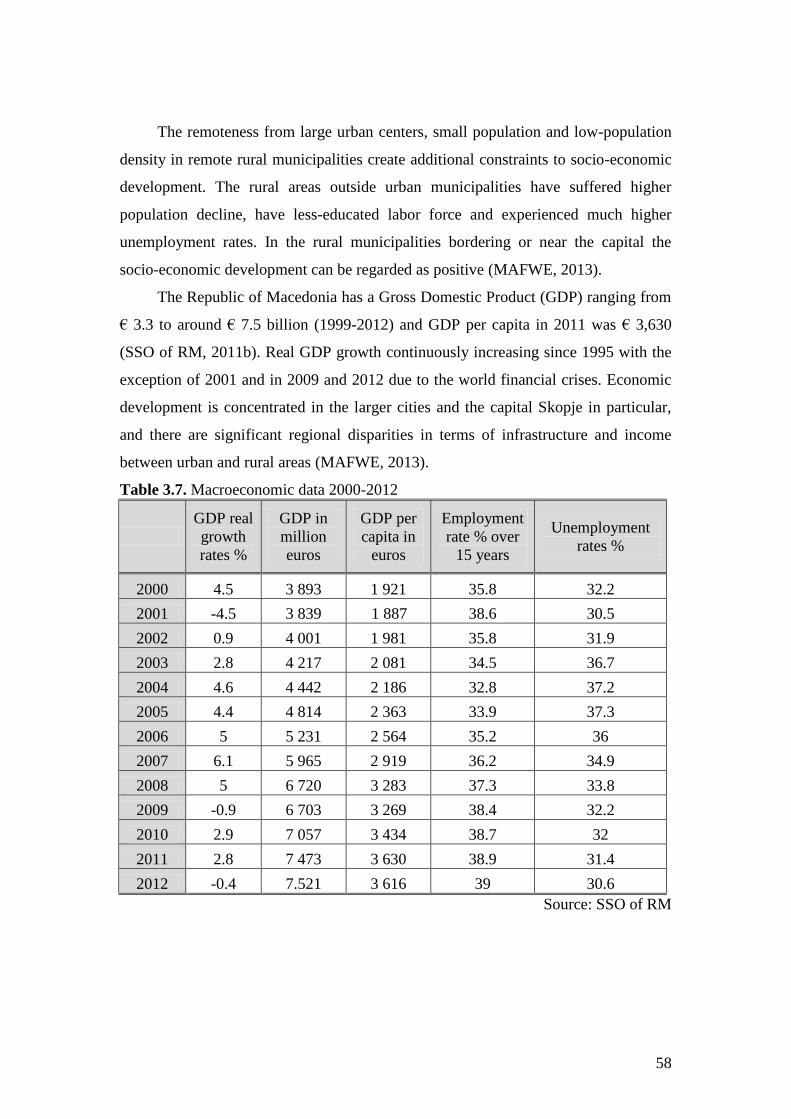
58
The remoteness from large urban centers, small population and low-population
density in remote rural municipalities create additional constraints to socio-economic
development. The rural areas outside urban municipalities have suffered higher
population decline, have less-educated labor force and experienced much higher
unemployment rates. In the rural municipalities bordering or near the capital the
socio-economic development can be regarded as positive (MAFWE, 2013).
The Republic of Macedonia has a Gross Domestic Product (GDP) ranging from
€ 3.3 to around € 7.5 billion (1999-2012) and GDP per capita in 2011 was € 3,630
(SSO of RM, 2011b). Real GDP growth continuously increasing since 1995 with the
exception of 2001 and in 2009 and 2012 due to the world financial crises. Economic
development is concentrated in the larger cities and the capital Skopje in particular,
and there are significant regional disparities in terms of infrastructure and income
between urban and rural areas (MAFWE, 2013).
Table 3.7. Macroeconomic data 2000-2012
GDP real
growth
rates %
GDP in
million
euros
GDP per
capita in
euros
Employment
rate % over
15 years
Unemployment
rates %
2000 4.5 3 893 1 921 35.8 32.2
2001 -4.5 3 839 1 887 38.6 30.5
2002 0.9 4 001 1 981 35.8 31.9
2003 2.8 4 217 2 081 34.5 36.7
2004 4.6 4 442 2 186 32.8 37.2
2005 4.4 4 814 2 363 33.9 37.3
2006 5 5 231 2 564 35.2 36
2007 6.1 5 965 2 919 36.2 34.9
2008 5 6 720 3 283 37.3 33.8
2009 -0.9 6 703 3 269 38.4 32.2
2010 2.9 7 057 3 434 38.7 32
2011 2.8 7 473 3 630 38.9 31.4
2012 -0.4 7.521 3 616 39 30.6
Source: SSO of RM
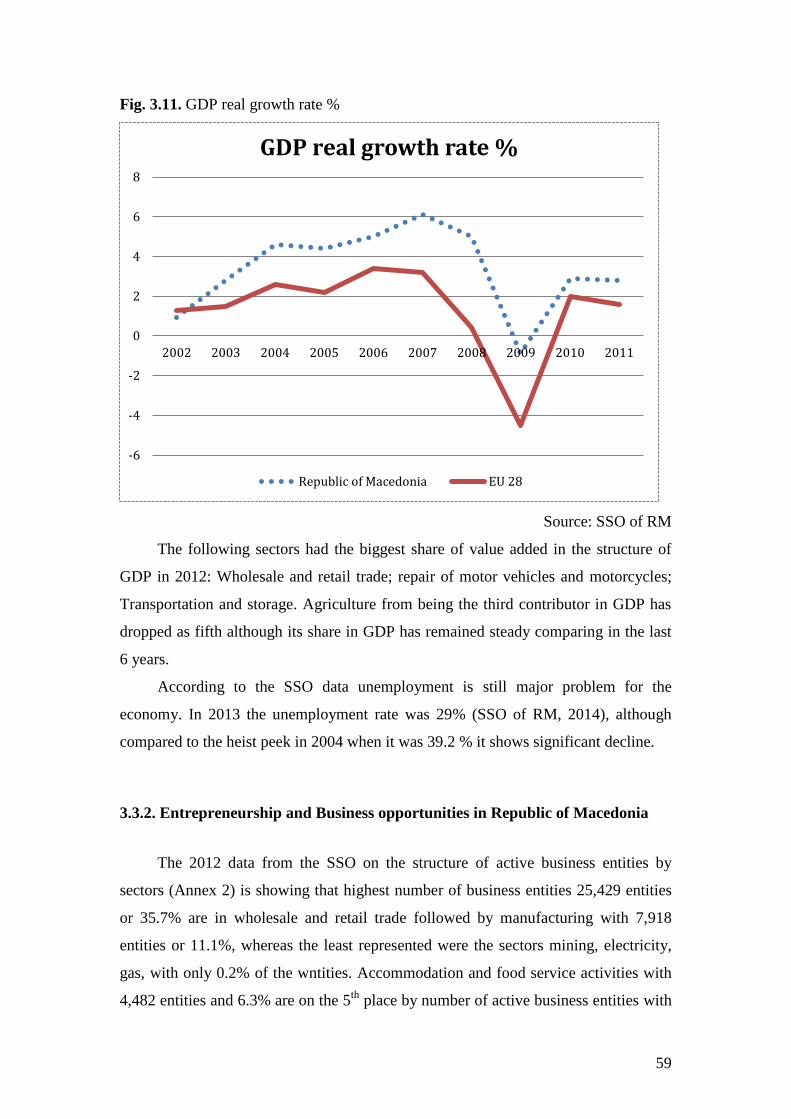
59
Fig. 3.11. GDP real growth rate %
Source: SSO of RM
The following sectors had the biggest share of value added in the structure of
GDP in 2012: Wholesale and retail trade; repair of motor vehicles and motorcycles;
Transportation and storage. Agriculture from being the third contributor in GDP has
dropped as fifth although its share in GDP has remained steady comparing in the last
6 years.
According to the SSO data unemployment is still major problem for the
economy. In 2013 the unemployment rate was 29% (SSO of RM, 2014), although
compared to the heist peek in 2004 when it was 39.2 % it shows significant decline.
3.3.2. Entrepreneurship and Business opportunities in Republic of Macedonia
The 2012 data from the SSO on the structure of active business entities by
sectors (Annex 2) is showing that highest number of business entities 25,429 entities
or 35.7% are in wholesale and retail trade followed by manufacturing with 7,918
entities or 11.1%, whereas the least represented were the sectors mining, electricity,
gas, with only 0.2% of the wntities. Accommodation and food service activities with
4,482 entities and 6.3% are on the 5th
place by number of active business entities with
-6
-4
-2
0
2
4
6
8
2002 2003 2004 2005 2006 2007 2008 2009 2010 2011
GDP real growth rate %
Republic of Macedonia EU 28
60
relatively high share. As in no other sector in Accommodation and food service,
SME‘s are accounting for 99.4% of the total active enterprises in the sector.
Measuring only micro enterprises and enterprises with no data in the sector, indicates
that 87% of the enterprises are below 9 employees which often fall under family
business or self-employment. The data for the all enterprises is showing 87.4% of
share for business entities with 1-9 persons employed, followed by entities with 10-19
persons employed with 4.2%, 20-49 persons employed was 2.5%, 50-249 persons
employed participated with 1.8%, while entities with 250 or more persons employed
had a share of only 0.3%. As in most economies, SMEs represent the vast majority of
all enterprises. According to the number of active enterprises, 65,375 or 92% were
micro and small enterprises (SSO of RM, 2012). The data of employed persons in
Annex 2 represents the total number of employed persons in the sector15
(due to the
scarcity of data on employed persons in legal entities) and it could not be compared
on basis of active enterprises.
The number of active SMEs convert into an SME density per 1,000 inhabitants
on national level reveals relatively high regional density of 32 SMEs/1000
inhabitants. This is higher than average figures for the SEE region accounting for 23
per 1,000 inhabitants (Fletcher, Huggins, & Koh, 2008; PACT, 2003; Sanfey, Falcetti,
Taci, & Tepic, 2004), but is far below the EU25 average of 45 per 1,000 inhabitants.
There is an underdeveloped SME sector in rural areas. The company density in rural
areas is significantly lower than in urban areas estimated as 22 enterprises on 1,000
inhabitants while 34 enterprises on 1,000 inhabitancies in the predominantly urban
regions.
Almost all of the food processing industry is located in rural areas (MAFWE,
2013). In all regions the development of industry is constrained by the quality of road
infrastructure and business related infrastructure and increasingly by the shortages
of qualified labor (Јакимовски, 2004).
The GEM research in Republic of Macedonia (Лазаревска, 2008) reveals that
almost 47% of the entrepreneurship inactive population believed that in the following
six mounts would have good opportunity for starting business, which presents high
expectations in entrepreneurship enrollment. Same study reveals that 35% of the
respondents who are entrepreneurially inactive have suggested that fear of failure
15 Self-employed persons with no legal entities and legal entities employed persons
61
would prevent them from starting their own business and 52% of the respondents in
Macedonia, which are non-entrepreneurs, believe they have the necessary knowledge,
skills and experience to successfully start a business. In the Republic of Macedonia,
80% of the respondents believe that entrepreneurship is a good career choice. This is
among the highest percentages in all GEM countries surveyed. In the Republic of
Macedonia nascent entrepreneurship is 7.2%, while the percentage of owners of new
businesses is 7.7%. Together, they provide the key GEM index, TEA Index16
14.5%.
TEA index is the most commonly used indicators of entrepreneurial activity. It should
be noted that half of the entrepreneurial activities at an early stage is driven by
necessity and half of entrepreneurship motivated by opportunity. In the research 11%
of respondents said they were already owners of established businesses (which are
over 3.5 years). All together the overall entrepreneurial activity is 24.8%. The last
indicator of entrepreneurial activity is discontinuation business activity, which for
Republic of Macedonia is 5.3%.
TEA index for Republic of Macedonia is 14.5% higher than the average of the
European Union 5.85% and OECD countries average 7.10%. The TEA index for
Republic of Macedonia was higher even compared to the region countries as Serbia
and Croatia 7.6%, Bosnia and Herzegovina 9% and Greece and Slovenia, economies
based on innovation, 9.9% and 6.4%, respectively. GEM indicators of entrepreneurial
activity are usually highest in countries with lower gross domestic product per capita.
In developed countries TEA index is falling because people are starting to have better
alternatives for employment, rather than to self-employment. Therefore, for countries
with lower GDP, TEA index decline can be seen as a positive signal, especially if it is
accompanied by political stability, a good business climate and economic growth.
Based on GEM indicators it is obvious that in the Republic of Macedonia
entrepreneurship is more necessity then opportunity driven. Having in mind that
entrepreneurship is not only an economic, but also a wider socio-economic
phenomenon, other factors (historical, cultural, institutional, demographic, etc.) are
contributing to the stated situation.
16 TEA (Total Early-Stage Entrepreneurial Activity) assess the percent of working age population both about to start an entrepreneurial activity, and that have started one from a maximum of 3 years and half
62
3.3.3. Entrepreneurship institutional framework
As a result of the inter-sectorial nature of the entrepreneurship, several
institutions are responsible for creation of good entrepreneurship environment in the
Republic of Macedonia. However most responsible institution is the Agency for
Entrepreneurship Support of the Republic of Macedonia (AESRM) as government
body under the Ministry for Economy. AESRM is established for realization of the
Programme with measures and activities for entrepreneurship support and creating of
competitiveness of small businesses in the Republic of Macedonia, other programs
related to entrepreneurship and small businesses and implementation of international
support in the sector.
The strategic framework to support the development of small business is
defined in the following documents: National Strategy for Development of Small and
Medium enterprises, Program of measures and activities to support entrepreneurship
and creating competitiveness in SMEs, European charter for small enterprises, the
Low on Craft Activity and National Council for Competitiveness and
Entrepreneurship as an advisory body to the Government.
Target groups identified by AESRM are following:
(1) Enterprises with less than 50 employees, have annual turnover of les
then 1,5 million EURO, are independent in their activities and have
more than 51% of private property;
(2) Sole proprietors;
(3) Craft;
(4) Other service providers.
One of the most successful Programme for entrepreneurship development in the
recent years is the Programme for self-employment supported and implemented with
cooperation between the AESRM, UNDP, Agency for employment and Ministry for
Labor and Social policy. The Programme is based on a grant scheme for persons that
are not employed and would like to create their own business. Since the Programme
began in 2007, more than 6,000 people created their own companies or formalizing
their existing business. More important is that 73% of the entrepreneurs who have
received grant over the past five years have remained in business, passing through
early business failure.
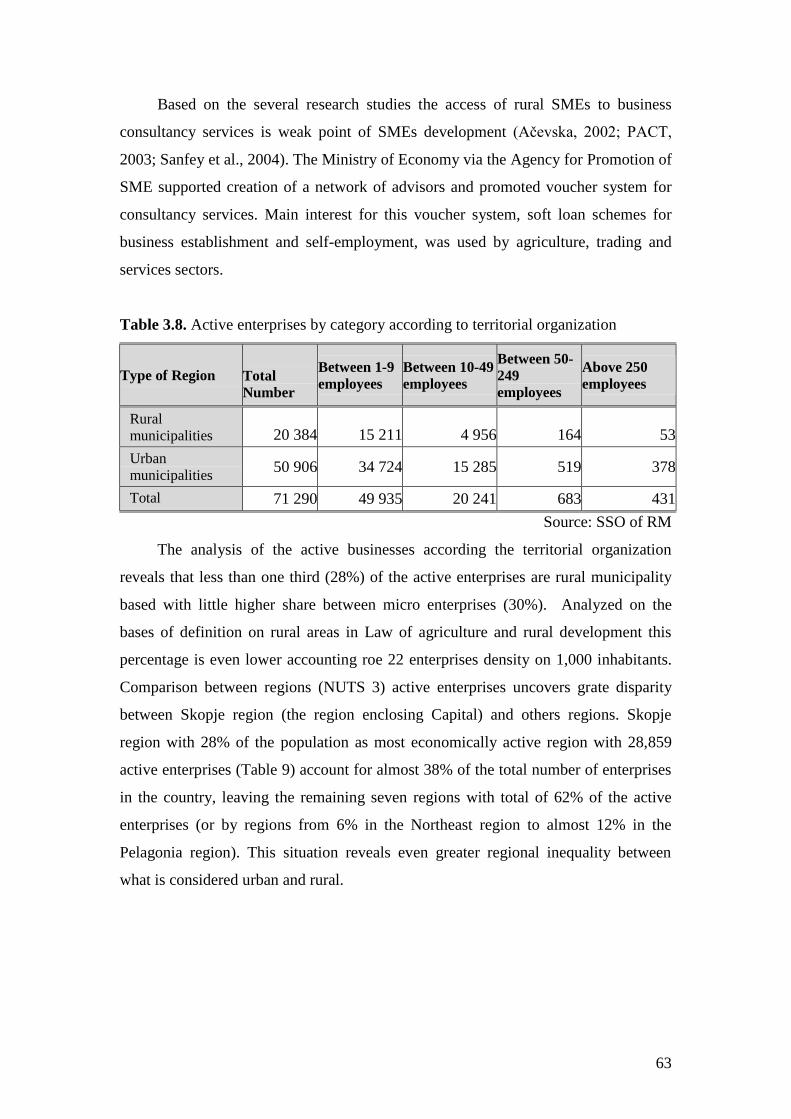
63
Based on the several research studies the access of rural SMEs to business
consultancy services is weak point of SMEs development (Ačevska, 2002; PACT,
2003; Sanfey et al., 2004). The Ministry of Economy via the Agency for Promotion of
SME supported creation of a network of advisors and promoted voucher system for
consultancy services. Main interest for this voucher system, soft loan schemes for
business establishment and self-employment, was used by agriculture, trading and
services sectors.
Table 3.8. Active enterprises by category according to territorial organization
Type of Region
Total
Number
Between 1-9
employees
Between 10-49
employees
Between 50-
249
employees
Above 250
employees
Rural
municipalities 20 384 15 211 4 956 164 53
Urban
municipalities 50 906 34 724 15 285 519 378
Total 71 290 49 935 20 241 683 431
Source: SSO of RM
The analysis of the active businesses according the territorial organization
reveals that less than one third (28%) of the active enterprises are rural municipality
based with little higher share between micro enterprises (30%). Analyzed on the
bases of definition on rural areas in Law of agriculture and rural development this
percentage is even lower accounting roe 22 enterprises density on 1,000 inhabitants.
Comparison between regions (NUTS 3) active enterprises uncovers grate disparity
between Skopje region (the region enclosing Capital) and others regions. Skopje
region with 28% of the population as most economically active region with 28,859
active enterprises (Table 9) account for almost 38% of the total number of enterprises
in the country, leaving the remaining seven regions with total of 62% of the active
enterprises (or by regions from 6% in the Northeast region to almost 12% in the
Pelagonia region). This situation reveals even greater regional inequality between
what is considered urban and rural.
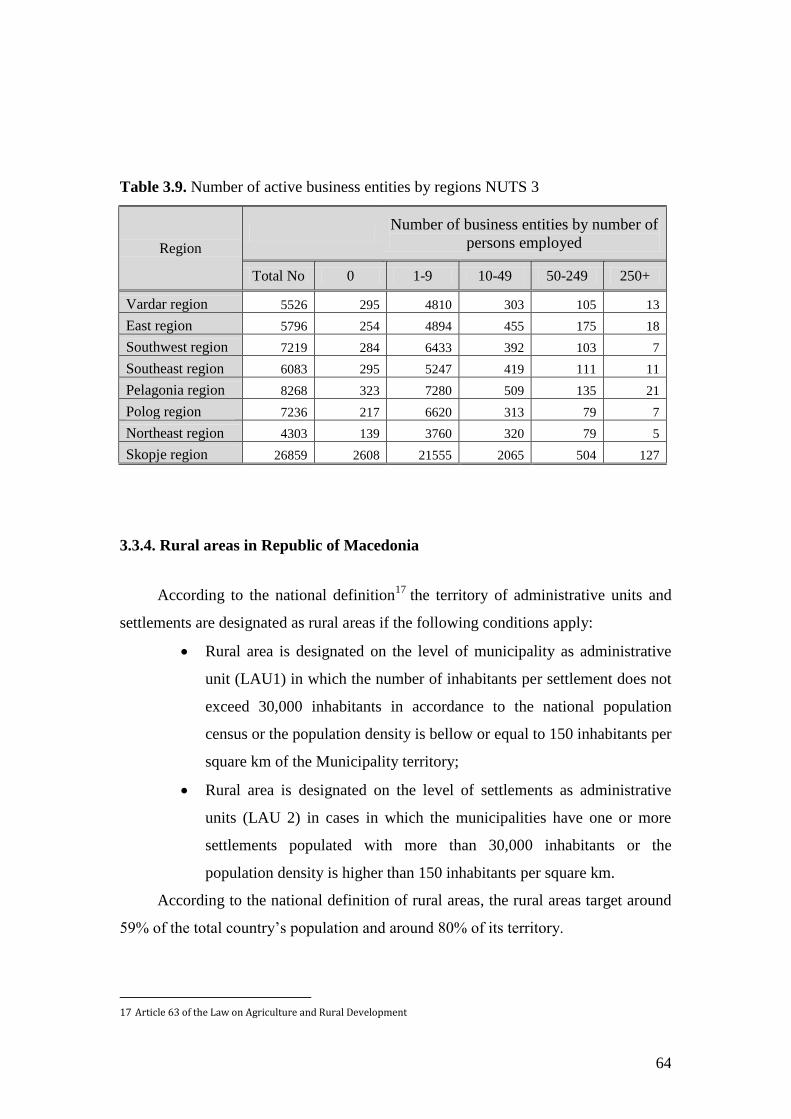
64
Table 3.9. Number of active business entities by regions NUTS 3
Region
Number of business entities by number of
persons employed
Total No 0 1-9 10-49 50-249 250+
Vardar region 5526 295 4810 303 105 13
East region 5796 254 4894 455 175 18
Southwest region 7219 284 6433 392 103 7
Southeast region 6083 295 5247 419 111 11
Pelagonia region 8268 323 7280 509 135 21
Polog region 7236 217 6620 313 79 7
Northeast region 4303 139 3760 320 79 5
Skopje region 26859 2608 21555 2065 504 127
3.3.4. Rural areas in Republic of Macedonia
According to the national definition17
the territory of administrative units and
settlements are designated as rural areas if the following conditions apply:
Rural area is designated on the level of municipality as administrative
unit (LAU1) in which the number of inhabitants per settlement does not
exceed 30,000 inhabitants in accordance to the national population
census or the population density is bellow or equal to 150 inhabitants per
square km of the Municipality territory;
Rural area is designated on the level of settlements as administrative
units (LAU 2) in cases in which the municipalities have one or more
settlements populated with more than 30,000 inhabitants or the
population density is higher than 150 inhabitants per square km.
According to the national definition of rural areas, the rural areas target around
59% of the total country‘s population and around 80% of its territory.
17 Article 63 of the Law on Agriculture and Rural Development
65
In addition18
there are areas with limited possibilities for agriculture, defined as,
(1) Mountainous areas above 700m of altitude where natural handicaps and climatic
conditions, as well as steep slopes, are limiting the opportunities for efficient
agriculture activity. The ‗mountainous‘ areas are delineated on a settlement level
(LAU2). The number of settlements listed as ‗mountainous‘ areas are 734 with total
population 244,460 inhabitants; (2) Areas with natural disadvantages are areas below
700 m above sea level, where natural disadvantages are caused by climate conditions
and slope agricultural land and low productivity of the soil. Erosive areas, areas prone
to seasonal floods and ponds, and swamps can be considered as Areas with natural
disadvantages; (3) Areas with specific disadvantages are depopulated rural
communities and areas where the performance of agriculture is limited in the interest
of protecting the environment, nature and biodiversity on the basis of laws relating to
the protection and improvement of environment and nature.
According to the latest official census, preformed in 2002, the country had a
total population of 2,022,547 in 564,296 total numbers of households (3.6 persons per
household); with an average population density of 79 persons per km2 (low
population density on national level compared to EU average of 115)19
(European
Union, 2013).
The population density in 5 regions is below 80 people per km2 and 3 regions
(Polog, Skopje and South-western region) are above the national average. Most
densely inhabited is Skopje region with 318 inhabitants per km2 or 28% of the total
population is situated in this region; the Vardar region (38 inhabitants/km2) is the
least populated region with only 7.6% of the total population.
The population is mainly concentrated in the urban centres, with 23.1%, in
Skopje-the capital city, 5% in Kumanovo, 4% in, Bitola, 3.5% in Tetovo, 3% in
Veles, and in 24% in other smaller cities-towns (most of which are up to 15,000
inhabitants).
18 Article 64 of the Low on Agriculture and Rural Development 19 According to 2012 population estimates of SSO, the total population was 2 062 294 inhabitants and national population density of 80.2 inhabitants per km2
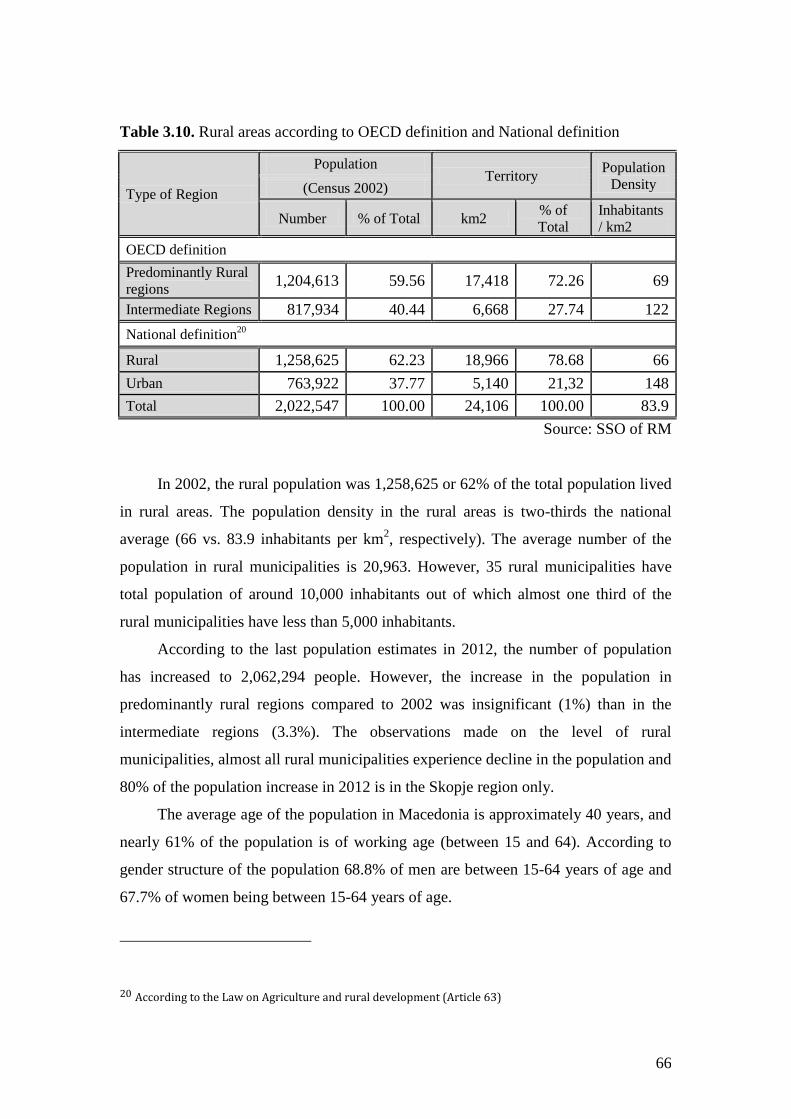
66
Table 3.10. Rural areas according to OECD definition and National definition
Type of Region
Population Territory
Population
Density (Census 2002)
Number % of Total km2 % of
Total
Inhabitants
/ km2
OECD definition
Predominantly Rural
regions 1,204,613 59.56 17,418 72.26 69
Intermediate Regions 817,934 40.44 6,668 27.74 122
National definition20
Rural 1,258,625 62.23 18,966 78.68 66
Urban 763,922 37.77 5,140 21,32 148
Total 2,022,547 100.00 24,106 100.00 83.9
Source: SSO of RM
In 2002, the rural population was 1,258,625 or 62% of the total population lived
in rural areas. The population density in the rural areas is two-thirds the national
average (66 vs. 83.9 inhabitants per km2, respectively). The average number of the
population in rural municipalities is 20,963. However, 35 rural municipalities have
total population of around 10,000 inhabitants out of which almost one third of the
rural municipalities have less than 5,000 inhabitants.
According to the last population estimates in 2012, the number of population
has increased to 2,062,294 people. However, the increase in the population in
predominantly rural regions compared to 2002 was insignificant (1%) than in the
intermediate regions (3.3%). The observations made on the level of rural
municipalities, almost all rural municipalities experience decline in the population and
80% of the population increase in 2012 is in the Skopje region only.
The average age of the population in Macedonia is approximately 40 years, and
nearly 61% of the population is of working age (between 15 and 64). According to
gender structure of the population 68.8% of men are between 15-64 years of age and
67.7% of women being between 15-64 years of age.
20 According to the Law on Agriculture and rural development (Article 63)
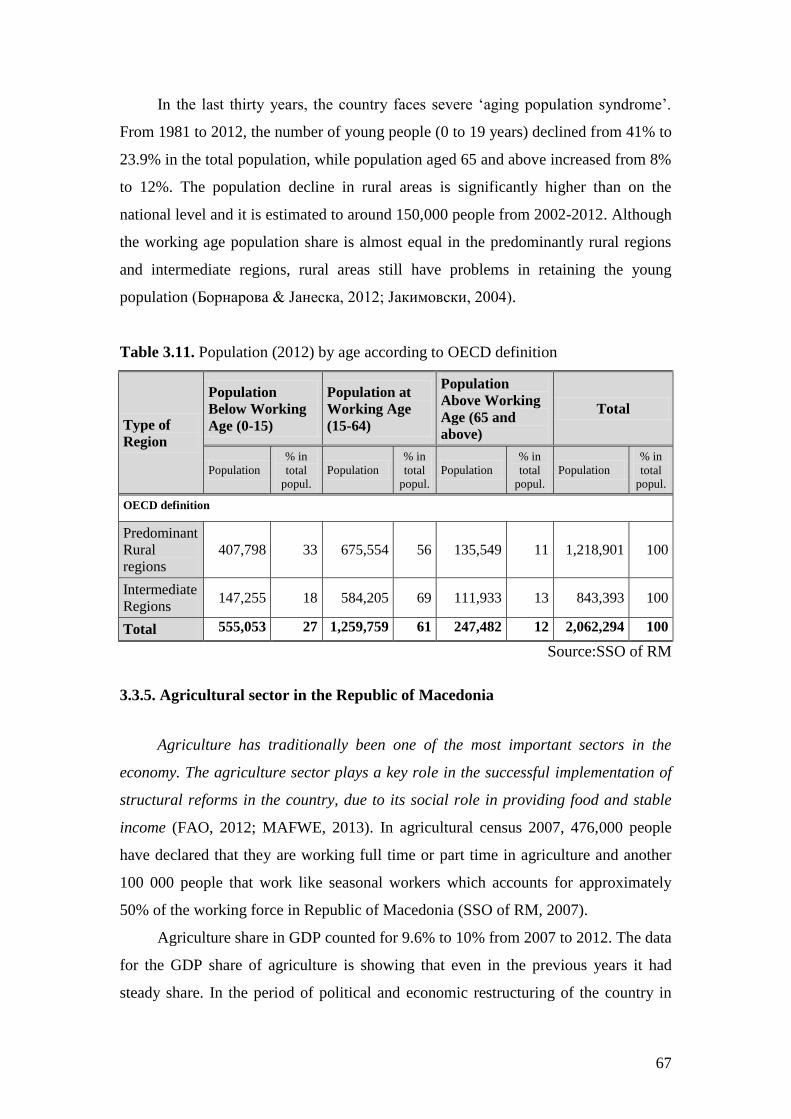
67
In the last thirty years, the country faces severe ‗aging population syndrome‘.
From 1981 to 2012, the number of young people (0 to 19 years) declined from 41% to
23.9% in the total population, while population aged 65 and above increased from 8%
to 12%. The population decline in rural areas is significantly higher than on the
national level and it is estimated to around 150,000 people from 2002-2012. Although
the working age population share is almost equal in the predominantly rural regions
and intermediate regions, rural areas still have problems in retaining the young
population (Борнарова & Јанеска, 2012; Јакимовски, 2004).
Table 3.11. Population (2012) by age according to OECD definition
Type of
Region
Population
Below Working
Age (0-15)
Population at
Working Age
(15-64)
Population
Above Working
Age (65 and
above)
Total
Population
% in
total popul.
Population
% in
total popul.
Population
% in
total popul.
Population
% in
total popul.
OECD definition
Predominant
Rural
regions
407,798 33 675,554 56 135,549 11 1,218,901 100
Intermediate
Regions 147,255 18 584,205 69 111,933 13 843,393 100
Total 555,053 27 1,259,759 61 247,482 12 2,062,294 100
Source:SSO of RM
3.3.5. Agricultural sector in the Republic of Macedonia
Agriculture has traditionally been one of the most important sectors in the
economy. The agriculture sector plays a key role in the successful implementation of
structural reforms in the country, due to its social role in providing food and stable
income (FAO, 2012; MAFWE, 2013). In agricultural census 2007, 476,000 people
have declared that they are working full time or part time in agriculture and another
100 000 people that work like seasonal workers which accounts for approximately
50% of the working force in Republic of Macedonia (SSO of RM, 2007).
Agriculture share in GDP counted for 9.6% to 10% from 2007 to 2012. The data
for the GDP share of agriculture is showing that even in the previous years it had
steady share. In the period of political and economic restructuring of the country in
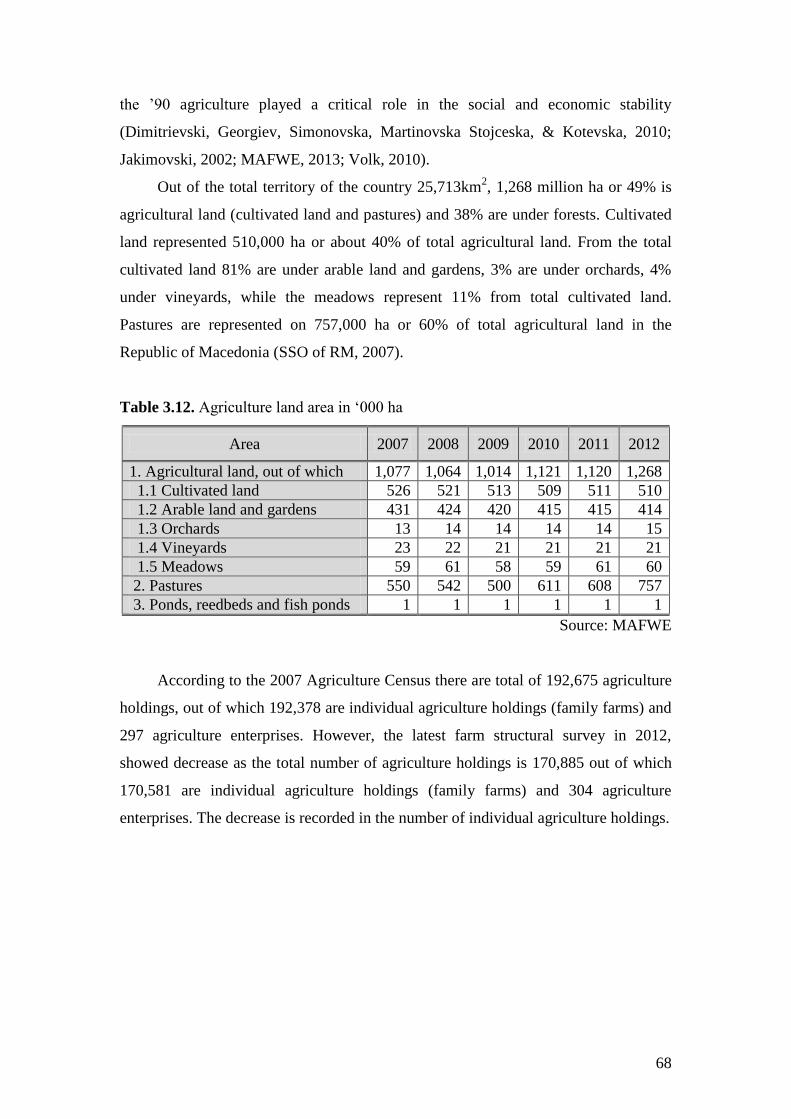
68
the ‘90 agriculture played a critical role in the social and economic stability
(Dimitrievski, Georgiev, Simonovska, Martinovska Stojceska, & Kotevska, 2010;
Jakimovski, 2002; MAFWE, 2013; Volk, 2010).
Out of the total territory of the country 25,713km2, 1,268 million ha or 49% is
agricultural land (cultivated land and pastures) and 38% are under forests. Cultivated
land represented 510,000 ha or about 40% of total agricultural land. From the total
cultivated land 81% are under arable land and gardens, 3% are under orchards, 4%
under vineyards, while the meadows represent 11% from total cultivated land.
Pastures are represented on 757,000 ha or 60% of total agricultural land in the
Republic of Macedonia (SSO of RM, 2007).
Table 3.12. Agriculture land area in ‗000 ha
Area 2007 2008 2009 2010 2011 2012
1. Agricultural land, out of which 1,077 1,064 1,014 1,121 1,120 1,268
1.1 Cultivated land 526 521 513 509 511 510
1.2 Arable land and gardens 431 424 420 415 415 414
1.3 Orchards 13 14 14 14 14 15
1.4 Vineyards 23 22 21 21 21 21
1.5 Meadows 59 61 58 59 61 60
2. Pastures 550 542 500 611 608 757
3. Ponds, reedbeds and fish ponds 1 1 1 1 1 1
Source: MAFWE
According to the 2007 Agriculture Census there are total of 192,675 agriculture
holdings, out of which 192,378 are individual agriculture holdings (family farms) and
297 agriculture enterprises. However, the latest farm structural survey in 2012,
showed decrease as the total number of agriculture holdings is 170,885 out of which
170,581 are individual agriculture holdings (family farms) and 304 agriculture
enterprises. The decrease is recorded in the number of individual agriculture holdings.
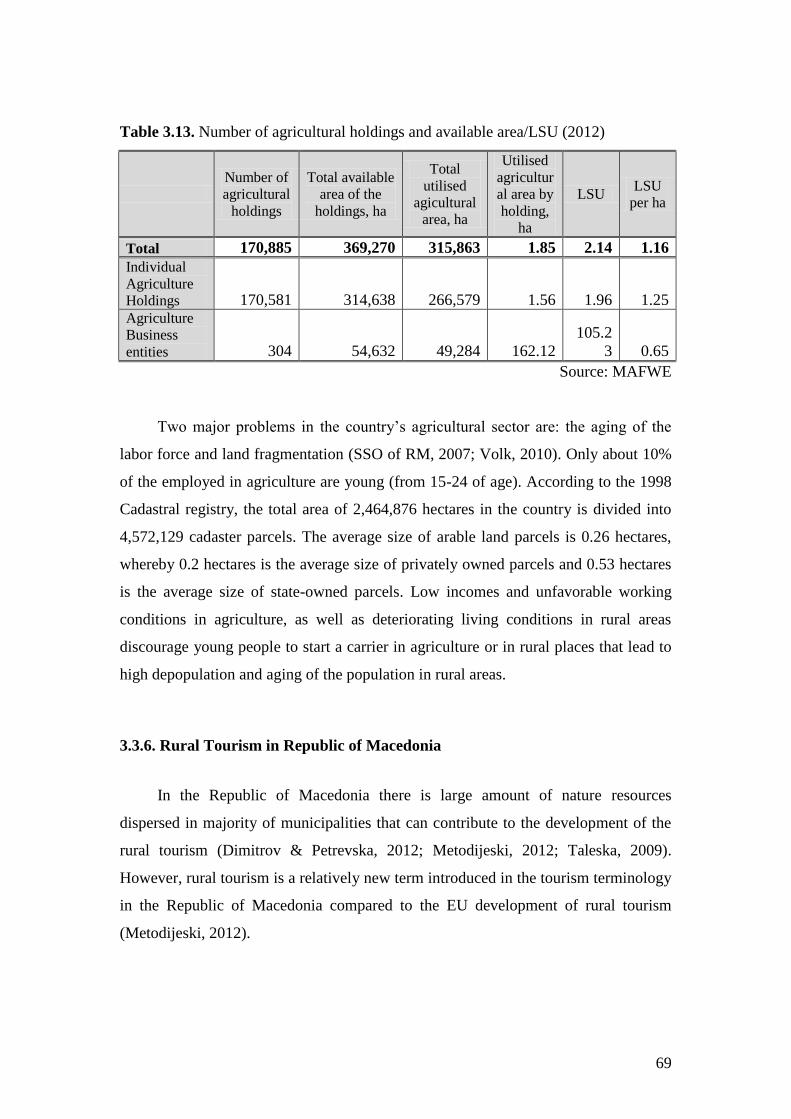
69
Table 3.13. Number of agricultural holdings and available area/LSU (2012)
Number of
agricultural
holdings
Total available
area of the
holdings, ha
Total
utilised
agicultural
area, ha
Utilised
agricultur
al area by
holding,
ha
LSU LSU
per ha
Total 170,885 369,270 315,863 1.85 2.14 1.16
Individual
Agriculture
Holdings 170,581 314,638 266,579 1.56 1.96 1.25 Agriculture
Business
entities 304 54,632 49,284 162.12
105.2
3 0.65
Source: MAFWE
Two major problems in the country‘s agricultural sector are: the aging of the
labor force and land fragmentation (SSO of RM, 2007; Volk, 2010). Only about 10%
of the employed in agriculture are young (from 15-24 of age). According to the 1998
Cadastral registry, the total area of 2,464,876 hectares in the country is divided into
4,572,129 cadaster parcels. The average size of arable land parcels is 0.26 hectares,
whereby 0.2 hectares is the average size of privately owned parcels and 0.53 hectares
is the average size of state-owned parcels. Low incomes and unfavorable working
conditions in agriculture, as well as deteriorating living conditions in rural areas
discourage young people to start a carrier in agriculture or in rural places that lead to
high depopulation and aging of the population in rural areas.
3.3.6. Rural Tourism in Republic of Macedonia
In the Republic of Macedonia there is large amount of nature resources
dispersed in majority of municipalities that can contribute to the development of the
rural tourism (Dimitrov & Petrevska, 2012; Metodijeski, 2012; Taleska, 2009).
However, rural tourism is a relatively new term introduced in the tourism terminology
in the Republic of Macedonia compared to the EU development of rural tourism
(Metodijeski, 2012).
70
Legal framework
The legal framework for development of this niche market is set in several
official documents in the Republic of Macedonia that contribute to the recognition of
the rural tourism sector.
In general two Laws are contributing to the development of the legal framework
for rural tourism. Law on Tourism in Article 51 stipulates tourist services and services
carried out as rural, ethnic and ecological tourism. Article 51 defines several services
in rural and ethno tourism that are only small portion of services in rural tourism.
Article 51 includes:
Horseback riding;
Photo safari;
Production and sale of domestic handicraft, souvenirs, instruments and
other products and services in rural household.
This Article limits the activity-holders only to physical persons registered in the
register under the local government and therefore makes large constrains to the
development of small businesses and entrepreneurship.
Low on Catering on other hand defines special provisions governing the
standards for providing catering services in rural tourism, by determining the
minimum standards of accommodation in rural households. Article 40 of the Law
defines catering services that can be carried out by physical persons. Article 53
defines terms of catering services in rural households as maximum number of beds
(20) and rooms (10) in the rural household. This Article defines mandatory
categorization and issuing of special designation for rural households.
National Strategy for Tourism of the Republic of Macedonia 2009 -2013
emphasize the development of rural tourism as an essential important part for
development of tourism offer and tourism products in the country with emphasizing
different forms of unique travel destinations in rural areas. The executive summary of
the National Strategy for Tourism states that the key resources for the development of
tourism in the Republic of Macedonia is the diversity of cultural, natural and
gastronomic heritage and various related environments, colors and sounds that emerge
from it (Влада на Република Македонија, 2009). The National Strategy for Tourism
highlight several main areas for rural tourism in Macedonia, although it states that
71
only completely organized rural tourism can be found in the village Brajcino (LAU1
Resen NUTS3 Pelagonia region) where there are facilities for accommodation and
catering, trails and activities. There are many attractions and trails organized in
municipalities Pehchevo and Berovo (NUTS 3 East Region), and accommodation and
catering, as well as attractions and restaurants in Southeast Region, settlements
Kolesino, Bansko, Mokrino and Smolare. There are villages e.g. Zrnovci that are
planning their authentic strategy for development of rural tourism. The attractive
nature of the mountains in the Polog Region and the South-West Region and the long
history and tradition of these regions have been promoted only in municipality of
Mavrovo-Rostuse, settlements as Galicnik, Jance, Rostuse. Municipality of Vevcani is
another good example of organized paths and attractions, as well as accommodation
and catering. Taleska (2009) as an contribution to this statement in the National
Strategy for Tourism argues that there are about 60 villages that have the possibility
to developed rural tourism. Moreover, Taskov at al. (2013) in correlation with
Dimitrov & Petrevska (2012) concludes that in Republic of Macedonia there are 30
touristic zones with over 130 settlements. In contrast to the existing conclusion of
unique resources in the field of rural tourism, the Strategy concludes that there is a
lack of compound rural tourism offer. The recommendation in the National Strategy
for Tourism in the field of rural tourism is creating tourism products with logo or
philosophy "Plunge into Macedonian Authentication"
Even in the long term Strategy for Sustainable Development of Macedonia
2010-2030, rural development and tourism in rural areas are among the six key areas
directly constituting sustainable development. This puts strategic importance and
stronger recognition on the rural tourism sector in the sustainable development of the
country.
As a result of the emergence of the rural tourism, the Ministry of Economy,
Sector for Tourism initiated development and adoption of the National Strategy for
Rural Tourism 2012 – 2017. The National Strategy for Rural Tourism 2012 – 2017
according to the SWOT analysis of the Institutional capacities and legal framework,
Human resources, Infrastructure, Marketing and Capacities for accommodation and
catering in rural tourism suggests three main strategic goals for development of rural
tourism:
1. Goal 1: Increase the capacity of the rural tourism;
2. Goal 2: Increase employment in rural tourism;
72
3. Goal 3: Increase the tourist offer of rural tourism.
The NSRT 2012 – 2017 suggest achievement of strategic objectives through the
creation three main programs, with set of projects and activities aimed at the same
goal and named: ―Macedonia Can, Macedonia Knows, Macedonia Has‖.
―Macedonia Can‖ specific goals are: (1) Preserving the authenticity and identity
of territorial feature of geographical destination with a choice of themed elements that
will be integrated into the building and reconstruction of buildings (2) Enabling
conditions for infrastructure investment in rural tourism (3) Enabling coordinated
construction of authentic objects by businesses and individuals.
―Macedonia Knows‖ specific goals are: (1) Determination of the necessary
institutional changes and implement them for development of human resources in
rural tourism; (2) Implementation of activities that will influence the negative
perception, attitude and behavior towards rural tourism industry as an attractive
employment; and (3) Implementation of activities for support the development of
human resources in rural tourism.
―Macedonia Has‖ specific goals are: (1) Determination of specific skills for
formation of the essential rural product; (2) Determination of specific skills for the
formation of additional elements of the tourism product that will meet the needs for
attraction and unique experience of the tourists; and (3) Mapping the elements of the
region that can be described as Top ... or Only ... (sic).
In correlation with the NSRT 2012-2017 the Law on Catering undertook one
change in 2012 and two in 2013 introducing the system of categorization of catering
premises in rural households.
Rural tourism market in the Republic of Macedonia
The NSRT 2012-2017 summarize the data for the number of accommodation
facilities and available beds and catering premises with number of chairs in
municipalities with rural centers in 2009. The data presented in the NSRT 2012-2017
shows that only 3.7% of the total catering facilities with accommodation were located
in rural areas and they have only 1.15% of the total bed capacity in Republic of
Macedonia. In the same time the number of seats in the catering facilities in rural
areas is 15.4% of the total number of seats in the catering facilities in the country. In
NSRT 2012-2017 it is stated that there is a lack of official statistical data focused
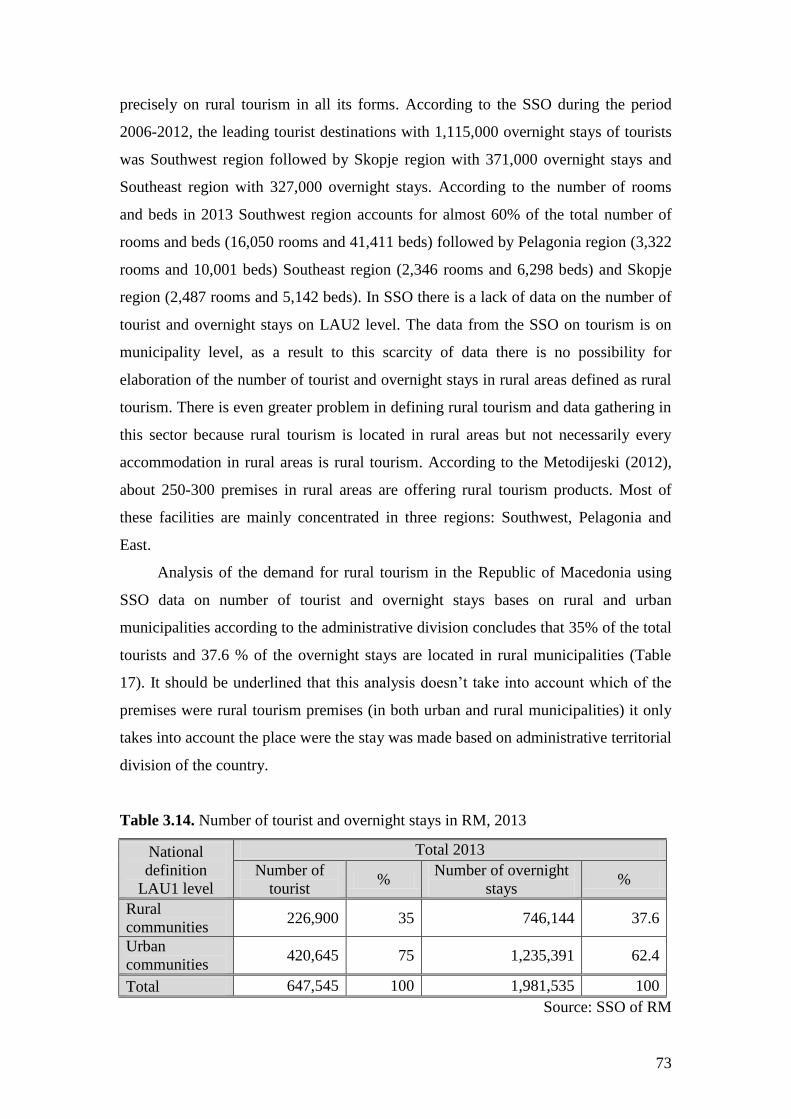
73
precisely on rural tourism in all its forms. According to the SSO during the period
2006-2012, the leading tourist destinations with 1,115,000 overnight stays of tourists
was Southwest region followed by Skopje region with 371,000 overnight stays and
Southeast region with 327,000 overnight stays. According to the number of rooms
and beds in 2013 Southwest region accounts for almost 60% of the total number of
rooms and beds (16,050 rooms and 41,411 beds) followed by Pelagonia region (3,322
rooms and 10,001 beds) Southeast region (2,346 rooms and 6,298 beds) and Skopje
region (2,487 rooms and 5,142 beds). In SSO there is a lack of data on the number of
tourist and overnight stays on LAU2 level. The data from the SSO on tourism is on
municipality level, as a result to this scarcity of data there is no possibility for
elaboration of the number of tourist and overnight stays in rural areas defined as rural
tourism. There is even greater problem in defining rural tourism and data gathering in
this sector because rural tourism is located in rural areas but not necessarily every
accommodation in rural areas is rural tourism. According to the Metodijeski (2012),
about 250-300 premises in rural areas are offering rural tourism products. Most of
these facilities are mainly concentrated in three regions: Southwest, Pelagonia and
East.
Analysis of the demand for rural tourism in the Republic of Macedonia using
SSO data on number of tourist and overnight stays bases on rural and urban
municipalities according to the administrative division concludes that 35% of the total
tourists and 37.6 % of the overnight stays are located in rural municipalities (Table
17). It should be underlined that this analysis doesn‘t take into account which of the
premises were rural tourism premises (in both urban and rural municipalities) it only
takes into account the place were the stay was made based on administrative territorial
division of the country.
Table 3.14. Number of tourist and overnight stays in RM, 2013
National
definition
LAU1 level
Total 2013
Number of
tourist %
Number of overnight
stays %
Rural
communities 226,900 35 746,144 37.6
Urban
communities 420,645 75 1,235,391 62.4
Total 647,545 100 1,981,535 100
Source: SSO of RM
74
The SSO (2011c) preformed a research study on the tourism demand from
domestic population. The data derived from this study shows that only 2.88% of
respondents spent their holidays in a facility that is located in the countryside. Often
this visit took place in friends and relatives household (75%) and in their own house
(25%).
Lacking official statistics on rural tourism market, such as: number of tourists,
revenue from rural tourism, the number of premises and accommodation, seasonal use
of the facilities for accommodation and food etc., is causing lack of research in this
area. The lack of such statistics greatly complicates the analysis and opportunities to
make objective analysis and forecasts for the development of rural tourism and its
forms in the Republic of Macedonia (Metodijeski, 2012).
Among the greatest obstacles for tourism development in rural areas is the
insufficient development of tourist attractions and facilities, as well as difficult access
to tourist amenities, national parks and tourist sites, primarily due to the poor
condition of the road infrastructure (Јакимовски, 2004; Министерство за
Економија, 2012). The number of skilled workers or labor market constrains is also
evident in the development of rural tourism. The highest number of unemployed
people with professional qualifications required for work in the tourism is in the
Southwest region (1,205) and in the Skopje region (1,307). From the available data on
the unemployed people in the rural areas, the NSRT 2012-2017 estimates that the
population of 15 to 39 years with qualifications to work in the tourism, with the
additional training for the specific subsectors of rural tourism could greatly add to the
development of this sector.
In the process of strategic planning and marketing of rural tourism resources
and products almost all municipalities have stated rural tourism as one of the
objectives in their local development strategies, mainly as a result of their potential.
Nearly two-thirds of rural municipalities identified in their strategies specific
infrastructure projects for rural tourism development.
In the process of rural tourism development in Republic of Macedonia
Metodijevski (2012) notes that rarely rural households registered tourism enterprises
when starting a business. The reason is often the inability to provide sufficient
financial resources to cover expenses during registration and further work. This
statement only reveals the lack of funding for development of rural tourism. At the
75
moment the only founding designed exclusively for rural tourism development is
measure 302 (sub measures 3,0241 and 30,242) from the IPARD Programme.
Metodijeski (2012) in his research made face to face contacts and interviews
with 59 entrepreneurs engaged in rural tourism from 28 rural settlements. The data
reveals that the average overnight stays in rural areas in one year is 50 but the
numbers depends of the premises capacities. The largest percentage of respondents
(92%) indicated that they have most visits in the summer, which speaks of expressed
seasonal work in rural tourism. Respondents reveal that 51% of their visitors are
domestic visitors, 32% foreign and 17% both foreign and domestic tourists. The
biggest motivation (70%) for tourists to stay in rural areas is the natural beauty of
rural areas. The length of stay in 83% was from 1-3 days and 83% of tourists in rural
areas are returnees that explain the satisfaction of the visitors. Primary additional
service required by tourists was walk through the environment 49%, then 28%
gastronomic specialties, 10% fun - sports, tourist information and souvenirs,
agriculture - livestock activities accounted for only 4%. 56% of the respondents have
no professional qualifications in the field of tourism, and the remaining 44% have
professional qualifications or have acquired qualifications in tourism through training.

76
77
4. ENTREPRENEURSHIP DEVELOPMENT, THEORIES AND ECONOMIC GROWTH
4.1. Entrepreneurship theories, components and context
4.1.1. Emergence and historical development of entrepreneurship
Entrepreneurship historically has meant different things to different people
(Gedeon, 2010; Nybakk & Hansen, 2008; Perelman, 1995). The world ―entrepreneur‖
has French origin with a meaning of ―person who mediates‖. There is enormous
literature on the development of the term ―entrepreneurship‖ and ―entrepreneur‖.
Richard Cantillon (1680-1734) is the first to incorporate this term in his work. He
defines the entrepreneurs as non-fixed income earners who pays known costs of
production, but earns uncertain incomes (Gedeon, 2010; Long, 1983). Latter, Jean-
Baptiste Say (1767–1832) discussed that entrepreneur is economic agent who joins all
resources of production as land, labor and capital to produce a product or service
(Becker, 2008). Joseph A. Schumpeter (1934) develops theory in which the
entrepreneur is innovator that implements new combination of currently existing
inputs (Berchicci & Tucci, 2008; Bull & Willard, 1993; Perelman, 1995; Shane, 2004;
M. D. Thomas, 1987). A person with a high need for achievement and a moderate risk
taker states David McClelland (1961) and a risk taker willing take risks in the name
of an idea, spending time and capital for an uncertain venture argues Peter Drucker
(1964) (Bygrave & Hofer, 1991; Cunningham & Lischeron, 1991; Eckhardt & Shane,
2003; Stevenson & Jarillo, 1990). Although there is no internationally accepted
definition on entrepreneurship it can be defined as capacity and willingness of a
person to develop, organize and manage a venture along with any of its risks in order
to make profit. Entrepreneurs can be bought venture entrepreneurs creating their own
business or corporation entrepreneurs engage in entrepreneurial activities in large
companies. The key economic authors that provided contribution to the development
of the theory and understanding of the entrepreneurship as an economic process are
described below.
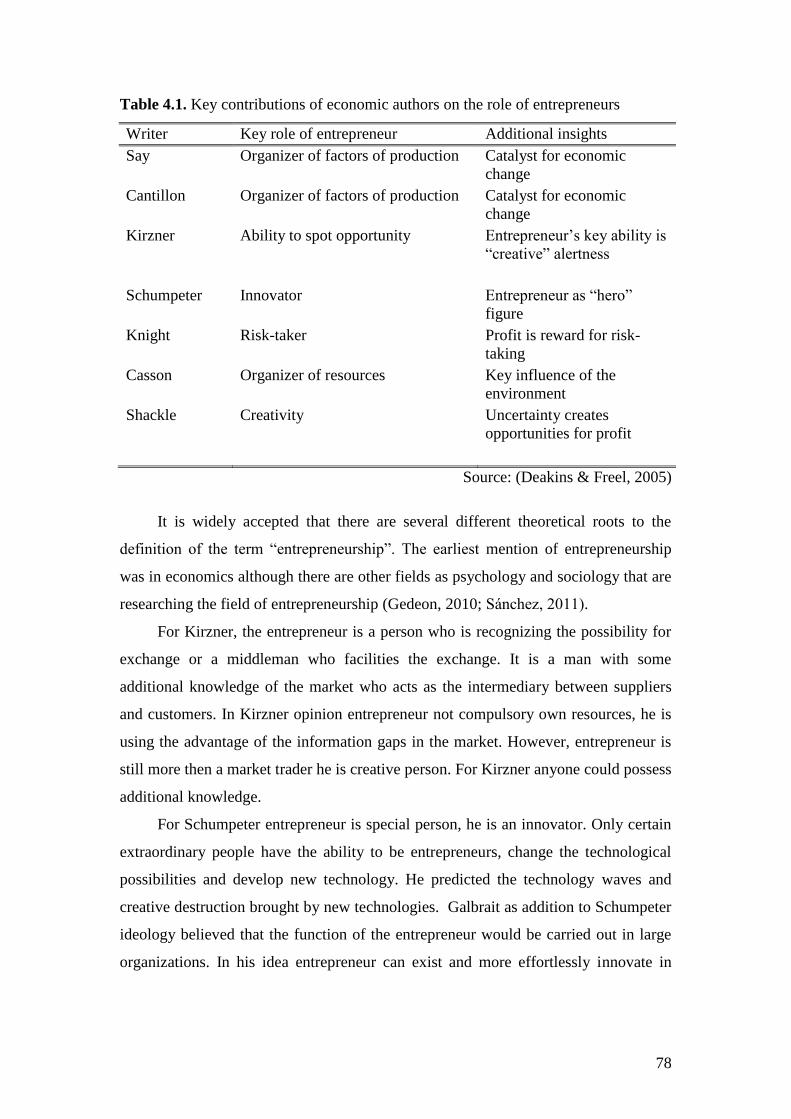
78
Table 4.1. Key contributions of economic authors on the role of entrepreneurs
Writer Key role of entrepreneur Additional insights
Say Organizer of factors of production Catalyst for economic
change
Cantillon Organizer of factors of production Catalyst for economic
change
Kirzner Ability to spot opportunity Entrepreneur‘s key ability is
―creative‖ alertness
Schumpeter Innovator Entrepreneur as ―hero‖
figure
Knight Risk-taker Profit is reward for risk-
taking
Casson Organizer of resources Key influence of the
environment
Shackle Creativity Uncertainty creates
opportunities for profit
Source: (Deakins & Freel, 2005)
It is widely accepted that there are several different theoretical roots to the
definition of the term ―entrepreneurship‖. The earliest mention of entrepreneurship
was in economics although there are other fields as psychology and sociology that are
researching the field of entrepreneurship (Gedeon, 2010; Sánchez, 2011).
For Kirzner, the entrepreneur is a person who is recognizing the possibility for
exchange or a middleman who facilities the exchange. It is a man with some
additional knowledge of the market who acts as the intermediary between suppliers
and customers. In Kirzner opinion entrepreneur not compulsory own resources, he is
using the advantage of the information gaps in the market. However, entrepreneur is
still more then a market trader he is creative person. For Kirzner anyone could possess
additional knowledge.
For Schumpeter entrepreneur is special person, he is an innovator. Only certain
extraordinary people have the ability to be entrepreneurs, change the technological
possibilities and develop new technology. He predicted the technology waves and
creative destruction brought by new technologies. Galbrait as addition to Schumpeter
ideology believed that the function of the entrepreneur would be carried out in large
organizations. In his idea entrepreneur can exist and more effortlessly innovate in
79
large firms. An individual who is capable of initiating change in large firm was called
―entrepreneur‖.
For Knight, the entrepreneur is a person who is prepared to undertake risk,
expecting profit as a reward. The opportunity for profit for Knight arises out of the
uncertainty surrounding change. If the change is perfectly predictable then no
opportunity for profit would exists. Knight makes distinction between risk and
uncertainty. For him risk is something that it can be predicted with certain level of
probability however uncertainty cannot be predicted and entrepreneur is the person
who is willing to take the risk of uncertainty.
Entrepreneur of Shackle is someone who is creative and imaginative. The
entrepreneur imagines the possibilities. According to Shackle uncertainty is creating
the possibility for someone to imagine possibilities for profit. The potential of
creativity in Shackle opinion is important element in the process of entrepreneurship.
Casson is trying to synthetize the attributes of the entrepreneur discussed by key
authors. The Casson entrepreneur possesses distinguished capabilities of management
of scarce resources. He is coordinating the supply and demand under uncertain
conditions and enjoys profits as a reward.
All these authors and many others has researched and developed theories of
entrepreneurship. The research in the field is so vast that no one could developed one
single definition that would underline every characteristic of the process and persons
involved in it. Moreover, that the process it self has changed over time adapting to the
conditions of the environment.
4.1.2. Entrepreneurship theories and schools
Numerous authors have researched and developed theories of entrepreneurship.
They defer largely due to the approach they use in the development of the theory.
There are two theories of entrepreneur’s residual profit: (1) the risk theory of
profit; and (2) the dynamic theory of profit (Gedeon, 2010; Knight, 1921; Toms,
2010). The essential entrepreneurship concepts that emerged from the risk theory of
profit are the degree of risk, presence of new venture formation, and ownership
involvement. The dynamic theory of profit supports the Schumpeter‘s theory of
80
creative destruction and his definition of the entrepreneur as the individual whose
function it is exploit market opportunity through technical or organizational
innovation (Perelman, 1995; J. A. Schumpeter, 1934; J. Schumpeter, 2003). This
dynamic theory of profit was later enlarged by Lundström and Stevenson (2005)
significantly outside independent business owners to include managers, directors,
financiers etc.
In the work of Stevenson and Jarillo (1990) entrepreneurship studies can be
divided in three main categories: ―what happens when entrepreneurs act; why they
act; and how they act”. The researchers in the first group are interested in the results
of the actions of the entrepreneur. The economists, such as Schumpeter, Kirzner, or
Casson, develop this category. After the Schumpeter‘s work most economists has
accepted the identification of entrepreneurship with innovation and continue the work
on effects of his actions on the market. The studies of the effects of the
entrepreneurship are focusing on the effects of the actions on the economic
environment. The second category can be named as 'psychological/sociological
approach', founded by McClelland largely to the research in achievement motivation
(McClelland, 1961), Bandura (1986) work on self-efficacy, the work of Rotter (1966)
on the locus of control and others psychologists and sociologist (Simpeh, 2011;
Thornton, 1999). In their work human beings and their motives, goals and values are
in the focus of the analysis. The center of attention in their work is the why of the
entrepreneur's actions. Last and third group in the center of attention has how
entrepreneurs act. Researchers in this category analyze the characteristics of
entrepreneurial management, how entrepreneurs are able to achieve their aims. In the
how category there are two important areas of research: the problems that
entrepreneurs face in the life cycle of their companies and studies focused on
identification of predictors of success for new ventures.
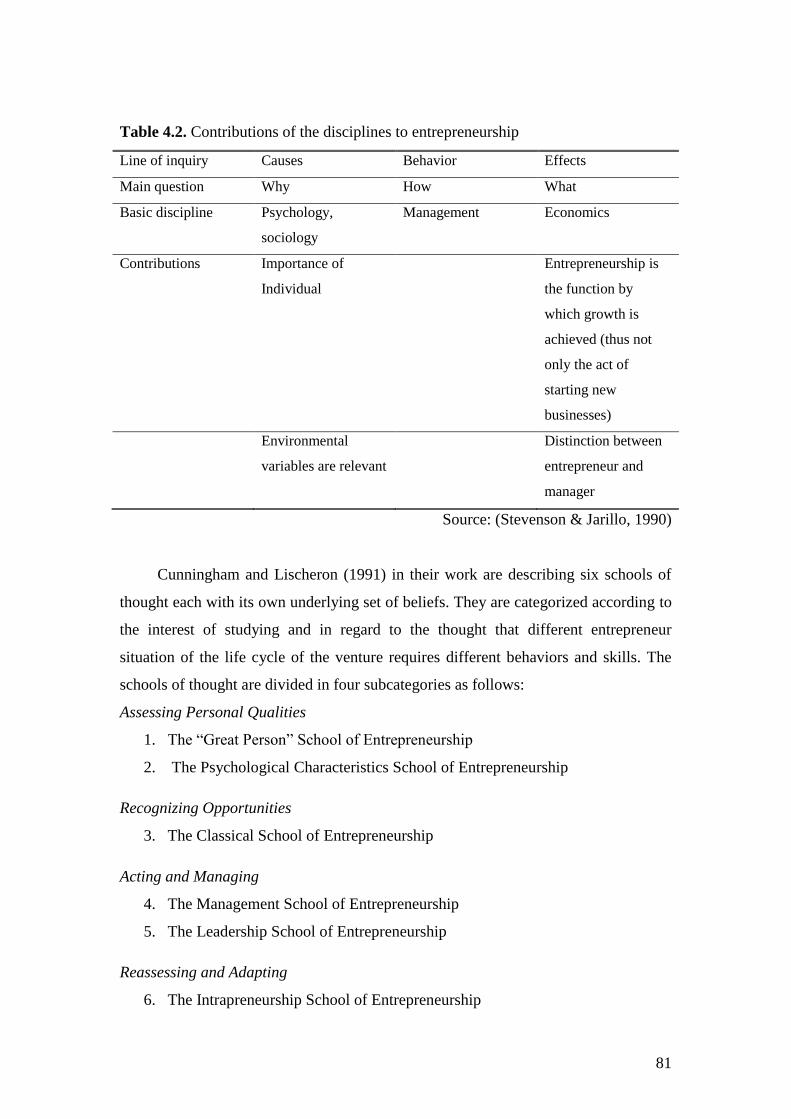
81
Table 4.2. Contributions of the disciplines to entrepreneurship
Line of inquiry Causes Behavior Effects
Main question Why How What
Basic discipline Psychology,
sociology
Management Economics
Contributions Importance of
Individual
Entrepreneurship is
the function by
which growth is
achieved (thus not
only the act of
starting new
businesses)
Environmental
variables are relevant
Distinction between
entrepreneur and
manager
Source: (Stevenson & Jarillo, 1990)
Cunningham and Lischeron (1991) in their work are describing six schools of
thought each with its own underlying set of beliefs. They are categorized according to
the interest of studying and in regard to the thought that different entrepreneur
situation of the life cycle of the venture requires different behaviors and skills. The
schools of thought are divided in four subcategories as follows:
Assessing Personal Qualities
1. The ―Great Person‖ School of Entrepreneurship
2. The Psychological Characteristics School of Entrepreneurship
Recognizing Opportunities
3. The Classical School of Entrepreneurship
Acting and Managing
4. The Management School of Entrepreneurship
5. The Leadership School of Entrepreneurship
Reassessing and Adapting
6. The Intrapreneurship School of Entrepreneurship
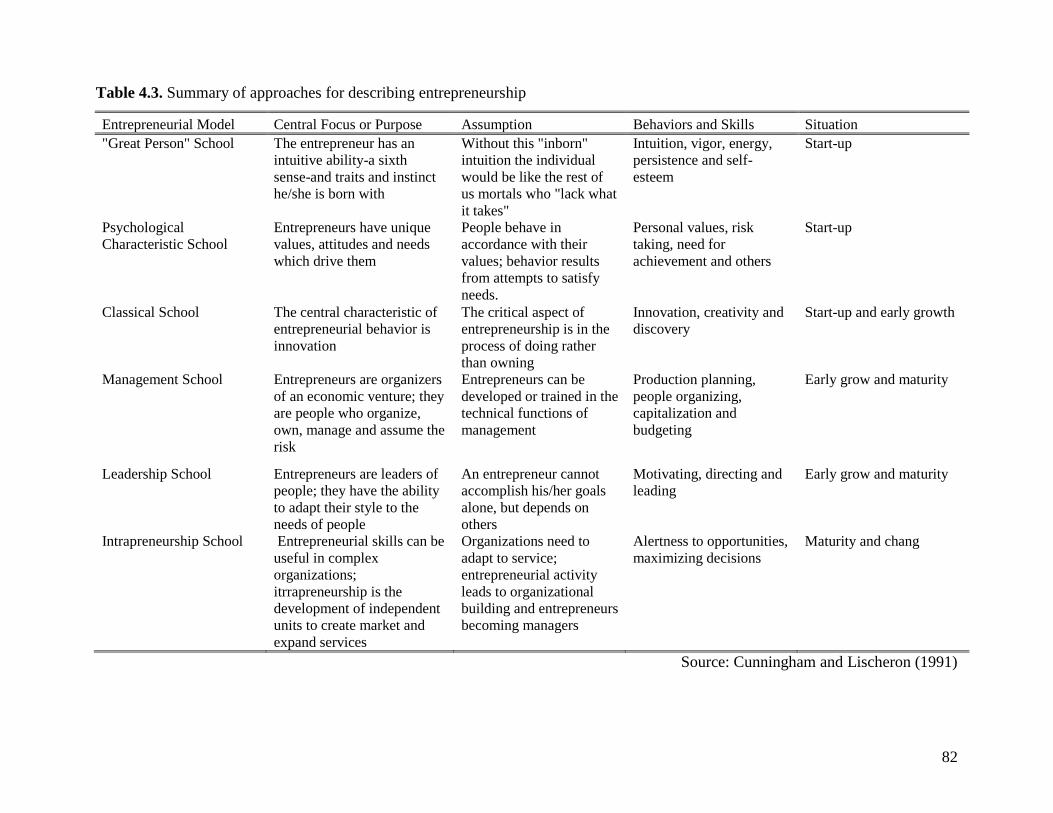
82
Table 4.3. Summary of approaches for describing entrepreneurship
Entrepreneurial Model Central Focus or Purpose Assumption Behaviors and Skills Situation
"Great Person" School The entrepreneur has an
intuitive ability-a sixth
sense-and traits and instinct
he/she is born with
Without this "inborn"
intuition the individual
would be like the rest of
us mortals who "lack what
it takes"
Intuition, vigor, energy,
persistence and self-
esteem
Start-up
Psychological
Characteristic School
Entrepreneurs have unique
values, attitudes and needs
which drive them
People behave in
accordance with their
values; behavior results
from attempts to satisfy
needs.
Personal values, risk
taking, need for
achievement and others
Start-up
Classical School The central characteristic of
entrepreneurial behavior is
innovation
The critical aspect of
entrepreneurship is in the
process of doing rather
than owning
Innovation, creativity and
discovery
Start-up and early growth
Management School Entrepreneurs are organizers
of an economic venture; they
are people who organize,
own, manage and assume the
risk
Entrepreneurs can be
developed or trained in the
technical functions of
management
Production planning,
people organizing,
capitalization and
budgeting
Early grow and maturity
Leadership School Entrepreneurs are leaders of
people; they have the ability
to adapt their style to the
needs of people
An entrepreneur cannot
accomplish his/her goals
alone, but depends on
others
Motivating, directing and
leading
Early grow and maturity
Intrapreneurship School Entrepreneurial skills can be
useful in complex
organizations;
itrrapreneurship is the
development of independent
units to create market and
expand services
Organizations need to
adapt to service;
entrepreneurial activity
leads to organizational
building and entrepreneurs
becoming managers
Alertness to opportunities,
maximizing decisions
Maturity and chang
Source: Cunningham and Lischeron (1991)
83
4.1.3. Context of entrepreneurship
The process of entrepreneurship can take place in diverse contexts. Different
entrepreneurship types can be practiced within diverse contexts. This makes the
entrepreneurship process dynamic and diverse in typology. Some of the contexts in
which entrepreneurship take place are discussed below.
Ethnic minority: Entrepreneurship has been identified as ―a set of connections
and regular patterns of interaction among people sharing common national
background or migration experience‖ (Volery, 2007). It can be also defined as a
vehicle for achieving personal success of the members of ethnic minority groups
(Morrison, Rimmington, & Williams, 1999). According to Cobas et al. (1991) ethnic
entrepreneurs are effective in creating market niches which are specific for the ethnic
group.
Family: Family business is the oldest and most common model of economic
organization (Brockhaus, 1994; Getz, Carlsen, & Morrison, 2004; Getz & Carlsen,
2005). A large ratio of smaller firms represents family enterprises. Frequently in this
kind of businesses most of the family is involved in performing different roles. The
family has an important role in terms of being a supplier of resources, such as finance
and labor (Morrison et al., 1999). It is an organization in which decision-making is
influenced by multiple generations of a family. Family businesses are diverse in size
ranging from small sole proprietors to large international companies. Depending on
the definition used they 60% of the enterprises in Europe are family business
(European Commission, 2009).
Life-style: A lifestyle business is a business activity created by entrepreneur
primarily with the aim of ensuring a certain level of income that will provide them
and their family with satisfactory amount of funds for enjoying particularly chosen
lifestyle (Henderson, 2002; Marcketti, 2006). Lifestyle businesses differs from other
types of businesses created in accordance to the life quality (Marcketti, 2006). In
pursuing personal satisfaction and life quality, entrepreneurship can also improve the
wellbeing of the community (Short, Moss, & Lumpkin, 2009). There is a large
amount of research literature and case studies that suggest that lifestyle businesses are
owned and managed by typical and successful entrepreneurs especially in the tourism
84
sector (I. Ateljevic & Doorne, 2000; Marcketti, 2006; Morrison et al., 1999; Shaw &
Williams, 2004; Skokic & Morrison, 2011; Teece, 2010; R. Thomas, Shaw, & Page,
2011)
Small business and self-employment: Small firms and self-employment are
dominant forms of business enterprises in factor-driven and efficiency-driven
economies (Blanchflower, 2004; Gollin, 2008). This is true for almost all sectors,
even manufacturing. Self-employment is the simplest kind of entrepreneurship
(Blanchflower, 2000). Usually self-employed are lacking managerial and marketing
skills and possess limited mobility due to the stable network of customers. Many of
them use unpaid family labor (Blanchflower, 2000), and do not employ regular staff.
These entrepreneurs sell to customers their personal skills, for example bed and
breakfast, tour guide, or craft souvenir vendor. Their personal knowledge is their
business strength (Morrison et al., 1999).
Temporary/part-time: Part-time entrepreneurs are people who hold a regular
wage job part of their time and work at their own businesses the other time. Petrova
(2005) hypothesis for the existence of part-time entrepreneurship is that people are
credit constrained. There is evidence in GEM 2003 report that 80% of the nascent
entrepreneurs also hold wage job. That is large proportion of the start-ups and it is
context of entrepreneurship fined in lower economic development of the country.
Franchise: It is a business that involves leasing for a certain period of time the
right to use brand name, product, service and associated support (Zoltan J. Acs &
Audretsch, 2010; Gedeon, 2010; Rubin, 1978). Franchisees are supplied with a
complete, proven, business concept together with the unique know-how (Zoltan J.
Acs & Audretsch, 2010; Kistruck, Webb, Sutter, & Ireland, 2011; Morrison et al.,
1999). It arises from the highly standardized nature of some products and services,
and the strength of the brands involved. Franchising has become a dominant story in
the industry sector in the recent years (Bates, 1995; Morrison et al., 1999).
Joint venture: This represents an arrangement in which the parties remain
independent, but agree to develop or set-up new organization jointly owned by the
parent firms. They are typically focused on a particular venture dealing with specific
activity or specific project referred to consortium. Joint venture is generally used for
setting-up small projects, but large corporations can also use this model to diversify
(E. Anderson, 1990; Buchel & Büchel, 2000).
85
4.2. Entrepreneurship and economic growth
Economic growth is the increase in welfare of an economy together with
changes in that economy’s industrial structure; public health, literacy, and
demography; and distribution of income.
It is commonly measured as increase of the percent rate of real GDP per capita.
The economic growth can be intensive growth caused by more efficient (productively)
use of inputs, the case of high-income countries as Japan or Republic of Korea. The
productivity with which countries use physical capital, human capital, and natural
capital is widely recognized as the main indicator of their level of economic
development. Beside gross domestic product (GDP) per capita, gross national product
(GNP) per capita is used as indicators for the productivity with which different
countries use their resources. GDP is calculated as the value of the total final output
of all goods and services produced in a country within a year. GNP is calculated as
GDP plus incomes received by residents from abroad minus incomes claimed by
nonresidents. For GNP and GDP to indicate the level of economic development they
are divided to the country‘s population ―per capita‖. For the purpose of comparison
between countries these indicators are adjusted with purchasing power parity (PPP)
conversion factor and in such cases the nominal GNP or GDP per capita (presented
in US dollars in accordance to the market exchange rate) are converted in real GNP of
GDP per capita. The PPP conversion factor shows the number of units of a country’s
currency required to buy the same amount of goods and services in the domestic
market as one dollar would buy in the United States.
Although GNP and GDP are measuring income and can be used as indicators
for economic growth in a country they show large limitations in measuring people
wellbeing, which is on the other hand indicator for economic development. They do
not show how equitably a country‘s income is distributed neither accounts for
environmental degradation, and resource depletion.
Large number of factors, economic of non-economic, are influencing the
economic growth. Most of the factors (see Fig. 12) evaluated in the literature are
measured by the use of secondary data (Bleaney & Nishiyama, 2002). However, until
emergence of the Global Entrepreneurship Monitor (GEM) little or no data was
available for accounting entrepreneurship in the factors that influence economic
growth. GEM is research program engaged in collecting relevant harmonized data in
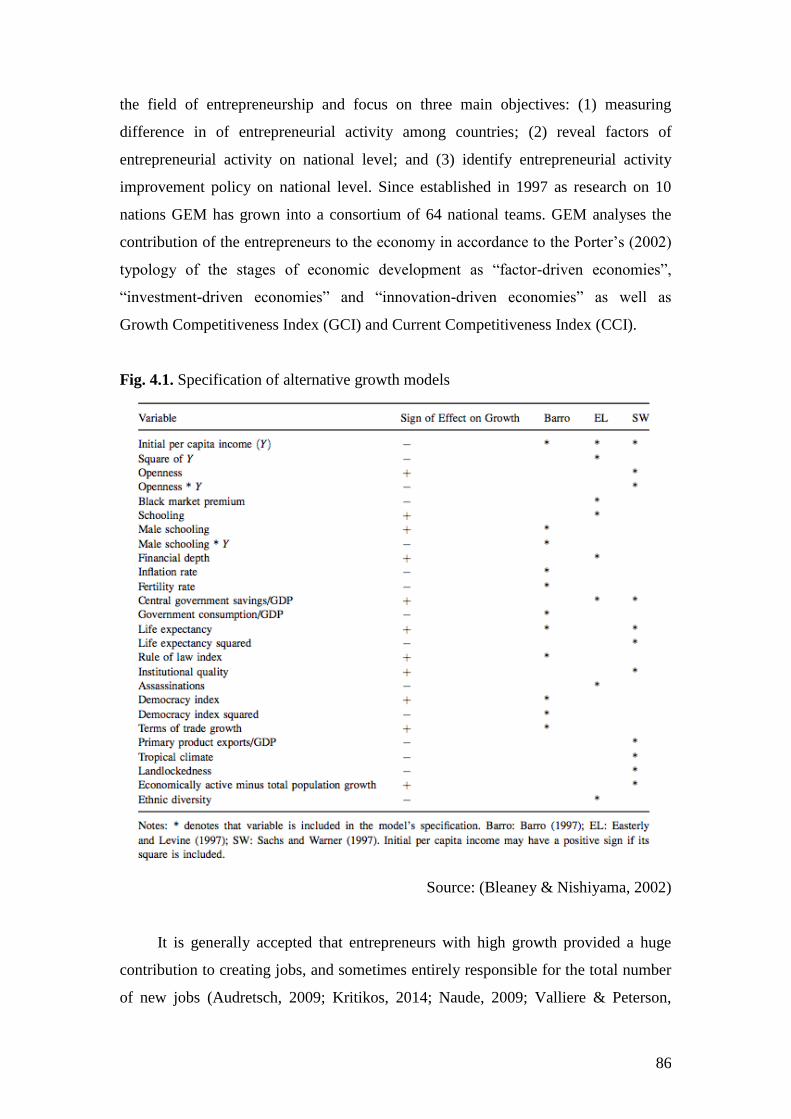
86
the field of entrepreneurship and focus on three main objectives: (1) measuring
difference in of entrepreneurial activity among countries; (2) reveal factors of
entrepreneurial activity on national level; and (3) identify entrepreneurial activity
improvement policy on national level. Since established in 1997 as research on 10
nations GEM has grown into a consortium of 64 national teams. GEM analyses the
contribution of the entrepreneurs to the economy in accordance to the Porter‘s (2002)
typology of the stages of economic development as ―factor-driven economies‖,
―investment-driven economies‖ and ―innovation-driven economies‖ as well as
Growth Competitiveness Index (GCI) and Current Competitiveness Index (CCI).
Fig. 4.1. Specification of alternative growth models
Source: (Bleaney & Nishiyama, 2002)
It is generally accepted that entrepreneurs with high growth provided a huge
contribution to creating jobs, and sometimes entirely responsible for the total number
of new jobs (Audretsch, 2009; Kritikos, 2014; Naude, 2009; Valliere & Peterson,
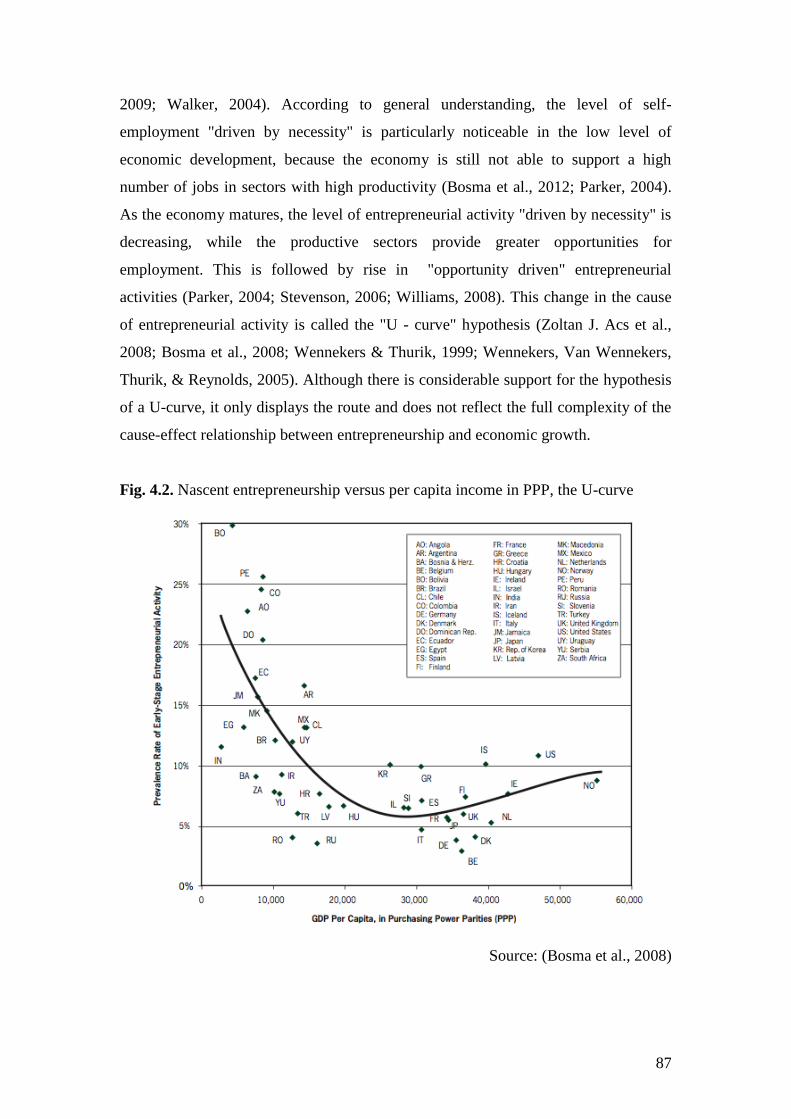
87
2009; Walker, 2004). According to general understanding, the level of self-
employment "driven by necessity" is particularly noticeable in the low level of
economic development, because the economy is still not able to support a high
number of jobs in sectors with high productivity (Bosma et al., 2012; Parker, 2004).
As the economy matures, the level of entrepreneurial activity "driven by necessity" is
decreasing, while the productive sectors provide greater opportunities for
employment. This is followed by rise in "opportunity driven" entrepreneurial
activities (Parker, 2004; Stevenson, 2006; Williams, 2008). This change in the cause
of entrepreneurial activity is called the "U - curve" hypothesis (Zoltan J. Acs et al.,
2008; Bosma et al., 2008; Wennekers & Thurik, 1999; Wennekers, Van Wennekers,
Thurik, & Reynolds, 2005). Although there is considerable support for the hypothesis
of a U-curve, it only displays the route and does not reflect the full complexity of the
cause-effect relationship between entrepreneurship and economic growth.
Fig. 4.2. Nascent entrepreneurship versus per capita income in PPP, the U-curve
Source: (Bosma et al., 2008)
88
Economic growth can be affected by entrepreneurship in numerous ways.
There is general agreement on the importance of entrepreneurship for economic
growth (Z. J. Acs & Szerb, 2007; Carree & Thurik, 2010; Larroulet & Couyoumdjian,
2009; Morrison, 2000; Stephens & Partridge, 2011; Wennekers & Thurik, 1999;
Wiklund, Davidsson, & Delmar, 2003). Entrepreneurs boost innovation, accelerate
structural changes in the economy and force existing businesses to improve their
efficiency and thus provide an indirect contribution to increased productivity
(Audretsch, 2009; Berchicci & Tucci, 2008; Bessant & Tidd, 2011; Fagerberg,
Mowery, & Nelson, 2006; Parker, 2004; Studies, 2010).
4.3. Rural entrepreneurship
Although there are large socio-economic differences between urban and rural
regions majority of components and the context of entrepreneurship are defined for
rural regions in the same way as for urban. From entrepreneurship perspective, rural
areas are distinctive from urban areas. Rural areas have unique context for small
businesses that are managed in the consistent with the rural socio-cultural values.
Rural areas are facing unique challenges in the start-up and grow of enterprises. These
challenges are structured in three groups: characteristics of the business environment;
characteristics of rural populations; and aspects of the existing economic structure
(Smallbone, 2005).
1. Characteristics of the business environment in rural areas includes:
Small size of local markets - rural enterprises more often are facing small size of
local markets allied with low population and per capita income. However sectors as
service and retail are affected by this disadvantage due to the fact that they sell locally
on the other hand manufacturing or hospitality sector makes fewer sales to local
residence and it is not affected by the market size.
Rural labor market characteristics – more often access to skilled labor is
constrain to rural enterprises. Occupational composition of rural labor market is small
and narrow with lower level of education. As a result to the diversification and
development of emerging sectors in rural areas as hospitality or IT sector skilled labor
is necessity. Rural labor market in this sense is large constraint.
Transport and communication infrastructure – transportation due to the
remoteness of the rural areas pose a challenge for the rural entrepreneurship.
89
Infrastructure in this context is particular important. It affects in large scale the ability
of some region to attract people and investments and the possibility of
entrepreneurship. Telecommunication as transport infrastructure is important as it
helps local businesses to overcome the barrier of distance and provides development
of other sectors as IT and services without full time office staff.
Access to finance – rural businesses as other small scale ventures lack sufficient
access to finance. This is due to the fact that banks and investors try to avoid small
firms with low growing potential, which are the most common in rural areas.
Institutional environment – local institutions or local self-governance is a
crucial factor influencing entrepreneurship in rural areas. They play a major role in
enabling conditions for development and grow of rural enterprises.
2. Characteristic of rural population:
Entrepreneurial culture and attitudes - Entrepreneurial culture as general set of
values, is important for the development of entrepreneurial activities in a society.
Even growth differences may be related to differences in entrepreneurial culture. In
the rural context the set of values can largely defer from urban. Rural areas are
characterized by typical socio-cultural values that in many ways affect SMEs
development. Only as an example rural population has different gender roles for
entrepreneurhip, co-operation manners, ways of communications etc.
Social capital – social capital in rural communities is a resource for
entrepreneurship. It is characterized by long term, smaller, denser kinship
relationship. It involves networking formal and informal, social trust and engagement
in voluntary activities. High level of social capital assists entrepreneurs in accessing
resources for their success.
In-migration – as process of migration from urban to rural areas can involve
people with specific entrepreneurial or business experience. This could lead in
increase of the entrepreneurial capacity of a rural region. However this is
characteristic of more developed countries and rarely the case in developing countries
as RM.
3. Characteristics of rural enterprises and the economic structure of rural areas:
Size – most of the studies on businesses in rural areas are suggesting that
businesses in rural areas tend to be smaller, with a higher proportion of micro
90
entreprices. Micro businesses are largest group, although in some regions they mostly
consist of solo proprietors without formal labor. This makes this businesses vary hard
to reach or to help by external advisory services and in some cases vary inefficient.
Sectoral mix – in the last decade new economic activities as manufacturing and
services has moved into rural areas and provided more jobs contrary to the traditional
industries such as farming. But not all rural areas are at the same level of economic
diversification there are still areas that are dependent on one large manufacturing
plant. However agriculture in many rural areas is still important economic activity
although the involvement of the rural workforce in agriculture has significantly
decline. As a result of high level of market competition in agriculture and support to
diversification, farmers are entering different sectors as retailing, sport and recreation,
services and tourism.
Innovation - Innovation is a process of finding better solutions for meeting new
or existing requirements. Entrepreneurs are key players in the innovation process and
international competitiveness. Innovation can be crucial in a rural context. It can
improve the productivity of existing business or encourage engagement in new ones
as tourism with linkage to traditional activities such as farming.
4.4. Entrepreneurship in tourism and hospitality
Tourism is one of the largest and fastest growing industries. As Ateljevic (2009)
defines it ―tourism is a social phenomenon associated with human travel for different
pursuits including business, leisure, pleasure, religion, education, security and
politics‖. This definition later on is extended due to the activities travelers enter
before, during and after the travel experience. Tourism in the work of Ateljevic
(2009) is complex phenomenon or a product defined as a ‗package‘ of five
components: destination, attractions, facilities, accessibility, images and price. It is
product driven by the curiosity of the traveler. Curiosity consequently is the main
pillar of many tourism products and it is core entrepreneurial ability in the process of
tourism development.
Tourism can take many forms as:
Nature-based tourism attracts travelers interested in nature. It is often seen as
a segment of rural tourism and usually includes variety of activities as hunting,
91
fishing, hiking, camping, farming etc. It is well connected to the ecotourism as
an additional segment of rural tourism;
Spa and wellness tourism attract travelers seeking mental, physical and
spiritual restoration and recover. It uses natural and mineral waters and other
natural products, sports, massage, saunas etc. in the satisfaction of customer‘s
needs;
Adventure tourism is to large extend connected to nature tourism as a result to
the fact that nature abound with adventure product. This form of tourism is
connected to the risk factor and can include different activities as trekking,
rafting, paragliding, mountain biking, parachuting etc.;
Mountain and winter tourism is connected to the winter sport activities as
skiing and in recent years to summer mountain activities as hiking and
mountain biking;
Maritime tourism is so called ―sea, sand and sun‖ tourism especially
developed in the Mediterranean countries as a market demand of the
Europeans summer holidaymakers which is the world largest tourist market.
This form of tourism accounts for one third of the total tourism demand in
Europe;
Religious tourism is associated with spiritual and religious offering to the
believers. It is a form of tourism in which travelers are offered experience of
sacred places and events;
Urban and culture tourism is the tourism of short trips to easily accessible
cities. This tourism in the resent years is fast growing as a result to the
increased transport access.
There is large list of countries in the world that economically entirely rely on
tourism sector. Tourism sector has the ability to generate revenue in different ways as
a result of the concept of tourism multipliers (Archer, 1982; Wanhill, 1994) and
therefore has greater economic impact. Recently, in order to be measured the
economic impact of the tourism industry to the GDP, new measure was introduced
and statistical approved by OECD and WTO named Tourism Satellite Accounts
(TSA) (Frechtling, 2010; Smeral, 2006). TSA is a statistical method employing the
System of National Accounts (SNA) in measuring the size and distribution of
different forms of tourism consumption and its contribution to GDP, employment,
92
income and other macroeconomic measures of the country‘s economy (Frechtling,
2010).
Despite the great contribution of scholars research in the tourism sector linked
to the economic development of country, region or place (Andrew, 1997; Cooper,
1988; Holzner, 2011; H. J. Kim, Chen, & Jang, 2006; Place, 1991; Rogerson, 2014;
Rosentraub & Joo, 2009; Sathiendrakumar & Tisdell, 1989; Vanhove, 2011; Var,
Toh, & Khan, 1999) and TSA research (Ahlert, 2007; Dwyer, Forsyth, Spurr, & Van
Ho, 2007; Dwyer, Forsyth, & Spurr, 2004, 2007; Frechtling, 1999, 2010; C. Jones &
Munday, 2007; Libreros, 2006; Smeral, 2006) the research in the field of
entrepreneurship and hospitality & travel industry is still small in size and effect.
Morrison at al. (1999), Thomas & Augustyn (2006), Getz at al. (2004) Ateljevic &
Page (2009) made grate contribution in the entrepreneurship and tourism research.
Ateljevic (2009) in his work evaluated the research articles published in one of the
seven refereed academic journals in the field of hospitality and tourism management
[Cornell Hotel and Restaurant Administration Quarterly (CHRAQ), International
Journal of Hospitality Management (IJHM), Journal of Hospitality and Tourism
Research (JHTR), International Journal of Contemporary Hospitality Management
(IJCHM), Annals of Tourism Research (ATR), Tourism Management (TM)] related to
entrepreneurship, entrepreneur, small business, family business, emerging venture and
entrepreneurship in the period between 1986 and 2006. The result was that out of the
total 4,917 articles published, 97 addressed entrepreneurship, amounting to about 2%.
Out of 97 published articles, 72 articles were empirical research and 25 theoretical
articles. The study analysis even the used methodology and data collection.
Furthermore, suggests research with combination of qualitative and quantitative
methods and expanding the field of research to women and ethnical minority and
entrepreneurship due to the fact that most of the previous research was in the field of
‗small businesses‘.
Getz at al. (2004) in their work on family business in tourism and hospitality
noted the importance of family business in tourism sector referring that in Europe
95% of tourism businesses are microbusiness in family segment. Getz analyses
previous research on family business from different perspectives elaborating the
definition on family business, the life cycle models for the family business by Gersick
at al. (1997) putting the family business in the framework of tourism and hospitality.
Getz in his work makes a model of tourism and hospitality family entrepreneurship
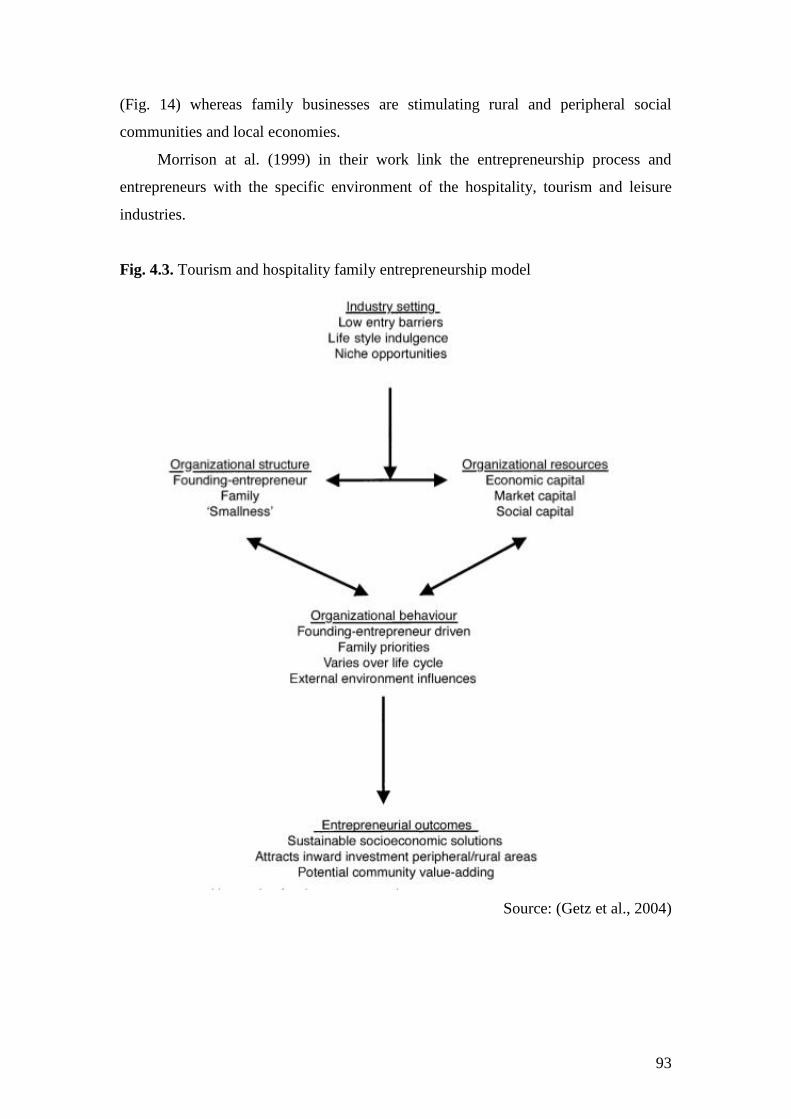
93
(Fig. 14) whereas family businesses are stimulating rural and peripheral social
communities and local economies.
Morrison at al. (1999) in their work link the entrepreneurship process and
entrepreneurs with the specific environment of the hospitality, tourism and leisure
industries.
Fig. 4.3. Tourism and hospitality family entrepreneurship model
Source: (Getz et al., 2004)

94
95
5. FACTORS INFLUENCING BUSINESS AND ENTREPRENEURSHIP SUCCESS
5.1. Defining business success
SME‘s in the form of family businesses, self-employment and small
enterprises are most dominant forms of business in rural tourism sector in Europe
(Getz et al., 2004; Lee-Ross & Lashley, 2010) and in Republic of Macedonia
measured by the data on active enterprises in tourism sector situated in rural areas
(Metodijeski, 2012; Taleska, 2009). Middleton (2001) indicate that micro-enterprises
and most of them family businesses are accounting for 95% of active businesses in
tourism sector in Europe. The success of these forms of businesses in the literature is
measured by two criteria, financial and non-financial criteria, or more accurately with
mix of these two criteria. Conventionally and with more literature attention, business
success has been measured by financial performance of the enterprise in terms of
profit, turnover or return of investment or on base of employee numbers (Barkham,
Gudgin, & Hart, 2012; Jim Curran & Blackburn, 2000; Kelmar, 1991; Parker, 2009).
In terms of owners‘ goals and needs, obtaining or sustaining profitability and
increasing the value of the business are most important attributes of success (Getz et
al., 2004). This financial measurement of success use the assumption that all
businesses are made with intention of grow and therefore they measure the increase of
profit and employees. Although most scholars use economics measures for business
success measurement there is strong evidence that not all businesses are made for
profit. Jennings and Beaver (1997) contribution to this statement add that using only
financial criteria does not refers to all enterprise owners‘ goals. They defined success
as ―the sustained satisfaction of principal stakeholder aspirations‖.
Contrary to popular belief, and a great deal of economic theory, money
and the pursuit of a personal financial fortune are not as significant as
the desire for personal involvement, responsibility and the independent
quality and style of life which many small business owner-managers
strive to achieve. Consequently, the attainment of these objectives
becomes one of the principal criteria for success, as defined by the
entrepreneur/owner-manager”.
(Jennings & Beaver, 1997, p. 63)
96
Ateljevic and Doorne (2000) in their study concluded that lifestyle
entrepreneurs are balancing between economic performance and sustainability in
sociocultural and environmental terms. They fined that lifestyle entrepreneurs are
willing to diminish their profits in order to obtain sustainable development as long as
they meet their goals. Further, Walker and Brown (2004) apply non-financial criteria
to measure business success in small business sector. In their work they found that
―owners of small businesses measure their success using both criteria, and that the
non-financial lifestyle criteria are sometimes more important‖ (Walker, 2004, p. 588).
The concept of success is unique to each industry group and it differs even from
organization to organization in one sector due to the owners‘ perception of success
(Beaver, 2002).
Greenbank (2001) concluded that ―micro-business owner-managers often
pursued a number of diverse objectives. In the main, they tended to relate to personal
rather than business criteria, and often involved both economic and non-economic
objectives‖ (Greenbank, 2001, p. 123)
There is strong evidence in the literature about the importance of non-financial
measures of business success used by business owners. These measures presented as
autonomy in the work and time, job satisfaction, obtaining certain lifestyle,
community recognition are usually more subjective and consequently difficult to
quantify compared to the financial measures of success. However, the non-financial
measures as stated previously can exist only in mix with financial measure or
presumption that there is curtain level of financial security already established within
the business or the business is not primary source of income (Walker, 2004).
As elaborated, success in business, is a term that is difficult to define. In many
respects it differs depending on the firm's activities, the economic sector, the
environment and ultimately on the perception of success of the firm owner. Much
easer way of defining and measuring business success used in extent of research is
―continued activity‖ or firm existence with or without use of financial measures as
profit, growth and employment. This definition is rather simple due to the fact that
one business might continue to exist and therefore be categorized as a success but
might continue to disappoint its owners by not achieving owners goals (Rogoff et al.,
2004) on the other hand business could be closed and that may not be failure because
owner meet their goals (Headd, 2003).
97
Metodijeski (2012) in the analysis of rural tourism in the Republic of
Macedonia shows the same impression of the business success between rural tourism
entrepreneurs based on owners goals and desires for starting the business. Interview
respondents (rural tourism entrepreneurs) stated that main goal or reason for engaging
in rural tourism was financial reasons 34%, nevertheless also significant are displayed
favorable living conditions of a particular place 20%, the desire to develop the place
(place identity) 32% and desire to create a family business 14%. This is just further
proof that success in a variety of entrepreneurs is difficult to determine because of the
different expectations among entrepreneurs.
5.2. Critical success factors
Critical Success Factors (CSF) are: ―those few things that must go well to
insure the success of an organization‖ (Boynton & Zmud, 1984). Among small
businesses often the enterprise reflects the personal characteristics, vision and
behavior of the entrepreneur although the shape and success of the enterprise can be
given to large extend by external environment. Curran et al. (1986) argue that
previous characteristics are mixed and that successful entrepreneur is made by
shaping the personality and knowledge of the individual by outside influences of
society and the environment. Many researchers has worked and tried to define the
characteristics of successful entrepreneur (Beaver, 2002; James Curran et al., 1986;
Jim Curran & Blackburn, 2000; Gadenne, 1998; Lundberg & Fredman, 2012;
Simpson et al., 2004; Watson et al., 1998). Consequently since Bolton Report (1972)
which emphasized the special role of the founder in small businesses, great amount of
research has been performed to discover and measure what characteristics to what
extend are conducive to small business success.
Keats and Bracker (1988) developed small business performance model (Fig.
17) based on six factors arranged in tree groups: General Environment, Task
Environment and Personal Characteristics. The first group, General Environment,
comprehends ―Behavioral Strategic Sophistication‖ identified as employment of
strategic management practices and ―Cognitive Strategic Sophistication‖ identified as
understanding of strategic management practices. Second group, Task Environment,
includes ―Task Environment Factors‖ identified as firm‘s relationship to customers,
competitors, suppliers and regulatory agencies. The third group, Personal
98
Characteristics is comprised of ―Entrepreneurial Intensity‖ behaviors that distinguish
entrepreneurs from others and ―Task Motivation‖ composed of locus of control, need
for achievement, avoiding risks, feedback of results, personal innovation and planning
for the future.
Chawla et al. (1997) identified eleven critical success factors based on three
categories. The first category ―Task Environment‖ was comprised of seven factors:
supplier/vendor relations, human resources, industry trend, location issues, competitor
analysis and purchasing inventory control. The second category ―General
Environment‖ was related to economic environment. And the third category identified
as ―Personal Characteristics‖ presented owner experience and goal orientation. Later
Chawla at al. (2010) researched CSF in different countries finding that CSFs may be
different given the variation in country cultural, political and economic situation.
Gadenne (1998) compares small business success factors in different industries
as retail, service and manufacturing. In his work he analyze list of owners‘
characteristic in each of the industries as: leadership, risk-taking, independence, self-
confidence, ambition and persistence. Owners‘ characteristics and objectives Gadenne
(1998) is relating to financial measurement of success and management practices.
Watson et al. (1998) undertakes empirical research of large number of personal,
business and environmental characteristics of businesses and relates them to the
outcome as failure, survival or growth. Watson at al. (1998) states that ―successful
entrepreneurship is undoubtedly a complex phenomenon and both internal and
external factors impact on business performance‖. In the research framework (Fig.
15) they developed two environments: internal and external composed of list of
factors and characteristics of the founder and the business.
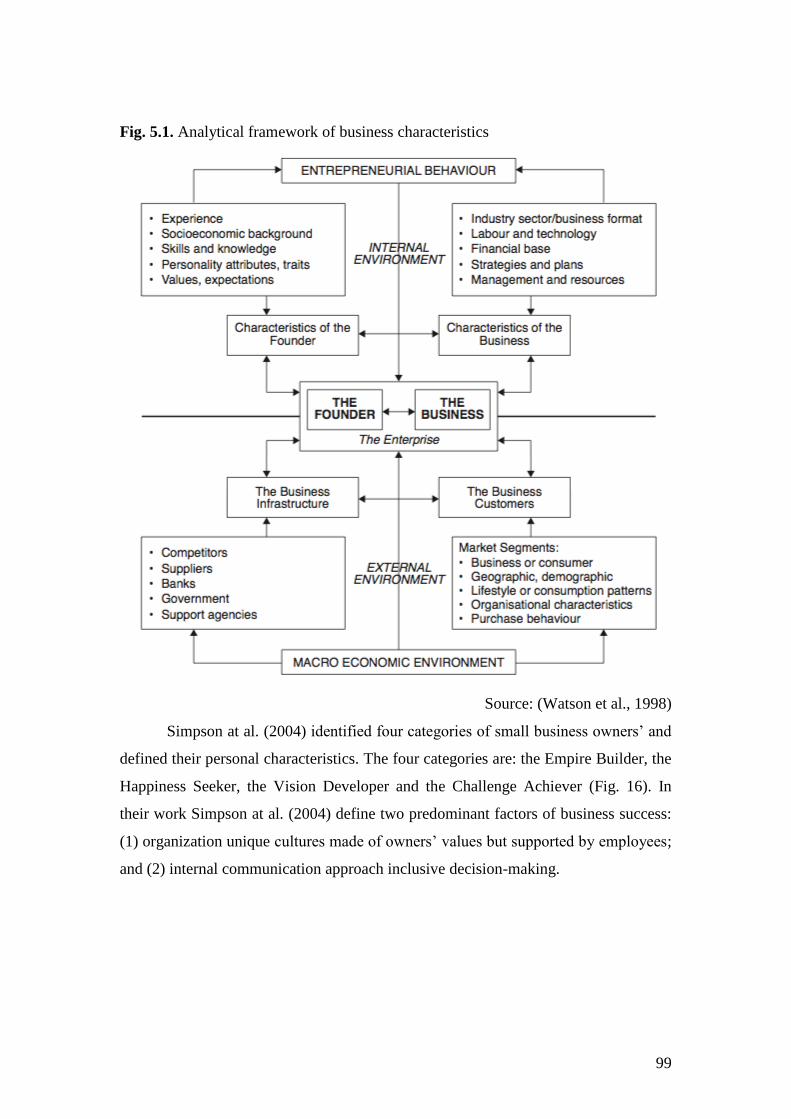
99
Fig. 5.1. Analytical framework of business characteristics
Source: (Watson et al., 1998)
Simpson at al. (2004) identified four categories of small business owners‘ and
defined their personal characteristics. The four categories are: the Empire Builder, the
Happiness Seeker, the Vision Developer and the Challenge Achiever (Fig. 16). In
their work Simpson at al. (2004) define two predominant factors of business success:
(1) organization unique cultures made of owners‘ values but supported by employees;
and (2) internal communication approach inclusive decision-making.
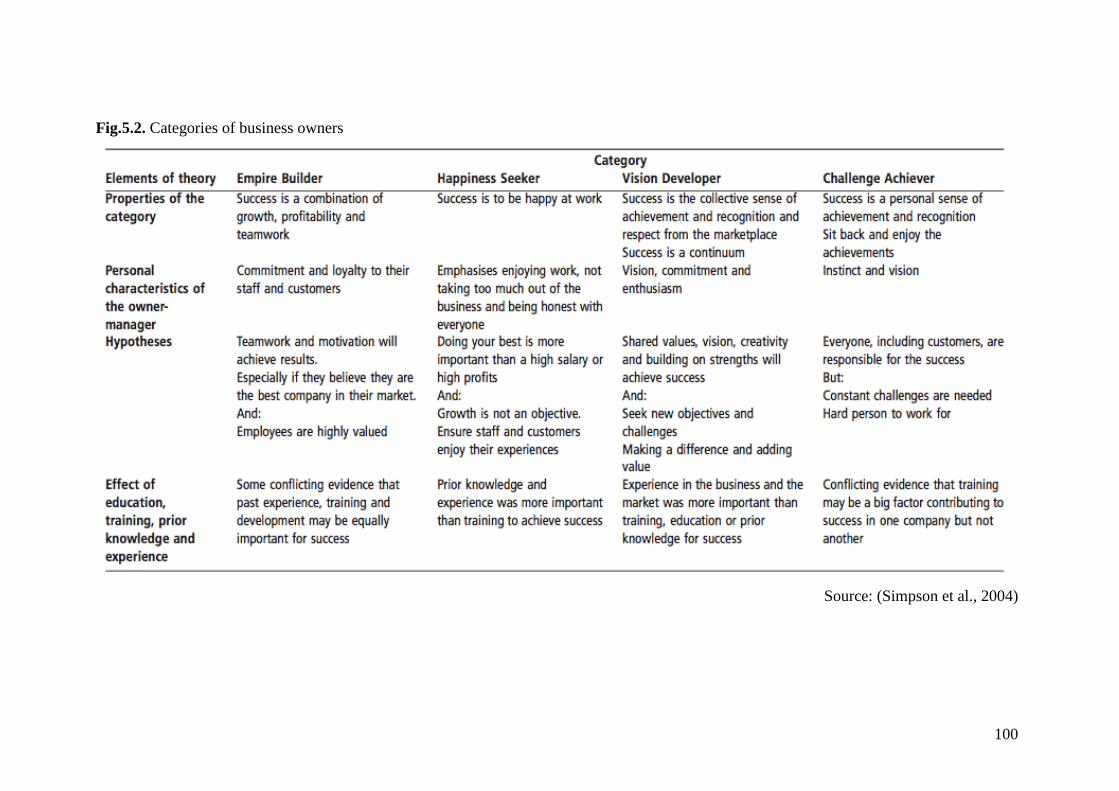
100
Fig.5.2. Categories of business owners
Source: (Simpson et al., 2004)
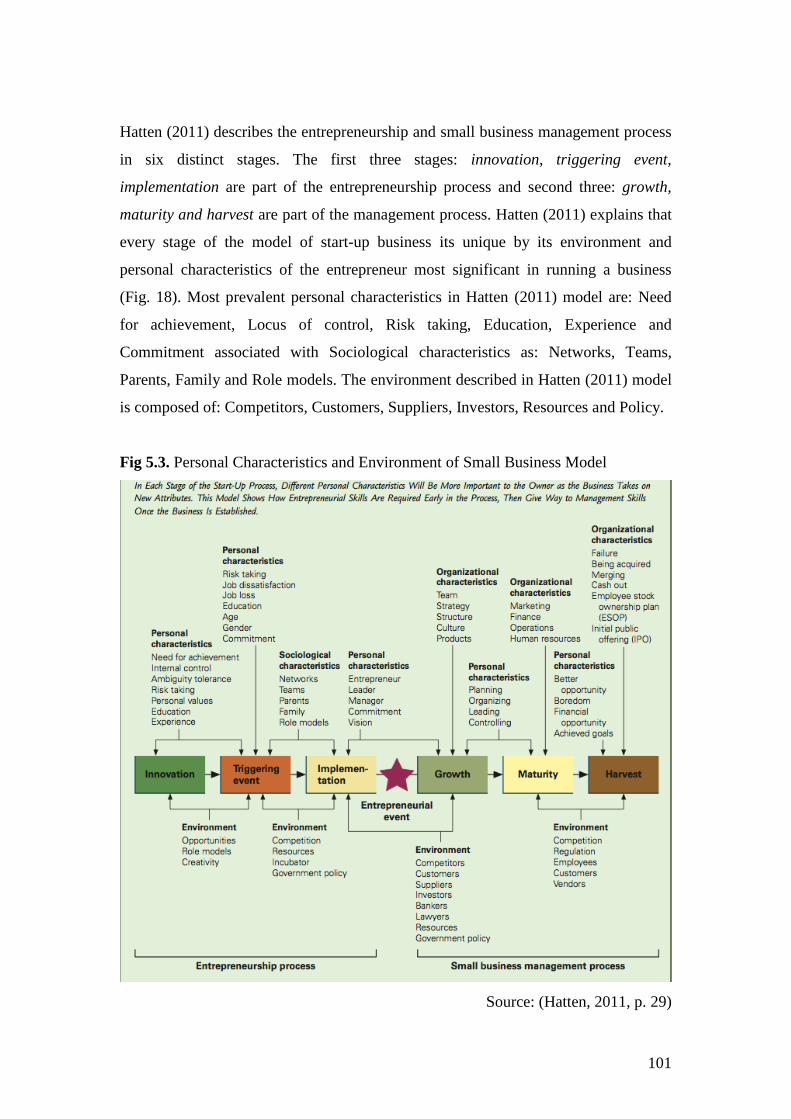
101
Hatten (2011) describes the entrepreneurship and small business management process
in six distinct stages. The first three stages: innovation, triggering event,
implementation are part of the entrepreneurship process and second three: growth,
maturity and harvest are part of the management process. Hatten (2011) explains that
every stage of the model of start-up business its unique by its environment and
personal characteristics of the entrepreneur most significant in running a business
(Fig. 18). Most prevalent personal characteristics in Hatten (2011) model are: Need
for achievement, Locus of control, Risk taking, Education, Experience and
Commitment associated with Sociological characteristics as: Networks, Teams,
Parents, Family and Role models. The environment described in Hatten (2011) model
is composed of: Competitors, Customers, Suppliers, Investors, Resources and Policy.
Fig 5.3. Personal Characteristics and Environment of Small Business Model
Source: (Hatten, 2011, p. 29)
102
In the process of identification of factors contributing to business success
Rogoff at al. (2004) made a list of internal and external factors on the bases of relation
of the factors to the entrepreneur. Internal factors were ones that are directly relate to
the entrepreneur and the factors that were referring to outside conditions were
identified as external. Main internal factors identified in Rogoff at al. (2004) work
were individual characteristics (e.g. experience, knowledge, dedication) and
marketing activities (e.g. advertising, good customer service, effective
communication). From the external factors most dominant were financial and
economic conditions. From the success contributing factors 92.1% were internal
factors.
Examining business success factors perceived by small rural entrepreneurs
Kader at al. (2009) reveals that most important external factors are government
assistance in training and extension service, the external environment, market support
by the government, market accessibility and networking. Internal factors included
entrepreneurial quality (as most important), pricing, delivery and services and human
resource.
In the last 20 years there is a large amount of research conducted in the field of
success factors in small businesses. For the purpose of this study author analyze the
research preformed in the field of success factors in small business using Scopus,
largest abstract and citation database. The analysis was based on articles and
conference papers with subject area of Life Sciences and Social Sciences &
Humanities. The period of publishing was set at 20 years consequently the research
analyzed articles released from 1994. The analysis was limited to use of several
keywords in the field of Article title, abstract or keyword i.e. enterprise, success
factors and tourism. With no limit on the publishing academic journal or industry, the
analysis results shows 817 articles and conference papers published. Five most
referenced academic journals were: International Journal of Business Information
Systems, Business Process Management Journal and Industry Management and Data
Systems (with 16 articles each), Lecture Notes in Business Information Processing
(with 15 articles) and International Journal of Enterprise Information Systems (with
12 Articles). Compared by document type: 71.8% were articles, and 28.2% were
conference papers. Dominant subject area has been Business Management with
64.6% or 528 documents; followed by Decision Sciences (29.1%) and Computer
103
Sciences (27.2%). The analysis of the published articles limited to tourism sector and
success factors reveals 84 published articles. Although the data shows representation
of over 40 academic journals most referenced are: Tourism Management (with 8
articles and SJR index 1.961 in 2013), Journal of Travel Research (with 4 articles and
CJR index 1.958 for 2013), International Journal of Tourism Research, Journal of
Travel and Tourism Marketing (with 3 Articles each and SJR indexes 1.093 and 0.66
for 2013, respectably). By document type 91.7% were articles with Business
management & Accounting and Social Sciences most represented subject area. Data
of documents limited to ―rural‖ reveals presence of only nine published articles.
The 84 published articles in tourism sector in extend to success factors were
limited to Academic Journals with Q1 ranking in 2013 based on SJR (Scientific
Journal Ranking) according to SCImago Journal and Country Rank. The result show
23 document published in 9 academic journals. Although a small number of articles
(23) are fined there is great diversity in the type and aim of research. Von der Weppen
& Cochrane (2012) researched success factors of social entrepreneurs in tourism
sector. They find out that touristic social enterprises operate similarly to those in other
sectors and that ―the most likely success factors are strong leadership, clear market
orientation and 103 rganizational culture, which balances financial with
social/environmental aims‖. Getz & Brown (2006) made comparison of previous
studies of critical success factors and the one‘s in wine tourism. Augustyn & Knowels
(2000) worked on identification of critical success factors for partnership between
public and private sectors at tourism destinations. Panyik at al. (2011) describes key
success factors of the event-based approach to Integrated Rural Tourism (IRT) as
conceptualized in Saxena at al. (2007) work. Eligh at al. (2002) suggests that
leadership, external funding, support from appropriate external agencies and the
existence of consumer demand are key success factors in sustainable tourism
destination management. There are studies that measuring success factors and
destination competitiveness (Dwyer & Kim, 2003; Mazanec, Wober, & Zins, 2007),
culture and culinary tourism (Horng & Tsai, 2012; S. Wang, Yamada, & Brothers,
2011), internet and small hospitality enterprices (Hudson & Gilbert, 2006; Y. H. Kim
& Kim, 2010; Mutch, 1995; Y. Wang, 2006).
Although there is a vast research of small business success factors the
comparative research between different sectors and in depth research of success
factors in tourism sector is still insufficient. Considering narrower branch of tourism
104
such as rural tourism the scarcity is even larger. Among studies based on success
factors and rural tourism (A. Anderson & Law, 2012; Baum, 2011; Gramm &
Tappeiner, 2009; Hammer & Siegrist, 2008; Kajanus, Kangas, & Kurttila, 2004;
Kontogeorgopoulos, Churyen, & Duangsaeng, 2014; Lundberg & Fredman, 2012;
Panyik et al., 2011) most relevant to rural tourism was Lundberg and Fredman (2012)
research with focus on success factors and constraints among nature-based tourism
entrepreneurs. They divided the success factors in two broad groups:
(1) internal environment that can be divided in two groups: (1) that deals with
entrepreneur characteristics as: experience, socioeconomic background, skills
and knowledge, personality attributes and traits, values and expectations,
recruitment, training, commitment of employees and effective
communication; and (2) that deals with business characteristics such as
industry sector/business format, labor and technology, financial base,
strategies and plans, management and resources;
(2) external environment that can be divided into (1) business infrastructure:
competitors, suppliers, banks, government, support agencies and networking.
Another group deals with; (2) customers and business segments related to
geographic and demographic, and (3) life, or consumption patterns and
purchase behavior.

105
106
6. DATA ANALYSIS
The research methodologically was divided in two stages. The first stage
subsequently to the extended literature review of related theory involved qualitative
research applying life story interviews with rural tourism entrepreneurs. The purpose
of the first stage of the research was to explore and support theory findings, develop
list of crucial factors that influence entrepreneurial success in rural tourism and
support the development of construct measures for the second stage of the research.
The second stage of the research involved quantitative research of previously defined
crucial success factors. In the second stage empirically are analyzed the relations
between five abstract constructs: social capital, human capital, personality, business
environment and success. In the qualitative research indicators measured constructs.
Indicators are variables results collected by questionnaire with rural tourism
entrepreneurs.
6.1. First stage data analysis qualitative research – life story interviews
As indicated by Atkinson (1998) storytelling is a fundamental form of human
interaction and communication. It is in the human nature to think and express trough
stories. Storytelling is a form of giving narrative account of an event and most
traditional form of learning in many human cultures for centuries. The life story as
narrative form has evolved from life history. It is qualitative research method for
gendering information on person‘s life core accomplishments. It starts as recorded life
story that is later transcribed and ends as finished product that is entirely a first person
narrative.
The researcher has several roles in the life story interview. In the first part after
deciding who is going to be interviewed depending primarily on the research goal,
which was in this research to define factors that influence entrepreneurial success in
rural tourism, the role of the researcher is to explain the purpose of the research to the
storyteller. Therefor all five entrepreneurs that were identified for life story interviews
were well aware of the purpose and the goal of the research and interviews.
Introducing the participants to the purpose of the study contribute to narrowing the
scope of the life story to the events related to the purpose of the research. This process
of narrowing the life story it is the second important role of the researcher in the
107
process of interviewing. In this regard the role of the researcher is to lead the
interview and by making open-ended questions on topics concerning the research.
This process should not make changes to the story that is being told on contrary it
should just focus the storyteller on the topic and go deeper into the story when it is
needed. Therefore the life story interview consists of an open-ended process where
the researcher is never really in control of the story that is being told.
There are several risks in the life story interviews technique. Most important one is
that the story told is subjective story or so-called personal truth of the storyteller. It is
made of ―facts and fictions‖ which can lead to wrong or subjective conclusions. The
best solution of this risk of life story interview recommended by Atkinson (1998) was
to run internal consistency of the story while interviewing. This entails that what is
told in one part of the story should not be contradictory to other parts of the story.
The life story interviews as first stage of the data collection and analysis process were
conducted with entrepreneurs from Macedonian rural tourism sector engaged in rural
tourism accommodation business. The entrepreneurs were chosen according to the
location and the level of commitment to the business sector. Concerning the location
the purpose was to have as much as possible stories from different geographical and
statistical regions of the country. Therefore the entrepreneurs that were interviewed
had running rural tourism accommodation businesses in five (out of eight) statistical
regions NUTS3 level. The regions and municipalities represented in the life story
interviews were: South-West region (Municipality of Vevčani); Pelagonia region
(Municipality of Kruševo); South-East region (Municipality of Gevgelia); East region
(Municipality of Berovo) and Polog region (Municipality of Mavrovo-Rostuše). (see
Map 1 – Life story interview municipalities location). Additionally the municipalities
that were chosen were municipalities with well-established rural tourism sector and
stated in the NSRT 2012-2017 as proposed rural tourism destinations.
The entrepreneurs that were interviewed were chosen according to their commitment
to the businesses. All five businesses were state of the art rural tourism businesses
satisfying all requirement stated by different scholars on the topic (Clark & Chabrel,
2007; D. R. Hall & Kirkpatrick, 2005; Keane, 1992; Lane, 1994; OECD, 1994; Page
& Getz, 1997). Therefore they were as ―representatives‖ of entrepreneurs involved in
rural tourism accommodation sector. The actual size of the running business, gender,
registration form or other important structural variables were not taken into account in
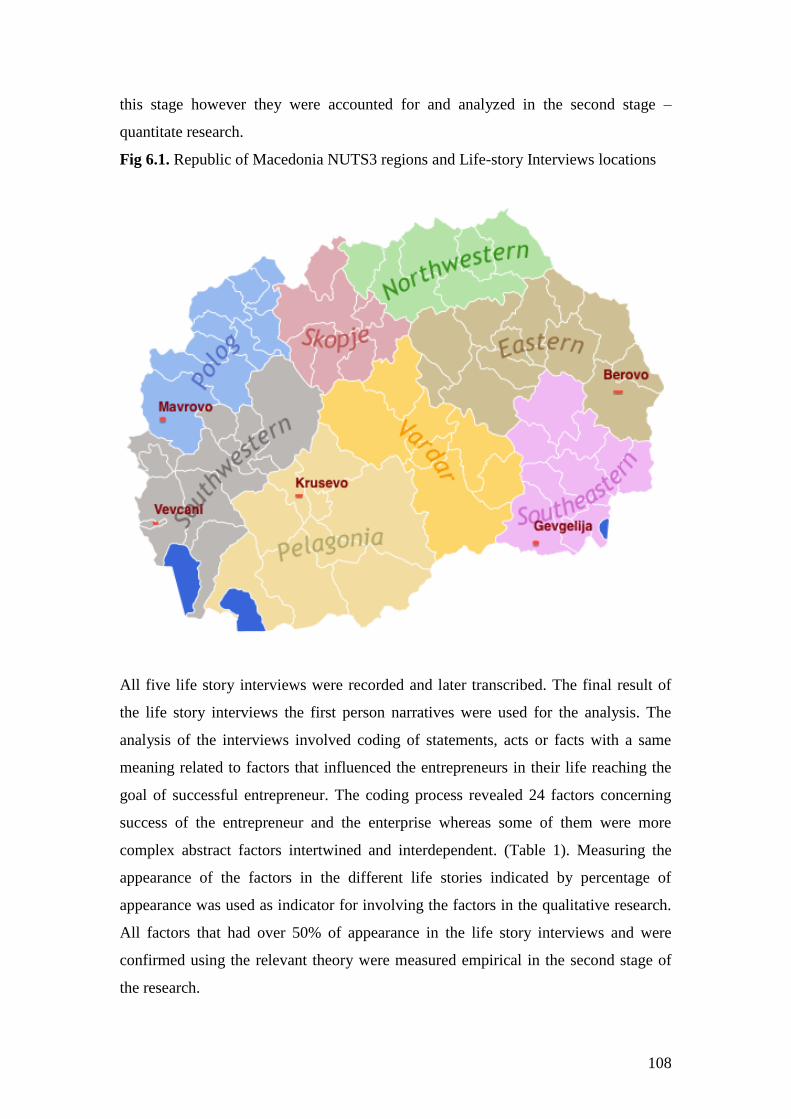
108
this stage however they were accounted for and analyzed in the second stage –
quantitate research.
Fig 6.1. Republic of Macedonia NUTS3 regions and Life-story Interviews locations
All five life story interviews were recorded and later transcribed. The final result of
the life story interviews the first person narratives were used for the analysis. The
analysis of the interviews involved coding of statements, acts or facts with a same
meaning related to factors that influenced the entrepreneurs in their life reaching the
goal of successful entrepreneur. The coding process revealed 24 factors concerning
success of the entrepreneur and the enterprise whereas some of them were more
complex abstract factors intertwined and interdependent. (Table 1). Measuring the
appearance of the factors in the different life stories indicated by percentage of
appearance was used as indicator for involving the factors in the qualitative research.
All factors that had over 50% of appearance in the life story interviews and were
confirmed using the relevant theory were measured empirical in the second stage of
the research.
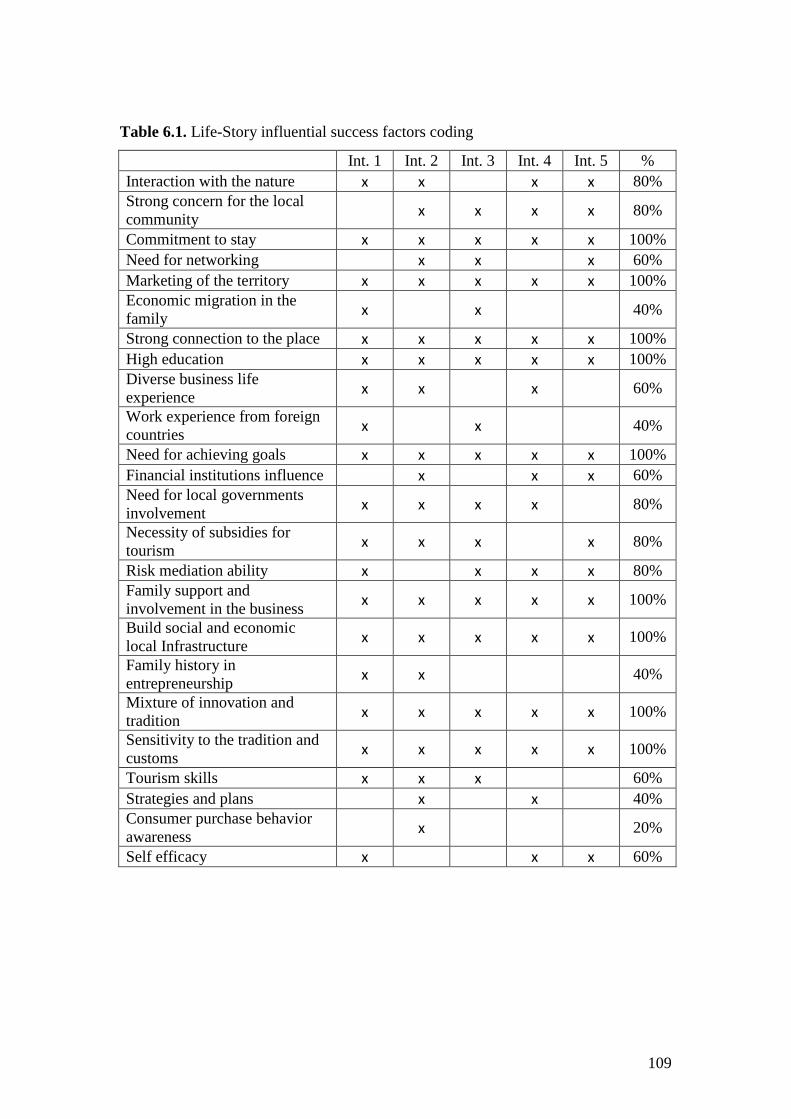
109
Table 6.1. Life-Story influential success factors coding
Int. 1 Int. 2 Int. 3 Int. 4 Int. 5 %
Interaction with the nature x x
x x 80%
Strong concern for the local
community x x x x 80%
Commitment to stay x x x x x 100%
Need for networking
x x
x 60%
Marketing of the territory x x x x x 100%
Economic migration in the
family x
x
40%
Strong connection to the place x x x x x 100%
High education x x x x x 100%
Diverse business life
experience x x
x
60%
Work experience from foreign
countries x
x
40%
Need for achieving goals x x x x x 100%
Financial institutions influence
x
x x 60%
Need for local governments
involvement x x x x
80%
Necessity of subsidies for
tourism x x x
x 80%
Risk mediation ability x
x x x 80%
Family support and
involvement in the business x x x x x 100%
Build social and economic
local Infrastructure x x x x x 100%
Family history in
entrepreneurship x x
40%
Mixture of innovation and
tradition x x x x x 100%
Sensitivity to the tradition and
customs x x x x x 100%
Tourism skills x x x
60%
Strategies and plans
x
x
40%
Consumer purchase behavior
awareness x
20%
Self efficacy x x x 60%
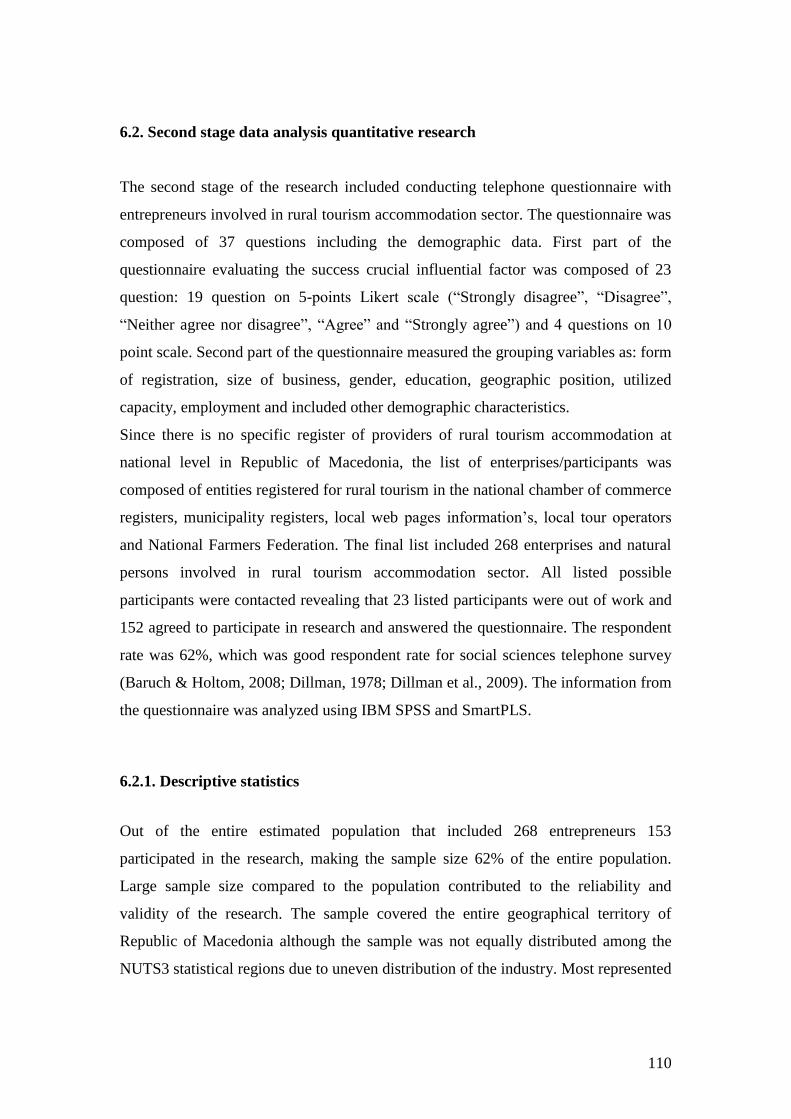
110
6.2. Second stage data analysis quantitative research
The second stage of the research included conducting telephone questionnaire with
entrepreneurs involved in rural tourism accommodation sector. The questionnaire was
composed of 37 questions including the demographic data. First part of the
questionnaire evaluating the success crucial influential factor was composed of 23
question: 19 question on 5-points Likert scale (―Strongly disagree‖, ―Disagree‖,
―Neither agree nor disagree‖, ―Agree‖ and ―Strongly agree‖) and 4 questions on 10
point scale. Second part of the questionnaire measured the grouping variables as: form
of registration, size of business, gender, education, geographic position, utilized
capacity, employment and included other demographic characteristics.
Since there is no specific register of providers of rural tourism accommodation at
national level in Republic of Macedonia, the list of enterprises/participants was
composed of entities registered for rural tourism in the national chamber of commerce
registers, municipality registers, local web pages information‘s, local tour operators
and National Farmers Federation. The final list included 268 enterprises and natural
persons involved in rural tourism accommodation sector. All listed possible
participants were contacted revealing that 23 listed participants were out of work and
152 agreed to participate in research and answered the questionnaire. The respondent
rate was 62%, which was good respondent rate for social sciences telephone survey
(Baruch & Holtom, 2008; Dillman, 1978; Dillman et al., 2009). The information from
the questionnaire was analyzed using IBM SPSS and SmartPLS.
6.2.1. Descriptive statistics
Out of the entire estimated population that included 268 entrepreneurs 153
participated in the research, making the sample size 62% of the entire population.
Large sample size compared to the population contributed to the reliability and
validity of the research. The sample covered the entire geographical territory of
Republic of Macedonia although the sample was not equally distributed among the
NUTS3 statistical regions due to uneven distribution of the industry. Most represented
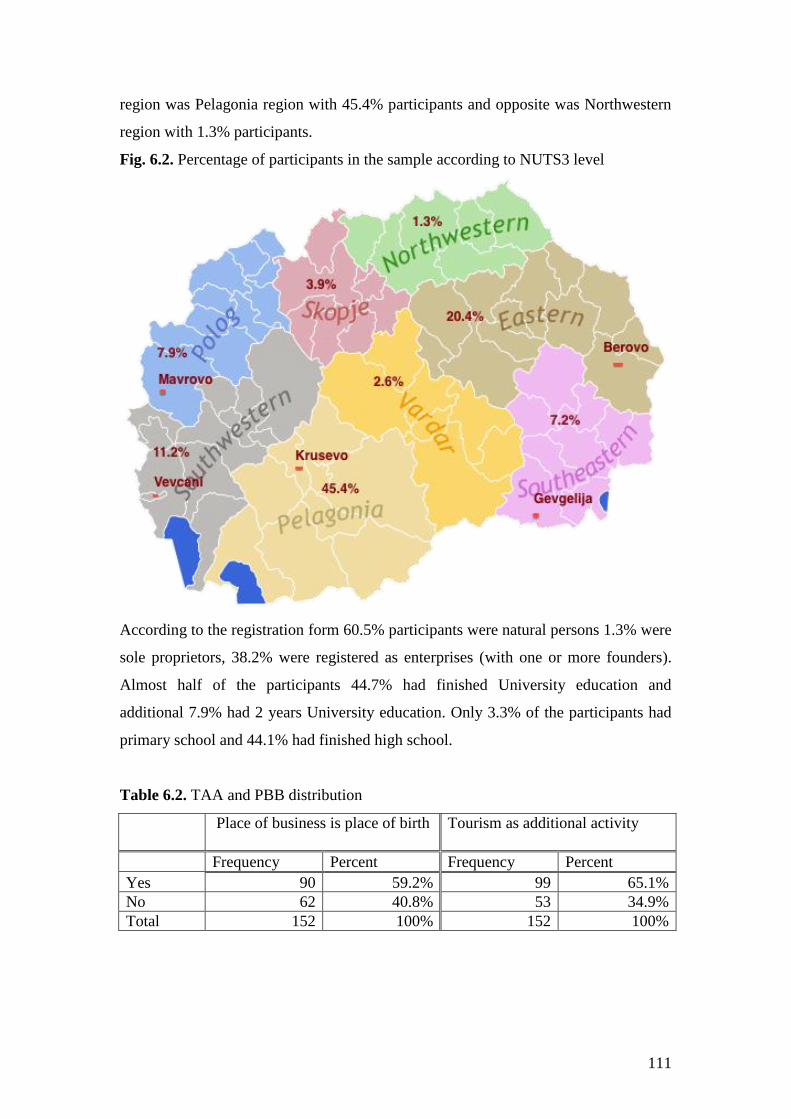
111
region was Pelagonia region with 45.4% participants and opposite was Northwestern
region with 1.3% participants.
Fig. 6.2. Percentage of participants in the sample according to NUTS3 level
According to the registration form 60.5% participants were natural persons 1.3% were
sole proprietors, 38.2% were registered as enterprises (with one or more founders).
Almost half of the participants 44.7% had finished University education and
additional 7.9% had 2 years University education. Only 3.3% of the participants had
primary school and 44.1% had finished high school.
Table 6.2. TAA and PBB distribution
Place of business is place of birth
Tourism as additional activity
Frequency Percent Frequency Percent
Yes 90 59.2% 99 65.1%
No 62 40.8% 53 34.9%
Total 152 100% 152 100%
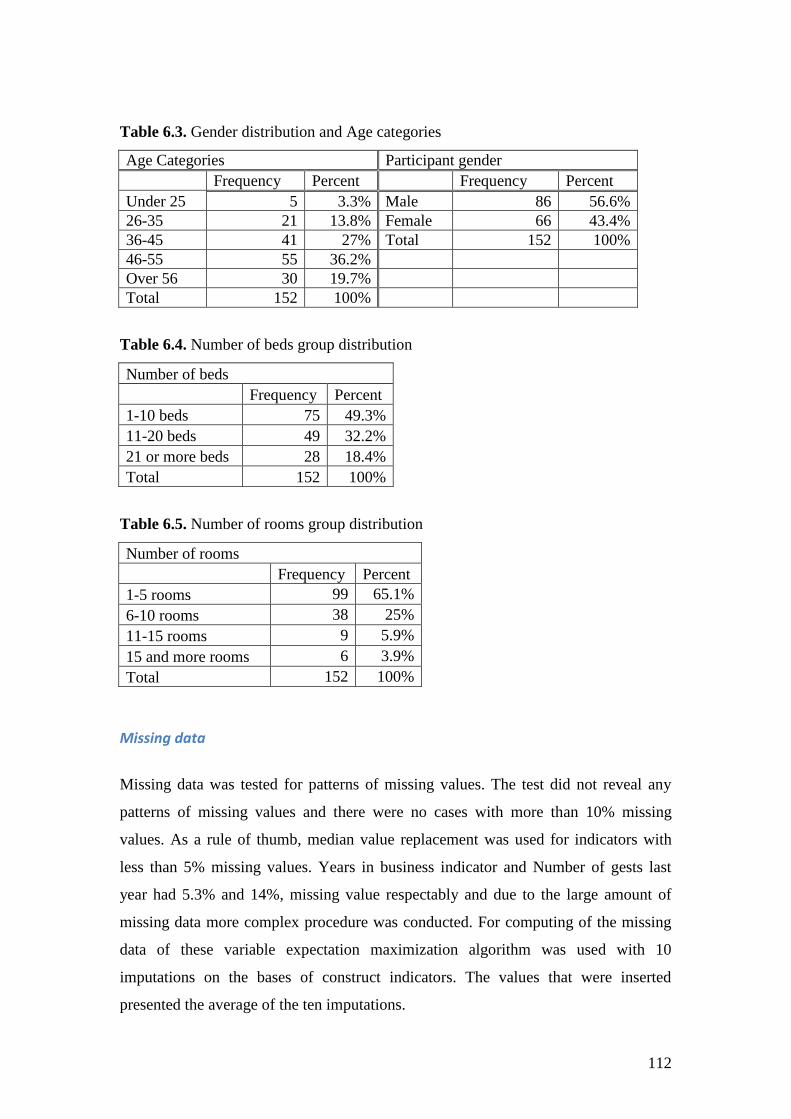
112
Table 6.3. Gender distribution and Age categories
Age Categories Participant gender
Frequency Percent
Frequency Percent
Under 25 5 3.3% Male 86 56.6%
26-35 21 13.8% Female 66 43.4%
36-45 41 27% Total 152 100%
46-55 55 36.2%
Over 56 30 19.7%
Total 152 100%
Table 6.4. Number of beds group distribution
Number of beds
Frequency Percent
1-10 beds 75 49.3%
11-20 beds 49 32.2%
21 or more beds 28 18.4%
Total 152 100%
Table 6.5. Number of rooms group distribution
Number of rooms
Frequency Percent
1-5 rooms 99 65.1%
6-10 rooms 38 25%
11-15 rooms 9 5.9%
15 and more rooms 6 3.9%
Total 152 100%
Missing data
Missing data was tested for patterns of missing values. The test did not reveal any
patterns of missing values and there were no cases with more than 10% missing
values. As a rule of thumb, median value replacement was used for indicators with
less than 5% missing values. Years in business indicator and Number of gests last
year had 5.3% and 14%, missing value respectably and due to the large amount of
missing data more complex procedure was conducted. For computing of the missing
data of these variable expectation maximization algorithm was used with 10
imputations on the bases of construct indicators. The values that were inserted
presented the average of the ten imputations.
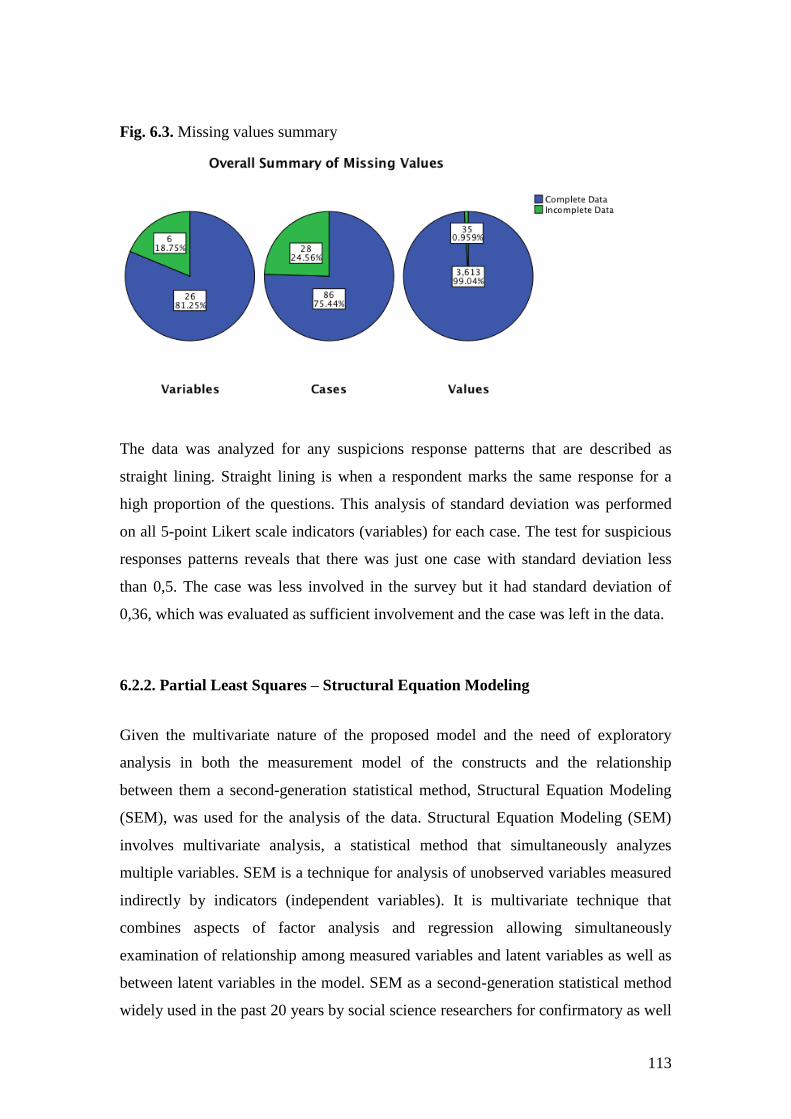
113
Fig. 6.3. Missing values summary
The data was analyzed for any suspicions response patterns that are described as
straight lining. Straight lining is when a respondent marks the same response for a
high proportion of the questions. This analysis of standard deviation was performed
on all 5-point Likert scale indicators (variables) for each case. The test for suspicious
responses patterns reveals that there was just one case with standard deviation less
than 0,5. The case was less involved in the survey but it had standard deviation of
0,36, which was evaluated as sufficient involvement and the case was left in the data.
6.2.2. Partial Least Squares – Structural Equation Modeling
Given the multivariate nature of the proposed model and the need of exploratory
analysis in both the measurement model of the constructs and the relationship
between them a second-generation statistical method, Structural Equation Modeling
(SEM), was used for the analysis of the data. Structural Equation Modeling (SEM)
involves multivariate analysis, a statistical method that simultaneously analyzes
multiple variables. SEM is a technique for analysis of unobserved variables measured
indirectly by indicators (independent variables). It is multivariate technique that
combines aspects of factor analysis and regression allowing simultaneously
examination of relationship among measured variables and latent variables as well as
between latent variables in the model. SEM as a second-generation statistical method
widely used in the past 20 years by social science researchers for confirmatory as well
114
as exploratory research. SEM advantage over first generation methods is in the
possibility of measurement of the unobserved variables.
SEM as a multivariate analysis uses the variance, linear combination of several
variables, as fundamental building block. It is particularly useful technic in measuring
abstract, complex and not directly observable phenomenon. This kind of phenomenon
that is measured by SEM refers to latent (unobservable) variable or construct.
Constructs in SEM are large abstract concepts that are measured indirectly by
indicators or manifestations each representing a single separate aspect of the concept.
In other words constructs in SEM are measured indirectly by combining several
items. Combining several item for measurement of the construct makes the measure
more accurate taking into account different aspects of the concept which reduces
measurement error.
There are two types of Structural Equation Modeling (SEM). Covariance-Based SEM
(CB-SEM) is primarily used for confirmatory theory analysis based on systematic
relationships between multiple variables that can be tested empirically. CB-SEM
determines how well the proposed theoretical model can estimate the covariance
matrix for a sample data set. The second type of SEM is Partial Least Squares SEM
(PLS-SEM) a method that is focusing on explaining the variance in the dependent
variables and by that primarily used for development of theories in exploratory
research. This type of SEM is more useful in situations where theory is less
developed. The variance based PLS-SEM algorithm was developed by Herman Wold
(1975; 1982; 1985) and later extended by Lohmoler (1989) Its statistical properties
are determent by OLS regression based estimation.
For the analysis of the data in this study PLS-SEM was used applying SmartPLS
3.1.6. SmartPLS 3 was chosen as much more advanced and sophisticated PLS-SEM
software than others on the market at the moment.
PLS-SEM (also called PLS path model) involves creating path models that are
diagrams used to visually display the hypotheses and variable relationships.
Constructs (latent exogenous and endogenous variables) in the path model are
represented as circles and indicators (items or manifest variables) are represented as
rectangles. The PLS path model consists of two elements. The first element is the
measurement model of the constructs or the outer model that represent the
relationship between the constructs and the indicators. The second element is the
structural model or inner model that represent the relationship between the
115
constructs. In the PLS path model constructs can be either exogenous latent variables
(constructs that explain other constructs in the model) or endogenous latent variables
(constructs that are being explained in the model). Although PLS-SEM is primary
exploratory technic the path model in PLS-SEM is still developed based on
measurement and structural theory referring to the measurement of the constructs and
relationship between the constructs respectably. In respect to the measurement theory
the grate advantage of PLS-SEM over CB-SEM is that PLS-SEM allows easy use of
both measurement ways, reflective and formative, where indicators can be either
effects (reflective measurement) or causes (formative measurement) of the constructs.
The estimation procedure for PLS-SEM is an ordinary least squares (OLS) regression
based method. PLS-SEM estimates path relationship in the model with the objective
to minimize the residual variance of the endogenous constructs and maximizing R2
values. Therefor it is favored method for prediction of constructs and theory
development (Hair Jr et al., 2013).
PLS-SEM generally achieves high levels of statistical power (renders specific
relationship significant when it is in fact significant in the population) with small
sample size although there are minimum requirements in sample size considering
different level of statistical power (Cohen 1992). PLS-SEM makes no distributional
assumptions and uses data that have normal and non-normal distributional properties.
This condition however should be taken into account with attention because outliers
and collinearity influence OLS regressions in PLS-SEM. The PLS-SEM measurement
model generally requires metric data but also works well with ordinal scales (Likert
scale) and binary coded data (dummy variables) as ones used in this research.
6.2.2.1. Structural model
The structural (inner) model of the research hypothesis illustrates the relationship
between the constructs that will be examined in this research. The sequence of the
constructs in the structural model is based on the theory previously examined and
developed through literature review, logic, experiences and partially concluded by the
use of qualitative research (first step of the research applied life story interviews with
rural tourism entrepreneurs). Fig 1 illustrates the basic diagram of the hypothesized
constructs that influence entrepreneurial success in rural tourism. Going from the left
to the right side of the diagram there are two predictors or exogenous latent variables
116
(constructs) referring to the Human Capital and Social Capital and three endogenous
latent variables (constructs) Personality, Business Environment and Success as
dependent variable (construct).
Based on the review of the literatures on tourism, rural development, rural tourism,
entrepreneurship, social and human psychology this research examines the theoretical
relationship among human capital, social capital, personality and business
environment and their effect on entrepreneurial success in rural tourism. The key
relationships in the structural model are expressed in the following null hypotheses:
H1. Human Capital of the rural tourism entrepreneur is positively related to his/her
entrepreneurial success.
H2. Personality of the rural tourism entrepreneur is positively related to his/her
entrepreneurial success.
H3. Social Capital of the rural tourism entrepreneur is positively related to his/her
entrepreneurial success.
H4. External financial environment is positively related to his/her entrepreneurial
success.
H5. Personality of the rural tourism entrepreneur mediates the positive effect of
Human Capital and Social Capital on entrepreneurial success
H6. Financial environment mediates the positive effect of Human Capital and Social
Capital on entrepreneurial success
H7. Human Capital moderates the positive effect of Social Capital on entrepreneurial
success
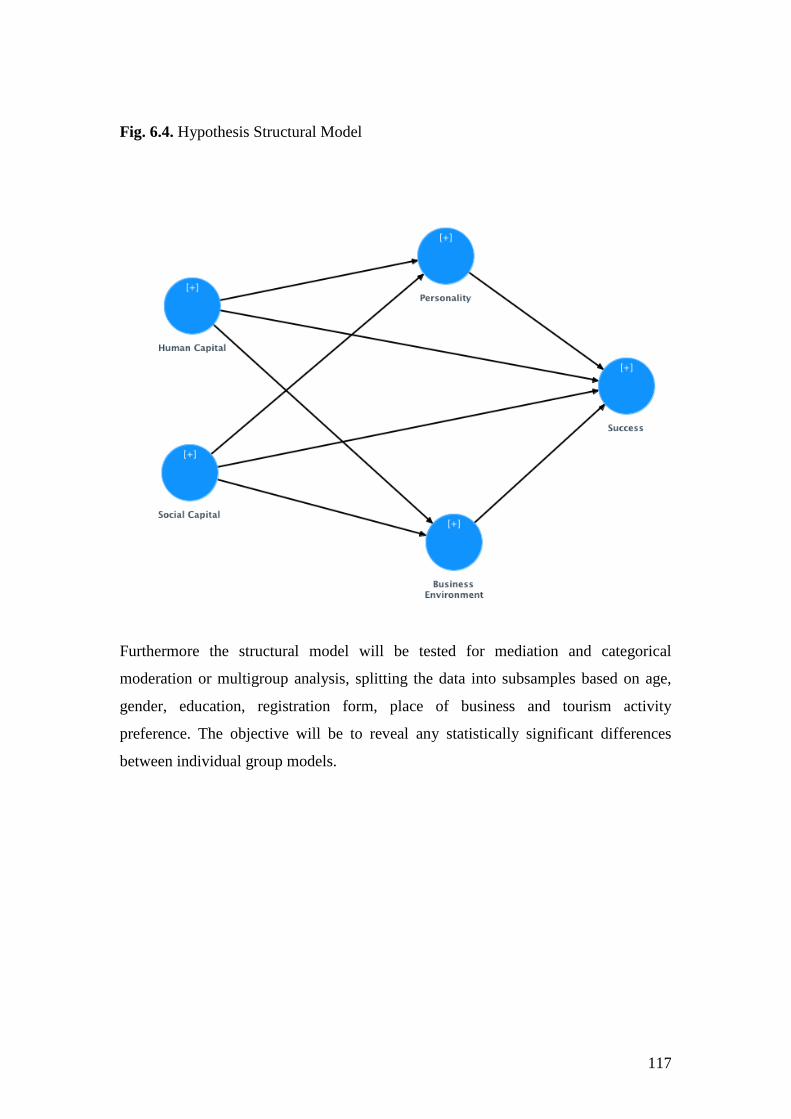
117
Fig. 6.4. Hypothesis Structural Model
Furthermore the structural model will be tested for mediation and categorical
moderation or multigroup analysis, splitting the data into subsamples based on age,
gender, education, registration form, place of business and tourism activity
preference. The objective will be to reveal any statistically significant differences
between individual group models.
118
6.2.2.2. Constructs development and measures
The structural model involves five constructs out of which two are exogenous latent
constructs referring to Human Capital and Social Capital and three are endogenous
latent constructs: Business Environment, Personality and Business Success.
Human Capital
The concept of human capital was primarily established in the work of economist as
Adam Smith, JS Mill and Alfred Marshal. They recognized the social capital,
although not referring to the exact phrase, as one of the four factors of production:
land, labor, capital and enterprise. However, human capital as a factor in the
economic research came to importance in the 1960s with the work of Schultz (1961)
and Becker (1964). Theodore Schultz (1961) in his work expressed that individuals
intentionally invest in themselves to improve their own, personal economic returns
and that modern economy can’t grow without an educated workforce. Human capital
theory is based on the principle that the more workers invest in education and training
the higher their earnings will be. Gary Becker (1962) separates the human capital in
two categories: general human capital (basic literacy and numeracy) and specific
human capital relevant to company or specific sector. Becker pointed that human
capital is the knowledge and skills acquired through formal and informal learning
closely related to generational transmission of previous family knowledge (Keeley,
2007). Sociologists on the other hand referring to human capital tend to focus on
socialization influences on educational achievements. Consequently, there has been
growing interest in examining learning in a wider context including formal education,
employee training as well as the role of family and community groups (Eraut and
Hirsh, 2007). This more social view of human capital led to links with work on social
capital (Swedberg and Granovetter, 2001).
Many researchers have argued that the entrepreneurship is dependent on the
entrepreneurs abilities created through their education and experience (O. Jones,
Macpherson, & Thorpe, 2010; Mincer, 1958; Mosey & Wright, 2007; Rae &
Carswell, 2001; Schultz, 1971; Shrader & Siegel, 2007; Thorpe, Jones, Macpherson,
119
& Holt, 2007). These abilities often are related to early experiences in life (Fairlie &
Robb, 2007) and interconnected with family involvement in entrepreneurship
(Athayde, 2009). Therefore the focus of the research was on measuring human
capital effect on entrepreneurship by measuring the effect of education and experience
as the principal form human capital (Olson & Bokor, 1995; Shrader & Siegel, 2007;
van Praag, 2006; Wiklund et al., 2003).
Human capital has strong connection to social capital referring to capabilities of
entrepreneurs to interact with others, share ideas and provide access to valuable
resources.. Jones et al. (2010) argues that entrepreneurial knowledge and experience
is crucial in developing absorptive capacity, social capital and firm performance.
People on bases of family transferred knowledge have initial human capital which is
supplemented with obtaining additional human capital by investing in education and
experience. As Fairlie & Robb (2007) indicated in their study on the relationship
between human capital and entrepreneurship, having a family business background
strongly affects small business outcomes. Further, Van Der Sluis, Van Praag and
Vijverberg (2007) analysing the relationship between education and entrepreneurship
has concluded that even though education doesn‘t plays significant role in the
decision whether people become entrepreneurs the relationship between education
and entrepreneurial outcomes is explicitly positive and significant. This is evident in
the result of his study showing that the returns to education for entrepreneurs are a
significant 37 percent higher than the comparable returns for employees. Ucbasaran,
Westhead and Wright (2008) researched specific in contrast to general work
experience, schooling and skills. Their findings on general human capital (i.e.,
education and work experience) and specific human capital (i.e., business ownership
experience, managerial capabilities, entrepreneurial capabilities and technical
capabilities) suggested that both forms of human capital have large effect on
opportunity identification and pursuit.
This study investigates the effect of general human capital expressed through
education, life experience and specific work experience on entrepreneurial success. It
tends to capture broader concept of human capital and describe its effect on business
success in narrow development industry, as it is rural tourism. The abstract construct
of human capital in this research was measured as formative measurement construct
composed of three causes (indicators): previous life experience, previous specific
tourism work experience and education.
120
Social Capital
Social Capital is relatively new term used for the first time in the literature in the
work of Hanifan (1916) referring to people noticeable assets as: goodwill, fellowship,
sympathy and social interaction among individuals and families. A century latter there
is no single definition that meets all criteria of social capital (Castiglione, Deth, &
Wolleb, 2008; Keeley, 2007) however it can be described as simple as Keeley (2007)
described the concept ―Human capital is links, shared values and understanding in
society that enable individuals and groups to trust each other and so work together‖.
This definition was mainly consequent of the essential work on concept of social
capital by Putnam (1995, 2000) and Coleman (1994; 1988). As a result of deference
between the individual and collective aspects of the term social capital, Castiglione at
al. (2008) furthermore describes two forms of social capital. On the basis of resources
Castiglione at al. (2008) describes relational capital as ―valued number of resources
an actor can employ and use through direct or indirect personal relations with other
actors who control those resources‖ and system capital as ―functioning social control,
system trust, and a comprehensive system morality, between individuals or within a
group, organization, community, region, or society‖. The latter describes collective
attitude toward the social system as a whole distinguishing it from the individual
relations.
Coleman (1994) in his large influence on the development of social capital theory
defined social capital as:
The set of resources that inhere in family relations and in community
social organization and that are useful for the cognitive or social
development of a child or young person. These resources differ for
different persons and can constitute an important advantage for
children and adolescents in the development of their human capital.
(Coleman 1994: 300)
In the Coleman‘s work there is strong relationship and causality between social and
human capital. The two concepts are linked in complex ways and in some extend they
promote each other. Education and experience are contributing on large extend to the
121
formation of social capital and vice versa. However this relationship can be either
positive or negative. Although ―communities with high levels of social capital tend to
achieve better school outcomes than communities which face social fragmentation
and isolation‖ (OECD 2001) social capital in some term can obstruct education in
sense of communities who see little value in education (Keeley, 2007).
As an important concept, majority of scholars theoretically and empirically supported
the impact of the social capital on entrepreneurship (Blumberg & Pfann, 2001;
Bosma, Van Praag, Thurik, & De Wit, 2004; Brüderl & Preisendörfer, 1998; Cope,
Jack, & Rose, 2007; Gedajlovic, Honig, Moore, Payne, & Wright, 2013; Greve &
Salaff, 2003; Kim and Howard E. Aldrich, 2005; Kwon, Heflin, & Ruef, 2013;
Pennings, Lee, & Van Witteloostuijn, 1998; Roxas & Azmat, 2014; Simpson et al.,
2004; Westlund & Bolton, 2003). They all emphasized that higher levels of social
capital and investment in relational and system capital, are associated with greater
returns and performance of ventures. Considering the strong link between human and
social capital and their connection to entrepreneurship in form of nascent venturing
and firm grow it is meaningful to consider all their aspects in analysis of business
success. Moreover it is necessary to empirically support the connection and causality
between social and human capital and rural tourism venture success.
As first empirical study on rural tourism success in Republic of Macedonia this study
try‘s to capture wider picture of industry-specific success. The social capital in the
study is measured in terms of networking, family support, community bonds and
place identity. The relevance of these indicators toward measurement of social capital
importance in entrepreneurial success considering the relevant theory seems
indisputable. The abstract construct of social capital in this research was measured as
formative higher-order component (HOC) measurement construct composed of five
indicators divided in two lower-order components (LOC): (1) social capital linked to
the people measured formative with two indicators: family support and networking
and (2) social capital linked to the place measured formative with three indicators:
nature, place identity and community bound.
122
Personality
As emphasized in the entrepreneurial theory small ventures are reflects of
entrepreneur personality (Getz & Carlsen, 2005). The personality of the venture
builder is highlighted as the main core in every research on SME‘s and characteristic
of business success. Hatten (2011) analyzed that most prevalent personal
characteristics of entrepreneur are: Need for achievement, Locus of control,
Commitment, Self-efficacy and Risk taking. Gadenne (1998) identifies entrepreneur
characteristic that contribute to success as: leadership, risk-taking, independence, self-
confidence, ambition and persistence. Watson et al. (1998) undertakes empirical
research of large number of personal, business and environmental characteristics of
businesses and relates them to the outcome as failure, survival or growth. In his work
as one of the internal factors he underlined personality attributes. In the recent studies
the three most frequently studied entrepreneur‘s characteristics are motivation, self-
efficacy, and risk attitudes (Tyszka, Cieślik, Domurat, & Macko, 2011).
Entrepreneur personality is complex construct (Begley & Boyd, 1987; Brandstätter,
1997, 2011). The physiological theory underline need for achievement, locus of
control, risk-taking propensity, tolerance of ambiguity and self-efficacy as leading
components of the entrepreneurial personality (Begley & Boyd, 1987). McClelland as
founder of 'psychological/sociological approach' to entrepreneurship has indicated in
his research that achievement motivation is the main factor influencing
entrepreneurial success (McClelland, 1961). His work was progressed by Bandura
(1986) who worked on self-efficacy, the work of Rotter (1966) on the locus of control
and others psychologists and sociologist (Simpeh, 2011; Thornton, 1999).
This study measures the entrepreneur‘s personality theory effects on the venture
success mainly by exploring the effect of the McClelland‘s needs theory and
Bandura‘s theory of self-efficacy (social cognitive theory). The David McClelland
Needs theory, also known as Three Needs Theory, is a motivational model used in
entrepreneurship research that attempts to explain how the need for achievement,
need for power, and need for affiliation affect the actions of people. In his work
McClelland (1961) discuss that all people poses these three types of motivations.
However the personality of the entrepreneur is characterized by higher level of need
for achievement and need for power.
123
Albert Bandura has defined self-efficacy as ―one's belief in one's ability to succeed in
specific situations‖. Self-efficacy in Bandura‘s theory can play a major role in how
people approach goals, tasks, and challenges. In his theory Bandura highlights the role
of ―observational learning‖ and social experience in the development of personality.
According to this theory entrepreneurs with high self-efficacy are more likely to view
difficult tasks as something to be mastered rather than something to be avoided
(Acharya, Rajan, & Schoar, 2006; Bandura, 1977, 1986).
Two reflective indicators that were incorporated in the measurement of the
personality construct measured the concepts of need for achievement and need for
power. In addition other three reflective indicators addressed the Bandura‘s self-
efficacy and locus of control measured in the personality construct.
Business environment
Business environment is the sum of all factors that can influence one business.
Although it is a sum of external and internal organizational factors most of the term
refers to the external environment that is influencing the operations of the business.
The external environment is also consisted of different factors as: macroeconomic,
microeconomic, political, technological factors etc. Generally speaking business
environment is an ambient which improves the growth potential of enterprises. Good
business environment ensures easier access for entrepreneurs to funding as a part of
good financial environment, creates legislation clear and more effective reducing the
administrative cost and burdens on businesses, takes care and support businesses in
different stages of their development, supports creation of business networks and
entrepreneurial culture. Business environment is large concept enclosing financial
environment, government and policies.
In this study business environment is measured by main factors that were recognized
in the qualitative research – life story interviews. The principal indicators for
measurement of business environment construct were financial as: access to financial
instruments (Loans and Credits), investment in local infrastructure, external financial
support (subsidies and grants) and marketing of the destination. Additionally the
business environment construct incorporated two internal business indicators that are
part of most of the businesses and have large influence in the success of one business

124
referring to Schumpeter‘s innovation as the leading actions of entrepreneurs in
creation of the enterprise and catalyst of growth and business risk as uncertainty of
profit or threat of loses. The construct of business environment in this study is
representing the general environment of doing business in rural tourism
accommodation sector created by the entrepreneurs that are doing business in the
sector.
Entrepreneurial success
The success of rural tourism businesses in the literature is measured by two criteria,
financial and non-financial criteria, or more accurately with a mix of both criteria.
Conventionally and with more literature attention, business success has been
measured by financial performance of the enterprise in terms of profit, turnover or
return of investment or on base of employee numbers (Barkham et al., 2012; Jim
Curran & Blackburn, 2000; Kelmar, 1991; Parker, 2009). In terms of owners‘ goals
and needs, obtaining or sustaining profitability and increasing the value of the
business are most important attributes of success (Getz et al., 2004). This financial
measurement of success use the assumptions that all businesses are made with
intention of grow and therefore they measure the increase of profit and employees as
base indicators of success. Although most scholars use economics measures for
business success measurement there is strong evidence that not all businesses are
made for profit. Jennings and Beaver (1997) contribution to this statement add that
using only financial criteria does not refers to all enterprise owners‘ goals. They
defined success as ―the sustained satisfaction of principal stakeholder aspirations‖.
This theory of enterprise success was supported by Ateljevic & Doorne (2000) in their
study on lifestyle entrepreneurs that are balancing between economic performance
and sustainability in sociocultural and environmental terms. Business success in small
business sector can be measured by non-financial criteria (Walker & Brown, 2004).
Owners‘ perception of success is the most important concept in defining and
measuring enterprise success (Beaver, 2002).
There is strong evidence in the literature about the importance of non-financial
measures of business success used by business owners. These measures presented as
autonomy in the work and time, job satisfaction, obtaining certain lifestyle,
125
community recognition are usually more subjective and consequently difficult to
quantify compared to the financial measures of success. However, the non-financial
measures as stated previously can exist only in mix with financial measure or
presumption that there is curtain level of financial security already established within
the business or the business is not primary source of income (Walker, 2004).
Metodijeski (2012) in the analysis of rural tourism in the Republic of
Macedonia shows the same impression of the business success between rural tourism
entrepreneurs based on owners goals and desires for starting the business. Interview
respondents (rural tourism entrepreneurs) stated that main goal or reason for engaging
in rural tourism was financial reasons 34%, nevertheless also significant are displayed
favorable living conditions of a particular place 20%, the desire to develop the place
(place identity) 32% and desire to create a family business 14%. This is just further
proof that success in a variety of entrepreneurs is difficult to determine as a result of
the different expectations among entrepreneurs.
As elaborated, success in business is a term that is difficult to define. In many
respects it differs depending on the firm's activities, the economic sector, the
environment and ultimately on the perception of success of the firm owner. However,
there is also clear distinction between two forms of success: nonfinancial personal
perception of success and financial success. This study uses both forms for measuring
success construct. The personal perception of success is measured by the self-
evaluation of the entrepreneurs. This measurement of success could be biased,
overestimated or subjective (Hienerth & Kessler, 2006) and therefore was corrected
with the index of utilized capacity. The utilized capacity of the enterprise is taking
into account the size of the business activity and the number of tourist in one fiscal
year. It represents the amount of the capacity of the enterprise referring to the number
of beds of the accommodation facility and the number of tourist in one year. This
index estimates the financial success of the enterprise and together with the number of
employees and perceived personal success are used to measure the abstract construct
of entrepreneurial success.
126
6.2.2.3. Model fit – measurement models
The purpose of model estimation (model fit) is to empirically measure the relationship
between indicators and corresponding constructs supporting the theoretical
relationship between them. In other words by evaluation of the measurement model it
can be determine how well the theory fits the data and evaluate the reliability and
validity of the construct measures.
Assessment of reflective measurement model
The assessment of reflective measurement model in PLS-SEM includes internal
consistency reliability, convergent validity and discriminant validity.
(1) For measuring the internal consistency reliability were used: (1) the traditional
measure for internal consistency – Cronbach‘s alpha (which is sensitive to the number
of items and tends to underestimate the internal consistency reliability) and (2)
composite reliability (pc) which takes into account the outer loadings of the indicators.
The calculation of the composite reliability uses the formula:
li = standardized outer loadings
ei = measurement error of indicators
var(ei) = variance of the measurement error
Composite reliability values of the reflective constructs (personality and success)
were between indicated values of 0,70 and 0,90 (Esposito Vinzi, Chin, Henseler, &
Wang, 2010; Hair, Ringle, & Sarstedt, 2011; Hair Jr et al., 2013; Nunnally &
Bernstein, 1994) The pc value for personality was 0.817 and for success was 0.826.
Therefore, composite reliability values validate the internal consistency reliability of
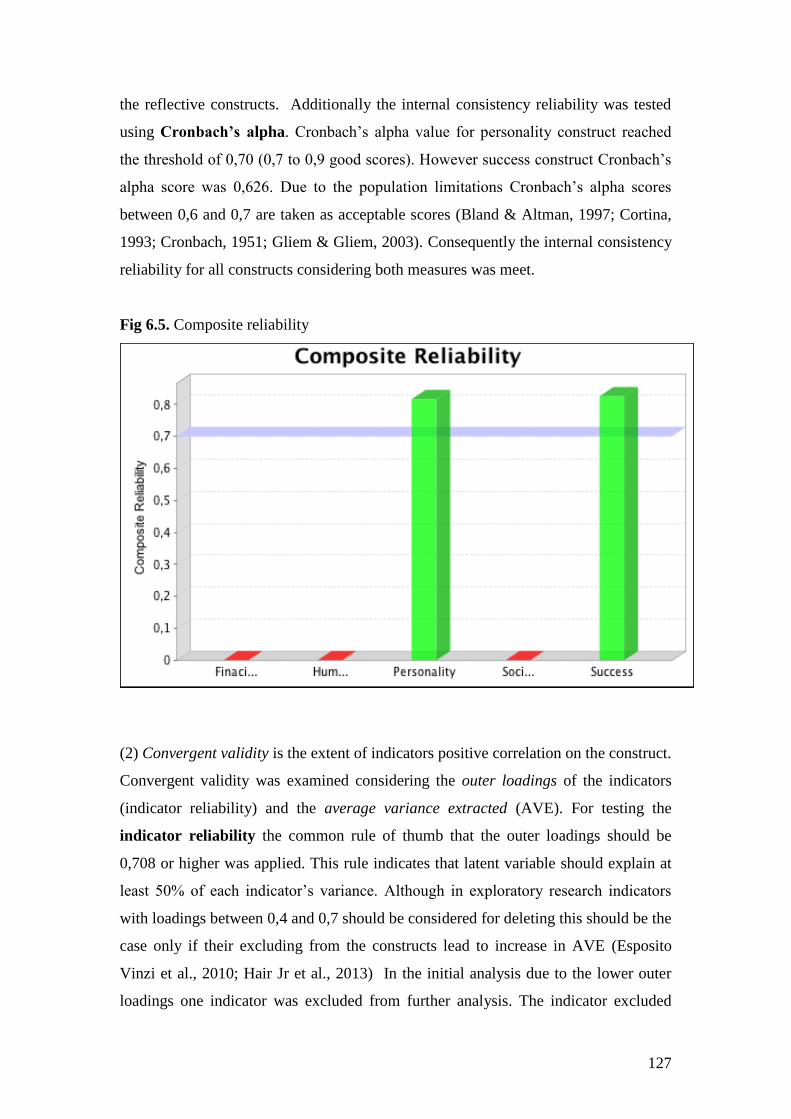
127
the reflective constructs. Additionally the internal consistency reliability was tested
using C b ch’ lpha. Cronbach‘s alpha value for personality construct reached
the threshold of 0,70 (0,7 to 0,9 good scores). However success construct Cronbach‘s
alpha score was 0,626. Due to the population limitations Cronbach‘s alpha scores
between 0,6 and 0,7 are taken as acceptable scores (Bland & Altman, 1997; Cortina,
1993; Cronbach, 1951; Gliem & Gliem, 2003). Consequently the internal consistency
reliability for all constructs considering both measures was meet.
Fig 6.5. Composite reliability
(2) Convergent validity is the extent of indicators positive correlation on the construct.
Convergent validity was examined considering the outer loadings of the indicators
(indicator reliability) and the average variance extracted (AVE). For testing the
indicator reliability the common rule of thumb that the outer loadings should be
0,708 or higher was applied. This rule indicates that latent variable should explain at
least 50% of each indicator‘s variance. Although in exploratory research indicators
with loadings between 0,4 and 0,7 should be considered for deleting this should be the
case only if their excluding from the constructs lead to increase in AVE (Esposito
Vinzi et al., 2010; Hair Jr et al., 2013) In the initial analysis due to the lower outer
loadings one indicator was excluded from further analysis. The indicator excluded
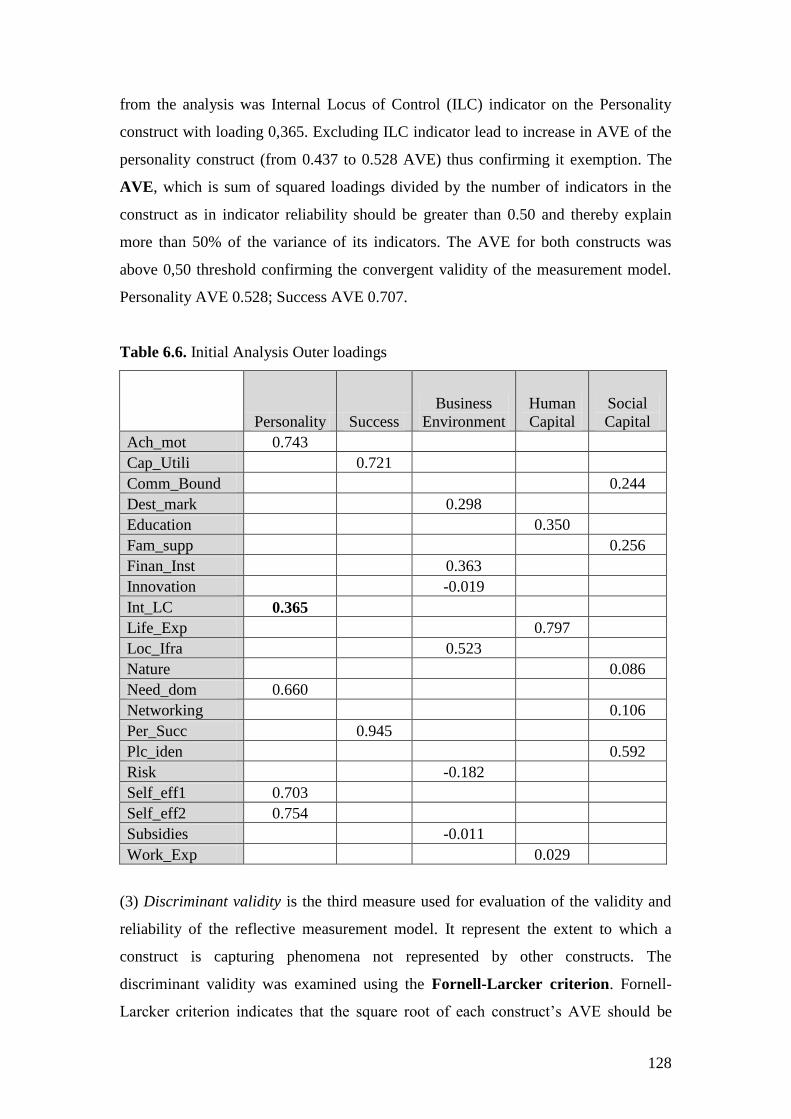
128
from the analysis was Internal Locus of Control (ILC) indicator on the Personality
construct with loading 0,365. Excluding ILC indicator lead to increase in AVE of the
personality construct (from 0.437 to 0.528 AVE) thus confirming it exemption. The
AVE, which is sum of squared loadings divided by the number of indicators in the
construct as in indicator reliability should be greater than 0.50 and thereby explain
more than 50% of the variance of its indicators. The AVE for both constructs was
above 0,50 threshold confirming the convergent validity of the measurement model.
Personality AVE 0.528; Success AVE 0.707.
Table 6.6. Initial Analysis Outer loadings
Personality Success
Business
Environment
Human
Capital
Social
Capital
Ach_mot 0.743
Cap_Utili
0.721
Comm_Bound
0.244
Dest_mark
0.298
Education
0.350
Fam_supp
0.256
Finan_Inst
0.363
Innovation
-0.019
Int_LC 0.365
Life_Exp
0.797
Loc_Ifra
0.523
Nature
0.086
Need_dom 0.660
Networking
0.106
Per_Succ
0.945
Plc_iden
0.592
Risk
-0.182
Self_eff1 0.703
Self_eff2 0.754
Subsidies
-0.011
Work_Exp
0.029
(3) Discriminant validity is the third measure used for evaluation of the validity and
reliability of the reflective measurement model. It represent the extent to which a
construct is capturing phenomena not represented by other constructs. The
discriminant validity was examined using the Fornell-Larcker criterion. Fornell-
Larcker criterion indicates that the square root of each construct‘s AVE should be
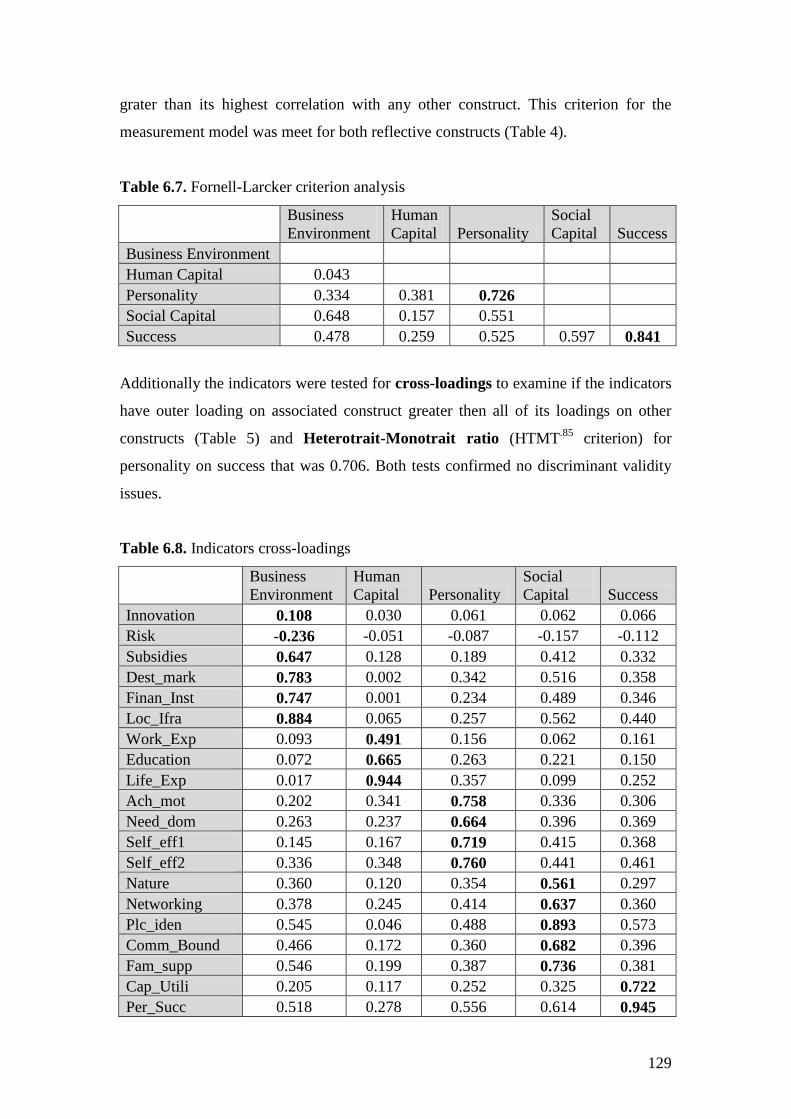
129
grater than its highest correlation with any other construct. This criterion for the
measurement model was meet for both reflective constructs (Table 4).
Table 6.7. Fornell-Larcker criterion analysis
Business
Environment
Human
Capital Personality
Social
Capital Success
Business Environment
Human Capital 0.043
Personality 0.334 0.381 0.726
Social Capital 0.648 0.157 0.551
Success 0.478 0.259 0.525 0.597 0.841
Additionally the indicators were tested for cross-loadings to examine if the indicators
have outer loading on associated construct greater then all of its loadings on other
constructs (Table 5) and Heterotrait-Monotrait ratio (HTMT.85
criterion) for
personality on success that was 0.706. Both tests confirmed no discriminant validity
issues.
Table 6.8. Indicators cross-loadings
Business
Environment
Human
Capital Personality
Social
Capital Success
Innovation 0.108 0.030 0.061 0.062 0.066
Risk -0.236 -0.051 -0.087 -0.157 -0.112
Subsidies 0.647 0.128 0.189 0.412 0.332
Dest_mark 0.783 0.002 0.342 0.516 0.358
Finan_Inst 0.747 0.001 0.234 0.489 0.346
Loc_Ifra 0.884 0.065 0.257 0.562 0.440
Work_Exp 0.093 0.491 0.156 0.062 0.161
Education 0.072 0.665 0.263 0.221 0.150
Life_Exp 0.017 0.944 0.357 0.099 0.252
Ach_mot 0.202 0.341 0.758 0.336 0.306
Need_dom 0.263 0.237 0.664 0.396 0.369
Self_eff1 0.145 0.167 0.719 0.415 0.368
Self_eff2 0.336 0.348 0.760 0.441 0.461
Nature 0.360 0.120 0.354 0.561 0.297
Networking 0.378 0.245 0.414 0.637 0.360
Plc_iden 0.545 0.046 0.488 0.893 0.573
Comm_Bound 0.466 0.172 0.360 0.682 0.396
Fam_supp 0.546 0.199 0.387 0.736 0.381
Cap_Utili 0.205 0.117 0.252 0.325 0.722
Per_Succ 0.518 0.278 0.556 0.614 0.945
130
Assessment of formative measurement model
The assessment of formative measurement model in PLS-SEM includes assessment of
convergent validity, assessment of collinearity issues and assessment of the
significance and relevance of the indicators. Ex-ante analysis of the formative
constructs focused on establishing content validity.
(1) Content validity or the extent to which measures are capturing all aspects of a
given construct. For measurement of the content validity in this study it was used
Lawshe (1975) and Haynes at al. (1995) methodological quantitative approach to
content validity involving subject matter expert raters (SMEs). SMEs involved in this
study were experts from the University of Bologna, University of East Sarajevo, Ss.
Cyril and Methodius University, Belgrade University and Pakistan Institute of
Development Economics with total number of eight SMEs. Content validity ratio
(CVR) for all indicators on the formative constructs had sufficient CRV values does
confirming content validity of the constructs. The calculation of CVR was done by
the following formula where positive values indicate that at least half the SMEs rated
the item as essential:
content validity ratio,
number of SME panelists indicating "essential",
total number of SME panelists.
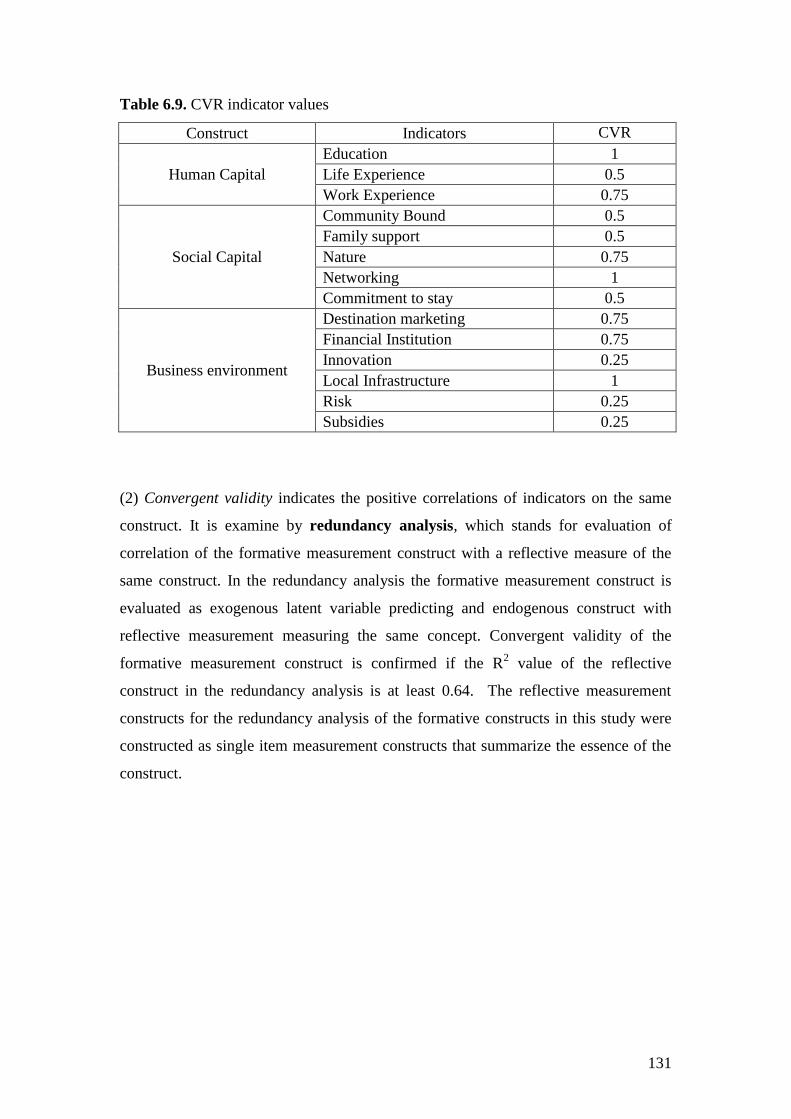
131
Table 6.9. CVR indicator values
Construct Indicators CVR
Human Capital
Education 1
Life Experience 0.5
Work Experience 0.75
Social Capital
Community Bound 0.5
Family support 0.5
Nature 0.75
Networking 1
Commitment to stay 0.5
Business environment
Destination marketing 0.75
Financial Institution 0.75
Innovation 0.25
Local Infrastructure 1
Risk 0.25
Subsidies 0.25
(2) Convergent validity indicates the positive correlations of indicators on the same
construct. It is examine by redundancy analysis, which stands for evaluation of
correlation of the formative measurement construct with a reflective measure of the
same construct. In the redundancy analysis the formative measurement construct is
evaluated as exogenous latent variable predicting and endogenous construct with
reflective measurement measuring the same concept. Convergent validity of the
formative measurement construct is confirmed if the R2 value of the reflective
construct in the redundancy analysis is at least 0.64. The reflective measurement
constructs for the redundancy analysis of the formative constructs in this study were
constructed as single item measurement constructs that summarize the essence of the
construct.
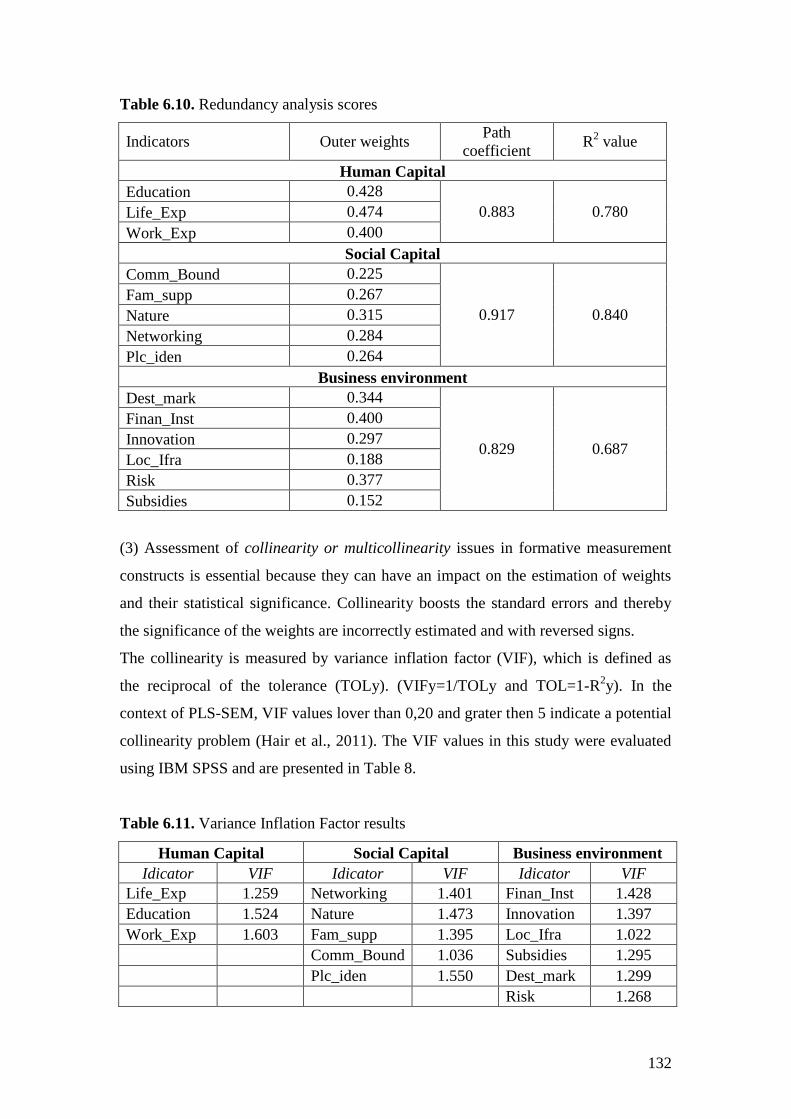
132
Table 6.10. Redundancy analysis scores
Indicators Outer weights Path
coefficient R
2 value
Human Capital
Education 0.428
0.883 0.780 Life_Exp 0.474
Work_Exp 0.400
Social Capital
Comm_Bound 0.225
0.917 0.840
Fam_supp 0.267
Nature 0.315
Networking 0.284
Plc_iden 0.264
Business environment
Dest_mark 0.344
0.829 0.687
Finan_Inst 0.400
Innovation 0.297
Loc_Ifra 0.188
Risk 0.377
Subsidies 0.152
(3) Assessment of collinearity or multicollinearity issues in formative measurement
constructs is essential because they can have an impact on the estimation of weights
and their statistical significance. Collinearity boosts the standard errors and thereby
the significance of the weights are incorrectly estimated and with reversed signs.
The collinearity is measured by variance inflation factor (VIF), which is defined as
the reciprocal of the tolerance (TOLy). (VIFy=1/TOLy and TOL=1-R2y). In the
context of PLS-SEM, VIF values lover than 0,20 and grater then 5 indicate a potential
collinearity problem (Hair et al., 2011). The VIF values in this study were evaluated
using IBM SPSS and are presented in Table 8.
Table 6.11. Variance Inflation Factor results
Human Capital Social Capital Business environment
Idicator VIF Idicator VIF Idicator VIF
Life_Exp 1.259 Networking 1.401 Finan_Inst 1.428
Education 1.524 Nature 1.473 Innovation 1.397
Work_Exp 1.603 Fam_supp 1.395 Loc_Ifra 1.022
Comm_Bound 1.036 Subsidies 1.295
Plc_iden 1.550 Dest_mark 1.299
Risk 1.268
133
(4) Assessment of the significance and relevance of the indicators. The assessment of
the relevance of specific indicator and its contribution to the formative constructs is
done by his outer weight. The outer weight is the result of a multiple regression (Hair
Jr et al., 2013) where dependent variable is latent variable score and independent is
the indicator. For testing the significance of the indicators weights the bootstrapping
procedure was used with 5.000 samples. For evaluating the significance of the
weights t values and p values were used. When the t value is larger than the critical
value the coefficient is significant at a certain error probability. For a two-tailed test
critical value is 1.65 with significance level 10%; 1.96 with significance level 5% or
2.57 with significance level 1%. The bootstrapping procedure allows testing the
hypothesis that w1 is 0 in the population (H0: w1=0; H1: w1≠0) and is calculated by
the following formula:
where w1 is the other weight and se*w1 is the standard bootstrapping error.
The construct of social capital in the model was represented as hierarchical
component model (HCM) build using the two-stage approach for formative-formative
HCM. In the first stage the repeated indicator approach was used for obtaining latent
variable scores for Lower-order components (LOC) (People and Place), which were
later in the second stage used as indicators on the higher-order components (HOC).
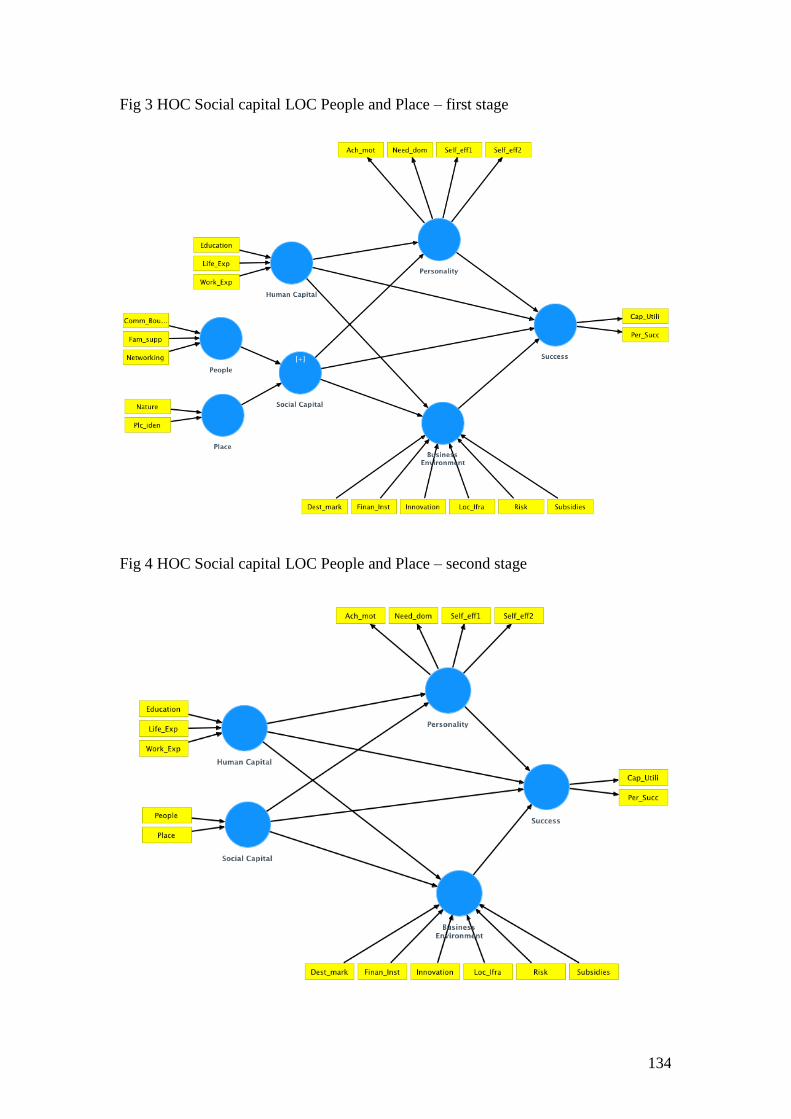
134
Fig 3 HOC Social capital LOC People and Place – first stage
Fig 4 HOC Social capital LOC People and Place – second stage
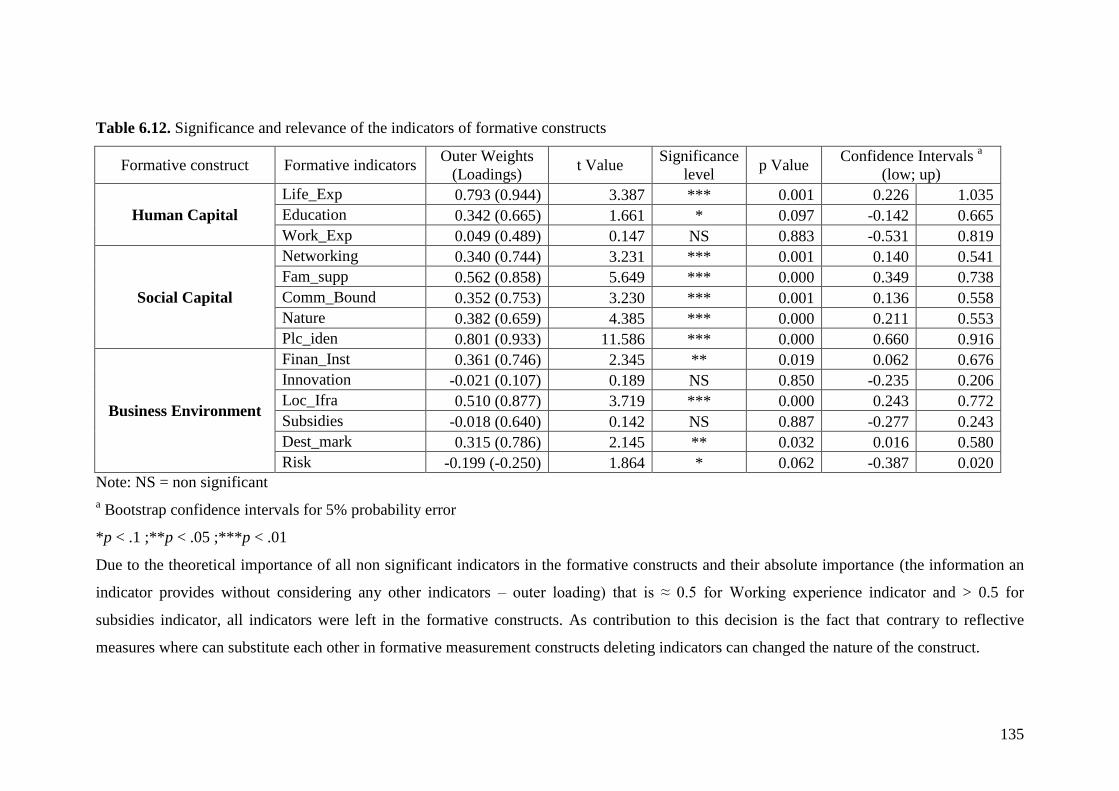
135
Table 6.12. Significance and relevance of the indicators of formative constructs
Formative construct Formative indicators Outer Weights
(Loadings) t Value
Significance
level p Value
Confidence Intervals a
(low; up)
Human Capital
Life_Exp 0.793 (0.944) 3.387 *** 0.001 0.226 1.035
Education 0.342 (0.665) 1.661 * 0.097 -0.142 0.665
Work_Exp 0.049 (0.489) 0.147 NS 0.883 -0.531 0.819
Social Capital
Networking 0.340 (0.744) 3.231 *** 0.001 0.140 0.541
Fam_supp 0.562 (0.858) 5.649 *** 0.000 0.349 0.738
Comm_Bound 0.352 (0.753) 3.230 *** 0.001 0.136 0.558
Nature 0.382 (0.659) 4.385 *** 0.000 0.211 0.553
Plc_iden 0.801 (0.933) 11.586 *** 0.000 0.660 0.916
Business Environment
Finan_Inst 0.361 (0.746) 2.345 ** 0.019 0.062 0.676
Innovation -0.021 (0.107) 0.189 NS 0.850 -0.235 0.206
Loc_Ifra 0.510 (0.877) 3.719 *** 0.000 0.243 0.772
Subsidies -0.018 (0.640) 0.142 NS 0.887 -0.277 0.243
Dest_mark 0.315 (0.786) 2.145 ** 0.032 0.016 0.580
Risk -0.199 (-0.250) 1.864 * 0.062 -0.387 0.020
Note: NS = non significant
a Bootstrap confidence intervals for 5% probability error
*p < .1 ;**p < .05 ;***p < .01
Due to the theoretical importance of all non significant indicators in the formative constructs and their absolute importance (the information an
indicator provides without considering any other indicators – outer loading) that is ≈ 0.5 for Working experience indicator and > 0.5 for
subsidies indicator, all indicators were left in the formative constructs. As contribution to this decision is the fact that contrary to reflective
measures where can substitute each other in formative measurement constructs deleting indicators can changed the nature of the construct.
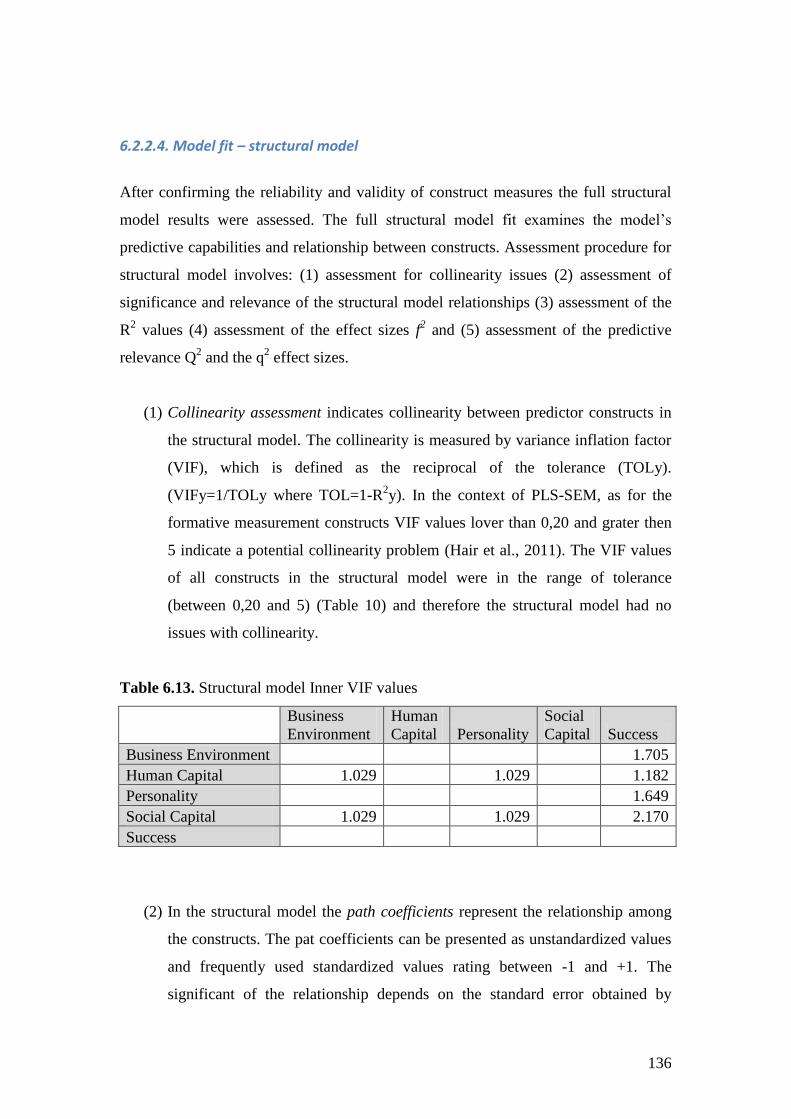
136
6.2.2.4. Model fit – structural model
After confirming the reliability and validity of construct measures the full structural
model results were assessed. The full structural model fit examines the model‘s
predictive capabilities and relationship between constructs. Assessment procedure for
structural model involves: (1) assessment for collinearity issues (2) assessment of
significance and relevance of the structural model relationships (3) assessment of the
R2 values (4) assessment of the effect sizes f
2 and (5) assessment of the predictive
relevance Q2 and the q
2 effect sizes.
(1) Collinearity assessment indicates collinearity between predictor constructs in
the structural model. The collinearity is measured by variance inflation factor
(VIF), which is defined as the reciprocal of the tolerance (TOLy).
(VIFy=1/TOLy where TOL=1-R2y). In the context of PLS-SEM, as for the
formative measurement constructs VIF values lover than 0,20 and grater then
5 indicate a potential collinearity problem (Hair et al., 2011). The VIF values
of all constructs in the structural model were in the range of tolerance
(between 0,20 and 5) (Table 10) and therefore the structural model had no
issues with collinearity.
Table 6.13. Structural model Inner VIF values
Business
Environment
Human
Capital Personality
Social
Capital Success
Business Environment
1.705
Human Capital 1.029
1.029
1.182
Personality
1.649
Social Capital 1.029
1.029
2.170
Success
(2) In the structural model the path coefficients represent the relationship among
the constructs. The pat coefficients can be presented as unstandardized values
and frequently used standardized values rating between -1 and +1. The
significant of the relationship depends on the standard error obtained by
137
process of bootstrapping. The PLS-SEM does not assume that the data is
normally distributed and therefore is not relying on parametric significance
tests. To test the significance of the coefficients PLS-SEM relies on
nonparametric bootstrapping procedure (Anthony C Davison & Hinkley,
1997; Anthony Christopher Davison, 1997; Efron & Tibshirani, 1986, 1994).
Bootstrapping procedure implies drowning large number of subsamples from
original sample with replacement. The number of cases in each subsample and
the number of subsamples should be at least equal to the number of valid
observations. For large confidence the number of subsamples should be 5.000
bootstrap samples (Anthony Christopher Davison, 1997; Hair Jr et al., 2013).
The bootstrapping procedure allows estimation of the standard error (se*) and
the standard deviation of the estimated coefficients. The bootstrapped
distribution is seen as reasonable approximation of the estimated distribution
in the population. The empirical t value is computed using the bootstrap
standard error. When the t value is larger than the critical value the coefficient
is significant at a certain error probability. For different error probability using
two-tailed test critical value is 1.65 at significance level 10%; 1,96 at
significance level 5% or 2.57 at significance level 1%). Running the
bootstrapping procedure with 5.000 samples on the structural model reveals
the significance of the path coefficient presented in Table 11. The test of
significance indicates that two paths in the structural model are non-significant
referring to Human Capital -> Business Environment and Human Capital ->
Success. However, as can be seen in the later analysis the path of Human
Capital -> Success is showing non-significant results due to it high level of
partial mediation through Personality as mediator and indirect effects. Does
confirming that human capital although not directly has positive effect on
success of the ventures.
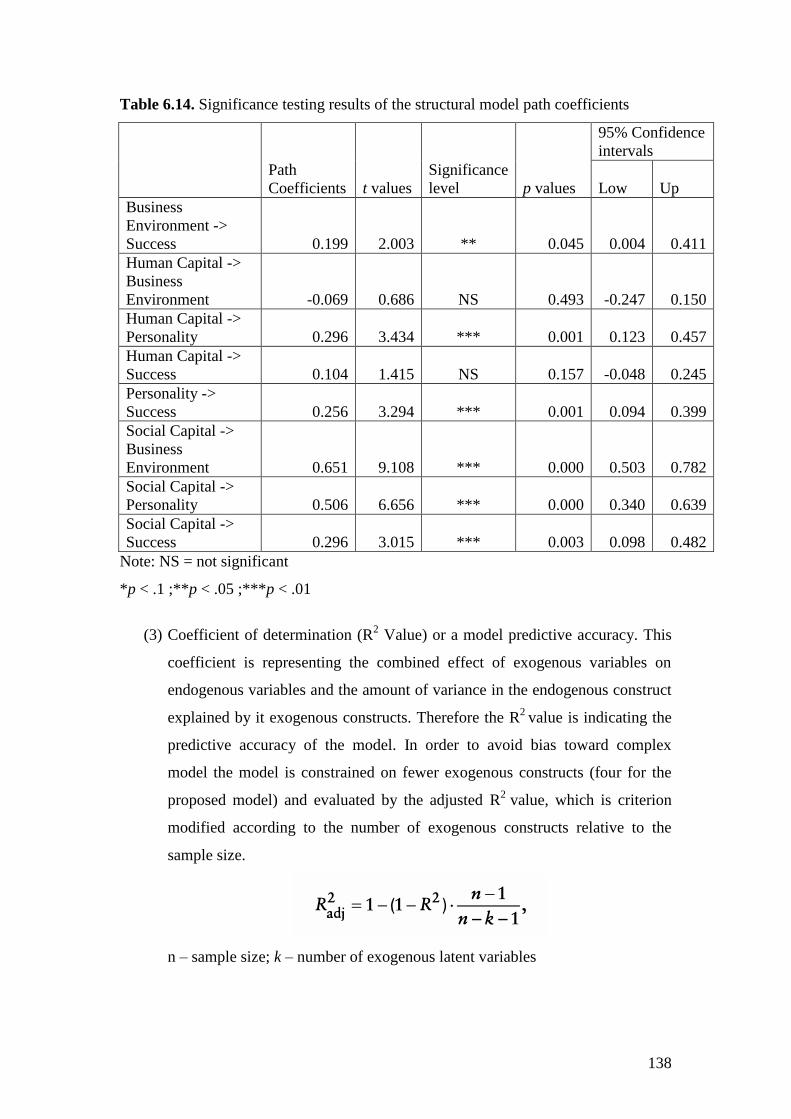
138
Table 6.14. Significance testing results of the structural model path coefficients
Path
Coefficients t values
Significance
level p values
95% Confidence
intervals
Low
Up
Business
Environment ->
Success 0.199 2.003 ** 0.045 0.004 0.411
Human Capital ->
Business
Environment -0.069 0.686 NS 0.493 -0.247 0.150
Human Capital ->
Personality 0.296 3.434 *** 0.001 0.123 0.457
Human Capital ->
Success 0.104 1.415 NS 0.157 -0.048 0.245
Personality ->
Success 0.256 3.294 *** 0.001 0.094 0.399
Social Capital ->
Business
Environment 0.651 9.108 *** 0.000 0.503 0.782
Social Capital ->
Personality 0.506 6.656 *** 0.000 0.340 0.639
Social Capital ->
Success 0.296 3.015 *** 0.003 0.098 0.482
Note: NS = not significant
*p < .1 ;**p < .05 ;***p < .01
(3) Coefficient of determination (R2 Value) or a model predictive accuracy. This
coefficient is representing the combined effect of exogenous variables on
endogenous variables and the amount of variance in the endogenous construct
explained by it exogenous constructs. Therefore the R2
value is indicating the
predictive accuracy of the model. In order to avoid bias toward complex
model the model is constrained on fewer exogenous constructs (four for the
proposed model) and evaluated by the adjusted R2
value, which is criterion
modified according to the number of exogenous constructs relative to the
sample size.
n – sample size; k – number of exogenous latent variables
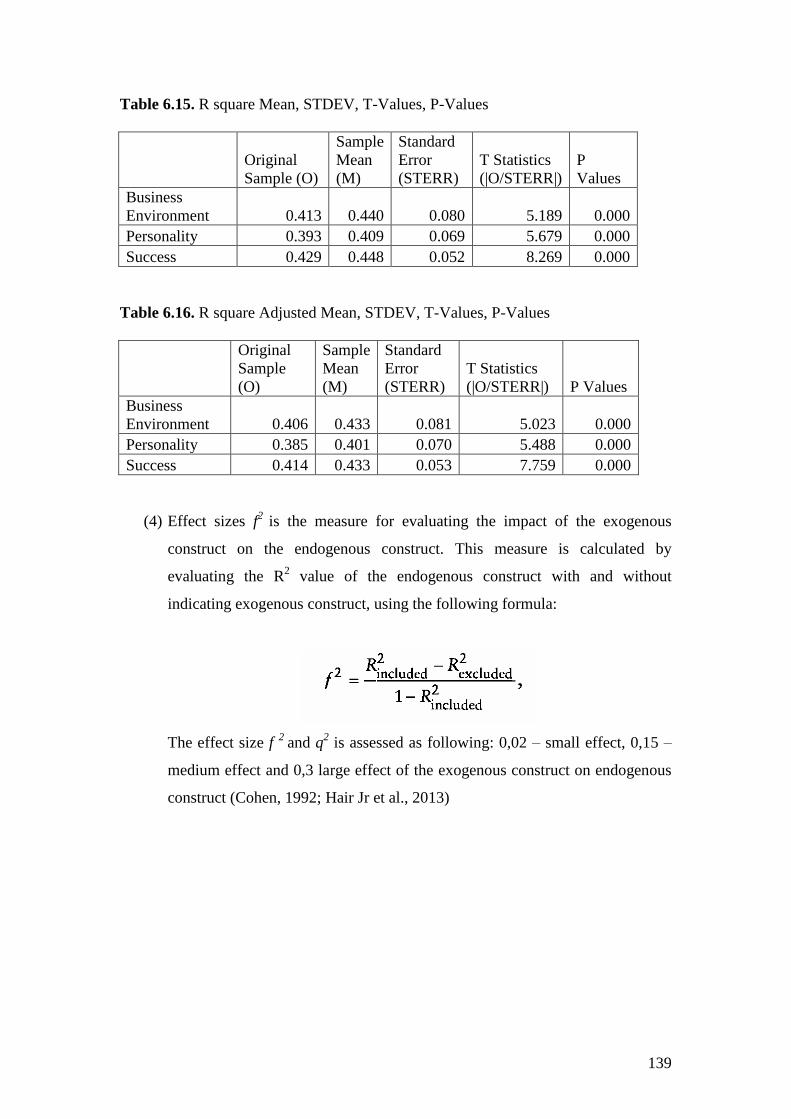
139
Table 6.15. R square Mean, STDEV, T-Values, P-Values
Original
Sample (O)
Sample
Mean
(M)
Standard
Error
(STERR)
T Statistics
(|O/STERR|)
P
Values
Business
Environment 0.413 0.440 0.080 5.189 0.000
Personality 0.393 0.409 0.069 5.679 0.000
Success 0.429 0.448 0.052 8.269 0.000
Table 6.16. R square Adjusted Mean, STDEV, T-Values, P-Values
Original
Sample
(O)
Sample
Mean
(M)
Standard
Error
(STERR)
T Statistics
(|O/STERR|) P Values
Business
Environment 0.406 0.433 0.081 5.023 0.000
Personality 0.385 0.401 0.070 5.488 0.000
Success 0.414 0.433 0.053 7.759 0.000
(4) Effect sizes f2
is the measure for evaluating the impact of the exogenous
construct on the endogenous construct. This measure is calculated by
evaluating the R2 value of the endogenous construct with and without
indicating exogenous construct, using the following formula:
The effect size f 2
and q2 is assessed as following: 0,02 – small effect, 0,15 –
medium effect and 0,3 large effect of the exogenous construct on endogenous
construct (Cohen, 1992; Hair Jr et al., 2013)
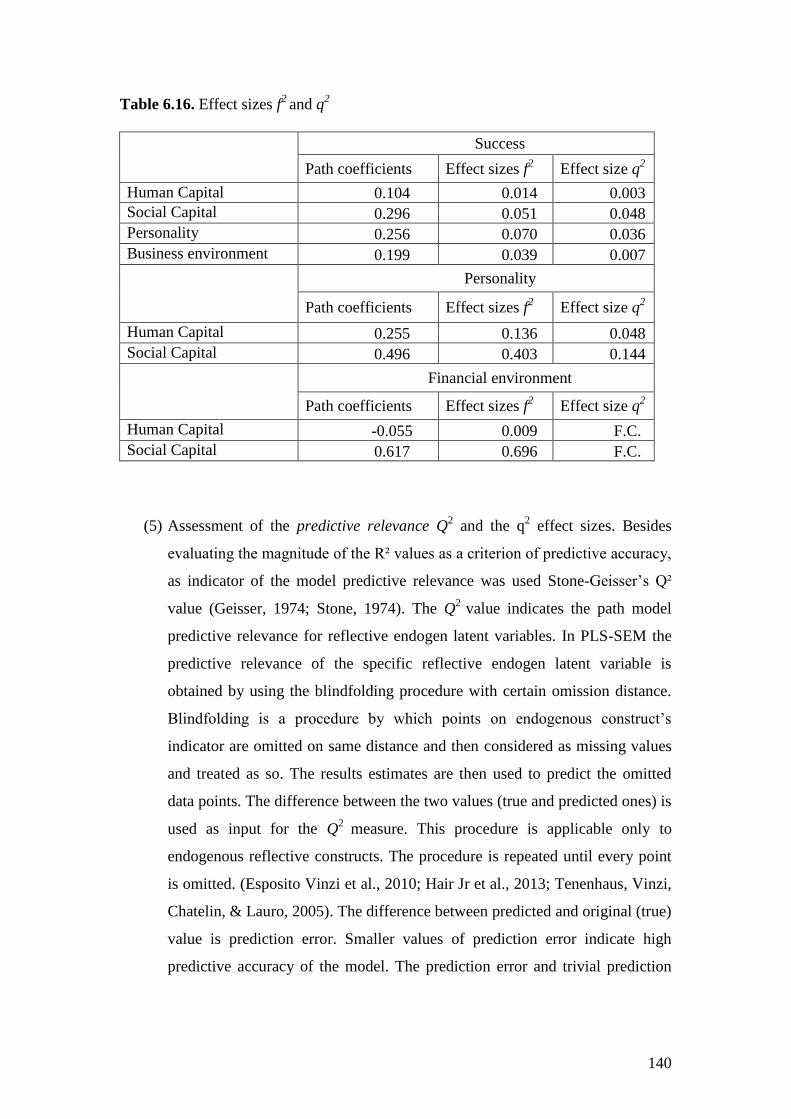
140
Table 6.16. Effect sizes f2
and q2
Success
Path coefficients Effect sizes f2 Effect size q
2
Human Capital 0.104 0.014 0.003
Social Capital 0.296 0.051 0.048
Personality 0.256 0.070 0.036
Business environment 0.199 0.039 0.007
Personality
Path coefficients Effect sizes f2 Effect size q
2
Human Capital 0.255 0.136 0.048
Social Capital 0.496 0.403 0.144
Financial environment
Path coefficients Effect sizes f2 Effect size q
2
Human Capital -0.055 0.009 F.C.
Social Capital 0.617 0.696 F.C.
(5) Assessment of the predictive relevance Q2 and the q
2 effect sizes. Besides
evaluating the magnitude of the R² values as a criterion of predictive accuracy,
as indicator of the model predictive relevance was used Stone-Geisser‘s Q²
value (Geisser, 1974; Stone, 1974). The Q2
value indicates the path model
predictive relevance for reflective endogen latent variables. In PLS-SEM the
predictive relevance of the specific reflective endogen latent variable is
obtained by using the blindfolding procedure with certain omission distance.
Blindfolding is a procedure by which points on endogenous construct‘s
indicator are omitted on same distance and then considered as missing values
and treated as so. The results estimates are then used to predict the omitted
data points. The difference between the two values (true and predicted ones) is
used as input for the Q2
measure. This procedure is applicable only to
endogenous reflective constructs. The procedure is repeated until every point
is omitted. (Esposito Vinzi et al., 2010; Hair Jr et al., 2013; Tenenhaus, Vinzi,
Chatelin, & Lauro, 2005). The difference between predicted and original (true)
value is prediction error. Smaller values of prediction error indicate high
predictive accuracy of the model. The prediction error and trivial prediction
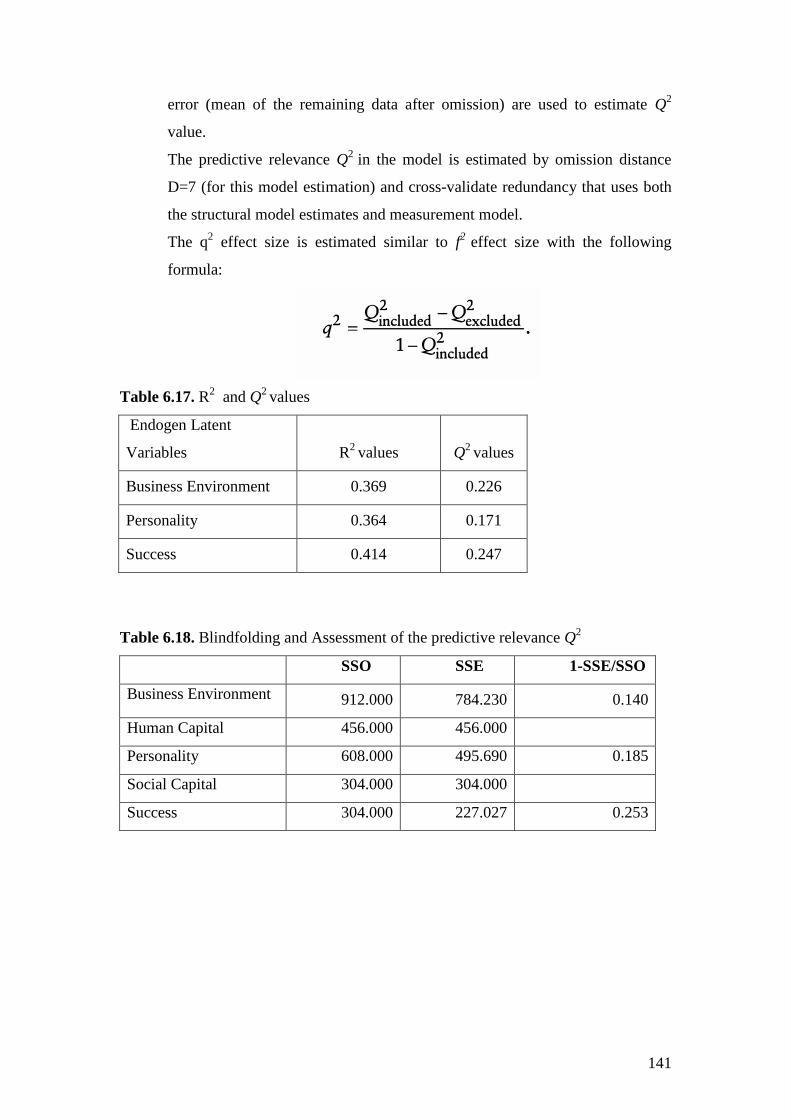
141
error (mean of the remaining data after omission) are used to estimate Q2
value.
The predictive relevance Q2
in the model is estimated by omission distance
D=7 (for this model estimation) and cross-validate redundancy that uses both
the structural model estimates and measurement model.
The q2 effect size is estimated similar to f
2 effect size with the following
formula:
Table 6.17. R2
and Q2 values
Endogen Latent
Variables R2
values Q2
values
Business Environment 0.369 0.226
Personality 0.364 0.171
Success 0.414 0.247
Table 6.18. Blindfolding and Assessment of the predictive relevance Q2
SSO SSE 1-SSE/SSO
Business Environment 912.000 784.230 0.140
Human Capital 456.000 456.000
Personality 608.000 495.690 0.185
Social Capital 304.000 304.000
Success 304.000 227.027 0.253
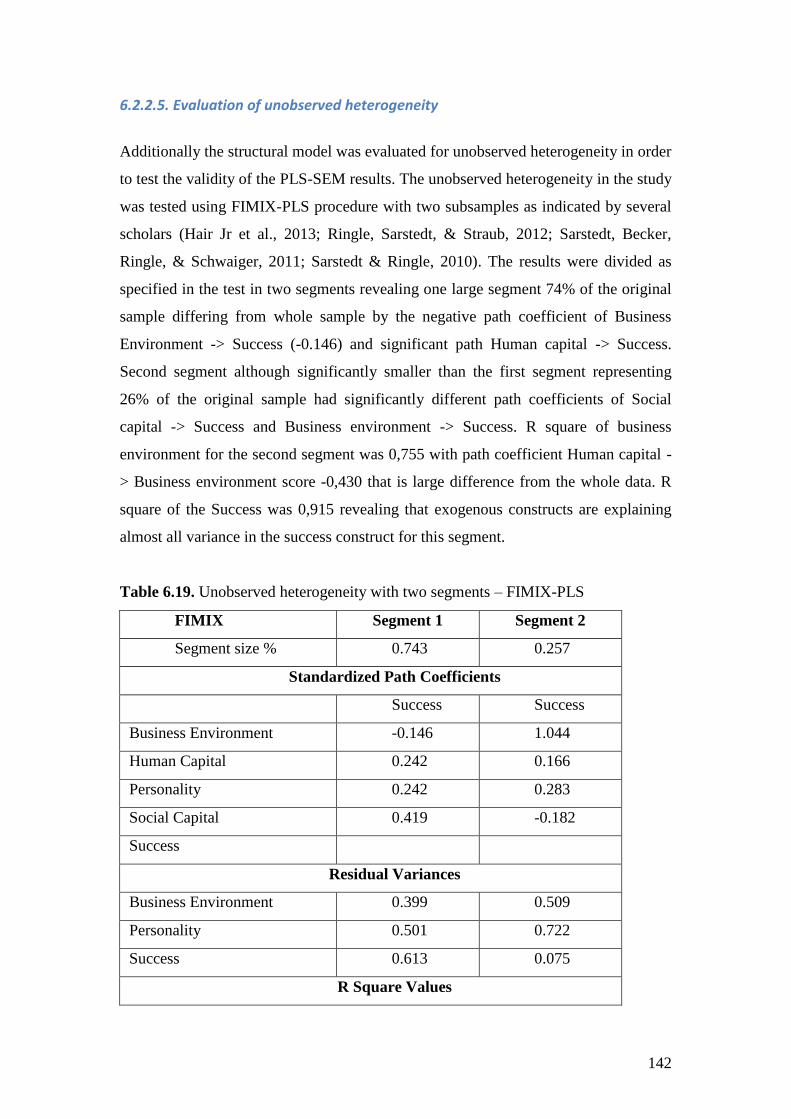
142
6.2.2.5. Evaluation of unobserved heterogeneity
Additionally the structural model was evaluated for unobserved heterogeneity in order
to test the validity of the PLS-SEM results. The unobserved heterogeneity in the study
was tested using FIMIX-PLS procedure with two subsamples as indicated by several
scholars (Hair Jr et al., 2013; Ringle, Sarstedt, & Straub, 2012; Sarstedt, Becker,
Ringle, & Schwaiger, 2011; Sarstedt & Ringle, 2010). The results were divided as
specified in the test in two segments revealing one large segment 74% of the original
sample differing from whole sample by the negative path coefficient of Business
Environment -> Success (-0.146) and significant path Human capital -> Success.
Second segment although significantly smaller than the first segment representing
26% of the original sample had significantly different path coefficients of Social
capital -> Success and Business environment -> Success. R square of business
environment for the second segment was 0,755 with path coefficient Human capital -
> Business environment score -0,430 that is large difference from the whole data. R
square of the Success was 0,915 revealing that exogenous constructs are explaining
almost all variance in the success construct for this segment.
Table 6.19. Unobserved heterogeneity with two segments – FIMIX-PLS
FIMIX Segment 1 Segment 2
Segment size % 0.743 0.257
Standardized Path Coefficients
Success Success
Business Environment -0.146 1.044
Human Capital 0.242 0.166
Personality 0.242 0.283
Social Capital 0.419 -0.182
Success
Residual Variances
Business Environment 0.399 0.509
Personality 0.501 0.722
Success 0.613 0.075
R Square Values
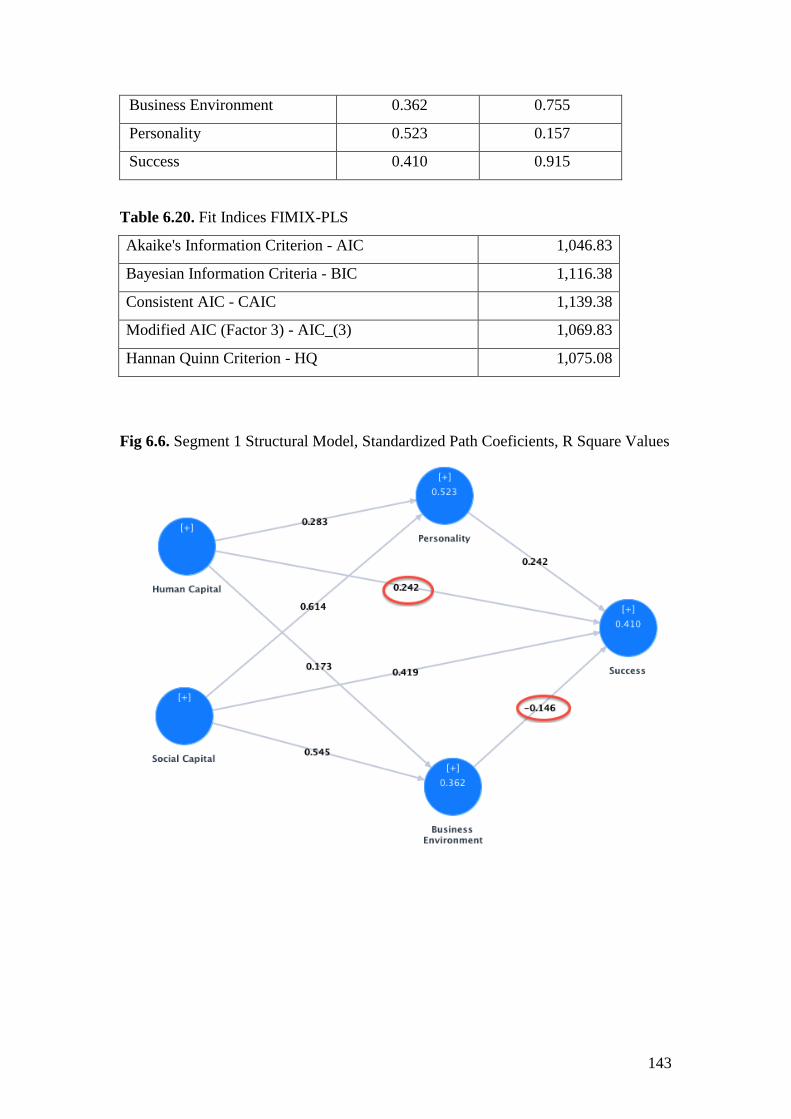
143
Business Environment 0.362 0.755
Personality 0.523 0.157
Success 0.410 0.915
Table 6.20. Fit Indices FIMIX-PLS
Akaike's Information Criterion - AIC 1,046.83
Bayesian Information Criteria - BIC 1,116.38
Consistent AIC - CAIC 1,139.38
Modified AIC (Factor 3) - AIC_(3) 1,069.83
Hannan Quinn Criterion - HQ 1,075.08
Fig 6.6. Segment 1 Structural Model, Standardized Path Coeficients, R Square Values
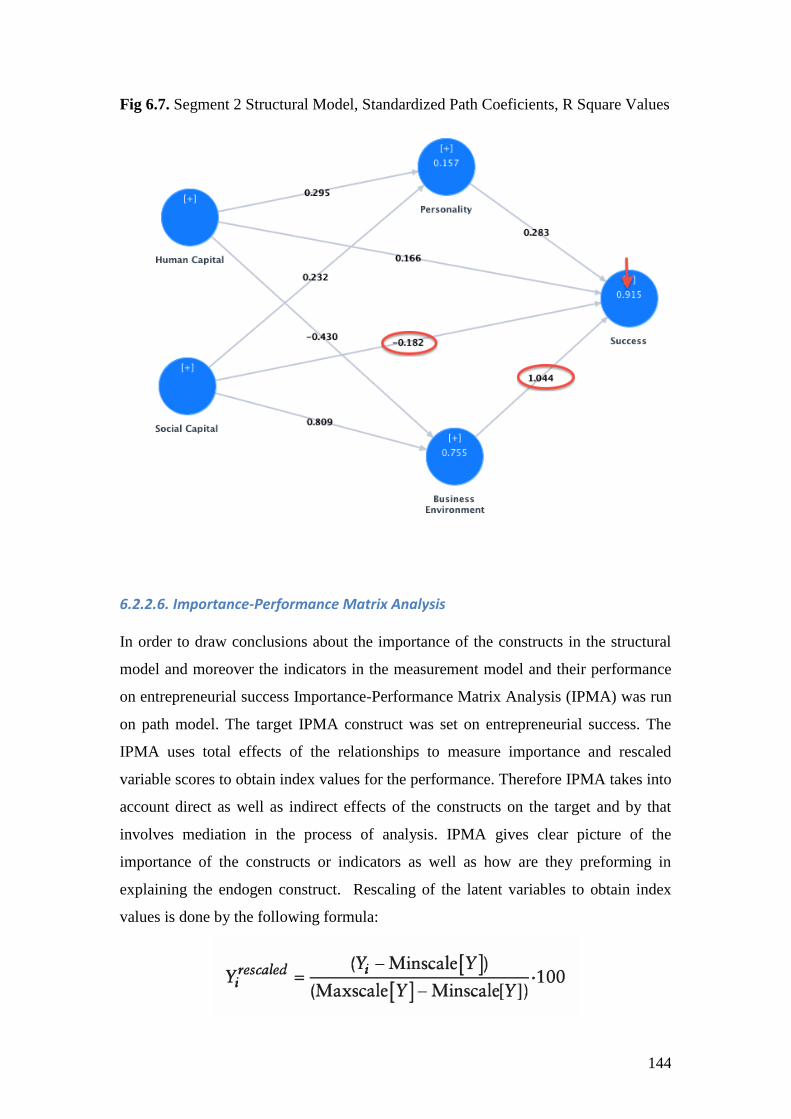
144
Fig 6.7. Segment 2 Structural Model, Standardized Path Coeficients, R Square Values
6.2.2.6. Importance-Performance Matrix Analysis In order to draw conclusions about the importance of the constructs in the structural
model and moreover the indicators in the measurement model and their performance
on entrepreneurial success Importance-Performance Matrix Analysis (IPMA) was run
on path model. The target IPMA construct was set on entrepreneurial success. The
IPMA uses total effects of the relationships to measure importance and rescaled
variable scores to obtain index values for the performance. Therefore IPMA takes into
account direct as well as indirect effects of the constructs on the target and by that
involves mediation in the process of analysis. IPMA gives clear picture of the
importance of the constructs or indicators as well as how are they preforming in
explaining the endogen construct. Rescaling of the latent variables to obtain index
values is done by the following formula:
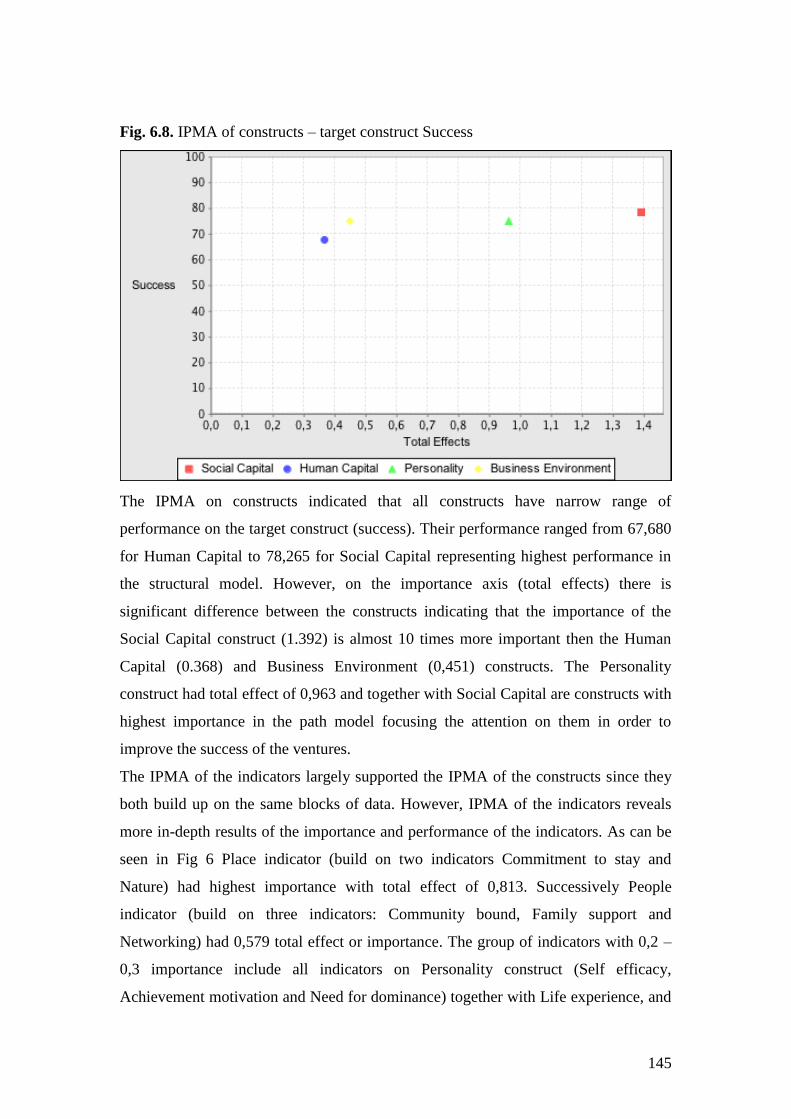
145
Fig. 6.8. IPMA of constructs – target construct Success
The IPMA on constructs indicated that all constructs have narrow range of
performance on the target construct (success). Their performance ranged from 67,680
for Human Capital to 78,265 for Social Capital representing highest performance in
the structural model. However, on the importance axis (total effects) there is
significant difference between the constructs indicating that the importance of the
Social Capital construct (1.392) is almost 10 times more important then the Human
Capital (0.368) and Business Environment (0,451) constructs. The Personality
construct had total effect of 0,963 and together with Social Capital are constructs with
highest importance in the path model focusing the attention on them in order to
improve the success of the ventures.
The IPMA of the indicators largely supported the IPMA of the constructs since they
both build up on the same blocks of data. However, IPMA of the indicators reveals
more in-depth results of the importance and performance of the indicators. As can be
seen in Fig 6 Place indicator (build on two indicators Commitment to stay and
Nature) had highest importance with total effect of 0,813. Successively People
indicator (build on three indicators: Community bound, Family support and
Networking) had 0,579 total effect or importance. The group of indicators with 0,2 –
0,3 importance include all indicators on Personality construct (Self efficacy,
Achievement motivation and Need for dominance) together with Life experience, and
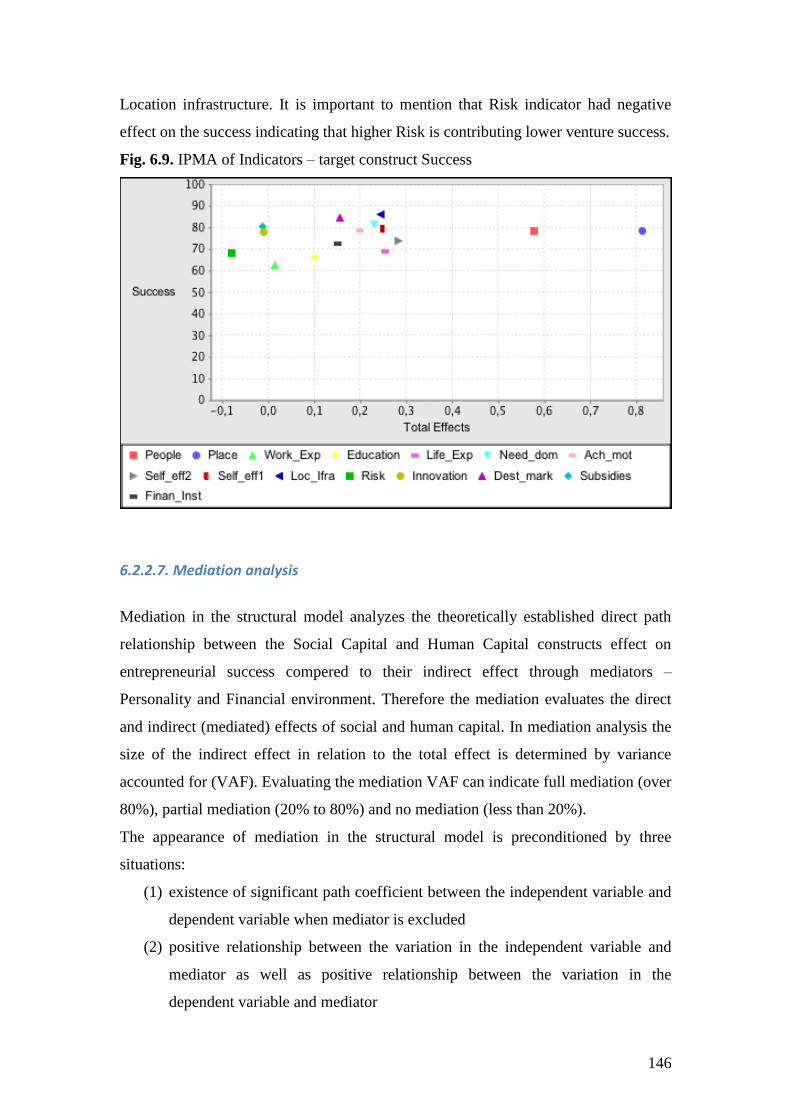
146
Location infrastructure. It is important to mention that Risk indicator had negative
effect on the success indicating that higher Risk is contributing lower venture success.
Fig. 6.9. IPMA of Indicators – target construct Success
6.2.2.7. Mediation analysis
Mediation in the structural model analyzes the theoretically established direct path
relationship between the Social Capital and Human Capital constructs effect on
entrepreneurial success compered to their indirect effect through mediators –
Personality and Financial environment. Therefore the mediation evaluates the direct
and indirect (mediated) effects of social and human capital. In mediation analysis the
size of the indirect effect in relation to the total effect is determined by variance
accounted for (VAF). Evaluating the mediation VAF can indicate full mediation (over
80%), partial mediation (20% to 80%) and no mediation (less than 20%).
The appearance of mediation in the structural model is preconditioned by three
situations:
(1) existence of significant path coefficient between the independent variable and
dependent variable when mediator is excluded
(2) positive relationship between the variation in the independent variable and
mediator as well as positive relationship between the variation in the
dependent variable and mediator
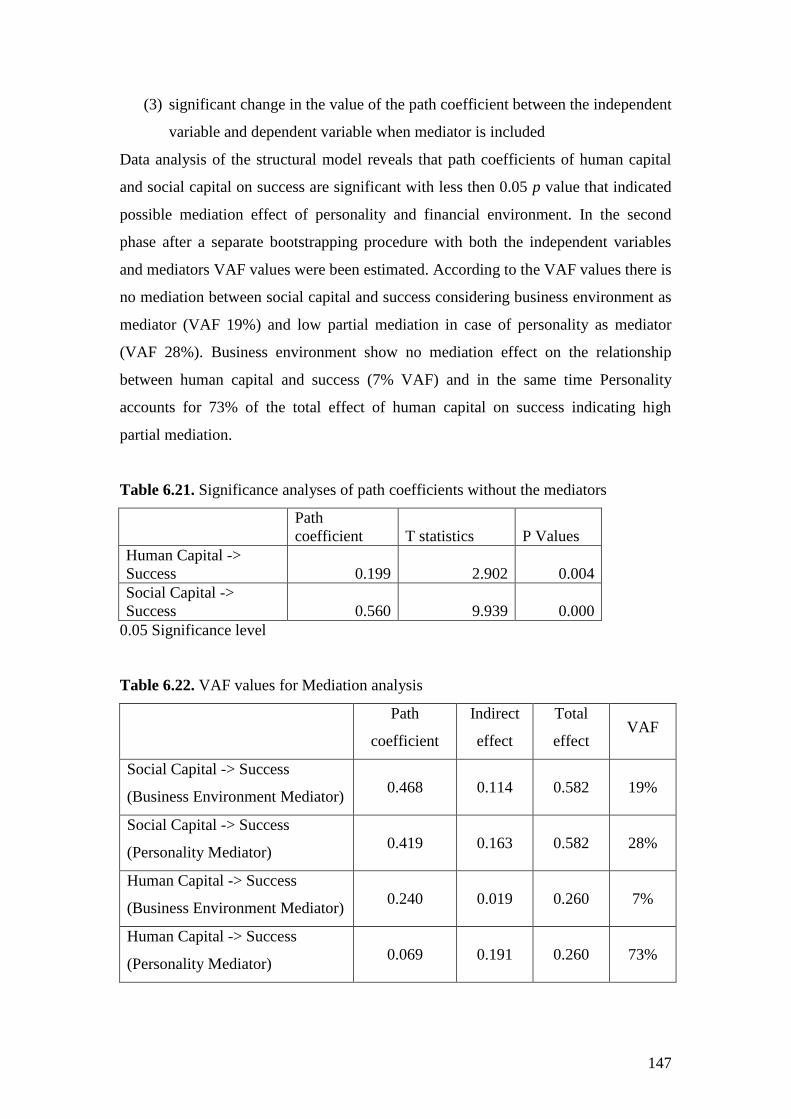
147
(3) significant change in the value of the path coefficient between the independent
variable and dependent variable when mediator is included
Data analysis of the structural model reveals that path coefficients of human capital
and social capital on success are significant with less then 0.05 p value that indicated
possible mediation effect of personality and financial environment. In the second
phase after a separate bootstrapping procedure with both the independent variables
and mediators VAF values were been estimated. According to the VAF values there is
no mediation between social capital and success considering business environment as
mediator (VAF 19%) and low partial mediation in case of personality as mediator
(VAF 28%). Business environment show no mediation effect on the relationship
between human capital and success (7% VAF) and in the same time Personality
accounts for 73% of the total effect of human capital on success indicating high
partial mediation.
Table 6.21. Significance analyses of path coefficients without the mediators
Path
coefficient T statistics P Values
Human Capital ->
Success 0.199 2.902 0.004
Social Capital ->
Success 0.560 9.939 0.000
0.05 Significance level
Table 6.22. VAF values for Mediation analysis
Path
coefficient
Indirect
effect
Total
effect VAF
Social Capital -> Success
(Business Environment Mediator) 0.468 0.114 0.582 19%
Social Capital -> Success
(Personality Mediator) 0.419 0.163 0.582 28%
Human Capital -> Success
(Business Environment Mediator) 0.240 0.019 0.260 7%
Human Capital -> Success
(Personality Mediator) 0.069 0.191 0.260 73%
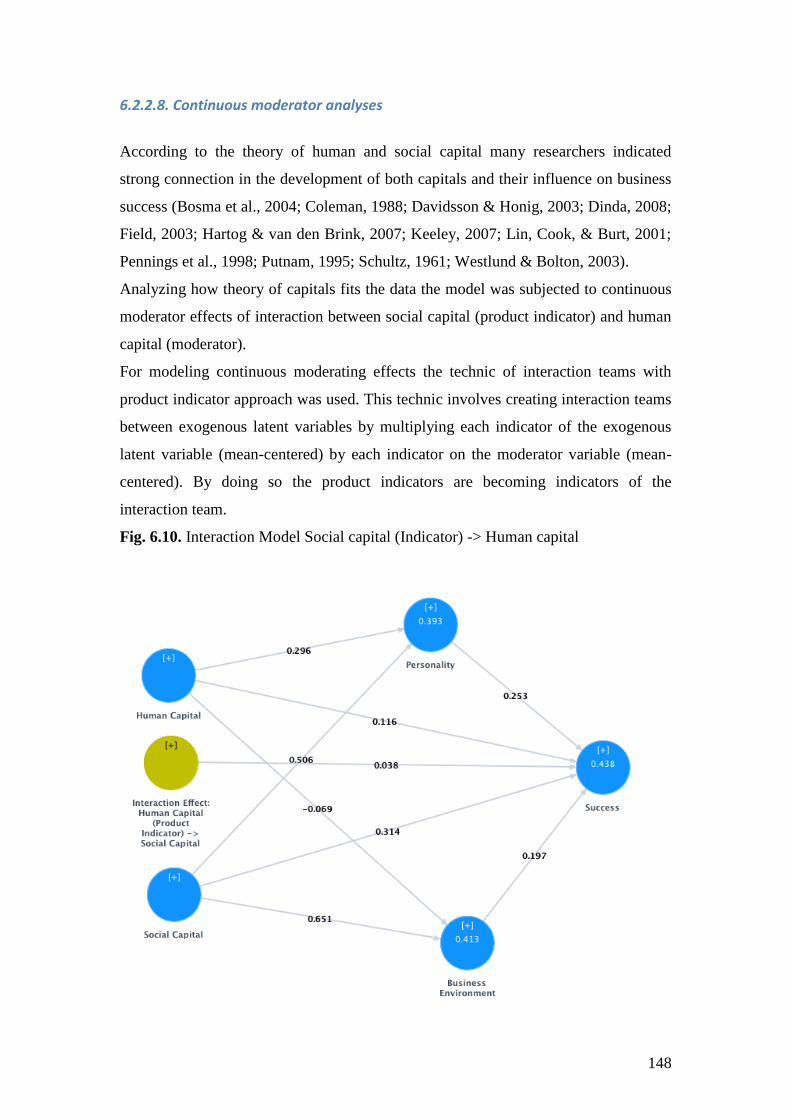
148
6.2.2.8. Continuous moderator analyses
According to the theory of human and social capital many researchers indicated
strong connection in the development of both capitals and their influence on business
success (Bosma et al., 2004; Coleman, 1988; Davidsson & Honig, 2003; Dinda, 2008;
Field, 2003; Hartog & van den Brink, 2007; Keeley, 2007; Lin, Cook, & Burt, 2001;
Pennings et al., 1998; Putnam, 1995; Schultz, 1961; Westlund & Bolton, 2003).
Analyzing how theory of capitals fits the data the model was subjected to continuous
moderator effects of interaction between social capital (product indicator) and human
capital (moderator).
For modeling continuous moderating effects the technic of interaction teams with
product indicator approach was used. This technic involves creating interaction teams
between exogenous latent variables by multiplying each indicator of the exogenous
latent variable (mean-centered) by each indicator on the moderator variable (mean-
centered). By doing so the product indicators are becoming indicators of the
interaction team.
Fig. 6.10. Interaction Model Social capital (Indicator) -> Human capital
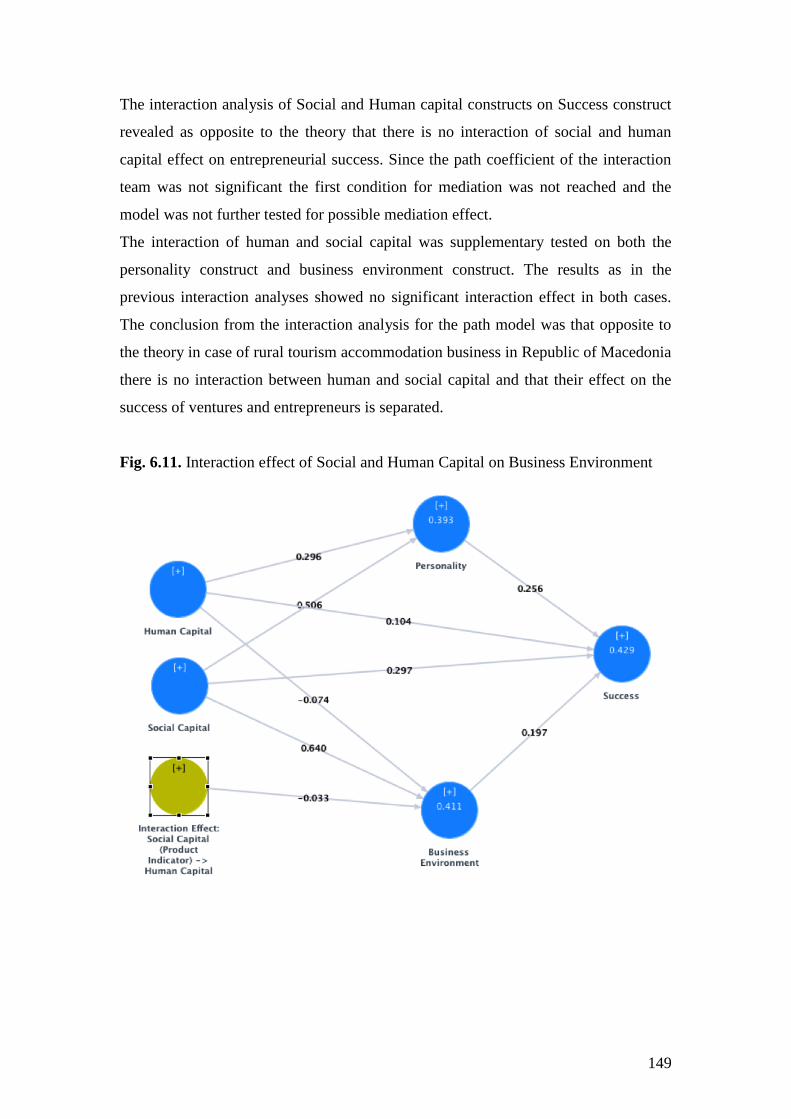
149
The interaction analysis of Social and Human capital constructs on Success construct
revealed as opposite to the theory that there is no interaction of social and human
capital effect on entrepreneurial success. Since the path coefficient of the interaction
team was not significant the first condition for mediation was not reached and the
model was not further tested for possible mediation effect.
The interaction of human and social capital was supplementary tested on both the
personality construct and business environment construct. The results as in the
previous interaction analyses showed no significant interaction effect in both cases.
The conclusion from the interaction analysis for the path model was that opposite to
the theory in case of rural tourism accommodation business in Republic of Macedonia
there is no interaction between human and social capital and that their effect on the
success of ventures and entrepreneurs is separated.
Fig. 6.11. Interaction effect of Social and Human Capital on Business Environment
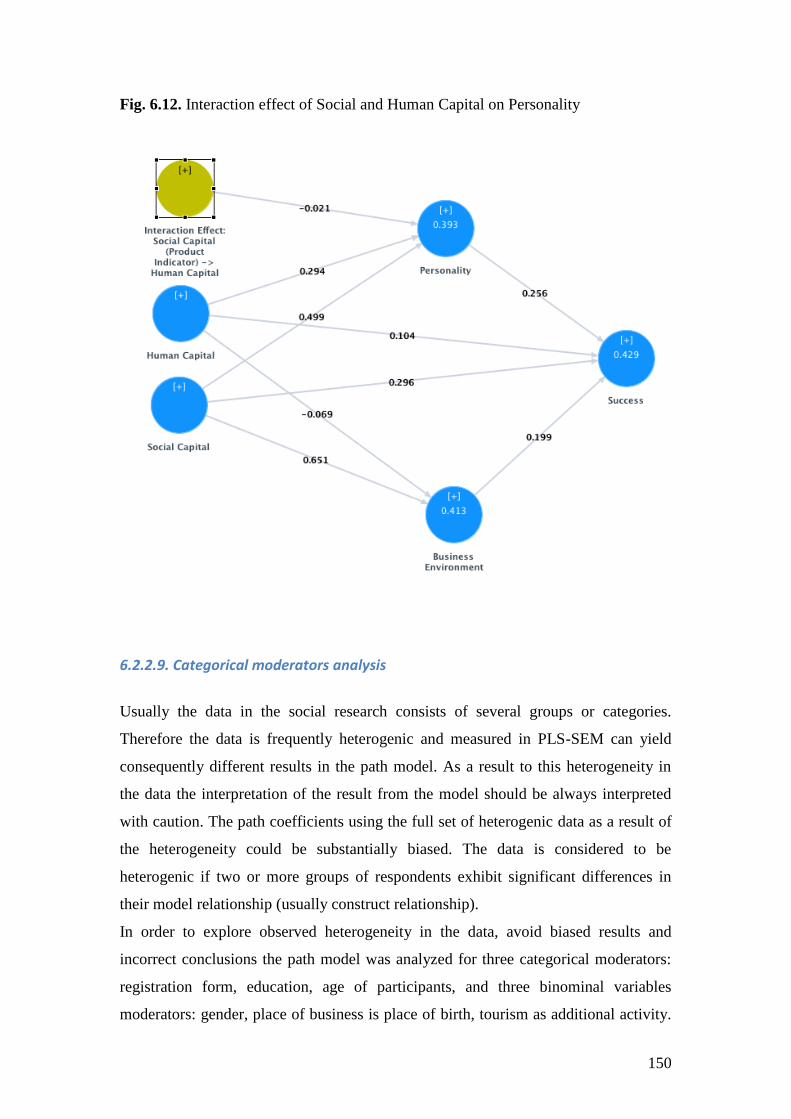
150
Fig. 6.12. Interaction effect of Social and Human Capital on Personality
6.2.2.9. Categorical moderators analysis
Usually the data in the social research consists of several groups or categories.
Therefore the data is frequently heterogenic and measured in PLS-SEM can yield
consequently different results in the path model. As a result to this heterogeneity in
the data the interpretation of the result from the model should be always interpreted
with caution. The path coefficients using the full set of heterogenic data as a result of
the heterogeneity could be substantially biased. The data is considered to be
heterogenic if two or more groups of respondents exhibit significant differences in
their model relationship (usually construct relationship).
In order to explore observed heterogeneity in the data, avoid biased results and
incorrect conclusions the path model was analyzed for three categorical moderators:
registration form, education, age of participants, and three binominal variables
moderators: gender, place of business is place of birth, tourism as additional activity.
151
The null hypotheses Ho tested in every consequently multigroup analysis are that the
path coefficients are significantly different. Two methods have been used for
multigroup analysis:
(1) Henseler‘s Multi-Group Analysis (MGA) for PLS-SEM. This method is a
non-parametric significance test for the difference of group-specific results
that builds on PLS-SEM bootstrapping results. A result is significant at the
5% probability of error level, if the p-value is smaller than 0.05 or larger than
0.95 for a certain difference of group-specific path coefficients (Hair Jr et al.,
2013; Sarstedt, Henseler, & Ringle, 2011).
(2) Welch-Satterthwait Test - method based on parametric significance test for the
difference of group-specific PLS-SEM results that assumes unequal variances
across groups.
Gender as grouping variable
The data was divided in two groups based on the gender of the respondent (group 1 =
males and group 2 = females) and the structural model was tested with two sets of
data. Group 1 consisted of 86 respondents whereas group 2 was counting 66
respondents. The path coefficients of the two groups were compared for significant
differences. The results revealed that although Henseler‘s MGA confirmed the Ho
hypothesis only for the path coefficient of Social Capital -> Success there are two
paths Business Environment -> Success and Human Capital -> Success that have
large differences between groups showing close to significant results, p values 0,909
and 0,914 respectably. Welch-Satterthwait Test confirmed the Ho hypotheses on two
path coefficients (Human Capital -> Success and Social Capital -> Success)
confirming significant difference between two groups. The difference was as a result
to the low pat coefficient (0.064) of Human Capital -> Success for group 1 (males)
and low pat coefficient (-0.010) of Social Capital -> Success for group 2 (females).
Concerning the results from the multigroup analysis on gender as moderator
obviously males and females have significantly different opinions on the effect of
human and social capital on the success of the rural tourism success.
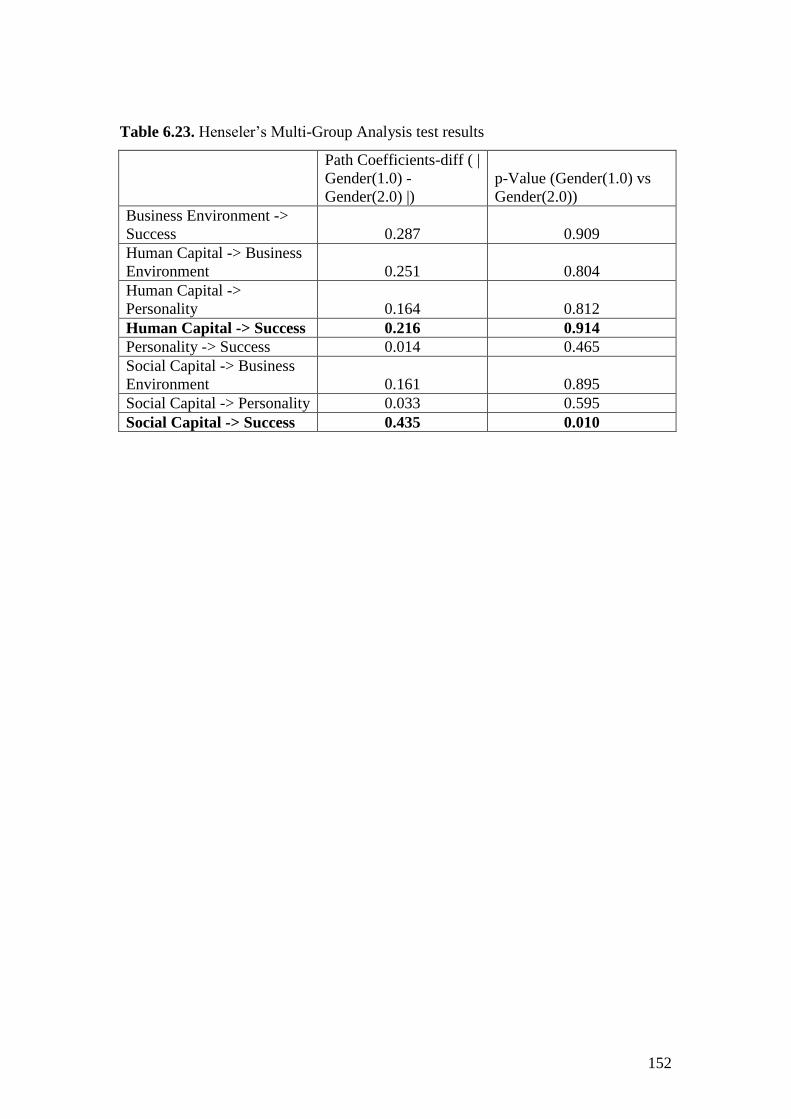
152
Table 6.23. Henseler‘s Multi-Group Analysis test results
Path Coefficients-diff ( |
Gender(1.0) -
Gender(2.0) |)
p-Value (Gender(1.0) vs
Gender(2.0))
Business Environment ->
Success 0.287 0.909
Human Capital -> Business
Environment 0.251 0.804
Human Capital ->
Personality 0.164 0.812
Human Capital -> Success 0.216 0.914
Personality -> Success 0.014 0.465
Social Capital -> Business
Environment 0.161 0.895
Social Capital -> Personality 0.033 0.595
Social Capital -> Success 0.435 0.010
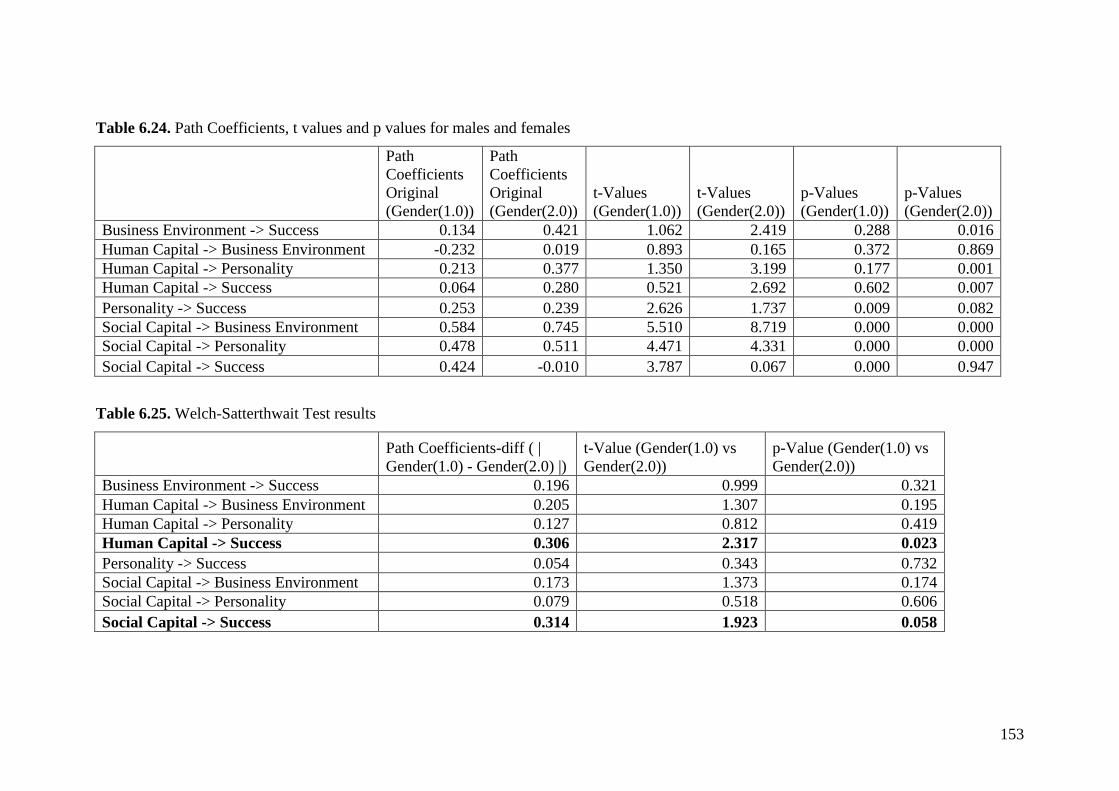
153
Table 6.24. Path Coefficients, t values and p values for males and females
Path
Coefficients
Original
(Gender(1.0))
Path
Coefficients
Original
(Gender(2.0))
t-Values
(Gender(1.0))
t-Values
(Gender(2.0))
p-Values
(Gender(1.0))
p-Values
(Gender(2.0))
Business Environment -> Success 0.134 0.421 1.062 2.419 0.288 0.016
Human Capital -> Business Environment -0.232 0.019 0.893 0.165 0.372 0.869
Human Capital -> Personality 0.213 0.377 1.350 3.199 0.177 0.001
Human Capital -> Success 0.064 0.280 0.521 2.692 0.602 0.007
Personality -> Success 0.253 0.239 2.626 1.737 0.009 0.082
Social Capital -> Business Environment 0.584 0.745 5.510 8.719 0.000 0.000
Social Capital -> Personality 0.478 0.511 4.471 4.331 0.000 0.000
Social Capital -> Success 0.424 -0.010 3.787 0.067 0.000 0.947
Table 6.25. Welch-Satterthwait Test results
Path Coefficients-diff ( |
Gender(1.0) - Gender(2.0) |)
t-Value (Gender(1.0) vs
Gender(2.0))
p-Value (Gender(1.0) vs
Gender(2.0))
Business Environment -> Success 0.196 0.999 0.321
Human Capital -> Business Environment 0.205 1.307 0.195
Human Capital -> Personality 0.127 0.812 0.419
Human Capital -> Success 0.306 2.317 0.023
Personality -> Success 0.054 0.343 0.732
Social Capital -> Business Environment 0.173 1.373 0.174
Social Capital -> Personality 0.079 0.518 0.606
Social Capital -> Success 0.314 1.923 0.058
154
Place of business as place of birth (PBB)
Place of business as place of birth is considered to have strong connection to the
perception of the rural tourism business and perception of success. The qualitative
analysis with the life story interviews indicated that there is tight connection between
place of the business and place of birth influencing the place identity and building the
social capital. As a result to this observation and conclusion from the life story
interviews a binominal categorical variable was included in the qualitative research.
The data, whether the place where the business is situated was the place of birth of the
entrepreneur, was used as groping variable.
According to this binominal variable the data was split in two groups. Group 1
indicated that the participant‘s place of business was place of birth accounting for 90
respondents and group 2 that the place of business is not the place of birth accounting
for 62 respondents.
Conducting the Henseler‘s MGA and Welch-Satterthwait Test all Ho hypotheses that
the path coefficients are significantly different among groups were rejected showing
no significant difference between the two groups. The results of group‘s path
coefficients, t values and p values are presented in Table 24. The only large difference
in path coefficient was in the path of Human Capital -> Personality. This path was
significant with t value of 2,196 for the first group indicating that Human capital has
positive effect and it‘s predicting the presence of entrepreneurial personality for
entrepreneurs that have strong place connection. For group 2 the same path Human
Capital -> Personality was not significant with t value of 0,619.
Tourism as additional activity (TAA)
According to the theory of rural tourism, the emergence and development of rural
tourism is often associated with small family businesses and diversification of rural
activities. As a diversified rural activity the rural tourism frequently appears as an
additional on farm activity that contributes to additional farm income. More recently
rural tourism as a result of the rapid growth of the industry, the great economic
potential and growing demand is increasingly appearing as a main activity unrelated
155
to agricultural production. Its development in this cases is based on the local natural
resources such as nature, tradition, food etc.
This condition can be observed from the data itself in the research where a large
majority of respondents indicated that for them rural tourism is additional activity and
they perform the rural tourism business as natural persons. Without exception these
entrepreneurs are using family labor without hiring additional people and have small-
scale activities.
According to the previous, the data clearly distinguish two groups of participants: (1)
participants that implement rural tourism as additional activity and (2) participants
that perform rural tourism as their primary activity. The groups were directly
examined by the binomial variable. Group 1 is determined as a group in which
participants performed rural tourism as additional activity and group 2 where
participants perform rural tourism as the main activity. Group 1 consisted of 99
respondents group 2 consisted of 53 respondents
Conducting the Henseler‘s MGA and Welch-Satterthwait Test all Ho hypotheses that
the path coefficients are significantly different among groups were rejected showing
no significant difference between the two groups. Nevertheless, analyzing the path
coefficient of the groups indicated that there are two path with strong differences
between the groups. The first path Human Capital -> Personality had t value of 3,382
and 0,01 level of significance for the group 1 TAA whereas for the group 2 TAA had
0.764 indicating that Personality for the small businesses is strongly predicted and
influenced by the Human Capital which is not the case for the entrepreneurs with
larger business and rural tourism as main activity. This effect is also present in the
path of Personality -> Success. This path has significance level of 0,01 for the first
group and in the same time is not significant for the second group.
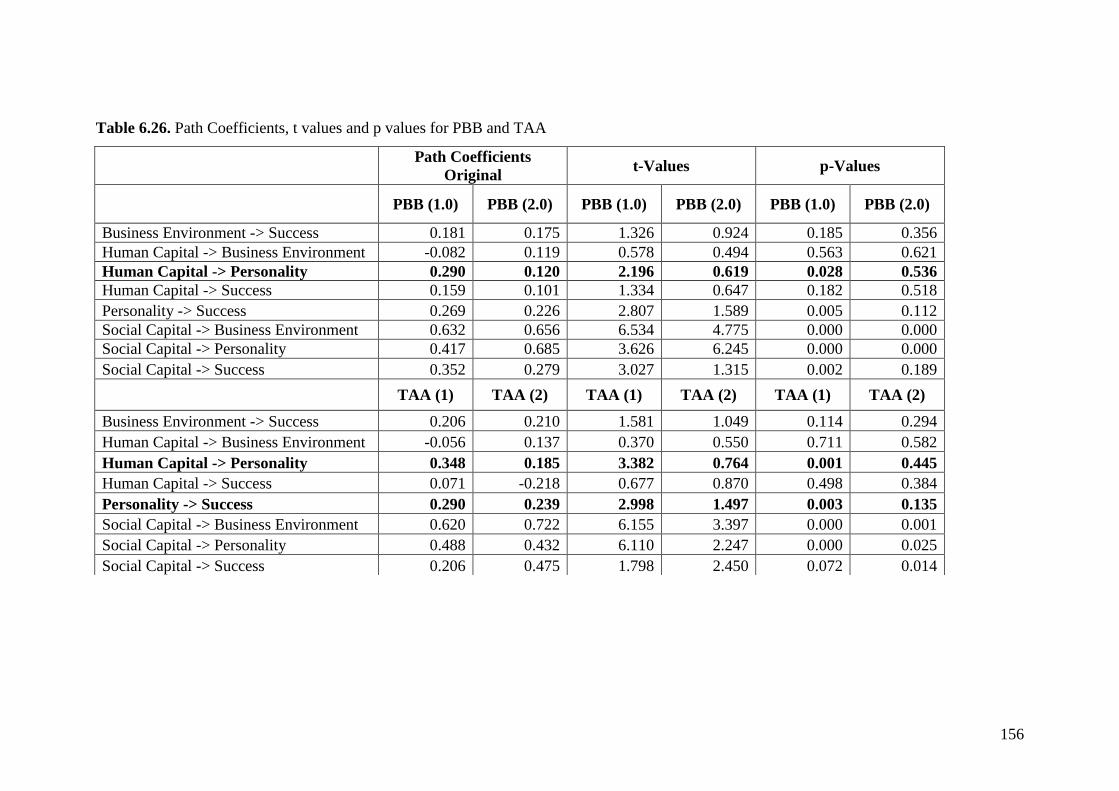
156
Table 6.26. Path Coefficients, t values and p values for PBB and TAA
Path Coefficients
Original t-Values p-Values
PBB (1.0) PBB (2.0) PBB (1.0) PBB (2.0) PBB (1.0) PBB (2.0)
Business Environment -> Success 0.181 0.175 1.326 0.924 0.185 0.356
Human Capital -> Business Environment -0.082 0.119 0.578 0.494 0.563 0.621
Human Capital -> Personality 0.290 0.120 2.196 0.619 0.028 0.536
Human Capital -> Success 0.159 0.101 1.334 0.647 0.182 0.518
Personality -> Success 0.269 0.226 2.807 1.589 0.005 0.112
Social Capital -> Business Environment 0.632 0.656 6.534 4.775 0.000 0.000
Social Capital -> Personality 0.417 0.685 3.626 6.245 0.000 0.000
Social Capital -> Success 0.352 0.279 3.027 1.315 0.002 0.189
TAA (1) TAA (2) TAA (1) TAA (2) TAA (1) TAA (2)
Business Environment -> Success 0.206 0.210 1.581 1.049 0.114 0.294
Human Capital -> Business Environment -0.056 0.137 0.370 0.550 0.711 0.582
Human Capital -> Personality 0.348 0.185 3.382 0.764 0.001 0.445
Human Capital -> Success 0.071 -0.218 0.677 0.870 0.498 0.384
Personality -> Success 0.290 0.239 2.998 1.497 0.003 0.135
Social Capital -> Business Environment 0.620 0.722 6.155 3.397 0.000 0.001
Social Capital -> Personality 0.488 0.432 6.110 2.247 0.000 0.025
Social Capital -> Success 0.206 0.475 1.798 2.450 0.072 0.014
157
Age and education of participants
Although age of participants was gathered as continuous variable as a result of the
small sample size (152) the data could not be divided in more than two categories.
Therefore the data was divided in close to median (47) two categories. The first
category range was 18 to 45 years old entrepreneurs and the second category was 46
to oldest participant that was 76 years old. (Group1= 67 participants, Group2=85
participants)
Education of the participants was gathered as categorical variable with five categories
but as a result to the size limitation for the data analysis this variable was rescaled in
binominal variable. Group 1 had lower education: primary school, high school and
two years faculty education whereas group 2 had higher education: 4 yeas faculty.
(Group1= 84 participants, Group2=68 participants)
Conducting the Henseler‘s MGA and Welch-Satterthwait test for both grouping
variables indicated that all Ho hypotheses that the path coefficients are significantly
different among groups were rejected showing no significant difference between the
two groups.
The results of group‘s path coefficients, t values and p values are presented in Table
25. The only large difference in path coefficient was in the path of Human Capital ->
Success. This path was significant with t value of 2,594 for the first group of
education variable indicating that Human capital has positive effect and it‘s predicting
the entrepreneurial success for the group with lower education. For group 2 the same
path Human Capital -> Success was not significant with t value of 0,046.
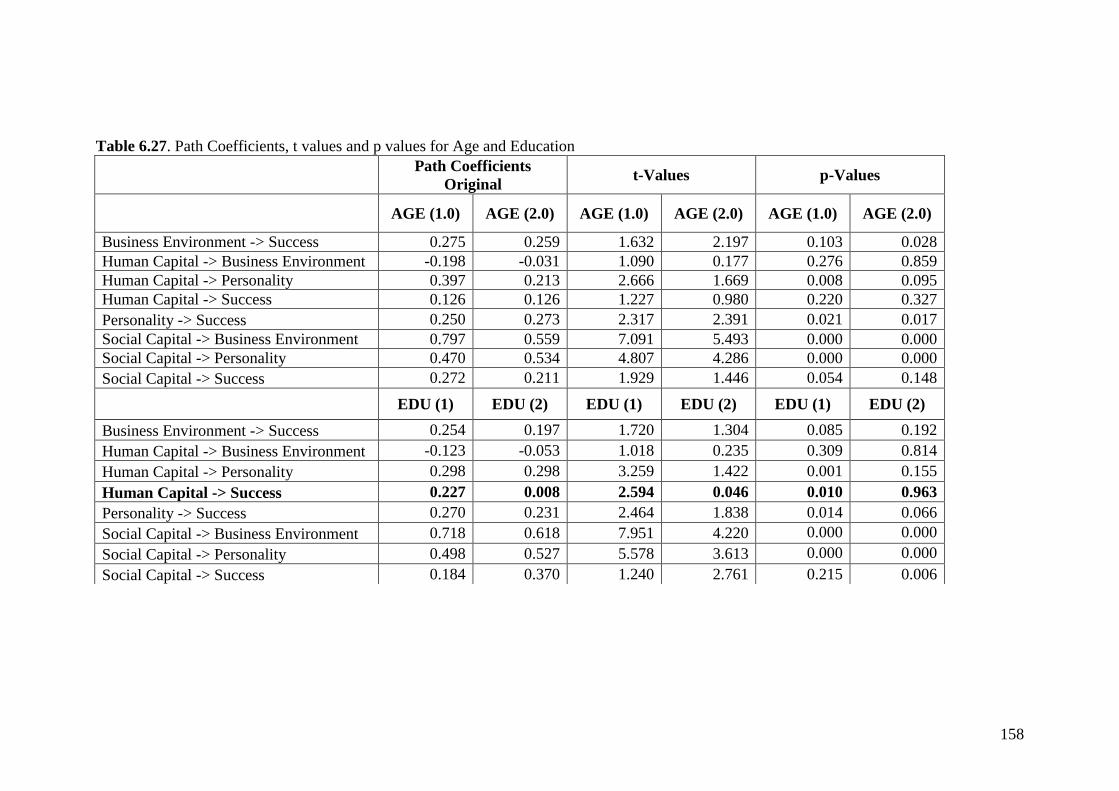
158
Table 6.27. Path Coefficients, t values and p values for Age and Education
Path Coefficients
Original t-Values p-Values
AGE (1.0) AGE (2.0) AGE (1.0) AGE (2.0) AGE (1.0) AGE (2.0)
Business Environment -> Success 0.275 0.259 1.632 2.197 0.103 0.028
Human Capital -> Business Environment -0.198 -0.031 1.090 0.177 0.276 0.859
Human Capital -> Personality 0.397 0.213 2.666 1.669 0.008 0.095
Human Capital -> Success 0.126 0.126 1.227 0.980 0.220 0.327
Personality -> Success 0.250 0.273 2.317 2.391 0.021 0.017
Social Capital -> Business Environment 0.797 0.559 7.091 5.493 0.000 0.000
Social Capital -> Personality 0.470 0.534 4.807 4.286 0.000 0.000
Social Capital -> Success 0.272 0.211 1.929 1.446 0.054 0.148
EDU (1) EDU (2) EDU (1) EDU (2) EDU (1) EDU (2)
Business Environment -> Success 0.254 0.197 1.720 1.304 0.085 0.192
Human Capital -> Business Environment -0.123 -0.053 1.018 0.235 0.309 0.814
Human Capital -> Personality 0.298 0.298 3.259 1.422 0.001 0.155
Human Capital -> Success 0.227 0.008 2.594 0.046 0.010 0.963
Personality -> Success 0.270 0.231 2.464 1.838 0.014 0.066
Social Capital -> Business Environment 0.718 0.618 7.951 4.220 0.000 0.000
Social Capital -> Personality 0.498 0.527 5.578 3.613 0.000 0.000
Social Capital -> Success 0.184 0.370 1.240 2.761 0.215 0.006
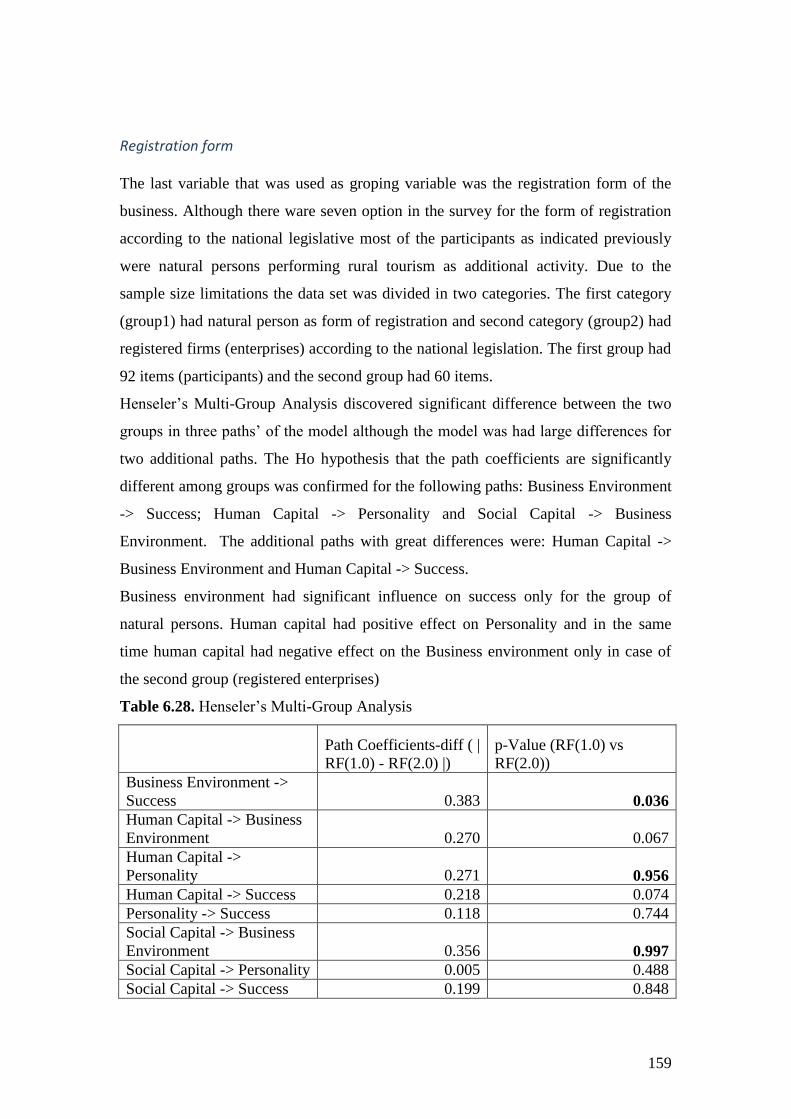
159
Registration form The last variable that was used as groping variable was the registration form of the
business. Although there ware seven option in the survey for the form of registration
according to the national legislative most of the participants as indicated previously
were natural persons performing rural tourism as additional activity. Due to the
sample size limitations the data set was divided in two categories. The first category
(group1) had natural person as form of registration and second category (group2) had
registered firms (enterprises) according to the national legislation. The first group had
92 items (participants) and the second group had 60 items.
Henseler‘s Multi-Group Analysis discovered significant difference between the two
groups in three paths‘ of the model although the model was had large differences for
two additional paths. The Ho hypothesis that the path coefficients are significantly
different among groups was confirmed for the following paths: Business Environment
-> Success; Human Capital -> Personality and Social Capital -> Business
Environment. The additional paths with great differences were: Human Capital ->
Business Environment and Human Capital -> Success.
Business environment had significant influence on success only for the group of
natural persons. Human capital had positive effect on Personality and in the same
time human capital had negative effect on the Business environment only in case of
the second group (registered enterprises)
Table 6.28. Henseler‘s Multi-Group Analysis
Path Coefficients-diff ( |
RF(1.0) - RF(2.0) |)
p-Value (RF(1.0) vs
RF(2.0))
Business Environment ->
Success 0.383 0.036
Human Capital -> Business
Environment 0.270 0.067
Human Capital ->
Personality 0.271 0.956
Human Capital -> Success 0.218 0.074
Personality -> Success 0.118 0.744
Social Capital -> Business
Environment 0.356 0.997
Social Capital -> Personality 0.005 0.488
Social Capital -> Success 0.199 0.848
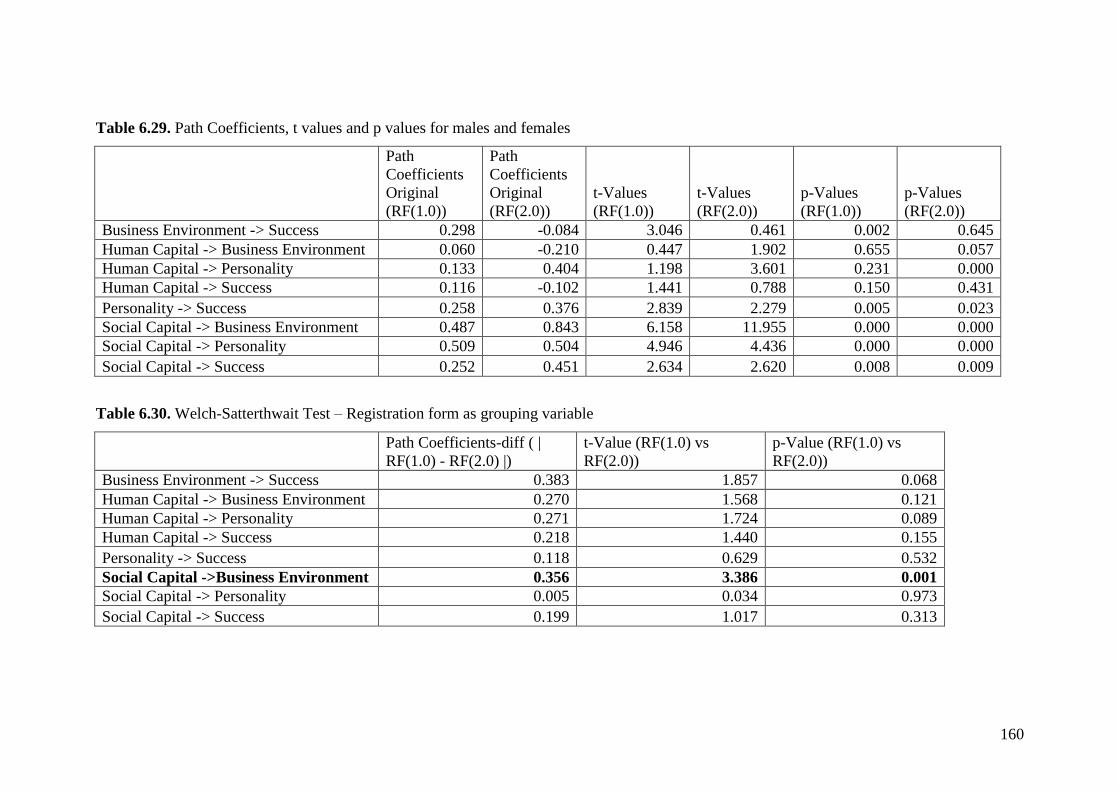
160
Table 6.29. Path Coefficients, t values and p values for males and females
Path
Coefficients
Original
(RF(1.0))
Path
Coefficients
Original
(RF(2.0))
t-Values
(RF(1.0))
t-Values
(RF(2.0))
p-Values
(RF(1.0))
p-Values
(RF(2.0))
Business Environment -> Success 0.298 -0.084 3.046 0.461 0.002 0.645
Human Capital -> Business Environment 0.060 -0.210 0.447 1.902 0.655 0.057
Human Capital -> Personality 0.133 0.404 1.198 3.601 0.231 0.000
Human Capital -> Success 0.116 -0.102 1.441 0.788 0.150 0.431
Personality -> Success 0.258 0.376 2.839 2.279 0.005 0.023
Social Capital -> Business Environment 0.487 0.843 6.158 11.955 0.000 0.000
Social Capital -> Personality 0.509 0.504 4.946 4.436 0.000 0.000
Social Capital -> Success 0.252 0.451 2.634 2.620 0.008 0.009
Table 6.30. Welch-Satterthwait Test – Registration form as grouping variable
Path Coefficients-diff ( |
RF(1.0) - RF(2.0) |)
t-Value (RF(1.0) vs
RF(2.0))
p-Value (RF(1.0) vs
RF(2.0))
Business Environment -> Success 0.383 1.857 0.068
Human Capital -> Business Environment 0.270 1.568 0.121
Human Capital -> Personality 0.271 1.724 0.089
Human Capital -> Success 0.218 1.440 0.155
Personality -> Success 0.118 0.629 0.532
Social Capital ->Business Environment 0.356 3.386 0.001
Social Capital -> Personality 0.005 0.034 0.973
Social Capital -> Success 0.199 1.017 0.313
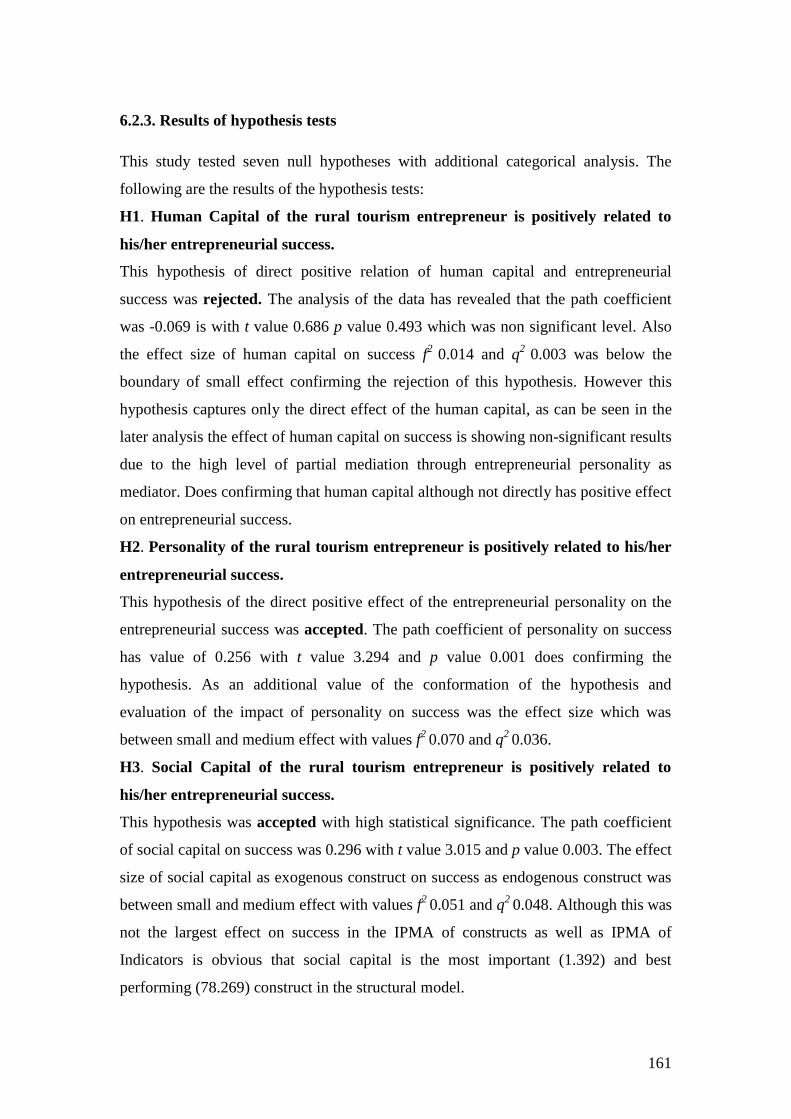
161
6.2.3. Results of hypothesis tests
This study tested seven null hypotheses with additional categorical analysis. The
following are the results of the hypothesis tests:
H1. Human Capital of the rural tourism entrepreneur is positively related to
his/her entrepreneurial success.
This hypothesis of direct positive relation of human capital and entrepreneurial
success was rejected. The analysis of the data has revealed that the path coefficient
was -0.069 is with t value 0.686 p value 0.493 which was non significant level. Also
the effect size of human capital on success f2
0.014 and q2
0.003 was below the
boundary of small effect confirming the rejection of this hypothesis. However this
hypothesis captures only the direct effect of the human capital, as can be seen in the
later analysis the effect of human capital on success is showing non-significant results
due to the high level of partial mediation through entrepreneurial personality as
mediator. Does confirming that human capital although not directly has positive effect
on entrepreneurial success.
H2. Personality of the rural tourism entrepreneur is positively related to his/her
entrepreneurial success.
This hypothesis of the direct positive effect of the entrepreneurial personality on the
entrepreneurial success was accepted. The path coefficient of personality on success
has value of 0.256 with t value 3.294 and p value 0.001 does confirming the
hypothesis. As an additional value of the conformation of the hypothesis and
evaluation of the impact of personality on success was the effect size which was
between small and medium effect with values f2
0.070 and q2
0.036.
H3. Social Capital of the rural tourism entrepreneur is positively related to
his/her entrepreneurial success.
This hypothesis was accepted with high statistical significance. The path coefficient
of social capital on success was 0.296 with t value 3.015 and p value 0.003. The effect
size of social capital as exogenous construct on success as endogenous construct was
between small and medium effect with values f2
0.051 and q2
0.048. Although this was
not the largest effect on success in the IPMA of constructs as well as IPMA of
Indicators is obvious that social capital is the most important (1.392) and best
performing (78.269) construct in the structural model.
162
H4. External business environment is positively related to his/her
entrepreneurial success.
The path coefficient of the business environment on success was 0.199 with t value
2.003 and p value 0.045 does confirming the positive relation between the constructs
and therefore the null hypothesis was accepted. The effect size of financial
environment as exogenous construct on success as endogenous construct revealed
small effect with values f2
0.039 and small predictive relevance with effect size
scoring q2
0.007.
H5. Personality of the rural tourism entrepreneur mediates the positive effect of
Human Capital and Social Capital on entrepreneurial success
In the evaluation of H2 it was accepted that personality has positive effect on success,
however measuring the direct positive effect of human capital on success H1 was
rejected and for social capital H3 was accepted. This hypothesis evaluated the indirect
effect of social and human capital on success via personality. As indicated in the
mediation analysis there is low partial mediation through personality of the effect of
social capital on success with VAF 28% and high partial mediation of the effect of
human capital on success with VAF 73%. Therefore this hypothesis was accepted
does confirming that personality is mediating the positive effect of human and social
capital on entrepreneurial success.
H6. Business environment mediates the positive effect of Human Capital and
Social Capital on entrepreneurial success
The evaluation of the mediation effect of business environment on the positive effect
of human and social capital on success showed opposite results compared to H5. As
indicated in the mediation analysis, business environment demonstrate no mediation
effect on the relationship between human capital and success with VAF 7% and also
no mediation between social capital and success with VAF 19%. Considering the
mediation analysis this hypothesis was rejected.
H7. Human Capital moderates the positive effect of Social Capital on
entrepreneurial success
The interaction analysis of social and human capital on success revealed as opposite
to the theory that there is no interaction effect. The path coefficient 0,038 of the
interaction team was not significant and therefore the hypothesis was rejected.
The interaction of human and social capital was supplementary tested on both the
personality construct and business environment construct. The results as in the
163
previous interaction analyses showed no significant interaction effect in both cases
(path coefficient -0.033 on business environment and -0.021 on personality). The
conclusion from the interaction analysis for the path model was that opposite to the
theory. Therefore in case of rural tourism accommodation business in Republic of
Macedonia there is no interaction between human and social capital and their effect
on the success of entrepreneurs is independent of one another.
In addition to these null hypotheses, the study analyzed the primary data with
two supplementary tests: test for unobserved heterogeneity and categorical moderator
analysis.
The FIMIX procedure for unobserved heterogeneity evaluation with two
segments revealed existence of one large segment 74% with negative path coefficient
of Business Environment -> Success (-0.146) and significant path coefficient on
Human capital -> Success. Second segment was smaller than the first segment
representing 26% of the original sample and had significantly different path
coefficients of Social capital -> Success (-0,182) and Business environment ->
Success (1.044). R square of business environment and success for the second
segment was 0.755 and 0.915 respectably, revealing that exogenous constructs are
explaining almost all variance in the success construct for this segment. It can
therefore be concluded that one quarter of the entrepreneurs declare that social capital
have negative effect on their success and in the same time business environment as
external factor has significant positive effect on their success.
The path model was analyzed for three categorical moderators: registration form,
education, age of participants, and three binominal variables moderators: gender,
place of business is place of birth, tourism as additional activity.
Considering the gender the analysis revealed that there is deference between path
coefficients of human and social capital on success. The female entrepreneurs
consider that human capital has significant positive effect on success and social
capital doesn‘t opposite to the male entrepreneurs that revealed strong positive effect
of social capital on success and no direct effect of the human capital.
The analysis revealed no significant difference between path coefficients for the
groping variables: PBB and TAA. Age and education analyzed as binominal
categorical variable showed no significant differences between the groups with
exception of the path coefficient between the low and high education groups. The low
164
education group considered that human capital has significant direct effect on success
opposite to the high education group.
The analysis for the last categorical variable, registration form, revealed that the
groups as expected are exceedingly different. The group of natural persons revealed
that business environment has strong positive correlation to the success compared to
the group of legal entities. Whereas the second group, legal entities, revealed that for
them human capital has more solid positive effect on personality and also social
capital has stronger positive effect on business environment compared to the first
group.
6.3. Discussion
This study analyzed the rural tourism in Republic of Macedonia as economic activity
from entrepreneurs‘ point of view. Analyzing the entrepreneurs the study define and
measure the factors that affect the success of entrepreneurs dealing with rural tourism
in the country. Given that the matter of entrepreneurship is complex one and requires
holistic approach the study establishes links and brings together the existing theories
of entrepreneurship, rural development and tourism.
The starting point for the study was the place where rural tourism is performed – the
rural area. As indicated in the analysis based on the national definition 1,733 out of
1,762 settlements in RM are rural. Measured in population rural settlements had
1,258,625 inhabitants or approximately 62% of the total population of the country
invading almost 79% of the territory. Working age population (15-64 years) share in
rural areas was 56% with almost 85% working full time or part time in agriculture.
According to the available data the business sector in rural areas is significantly less
developed compared to the urban with 22 enterprises on 1,000 inhabitants or 12 less
then in urban areas. Out of 71,290 registered enterprises in the country only 28% are
based in rural municipalities. Analyzing the structure of the enterprises registered in
rural municipalities almost 75% of the enterprises are micro enterprises with 1-9
employees. Briefly, rurality in RM includes large portion of the country resources
that, with small exceptions, still produces only food, feed and fiber.
165
The location is a factor that limits but also creates opportunities. It is the most
important thing in the business and as data analysis indicates important influential
success factor in rural tourism in RM. The rural areas are often distant, inaccessible
and with infrastructure and financial limitations. On the other hand partially as a
result to this inaccessibility combined with the natural resources they present huge
potential for authentic rural tourism development. This potential is also an
opportunity for the rural areas. However, rural tourism is a relatively new term
introduced in the tourism terminology in the Republic of Macedonia compared to the
EU. The legal framework for rural tourism is relatively young and still in
development but with adoption of the National Strategy for Rural Tourism 2012 –
2017 it is evident positive approach toward implementation of EU standards.
Important initial problem in the development of rural tourism that faced this study and
that will be obstacle to future studies and even to the development of rural tourism is
the lack of database on premises and entities involved in the sector. This database
could also be used for measuring the tourist and overnight stays in rural tourism
sector. Lacking official statistics on rural tourism market, such as: number of tourists,
revenue from rural tourism, the number of premises and accommodation, seasonal use
of the facilities for accommodation and food etc., is causing lack of research in this
area. The lack of such statistics greatly complicates the analysis and opportunities to
make objective analysis and forecasts for the development of rural tourism.
According to the available data only 3.7% of the total catering facilities with
accommodation are located in rural areas and they have only 1.15% of the total bed
capacity of the country.
The theory of rural entrepreneurship emphasized that rural enterprises more often are
facing small size of local markets allied with low population and per capita income;
low access to skilled labor; poor infrastructure, access to finance and institutional
environment.
Many see rural tourism as one of the principal forms of preservation of the
characteristics of rural areas, the landscape and the culture. In this sense rural areas
are shaping or influencing the form in which rural tourism emerges. Therefore the
form and size is also important characteristic of rural tourism. Rural tourism is an
activity that is usually opposite to the conventional tourism small in scale and size in
order to fit in the area and in the landscape and also to satisfy the expectations of the
166
consumers. Consequently we often think of rural tourism as small village house with
local architecture preserving the nature and culture located in sparsely populated areas
with much open space owned by local people or family. It is a niche market in which
customers expect pleasant, kind and worm atmosphere associated with personal guest
relations. Many times this experience could be supplemented with agriculture or other
outdoor activities: hunting, fishing, hiking etc.
Preconditioned form and size of the businesses together with the lack of funding and
insufficient financial resources are affecting the form of registration. Registration is
very rare among households that are starting a rural tourism business. In this study
65% of the respondents are preforming tourism as additional activity. This group of
respondents were involved in rural tourism as natural persons. According to the Low
on tourism they should have been registered in local government registry although
this was very rare situation.
The theory of entrepreneurship emphasis that the success on the family businesses
depends on entrepreneurs ability to manage available resources. Success, seen as
personal economic and non-economic objectives of the entrepreneur, in rural tourism
is influenced by a number of factors. Scholars commonly divide these factors on
external and internal factors. Internal factors are related to the characteristics of the
entrepreneur as: experience, socioeconomic background, skills, knowledge,
personality, values and expectations and characteristics of the business as: sector,
labor, financial base, strategies. External factors are related to business infrastructure
as: competitors, suppliers, banks, government, support and business customers as:
consumers, demographic, lifestyle, purchase behavior. In this study the theory of
entrepreneurship and tourism was confirmed through conducting qualitative analysis
and life stories interviews with rural tourism entrepreneurs in Republic of Macedonia.
The qualitative analysis was used to strengthen the theoretical knowledge with its
regional, local and individual factors affecting entrepreneurs in rural tourism. It
confirmed that influential factors are internal and external. Internal factors that were
identified by the qualitative analysis are structured in personality characteristics of
the entrepreneur as: need for achievement, self-efficacy, need for dominance and
locus of control and human capital as: education and experience. Identified external
factors were social capital linked to the place and to the people as: community
bounds, family bonds and support and local networking and business environment
167
identified through: financial institutions, infrastructure, destination marketing,
business risk, innovation and subsidies.
The analysis of life story interviews with the entrepreneurs in rural tourism revealed
whole range of factors that affect in some way the decision-making and consequently
the success of the enterprise. The interviews revealed that without exceptions all
entrepreneurs felt connection to the nature, local community, territory in their words
…..“I am born in the house where the gest house is located and I feel emotional
biding to this house” …. ―My first memories are from this mountains” ……”I have
always felt strong connection with this place”. They were all strongly committed
to stay and make families in “their places” although they all lived some period in
life far from these places ….”I was economic emigrant in Germany for 10 years”….”
Long period I had lived in the capital – Skopje where I finished my studies”.
Interviewed entrepreneurs, although some of them not completely aware, felt
that they are small part of the local community. Without exception they were not
“pushed” into rural tourism, which is characteristic for low per capita income
economies but contrary they were “puled” by the opportunity.
Important characteristic of the interviewed entrepreneurs was that they all had
previous business experience, personal or as a part of the family business, but
with wary small experience in tourism and leisure business. This was similar
evident in the qualitative research.
Striking was the fact that all interviewed entrepreneurs had finished high
educated which was supported as obvious characteristic in the qualitative
research with 52.6% of the respondents having university education. It was
obvious and expected that entrepreneurs with economic education felt necessity
of strategies and plans for their businesses and had more customer oriented
behaviour opposite to the ones without economic education.
All businesses were family business; engaging family members in the business
and depending on the size very rarely employing other persons. All interviewed
entrepreneurs felt commitment to the family … “something that brings happiness
to me is the willingness of my two daughters to help me in the business”…
168
Innovation for the entrepreneurs, although important part of entrepreneurship
theory, was mixed with the traditions and customs. Most of them didn’t see
opportunity in innovation.
Life story interviews have revealed as expected from the literature review and
three needs theory that all entrepreneurs share some common personal
characteristics. Most obviously expressed were the need for achievement and the
need for power although the need for affiliation was also present in the
entrepreneurs personality. Self-efficacy played extremely important role in the
entrepreneurs’ personality.
All factors that emerged from the literature review and qualitative research were
summarised in four factors that are most influential in the success of entrepreneurs in
rural tourism: the personality of entrepreneurs and human capital as internal factors
and social capital and business environment as external factors.
Appearance of rural tourism is closely linked to the territory and certain basic
conditions necessary for tourism development. As presented in the quantitative
research the distribution of the population of rural entrepreneurs is unequal
throughout the country‘s territory. Most represented region was Pelagonia region with
45.4% participants followed by Eastern region with 20.4% of the participants as a
result of long continuous development of rural tourism in some places as: Krusevo,
Prespa and Berovo.
According to the registration form 60.5% participants were natural persons 1.3% were
sole proprietors, 38.2% were registered as enterprises. In addition 65% of the
respondents were preforming rural tourism as additional activity with almost 50% of
the participants ranging from 1 to 10 beds and 65% of the participants operating with
1-5 rooms. Most certainly by this data it is clear that most of the rural tourism
business are very small in size and hardly undependable activity which contribute to
the theory that rural tourism in most likely to be economic activity created by
diversification of rural economy undertaken by all age and gender categories with
almost even distribution between categories.
In the analysis of the factors and indicators forming the factors most interesting facts
were that respondents didn‘t find that previous working experience in tourism is
169
necessary for success of rural tourism business and education has 0.1 significance
level opposite to the previous life experience with 0.01 significance level. Another
important consideration opposite to the expectations was that in the development of
the business environment respondents find that innovation and subsidies have non-
significant level.
Most useful and simplest presentation of the importance of the factors and moreover
the indicators in the measurement model and their performance on entrepreneurial
success is the Importance-Performance Matrix Analysis (section 6.2.2.6). The highest
importance for success of entrepreneurs is the social capital build on the (1) place -
commitment to stay in the place of their business incorporated with the nature as they
identify that the surrounding nature is part of their business and (2) people -
community bound, family support and networking. The importance of the personality
was also high in the success of the rural tourism businesses. Therefore the personality
of the entrepreneur played critical role in the success of the enterprise. Human capital
on the other hand didn‘t have direct importance on the success however was very
important in the creation of personality and thereby indict in more complex way
affecting the success. Business environment indicated by the respondents had lowest
importance in the success of the rural tourism enterprises.
170
7. CONCLUSIONS 7.1. Main findings
The study was set out to explore the concept of rural tourism as diversified rural
economic activity in Republic of Macedonia, to identify the entrepreneurs behind
rural tourism, reasons and motivation for their involvement in rural tourism and most
of all identify factors that are influencing their success and measure the importance
and performance of identified factors. The study has also sought to know if there are
interactions between identified influential success factors, extend of their influence on
success and the existence of substantially different groups of entrepreneur on bases of
influential factors. The theoretical literature on entrepreneurship and rural tourism
related to Republic of Macedonia is unsatisfying in some fundamental questions that
this study required to answer:
7. Is rural tourism recognized and supported by the existing policies in RM?
8. What is the position of entrepreneur in the development of rural tourism?
9. What are the crucial factors that are influencing rural tourism entrepreneur
success?
10. To what extend they are influencing the success?
11. Are there interactions between the influential factors?
12. Are there any groups that are substantially different based on success factors?
The main empirical findings are stated in different sections of chapter 6 this chapter
will only combine and wrap the empirical findings in order to answer the research
questions.
1. Is rural tourism recognized and supported by the existing policies in RM?
a. Extended literature review indicates that rural tourism is well
established and recognized as existing economic activity in rural areas
in RM. It contribution to the local economy as diversified economic
activity in recent years is well known and recognized by policy makers
which is evident in the appropriate laws and national programs.
2. What is the position of entrepreneur in the development of rural tourism?
a. Rural tourism is based on small family business entrepreneurs that are
the milestones of the activity. Almost without exclusion these
businesses are created on the individual capabilities of the
entrepreneurs and the development of the sector is based on this
171
individuals. Therefore, entrepreneurs with their abilities and
willingness to identify the opportunity, take the risk and invest in rural
tourism are in the core of the development.
3. What are the crucial factors that are influencing rural tourism entrepreneur
success?
a. Internal factors that were identified by the qualitative analysis
structured as personality characteristics of the entrepreneur are: need
for achievement, self-efficacy, need for dominance and locus of
control and human capital as: education and experience in form of
previous life experience and previous work experience.
b. External factors that were identified by the qualitative analysis
structured as social capital presented as links to the place and to the
people as: community bounds, family support and local networking
and business environment identified as: financial institutions,
infrastructure, destination marketing, business risk, innovation and
subsidies.
4. To what extend they are influencing the success?
a. Personality characteristics, social capital, human capital and business
environment have positive effect on the success of rural tourism
entrepreneurs although human capital does not show direct positive
effect but indirect effect that is mediated by personality. Social capital
on the other hand not only that has strong direct effect on the success
but also has indirect effect that shapes it as most important factor with
best performance in the model.
5. Are there interactions between the influential factors?
a. Empirical findings are implying that business environment, as
influential success factor does not interact with other factors. In
contrast social and human capital are positively mediated by the
personality factor.
b. Social and human capital opposite to the theory findings empirically
doesn‘t show continuous interaction effect on the success or on other
factors in the model.
6. Are there any groups that are substantially different based on success factors?
172
a. The empirical findings indicate that the path model has some
substantial differences between the groups that were analyzed. First,
considering the gender, the female entrepreneurs consider that human
capital has significant positive effect on success and social capital
opposite to the human capital doesn‘t whereas the male entrepreneurs
indicated strong positive effect of social capital on success and no
direct effect of the human capital. Second, in education groups, there
were differences in the path coefficient between the low and high
education groups. The low education group considered that human
capital has significant direct effect on success opposite to the high
education group. Lastly, in registration form groups, indicating that the
groups are exceedingly different. The group of natural persons
revealed that business environment has strong positive correlation to
the success compared to the group of legal entities. Whereas the
second group, legal entities, revealed that for them human capital has
more solid positive effect on personality and also social capital has
stronger positive effect on business environment compared to the first
group.
The theory of entrepreneurship and rural tourism in case of Republic of Macedonia
needs to be reevaluated in order to strengthen the role of entrepreneur in the
development of rural tourism and incorporate the factors that are prevalent for
entrepreneurial success.
173
7.2. Policy implications
Unified conceptual approach to the development of rural tourism has a need
for unification of the legislation and its full compliance within the national
legislation.
Implementation of one unique register for registration of all premises for rural
tourism accommodation that will contain all necessary data for evaluation of
policies and further research.
Encouragement of joint tourism offer and marketing of destinations and their
presentation of the major tourism fairs to increase the demand for rural
tourism what will substantially increase the supply in quality and quantity.
Increased support of the social capital in form of creation of rural tourism
entrepreneur regional and national networks as well as inducement of
membership in international networks as EUROGITES membership.
Support to the communities in identification and protection of natural
resources and local cultural heritage.
Establishment of LAG‘s as best practice in creation of bottom up policies
Encouraging the financial institutions in development of new more targeted
products for rural tourism businesses
Extensive investment in local infrastructure as investment in transport, energy,
water, communications, as well as social, cultural, sport and recreational
infrastructure.
Subsidies are not necessity and they will not influence the success of the
businesses in rural tourism
174
8. REFERENCES
Abadjieva, L. (2008). Poverty and social exclusion in rural areas.
Ačevska, B. (2002). Entrepreneurship under difficult circumstances: factors hindering
SME growth in the Republic of Macedonia. South-East Europe Review for
Labour and Social Affairs, 1, 109–122.
Acharya, V., Rajan, A., & Schoar, A. (2006). What Determines Entrepreneurial
Success ? — A Psychometric Study Of Rural Entrepreneurs In India. Journal of
Asia Entrepreneurship & Sustainability, 3(1), 2–18.
Acs, Z. J., & Audretsch, D. B. (2010). Handbook of Entrepreneurship Research.
International Business, 5, 703. doi:10.1007/978-1-4419-1191-9
Acs, Z. J., Desai, S., & Hessels, J. (2008). Entrepreneurship, economic development
and institutions. Small Business Economics, 31(3), 219–234.
doi:10.1007/s11187-008-9135-9
Acs, Z. J., & Szerb, L. (2007). Entrepreneurship, economic growth and public policy.
Small Business Economics, 28(2), 109–122. doi:10.1007/s11187-006-9012-3
Ács, Z. J., & Szerb, L. (2007). The Global Entrepreneurship Index (GEINDEX).
Foundations and Trends® in Entrepreneurship.
Ahlert, G. (2007). Methodological aspects of preparing the German TSA, empirical
findings and initial reactions. Tourism Economics.
Alexe, I., Horváth, I., Noica, R., & Radu, M. (2012). Social Impact of Emigration and
Rural-Urban Migration in Central and Eastern Europe Final Country Report
Romania.
Anderson, A., & Law, L. (2012). An advanced framework for food trail performance.
Journal of Vacation Marketing, 18(4), 275–286.
doi:10.1177/1356766712451075
Anderson, E. (1990). Two firms, one frontier: On assessing joint venture
performance. Sloan Management Review, 31(2), 19–30. doi:Article
Andrew, B. P. (1997). Tourism and the economic development of Cornwall. Annals of
Tourism Research, 24(3), 721–735. doi:10.1016/S0160-7383(97)00026-1
Archer, B. H. (1982). The value of multipliers and their policy implications. Tourism
Management, 3(4), 236–241. doi:10.1016/0261-5177(82)90044-9
Ateljevic, I., & Doorne, S. (2000). ―Staying Within the Fence‖: Lifestyle
Entrepreneurship in Tourism. Journal of Sustainable Tourism.
doi:10.1080/09669580008667374
175
Ateljevic, J., & Page, S. J. (2009). Tourism and Entrepreneurship: International
Perspectives. Tourism Management (Vol. 32, p. 480). Elsevier Ltd.
doi:10.1016/j.tourman.2010.06.007
Athayde, R. (2009). Measuring enterprise potential in young people.
Entrepreneurship Theory and Practice, 33(2), 481–500.
Audretsch. (2009). The Entrepreneurial Society. The Journal of Technology Transfer,
34(3), 99–120. doi:10.1007/978-3-319-00095-4_3
Augustyn, M. M., & Knowles, T. (2000). Performance of tourism partnerships: a
focus on York. Tourism Management, 21(4), 341–351. doi:10.1016/S0261-
5177(99)00068-0
BAAT. (n.d.). What is Alternative Tourism - Bulgarian Association for Alternative
Tourism. Retrieved September 13, 2014, from
http://www.baatbg.org/definitions/17/27/
Baláž, V., & Kusá, Z. (2012). Social Impact of Emigration and Rural-Urban
Migration in Central and Eastern Europe Final Country Report Slovakia.
Bandura, A. (1977). Self-efficacy: toward a unifying theory of behavioral change.
Psychological Review, 84(2), 191.
Bandura, A. (1986). Social foundations of thought and action : a social cognitive
theory / Albert Bandura. Englewood Cliffs, N.J: Prentice-Hall, 1986. xiii, 617
pp. (pp. 2–xiii, 617).
Barkham, R., Gudgin, G., & Hart, M. (2012). The Determinants of Small Firm
Growth: an inter-regional study in the United Kingdom 1986-90. Routledge.
Barton, H. A. (2007). The Discovery of Norway Abroad, 1760-1905. Scandinavian
Studies, 25–40.
Baruch, Y., & Holtom, B. C. (2008). Survey response rate levels and trends in
organizational research. Human Relations, 61(8), 1139–1160.
Bates, T. (1995). A comparison of franchise and independent small business survival
rates. Small Business Economics, 7(5), 377–388.
Baum, S. (2011). The Tourist Potential of Rural Areas in Poland. Eastern European
Countryside, 17(-1), 107–135. doi:10.2478/v10130-011-0006-z
Beard, N., & Swinbank, A. (2001). Decoupled payments to facilitate CAP reform.
Food Policy, 26(2), 121–145. doi:10.1016/S0306-9192(00)00041-5
Beaver, G. (2002). Small business, entrepreneurship and enterprise development.
Pearson Education.
176
Becker, C. (2008). Thoreau‘s economic philosophy. The European Journal of the
History of Economic Thought, 15(2), 211–246.
doi:10.1080/09672560802037573
Begley, T. M., & Boyd, D. P. (1987). Psychological characteristics associated with
performence in entrepreneurial firms and smaller businesses. Journal of Business
Venturing, 2(1), 79–93. doi:10.1016/0883-9026(87)90020-6
Berchicci, L., & Tucci, C. (2008). Entrepreneurship, Technology and Schumpeterian
Innovation: Entrants and Incumbents. In The Oxford Handbook of
Entrepreneurship (pp. 332–350).
Bessant, J., & Tidd, J. (2011). Innovation and Entrepreneurship. Innovation (Vol. 31,
p. 2002).
Blanchflower, D. G. (2000). Self-employment in OECD countries. Labour
Economics, 7(5), 471–505. doi:10.1016/S0927-5371(00)00011-7
Blanchflower, D. G. (2004). Self-Employment: More may not be better.
Bland, J. M., & Altman, D. G. (1997). Statistics notes: Cronbach‘s alpha. Bmj,
314(7080), 572.
Bleaney, M., & Nishiyama, A. (2002). Explaining growth: A contest between models.
Journal of Economic Growth, 7(1), 43–56.
Blumberg, B. F., & Pfann, G. A. (2001). Social capital and the uncertainty reduction
of self-employment. IZA Discussion paper series.
Bogdanov, G., & Rangelova, R. (2012). Social Impact of Emigration and Rural-
Urban Migration in Central and Eastern Europe Final Country Report Bulgaria.
Bojnec, S. (2012). Agricultural and rural capital markets in Turkey, Croatia and the
FYR of macedonia. Agricultural Economics (Czech Republic), 58(11), 533–541.
Bolton, J. E. (1972). Small firms: Report of the committee of inquiry on small firms.
HM Stationery Office.
Bornarova, S., & Janeska, V. (2012). Social Impact of Emigration and Rural-Urban
Migration in Central and Eastern Europe Final Country Report The Former
Yugoslav Republic of Macedonia (p. 49).
Bosma, N., Acs, Z. J., Autio, E., Coduras, A., & Levie, J. (2008). Global
Entrepreneurship Monitor 2008 Executive Report.
Bosma, N., Hessels, J., Schutjens, V., Praag, M. Van, & Verheul, I. (2012).
Entrepreneurship and role models. Journal of Economic Psychology, 33(2), 410–
424. doi:10.1016/j.joep.2011.03.004
177
Bosma, N., Van Praag, M., Thurik, R., & De Wit, G. (2004). The value of human and
social capital investments for the business performance of startups. Small
Business Economics, 23(3), 227–236.
Boynton, A. C., & Zmud, R. W. (1984). An assessment of critical success factors.
Sloan Management Review, 25(4), 17–27.
Bradley, D., Dwyer, J., & Hill, B. (2010). The Evaluation of Rural Development
Policy in the EU L‘evaluation de la politique de developpement rural dans
l‘Union europeenne Die Evaluation der Politik zur Entwicklung des ländlichen
Raums in der EU. EuroChoices, 9(1), 15–20. doi:10.1111/j.1746-
692X.2010.00148.x
Brandstätter, H. (1997). Becoming an entrepreneur — A question of personality
structure? Journal of Economic Psychology, 18(2-3), 157–177.
doi:10.1016/S0167-4870(97)00003-2
Brandstätter, H. (2011). Personality aspects of entrepreneurship: A look at five meta-
analyses. Personality and Individual Differences, 51(3), 222–230.
doi:10.1016/j.paid.2010.07.007
Brockhaus, R. (1994). Entrepreneurship and Family Business Research: Comparisons
, Critique , and Lessons. Entrepreneurship Theory and …, 25–39.
Brüderl, J., & Preisendörfer, P. (1998). Network support and the success of newly
founded business. Small Business Economics, 10(3), 213–225.
Buchel, B., & Büchel, B. (2000). Framework of Joint Venture Development: Theory-
Building Through Qualitative Research. Journal of Management Studies, 37(5),
637–661. doi:10.1111/1467-6486.00197
Bull, I., & Willard, G. E. (1993). Towards a theory of entrepreneurship. Journal of
Business Venturing. doi:10.1016/0883-9026(93)90026-2
Bureau, J.-C., & Matthews, A. (2005). EU Agricultural Policy: What Developing
Countries Need to Know.
Bygrave, W. D., & Hofer, C. W. (1991). Theorizing about Entrepreneurship.
Entrepreneurship: Theory & Practice, 16, 13–22. doi:Article
Cánoves, G., Villarino, M., Priestley, G. K., & Blanco, A. (2004). Rural tourism in
Spain: an analysis of recent evolution. Geoforum, 35(6), 755–769.
Carree, M., & Thurik, A. R. (2010). The Impact of Entrepreneurship on Economic
Growth. Handbook of Entrepreneurship Research SE - 20, 5, 557–594.
doi:10.1007/978-1-4419-1191-9_20
Castiglione, D., Deth, J. W. van, & Wolleb, G. (2008). The handbook of social
capital. Oxford University Press.
178
Chawla, S. K., Khanna, D., & Chen, J. (2010). Are Small Business Critical Success
Factors Same in Different Countries ? SIES Journal of Management, 7(August),
1–12.
Chawla, S. K., Pullig, C., & Alexander, F. D. (1997). Critical success factors from an
organizational life cycle perspective: Perceptions of small business owners from
different business environments. Journal of Business and Entrepreneurship,
9(1), 47.
Clark, G., & Chabrel, M. (2007). Special Issue: Rural tourism in Europe. Tourism
Geographies: An International Journal of Tourism Space, Place and
Environment, 9(4), 345–346. doi:10.1080/14616680701685121
Cobas, J. A., Waldinger, R., Aldrich, H., & Ward, R. (1991). Ethnic Entrepreneurs:
Immigrant Business in Industrial Societies. Contemporary Sociology.
doi:10.2307/2072935
Cohen, J. (1992). A power primer. Psychological Bulletin, 112(1), 155.
Coleman, J. S. (1988). Social Capital in the Creation of Human Capital. American
Journal of Sociology.
Coleman, J. S., & Coleman, J. S. (1994). Foundations of social theory. Harvard
University Press.
Cooper, C. (1988). Tourism and economic development: Western European
experiences. Tourism Management, 9(4), 345–346. doi:10.1016/0261-
5177(88)90012-X
Cope, J., Jack, S., & Rose, M. B. (2007). Social Capital and Entrepreneurship An
Introduction. International Small Business Journal, 25(3), 213–219.
Cormack, B. (1998). A history of holidays, 1812-1990 (Vol. 4).
Routledge/Thoemmes.
Cortina, J. M. (1993). What is coefficient alpha? An examination of theory and
applications. Journal of Applied Psychology, 78(1), 98.
Cronbach, L. J. (1951). Coefficient alpha and the internal structure of tests.
Psychometrika, 16(3), 297–334.
Cunningham, J. B., & Lischeron, J. (1991). Defining Entrepreneurship. Journal of
Small Business Management, 29(1), 45–61. doi:10.1504/IJESB.2007.014395
Curran, J., & Blackburn, R. (2000). Researching the small enterprise. Sage.
Curran, J., Stanworth, J., & Watkins, D. (1986). The survival of the small firm.
179
Darbellay, F., & Stock, M. (2012). Tourism as complex interdisciplinary research
object. Annals of Tourism Research, 39(1), 441–458.
doi:10.1016/j.annals.2011.07.002
Daugbjerg, C. (2009). Sequencing in public policy: the evolution of the CAP over a
decade. Journal of European Public Policy, 16(3), 395–411.
doi:10.1080/13501760802662698
Daugbjerg, C., & Swinbank, A. (2011). Explaining the ―Health Check‖ of the
Common Agricultural Policy: budgetary politics, globalisation and paradigm
change revisited. Policy Studies, 32(2), 127–141.
doi:10.1080/01442872.2010.541768
Davidsson, P., & Honig, B. (2003). The role of social and human capital among
nascent entrepreneurs. Journal of Business Venturing, 18(3), 301–331.
Davison, A. C. (1997). Bootstrap methods and their application (Vol. 1). Cambridge
university press.
Davison, A. C., & Hinkley, D. V. (1997). Bootstrap Methods and their Applications,
Cambridge Series in Statistical and Probabilistic Mathematics. Cambridge
University Press Cambridge.
De Vaus, D. A. (2002). Surveys in social research. Psychology Press.
Deakins, D., & Freel, M. S. (2005). Entrepreneurship and small firms. McGraw-Hill
Hemel Hempstead,, UK.
Di Giovine, M. A. (2013). The sage handbook of tourism studies and the construction
of a unified field of tourism research. Tourism, 61(3), 317–323.
Dillman, D. A. (1978). Mail and telephone surveys (Vol. 3). Wiley Interscience.
Dillman, D. A., Phelps, G., Tortora, R., Swift, K., Kohrell, J., Berck, J., & Messer, B.
L. (2009). Response rate and measurement differences in mixed-mode surveys
using mail, telephone, interactive voice response (IVR) and the Internet. Social
Science Research, 38(1), 1–18.
Dimitrievski, D., Georgiev, N., Simonovska, A., Martinovska Stojceska, A., &
Kotevska, A. (2010). Review of agriculture and agricultural policy in FYR
Macedonia. Proceeding: Studies on the Agricultural and Food Sector in Central
and Eastern Europe, Agriculture in the Western Balkan Countries. Halle (Salle),
IAMO.
Dimitrov, N., & Josheski, D. (2012). Основни социо-економски параметри за
унапредување на туризмот во општина Дојран.
Dimitrov, N., & Petrevska, B. (2012). Rural tourism development zones: the case of
Macedonia. Researches Review of the Department of Geography, Tourism and
Hotel Management, (41), 152–162.
180
Dinda, S. (2008). Social capital in the creation of human capital and economic
growth: A productive consumption approach. Journal of Socio-Economics,
37(5), 2020–2033.
Drbohlav, D., & Rákoczyová, M. (2012). Social Impact of Emigration and Rural-
Urban Migration in Central and Eastern Europe Executive Summary Czech
Republic.
Drucker, P. F. (1964). The Big Power of Little Ideas. Harvard Business Review, 42,
6–182.
Dwyer, L., Forsyth, P., & Spurr, R. (2004). Evaluating tourism‘s economic effects:
new and old approaches. Tourism Management, 25(3), 307–317.
doi:10.1016/S0261-5177(03)00131-6
Dwyer, L., Forsyth, P., & Spurr, R. (2007). Contrasting the uses of TSAs and CGE
models: Measuring tourism yield and productivity. Tourism Economics, 13(4),
537–551.
Dwyer, L., Forsyth, P., Spurr, R., & Van Ho, T. (2007). Tourism‘s economic
contribution versus economic impact assessment: Differing roles for satellite
accounts and economic modelling. In Tourism Management: Analysis,
Behaviour and Strategy (pp. 459–469). CABI Publishing.
Dwyer, L., & Kim, C. (2003). Destination competitiveness: Determinants and
indicators. Current Issues in Tourism, 6(5), 369–414.
Eckhardt, J. T., & Shane, S. A. (2003). Opportunities and entrepreneurship. Journal of
Management. doi:10.1016/S0149-2063(02)00225-8
ECORYS. (2009). Study on the Competitiveness of the EU tourism industry.
Efron, B., & Tibshirani, R. (1986). Bootstrap methods for standard errors, confidence
intervals, and other measures of statistical accuracy. Statistical Science, 54–75.
Efron, B., & Tibshirani, R. J. (1994). An introduction to the bootstrap (Vol. 57). CRC
press.
Eliasson, Å., Jones, R. J. A., Nachtergaele, F., Rossiter, D. G., Terres, J.-M., Van
Orshoven, J., … Le Bas, C. (2010). Common criteria for the redefinition of
Intermediate Less Favoured Areas in the European Union. Environmental
Science & Policy, 13(8), 766–777. doi:10.1016/j.envsci.2010.08.003
Eligh, J., Welford, R., & Ytterhus, B. (2002). The production of sustainable tourism:
concepts and examples from Norway. Sustainable Development, 10(4), 223–234.
doi:10.1002/sd.195
English Tourism Council, L. (United K. (2001). Working for the countryside A
strategy for rural tourism in England, 2001-2005.
181
ENRD TWG 1. (2010a). Annex 4-Targeting territorial specificities and needs in
Rural Development Programmes Final Report.
ENRD TWG 1. (2010b). Targeting territorial specificities and needs in Rural
Development Programmes Final Report.
Esposito Vinzi, V., Chin, W. W., Henseler, J., & Wang, H. (2010). Handbook of
partial least squares: Concepts, methods and applications.
European Commission. (2001). Working together for the future of European tourism
COM(2001) 665 final.
European Commission. (2003). Basic orientations for the sustainability of European
tourism COM(2003) 716 final.
European Commission. (2006a). A renewed EU Tourism Policy: Towards a stronger
partnership for European Tourism COM(2006) 134 final.
European Commission. (2006b). The EU Rural Development Policy 2007-2013.
European Commission. (2007). Agenda for a sustainable and competitive European
tourism COM(2007) 621 final. OPOCE.
European Commission. (2008a). Poverty and social exclusion in rural areas (pp. 1–
187).
European Commission. (2008b). Synthesis of Ex Ante Evaluations of Rural
Development Programmes 2007-2013 Final Report.
European Commission. (2009). Overview of Family business relevant issues:
research, networks, policy measures and existing studies. European Commission
Directorate-General for Enterprise and Industry.
European Commission. (2010). Europe, the world’s No 1 tourist destination – a new
political framework for tourism in Europe COM(2010) 352 final.
European Commission. (2013a). Rural Development in the EU Statistical and
Economic Information Report 2013.
European Commission. (2013b). The Common Agricultural Policy A partnership
between Europe and Farmers.
European Commission. (2013c). Tourism Satellite Accounts (TSAs) in Europe.
doi:http://bookshop.europa.eu
European Council. (2004). Joint report by the Commission and the Council on social
inclusion (Vol. 1).
European Union. (2013). Eurostat regional yearbook 2013.
182
Fagerberg, J., Mowery, D. C., & Nelson, R. R. (2006). The Oxford Handbook of
Innovation. The Oxford Handbook of Innovation (Vol. 1, pp. 2009 – 2011).
doi:10.1093/oxfordhb/9780199286805.001.0001
Fairlie, R. W., & Robb, A. (2007). Families, human capital, and small business:
Evidence from the characteristics of business owners survey. Industrial and
Labor Relations Review, 225–245.
FAO, F. A. O. (2012). Statistical Yearbook 2013: World Food and Agriculture. FAO
(Food and Agriculture Organziation of the United Nations), Rome.
Field, J. (2003). Social Capital.
Fletcher, D., Huggins, R., & Koh, L. (2008). Institutional entrepreneurship in the
emerging regional economies of the western Balkans. Entrepreneurship in
Emerging Regions around the World: Theory, Evidence and Implications, 125–
152.
Foddy, W., & Foddy, W. H. (1994). Constructing questions for interviews and
questionnaires: theory and practice in social research. Cambridge university
press.
Frechtling, D. C. (1999). The tourism satellite account: foundations, progress and
issues. Tourism Management, 20(1), 163–170. doi:10.1016/S0261-
5177(98)00103-4
Frechtling, D. C. (2010). The Tourism Satellit Account. A Primer. Annals of Tourism
Research, 37(1), 136–153.
Gadenne, D. (1998). Critical Success Factors for Small Business: An Inter-industry
Comparison. International Small Business Journal, 17(1), 36–56.
doi:10.1177/0266242698171002
Gedajlovic, E., Honig, B., Moore, C. B., Payne, G. T., & Wright, M. (2013). Social
Capital and Entrepreneurship: A Schema and Research Agenda.
Entrepreneurship: Theory and Practice, 37(3), 455–478.
Gedeon, S. (2010). What is Entrepreneurship ? Entrepreneurial Practice Review, 1(3),
16–35.
Geisser, S. (1974). A predictive approach to the random effect model. Biometrika,
61(1), 101–107.
George, E. W., Mair, H., & Reid, D. G. (2009). Rural tourism development: Localism
and cultural change. Channel View Publications Bristol.
Gersick, K. E., Davis, J. A., Hampton, M. M., & Lansberg, I. (1997). Generation to
Generation: Life Cycles of the Family Business. Harvard Business School Press
Boston MA (p. 302). doi:10.5860/CHOICE.34-4568
183
Getz, D., & Brown, G. (2006). Critical success factors for wine tourism regions: a
demand analysis. Tourism Management, 27(1), 146–158.
doi:10.1016/j.tourman.2004.08.002
Getz, D., & Carlsen, J. (2005). Family business in tourism. Annals of Tourism
Research, 32(1), 237–258. doi:10.1016/j.annals.2004.07.006
Getz, D., Carlsen, J., & Morrison, A. (2004). The Family Business in Tourism and
Hospitality. (D. Getz, J. Carlsen, & A. Morrison, Eds.) (p. 209). Wallingford:
Cabi. doi:10.1079/9780851998084.0000
Gliem, J. A., & Gliem, R. R. (2003). Calculating, interpreting, and reporting
Cronbach‘s alpha reliability coefficient for Likert-type scales. Midwest
Research-to-Practice Conference in Adult, Continuing, and Community
Education.
Godin, K., Clemens, J., & Veldhuis, N. (2008). Measuring Entrepreneurship:
Conceptual Frameworks and Empirical Indicators, (7).
Gollin, D. (2008). Nobody‘s business but my own: Self-employment and small
enterprise in economic development. Journal of Monetary Economics, 55(2),
219–233.
Gramm, D., & Tappeiner, G. (2009). Südtirol - Von der Agrarregion zur
Wohlstandsinsel. Geographische Rundschau, 61(3), 4–9.
Grečić, V., & Kaludjerović, J. (2012). Social Impact of Emigration and Rural-Urban
Migration in Central and Eastern Europe Final Country Report Montenegro.
Greenbank, P. (2001). Objective setting in the micro-business. International Journal
of Entrepreneurial Behaviour & Research, 7(3), 108–127.
Gretzel, U., Jamal, T., Stronza, A., & Nepal, S. K. (2009). Teaching International
Tourism: An Interdisciplinary, Field-based Course. Journal of Teaching in
Travel & Tourism, 8(2-3), 261–282. doi:10.1080/15313220802714562
Greve, A., & Salaff, J. W. (2003). Social networks and entrepreneurship.
Entrepreneurship Theory and Practice, 28(1), 1–22.
Hair, J. F., Ringle, C. M., & Sarstedt, M. (2011). PLS-SEM: Indeed a silver bullet.
The Journal of Marketing Theory and Practice, 19(2), 139–152.
Hair Jr, J. F., Hult, G. T. M., Ringle, C., & Sarstedt, M. (2013). A primer on partial
least squares structural equation modeling (PLS-SEM). SAGE Publications,
Incorporated.
Hall, C. M., Sharples, L., Cambourne, B., & Macionis, N. (2009). Wine tourism
around the world. Routledge.
184
Hall, D. R., & Kirkpatrick, I. (2005). Rural tourism and sustainable business (Vol.
26). Channel View Publications.
Hall, D., Smith, M., & Marciszewska, B. (2006). Tourism in the New Europe (p. 336).
Hammer, T., & Siegrist, D. (2008). Protected areas in the Alps - The success factors
of nature-based tourism and the challenge for regional policy. In GAIA (Vol. 17,
pp. 152–160).
Hanifan, L. J. (1916). The rural school community center. Annals of the American
Academy of Political and Social Science, 67, 130–138.
Hartog, J., & van den Brink, H. M. (2007). Human Capital. Cambridge University
Press.
Hatten, T. S. (2011). Small business management: entrepreneurship and beyond.
Cengage Learning.
Haynes, J. Making a virtue of idleness? A critical look at the MacSharry reforms. , 13
ECOS: a Review of Conservation 3–14 (1992).
Haynes, S. N., Richard, D., & Kubany, E. S. (1995). Content validity in psychological
assessment: A functional approach to concepts and methods. Psychological
Assessment, 7(3), 238.
Headd, B. (2003). Redefining business success: Distinguishing between closure and
failure. Small Business Economics, 21(1), 51–61.
Henderson, B. J. (2002). Building the Rural Economy With High-Growth
Entrepreneurs. Review Literature And Arts Of The Americas, 87(3), 45–70.
Hienerth, C., & Kessler, A. (2006). Measuring success in family businesses: The
concept of configurational fit. Family Business Review, 19(2), 115–134.
Hjalager, A.-M. (1996). Agricultural diversification into tourism. Tourism
Management, 17(2), 103–111. doi:10.1016/0261-5177(95)00113-1
Hodgetts, R. M., & Kuratko, D. F. (1998). Effective small business management.
Dryden Press Fort Worth.
Holzner, M. (2011). Tourism and economic development: The beach disease?
Tourism Management, 32(4), 922–933. doi:10.1016/j.tourman.2010.08.007
Horng, J.-S., & Tsai, C.-T. S. (2012). Culinary tourism strategic development: an
Asia-Pacific perspective. International Journal of Tourism Research, 14(1), 40–
55. doi:10.1002/jtr.834
Hudson, S., & Gilbert, D. (2006). The Internet and Small Hospitality Businesses:
B&B Marketing in Canada. Journal of Hospitality & Leisure Marketing, 14(1),
99–116. doi:10.1300/J150v14n01_06
185
Hughes, M., & Carlsen, J. (2010). The business of cultural heritage tourism: critical
success factors. Journal of Heritage Tourism, 5(1), 17–32.
doi:10.1080/17438730903469805
Hummelbrunner, R., & Miglbauer, E. (1994). Tourism promotion and potential in
peripheral areas: The Austrian case. Journal of Sustainable Tourism, 2(1-2), 41–
50.
Hundstad, D. (2011). A ―Norwegian Riviera‖ in the making: the development of
coastal tourism and recreation in southern Norway in the interwar period.
Journal of Tourism History, 3(2), 109–128.
Jakimovski, J. (2002). Rural Development : Does Macedonia Need a New Approach.
In Exploring Diversity in the European Agri-Food System (pp. 28–31). European
Association of Agricultural Economists.
Janeska, V., & Bojnec, Š. (2011). Rural Labour Market Developments in the Former
Yugoslav Republic of Macedonia (Vol. 32, p. 18).
Jaworski, A., & Pritchard, A. (2005). Discourse, communication, and tourism (Vol.
5). Channel View Publications.
Jennings, P., & Beaver, G. (1997). The performance and competitive advantage of
small firms: a management perspective. International Small Business Journal,
15(2), 63–75.
Jones, C., & Munday, M. (2007). Exploring the Environmental Consequences of
Tourism: A Satellite Account Approach. Journal of Travel Research, 46(2),
164–172. doi:10.1177/0047287507299592
Jones, O., Macpherson, A., & Thorpe, R. (2010). Learning in owner-managed small
firms: Mediating artefacts and strategic space. Entrepreneurship and Regional
Development, 22(7-8), 649–673.
Jöreskog, K. G., & Wold, H. O. A. (1982). Systems under indirect observation:
Causality, structure, prediction (Vol. 139). North Holland.
Kader, R. A., Mohd Rosli Bin, M., & Ab. Azid Hj. Che, I. (2009). Success Factors for
Small Rural Entrepreneurs under the One- District-One-Industry Programme in
Malaysia. Contemporary Management Research, 5(2), 147–162.
Kajanus, M., Kangas, J., & Kurttila, M. (2004). The use of value focused thinking and
the A‘WOT hybrid method in tourism management. Tourism Management,
25(4), 499–506. doi:10.1016/S0261-5177(03)00120-1
Keane, M. (1992). Rural tourism and rural development. Tourism and the
environment (pp. 43–55). Kluwer; Environment & Assessment, 2.
Keats, B. W., & Bracker, J. S. (1988). Toward a theory of small firm performance: a
conceptual model. American Journal of Small Business, 12(4), 41–58.
186
Keeley, B. (2007). OECD Insights Human Capital How what you know shapes your
life: How what you know shapes your life. OECD Publishing.
Kelmar, J. H. (1991). Measurement of Success and Failure in Small Business: A Two-
factor Approach. Curtin University of Technology.
Kim and Howard E. Aldrich, P. H. (2005). Social Capital and Entrepreneurship.
Foundations and TrendsTM
in Entrepreneurship. doi:10.1561/0300000002
Kim, H. J., Chen, M.-H., & Jang, S. ―Shawn.‖ (2006). Tourism expansion and
economic development: The case of Taiwan. Tourism Management, 27(5), 925–
933. doi:10.1016/j.tourman.2005.05.011
Kim, Y. H., & Kim, M. (2010). A New Approach for Assessment and Comparison of
Websites: Using the Modified Balanced Scorecard and Analytical Hierarchy
Process. Journal of Hospitality Marketing & Management, 19(6), 676–695.
doi:10.1080/19368623.2010.493089
Kistruck, G. M., Webb, J. W., Sutter, C. J., & Ireland, R. D. (2011). Microfranchising
in Base-of-the-Pyramid Markets: Institutional Challenges and Adaptations to the
Franchise Model. Entrepreneurship Theory and Practice, 35(3), 503–531.
doi:10.1111/j.1540-6520.2011.00446.x
Knight, F. (1921). Risk, Uncertainty, and Profit. Hart Schaffner Marx Prize Essays,
XXXI, 1–173.
Kontogeorgopoulos, N., Churyen, A., & Duangsaeng, V. (2014). Success Factors in
Community-Based Tourism in Thailand: The Role of Luck, External Support,
and Local Leadership. Tourism Planning & Development, 11(1), 106–124.
doi:10.1080/21568316.2013.852991
Kostadinov, T. (2012). The state of rural entrepreneurship in the Republic of
Macedonia. Macedonian Journal of Animal Science, 2(4), 419–424.
Kostadinova-Daskalovska, K., & Noshpalovska, K. (2000). Migrations in the
Republic of Macedonia and spatial distribution of the population in the 1990s.
Studi Emigrazione, (139), 557–580.
Kritikos, A. (2014). Entrepreneurs and their impact on jobs and economic growth.
IZA World of Labor, (May), 1–10. doi:10.15185/izawol.8
Kwon, S.-W., Heflin, C., & Ruef, M. (2013). Community Social Capital and
Entrepreneurship. American Sociological Review, 0003122413506440.
Lane, B. (1994). What is rural tourism? Journal of Sustainable Tourism, 2(1), 7–21.
doi:10.1080/09669589409510680
Larroulet, C., & Couyoumdjian, J. P. (2009). Entrepreneurship and Growth.
Independent Review, 14, 81–100. doi:10.1177/0266242612467359
187
Lawshe, C. H. (1975). A quantitative approach to content validity1. Personnel
Psychology, 28(4), 563–575.
Lee-Ross, D., & Lashley, C. (2010). Entrepreneurship and small business
management in the hospitality industry. Routledge.
Li, G., Wu, B., & Bai, G. (2012). Investigation on the Success of Peasant
Entrepreneurs. Physics Procedia, 25, 2282–2286.
doi:10.1016/j.phpro.2012.03.383
Libreros, M. (2006). Progress in Tourism Satellite Account Implementation and
Development. Journal of Travel Research, 45(1), 83–91.
doi:10.1177/0047287506289517
Lin, N., Cook, K. S., & Burt, R. S. (2001). Social capital: Theory and research.
Transaction Publishers.
Lohmöller, J.-B. (1989). Latent variable path modeling with partial least squares.
Physica-Verlag Heidelberg.
Long, W. (1983). The Meaning of Entrepreneurship. American Journal of Small
Business, 8, 47–56. doi:10.1007/s10842-009-0052-7
Lundberg, C., & Fredman, P. (2012). Success factors and constraints among nature-
based tourism entrepreneurs. Current Issues in Tourism, 15(September 2012),
649–671.
Lundström, A., & Stevenson, L. (2005). Entrepreneurship Policy: Theory and
Practice. Business (Vol. 9, p. 303). Kluwer Academic Publishers.
doi:10.1007/b104813
MAFWE. (2013). EU INSTRUMENT FOR PRE-ACCESSION FOR RURAL
DEVELOPMENT National Programme for Agriculture and Rural Development
2007-2013.
Malik, K. (2013). Human development report 2013. The rise of the South: Human
progress in a diverse world.
Marcketti, S. B. (2006). An Exploratory Study of Lifestyle Entrepreneurship and Its
Relationship to Life Quality. Family and Consumer Sciences Research Journal,
34(3), 241–259. doi:10.1177/1077727X05283632
Maye, D., Ilbery, B., & Watts, D. (2009). Farm diversification, tenancy and CAP
reform: Results from a survey of tenant farmers in England. Journal of Rural
Studies, 25(3), 333–342. doi:10.1016/j.jrurstud.2009.03.003
Mazanec, J. A., Wober, K., & Zins, A. H. (2007). Tourism Destination
Competitiveness: From Definition to Explanation? Journal of Travel Research,
46(1), 86–95. doi:10.1177/0047287507302389
188
McAreavey, R., & McDonagh, J. (2011). Sustainable Rural Tourism: Lessons for
Rural Development. Sociologia Ruralis, 51(2), 175–194. doi:10.1111/j.1467-
9523.2010.00529.x
McClelland, D. C. (1961). The Achieving Society. University of Illinois at
UrbanaChampaigns Academy for Entrepreneurial Leadership Historical
Research Reference in Entrepreneurship (p. 532). doi:10.2139/ssrn.1496181
McGehee, N. G. (2004). Motivation for Agri-Tourism Entrepreneurship. Journal of
Travel Research, 43(2), 161–170. doi:10.1177/0047287504268245
McGehee, N. G., Kim, K., & Jennings, G. R. (2007). Gender and motivation for agri-
tourism entrepreneurship. Tourism Management, 28(1), 280–289.
doi:10.1016/j.tourman.2005.12.022
Metodijeski, D. (2012). Туризмот во руралните средини.
Middleton, V. (2001). The importance of micro-businesses in European tourism.
Rural Tourism and Recreation: Principles to Practice, 197–201.
Mihalache, F. (2013). O analizǎ criticǎ asupra dezvoltǎrii agriculturii şi zonelor rurale,
pe baza PNDR 2007-2013. Calitatea Vietii, 2013(3), 277–294.
Mincer, J. (1958). Investment in human capital and personal income distribution. The
Journal of Political Economy, 281–302.
Morrison, A. (2000). Entrepreneurship: what triggers it? International Journal of
Entrepreneurial Behaviour & Research. doi:10.1108/13552550010335976
Morrison, A., Rimmington, M., & Williams, C. (1999). Entrepreneurship in the
Hospitality, Tourism and Leisure Industries. Elsevier Ltd.
Mosey, S., & Wright, M. (2007). From human capital to social capital: A longitudinal
study of technology‐based academic entrepreneurs. Entrepreneurship Theory
and Practice, 31(6), 909–935.
Moss, J., Binfield, J., Patton, M., Zhang, L., & Westhoff, P. (2008). Health Check:
Major Surgery or Cosmetic Procedures? Bilan de sante: Operation de grande
importance ou demarche cosmetique Der Gesundheitscheck: Größere Operation
oder kosmetischer Eingriff? EuroChoices, 7(3), 11–16. doi:10.1111/j.1746-
692X.2008.00105.x
Mutch, A. (1995). IT and small tourism enterprises: a case study of cottage-letting
agencies. Tourism Management, 16(7), 533–539.
Naude, W. (2009). Entrepreneurship, developing countries, and development
economics: New approaches and insights. Small Business Economics, 34(1), 1–
12.
189
Nedergaard, P. (2008). The reform of the 2003 Common Agricultural Policy: an
advocacy coalition explanation1. Policy Studies, 29(2), 179–195.
doi:10.1080/01442870802033464
Nunnally, J. C., & Bernstein, I. H. (1994). Psychometric Theory (3) McGraw-Hill.
New York.
Nybakk, E., & Hansen, E. (2008). Entrepreneurial attitude, innovation and
performance among Norwegian nature-based tourism enterprises. Forest Policy
and Economics, 10(7-8), 473–479. doi:10.1016/j.forpol.2008.04.004
OECD. (1994). TOURISM STRATEGIES AND RURAL DEVELOPMENT.
OECD. (2006). The New Rural Paradigm (p. 168). OECD Publishing.
doi:10.1787/9789264023918-en
OECD. (2014). OECD Tourism Trends and Policies 2014. doi:10.1787/tour-2014-en
Okólski, M., & Topińska, I. (2012). Social Impact of Emigration and Rural-Urban
Migration in Central and Eastern Europe Final Country Report Poland.
Olson, P. D., & Bokor, D. W. (1995). Strategy process-content interaction: effects on
growth performance in small start-up firms. Journal of Small Business
Management, 33(1), 34.
Oppenheim, A. N. (1992). Questionnaire design, interviewing and attitude
measurement. Bloomsbury Publishing.
Oppermann, M. (1997). Rural tourism in Germany: Farm and rural tourism operators.
The Business of Rural Tourism: International Perspectives, 108–119.
Page, S., & Getz, D. (1997). The business of rural tourism: international perspectives.
The Business of Rural Tourism International Perspectives (p. 217). International
Thomson Business Press.
Panyik, E., Costa, C., & Rátz, T. (2011). Implementing integrated rural tourism: An
event-based approach. Tourism Management, 32(6), 1352–1363.
doi:10.1016/j.tourman.2011.01.009
Parker, S. C. (2004). The Economics of Self-Employment and Entrepreneurship.
(cambridge university press, Ed.)Business (p. 308). cambridge university press.
doi:10.1017/CBO9780511493430
Parker, S. C. (2009). The economics of entrepreneurship. Cambridge University
Press.
Pearce, D., & Davis, J. (2000). The role of the non-farm rural sector in the
reconstruction of the Balkans. Most, 10(2), 207–228.
190
Pennings, J. M., Lee, K., & Van Witteloostuijn, A. (1998). Human capital, social
capital, and firm dissolution. Academy of Management Journal, 41(4), 425–440.
Perelman, M. (1995). Retrospectives: Schumpeter, David Wells, and Creative
Destruction. Journal of Economic Perspectives. doi:10.1257/jep.9.3.189
Peters, R., & Gregory, M. (2014). Networking, Small Farms and EU Rural
Development Policy. EuroChoices, 13(1), 36–39. doi:10.1111/1746-692X.12050
Petrova, K. (2005). Part-Time Entrepreneurship and Wealth Effects : New Evidence
from the Panel Study of Entrepreneurial Dynamics.
Philippidis, G., & Hubbard, L. J. (2003). Agenda 2000 reform of the CAP and its
impacts on member member States: A note. Journal of Agricultural Economics,
54(3), 479–486.
Place, S. E. (1991). Nature tourism and rural development in Tortuguero. Annals of
Tourism Research, 18(2), 186–201. doi:10.1016/0160-7383(91)90003-T
Putnam, R. D. (1995). Bowling alone: America‘s declining social capital. Jouenal of
Democeacy, 6, 68.
Putnam, R. D. (2000). Bowling alone: The collapse and revival of American
community. Simon and Schuster.
Rae, D., & Carswell, M. (2001). Towards a conceptual understanding of
entrepreneurial learning. Journal of Small Business and Enterprise Development,
8(2), 150–158.
Regoli, F. (2011). Bridging innovation, nature and tradition: assessment of strategies
for rural tourism development in Maramureş (Romania) (No. 0).
Regoli, F., Vittuari, M., & Segrè, A. (2011). Policy options for sustainability. a
preliminary appraisal of rural tourism in Romania: the case of Maramureş. In
Food, Agri-Culture and Tourism (pp. 41–55). Springer.
Ringle, C. M., Sarstedt, M., & Straub, D. W. (2012). Editor‘s comments: a critical
look at the use of PLS-SEM in MIS quarterly. MIS Quarterly, 36(1), iii–xiv.
Roberts, L., & Hall, D. (2001). Rural tourism and recreation: principles to practice.
Cabi Publishing.
Rogerson, C. M. (2014). Backpacker tourism and economic development. Annals of
Tourism Research, 47, 96–97. doi:10.1016/j.annals.2014.05.006
Rogoff, E. G., Lee, M.-S., & Suh, D.-C. (2004). ―Who Done It?‖ Attributions by
Entrepreneurs and Experts of the Factors that Cause and Impede Small Business
Success. Journal of Small Business Management, 42(4), 364–376.
doi:10.1111/j.1540-627X.2004.00117.x
191
Rosentraub, M. S., & Joo, M. (2009). Tourism and economic development: Which
investments produce gains for regions? Tourism Management, 30(5), 759–770.
doi:10.1016/j.tourman.2008.11.014
Rotter, J. B. (1966). Generalized expectancies for internal versus external control of
reinforcement. Psychological Monographs, 80(1), 1–28.
Roxas, H. ―Banjo‖, & Azmat, F. (2014). Community social capital and
entrepreneurship: analyzing the links. Community Development, 45(2), 134–149.
Ruben, R., & Pender, J. (2004). Rural diversity and heterogeneity in less-favoured
areas: the quest for policy targeting. Food Policy, 29(4), 303–320.
doi:10.1016/j.foodpol.2004.07.004
Rubin, P. H. (1978). The Theory of the Firm and the Structure of the Franchise
Contract. The Journal of Law and Economics. doi:10.1086/466918
Sadowski, A., & Czubak, W. (2013). The priorities of rural development in the EU
countries in years 2007-2013. Agricultural Economics (Czech Republic), 59(2),
58–73.
Sánchez, J. C. (2011). Entrepreneurship: introduction. Psicothema, 23, 424–426.
Sanfey, P., Falcetti, E., Taci, A., & Tepic, S. (2004). Spotlight on south-eastern
Europe: an overview of private sector activity and investment. EBRD.
Sarstedt, M., Becker, J.-M., Ringle, C. M., & Schwaiger, M. (2011). Uncovering and
treating unobserved heterogeneity with FIMIX-PLS: Which model selection
criterion provides an appropriate number of segments? Schmalenbach Business
Review, 63, 34–62.
Sarstedt, M., Henseler, J., & Ringle, C. M. (2011). Multigroup analysis in partial least
squares (PLS) path modeling: Alternative methods and empirical results.
Advances in International Marketing, 22, 195–218.
Sarstedt, M., & Ringle, C. M. (2010). Treating unobserved heterogeneity in PLS path
modeling: a comparison of FIMIX-PLS with different data analysis strategies.
Journal of Applied Statistics, 37(8), 1299–1318.
Sathiendrakumar, R., & Tisdell, C. (1989). Tourism and the economic development of
the Maldives. Annals of Tourism Research, 16(2), 254–269. doi:10.1016/0160-
7383(89)90071-6
Saxena, G., Clark, G., Oliver, T., & Ilbery, B. (2007). Conceptualizing Integrated
Rural Tourism. Tourism Geographies, 9(4), 347–370.
doi:10.1080/14616680701647527
Schmelzkopf, K. (2002). Interdisciplinarity, Participatory Learning and the
Geography of Tourism. Journal of Geography in Higher Education, 26(2), 181–
195. doi:10.1080/03098260220144702
192
Schultz, T. W. (1961). Investment in human capital. The American Economic Review,
1–17.
Schultz, T. W. (1971). Investment in Human Capital. The Role of Education and of
Research.
Schumpeter, J. (2003). The Theory of Economic Development: The Economy as a
Whole. In Joseph Alois Schumpeter: Entrepreneurship, Style and Vision (pp. 61–
116).
Schumpeter, J. A. (1934). The Theory of Economic Development. Harvard University
Press (p. 255).
Shane, S. (2004). A general theory of entrepreneurship. booksgooglecom (p. 327).
doi:10.4337/9781781007990
Sharpley, R. (2001). Sustainable rural tourism development: Ideal or idyll. Rural
Tourism and Recreation: Principles to Practice, 57–58.
Sharpley, R., & Jepson, D. (2011). Rural tourism A spiritual experience? Annals of
Tourism Research, 38(1), 52–71. doi:10.1016/j.annals.2010.05.002
Sharpley, R., & Vass, A. (2006). Tourism, farming and diversification: An attitudinal
study. Tourism Management, 27(5), 1040–1052.
doi:10.1016/j.tourman.2005.10.025
Shaw, G., & Williams, A. M. (2004). Chapter 7 - From Lifestyle Consumption to
Lifestyle Production: Changing Patterns of Tourism Entrepreneurship. In R. B.
T.-S. F. in T. Thomas (Ed.), Advances in Tourism Research (pp. 99–113).
Oxford: Elsevier. doi:http://dx.doi.org/10.1016/B978-0-08-044132-0.50010-1
Short, J. C., Moss, T. W., & Lumpkin, G. T. (2009). Research in social
entrepreneurship: Past contributions and future opportunities. Strategic
Entrepreneurship Journal, 3, 161–194. doi:10.1002/sej
Shrader, R., & Siegel, D. S. (2007). Assessing the Relationship between Human
Capital and Firm Performance: Evidence from Technology‐Based New
Ventures. Entrepreneurship Theory and Practice, 31(6), 893–908.
Sidik, I. G. (2012). Conceptual Framework of Factors Affecting SME Development:
Mediating Factors on the Relationship of Entrepreneur Traits and SME
Performance. Procedia Economics and Finance, 4, 373–383.
doi:10.1016/S2212-5671(12)00351-6
Simonovska, A., Gjosevski, D., & Campos, M. (2012). Capital Structure And
Financial Performance Of Agricultural Companies–Evidences From The
Macedonian Agricultural Sector In Transition.
193
Simpeh, K. N. (2011). Entrepreneurship theories and Empirical research : A Summary
Review of the Literature. European Journal Of Business and Management, 3, 1–
9.
Simpson, M., Tuck, N., & Bellamy, S. (2004). Small business success factors: the role
of education and training. Education + Training, 46(8/9), 481–491.
doi:10.1108/00400910410569605
Skokic, V., & Morrison, A. (2011). Conceptions of Tourism Lifestyle
Entrepreneurship: Transition Economy Context. Tourism Planning &
Development, 8(2), 157–169. doi:10.1080/21568316.2011.573915
Smallbone, D. (2005). Fostering entrepreneurship in rural areas (pp. 1–33).
Smeral, E. (2006). Tourism Satellite Accounts: A Critical Assessment. Journal of
Travel Research. doi:10.1177/0047287506288887
SSO of RM. (2007). Census of Agriculture, 2007. STATE STATISTICAL OFFICE
OF THE REPUBLIC OF MACEDONIA.
SSO of RM. (2011a). Gross Domestic Product, 2011.
SSO of RM. (2011b). STATISTICAL YEARBOOK OF THE REPUBLIC OF
MACEDONIA 2011.
SSO of RM. (2011c). Travels of the domestic population, 2011.
SSO of RM. (2012). STATISTICAL YEARBOOK OF THE REPUBLIC OF
MACEDONIA 2012.
SSO of RM. (2014). Active Population in the Republic of Macedonia, 1–13.
Stephens, H. M., & Partridge, M. D. (2011). Do Entrepreneurs Enhance Economic
Growth in Lagging Regions? Growth and Change, 42(4), 431–465.
Stevenson, H. H. (2006). A Perspective on Entrepreneurship. Harvard Business
School, 1–13.
Stevenson, H. H., & Jarillo, J. C. (1990). A paradigm of entrepreneurship:
Entrepreneurial management. In Strategic Management Journal (Vol. 11, pp.
17–27). doi:10.1007/978-3-540-48543-8_7
Štolbová, M. (2007). Comparative analysis of less-favoured areas payments in the EU
states. Agricultural Economics, 53(10), 455–465.
Stone, M. (1974). Cross-validatory choice and assessment of statistical predictions.
Journal of the Royal Statistical Society. Series B (Methodological), 111–147.
Studies, O. (2010). SMEs, Entrepreneurship and Innovation. Innovation (Vol. 54, p.
277). doi:10.1787/9789264080355-en
194
Taleska, M. (2009). Рурален туризам. (Celektor Skopje, Ed.).
Tangermann, S. (1999). Europe‘s agricultural policies and the millennium round.
World Economy, 22(9 BONUS ISSUE), 1155–1178.
Taskov, N., Dimitrov, N., & Metodijeski, D. (2013). Регионална распространетост
на руралниот туризам во ридско-планинските подрачја.
Teece, D. J. (2010). Business models, business strategy and innovation. Long Range
Planning, 43(2-3), 172–194.
Tenenhaus, M., Vinzi, V. E., Chatelin, Y.-M., & Lauro, C. (2005). PLS path
modeling. Computational Statistics & Data Analysis, 48(1), 159–205.
Thomas, M. D. (1987). Schumpeterian perspectives on entrepreneurship in economic
development: a commentary. Geoforum, 18(2), 173–186. doi:10.1016/0016-
7185(87)90004-2
Thomas, R., & Augustyn, M. (2006). Tourism in the New Europe: Perspectives on
SME policies and practices. Tourism in the New Europe: Perspectives on SME
Policies and Practices (pp. 1–247). Elsevier. doi:10.4324/9780080466040
Thomas, R., Shaw, G., & Page, S. J. (2011). Understanding small firms in tourism: A
perspective on research trends and challenges. Tourism Management, 32(5),
963–976. doi:10.1016/j.tourman.2011.02.003
Thornton, P. H. (1999). THE SOCIOLOGY OF ENTREPRENEURSHIP. Annual
Review of Sociology. doi:10.1146/annurev.soc.25.1.19
Thorpe, R., Jones, O., Macpherson, A., & Holt, R. (2007). Evolution of Business
Knowledge in SMEs. Economic & Social Research Council.
Todorov, K., & Vittuari, M. (2010). Towards a shift from agricultural to rural
development policy. The case of the Republic of Macedonia. European
Association of Agricultural Economists.
Toms, J. S. (2010). The labour theory of value, risk and the rate of profit. Critical
Perspectives on Accounting, 21, 96–103. doi:10.1016/j.cpa.2006.01.017
Towner, J. (1996). An historical geography of recreation and tourism in the western
world: 1540-1940. John Wiley & Sons Ltd.
Tyszka, T., Cieślik, J., Domurat, A., & Macko, A. (2011). Motivation, self-efficacy,
and risk attitudes among entrepreneurs during transition to a market economy.
The Journal of Socio-Economics, 40(2), 124–131.
Ucbasaran, D., Westhead, P., & Wright, M. (2008). Opportunity identification and
pursuit: does an entrepreneur‘s human capital matter? Small Business
Economics, 30(2), 153–173.
195
Valliere, D., & Peterson, R. (2009). Entrepreneurship and economic growth: Evidence
from emerging and developed countries. Entrepreneurship & Regional
Development. doi:10.1080/08985620802332723
Van der Sluis, J., van Praag, C. M., & Van Witteloostuijn, A. (2007). Why are the
returns to education higher for entrepreneurs than for employees? IZA
Discussion Papers.
Van Praag, M. (2006). Entrepreneurship and Human Capital. Academic Network in
Entreprenurship, Innovation and Finance.
Vanhove, N. (2011). The Economics of Tourism Destinations. The Economics of
Tourism Destinations (pp. 223–279). Elsevier. doi:10.1016/B978-0-08-096996-
1.00008-X
Var, T., Toh, R., & Khan, H. (1999). Tourism and asean Economic Development.
Annals of Tourism Research, 26(1), 195–196. doi:10.1016/S0160-
7383(98)00065-6
Volery, T. (2007). Ethnic entrepreneurship: a theoretical framework. In L. P. Dana
(Ed.), Handbook Of Research On Ethnic Minority Entrepreneurship: A Co-
evolutionary View on Resource Management (pp. 30–41). Edward Elgar.
Volk, T. (2010). Agriculture in the Western Balkan countries. Studies on the
agricultural and food sector in Central and Eastern Europe.
Von der Weppen, J., & Cochrane, J. (2012). Social enterprises in tourism: an
exploratory study of operational models and success factors. Journal of
Sustainable Tourism, 20(3), 497–511. doi:10.1080/09669582.2012.663377
Walker, E. (2004). What Success Factors are Important to Small Business Owners?
International Small Business Journal, 22(6), 577–594.
doi:10.1177/0266242604047411
Wang, S., Yamada, N., & Brothers, L. (2011). A Case study: discussion of factors and
challenges for urban cultural tourism development. International Journal of
Tourism Research, 13(6), 553–569. doi:10.1002/jtr.826
Wang, Y. (2006). Identifying the Success Factors of Web-Based Marketing Strategy:
An Investigation of Convention and Visitors Bureaus in the United States.
Journal of Travel Research, 44(3), 239–249. doi:10.1177/0047287505279007
Wanhill, S. (1994). The measurement of tourist income multipliers. Tourism
Management, 15(4), 281–283. doi:10.1016/0261-5177(94)90045-0
Watson, K., Hogarth-Scott, S., & Wilson, N. (1998). Small business start-ups: success
factors and support implications. International Journal of Entrepreneurial
Behaviour & Research, 4(3), 217–238. doi:10.1108/13552559810235510
196
Wennekers, S., & Thurik, R. (1999). Linking entrepreneurship and economic growth.
Small Business Economics, 13, 27–55. doi:10.1007/s11187-009-9233-3
Wennekers, S., Van Wennekers, A., Thurik, R., & Reynolds, P. (2005). Nascent
entrepreneurship and the level of economic development. Small Business
Economics, 24(3), 293–309.
Westlund, H., & Bolton, R. (2003). Local Social Capital and Entrepreneurship. In
Small Business Economics (Vol. 21, pp. 77–113).
Wijewardena, H., & Tibbits, G. E. (1999). Factors contributing to the growth of small
manufacturing firms : Data from Australia. Journal of Small Business
Management, 37(2), 88.
Wiklund, J., Davidsson, P., & Delmar, F. (2003). Entrepreneurship and the Growth of
Firms. Entrepreneurship: Theory & Practice.
Williams, C. C. (2008). Beyond necessity-driven versus opportunity-driven
entrepreneurship. Journal of Entrepreneurship and Innovation, 9(3), 1–10.
Wilson, S., Fesenmaier, D. R., Fesenmaier, J., & Van Es, J. C. (2001). Factors for
Success in Rural Tourism Development. Journal of Travel Research, 40(132),
132–138. doi:10.1177/004728750104000203
Wold, H. (1985). Partial least squares. Encyclopedia of Statistical Sciences.
Wong, K. Y. (2005). Critical success factors for implementing knowledge
management in small and medium enterprises. Industrial Management Data
Systems, 105(3), 261–279. doi:10.1108/02635570510590101
Борнарова, С., & Јанеска, В. (2012). Општественото влијание на емиграцијата
и рурално - урбаната миграција в Централна и Источна Европа Извршно
резиме (p. 4).
Влада на Република Македонија. (2009). Национална стратегија за развој на
туризмот 2009 - 2013.
Јакимовски, Ј. (2004). Општествена структура на селото.
Лазаревска, Т., Неданоски, Л., Михаиловски, Г., Поленаковиќ, Радмил Ќурчиев,
А., Јовановски, Б., & Велковски, T. (2008). ПРЕТПРИЕМНИШТВОТО ВО
МАКЕДОНИЈА.
Министерство за Економија. (2012). НАЦИОНАЛНА СТРАТЕГИЈА ЗА
РУРАЛЕН ТУРИЗАМ 2012-2017. Министерство за Економија, Сектор за
Туризам.

197
ANNEXES ANNEX 1 QUESTIONNAIRE
1. Life experience is factor that influence successes of rural tourism business.
1 2 3 4 5 |---------|---------|---------|---------|
2. Education level is important for starting and running a rural tourism business. 1 2 3 4 5 |---------|---------|---------|---------|
3. Rural tourism is a sector with high risk potential.
1 2 3 4 5 |---------|---------|---------|---------|
4. Sectorial associations are influencing the business success in rural tourism.
1 2 3 4 5 |---------|---------|---------|---------|
5. Previous experience of work in tourism sector is necessary for starting a
business in rural tourism sector.
1 2 3 4 5 |---------|---------|---------|---------|
6. Untouched natural beauties are part of my business and without them my business will not exist.
1 2 3 4 5 |---------|---------|---------|---------|
7. Access to financial instruments (Loans and Credits) is influencing the success of
rural accommodation business.
1 2 3 4 5 |---------|---------|---------|---------|
8. The bound with the local community is important when making decisions in my
business.
1 2 3 4 5 |---------|---------|---------|---------|
198
9. Innovative new services and products are influencing the success of rural
tourism accommodation capacities.
1 2 3 4 5 |---------|---------|---------|---------|
10. Investment in local infrastructure is requirement for the development of rural
tourism.
1 2 3 4 5 |---------|---------|---------|---------|
11. Family support (financial and non-financial) is important for success of rural tourism business.
1 2 3 4 5 |---------|---------|---------|---------|
12. External financial support (subsidies and grants) is important for initiation and success of rural tourism.
1 2 3 4 5 |---------|---------|---------|---------|
13. Marketing of the destination influence the success and development of my rural tourism business.
1 2 3 4 5 |---------|---------|---------|---------|
14. I feel capable to deal with unforeseen problems.
1 2 3 4 5 |---------|---------|---------|---------|
15. I have commitment to stay in the place of my business.
1 2 3 4 5 |---------|---------|---------|---------|
16. When participating in group I would take the position of leader.
1 2 3 4 5 |---------|---------|---------|---------|
17. It is usually easy for me to coup with and to achieve the set goals.
199
1 2 3 4 5 |---------|---------|---------|---------|
18. I always set high goals in what I do. 1 2 3 4 5
|---------|---------|---------|---------|
19. Large proportion of entrepreneurs achieve their success by good lack and fortune.
1 2 3 4 5 |---------|---------|---------|---------|
20. How successful you consider your business on a scale from 1 not successful to 10 successful?
21. On the scale from 1 to 10 how important in human capital for success of rural tourism entrepreneur?
22. On the scale from 1 to 10 how important in social capital for success of rural tourism entrepreneur?
23. On the scale from 1 to 10 how important in business environment for success of rural tourism entrepreneur?
Demographic Data
1. Name natural person or legal entity:
2. Settlement:
3. Registration form: natural person, legal entity,
4. Sex: ☐Male ☐Female
5. Age:
6. Education: ☐primary ☐high school ☐university degree ☐master or >
7. Number of rooms:
8. Number of beds:
9. Number of years in business:
10. Number of full time employed persons:
11. Place of rural tourism is your birth place: Yes No
12. Rural tourism is additional occupation (not main income) Yes No
13. Number of gests in the last year:
14. Annual turnover from rural tourism in MKD:
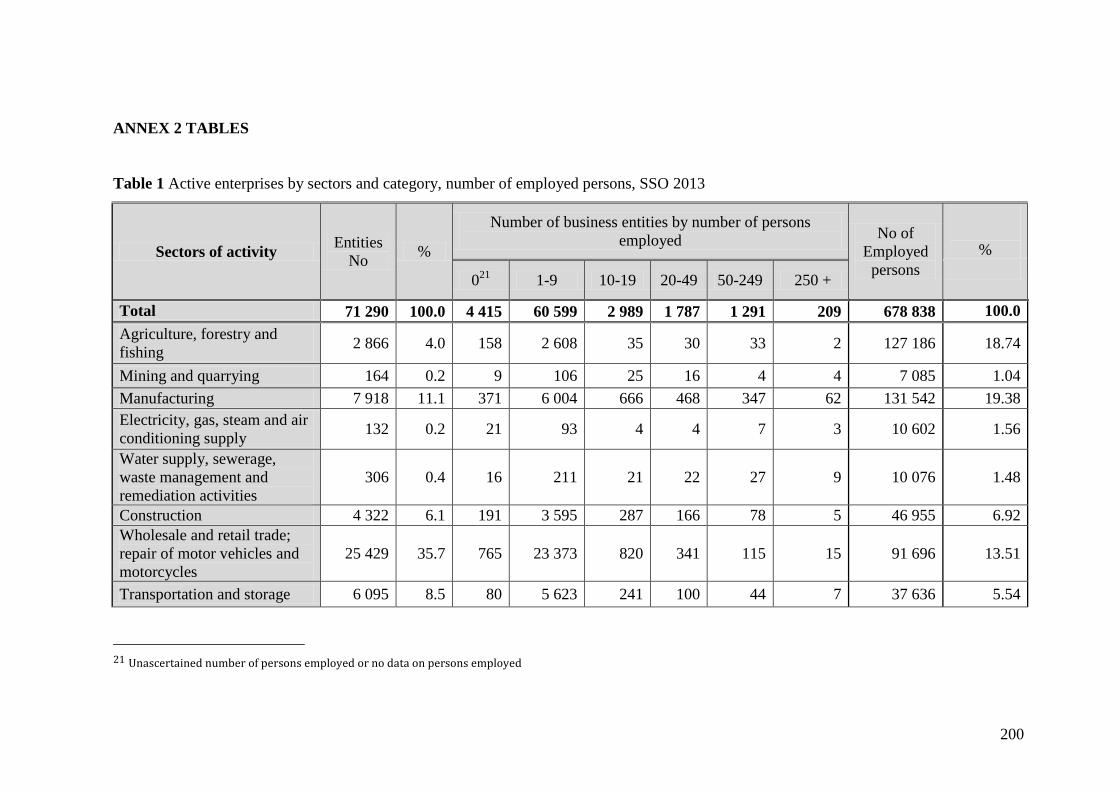
200
ANNEX 2 TABLES
Table 1 Active enterprises by sectors and category, number of employed persons, SSO 2013
Sectors of activity Entities
No %
Number of business entities by number of persons
employed No of
Employed
persons
%
021
1-9 10-19 20-49 50-249 250 +
Total 71 290 100.0 4 415 60 599 2 989 1 787 1 291 209 678 838 100.0
Agriculture, forestry and
fishing 2 866 4.0 158 2 608 35 30 33 2 127 186 18.74
Mining and quarrying 164 0.2 9 106 25 16 4 4 7 085 1.04
Manufacturing 7 918 11.1 371 6 004 666 468 347 62 131 542 19.38
Electricity, gas, steam and air
conditioning supply 132 0.2 21 93 4 4 7 3 10 602 1.56
Water supply, sewerage,
waste management and
remediation activities
306 0.4 16 211 21 22 27 9 10 076 1.48
Construction 4 322 6.1 191 3 595 287 166 78 5 46 955 6.92
Wholesale and retail trade;
repair of motor vehicles and
motorcycles
25 429 35.7 765 23 373 820 341 115 15 91 696 13.51
Transportation and storage 6 095 8.5 80 5 623 241 100 44 7 37 636 5.54
21 Unascertained number of persons employed or no data on persons employed
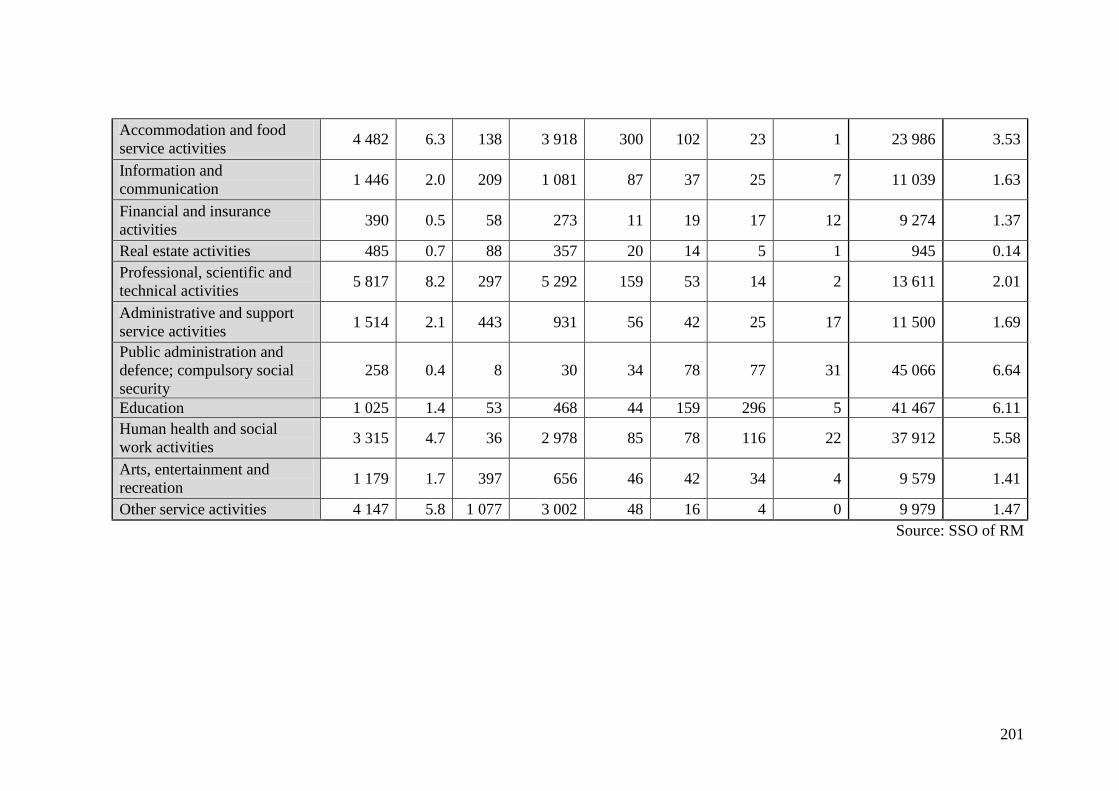
201
Accommodation and food
service activities 4 482 6.3 138 3 918 300 102 23 1 23 986 3.53
Information and
communication 1 446 2.0 209 1 081 87 37 25 7 11 039 1.63
Financial and insurance
activities 390 0.5 58 273 11 19 17 12 9 274 1.37
Real estate activities 485 0.7 88 357 20 14 5 1 945 0.14
Professional, scientific and
technical activities 5 817 8.2 297 5 292 159 53 14 2 13 611 2.01
Administrative and support
service activities 1 514 2.1 443 931 56 42 25 17 11 500 1.69
Public administration and
defence; compulsory social
security
258 0.4 8 30 34 78 77 31 45 066 6.64
Education 1 025 1.4 53 468 44 159 296 5 41 467 6.11
Human health and social
work activities 3 315 4.7 36 2 978 85 78 116 22 37 912 5.58
Arts, entertainment and
recreation 1 179 1.7 397 656 46 42 34 4 9 579 1.41
Other service activities 4 147 5.8 1 077 3 002 48 16 4 0 9 979 1.47
Source: SSO of RM
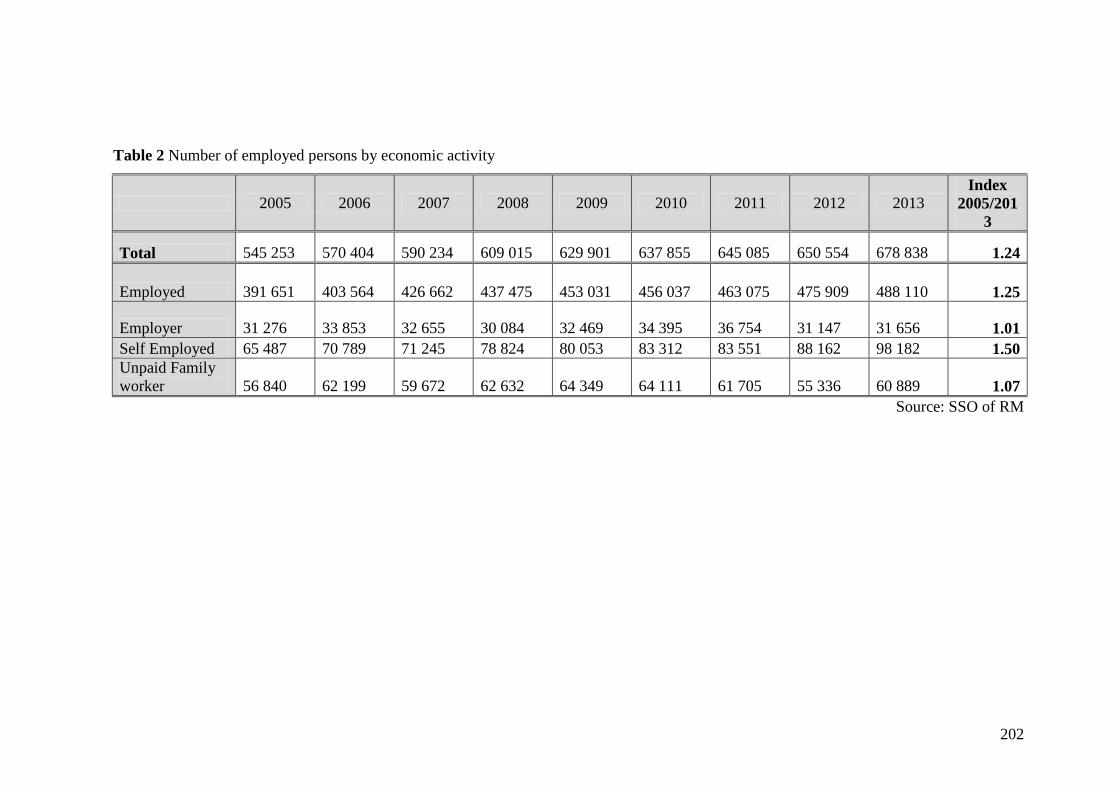
202
Table 2 Number of employed persons by economic activity
2005 2006 2007 2008 2009 2010 2011 2012 2013 Index
2005/201
3
Total 545 253 570 404 590 234 609 015 629 901 637 855 645 085 650 554 678 838 1.24
Employed 391 651 403 564 426 662 437 475 453 031 456 037 463 075 475 909 488 110 1.25
Employer 31 276 33 853 32 655 30 084 32 469 34 395 36 754 31 147 31 656 1.01
Self Employed 65 487 70 789 71 245 78 824 80 053 83 312 83 551 88 162 98 182 1.50
Unpaid Family
worker 56 840 62 199 59 672 62 632 64 349 64 111 61 705 55 336 60 889 1.07
Source: SSO of RM
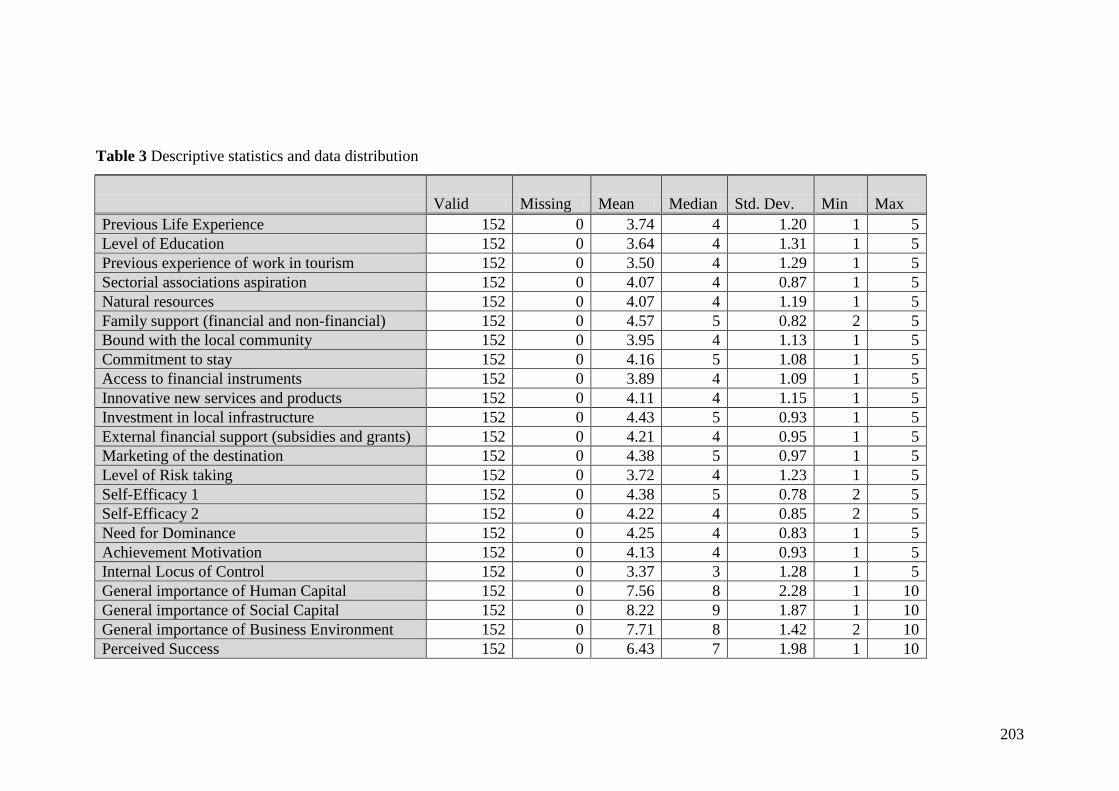
203
Table 3 Descriptive statistics and data distribution
Valid Missing Mean Median Std. Dev. Min Max
Previous Life Experience 152 0 3.74 4 1.20 1 5
Level of Education 152 0 3.64 4 1.31 1 5
Previous experience of work in tourism 152 0 3.50 4 1.29 1 5
Sectorial associations aspiration 152 0 4.07 4 0.87 1 5
Natural resources 152 0 4.07 4 1.19 1 5
Family support (financial and non-financial) 152 0 4.57 5 0.82 2 5
Bound with the local community 152 0 3.95 4 1.13 1 5
Commitment to stay 152 0 4.16 5 1.08 1 5
Access to financial instruments 152 0 3.89 4 1.09 1 5
Innovative new services and products 152 0 4.11 4 1.15 1 5
Investment in local infrastructure 152 0 4.43 5 0.93 1 5
External financial support (subsidies and grants) 152 0 4.21 4 0.95 1 5
Marketing of the destination 152 0 4.38 5 0.97 1 5
Level of Risk taking 152 0 3.72 4 1.23 1 5
Self-Efficacy 1 152 0 4.38 5 0.78 2 5
Self-Efficacy 2 152 0 4.22 4 0.85 2 5
Need for Dominance 152 0 4.25 4 0.83 1 5
Achievement Motivation 152 0 4.13 4 0.93 1 5
Internal Locus of Control 152 0 3.37 3 1.28 1 5
General importance of Human Capital 152 0 7.56 8 2.28 1 10
General importance of Social Capital 152 0 8.22 9 1.87 1 10
General importance of Business Environment 152 0 7.71 8 1.42 2 10
Perceived Success 152 0 6.43 7 1.98 1 10
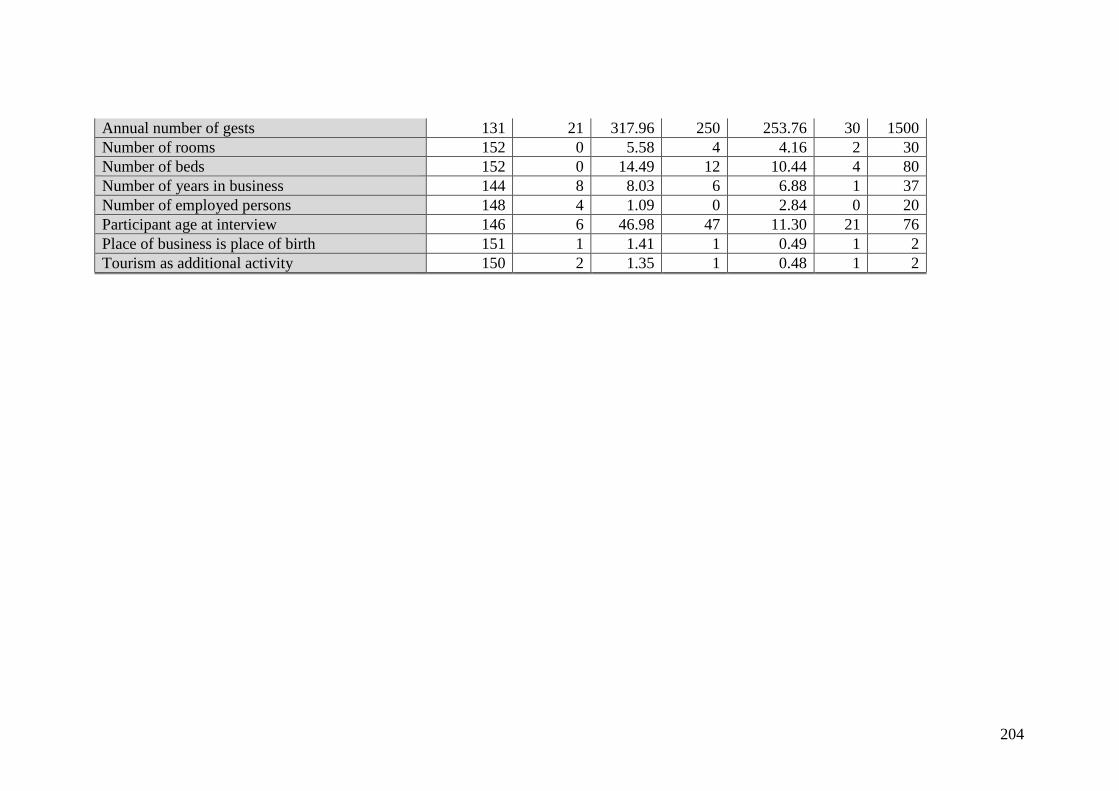
204
Annual number of gests 131 21 317.96 250 253.76 30 1500
Number of rooms 152 0 5.58 4 4.16 2 30
Number of beds 152 0 14.49 12 10.44 4 80
Number of years in business 144 8 8.03 6 6.88 1 37
Number of employed persons 148 4 1.09 0 2.84 0 20
Participant age at interview 146 6 46.98 47 11.30 21 76
Place of business is place of birth 151 1 1.41 1 0.49 1 2
Tourism as additional activity 150 2 1.35 1 0.48 1 2
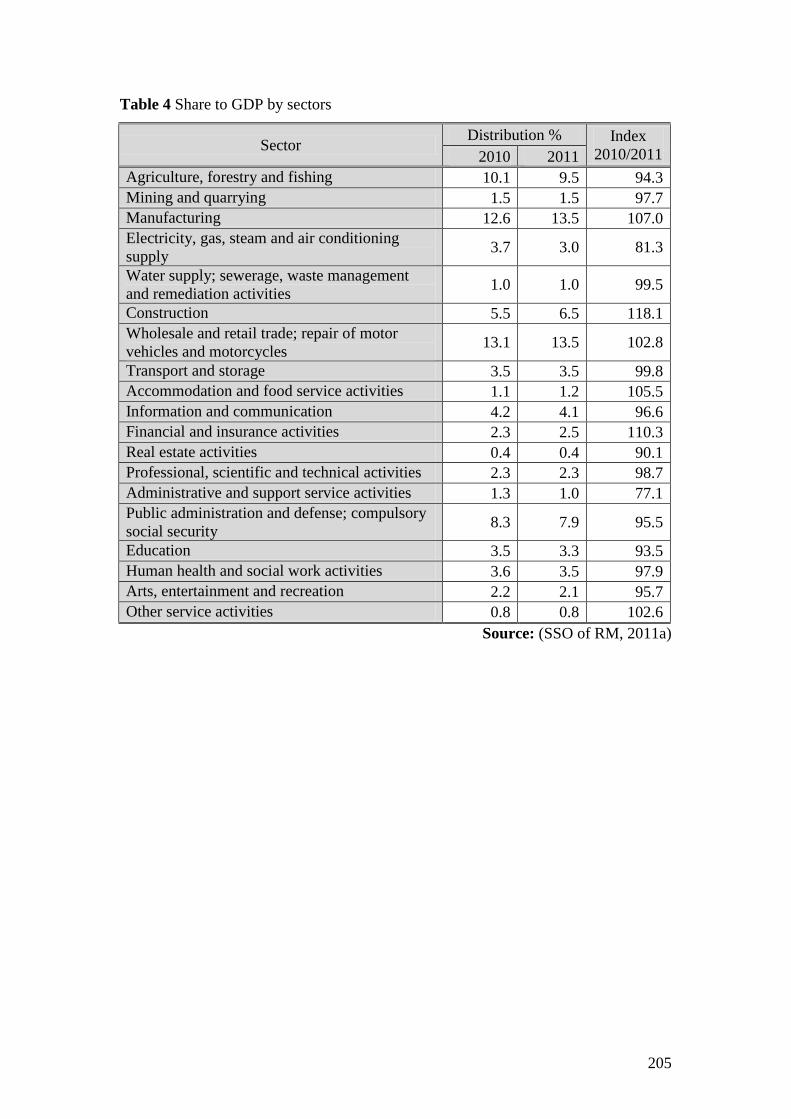
205
Table 4 Share to GDP by sectors
Sector Distribution % Index
2010/2011 2010 2011
Agriculture, forestry and fishing 10.1 9.5 94.3
Mining and quarrying 1.5 1.5 97.7
Manufacturing 12.6 13.5 107.0
Electricity, gas, steam and air conditioning
supply 3.7 3.0 81.3
Water supply; sewerage, waste management
and remediation activities 1.0 1.0 99.5
Construction 5.5 6.5 118.1
Wholesale and retail trade; repair of motor
vehicles and motorcycles 13.1 13.5 102.8
Transport and storage 3.5 3.5 99.8
Accommodation and food service activities 1.1 1.2 105.5
Information and communication 4.2 4.1 96.6
Financial and insurance activities 2.3 2.5 110.3
Real estate activities 0.4 0.4 90.1
Professional, scientific and technical activities 2.3 2.3 98.7
Administrative and support service activities 1.3 1.0 77.1
Public administration and defense; compulsory
social security 8.3 7.9 95.5
Education 3.5 3.3 93.5
Human health and social work activities 3.6 3.5 97.9
Arts, entertainment and recreation 2.2 2.1 95.7
Other service activities 0.8 0.8 102.6
Source: (SSO of RM, 2011a)