Hydro One Networks Inc DG Technical Interconnection Requirements

NREL is a national laboratory of the U.S. Department of Energy, Office of Energy Efficiency and Renewable Energy, operated by the Alliance for Sustainable Energy, LLC.
Distributed Generation Interconnection
Collaborative (DGIC)
“Mitigation Measures for Distributed Interconnection”
Michael Coddington with National Renewable Energy Laboratory and Robert Broderick with Sandia National
Laboratories
July 9, 2014

2
Speakers
Michael Coddington Principal Investigator
Distributed Grid Integration NREL
Robert Broderick Technical Lead
Distributed Grid Integration Programs Sandia National Laboratories Kristen Ardani
Solar Analyst, (today’s moderator)
NREL

3 3
INTERCONNECTION, SCREENING & MITIGATION PRACTICES OF 21 UTILITIES
Michael Coddington Principle Investigator, Distributed Grid Integration
5
Document current practices
Determine the range of feeders in CA
Collect high-res PV data
Analyze high-pen PV feeder
Develop/validate alternate screening methods
Step 1: Current Screening Practices
• Task Purpose > Investigate and document current practices for
screening PV interconnection requests among California utilities and from other sources outside California
• Approach > Consider federal, state, and local
interconnection procedures pertaining to CA (Rule 21, WDAT, SGIP)
> Consider non-CA utility screening practices as well
6
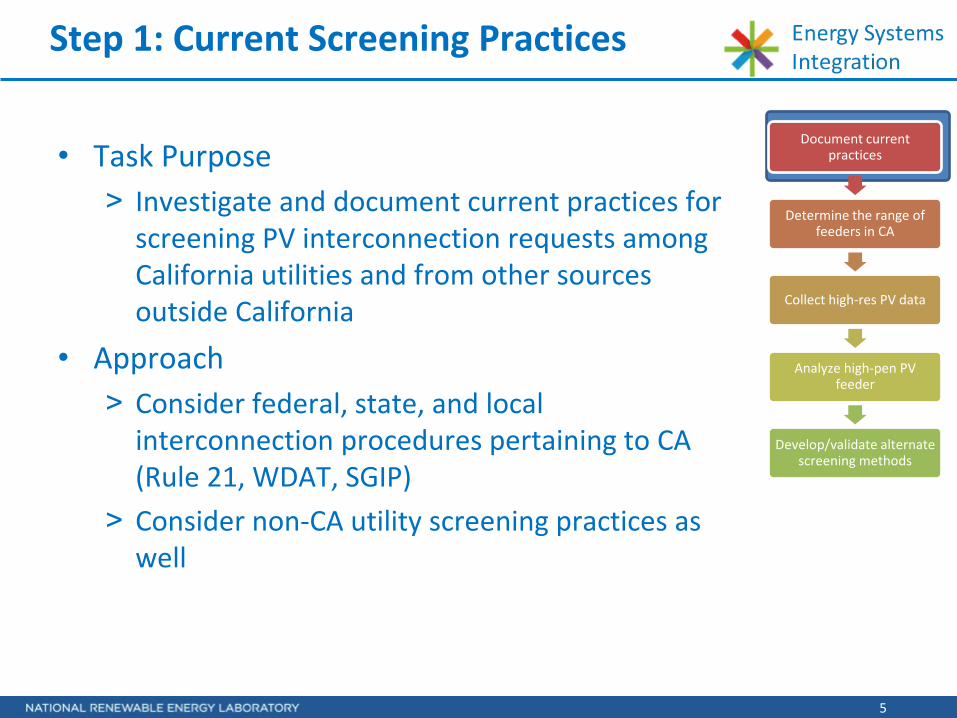
Documenting Current Practices
Document current practices
Determine the range of feeders
in CA
Collect high-res PV data for
model development &
screening validation
Analyze high-pen PV feeder
Develop/validate alternate screening methods

7
21 Utilities, Four Regions
PG&E SCE SDG&E SMUD
NSP Com Ed Detroit Edison Nashville Electric
PSCO PNM APS Tri County Electric Coop Austin Power SPS
NSTAR National Grid Con Ed O&R Central Hudson LIPA PEPCO
8
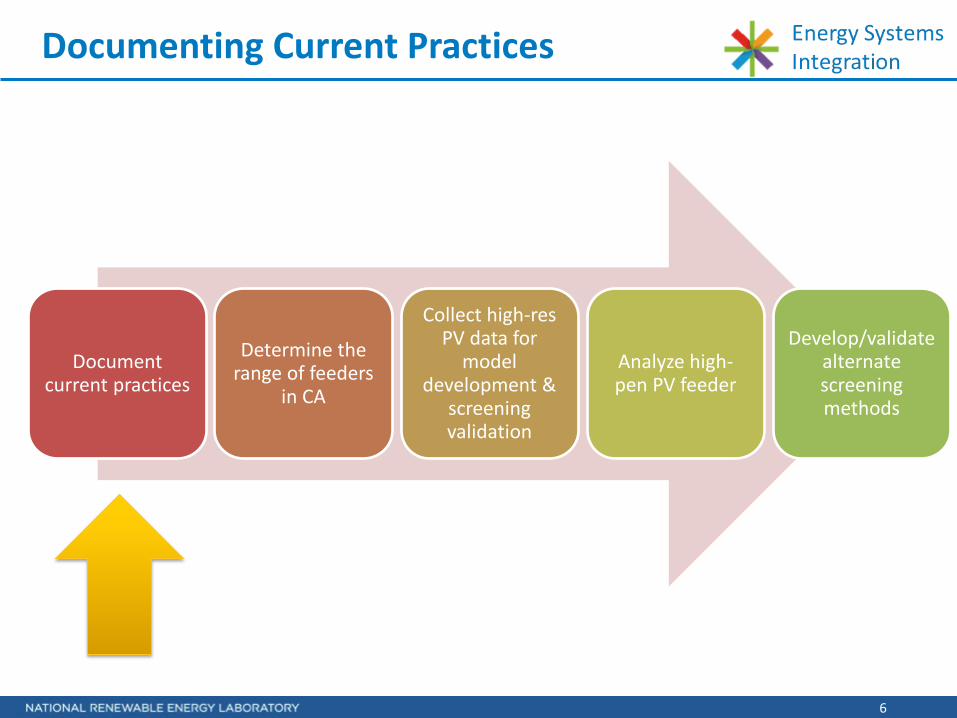
Application Screens Applied
Supplemental Study
Impact Studies / Modeling
Mitigate Concerns
Approve Installation

9
Questionnaire Areas of Focus
• Application Process • Screening procedures • Supplemental screening procedures • Utility concerns related to interconnection • Impact study approach & software used • Mitigation strategies

10
Application Processes
• Most have time limits to respond to applications • Many utilities followed state rules for applications • Many utilities have multiple tiers • Many utilities have inverter-based DG applications • Many interconnection applications are posted
online • Some utilities allowed online submittal, tracking • Some utilities are not allowed to charge a fee for
certain applications

11
Screening Procedures
• Most utilities follow a version of FERC screens • Some used a minimum daytime load for
penetration screen (prior to FERC SGIP 2013 order) • One utility didn’t use any screens at all
1. Aggregated DG <15% of peak load on line section
2. For connection to a spot network: DG is inverter-based, aggregated DG capacity is <5% of peak load & <50 kW
3. Aggregated DG contribution to maximum short circuit current is <10%
4. Aggregated DG does not cause protective device to exceed 87.5% of short circuit interrupting capability
5. DG interface is compatible with type of primary distribution line (wye/Delta)
6. For a single-phase shared secondary, Aggregated DG capacity <20kW
7. Resulting imbalance <20% of service transformer rating of 240 V service
8. Aggregated transmission connected DG capacity <10 MW for stability-limited area
9. Construction not required for interconnection

12
Universal Interconnection Process
There are significant differences amongst U.S. Electric utilities in practices, processes, tools & models and mitigation strategies.
Complete Application
Fast-Track Screens
Supplemental
Review Screens
Impact Studies
Model Mitigate
Approval
Expedited Review Process (Preferred)
$ Supplemental study Process (Better)
$$$ Detailed Study Process (Slower, Expensive, Time-Consuming)
Fail Fail

13
Supplemental Screening
• Used to pass some interconnection applications when fast-track screens are failed
• Often quick, inexpensive solutions rather than moving to detailed impact studies
• Implemented only by some utilities • Now part of the FERC SGIP

14
Major Utility Concerns
• Voltage Regulation 16 • Protection system coordination 10 • Reverse power flow 11 • Increased duty of line regulation equipment 8 • Unintentional islanding 8 • Secondary network protection 6 • Variability due to clouds 5 • Increased switching of capacitors 4

15
Minor Utility Concerns
• Flicker 4 • Reactive power control 3 • Balancing resources and demand response 3 • Overvoltage due to faults 2 • Multiple inverter stability 1 • Harmonics 1 • Relay desensitization 1 • Exporting power through network protectors 1

16
Detailed Impact Studies
Most utilities employ one or more of the following study types
• Feasibility • Facility • Power Flow (common) • Short Circuit (common) • Voltage (common) • Quasi-Static Time Series • Flicker • Power Quality • Dynamic/Transient Stability • Electromagnetic Transient
Common software
• SynerGEE • CymDist • Milsoft Windmil • DEW • ASPEN • OpenDSS

17
Common Mitigation Strategies
Type SW (5) Central (3) California (4) NE (7)
Voltage Regulation devices (13) 4 1 3 5
Upgraded line sections (16) 4 2 4 6
Modify protection (16) 4 3 3 6
Power factor controls (8) 4 1 x 3
Direct Transfer Trip (12) 2 3 1 6
Static VAR Compensator (SVC) (1) 1 x x x
Communication/Control Technology (11) 4 1 2 4
Grounding transformers (8) 2 2 2 2
Advanced inverters (11) 3 2 3 3
Capacitor control modifications (1) x x x 1
Reclosers (3) x 1 x 2
Volt/VAR Controls (1) x x x 1

18
Common Amongst Experienced Utilities
• Open communication between utility & developer • Online interconnection applications • Ease of tracking project status • Rational screening approach • Supplemental screening options • “Safety Valve” approach to solve simple problems
and avoid impact studies • Standard impact study approach, software • Cost-effective mitigation strategies • Supportive regulatory organizations • Uniform state rules/processes for all utilities • Overall streamlined, transparent processes

19
Thank You

Photos placed in horizontal position with even amount of white space
between photos and header
Sandia National Laboratories is a multi-program laboratory managed and operated by Sandia Corporation, a wholly owned subsidiary of Lockheed Martin Corporation, for the U.S. Department of Energy’s National Nuclear Security Administration under contract DE-AC04-94AL85000. SAND NO. 2011-XXXXP
Analysis of 100 Utility SGIP PV Interconnection Studies
Santiago S. Sena, Jimmy E. Quiroz, and Robert J. Broderick

Introduction
Small Generator Interconnection Procedure (SGIP) was developed by FERC as a standard interconnection procedure.
Applies to generating facilities ≤ 20 MWs on distribution systems.
Three evaluation procedures: 10 kW Inverter Process Fast Track process Study Process
SNL surveyed 100 PV SGIP studies to: Classify interconnection types and facility costs Analyze the types of adverse system impacts Analyze mitigation options and associated costs
21

100 SGIP Cases Dataset
PV facility sizes ranged from 1 MW to 20 MW. Facilities entered study process by failing Fast Track screens:
Capacity must be less than 15% of the peak load on the line section Contribution to fault current shall not exceed 10% of circuit’s max
fault current Must not cause equipment to exceed 87.5% of short circuit
interruption capability Capacity must not exceed 10 MW if interconnecting to an area with
known transient stability limitations No construction of facilities by the Transmission Provider on its own
system shall be required to accommodate the small generation facility
Studies performed by 7 utilities in U.S.
22

Interconnection Topologies – Tap Existing Low Voltage Distribution Circuit
23
Ranged from 12.47 to 34.5 kV.

Interconnection Topologies – Build New Distribution Circuit from Substation
24
Single Feeder Service
Double Feeder Service

Interconnection Topologies – Tap Existing High Voltage Distribution Circuit
25
69 kV or less.

General Statistics – Facility Sizes and Utility
26 66% less than 7 MW, 82% less than 11 MW.

General Statistics – Interconnection Voltage
27
70% at 12.47 kV, all 69 kV facilities were 20 MW capacity.

General Statistics – Facility Sizes and Interconnection Topology
28
All “Tap Existing Low” were 10 MW or less, 80% of “Tap Existing High” were 20 MW.

Impacts Identified – Interconnection Topology
29
68% 86%

Impacts Identified – Impact Type
30
Protection 20
Voltage & Protection
7 Voltage
9
Voltage & Thermal 4
Thermal, Voltage & Protection
9 Protection &
Thermal 7
All thermal impacts occurred in conjunction with another impact type.
29 voltage impacts – 19 overvoltage and 10 voltage deviation.
Protection impacts most prevalent (43).

Mitigations and Costs – Overvoltage
31
Ranged from $0 to $383,700.
Required inverter PF adjustment only.
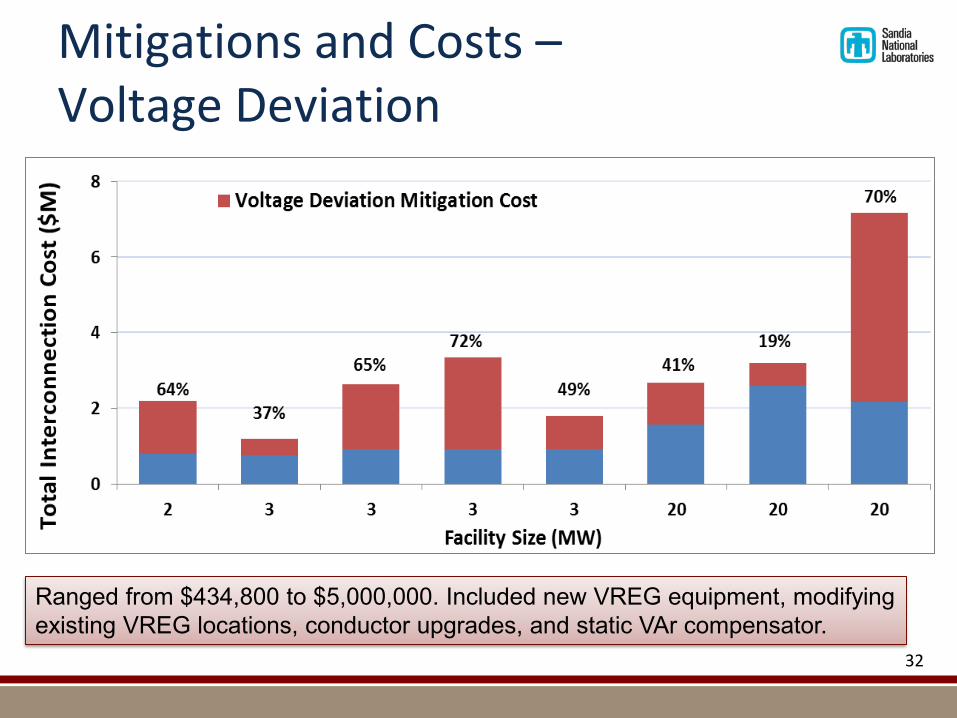
Mitigations and Costs – Voltage Deviation
32
Ranged from $434,800 to $5,000,000. Included new VREG equipment, modifying existing VREG locations, conductor upgrades, and static VAr compensator.

Mitigations and Costs – Thermal Impacts
33
Ranged from $20,000 to $2,415,100. Included upgrades to conductor sections and voltage regulation equipment.
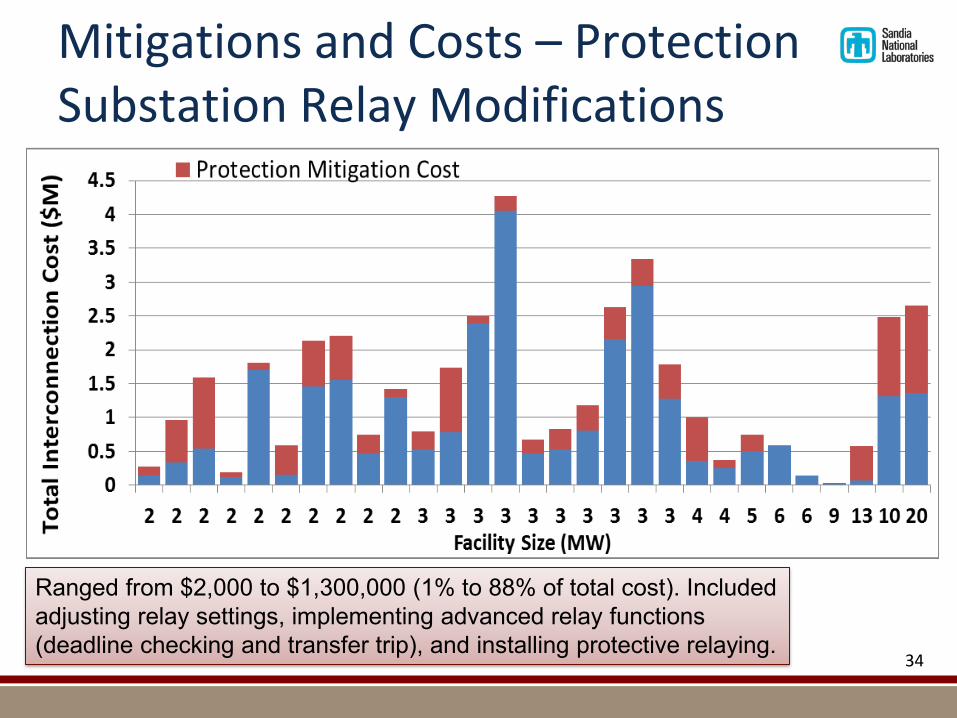
Mitigations and Costs – Protection Substation Relay Modifications
34
Ranged from $2,000 to $1,300,000 (1% to 88% of total cost). Included adjusting relay settings, implementing advanced relay functions (deadline checking and transfer trip), and installing protective relaying.

Mitigations and Costs – Protection Distribution Protection Modifications
35
Ranged from $45,000 to $178,900 (11% to 69% of total cost). Included modifications to existing reclosers and installation of new reclosers.

Cost Analysis – Facility Size
36
Ranged from $22,000 to $11,516,445. 50% less than $689,431.

Cost Analysis – Cost Per MW vs. Facility Size
37
Ranged from $2,444 to $1,424,400. 50% less than $133,833.

Cost Analysis – Interconnection Voltage
38

Conclusions
Interconnection topologies were strongly correlated to the presence/absence of adverse impacts.
Protection impacts were the most prevalent adverse system impact identified (43%).
Overvoltage impacts were overall the easiest and least expensive to mitigate, with almost half requiring no added cost.
Voltage deviation impact mitigations were overall the most difficult and costly.
SNL work underway to improve interconnection screens and identify the most efficient mitigation strategies for common impacts.
39

Thank you!
Jimmy E. Quiroz, [email protected] Robert J. Broderick, [email protected]
“Survey of 100 SGIP Interconnection Studies”.
Sandia National Laboratories SAND2014-4753, 2014
40

Thank you!
http://www.nrel.gov/tech_deployment/dgic.html


![Combined Effect of CVR and DG Penetration in the Voltage ...engineering.nyu.edu/power/sites/engineering.nyu.edu.power/files/upl… · DG interconnection [4], [5]. The recommendations](https://static.fdocuments.in/doc/165x107/5ed3f4041188145a1e026928/combined-effect-of-cvr-and-dg-penetration-in-the-voltage-dg-interconnection.jpg)