Diffusion of ISO 9000 and ISO 14000 Certification through ...
35
Global Diffusion of ISO 9000 Certification through Supply Chains Charles J. Corbett UCLA Anderson School of Management [email protected] December 31, 2003 Abstract The ISO 9000 series of quality management systems standards is widely diffused, with over 560,000 sites certified in 159 countries (as of December 2002). Anecdotal evidence suggests that global supply chains contributed to this diffusion, in the following sense. Firms in Europe were the first to seek ISO 9000 certification. They then required their suppliers to do likewise, including those abroad. Once the standard had thus entered other countries, it spread beyond those firms immediately exporting to Europe to be adopted by many other firms in those same countries. This paper empirically examines the validity of this view of the role of supply chains in global diffusion of ISO 9000. We formulate a series of four requirements that must be met in order to be able to claim that supply chains contributed to the global diffusion of ISO 9000. We then use firm-level data from a global survey of over 5000 firms in 9 countries to test the hypotheses that correspond to these requirements. Our findings are consistent with the view that ISO 9000 did diffuse upstream through global supply chains. In short, this means that firms that export goods or services to a particular country may simultaneously be importing that country’s management practices. We conclude by speculating on how these findings might apply to the environmental management systems standard ISO 14000. Keywords: ISO 9000, ISO 14000, quality management, supply chains, diffusion, global, empirical, survey. 1
Transcript of Diffusion of ISO 9000 and ISO 14000 Certification through ...

Global Diffusion of ISO 9000 Certification through Supply
Chains
Charles J. Corbett
UCLA Anderson School of Management
December 31, 2003
Abstract
The ISO 9000 series of quality management systems standards is widely diffused, with over 560,000 sites certified in 159 countries (as of December 2002). Anecdotal evidence suggests that global supply chains contributed to this diffusion, in the following sense. Firms in Europe were the first to seek ISO 9000 certification. They then required their suppliers to do likewise, including those abroad. Once the standard had thus entered other countries, it spread beyond those firms immediately exporting to Europe to be adopted by many other firms in those same countries. This paper empirically examines the validity of this view of the role of supply chains in global diffusion of ISO 9000. We formulate a series of four requirements that must be met in order to be able to claim that supply chains contributed to the global diffusion of ISO 9000. We then use firm-level data from a global survey of over 5000 firms in 9 countries to test the hypotheses that correspond to these requirements. Our findings are consistent with the view that ISO 9000 did diffuse upstream through global supply chains. In short, this means that firms that export goods or services to a particular country may simultaneously be importing that country’s management practices. We conclude by speculating on how these findings might apply to the environmental management systems standard ISO 14000. Keywords: ISO 9000, ISO 14000, quality management, supply chains, diffusion, global, empirical, survey.
1

1. Introduction
Do management practices diffuse through global supply chains? That is the question
underlying this research. There are many mechanisms by which management practices
might spread: through industry associations, government interventions, consulting firms,
management education, etc. Some of these mechanisms operate primarily within
countries, others could contribute to practices spreading across countries. Our interest
here is in the question whether management practices diffuse across countries as a result
of global supply chains. In other words, when firms export goods or services to a country,
do they also import that country’s management practices?
We study this question in the context of ISO 9000, the widely diffused quality
management systems standard. ISO 9000 was introduced in 1986 and had been adopted
by over 560,000 sites in 159 countries by December 2002 (ISO 2003). Anecdotal
evidence suggests that this worldwide spread occurred in part through supply chains.
According to that view, firms in Europe were early to adopt ISO 9000; they then imposed
the standard on their suppliers, including those abroad. These foreign suppliers
essentially imported the standard into their own country, after which it spread to other
firms in the same country.
This paper empirically examines this view of global diffusion of ISO 9000. To do
so, we formulate a series of four requirements that must be met in order to be able to
claim that ISO 9000 diffused through global supply chains. This gives a self-contained
theoretical framework for studying diffusion in supply chains; we relate this to the well-
known Bass (1969) model of diffusion in Appendix A. Applying this theoretical
framework to the case of ISO 9000, the four requirements translate into specific
2

hypotheses. We combine global country-level certification data with firm-level data
collected in a survey of over 5000 firms in 9 countries to test these hypotheses. Overall,
we find strong support for the view that management practices can initially be adopted by
firms in one region, then “imported” by supplier firms in other countries exporting to that
region. Those supplier firms, in turn, trigger traditional single-market diffusion
mechanisms, hence contributing to certification by yet other firms within their country.
This is consistent with Dekimpe et al.’s (2000b) view that, in studying diffusion, both
breadth (across countries) and depth (within countries) must be considered
simultaneously. We conclude that supply chain pressures related to export flows
definitely contributed to global diffusion of ISO 9000.
Below, in Section 2, we review relevant literature on ISO 9000 and on diffusion
theory. Section 3 presents our theoretical framework. Section 4 describes the data, and
Section 5 discusses the methodology and results. Section 6 summarizes our findings and
the limitations of this study.
2. Literature
This paper draws on and contributes to several strands of literature: that on management
standards in general and on ISO 9000 and ISO 14000 certification in particular, and that
on global diffusion processes. Some of the recent theoretical perspectives on ISO 14000
are relevant for ISO 9000 too, which is why we include them here.
Early academic surveys on ISO 9000 include Brown et al.’s (1998) study of small
firms’ experiences with ISO 9000 and Lee’s (1998) survey of ISO 9000 in Hong Kong.
Terziovski et al. (1996) find no link between ISO 9000 and organizational performance
3

among Australian firms. Anderson et al. (1999) use COMPUSTAT data to find that
exports to Europe and elsewhere increase US firms’ likelihood of seeking ISO 9000, but
they do not distinguish between early and late adopters as we do here.
Several authors have recently studied ISO 9000 and ISO 14000 in the context of
institutional theory (Scott 1995). Naveh and Marcus (2000), using a detailed survey of
ISO 9000 in the US, find that “going beyond” the requirements of the standard increases
its value to the firm, and Naveh et al. (2000) find no difference between early and later
adopters with respect to external pressure to seek certification. Terlaak and King (2001)
use TRI data to study how early adopters of ISO 9000 affect subsequent adoption patterns
in various industries, finding that signalling models and institutional theory both
contribute to explaining adoption of ISO 9000. Delmas (2002) finds that institutional
theory contributes to explaining early adoption of ISO 14000.
Some recent work has focused explicitly on global diffusion of ISO 9000 and ISO
14000. Mendel (2001) discusses various mechanisms driving global spread of ISO 9000.
Guler et al. (2002) use national ISO 9000 certification levels to examine which
mechanisms drive global diffusion, while Delmas (2003) does the same for ISO 14000.
Corbett and Kirsch (2001) show that ISO 14000 certification levels by country depend on
ISO 9000 certification levels, export-propensity, and environmental attitudes. Christmann
and Taylor (2001) find that foreign ownership and exports to more developed countries
increase the likelihood of ISO 14000 certification among Chinese firms.
The literature on diffusion of management practices is large. Teece (1980) shows
that the Bass (1969) model of diffusion for technological innovations can also be applied
to administrative innovations. Venkatraman et al. (1994) find that the relative influence
4

of the internal- and external-influence components of the Bass model varies across
innovations. Lücke (1996) finds that the level of economic development of countries
affects the timing of the start of the diffusion process for weaving technology, but not the
diffusion rate itself. Dekimpe et al. (2000b) review the limited research to date on global
diffusion. Talukdar et al. (2002) examine how country-specific characteristics affect
diffusion patterns of a range of consumer products, but do not explicitly consider
interactions between countries. Various other factors that drive diffusion of management
practices are proposed by Abrahamson (1991) and subsequent work.
None of this work has explicitly focused on the role of supply chains in
explaining global diffusion. The contribution of the current paper is to formally state the
requirements for claiming that supply chains contribute to global diffusion, and to apply
this framework to ISO 9000 and test it. In doing so, we make use of the extensive
literature on survey research methods, especially that dealing with international mail
surveys, reviewed in Singh (1995) and Harzing (1997).
3. Theoretical framework
Consider a global economy, with firms in each geographic region trading goods and
services with other firms, in the same region and elsewhere. A new management practice
(in our case, ISO 9000) is introduced somewhere in this global economy, and gradually
accepted by firms in many regions. In order to be able to say that global supply chains
contributed to this diffusion, four requirements must be met. Below we outline these
requirements; later we use them to formulate and test specific hypotheses. In Appendix
A, we describe how an adaptation of the Bass model of diffusion (Bass 1969) can be used
5
to generate largely identical hyptheses.
The first requirement to support the view that global supply chains contributed to
global diffusion of ISO 9000 is that there exist considerable heterogeneity across
geographic areas in timing of adoption. Without such chronological heterogeneity, it
would be meaningless to claim that ISO 9000 spread from one area to another at all, let
alone that any particular mechanism contributed to that spread. If this first requirement is
met, we can distinguish between early- and later-adopting areas.
Assuming that this first requirement is met, the second requirement is that firms in
the early-adopting areas must exert more pressure on their immediate suppliers to seek
ISO 9000 certification than firms in later-adopting areas. This pressure can take several
forms. It can be explicit, e.g., by excluding non-certified firms from bidding for supply
contracts (as is increasingly the case with ISO 9000). It can be implicit, e.g., by including
questions about certification status in vendor selection questionnaires (as is currently
becoming more common for ISO 14000). It can also be indirect, e.g., through the
perception held by many non-European firms that ISO 9000 certification is somehow a
requirement for exporting to the European Union. Any of these mechanisms would put
pressure on firms in later-adopting areas to seek certification. Without this second
requirement, there would be no supply chain-related causal link between diffusion
patterns in early- and later-adopting areas.
If the first two requirements are met, exporting firms in later-adopting areas
experience pressure from customers in early-adopting areas to seek certification. The
third requirement is that these exporters are indeed the first to seek certification within
their (later-adopting) area. At that point, we can say that firms that export goods and
6

services into another area import management practices (such as ISO 9000) from that
area. This third requirement addresses the breadth of diffusion from early-adopting to
later-adopting areas (Dekimpe et al. 2000b). If this third requirement is not met, the
management practice would spread from one country to another through mechanisms
other than supply chains.
The fourth and final requirement addresses depth of diffusion within the later-
adopting areas: firms that adopt later must be less motivated by export-related factors
than early-adopting firms. In other words, traditional single-market diffusion mechanisms
spread the practice to other firms beyond the early-adopting exporting firms. This could
be through pressure from exporting firms on their domestic suppliers, through
professional societies, trade organizations, word-of-mouth, etc. Without this fourth
requirement, the spread of the management practice in later-adopting areas would be
limited to exporting firms, hence failing the depth requirement.
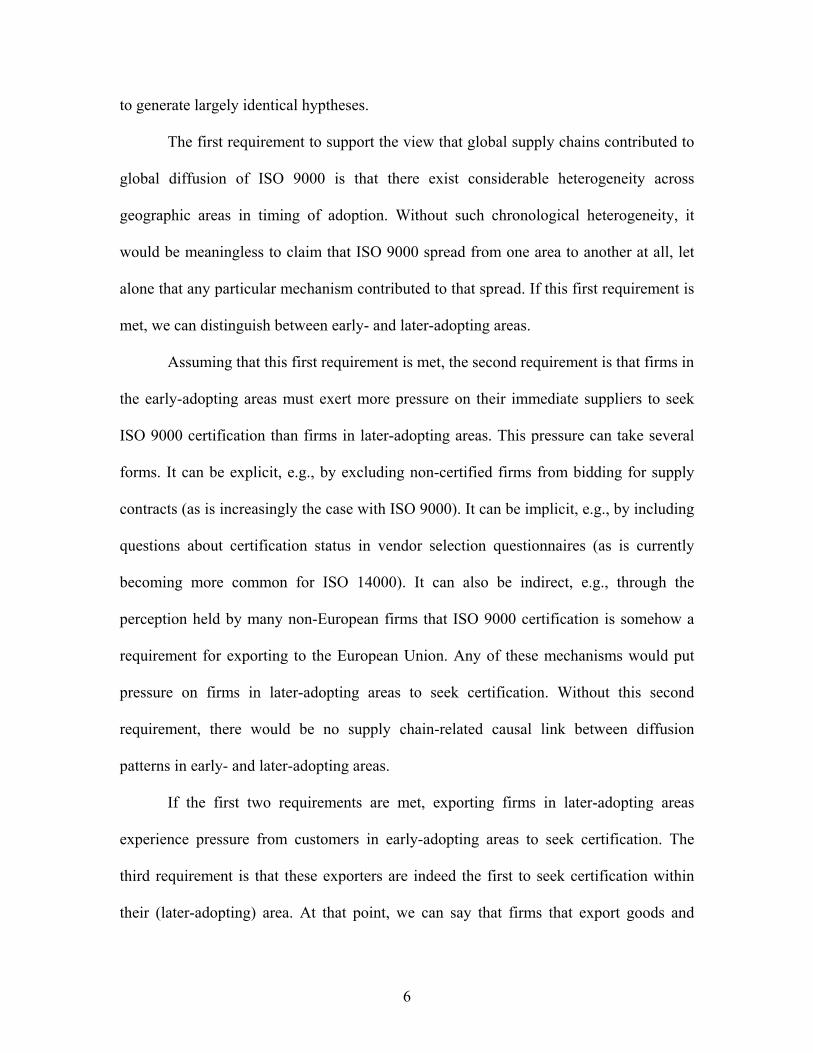
FIGURE 1 ABOUT HERE
If these four requirements are satisfied, one can conclude that global supply
chains contributed to global diffusion of ISO 9000, as depicted in Figure 1. Other factors
undoubtedly also contribute to global diffusion of ISO 9000; for instance, professional
societies and word-of-mouth also cross borders. However, if such traditional, single-
market diffusion mechanisms fully explained global diffusion of ISO 9000, several of the
four requirements above would not be met. Hence, these requirements form a concise and
falsifiable basis for testing whether global supply chains contributed to global diffusion
of ISO 9000.
Next, we present the data used in this study, after which we can reformulate the
7
four requirements as precise hypotheses to be tested.
4. Data
Data from several sources were used in this study. During 1997-1999 we conducted
open-ended interviews in Brazil, Japan, the Netherlands, Taiwan, Uruguay, and the US,
with firms with ISO 9000 and/or ISO 14000 certification, registrars, accreditation bodies
and government agencies. Corbett and Kirsch (2000, 2001) summarize the findings from
this phase. Certification levels by country for each year since 1993 were obtained from
ISO (ISO 2003).
Our main source of data is a mail survey, conducted in 17 countries. After
eliminating countries with insufficient responses, 9 countries remain: Australia/New
Zealand, Canada, France, Hong Kong, Japan, Korea, Sweden, Taiwan, and the US. In
each country, the survey was administered by local researchers; Harzing (1997) found
that such domestically-administered surveys achieve higher response rates. A pilot survey
among 200 US firms during the summer of 1999 yielded 23 responses. After slight
modification, the same survey form was used in all countries, translated by the local
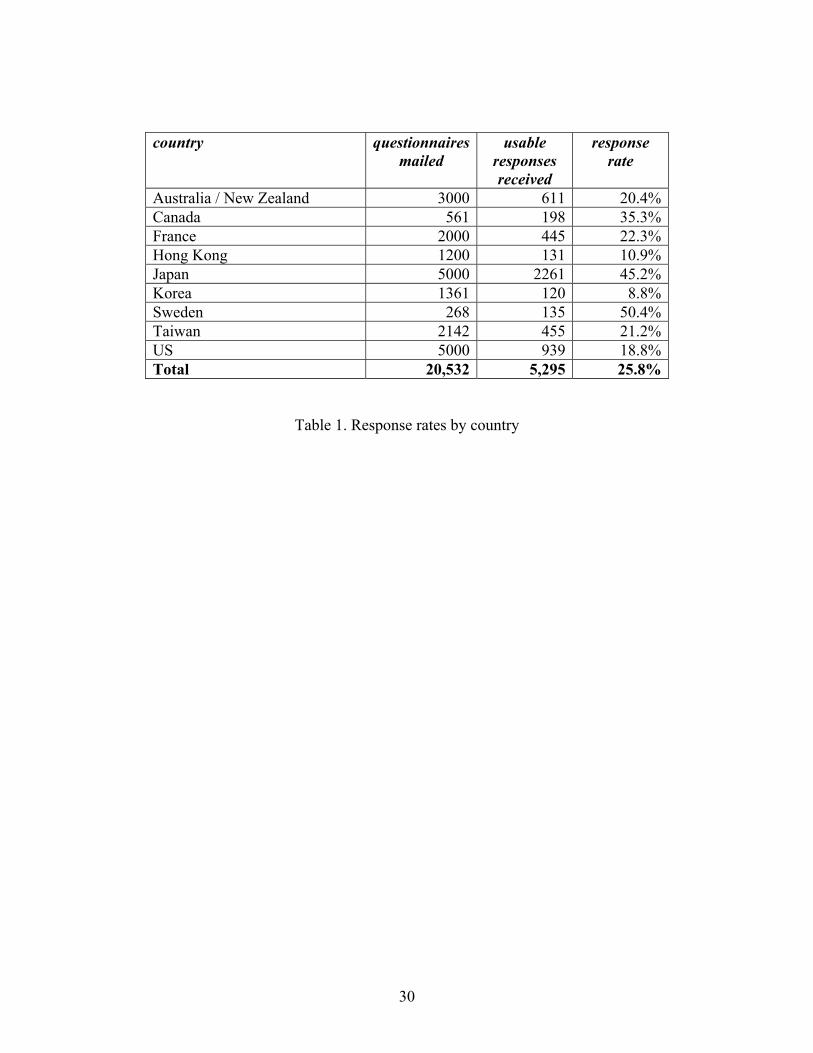
partner. In total, 5295 observations were used in this analysis. Response rates, shown in
Table 1, varied from 8.8% to 50.4%. These figures compare favorably with Harzing’s
(1997) finding that response rates for international mail surveys among an industrial
population are typically in the 6-16% range. The survey questions used here are shown in
Appendix B. In questions 6 and 7, it would be impossible to ask firms about customers in
each individual country, hence the aggregation into larger regions. The motivations
included in question 9b are based on findings from earlier surveys on ISO certification
8
(see the literature review) and on our interviews.
TABLE 1 ABOUT HERE
Care was taken to avoid the pitfalls of international mail surveys, discussed in
Singh (1995). These include country biases due to cultural differences in response
behavior or due to differences in sampling procedures. Some differences in sampling
procedures were inevitable, due to lack of national databases of ISO 9000 and/or ISO
14000 certifications. In the US, certification data were obtained from WorldPreferred in
Toronto. 5000 forms were mailed in Winter 2001, to all (approximately 1100) ISO 14000
certified firms and the remainder to randomly selected ISO 9000 certified firms.
Monetary and non-monetary incentives were used: a postcard from the author’s
university was included in the survey, to which a “golden dollar” US$1 coin was
attached, which presumably contributed to the relatively high 18.8% response rate. A
telephone follow-up among 100 non-respondents in November 2001 yielded 37
responses; these exhibited similar breakdown by industry and number of employees
worldwide as the original respondents, but had lower global sales. No material non-
response bias was found in the questions included in the follow-up, such as year of
certification and overall benefits of certification.
In Japan, national certification data were obtained from the Japan Accreditation
Board (JAB). A cover letter from JAB was included with the survey, but no incentive. In
France and Korea, addresses of certified companies were obtained from leading
registrars. In addition to being inevitable, Keon (1985) found that such flexibility in
sampling practices is in fact desirable.
We did notice some country biases; for instance, Taiwanese respondents reported
9

higher scores on all motivation and benefit categories than other respondents. To avoid
country bias, our analysis does not compare means across countries. Only in one instance
do we aggregate data across countries (Table 3), but there too we report separate results
by country (Table 4). Singh’s (1995) concern with separate analyses by country is that of
maintaining the overall Type-I error rate. This is not a problem in our case, as most of the
results are significant at the 1% or even stricter significance levels.
5. Methodology and results
Here we re-examine the four requirements for supply chains to have contributed to global
diffusion of ISO 9000, and discuss our methodology for testing each of these and the
results obtained. Throughout, “area” can refer to the specific countries in which the
survey was conducted, or to the geographic region to which the respondent firms export.
5.1. Requirement 1: heterogeneity across areas of timing of adoption
To assess the extent of adoption in a country at any given time, we would ideally
compare the number of certifications to the maximum number of potential certifications,
e.g., the number of establishments, but the latter data do not exist. Instead, we deflate
certification counts using GDP and population, both imperfect but the best available
measures for this purpose. GDP has been used as a deflator in Guler et al. (2000) and
Corbett and Kirsch (2001); however, this overcorrects in rich countries as the US and
Japan relative to developing countries. Deflating by population does the opposite,
overcorrecting in large developing countries such as China and India relative to small
rich countries.
10

Our data do not allow statistical tests of the relative timing of adoption, so our
discussion of the first requirement will necessarily be more qualitative than that of the
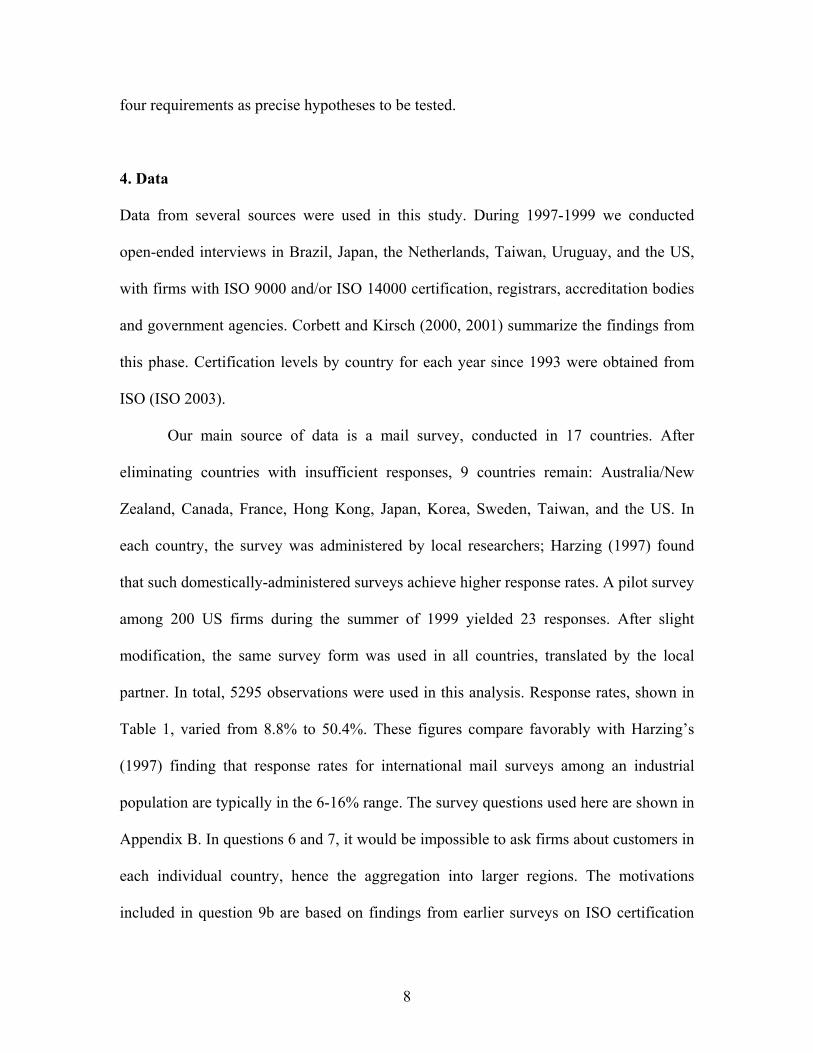
other three. Figure 2 shows the diffusion by region, starting in January 1993 with the
earliest existing data. At that time, ISO 9000 had existed for 7 years and had been
adopted by some 27,000 sites in 48 countries (ISO 2003). Visual inspection of Figure 2
mostly confirms the view that ISO 9000 first spread within Europe, with other areas
following later, regardless of whether one deflates by GDP or population. Using the GDP
deflator, Africa in 1993 appears not far below Europe, but the absolute numbers of
certifications are 825 and 23,092 respectively. In the hypotheses below, we therefore
classify Europe as the “early” region and the other regions as “later” adopters, consistent
with the view held widely among scholars and practitioners of ISO 9000 (e.g., Anderson
et al. 1999). We would prefer a more complete ordering of timing of adoption, but the
nature of the data does not allow that.
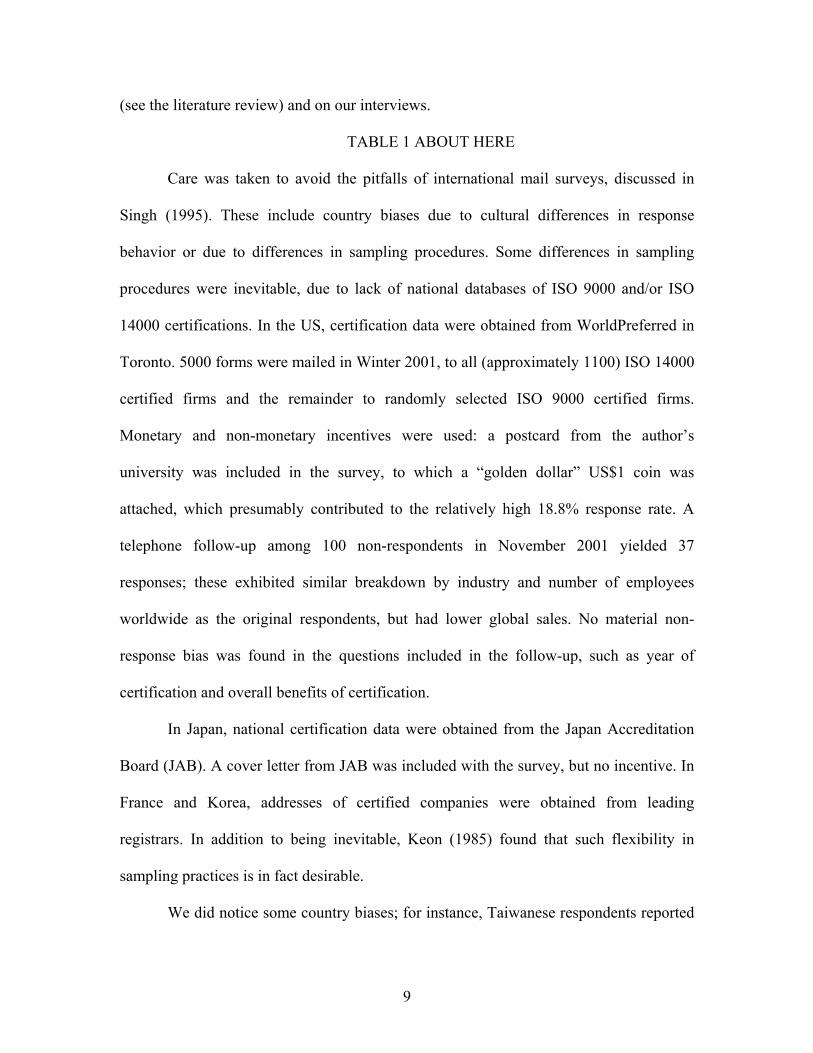
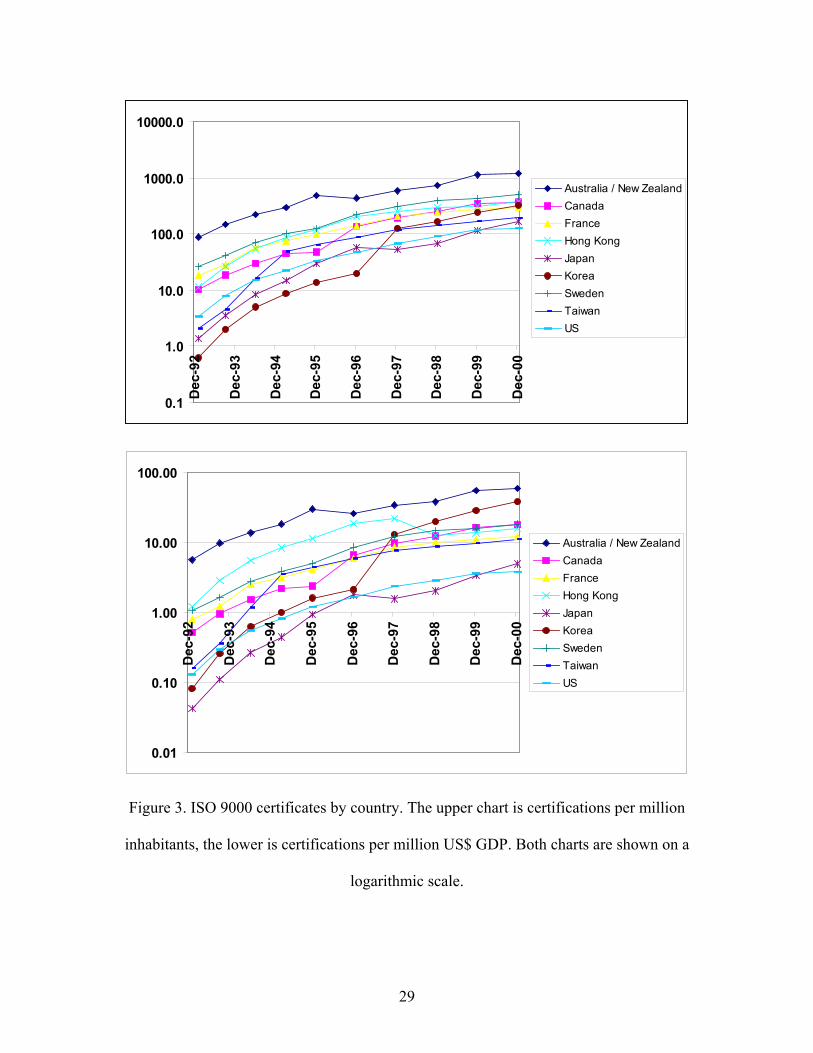
Similarly, Figure 3 indicates that Australia / New Zealand, Canada, France, Hong
Kong and Sweden were early-adopting countries, with Japan, Korea, Taiwan and the US
following later. (We consistently refer to “later-adopting” rather than “late-adopting” as
the survey does not include truly late-adopting countries.) This is again consistent with
expectations: the early-adopting countries are in Europe or have close ties to the UK,
where the BS 5750 standard, a partial predecessor of ISO 9000, was already well-
established when ISO 9000 was introduced (Guler et al. 2002).
FIGURES 2 AND 3 ABOUT HERE
The country-level and regional distinctions between early and later areas are
largely mutually consistent. Canada is classified as early, but is a relatively small part of
11
North America, a later-adopting region. Similarly, Australia / New Zealand and Hong
Kong, both early countries, are small relative to the rest of Asia, which adopted later. In
summary, Figures 2 and 3 show that the first requirement is met: there exists considerable
heterogeneity between areas with respect to timing of widespread adoption.
5.2. Requirement 2: firms in early-adopting regions exert more pressure
Having classified Europe as an early-adopting region and the rest as later-adopting, the
second requirement can be reformulated as follows:
Hypothesis R2: The proportion of customers in Europe requiring ISO 9000
certification is higher than that in other regions.
To test this, we use questions 6 and 7 in the survey. In order to exclude respondents with
insufficient knowledge about customers in any particular region A, we selected only
respondents for which region A was at least “moderately” important (see question 6);
other cutoff points gave similar results. For those respondents, we computed the mean for
question 7a, the proportion of customers in region A requiring ISO 9000 certification.
Table 2 shows the results by country and for the entire sample, where “1” means no
customers in that region require certification and “5” means that all customers do. In the
global sample and in 8 out of 9 countries, firms report that the proportion of customers in
Europe requiring certification is higher than that in other regions. For instance, in the
global sample, the mean for Europe is 3.46, so the proportion of customers requiring
certification lies between “some” (3) and “most” (4).
TABLE 2 ABOUT HERE
To test whether these differences are significant, we need nonparametric methods
12

as the responses to question 7a are not normally distributed. The appropriate test with
paired observations involves computing all pairwise differences between regions, for
each respondent, and then applying the one-sided Wilcoxon signed-rank test (Miller et al.
1999), in our case using PROC UNIVARIATE in SAS, to these differences.
TABLE 3 ABOUT HERE
For each pair of regions, Table 3 shows the mean difference in proportion of
customers from those regions requiring certification, using the pooled data across all
countries. For instance, respondents reported a 0.29 higher score for proportion of
customers in Europe than in North America requiring certification, and this is significant
with a p-value of 0.000. This difference of 0.29 between Europe and North America is
close to but not equal to the difference between the European mean of 3.46 and the North
American mean of 3.21 in Table 2, because the means in Table 2 are computed over all
respondents with sufficient exports to that one region (e.g., Europe) while the means in
Table 3 are taken over all firms with sufficient exports to both regions concerned (e.g.,
Europe and North America). From Table 3 we see that Europe has the highest proportion
of customers requiring ISO 9000 certification, followed by North America and Japan,
then Asia, South America and Africa.
Given the large sample size, finding highly significant differences between
regions is not surprising. More insightful is to compare the percentage of respondents
experiencing higher pressure from region A than region B with the percentage
experiencing higher pressure from region B than region A. For instance, 31.1% of
respondents with enough exports to both Europe and North America report a strictly
greater proportion of customers in Europe than in North America requiring ISO 9000
13

certification, and only 9.5% report the opposite. The same pattern is largely replicated
within each country, though due to the smaller sample sizes within countries, some
differences are no longer significant. Table 4 shows, for each country, which differences
are positive and significant at the 1% and 5% levels; Europe clearly still leads.
TABLE 4 ABOUT HERE
Overall, we find strong support for the hypothesis that a higher proportion of
customers from Europe require certification than from other regions.
5.3. Requirement 3: in later-adopting areas, firms with higher exports to early-adopting
areas adopt earlier
Our third and fourth requirements focus on countries in which diffusion started relatively
late, i.e, Japan, Korea, Taiwan and the US. Including the appropriate control variables,
requirement 3 becomes:
Hypothesis R3: in Japan, Korea, Taiwan and the US, firms with higher exports to
Europe certified earlier, after correcting for size and other exports.
Our dependent variable here is ISO9Year, the year of original certification for each
respondent. We get “Exports to Other Regions” by computing the mean of the responses
to question 6 over all regions except Europe. Controlling for size is slightly more
involved: questions 1 and 2 asked about employees and sales respectively, but many
respondents only answered one of the two questions, so that any analysis using the
original scores for questions 1 or 2 would miss many responses. We define a company as
“large” (Large = 1) if it has more than 1,000 employees worldwide (question 1b) or falls
within the top quartile (within its country) with respect to world sales (question 2b). This
14

new dummy variable exhibits high Spearman rank correlation with the two original size
variables, generally in the 0.75-0.85 range and always greater than 0.60, so it is an
acceptable proxy for size. Setting the cutoff point at 5,000 employees worldwide gives
similar results, as does the analysis based on either of the original variables but using less
observations.
Hypothesis R3 then predicts that ISO9Year is negatively associated with Exports
to Europe when correcting for size and exports to all other regions. In testing this, we
face two challenges. We need to allow for the possibility that there exist interactions
between firm size and each of the export variables, which would lead to nonequal slopes
for smaller and larger firms. We also need to incorporate the fact that ISO9Year is
truncated above (Maddala 1983, Section 6.9), as the data do not include certifications that
occurred after the survey was administered. No established estimation procedure takes
both of these issues into account, so we deal with them separately. We tested for
interactions using analysis of covariance (ANCOVA), using PROC GLM in SAS, but
only found a significant interaction effect in Japan, due to that country’s large sample.
This justifies focusing on the truncation problem while ignoring interaction effects.
Therefore we use the maximum likelihood estimator in PROC QLIM, setting the upper
truncation for each country equal to the year of its most recent certification in the survey.
TABLE 5 ABOUT HERE
Table 5 shows that Exports to Europe is significant at the 1% level in Japan,
Korea, and Taiwan, and at the 5% level in the US. This means that Exports to Europe are
a significant factor in explaining early adoption in all four later-adopting countries, after
correcting for size and exports to all other regions. There is of course substantial
15

correlation between Exports to Europe and Exports to Other Regions (the correlation
coefficients vary between 0.12 and 0.82); the consequence of multicollinearity is usually
to inflate the standard errors and hence reduce the significance of the parameter estimate.
Therefore, this correlation does not weaken the finding that Exports to Europe are
strongly significant. To avoid this correlation, we can combine Exports to Europe and
Exports to Other Regions into one single variable, Global Exports; this new variable is
significant at the 1% level for Japan, Taiwan, and the US but not significant for Korea.
Overall, this provides fairly strong support that the third requirement is met.
5.4. Requirement 4: in later-adopting countries, firms that adopt later are less motivated
by export-related factors
To examine this, we need to define “early” and “later” adopting firms. Firms with
certification year in the first quartile within each country are defined as “early” adopters,
the rest as “later” adopters. (Using the 10th percentile or the median as the cutoff point
gave similar results.)
Question 9b asked about motivations for certification. The motivation that
explicitly addresses exports is “avoid potential export barrier”. The hypothesis
corresponding to our fourth requirement is then:
Hypothesis R4: in Japan, Korea, Taiwan and the US, firms that adopt later are
less motivated by export protection than are earlier adopters.
A bias would occur if early adopters reported higher scores for all motivations; therefore,
we normalize each motivation score by dividing it by the sum over all 11 motivation
factors. Let be respondent i’s score for motivation k; the relative score for ik)(MOT
16
motivation k is ∑ ==
11
1)(MOT/)(MOT:)(RELMOT
j jii kkk . The normalized variable for
the export motivation is RELMOTEXP. (Using the raw scores does give similar results.)
The test is now whether, in the four later-adopting countries, firms classified as
early adopters have higher scores for RELMOTEXP than later adopters. The “customer
pressure” motivation factor (RELMOTCUST) does not distinguish between domestic and
foreign customers, so our set of requirements does not predict how the importance of this
factor differs between early and late adopters.
The normalized motivation scores are not normally distributed, so we apply
nonparametric ANOVA, using the one-sided Wilcoxon two-sample test in PROC
NPAR1WAY in SAS. Note that MANOVA is not appropriate here as we are interested in
the effect of early adoption on individual motivation factors, not on all motivations
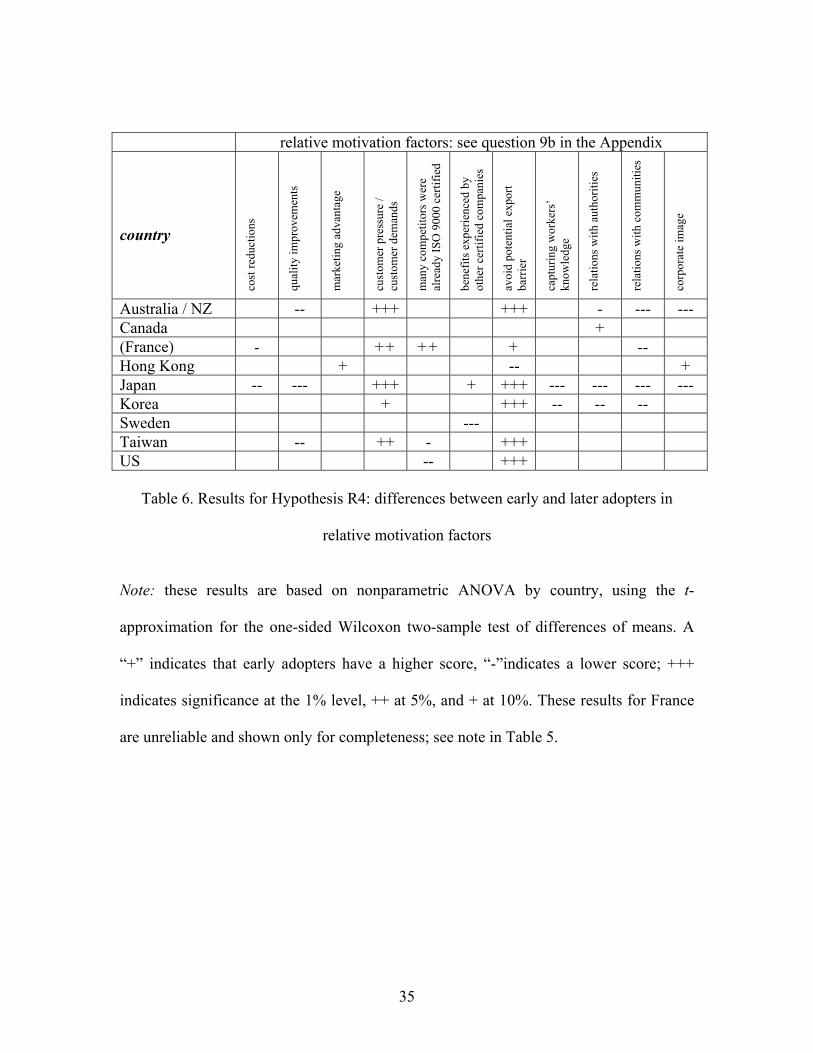
jointly. Table 6 shows significant differences (at the 1% level) in RELMOTEXP between
early and later adopters in the expected direction in all four later-adopting countries (and
in Australia / New Zealand). This is not a mere sample size effect: in Japan, for instance,
almost any difference would be significant due to the large sample, but the magnitude of
the difference is also larger than for most other motivations. Table 6 also shows that
export protection is the only motivation that strongly distinguishes early and later
adopters in the four later-adopting countries, providing support for hypothesis R4.
TABLE 6 ABOUT HERE
6. Discussion, conclusions and future research
Our findings can be summarized as follows. Diffusion of ISO 9000 started (primarily) in
Europe. From there, it spread to other countries, as customers in Europe pressured foreign
17

suppliers to seek ISO 9000 certification. Those suppliers in other countries then sought
certification as protection against the perceived threat of ISO 9000 becoming an export
barrier. After exporting firms in other countries had adopted the standard, domestic
diffusion by traditional mechanisms picked up, and other firms in those countries started
adopting ISO 9000 too, resulting in over 560,000 certifications in 159 countries. The
findings in this paper suggest that at least part of those certifications can be explained by
pressure exerted by downstream customers through global supply chains on upstream
firms in other countries. This implies that firms exporting goods or services into a region
may also simultaneously import management practices from that region back into their
home country.
This paper contributes to the literature on global diffusion, by explicitly
examining the role of supply chains in explaining global diffusion of management
practices, and by formulating precise requirements for claiming that supply chains
contribute to global diffusion. This paper also contributes to the literature on management
practices, and on ISO 9000 and ISO 14000 in particular, by testing hypotheses derived
from these requirements and showing that ISO 9000 did diffuse worldwide through
global supply chains.
This study has several inevitable limitations. It does not include truly late-
adopting countries; attempts were made to administer the survey in Argentina and
Mexico but both were unsuccessful. The survey, administered around 2000, is an
imperfect way of obtaining information about motivations for certifications that occurred
long before; however, the bulk of all certifications, including those in early-adopting
countries, occurred in the mid- to late-1990s, which partially mitigates this problem.
18
Despite these and other limitations which are inherent in survey research, two factors do
lend additional credibility to the results. First is their face validity: the picture that
emerges from this analysis is consistent with anecdotal views of global diffusion of ISO
9000. Second is their robustness: each of the tests reported here was performed in several
different ways, without leading to substantially different results.
This study has only examined ISO 9000, so we cannot conclude that other
management practices diffuse through global supply chains too. Documenting similar
findings for ISO 14000 and other practices is necessary to assess the generalizability of
our findings beyond ISO 9000. However, this author’s original interest was in ISO
14000, the environmental management systems standard introduced in 1996 and adopted
by almost 50,000 sites in 118 countries (ISO 2003). It is too early to determine
conclusively what drives global diffusion of ISO 14000, but the design of the ISO 14000
standards is analogous to that of ISO 9000, even though its scope is different. If one can
demonstrate that an environmental management practice as ISO 14000 diffuses through
global supply chains, that would imply that the notion of “greening the supply chain” is
indeed a feasible mechanism for spreading environmental practices to other countries.
The current study cannot answer that question for ISO 14000, but will hopefully
contribute indirectly to that debate by showing that this mechanism did occur for ISO
9000.
19

Appendix A: relating our framework to the Bass diffusion model
The Bass (1969) diffusion model relates tN∆ , the number of new adoptions in period t ,
to cumulative past adoptions through the following relationship: 1−tN
( 11
1: −−
− −
+=−=∆ t
tttt NM
MNbaNNN ) (1)
where M is the saturation level, a constant diffusion rate and the coefficient of the
imitation effect. According to this model, any firm deciding to adopt is partly motivated
by a constant effect and partly by an effect b which becomes stronger as diffusion is
more widespread. This model gives rise to the classic S-shaped diffusion curve.
a b
a
To model a global diffusion process, one could attach a country index i to all
variables in (1), estimate the resulting diffusion curves, and compare the resulting
coefficients , and across countries. This is the approach taken in Lücke (1996).
To explicitly capture diffusion across
ia ib iM
K countries, we can use the following adaptation:
( 1,1
1,1,: −
=
−− −
+=−=∆ ∑ tii
K
j j
tjijitiitit NM
MN
baNNN ) (2)
New adoptions in country i in period depend on the constant diffusion rate and the
domestic imitation effect , but also on
t ia
iti MN /1, −iib jij tjij MNb /1,∑ ≠ − where b denotes
the influence of country
ij
j on country . This is analogous to the multi-product diffusion
model in Bayus et al. (2000).
i
Expression (2) implies that the effect of country j on country becomes stronger
with the penetration level in country
i
j , resembling our second requirement. In later-
adopting countries, in the early years, the domestic imitation effect is small iti MNb /1, −ii
20

compared to the cross-country effect ∑ = −R
r rtrir MNb1 1, /
N
as, by definition, is
small relative to at least some of the other countries’ . Over time
may catch up with , so that the domestic imitation effect gains strength relative
to the cross-country effect. Therefore, in countries in which diffusion started late, the
cross-country effect should play a larger role for early-adopting firms than for later-
adopting firms. This is consistent with our third and fourth requirements, where exports
are the cross-country effect.
iti MN /1, −
ti MN /1, −rtr M/1, − i
rtr MN /1, −
Appendix B: excerpts from questionnaire used
1. How many employees work at your company, at the same facility as you? And how many
work at your company, counting all locations worldwide?
1a. At your facility:
1: 1 – 19
2: 20 – 99
3: 100 - 499
4: 500 - 999
5: 1000 – 4,999
6: 5,000 -24,999
7: 25,000 or more
1b. Worldwide:
1: 1 – 19
2: 20 – 99
3: 100 - 499
4: 500 - 999
5: 1000 – 4,999
6: 5,000 -24,999
7: 25,000 or more
2. Please estimate the total annual sales generated by your facility and the total global
annual sales of your company, in US$. Total annual sales at your facility (US$):
Total global, annual sales of your entire company (US$):
6. Please tell us where your immediate customers are located, by indicating how important
sales in each of the following geographic regions are for your company. not at all
important not important moderately
important important very important
North America 1 2 3 4 5 South America 1 2 3 4 5 Europe 1 2 3 4 5 Africa 1 2 3 4 5 Australia / New Zealand 1 2 3 4 5 Japan 1 2 3 4 5 Asia (except Japan) 1 2 3 4 5
21

7a. Please indicate how many customers in each of the following regions require ISO 9000
certification or are expected to do so soon. proportion of customers requiring ISO 9000
(now or in near future) no
customers in this region
none few some most all
North America 0 1 2 3 4 5 South America 0 1 2 3 4 5 Europe 0 1 2 3 4 5 Africa 0 1 2 3 4 5 Australia / New Zealand 0 1 2 3 4 5 Japan 0 1 2 3 4 5 Asia (except Japan) 0 1 2 3 4 5
9b. Please indicate how important each of the following reasons was for seeking, maintaining, or seriously considering ISO 9000 certification. (If you do not have ISO 9000 certification and are not considering it, please do not answer this question.) not
important at all
not important
somewhat important
important
extremely important
cost reductions 1 2 3 4 5 quality improvements 1 2 3 4 5 marketing advantage 1 2 3 4 5 customer pressure / customer demands 1 2 3 4 5 many competitors were already ISO 9000 certified 1 2 3 4 5 benefits experienced by other certified companies 1 2 3 4 5 avoid potential export barrier 1 2 3 4 5 capturing workers’ knowledge 1 2 3 4 5 relations with authorities 1 2 3 4 5 relations with communities 1 2 3 4 5 corporate image 1 2 3 4 5
Acknowledgements
The author is deeply grateful to the partners in this global survey for administering the
survey in their respective countries: Mile Terziovski, Rob Klassen, Olivier Aptel, TY
Lee, Kazuhiro Asakawa, Phares Parayno, Carlos Romero, Hosun Rhim, and Jens
Dahlgaard. I am particularly grateful to Jack Pan for his assistance in developing the
survey and administering it in Taiwan, and to David Kirsch for many discussions on
related subjects and for suggesting the “golden dollar” incentive. I am also grateful to
Anastasia Luca and Maria J. Montes for their research assistance and to Theresa Jones
22

and Susana Medina for their assistance in administering the survey, and to
WorldPreferred for providing the database of US certifications. Thanks are also due to
the UCLA Pacific Rim Research Program, CIBER at the UCLA Anderson School of
Management, to ISO, and the James Peters Research Fellowship for their financial
support.
References
Abrahamson, E. 1991. Managerial Fads and Fashions: The Diffusion and Rejection of
Innovations. Academy of Management Review 16 (3) 586-612.
Anderson, S.W., J.D. Daly and M.F. Johnson. 1999. Why Firms Seek ISO 9000
Certification: Regulatory Compliance or Competitive Advantage? Production and
Operations Management 8 (1) 28-43.
Bass, F.M. 1969. A New Product Growth Model for Consumer Durables. Management
Science 15 (5) 215-227.
Bayus, B.L., N. Kim and A.D. Shocker. 2000. Growth Models for Multiproduct
Interactions: Current Status and New Directions. Chapter 7 in Mahajan, V., E. Muller and
Y. Wind (eds.), New-Product Diffusion Models, Kluwer Academic Publishers, Boston.
Brown, A., T. van der Wiele and K. Loughton. 1998. Smaller enterprises’ experiences
with ISO 9000. Int.l Journal of Quality & Reliability Management 15 (3) 273-285.
Christmann, P. and G. Taylor. 2001. Globalization and the Environment: Determinants of
Firm Self-Regulation in China. Journal of International Business Studies 32 (3) 439-458.
23

Corbett and D.A. Kirsch. 2000. ISO 14000: An Agnostic’s Report from the Frontline.
ISO 9000 + ISO 14000 News 9 (2) 4-17.
Corbett and D.A. Kirsch. 2001. International Diffusion of ISO 14000 Certification.
Production and Operations Management 10 (3) 327-342.
Dekimpe, M., P.M. Parker and M. Sarvary. 2000a. Global Diffusion of Technological
Innovations: A Coupled-Hazard Approach. Journal of Marketing Research, 37.
(February) 47-59.
Dekimpe, M.G., P.M. Parker and M. Sarvary. 2000b. Multimarket and Global Diffusion.
Chapter 3 in Mahajan, V., E. Muller and Y. Wind (eds.), New-Product Diffusion Models,
Kluwer Academic Publishers, Boston.
Delmas, M.A.. 2002. The Diffusion of Environmental Management Standards in Europe
and in the United States: An Institutional Perspective. Policy Sciences, 35, 91-119.
Delmas, M.A. 2003. In Search of Iso: An Institutional Perspective On The Adoption Of
International Management Standards. Institute for Social, Behavioral, and Economic
Research. ISBER Publications. Paper 2. http://repositories.cdlib.org/isber/publications/2
Dowell, G., S. Hart and B. Yeung. 2000. Do Corporate Global Environmental Standards
Create or Destroy Market Value? Management Science 46 (8) 1059-1074.
Guler, I., M.F. Guillén, and J.M. MacPherson. 2002. Global Competition, Institutions,
and the Diffusion of Organizational Practices: The International Spread of ISO 9000
Quality Certificates. Administrative Science Quarterly 47 (2) 207-232.
Harzing, A.-W. 1997. Response Rates in International Mail Surveys: Results of a 22
Country Study. International Business Review 6 (6) 641-665.
ISO. 2003. The ISO Survey of ISO 9000 and ISO 14001 Certificates: Twelfth Cycle: up
24

to and including 31 December 2002. Available at www.iso.ch.
Keown, C.F. 1985. Foreign Mail Surveys: Response Rates Using Monetary Incentives.
Journal of International Business Studies 16 (3) 151-154.
Lee, T.Y. 1998. The development of ISO 9000 certification and the future of quality
management: A survey of certified firms in Hong Kong. International Journal of Quality
& Reliability Management 15 (2) 162-177.
Lücke, M.. 1996. Diffusion of Innovations in the World Textile Industry. Journal of
Economic Development 21 (2) 121-135.
Maddala, G.S. 1983. Limited-Dependent and Qualitative Variables in Econometrics.
Cambridge University Press, Cambridge, UK.
Mendel, P.J. 2001. International Standardization and Global Governance: The Spread of
Quality and Environmental Management Standards. In Hoffman, A. and M. Ventresca
(eds.), Organizations, Policy, and the Natural Environment: Institutional and Strategic
Perspectives, Stanford University Press.
Miller, I., M. Miller and J.E. Freund. 1999. John E. Freund’s Mathematical Statistics.
Prentice-Hall.
Naveh, E. and A. Marcus. 2000. Implementation of A Management Practice:
Assimilation and Going Beyond. Manuscript.
Naveh, E., A. Marcus and H.K. Moon. 2000. Implementing A Managerial Practice:
Advantage to First and Second Movers. Manuscript.
Scott, W. Richard. 1995. Institutions and Organizations: Theories and Research.
London: Sage.
Singh, J. 1995. Measurement Issues in Cross-National Research. Journal of International
25
Business Studies 26 (3) 597-619.
Teece, D. 1980. The Diffusion of an Administrative Innovation. Management Science 26
(5) 464-470.
Terlaak, A. and A.A. King. 2001. Contrasting Institutional and Game theoretic models to
explain the Adoption Process of an industry Standard. Manuscript.
Terziovski, M., D. Samson and D. Dow. 1996. The business value of quality management
systems certification: Evidence from Australia and New Zealand. Journal of Operations
Management 15 August 1-18.
Venkatraman, N., L. Loh and Jeongsuk Koh. 1994. The Adoptions of Corporate
Governance Mechanisms: A Test of Competing Diffusion Models. Management Science
40 (4) 496-507.
26

later-adopting area early-adopting area
exporter customerotherfirms
importingmanagement
practices(breadth ofdiffusion):through
supply chains
spreadingmanagement
practices(depth of diffusion):
through supplychains, and other
diffusion mechanisms
R1: there exist early-adoptingand later-adopting areas
R2: customers in early-adopting areas exert
more pressure ontheir suppliers to
adopt the practicethan customers in
later-adopting areas
exportinggoods andservices
R3: in later-adoptingcountries, exporting
firms adopt earlier thannon-exporting firms
R4: in later-adoptingcountries, the practicespreads to other firms
through traditionaldiffusion mechanisms
Figure 1. Global diffusion of ISO 9000 through supply chains
27

0.01
0.10
1.00
10.00
100.00
Dec-92
Dec-93
Dec-94
Dec-95
Dec-96
Dec-97
Dec-98
Dec-99
Dec-00
EuropeJapanNorth AmericaSouth AmericaAsia w/o JapanAfrica
0.01
0.1
1
10
100
1000
Dec-92
Dec-93
Dec-94
Dec-95
Dec-96
Dec-97
Dec-98
Dec-99
Dec-00
EuropeJapanNorth AmericaSouth AmericaAsia w/o JapanAfrica
Figure 2. ISO 9000 certificates by region. The upper chart is certifications per million
inhabitants, the lower is certifications per million US$ GDP. Both charts are shown on a
logarithmic scale.
28
0.1
1.0
10.0
100.0
1000.0
10000.0
Dec-92
Dec-93
Dec-94
Dec-95
Dec-96
Dec-97
Dec-98
Dec-99
Dec-00
Australia / New ZealandCanadaFranceHong KongJapanKoreaSwedenTaiwanUS
0.01
0.10
1.00
10.00
100.00
Dec-92
Dec-93
Dec-94
Dec-95
Dec-96
Dec-97
Dec-98
Dec-99
Dec-00
Australia / New ZealandCanadaFranceHong KongJapanKoreaSwedenTaiwanUS
Figure 3. ISO 9000 certificates by country. The upper chart is certifications per million
inhabitants, the lower is certifications per million US$ GDP. Both charts are shown on a
logarithmic scale.
29
country questionnaires mailed
usable responses received
response rate
Australia / New Zealand 3000 611 20.4%Canada 561 198 35.3%France 2000 445 22.3%Hong Kong 1200 131 10.9%Japan 5000 2261 45.2%Korea 1361 120 8.8%Sweden 268 135 50.4%Taiwan 2142 455 21.2%US 5000 939 18.8%Total 20,532 5,295 25.8%
Table 1. Response rates by country
30

customer region
respondent countries:
Europe
Japan
North America
South America
Asia w/o Japan
Africa
Australia / New Zealand
2.90 (1.52)
2.57 (1.46)
2.60 (1.55)
2.26 (1.29)
2.95 (1.22)
1.72 (0.89)
Canada 3.93 (1.09)
3.41 (1.24)
3.48 (1.23)
2.73 (1.35)
2.98 (1.31)
2.36 (1.22)
France 3.06 (1.24)
3.11 (1.62)
2.99 (1.45)
2.81 (1.33)
2.80 (1.35)
n/a
Hong Kong 3.58 (0.84)
2.93 (1.28)
2.67 (1.19)
2.25 (0.89)
3.39 (1.02)
2.00 (0.82)
Japan 3.51 (0.99)
3.20 (0.86)
3.14 (1.01)
2.65 (0.91)
2.78 (0.93)
n/a
Korea 4.07 (0.93)
3.79 (1.06)
3.84 (1.07)
3.18 (1.07)
3.62 (1.02)
2.93 (1.10)
Sweden 3.60 (1.00)
3.08 (1.36)
2.88 (1.49)
3.00 (1.39)
2.88 (1.33)
2.36 (1.28)
Taiwan 3.93 (1.15)
3.71 (1.25)
3.61 (1.25)
3.20 (1.30)
3.36 (1.14)
2.52 (1.17)
US 3.48 (1.31)
2.99 (1.35)
3.20 (1.20)
2.63 (1.30)
2.81 (1.32)
2.42 (1.21)
Global 3.46 (1.20)
3.20 (1.02)
3.21 (1.21)
2.73 (1.21)
2.97 (1.16)
2.40 (1.18)
Table 2. Hypothesis R2: proportion of customers in different regions requiring
certification, by country
Note: the first number in each cell indicates the mean proportion of customers from the
column region requiring respondents in the row country to seek certification; the second
number (between brackets) is the standard deviation. Tables 3 and 4 show results of tests
for differences between regions. The French and Japanese surveys omitted Africa from
the list of regions.
31

Europe
Japan
N.Am.
S.Am.
Asia w/o Japan
Africa
Europe
0.28 0.000
30.1%
0.29 0.000
31.1%
0.85 0.000
54.7%
0.56 0.000
45.0%
1.21 0.000
60.8% Japan
-0.28 0.000
12.0%
0.04 0.093
25.2%
0.54 0.000
43.9%
0.33 0.000
37.8%
0.71 0.000
43.0% N.Am.
-0.29 0.000 9.5%
-0.04 0.093
19.8%
0.51 0.000
41.7%
0.20 0.000
30.8%
0.74 0.000
48.2% S.Am.
-0.85 0.000 3.2%
-0.54 0.000 7.3%
-0.51 0.000 4.7%
-0.36 0.000 9.5%
0.32 0.000
25.9% Asia w/o Japan
-0.56 0.000 6.6%
-0.33 0.000
10.1%
-0.20 0.000
16.6%
0.36 0.000
34.5%
0.72 0.000
46.3% Africa
-1.21 0.000 1.1%
-0.71 0.000 4.8%
-0.74 0.000 5.7%
-0.32 0.000 5.7%
-0.72 0.000 1.5%
Table 3. Hypothesis R2: mean difference for question 7a, global data
Note: the first number in each cell indicates the mean difference (row minus column); the
second gives the p-value for the two-sided Wilcoxon signed-rank test; the third number
indicates the percentage of respondents reporting a strictly higher score for the row
region than for the column region. For instance, firms with sufficient exports to Europe
and North America reported a higher proportion of European customers requiring ISO
9000 certification; the mean difference between scores for question 7a for Europe and
North America was 0.29. 31.1% of those respondents reported a strictly higher score for
Europe, 9.5% reported a strictly higher score for North America. The number of
observations used for each comparison depends on the number of firms with sufficient
exports to both regions, but was always between 165 and 1461, hence the high degrees of
significance.
32

Europe
Japan
N.Am.
S.Am.
Asia w/o Japan
Africa
Europe
C,J,S,U T
A,F,J,S,T,U, C
C,F,J,K,S,T,U, H
C,F,J,S,T,U C,K,S,T,U
Japan
J J,K,T,U C,S
C,J K,T,U
N.Am.
U C,J,K,T,U S
C,J,U
K,T,U C
S.Am.
T,U
Asia w/o Japan
A H
A H
A,J,K,T,U F,H
A,K,T,U S
Africa
Table 4. Results for Hypothesis R2: significant differences for question 7a, by country
Note: if respondents in country i report a significantly higher proportion of customers in
region A requiring certification than in region B, that country’s letter is entered in row A,
column B. For instance, the entry “K,T,U” in Japan/Africa indicates that among Korean,
Taiwanese and US respondents the average response for Japan was significantly higher
than that for Africa. This uses the one-sided Wilcoxon signed-rank test at the 5% (italics)
and 1% (bold italics) significance levels. In many cases, a positive difference was not
significant as too few respondents in country i had sufficient exports to both region A and
B to be included. Europe clearly dominates, followed by North America, Japan and Asia,
followed by South America and Africa.
33

country N intercept Large Exports to Europe Exports to Other
Regions estimate p-value estimate p-value estimate p-value estimate p-value Australia/NZ 576 1996 *** <0.0001 -1.28 *** <0.0001 -0.02 0.8800 -0.11 0.6328
Canada 181 1998 *** <0.0001 -1.79 *** 0.0019 -0.09 0.6990 -0.44 0.3769
(France) 424 2013 *** <0.0001 -2.27 *** 0.0025 -1.47 *** 0.0060 -2.61 *** <.0001
Hong Kong 112 2001 *** <0.0001 -4.82 *** <0.0001 0.93 0.1179 -1.06 0.3618
Japan 2164 2004 *** <0.0001 -2.14 *** <0.0001 -0.58 *** <0.0001 -1.04 *** <0.0001
Korea 111 1997 *** <0.0001 -1.74 *** 0.0012 -0.59 *** 0.0095 0.52 0.2190
Sweden 133 2001 *** <0.0001 -2.96 *** 0.0002 -0.50 0.4900 -0.06 0.3870
Taiwan 434 1997 *** <0.0001 -0.67 *** 0.0023 -0.32 *** 0.0027 -0.29 0.2476
US 891 1998 *** <0.0001 -0.94 *** <0.0001 -0.18 ** 0.0178 -0.22 ** 0.0415
Table 5. Results for Hypothesis R3: explaining year of adoption
Note: these results are maximum likelihood estimates for the truncated regression by
country. Significance at the 1% level is shown by ***, at the 5% level by **. The figures
for France are not reliable, as some respondents may have reported the most recent
recertification rather than the year of original certification. As firms must recertify to ISO
9000 every three years, we may not observe the year of the original certification but only
that of the most recent re-certification, leading to a potential misclassification of some
firms into early and late adopters. However, as hypotheses R3 and R4 focus on later-
adopting countries, the results for (early-adopting) France do not affect our conclusion in
support of hypotheses R3 and R4. Note also that the classification of France as an early-
adopting country was based on national certification data, not on the survey data. The
data for France are shown only for completeness.
34
relative motivation factors: see question 9b in the Appendix country co
st re
duct
ions
qual
ity im
prov
emen
ts
mar
ketin
g ad
vant
age
cust
omer
pre
ssur
e /
cust
omer
dem
ands
man
y co
mpe
titor
s wer
e al
read
y IS
O 9
000
certi
fied
bene
fits e
xper
ienc
ed b
y ot
her c
ertif
ied
com
pani
es
avoi
d po
tent
ial e
xpor
t ba
rrie
r
capt
urin
g w
orke
rs’
know
ledg
e
rela
tions
with
aut
horit
ies
rela
tions
with
com
mun
ities
corp
orat
e im
age
Australia / NZ -- +++ +++ - --- --- Canada + (France) - ++ ++ + -- Hong Kong + -- + Japan -- --- +++ + +++ --- --- --- --- Korea + +++ -- -- -- Sweden --- Taiwan -- ++ - +++ US -- +++
Table 6. Results for Hypothesis R4: differences between early and later adopters in
relative motivation factors
Note: these results are based on nonparametric ANOVA by country, using the t-
approximation for the one-sided Wilcoxon two-sample test of differences of means. A
“+” indicates that early adopters have a higher score, “-”indicates a lower score; +++
indicates significance at the 1% level, ++ at 5%, and + at 10%. These results for France
are unreliable and shown only for completeness; see note in Table 5.
35


![Welcome [cicc.or.jp]cicc.or.jp/japanese/hyoujyunka/pdf_ppt/04SEbangladesh.slide.pdf · ¾Bangladesh has already adopted ISO 9000, ISO 14000, HACCP and many other international standards,](https://static.fdocuments.in/doc/165x107/5e7e97ec6f2d5e4fef3b2170/welcome-ciccorjpciccorjpjapanesehyoujyunkapdfppt-bangladesh-has.jpg)