Development of the Access System for Offshore Wind Turbines
205
Ampelmann Development of the Access System for Offshore Wind Turbines Proefschrift ter verkrijging van de graad van doctor aan de Technische Universiteit Delft, op gezag van de Rector Magnificus prof. ir. K.C.A.M. Luyben in het openbaar te verdedigen ten overstaan van een commissie, door het College voor Promoties aangewezen, op donderdag 7 oktober 2010 te 15:00 uur door David Julio CERDA SALZMANN Civiel ingenieur geboren te Antofagasta, Chili
-
Upload
omar-eladel-mahmoud -
Category
Documents
-
view
61 -
download
6
description
PhD Thesis
Transcript of Development of the Access System for Offshore Wind Turbines

Ampelmann
Development of the Access System for Offshore Wind Turbines
Proefschrift
ter verkrijging van de graad van doctor aan de Technische Universiteit Delft,
op gezag van de Rector Magnificus prof. ir. K.C.A.M. Luyben in het openbaar te verdedigen ten overstaan van een commissie,
door het College voor Promoties aangewezen, op donderdag 7 oktober 2010 te 15:00 uur
door
David Julio CERDA SALZMANN
Civiel ingenieur geboren te Antofagasta, Chili

Dit proefschrift is goedgekeurd door de promotoren: Prof. ir. J. Meek Prof. dr. ir. G.A.M. van Kuik Samenstelling promotiecommissie: Rector Magnificus voorzitter Prof. ir. J. Meek Technische Universiteit Delft, promotor Prof. dr. ir. G.A.M. van Kuik Technische Universiteit Delft, promotor Prof. dr. ir. R.H.M. Huijsmans Technische Universiteit Delft Prof. J.D. Sørensen, PhD Aalborg University Denmark Dr. ir. J. van der Tempel Technische Universiteit Delft Dr. ir. F.E.H.M. Smulders Technische Universiteit Delft T. Corrigan, MSc. Lloyd’s Register, London The research described in this thesis is part of the project PhD@Sea, funded by the We@Sea programme of the We@Sea consortium (http://www.we-at-sea.org) within the framework of the BSIK-programme (BSIK03041) of the Dutch government. Published and distributed by the author in cooperation with: Published by: Uitgeverij BOXPress, Oisterwijk Printed by: Proefschriftmaken.nl || Printyourthesis.com ISBN 978-90-8891-194-1 Copyright © 2010 David Cerda Salzmann No part of this book may be reproduced in any form, by print, copy or in any other way without prior written permission from the author
Offshore Engineering Stevinweg 1
2628 CN Delft +31 15 278 4758
www.offshore.tudelft.nl
DUWIND Kluyverweg 1 2629 HS Delft
+31 15 278 5170 www.duwind.tudelft.nl
i
Acknowledgements A very large number of people and companies were involved in the scale model tests
and the development and testing of the Ampelmann Demonstrator. All are thanked sincerely for contributing their knowledge, skills and enthusiasm, without which this project would have been impossible.
For the completion of this thesis I would like to thank first of all Jan van der Tempel
for providing the PhD position, the Ampelmann idea and solid guidance throughout these amazing years. My doctorate supervisors Gijs van Kuik and Jan Meek are acknowledged for their outstanding efforts of leading me towards the completion of this work. Frederik Gerner and Arjan Göbel, first two excellent students, now my respected colleagues, are thanked for all the hard work that made the Ampelmann Demonstrator a success. Joke Baan and Sylvia Willems are thanked for the support I could always count on. My fellow PhD students Wybren de Vries and Niels Diepeveen are acknowledged for their scientific support. I would like to thank Peter Albers and Kees van Beek whose superb expertise made so much more possible. We@Sea, Smit, Shell WindEnergy, SMST and iXSea are acknowledged for their support and belief in the Ampelmann concept. Finally, I would like to thank my girlfriend Sandra for her love and support.

ii

iii
Summary During the last decades renewable sources of energy have become increasingly
important as an alternative to fossil fuels. Amongst the different renewable sources, wind has emerged as a cost effective alternative source and the wind industry has become a large international business. Wind turbines are increasingly being placed offshore where wind conditions are generally more beneficial. As a downside, however, offshore wind farms are more expensive in terms of investment costs as well as operation and maintenance (O&M) costs when compared to application on land. Meanwhile, offshore wind farms are being erected farther offshore where environmental conditions are rougher. This creates an additional challenge for O&M, since the currently applied method to access these wind turbines is ship-based (ship bow to ladder on wind turbine) and only allows for safe transfers in mild wave conditions, up to a significant wave height (HS) of approximately 1.5m. As a result, offshore wind farms in rough wave climates will encounter decreased accessibility which in turn will lead to long downtimes and loss of revenue.
The accessibility of offshore wind turbines can be significantly increased if safe access
is enabled in wave conditions with a significant wave height of up to approximately 2.5m. Such increased accessibility does require a novel access system. The new system proposed in this thesis is named “Ampelmann” and enables safe transfer of personnel and goods by providing a motionless transfer deck on a vessel. This deck is mounted on top of a so-called Stewart platform which is often used for flight simulators and can provide motions in all six degrees of freedom using six hydraulic cylinders. Such a Stewart platform is mounted on the ship’s deck. To keep the transfer deck on the Stewart platform motionless, a sensor continuously measures the motions of the ship’s deck. The cylinders of the Stewart platform are subsequently controlled in such a way that a stable and motionless transfer deck is being created, from which a gangway provides access to the fixed offshore structure. The objective of the research of which the results are presented in this thesis was to prove that the use of an Ampelmann system can increase the safe accessibility of offshore wind turbines significantly.
As a start it had to be examined whether the different technologies combined in the
Ampelmann system, i.e. the Stewart platform and motion sensor, would allow for a sufficiently fast and accurate motion control to create a motionless upper deck on a moving vessel. To research this, a series of scale model tests have been performed using a small Stewart platform in combination with a motion sensor and custom-made software. This proof of concept was conducted by first placing the system on top of another, larger, Stewart platform (used to “simulate” ship motions) to test and enhance the system performance by fine-tuning of the controls. Thereafter, the system was

iv
mounted on a 4 meter vessel which was placed in a wave basin in which the vessel was excited by regular and irregular waves. These scale model tests proved the Ampelmann concept: obtaining a motionless transfer deck on top of a moving vessel. The results of this proof-of-concept phase justified continuing with the next phase: creating a prototype.
This prototype, the Ampelmann Demonstrator, was to prove its capability of safely
transferring personnel in real offshore conditions. Prior to the development of the Ampelmann Demonstrator, the following system requirements were stated:
• High safety standards • Ship-based system, applicable on a wide range of vessels • No special appurtenances required on the wind turbine • Provide accessibility in sea states up to HS = 2.5m.
To create an inherently safe Ampelmann system, a fail-operational safety philosophy
was adopted, implying that after a single component failure the operation must continue normally for at least one minute: enough time to complete a transfer operation safely and return the platform to its safe state. To address the safety-based design of the Ampelmann Demonstrator, four main requirements were identified:
• Stewart platform motion range • Stewart platform motion integrity • Safe operational procedure • Structural integrity.
The design of the Stewart platform should be such that it provides sufficient motion
range to enable compensation of vessel motions in sea states of HS=2.5m. A design process was developed to determine the Stewart platform’s architecture best apt for the prototype, the Ampelmann Demonstrator. This was done by first determining a large number of possible architectures for a cylinder stroke length of 2m and limited top and base frame dimensions. A calculation procedure was performed for each proposed platform architecture to determine its motion range. Additionally, the extreme axial cylinder forces were determined for all architectures; the architectures leading to the largest cylinder loads have been discarded since large cylinder forces are associated with larger cylinder dimensions which in turn lead to higher costs. Ultimately the platform architecture with the largest heave motion range was considered the most appropriate for the Ampelmann Demonstrator. The behaviour of this architecture was studied for use on different types of vessels through motion simulations. It was found that the chosen Stewart platform design could provide motion compensation in a sea state of HS=2.5m when mounted on vessels with a length of at least 50m.
v
For adequate motion compensation, the motions provided by the Stewart platform have to be exact and timely and may not be hampered by any component failure. All non-structural critical components of the Stewart platform were therefore designed to be redundant to comply with the fail-operational safety philosophy. This redundant set-up allows the system to ride through any component failure for at least 60 seconds. As soon as such a component fails the Ampelmann Safety Management System (ASMS) detects this failure and immediately takes mitigating measures: isolate the failure and switch to the redundant component. In addition the operator is warned to finish the operation within one minute. The system was proven to be fail-operational through an extensive series of tests.
Furthermore an operational procedure has been defined to enable safe personnel
transfers. While trained operators command the Ampelmann system in accordance with the operational procedure, the ASMS continuously monitors all system functionalities and warns the operator in case a component failure compromises the system’s redundancy. Safe and easy access from the Ampelmann transfer deck to a landing point on a wind turbine is made possible by a custom-made gangway. This Telescopic Access Bridge (TAB) incorporates three degrees of freedom which enable the operator to position the tip of the gangway against any envisaged landing point. The free floating functions of the TAB ensure contact with the landing point even when encountering small transfer platform motions and serve as a safety feature to keep the gangway tip pressed against the landing point in case of an emergency. The safety of the operational procedure has been confirmed by onshore and offshore tests.
To verify the structural integrity of the Ampelmann Demonstrator, the design and
fabrication of the system and its structural components have been evaluated by the certification authority Lloyd’s Register. For the design appraisal this presented a practical problem since no specific design codes existed for an Ampelmann system. Based on the Code for Lifting Appliances in a Marine Environment, six load cases were specifically outlined for the Ampelmann system; these load cases were agreed upon by Lloyd’s Register to be used for the design appraisal. Based on the design, fabrication and an overload test a full certificate was issued confirming the Ampelmann Demonstrator’s structural integrity.
The Ampelmann Demonstrator development phase has been completed by a
successful transfer demonstration at the Offshore Windpark Egmond aan Zee (OWEZ). A second Ampelmann system was built in 2009 and two more in the first half of 2010. These four systems are commercially available and have been applied in offshore wind projects as well as oil- and gas projects. By the summer of 2010, the four Ampelmann systems have jointly performed over 25.000 personnel transfers in sea states of up to HS=2.8m. The next step for the Ampelmann is to be used for its originally envisaged

vi
task to significantly increase the accessibility of offshore wind turbines in order to increase uptime, power production and revenues. The Ampelmann technology has proven to be a safe method to transfer personnel to fixed offshore structures, providing access in sea states with a significant wave height of over 2.5 metres, making offshore access as easy as crossing the street.

vii
Table of Contents
Acknowledgements........................................................................................... i
Summary ......................................................................................................... iii
Table of Contents........................................................................................... vii
List of Symbols................................................................................................ ix
List of Abbreviations.................................................................................... xiii
1. Introducing Offshore Wind Energy, Maintenance and Access ............ 1 1.1 The Wind Energy Industry.................................................................................1 1.2 Operation and Maintenance ...............................................................................4 1.3 Maintenance Strategy and Offshore Accessibility.............................................6 1.4 Access Methods .................................................................................................8 1.5 Future Access Requirements............................................................................13
2. Active Motion Compensation and Research Objective........................ 15 2.1 Introduction......................................................................................................15 2.2 Requirements for a New Access Method.........................................................15 2.3 Active motion compensation............................................................................20 2.4 The Ampelmann System..................................................................................24 2.5 Research Objective and Thesis Approach........................................................26
3. Ampelmann Scale Model Tests............................................................... 31 3.1 Introduction......................................................................................................31 3.2 Requirements for Scale Model Tests ...............................................................31 3.3 Testing Facilities ..............................................................................................33 3.4 Measuring System............................................................................................34 3.5 Stewart Platform ..............................................................................................37 3.6 Control System.................................................................................................39 3.7 Dry Tests..........................................................................................................41 3.8 Wet Tests .........................................................................................................44 3.9 Conclusions......................................................................................................47

viii
4. Requirements for a Prototype: Ampelmann Demonstrator ................ 49 4.1 Introduction......................................................................................................49 4.2 Prototype Development....................................................................................49 4.3 Offshore Application........................................................................................51 4.4 Demonstrator Size Constraints.........................................................................52 4.5 Other System Requirements.............................................................................54 4.6 List of Requirements........................................................................................55 4.7 Preliminary Concept of Ampelmann Demonstrator.........................................56
5. Safety Philosophy and Consequences for Design and Operation........ 57 5.1 Introduction......................................................................................................57 5.2 Safety Philosophy ............................................................................................57 5.3 Safety-based System Design ............................................................................62 5.4 Safety-based Operational Procedure ................................................................70 5.5 Summary..........................................................................................................77
6. Stewart Platform Design ......................................................................... 81 6.1 Introduction......................................................................................................81 6.2 Stewart Platform Basics ...................................................................................81 6.3 Modelling of Waves and Simulation of Vessel Motions..................................97 6.4 Vessel Motion Based Design .........................................................................114 6.5 Scaling Based Design.....................................................................................121 6.6 Stroke Based Design including Optimization ................................................125 6.7 Evaluation of Design Methods.......................................................................130
7. Certification and Tests .......................................................................... 133 7.1 Introduction....................................................................................................133 7.2 Certification ...................................................................................................133 7.3 Test Phases.....................................................................................................151 7.4 Evaluation ......................................................................................................160
8. Conclusions and Outlook ...................................................................... 163 8.1 Conclusions....................................................................................................163 8.2 Outlook ..........................................................................................................167
References .................................................................................................... 169
Appendix A: Videos..................................................................................... 173
Appendix B: Ampelmann Certificates....................................................... 177
Samenvatting ............................................................................................... 185
Curriculum Vitae ........................................................................................ 189

ix
List of Symbols
Arod Cross-sectional area of rod [mm2]
bi Base gimbal of actuator i
bi,b Position vector of base frame gimbal i in the b-frame [m]
bi,h Position vector of base frame gimbal i in the h-frame [m]
bh Position vector of B with respect to Oh in the h-frame [m]
bh Position vector of B with respect to the CoG in the b-frame [m]
B Centre of base frame
c Position vector of centre of top frame C [m]
ch Position vector of C with respect to Oh in the h-frame [m]
C Centre of top frame
D (µ ) Directional spreading function [rad-1]
fb Degrees of freedom of joint at base level [-]
fc Degrees of freedom of joint at cylinder level [-]
fi Number of degrees of freedom of the i-th joint [-]
ft Degrees of freedom of joint at top level [-]
F Effective degrees of freedom of the mechanism [-]
F Load case dependent stress factor [-]
Fd Duty factor [-]
Fh Hoisting factor [-]
Fx External force in x-direction [N]
Fy External force in y-direction [N]
Fz External force in z-direction [N]
g Gravitational acceleration [m/s2] Hmax Maximum wave height [m]
HS Significant wave height [m]
J Jacobian matrix
K Constant depending on the cylinder end constraint conditions [-]
lcyl Cylinder length [m]
ldead Cylinder dead length [m]
li Length of cylinder i [m]
li Length vector of cylinder i [m]
ˆil Unit vector of length of cylinder i [-]

x
lmax Maximum cylinder length [m]
lmin Minimum cylinder length [m]
lstroke Cylinder stroke length [m]
Lg Dead loads [N]
Lh1 Horizontal component of live load due to heel and trim [N]
Lh2 Most unfavourable horizontal load next to Lh1 [N]
Lh3 Horizontal component of dead load due to heel and trim [N]
Lk Effective rod length, depends on platform pose [m]
Ll Live loads [N]
Lw Most unfavourable wind load in critical condition [N]
m Wave direction index number [-]
M Number of wave directions [-]
Mx External bending moment around x-axis [Nm]
My External bending moment around y-axis [Nm]
Mz External bending moment around z-axis [Nm]
n Harmonic wave index number [-]
nj Number of joints in mechanism [-]
nl Number of links in mechanism [-]
nf Normalising factor between JONSWAP and PM spectrum [-]
N Number of wave frequencies [-]
Ni Axial force in cylinder i [N]
Nmax Maximum allowable axial force in cylinder [N]
Ob Coordinate system attached to centre of base frame
Oh Origin of hydrodynamic frame
Ot Coordinate system attached to centre of top frame
p Hydraulic pressure [N/m2]
P Required power [W]
Q Volumetric flow rate [m3/s]
Qcyl Volumetric flow rate in cylinder [m3/s]
r Effective radius of gyration [m]
Rb Radius base frame [m]
Rt Radius top frame [m]
( )hb hbR Θ Transformation matrix from b-frame to h-frame
( )bt btR Θ Transformation matrix from Ot to Ob
RAOx Response Amplitude Operator for surge motion [m/m]
RAOy Response Amplitude Operator for sway motion [m/m]
xi
RAOz Response Amplitude Operator for heave motion [m/m]
RAOφ Response Amplitude Operator for roll motion [deg/m]
RAOθ Response Amplitude Operator for pitch motion [deg/m]
RAOψ Response Amplitude Operator for yaw motion [deg/m]
sb Half separation distance between base gimbal pairs [m]
st Half separation distance between top gimbal pairs [m]
SJS (ω) JONSWAP variance density spectrum [m2s/rad]
SPM (ω) Pierson-Moskowitz variance density spectrum [m2s/rad]
Sz (ω) Variance density spectrum of heave response [m2s/rad]
Sζ* Discrete wave variance density spectrum [m2s/rad]
Sζ (ω) Wave variance density spectrum [m2s/rad]
Sζ (ω, µ) Directional wave variance density spectrum [m2s/rad2]
t Time [s]
ti Top gimbal of actuator i
ti Position vector of top gimbal of actuator i [m]
Tz Mean zero-crossing wave period [s]
Vcyl Cylinder rod velocity = ∆lcyl / ∆t [m/s]
x Platform position vector [m][rad]
x Surge [m]
xa Surge amplitude [m]
,ˆl ix x-component of unit vector of length of cylinder i [-]
y Sway [m]
ya Sway amplitude [m]
,ˆl iy y-component of unit vector of length of cylinder i [-]
z Heave [m]
za Heave amplitude [m]
za,n Amplitude of heave motion component n [m]
,ˆl iz z-component of unit vector of length of cylinder i [-]
γ JONSWAP peak shape parameter [-]
γt Half separation angle between top gimbal pairs [rad]
γb Half separation angle between base gimbal pairs [rad]
ε Phase shift of wave [rad]
εn Phase shift of wave n [rad]
εn,m Phase shift of wave n travelling in direction m [rad]
ε zζ,n Phase difference between elevation of wave n and heave [rad]
ζ Surface elevation [m]

xii
ζa Wave amplitude [m]
ζa,n Amplitude of wave n [m]
ζa,n,m Amplitude of wave n travelling in direction m [m]
θ Pitch [rad]
θa Pitch amplitude [rad]
hbΘ Vector of Euler angles κ Condition number of the Jacobian matrix
λ DoFs of the space in which the mechanism can operate [-]
µ Wave direction [rad] µ Dominant wave direction [rad]
σ Numerical parameter for JONSWAP spectrum [-]
σcr Critical compressive stress [N/mm2]
φ Roll [rad]
φa Roll amplitude [rad]
ψ Yaw [rad]
ψa Yaw amplitude [rad]
ω Angular frequency [rad/s]
ωm Modal angular frequency [rad/s]
ωn Angular frequency of wave n [rad/s]
∆ω Angular frequency bandwidth [rad/s]

xiii
List of Abbreviations 6DoF Six Degrees of Freedom ABS Anti-lock Brake System ASMS Ampelmann Safety Management System b-frame Body-fixed Frame CF Capacity Factor CLAME Code for Lifting Appliances in a Marine Environment CoG Centre of Gravity DGPS Differential Global Positioning System DoF Degree of Freedom DP Dynamic Positioning EWEA European Wind Energy Association FMEA Failure Modes and Effects Analysis FOG Fibre Optic Gyroscope GPS Global Positioning System h-frame Hydrodynamic Frame HAZID Hazard Identification HPU Hydraulic Power Unit HSC High Speed Controller IMU Inertial Measurement Unit MCC Motion Control Cabinet MMS Micro Motion System MRAO Motion Response Amplitude Operator NPV Net Present Value OAS Offshore Access System OWEZ Offshore Windpark Egmond aan Zee O&M Operation & Maintenance PLC Programmable Logic Controller PTA Piston Type Accumulator RAO Response Amplitude Operator RIKZ Rijksinstituut voor Kust en Zee SWATH Small Waterplane Area Twin Hull SWL Safe Working Load TAB Telescopic Access Bridge UPS Uninterruptable Power Supply

xiv

1
1. Introducing Offshore Wind Energy, Maintenance and Access
1.1 The Wind Energy Industry
1.1.1 Introduction Due to the increasing demand for energy, the growing environmental awareness and
fossil fuels generally having increasing and unstable prices, renewable sources of energy have become of increasing importance over the last decades. Presently hydropower, wind energy, biomass energy, geothermal energy and solar photovoltaics contribute to the global electricity generation alongside fossil fuels. Generating electricity from wind using turbines has evolved from small domestic and agricultural applications in the early 1970’s to an international multibillion euro business today. Throughout these decades, technological improvements have steadily been reducing total costs, making onshore wind energy currently cost competitive with fossil fuels when situated in locations with sufficient wind velocities. The most noticeable technological development is the explosive growth of turbines both in rotor diameter as well as power capacity, as shown with trend lines in Figure 1.1. Although the increase in rotor diameter appears to have stalled, the maximum rated power capacity of wind turbines is still expected to increase. At this moment, the largest commercially available wind turbine has a rated capacity of 6 Megawatt. Early 2009, the installed wind power capacity worldwide was 121 Gigawatt with an annual growth of over 20%. Europe currently accounts for over 50% of this total installed capacity. [1]
Figure 1.1 Growth in turbine sizes [2][3]
1975 1980 1985 1990 1995 2000 2005 2010 2015
8
6
4
2
0
160
120
80
40
0
[m] [MW]
Rotor Diameter [m] Rated Power Capacity [MW]
2
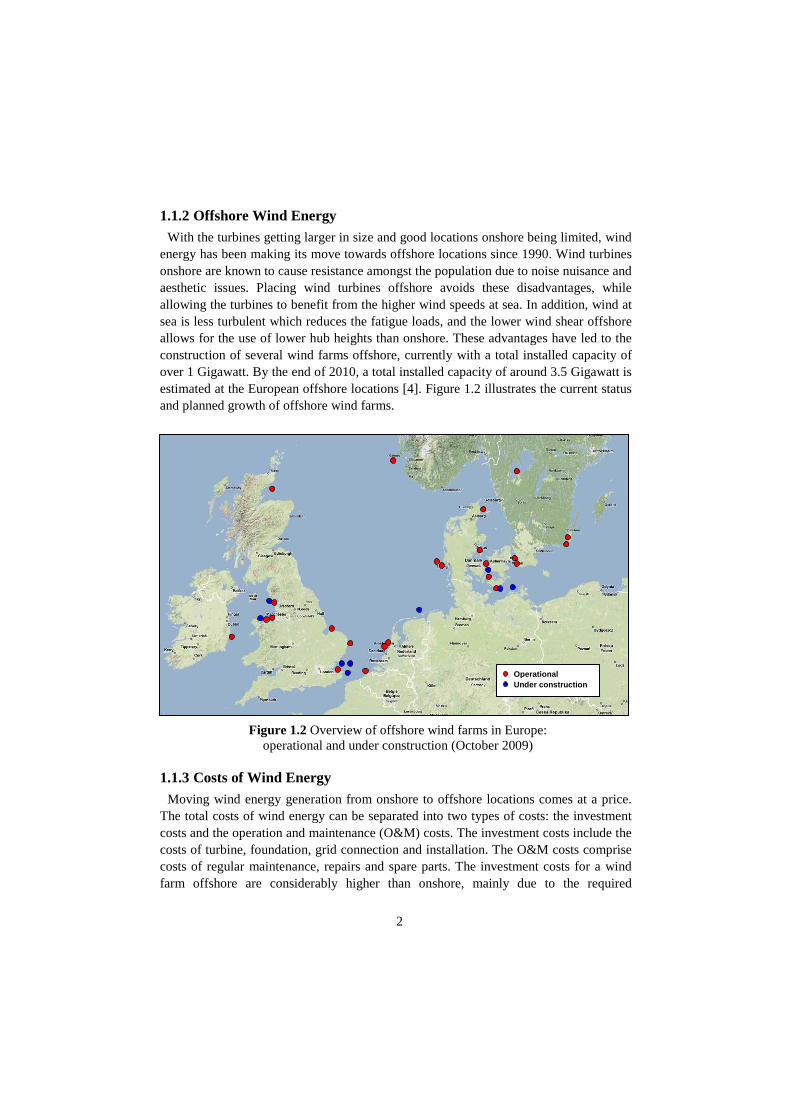
1.1.2 Offshore Wind Energy With the turbines getting larger in size and good locations onshore being limited, wind
energy has been making its move towards offshore locations since 1990. Wind turbines onshore are known to cause resistance amongst the population due to noise nuisance and aesthetic issues. Placing wind turbines offshore avoids these disadvantages, while allowing the turbines to benefit from the higher wind speeds at sea. In addition, wind at sea is less turbulent which reduces the fatigue loads, and the lower wind shear offshore allows for the use of lower hub heights than onshore. These advantages have led to the construction of several wind farms offshore, currently with a total installed capacity of over 1 Gigawatt. By the end of 2010, a total installed capacity of around 3.5 Gigawatt is estimated at the European offshore locations [4]. Figure 1.2 illustrates the current status and planned growth of offshore wind farms.
Figure 1.2 Overview of offshore wind farms in Europe: operational and under construction (October 2009)
1.1.3 Costs of Wind Energy Moving wind energy generation from onshore to offshore locations comes at a price.
The total costs of wind energy can be separated into two types of costs: the investment costs and the operation and maintenance (O&M) costs. The investment costs include the costs of turbine, foundation, grid connection and installation. The O&M costs comprise costs of regular maintenance, repairs and spare parts. The investment costs for a wind farm offshore are considerably higher than onshore, mainly due to the required
Operational Under construction
3
integration with the electrical grid, larger and more complex support structures and expensive installation methods. According to a 2009 study of the European Wind Energy Association (EWEA) [3], the investment costs for an onshore wind energy facility typically vary between 1.00 and 1.35 million €/MW, whereas the investment costs for a new offshore wind farm are expected to be in the range of 2.00 to 2.20 million €/MW at a near-shore, shallow water site. EWEA estimates O&M costs to be under or close to 10 €/MWh for onshore turbines with a rated power of 500kW and more, and around 16 €/MWh in offshore conditions, since maintenance activities in the harsh offshore environment are generally more cumbersome and thus more expensive. However, estimates of O&M costs are still very unpredictable.
Using the above quoted values, a simple estimate of the costs of an offshore wind farm
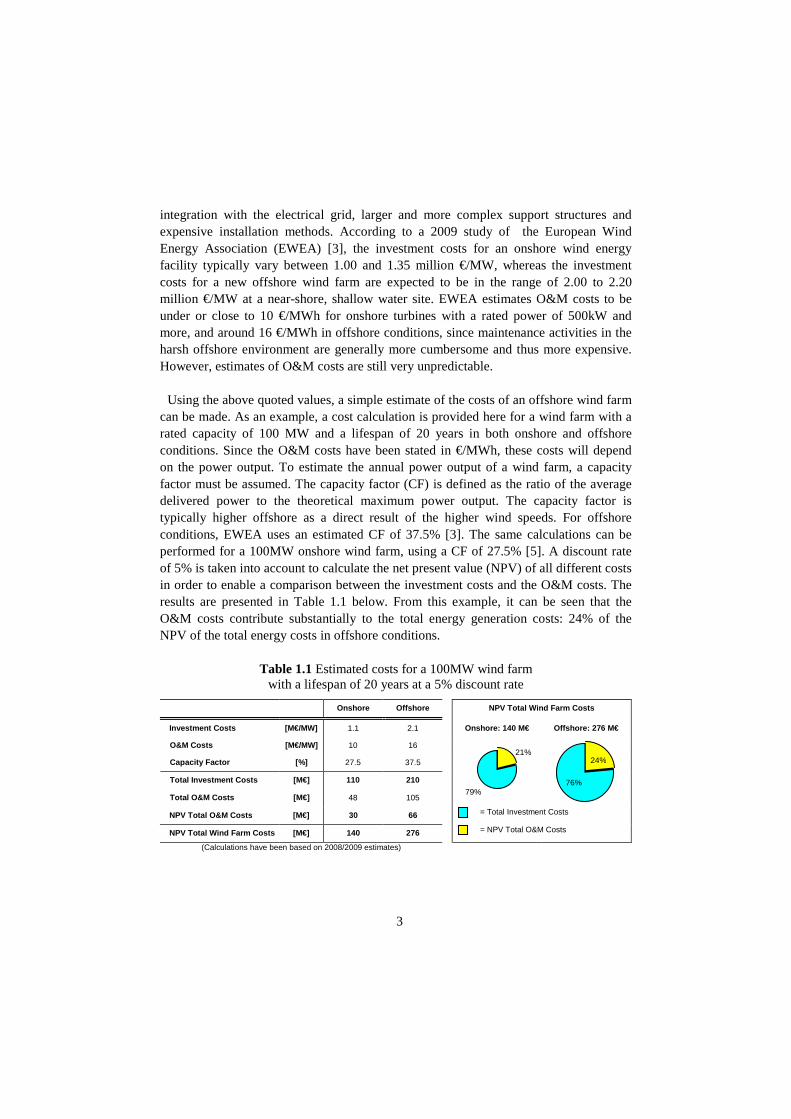
can be made. As an example, a cost calculation is provided here for a wind farm with a rated capacity of 100 MW and a lifespan of 20 years in both onshore and offshore conditions. Since the O&M costs have been stated in €/MWh, these costs will depend on the power output. To estimate the annual power output of a wind farm, a capacity factor must be assumed. The capacity factor (CF) is defined as the ratio of the average delivered power to the theoretical maximum power output. The capacity factor is typically higher offshore as a direct result of the higher wind speeds. For offshore conditions, EWEA uses an estimated CF of 37.5% [3]. The same calculations can be performed for a 100MW onshore wind farm, using a CF of 27.5% [5]. A discount rate of 5% is taken into account to calculate the net present value (NPV) of all different costs in order to enable a comparison between the investment costs and the O&M costs. The results are presented in Table 1.1 below. From this example, it can be seen that the O&M costs contribute substantially to the total energy generation costs: 24% of the NPV of the total energy costs in offshore conditions.
Table 1.1 Estimated costs for a 100MW wind farm
with a lifespan of 20 years at a 5% discount rate
Onshore Offshore NPV Total Wind Farm Costs
Investment Costs [M€/MW] 1.1 2.1 Onshore: 140 M€ Offshore: 276 M€ O&M Costs [M€/MW] 10 16 Capacity Factor [%] 27.5 37.5 Total Investment Costs [M€] 110 210 Total O&M Costs [M€] 48 105
NPV Total O&M Costs [M€] 30 66 = Total Investment Costs
NPV Total Wind Farm Costs [M€] 140 276 = NPV Total O&M Costs (Calculations have been based on 2008/2009 estimates)
24%
76%
21%
79%

4
1.2 Operation and Maintenance
1.2.1 Maintenance Activities The term “Operation and Maintenance” refers to all activities performed after a wind
turbine has been commissioned in order to have and keep the turbine in operation. Besides monitoring, these are mainly maintenance and repair activities which can be categorized into the following three different types of maintenance [6]:
• Calendar based maintenance • Condition based maintenance • Unplanned corrective maintenance. Calendar based maintenance Calendar based maintenance is performed at fixed time intervals, or after a fixed
number of operating hours. This usually amounts to one or two visits per year. Condition based maintenance Condition based maintenance is carried out after a certain degree of degradation of a
system or component has been detected. The component is to be repaired or replaced before actual failure occurs.
Unplanned corrective maintenance Unplanned corrective maintenance is necessary after an unexpected failure of a system
or component. Such failures have a random character and are therefore impossible to predict. These unplanned visits, necessary for corrective maintenance, may demand a large number of personnel transfers to the turbines. Moreover, waiting time for replacement parts to be available can prolong the turbine downtime substantially.
For offshore wind farms, the costs of corrective maintenance cover around 60% of the
total O&M costs, whereas the costs for preventive maintenance (both calendar and condition based) presently account for around 40% [7].
Maintenance activities can also be categorized per required action. A categorization as
proposed in [8] is presented in Table 1.2. The distinction between the different categories is based on the weight of the components that are to be replaced and the equipment needed. For the Dutch DOWEC project, the occurrence of failures was simulated for an offshore wind farm with 80 turbines [9]. From this simulation, the required maintenance actions were derived and separated into the different maintenance categories. The occurrence of each action is presented in the rightmost column of Table

5
1.2 as a percentage of all required maintenance actions. It is clear that over 90% of all maintenance actions only require the transfer of personnel and of parts which can be carried by man or lifted by a turbine’s permanent internal crane.
Table 1.2 Maintenance categories per required action [8] [9]
Maintenance Category Number
Required Action Offshore Equipment Required
Occurrence as percentage of all maintenance actions
[%]
1 Replacement of a heavy component Vessel + Jack-up 1
2 Replacement of a large part Vessel + Build up Internal Crane 7
3 Replacement of a small part (< 1 MT) Vessel + Permanent Internal Crane 23
4
Replacement of a small part (man carried) or no parts; Inspection
Vessel or Helicopter
69
1.2.2 Factors Determining Operation & Maintenance Costs When considering an offshore wind farm, the main contributors to operation and
maintenance costs are labour costs, material costs, costs for access vessels and crane ships. In addition to these costs one should also take into account revenue losses due to downtime. These different costs are dependent on [7]:
• Size and reliability of the turbines • Water depth, distance to the shore and number of turbines of the wind farm • Wind and wave climate • Maintenance strategy. Size and reliability of the turbines The reliability of a wind turbine plays a major role in the O&M costs: turbines that
require much maintenance, either scheduled or unscheduled, will demand higher O&M costs than reliable and robust turbines. Turbines with a comparable reliability but with different rated capacities (e.g. 2 MW and 5 MW) will have different O&M costs. The turbine with the larger rated capacity will generally require fewer visits per installed MW. On the other hand, the repair of a larger turbine will cause a higher revenue loss during downtime and will generally include replacement of larger parts possibly resulting in the use of more expensive equipment. Furthermore, additional wind turbine facilities such as internal cranes, a second boat landing or a hoisting deck on the nacelle can influence the ease of maintenance and therefore influence the O&M costs.

6
Water depth, distance to port and number of turbines of the wind farm A larger water depth may require the use of more expensive hoisting facilities (e.g. a
bigger jack-up barge for overhaul). For all maintenance and repair actions, the distance to port directly influences the travel time from shore to wind farm. The number of turbines of the wind farm can have an influence on the chosen maintenance strategy: as wind farms become larger, the use of more advanced vessels and access systems are likely to become more economical.
Wind and wave climate The wind and wave climate are determined by the location of the wind farm. The trip
from port to wind farm and back, and especially the transfer of people and goods to and from an offshore wind turbine can be significantly hampered by the environmental conditions. Transfers as well as maintenance operations are limited to certain wind speeds and wave conditions.
Maintenance strategy During its lifetime maintenance of a wind farm is performed according to a certain
strategy. This strategy also defines the access system, hoisting facilities, the frequency of scheduled maintenance and overhaul, as well as how to deal with unscheduled maintenance activities. Different maintenance strategies will obviously have different effects on the resulting O&M costs.
It is evident that in order to minimize O&M costs all aforementioned factors
determining these costs should be investigated more closely. However, the wind farm location, the turbine type and the wind farm size are always decided upon at an early stage of the wind farm development, normally several years before the installation of the farm. After the wind farm location, turbine type and wind farm size have been determined, the main factors influencing total O&M costs mentioned earlier will all be fixed, with the exception of the maintenance strategy. The choice of strategy directly influences the costs of access systems, of crane ships and of labour while indirectly affecting the revenue losses.
1.3 Maintenance Strategy and Offshore Accessibility When operating an offshore wind farm, all turbine-related maintenance activities
require a visit to the offshore wind turbine. Any visit to a turbine calls for a means of transportation as well as a transfer method to the turbine. Access to a turbine thus comprises transport to the turbine location as well as transfer of personnel and goods from the transport means to the turbine itself. The accessibility of a wind turbine is defined here as the percentage of time that a turbine can be accessed.
7
One of the most significant differences between wind farms offshore and onshore for O&M is their accessibility. In some cases, onshore wind turbines are located in remote areas or hills which can significantly increase travel time. However, in case of onshore maintenance, crews can travel from turbine to turbine by car and can generally access the turbines at any moment, regardless the weather conditions. The possibility to access a wind turbine offshore depends heavily on the weather and sea conditions. Offshore wind turbines are placed at locations with favourable wind conditions, so these locations will often experience rough weather conditions with high wind speeds and high waves. Due to such weather conditions, the turbines may well be inaccessible for days or even weeks.
Whenever a turbine requires a corrective maintenance action, it remains unavailable
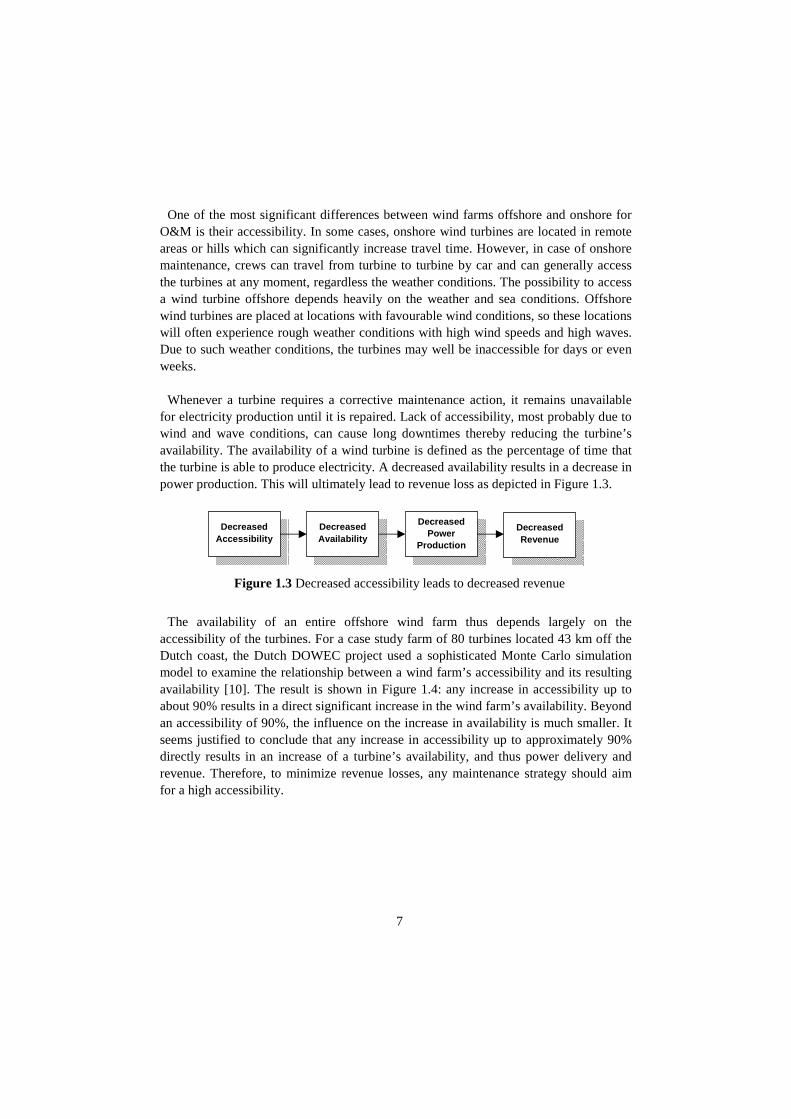
for electricity production until it is repaired. Lack of accessibility, most probably due to wind and wave conditions, can cause long downtimes thereby reducing the turbine’s availability. The availability of a wind turbine is defined as the percentage of time that the turbine is able to produce electricity. A decreased availability results in a decrease in power production. This will ultimately lead to revenue loss as depicted in Figure 1.3.
The availability of an entire offshore wind farm thus depends largely on the
accessibility of the turbines. For a case study farm of 80 turbines located 43 km off the Dutch coast, the Dutch DOWEC project used a sophisticated Monte Carlo simulation model to examine the relationship between a wind farm’s accessibility and its resulting availability [10]. The result is shown in Figure 1.4: any increase in accessibility up to about 90% results in a direct significant increase in the wind farm’s availability. Beyond an accessibility of 90%, the influence on the increase in availability is much smaller. It seems justified to conclude that any increase in accessibility up to approximately 90% directly results in an increase of a turbine’s availability, and thus power delivery and revenue. Therefore, to minimize revenue losses, any maintenance strategy should aim for a high accessibility.
Figure 1.3 Decreased accessibility leads to decreased revenue
Decreased Accessibility
Decreased Availability
Decreased Power
Production
Decreased Revenue

8
The importance of accessibility of offshore wind turbines can also be illustrated by the
following example [11]. If a wind farm of 100 turbines is assumed and each single wind turbine has an availability of 97%, the probability that all turbines are operating equals (0.97)100 = 4.8%. This means that the need for turbine repair is almost continuous.
1.4 Access Methods
1.4.1 Introduction It was shown in Table 1.2 that over 90% of all maintenance activities required during
the entire lifetime of the offshore wind farm studied in [9] consist of inspection, simple repairs or replacement of small parts. Therefore, when addressing accessibility in this study the focus will be on the transport and transfer of personnel and light equipment to offshore wind turbines. The accessibility of a wind turbine depends on the means of transport used to get to the turbine location as well as the method of transferring personnel and goods to the turbine. In the offshore industry two means of transport are being used to reach offshore structures: helicopters and vessels.
1.4.2 Helicopter Access Helicopters are regularly used in the offshore industry (with facilities frequently far
from shore) to get to various offshore facilities since they provide a fast means of transportation for personnel and light equipment at cruise speeds up to 250 km/h. Another big advantage of using helicopters is that both transport and transfers are not limited by wave conditions. If an offshore structure is equipped with a helicopter landing deck, the helicopter can land on this deck and passengers can safely board or exit the helicopter. However, mounting a helicopter landing deck on an offshore wind turbine would be unpractical. Instead, a hoisting platform can be placed on the turbine nacelle. The transfer of personnel from helicopter to turbine can then be achieved by having the helicopter hovering over the turbine and lowering people from the helicopter
Figure 1.4 Wind farm availability versus accessibility [10]
9
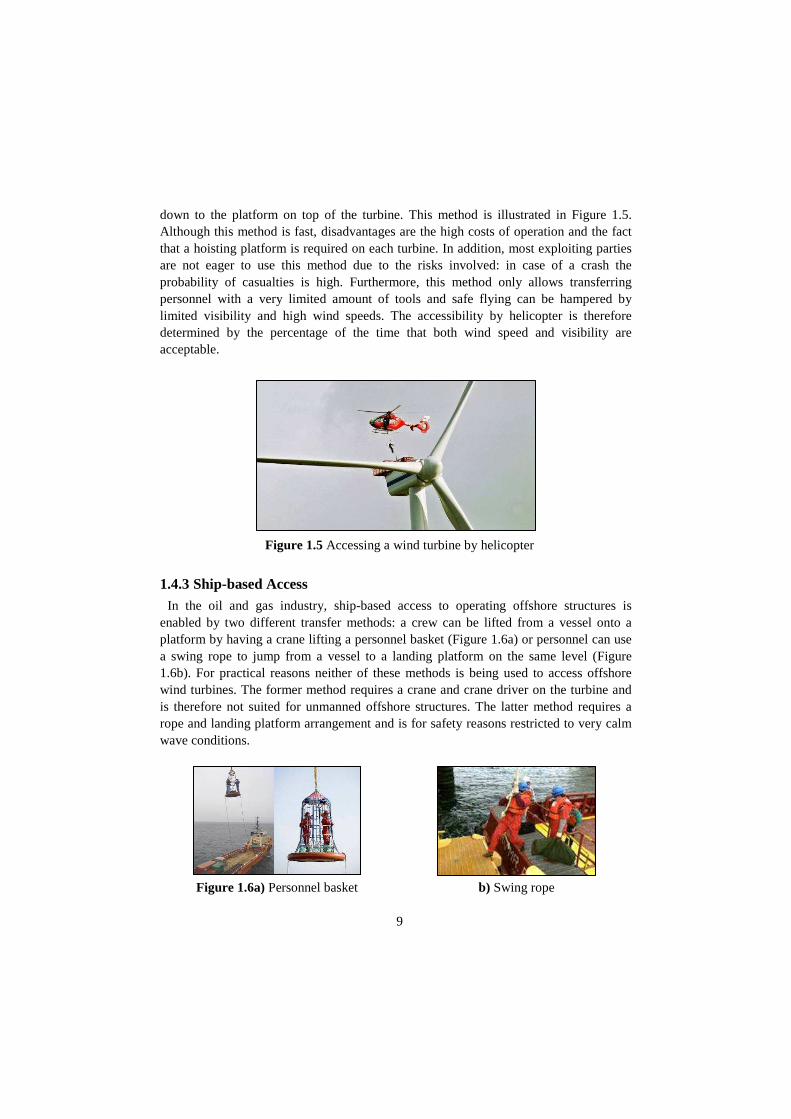
down to the platform on top of the turbine. This method is illustrated in Figure 1.5. Although this method is fast, disadvantages are the high costs of operation and the fact that a hoisting platform is required on each turbine. In addition, most exploiting parties are not eager to use this method due to the risks involved: in case of a crash the probability of casualties is high. Furthermore, this method only allows transferring personnel with a very limited amount of tools and safe flying can be hampered by limited visibility and high wind speeds. The accessibility by helicopter is therefore determined by the percentage of the time that both wind speed and visibility are acceptable.
Figure 1.5 Accessing a wind turbine by helicopter
1.4.3 Ship-based Access In the oil and gas industry, ship-based access to operating offshore structures is
enabled by two different transfer methods: a crew can be lifted from a vessel onto a platform by having a crane lifting a personnel basket (Figure 1.6a) or personnel can use a swing rope to jump from a vessel to a landing platform on the same level (Figure 1.6b). For practical reasons neither of these methods is being used to access offshore wind turbines. The former method requires a crane and crane driver on the turbine and is therefore not suited for unmanned offshore structures. The latter method requires a rope and landing platform arrangement and is for safety reasons restricted to very calm wave conditions.
Figure 1.6a) Personnel basket b) Swing rope

10
Currently all ship-based access to offshore wind turbines is provided by intentionally creating frictional contact between the bow of a vessel and the turbine’s boat landing aiming to have no vertical vessel motions at the point of contact. A rubber bumper on the vessel bow forms this contact point, while the thrusters push the boat against the structure. The boat then pivots around the bumper and personnel can step from the vessel bow onto the turbine ladder. This method is generally being used for all maintenance visits and applied by different types of vessels as shown in Figure 1.7. The most commonly used vessels for wind farm support are small vessels with lengths between 14 and 20 metres, with either a single or a twin hull shape, and a bow section that is specifically designed to facilitate this type of access. An important downside of this access method is that it is limited to moderate wave conditions.
1.4.4 Comparison between Helicopter and Ship-based Access When selecting an access method to offshore structures, safety considerations are
always paramount. Safety performance indicators in the oil and gas industry [12] reveal that the probability of injuries using ship-based transfer methods is higher than when accessing a platform by helicopter. However, although the likelihood of a helicopter crash is low, such accidents have a high probability of numerous fatalities. For this reason the use of helicopters has a higher probability of casualties than ship-based access. Furthermore, the lowering and hoisting method shown in Figure 1.5 adds an additional risk to helicopter-based access to offshore wind turbines. Thus, when considering safety, ship-based access appears to be the preferred solution.
Further to the safety related arguments, the use of helicopters to access offshore wind
turbines presents other disadvantages compared to vessels. First of all, provided distances from port are not too long, access by vessels is known to be more cost-efficient than access by helicopters [13]. Secondly, helicopter transfers require a hoisting platform on each turbine and finally the hoisting procedure only allows for a very limited amount of tools to be carried. The two biggest advantages of access by
Figure 1.7 Ship-based access to offshore wind turbines Ships used: a) WindCat b) Aaryan c) Valhalla
11
helicopters over the use of vessels are the much higher transportation speed and the fact that accessibility is not limited by wave conditions.
During recent years it has become apparent that the offshore wind industry is not keen
on applying helicopters as the main access method to offshore wind turbines. In fact, most wind farms are not equipped with hoisting platforms and thereby exclude the possibility of using helicopters as an access method. The aforementioned ship-based access method has so far proved to be the industry’s preferred solution, notwithstanding it is limited to use in moderate wave conditions.
1.4.5 Limiting Conditions for Ship-based Access The ship-based access method to offshore wind turbines as described in section 1.4.3 is
mainly limited by the maximum allowable wave conditions during personnel transfer. When wave conditions get rougher, ship motions will become larger and there is a possibility that the vessel loses contact with the turbine’s boat landing. As a result, the vessel can suddenly start moving relative to the offshore structure. During such a situation the safety of transferring personnel is at stake and the operation must be aborted. The accepted way of describing the limiting conditions for all ship-based access is by giving the limiting significant wave height for a certain access method. In conditions exceeding this limiting significant wave height the access operation is considered too dangerous.
Sea states and significant wave height Wave conditions are generally described by two parameters, being the significant
wave height HS and the mean zero-crossing wave period Tz. For the purpose of describing the wave conditions at a specific location, wave climates are considered stationary during any period of three hours. This means that within such a period of time, the statistical properties of the wave climate are assumed to be constant. The wave conditions within such durations are generally referred to as sea states. In such a three-hour wave time series, the mean zero-crossing wave period Tz is defined as the average value of all upward (or downward) zero crossing periods within the series, whereas the significant wave height is defined as the average height of the largest 1/3 of all waves in this series. The value of the significant wave height corresponds well with visual estimates of the wave height, since larger waves are more "significant" to an observer than smaller ones. Since the significant wave height is the average of the 1/3 largest waves, some individual waves within a sea state will be larger than the significant wave height HS. The maximum expected wave height Hmax in a three-hour period can be estimated by taking the highest of 1000 waves. Probabilistic calculations based on the Rayleigh distribution have led to the following rule of thumb: Hmax = 1.86*HS [14]

12
Regarding the different vessels currently used for accessing offshore wind turbines which use the frictional contact method, it is not clear what the exact limiting sea state is for safe access. Based on industry practice a fair estimate of the limiting wave conditions seems to be a significant wave height of 1.5 metre, however.
Scatter diagram and accessibility To predict which percentage of time offshore access can be performed safely, the long-
term distribution of sea states at a given location is required. The long-term distribution of sea states is normally presented in a scatter diagram, which gives the probability of occurrence for combinations of significant wave height HS and the mean zero-crossing wave period Tz. A scatter diagram can correspond to the yearly, monthly or seasonal distribution of sea states, preferably based on many years of measurements or hindcast data.
Table 1.3 is an example of a scatter diagram showing the yearly distribution of sea
states at a typical Dutch offshore location and is based on measurements from 1989 to 2008; the most right column of this diagram shows the probability of occurrence of significant wave heights in different bins. From these bins, the probability of sea states up to any significant wave height in a year can easily be deduced. For example, the probability of sea states up to a significant wave height of 1.5 metres equals 14.6+30.4+23.3=68.3%. If access is only allowed in sea states up to a significant wave height of 1.5 metre, the accessibility of a turbine for the given location will theoretically be 68.3% per year. Throughout this study the accessibility of an access method will therefore be assumed equal to the probability of sea states up to the related limiting significant wave height.

13
68.3%
1.5 Future Access Requirements At the moment of writing this thesis the offshore wind industry is a rapidly growing
business. Many aspects within the industry are changing and gradually improving due to technological advances, political measures and industry initiatives. Considering the operation and maintenance aspects of offshore wind farms, lessons are being learned from existing operating farms. Maintenance strategies can therefore be adapted, while manufacturers focus on more robust turbine design in combination with more remotely controlled functions. In addition some trends within the industry may have an effect on the costs and complexity of O&M in the near future:
• Increasing power capacity and size of wind turbines • Wind farms being placed farther offshore • Increasing number of turbines per wind farm.
These trends will have several consequences. First of all, a turbine with a larger power
capacity will cause more loss of revenue per turbine during downtime. This will increase the need for a higher accessibility in order to minimize revenue losses. Secondly, near-shore locations are getting scarce and as a result, wind farms are gradually being placed farther offshore, where wind speeds are higher and the available locations have a larger areal extent allowing for wind farms with a larger number of
Table 1.3 Example of a scatter diagram of the yearly sea state distribution at the IJmuiden Munitiestortplaats in the Dutch North Sea [15]
Tz [s]
HS [m]
0.0 -
1.0
1.0 -
2.0
2.0 -
3.0
3.0 -
4.0
4.0 -
5.0
5.0 -
6.0
6.0 -
7.0
7.0 -
8.0
8.0 -
9.0
9.0 -
10.0
10.0 -
11.0
11.0 -
12.0 Total
0.0 - 0.5 1.2 9.4 3.5 0.5 0.1 <0.05 <0.05
14.6
0.5 - 1.0 0.2 15.0 11.6 3.2 0.3 <0.05 <0.05 30.4
1.0 - 1.5 3.8 15.2 3.9 0.4 <0.05 <0.05 23.3
1.5 - 2.0 0.1 8.9 5.0 0.3 <0.05 <0.05 <0.05 14.3
2.0 - 2.5 1.7 5.9 0.4 <0.05 8.1
2.5 - 3.0 0.1 3.6 0.8 <0.05 <0.05 4.5
3.0 - 3.5 <0.05 1.0 1.3 0.1 <0.05 2.4
3.5 - 4.0 0.1 1.1 0.1 <0.05 1.3
4.0 - 4.5 <0.05 0.4 0.2 0.6
4.5 - 5.0 0.1 0.2 <0.05 0.3
5.0 - 5.5 <0.05 0.1 <0.05 0.1
5.5 - 6.0 <0.05 <0.05 0.1
7.0 - 7.5 <0.05 <0.05 <0.05
Total 0 0 1.4 28.3 40.9 23.2 5.2 0.9 0.1 <0.05 <0.05 <0.05 100 %

14
turbines. Unfortunately, such sites are commonly in deeper seas and subject to rougher wave conditions than the currently operational wind farms. Future wind farms at locations with heavier sea conditions will have a significantly decreased accessibility when using the current access method, due to the maximum significant wave height that limits transfers. In addition, the large distances of future farms to the nearest port may also call for a change in maintenance strategy: if technicians are based in living quarters on a transformer platform instead of onshore, sailing distances can be reduced significantly. Finally, wind farms with more turbines will require more visits, with vessels that can accommodate more spare parts and possibly more personnel. This may result in the use of larger vessels than currently used for maintenance purposes.
In order to ensure high wind farm availabilities in the future while taking into account
the aforementioned trends, two important initiatives emerge. The first one is to put more emphasis on developing wind turbines that are extremely robust: if no unexpected component failures occur, no repairs are needed. As all preventive maintenance actions can be performed during calm wave conditions, high availabilities could theoretically be achieved with the present ship-based access method. The development of robust offshore wind turbines is a big challenge for wind turbine manufacturers. However, in the foreseeable future the other initiative is to achieve a high accessibility, even at sites with rough wave climates. This will require a more advanced access method for which the limiting significant wave height is higher than for the current methods, and that will increase the accessibility and consequently the availability of a wind farm.
In conclusion it can be stated that there is a need to develop better access methods to
offshore wind turbines which can be made available in the very near future. Over the last decade it has also become clear that access to turbines by means of helicopters is not likely to become a preferred method: ship-based access is and shall remain the preferred option. With the anticipated increase in number of offshore wind farms in mind, especially at locations farther offshore with rougher wave climates, there is a clear industry need to develop a safe ship-based access system for wind turbine maintenance with a high accessibility.

15
2. Active Motion Compensation and Research Objective
2.1 Introduction It is clear from the previous chapter that there is a huge incentive to improve the
accessibility of offshore wind turbines in order to increase the availability and revenues of wind farms. It is not likely that the use of helicopters will become a preferred method; ship-based methods are expected to remain the favoured solution for providing access to offshore wind turbines. However, the currently used ship-based access methods only allow access in limited weather conditions: a significant wave height of HS = 1.5m is generally accepted as the maximum sea state for safely accessing an offshore wind turbine by vessel. When considering the present developments in the offshore wind industry it is evident that in the near future today’s access limitation will not be acceptable from a business point of view.
This chapter describes the concept of a new ship-based access method named
“Ampelmann”, which will enable transferring people from a vessel to an offshore wind turbine using an active motion compensating platform. Section 2.2 focuses on the requirements for such a new ship-based access method. Section 2.3 describes the use of different types of active motion compensation, leading to the description of the Ampelmann system in section 2.4. In section 2.5 the objective of this PhD research will be stated.
2.2 Requirements for a New Access Method
2.2.1 Introduction To increase the accessibility of existing and future offshore wind farms in order to
reduce turbine downtime and related revenue losses, a prerequisite is to have an improved access method to offshore wind turbines. Such an access method will have to meet a number of requirements which will be addressed in this section.
2.2.2 High Safety Any system used to access offshore structures is governed by safety considerations.
Ship-based transfers to offshore wind turbines are generally limited by wave conditions. The main consideration is to avoid injuries of the person that is being transferred. For the current ship-based access method to wind turbines the most critical moment is when a person steps from the vessel onto the turbine mounted ladder or from the ladder onto
16
the vessel. The captain is to judge whether he believes that the wave conditions allow the vessel to pivot around its fender. When waves are too high, the vertical force between the fender and the boat landing can at any time become higher than the maximum friction force and the vessel can suddenly move upwards or downwards. This situation can cause personal injury and must therefore be avoided at all times.
For any new access method to offshore wind turbines, safety is the main driver and
will thus be of utmost importance in the development of a new access method. For this, the risks involved in personnel transfer must be kept as low as reasonably possible and a thorough safety philosophy must be incorporated in all stages of the development of a new system.
2.2.3 Stand-Alone System Applicable on a Wide Range of Vessels Some dedicated vessels have already been developed for the purpose of accessing
offshore wind turbines; two examples shall be given here.
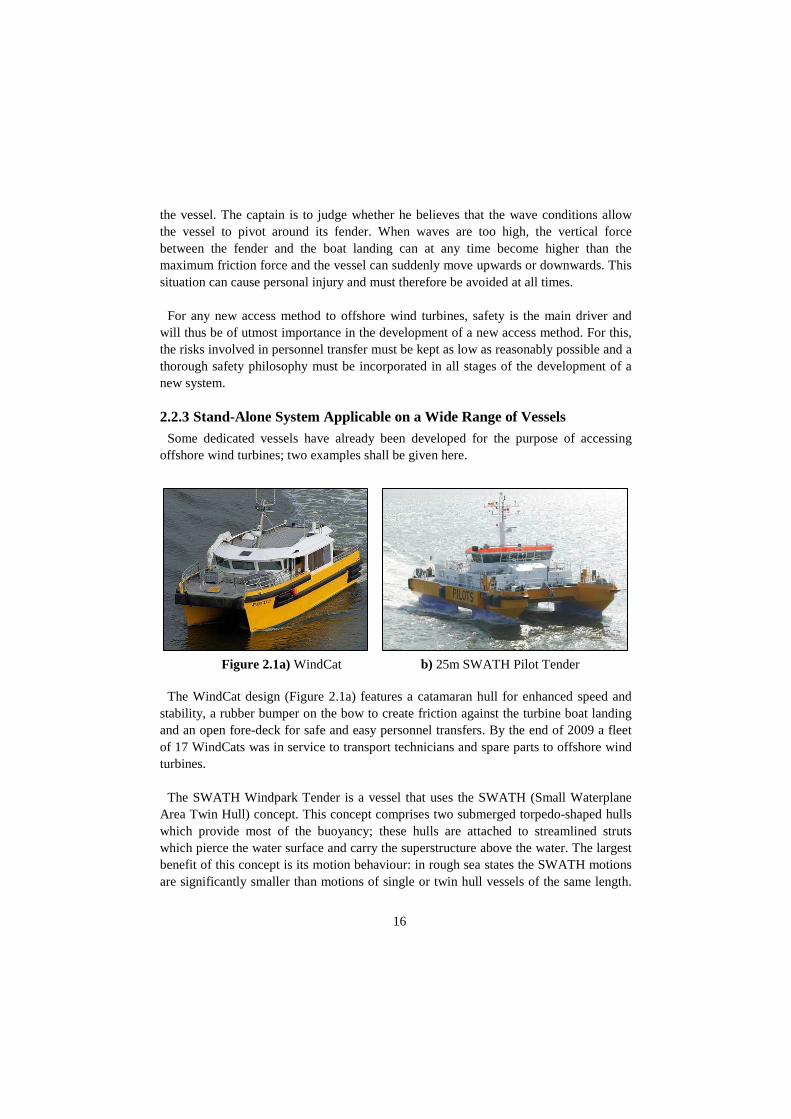
Figure 2.1a) WindCat b) 25m SWATH Pilot Tender The WindCat design (Figure 2.1a) features a catamaran hull for enhanced speed and
stability, a rubber bumper on the bow to create friction against the turbine boat landing and an open fore-deck for safe and easy personnel transfers. By the end of 2009 a fleet of 17 WindCats was in service to transport technicians and spare parts to offshore wind turbines.
The SWATH Windpark Tender is a vessel that uses the SWATH (Small Waterplane
Area Twin Hull) concept. This concept comprises two submerged torpedo-shaped hulls which provide most of the buoyancy; these hulls are attached to streamlined struts which pierce the water surface and carry the superstructure above the water. The largest benefit of this concept is its motion behaviour: in rough sea states the SWATH motions are significantly smaller than motions of single or twin hull vessels of the same length.

17
Disadvantages are that a SWATH is more expensive and uses more power than an equivalent sized catamaran. The design of the SWATH Windpark Tender is derived directly from the proven design of the Pilot Tender (Figure 2.1b) and modified to the needs of the offshore wind industry [11]. The transfer of personnel is enabled by pushing the fender of one of the two bows against a wind turbine’s boat landing to create a pivot point around the fender. Based on tests with the Pilot Tender transfers are expected to be possible in sea states with a significant wave height up to approximately 2.0m to 2.5m. The first delivery of this vessel is planned for 2010.
Future offshore wind farms are likely to comprise a large number of turbines and will
therefore require more visits per farm than present wind farms. As a result, vessels may have to accommodate more personnel and spare parts. In case a wind farm is placed far offshore, the use of a vessel with a high cruising speed is preferred to reduce travelling time between port and wind farm. Another solution for reducing travelling time is to have living quarters located offshore near the wind farm: technicians can then stay in the farm for longer periods of time and most access operations will require only short trips within the farm. It can be concluded that the eventual choice of maintenance vessel highly depends on the wind farm characteristics.
For the purpose of offshore access it would be beneficial to create a personnel transfer
system that can be used on a range of vessels and thus becomes widely applicable. The benefit of such a system is that the choice of vessel can be made solely to fit the wind farm characteristics. For this reason this research will focus on developing a personnel transfer system that can be installed on a range of vessels. A prerequisite for such a system is also that it can function independently of vessel facilities (e.g. power, hydraulics): it must be a fully self-supporting system.
2.2.4 Increased Accessibility To gain insight in the accessibility of typical offshore wind farms, two Dutch offshore
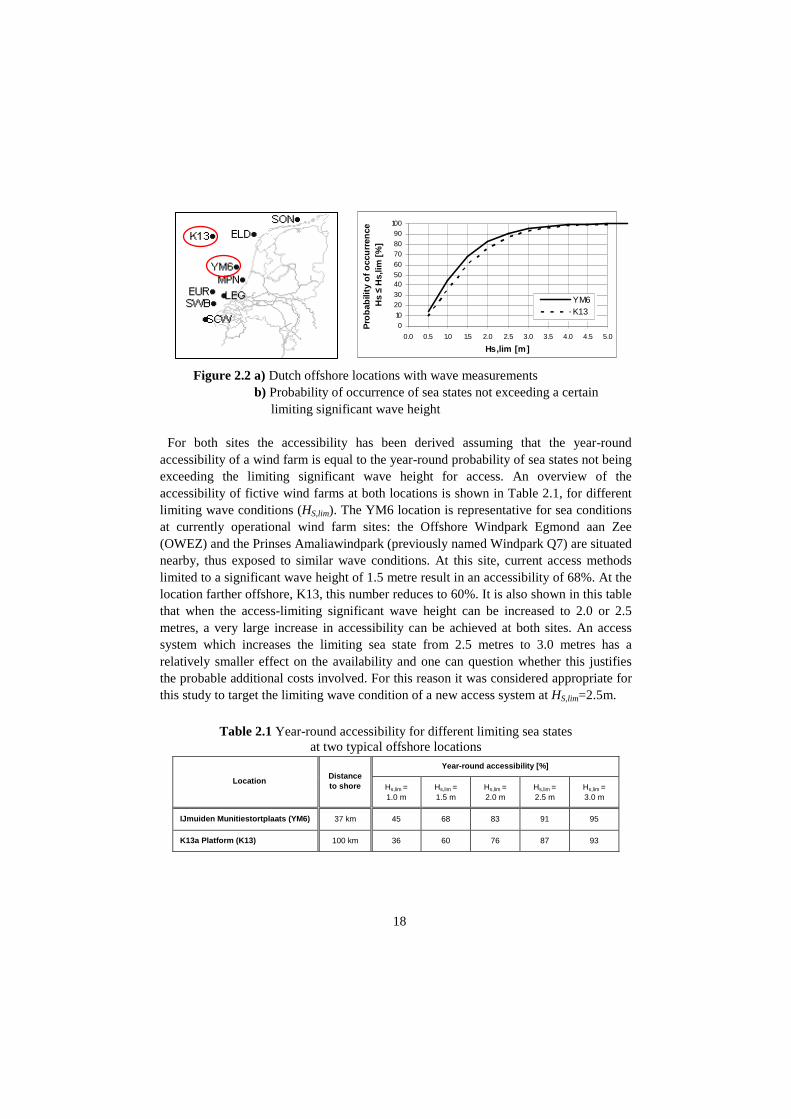
locations with available wave data have been examined (Figure 2.2a): The IJmuiden Munitiestortplaats (YM6) and the K13a platform (K13). The former is situated approximately 37 km offshore, the latter at a distance of about 100 km from shore. Scatter diagrams with the yearly distribution of sea states of both locations were used to determine the year-round accessibility of fictive wind farms at these two sites using different limiting sea states (determined by the selected transfer method). For this, first the probability of occurrence of sea states up to a certain limiting significant wave height has been plotted as a function of the limiting significant wave height (HS,lim) for these two locations in Figure 2.2b. This data was taken from the wave climate site of the National Institute for Coastal and Marine Management / RIKZ [15].
18
Figure 2.2 a) Dutch offshore locations with wave measurements b) Probability of occurrence of sea states not exceeding a certain limiting significant wave height For both sites the accessibility has been derived assuming that the year-round
accessibility of a wind farm is equal to the year-round probability of sea states not being exceeding the limiting significant wave height for access. An overview of the accessibility of fictive wind farms at both locations is shown in Table 2.1, for different limiting wave conditions (HS,lim). The YM6 location is representative for sea conditions at currently operational wind farm sites: the Offshore Windpark Egmond aan Zee (OWEZ) and the Prinses Amaliawindpark (previously named Windpark Q7) are situated nearby, thus exposed to similar wave conditions. At this site, current access methods limited to a significant wave height of 1.5 metre result in an accessibility of 68%. At the location farther offshore, K13, this number reduces to 60%. It is also shown in this table that when the access-limiting significant wave height can be increased to 2.0 or 2.5 metres, a very large increase in accessibility can be achieved at both sites. An access system which increases the limiting sea state from 2.5 metres to 3.0 metres has a relatively smaller effect on the availability and one can question whether this justifies the probable additional costs involved. For this reason it was considered appropriate for this study to target the limiting wave condition of a new access system at HS,lim=2.5m.
Table 2.1 Year-round accessibility for different limiting sea states at two typical offshore locations
Year-round accessibility [%]
Location Distance to shore Hs,lim =
1.0 m Hs,lim = 1.5 m
Hs,lim = 2.0 m
Hs,lim = 2.5 m
Hs,lim = 3.0 m
IJmuiden Munitiestortplaats (YM6) 37 km 45 68 83 91 95
K13a Platform (K13) 100 km 36 60 76 87 93
0
10
2030
4050
60
7080
90100
0.0 0.5 1.0 1.5 2.0 2.5 3.0 3.5 4.0 4.5 5.0
Hs,lim [m]
Pro
babi
lity
of o
ccur
renc
eH
s ≤ H
s,lim
[%]
YM6K13

19
2.2.5 No Need for Special Provisions on the Turbines It has been stated earlier that future wind farms are expected to comprise a larger
number of turbines than current farms. The preferred situation is thus to avoid the need for any appurtenances or large modifications to the turbines specifically for enabling access. In the light of the expected size of future wind farms, any costly adaptation necessary to enable the use of an access system will result in a significant increase of the total wind farm investment costs.
An example of a special provision on a turbine required for access is the hoisting deck
on top of the nacelles at the Horns Rev wind farm (Figure 2.3). These decks are mounted on all turbines to enable the transfer of personnel from a helicopter. Another access method which requires an additional structure to enable personnel transfer is the Offshore Access System (OAS). This system has been used to access platforms in the oil and gas industry and connects a ship-based gangway to a vertical pole on a dedicated landing platform as shown in Figure 2.4. Access with the OAS therefore is only possible to offshore structures which have such a landing platform installed.
Figure 2.3 Hoisting deck on top of a nacelle
Figure 2.4 a) OAS connected to landing platform b) OAS landing platform
The need for a special provision on every turbine requires a specific concept for
maintenance being chosen at a very early stage of the wind farm design and brings along extra costs for fabrication and installation of the structure. Also, the additional forces applied on this structure are to be taken into account in the wind turbine support structure design. For these reasons, one of the aims of this research will be to find a solution for offshore access that avoids the need for any special provisions on the wind turbines.

20
2.2.6 Conclusions In conclusion, the requirements for a new access system for offshore wind turbines
with a high safety standard can be listed as follows:
• Ship-based • Self-supporting: independent of vessel facilities • Applicable on different types of vessels • High accessibility: up to sea states with a significant wave height of HS =2.5m • No need for special provisions on the turbines.
2.3 Active motion compensation
2.3.1 Vessel Motions All transfers from a ship to a fixed offshore structure have to deal with the same
problem that makes these transfers difficult: due to wave forces a ship is constantly in motion while the motions of a fixed structure are negligible. The main problem of safe transfers is caused by the relative motions between the moving vessel and the fixed landing point on the offshore structure. The wave induced ship motions can be described by the six degrees of freedom that a ship can experience relative to a fixed frame of reference: three translations (surge, sway and heave) and three rotations (roll, pitch and yaw). These six degrees of freedom are illustrated in Figure 2.5.
Figure 2.5 Six degrees of freedom of ship motions
In order to cope with the problem of the relative motions, the ideal situation would be
to minimize and preferably eliminate the relative motions between the transfer point on a ship and the landing point on a structure. The currently used transfer method from ships to offshore wind turbines addresses this problem by using the thrusters to push the vessel bow against the boat landing. The pushing force eliminates the surge motion of the vessel at the bow, while the sway and heave at the bow will be negligible due to the
Surge
Sway
Heave
Pitch
Roll
Yaw

21
friction between the bow fender and the boat landing. During this procedure, the vessel will still experience some roll, pitch and yaw motions around the point of contact.
The offshore and dredging industries have been dealing with issues related to ship
motions for decades. Amongst the more advanced solutions are motion compensating systems which are actively controlled to minimize motions in at least one degree of freedom. A selection of active motion compensating systems used in the offshore industry is presented in this section.
2.3.2 Active Heave Compensated Cranes When a crane vessel is installing equipment or goods offshore, it uses a crane to lift
and lower the loads to their destination. Due to wave induced ship motions, the heave motions at the tip of the crane can cause large force variations in the crane and lifting cable during lifting and lowering. In addition, these motions can result in high impact forces when the load reaches its final destination. Heave compensation systems have been developed to reduce the potentially high force variations and impact loads. While passive heave compensators reduce the effects of heave reactively, active heave compensators actually aim at keeping a load hanging from a crane isolated from the heave motions while the crane tip moves. A brief elaboration on active heave compensated cranes is presented here.
Figure 2.6 Crane with active heave compensation
A schematic overview of an active heave compensated crane is shown in Figure 2.6.
The crane tip heave can be derived from motion sensor measurements and this heave can be compensated for by adjusting the lifting cable length using a cylinder. The lifting cables are wound over sheaves and one of the sheaves is attached to the cylinder. By extending or retracting the cylinder, the cable lengths change. For example, if the crane tip heaves 1m upwards this is detected by the motion sensor and the controller retracts the cylinder by 0.5m (half the crane tip heave) creating an additional cable length of 1m.
Motion Sensor
Controller
Load
Control Signal Position
Crane Tip Heave Motion
Sheave Motion
Cylinder
Sheave
Lifting Cable
22
The load then lowers 1m as seen from the crane tip, while the crane tip itself has moved 1m upwards. The resulting heave motion of the load has thus become zero: the heave motion of the load has been compensated. This system is fast and accurate enough to achieve a rest-movement relative to the seabed of 6% for a crane tip heave of 5m [16].
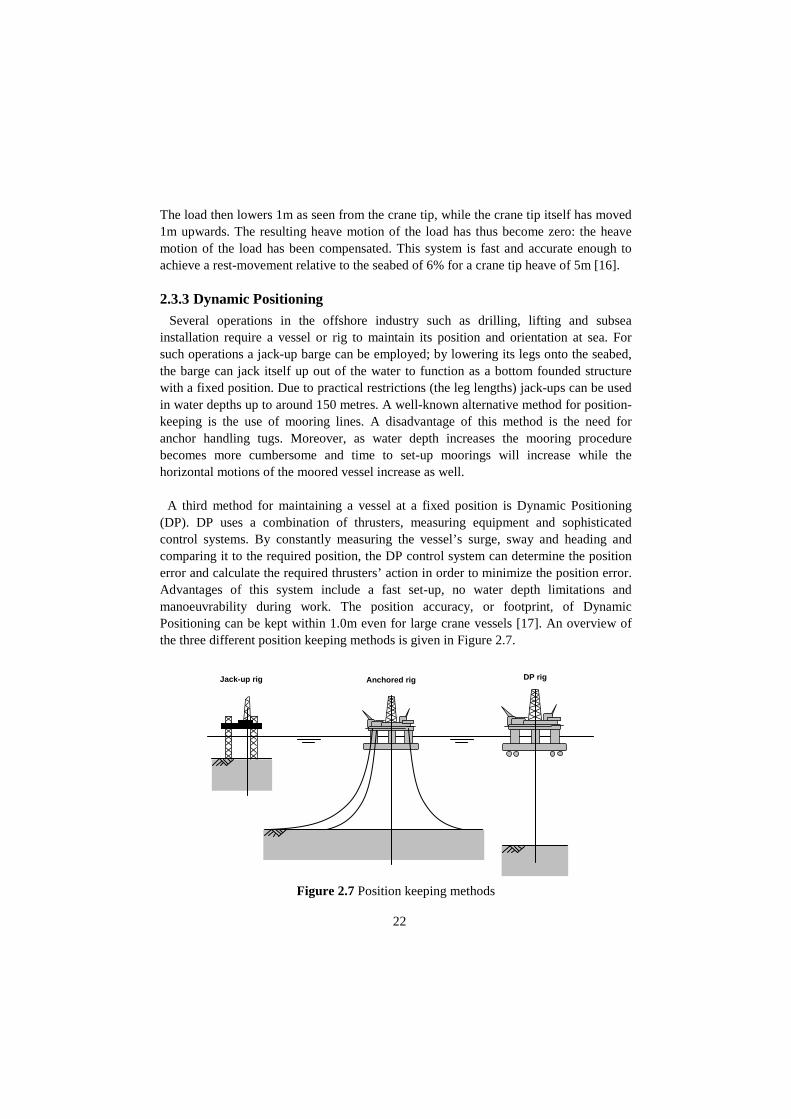
2.3.3 Dynamic Positioning Several operations in the offshore industry such as drilling, lifting and subsea
installation require a vessel or rig to maintain its position and orientation at sea. For such operations a jack-up barge can be employed; by lowering its legs onto the seabed, the barge can jack itself up out of the water to function as a bottom founded structure with a fixed position. Due to practical restrictions (the leg lengths) jack-ups can be used in water depths up to around 150 metres. A well-known alternative method for position-keeping is the use of mooring lines. A disadvantage of this method is the need for anchor handling tugs. Moreover, as water depth increases the mooring procedure becomes more cumbersome and time to set-up moorings will increase while the horizontal motions of the moored vessel increase as well.
A third method for maintaining a vessel at a fixed position is Dynamic Positioning
(DP). DP uses a combination of thrusters, measuring equipment and sophisticated control systems. By constantly measuring the vessel’s surge, sway and heading and comparing it to the required position, the DP control system can determine the position error and calculate the required thrusters’ action in order to minimize the position error. Advantages of this system include a fast set-up, no water depth limitations and manoeuvrability during work. The position accuracy, or footprint, of Dynamic Positioning can be kept within 1.0m even for large crane vessels [17]. An overview of the three different position keeping methods is given in Figure 2.7.
Figure 2.7 Position keeping methods
Jack-up rig Anchored rig DP rig
23
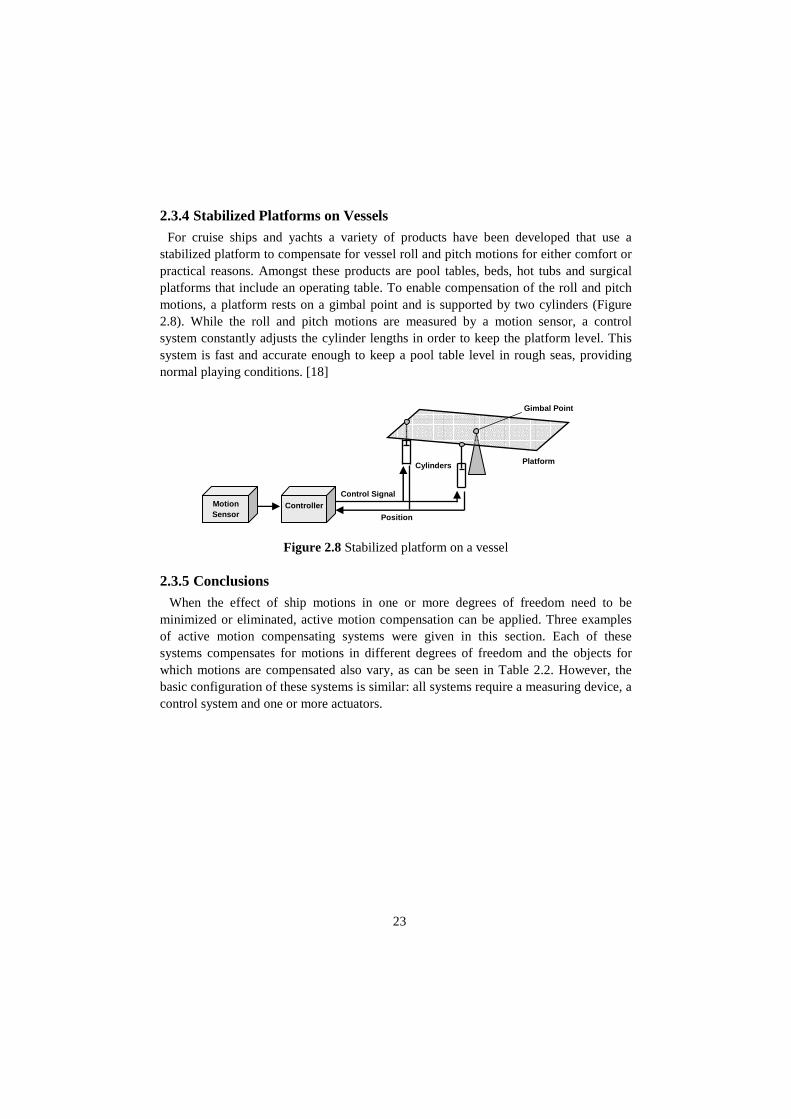
2.3.4 Stabilized Platforms on Vessels For cruise ships and yachts a variety of products have been developed that use a
stabilized platform to compensate for vessel roll and pitch motions for either comfort or practical reasons. Amongst these products are pool tables, beds, hot tubs and surgical platforms that include an operating table. To enable compensation of the roll and pitch motions, a platform rests on a gimbal point and is supported by two cylinders (Figure 2.8). While the roll and pitch motions are measured by a motion sensor, a control system constantly adjusts the cylinder lengths in order to keep the platform level. This system is fast and accurate enough to keep a pool table level in rough seas, providing normal playing conditions. [18]
Figure 2.8 Stabilized platform on a vessel
2.3.5 Conclusions When the effect of ship motions in one or more degrees of freedom need to be
minimized or eliminated, active motion compensation can be applied. Three examples of active motion compensating systems were given in this section. Each of these systems compensates for motions in different degrees of freedom and the objects for which motions are compensated also vary, as can be seen in Table 2.2. However, the basic configuration of these systems is similar: all systems require a measuring device, a control system and one or more actuators.
Motion Sensor
Controller Control Signal Position
Platform Cylinders Gimbal Point
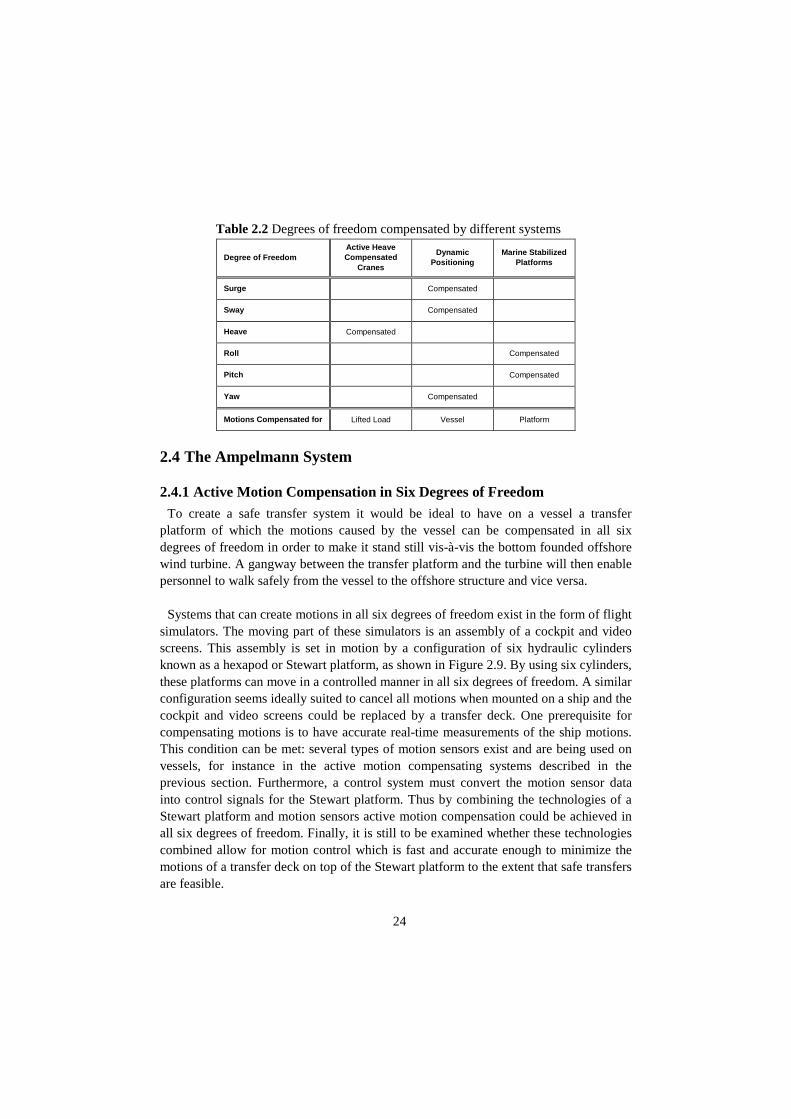
24
Degree of Freedom Active Heave Compensated
Cranes
Dynamic Positioning
Marine Stabilized Platforms
Surge Compensated
Sway Compensated
Heave Compensated
Roll Compensated
Pitch Compensated
Yaw Compensated
Motions Compensated for Lifted Load Vessel Platform
2.4 The Ampelmann System
2.4.1 Active Motion Compensation in Six Degrees of Freedom To create a safe transfer system it would be ideal to have on a vessel a transfer
platform of which the motions caused by the vessel can be compensated in all six degrees of freedom in order to make it stand still vis-à-vis the bottom founded offshore wind turbine. A gangway between the transfer platform and the turbine will then enable personnel to walk safely from the vessel to the offshore structure and vice versa.
Systems that can create motions in all six degrees of freedom exist in the form of flight
simulators. The moving part of these simulators is an assembly of a cockpit and video screens. This assembly is set in motion by a configuration of six hydraulic cylinders known as a hexapod or Stewart platform, as shown in Figure 2.9. By using six cylinders, these platforms can move in a controlled manner in all six degrees of freedom. A similar configuration seems ideally suited to cancel all motions when mounted on a ship and the cockpit and video screens could be replaced by a transfer deck. One prerequisite for compensating motions is to have accurate real-time measurements of the ship motions. This condition can be met: several types of motion sensors exist and are being used on vessels, for instance in the active motion compensating systems described in the previous section. Furthermore, a control system must convert the motion sensor data into control signals for the Stewart platform. Thus by combining the technologies of a Stewart platform and motion sensors active motion compensation could be achieved in all six degrees of freedom. Finally, it is still to be examined whether these technologies combined allow for motion control which is fast and accurate enough to minimize the motions of a transfer deck on top of the Stewart platform to the extent that safe transfers are feasible.
Table 2.2 Degrees of freedom compensated by different systems

25
Figure 2.9 A flight simulator supported by a Stewart platform
2.4.2 The Ampelmann idea The concept of using a Stewart platform on top of a vessel to compensate for vessel
motions in all six degrees of freedom was first envisaged during the 2002 World Wind Energy Conference in Berlin by two Delft University PhD students, Jan van der Tempel and David-Pieter Molenaar. After a presentation on offshore access, they decided that a better access method needed to be introduced and created this idea. The envisaged system should ideally be so reliable that a maintenance engineer only needs to watch a pedestrian traffic light change to green to signal him that he can transfer safely: offshore access as easy as crossing the street. The concept was thus named "Ampelmann", meaning “traffic light man” in German, after the typical hat-wearing figure in the pedestrian lights in Berlin (Figure 2.10). Ampelmann has since become the trading name of the concept of the use of a Stewart platform on a ship for active motion compensation in six degrees of freedom.
Figure 2.10 Der Ampelmann, name giver to the concept

26
2.4.3 The Patent The concept of using a motion compensated transfer deck on hydraulic cylinders for
accessing offshore structures has been patented by the Delft University of Technology [19]. The basic configuration is shown in Figure 2.11: transfers to the access platform (2) of an offshore structure (1) from vessel (3) are provided by a motion controlled transfer platform (5) supported by 6 hydraulic cylinders (6) mounted on the vessel’s deck (4). While the vessel deck motions are registered with measuring equipment (7), the control system (8) can calculate the required cylinder lengths in order to keep the transfer platform motionless in comparison to the fixed world. The cylinders are then continuously commanded to the required lengths by the control system.
Figure 2.11 The Ampelmann patent
2.5 Research Objective and Thesis Approach
2.5.1 Problem Description As concluded in Chapter 1, the currently used ship-based transfer method to offshore
wind turbines results in an unacceptably low accessibility of future wind farms, especially when one considers the current trends in the offshore wind industry. A means to enable higher accessibility is to introduce a new transfer method that allows transferring personnel to offshore wind turbines in sea states well above the present limit of HS=1.5m. A new transfer method can be created by compensating ship motions in all six degrees of freedom with the use of a new concept, named “Ampelmann”. This concept combines measuring equipment, a control system and a Stewart platform to keep a transfer deck on a vessel (nearly) motionless relative to a fixed point of reference
1. Offshore Structure 2. Access Platform 3. Vessel 4. Ship Deck 5. Transfer Deck 6. Hydraulic Cylinders 7. Measuring equipment 8. Control System

27
to enable safe transfer to a fixed structure. Different types of active motion compensating systems have shown that motions in all degrees of freedom can in principle be compensated for. However, it is still to be proven that the Ampelmann concept is technically feasible and that this technology can actually increase accessibility of offshore wind farms meeting all the industry requirements, especially safety considerations.
2.5.2 Research Objective The main objective of this research is defined as follows:
“Prove that an Ampelmann system can, in a safe manner, significantly increase the accessibility of offshore wind turbines when compared to presently used systems”
This PhD study starts with the Ampelmann as an idea as described in the patent. The
main goal of this PhD study is to research whether the concept of motion compensation in six degrees of freedom can be developed into a real working transfer system for offshore wind turbines that significantly increases wind farm accessibility while meeting the requirements as stated in section 2.2. This required the development of an actual Ampelmann system with the design process strongly embedded in the research and with a close interaction between scientific study and design aspects. This thesis research has therefore been performed according to a research approach named design inclusive research [20]. This methodology is generally being used when the verification of a hypothesis and the proof of a theory can best be delivered after a prototype has been successfully designed, built and tested. The design and test results are therefore key elements of this research. Since it is hard, if not impossible, to present many of the research results in writing (e.g. the actual motion compensation) videos can be downloaded to show these parts of the work (see Appendix A).
2.5.3 Thesis Approach The main thesis objective was split into a series of sub-objectives. Although Stewart
platforms and motion sensors are both proven and widely used technologies, the concept of combining these technologies to cancel ship motions was new. This is translated into a hypothesis stating that the combined use of these technologies makes active compensation of vessel motions in six degrees of freedom technically feasible. Therefore, the first sub-objective was to prove the technical feasibility of the Ampelmann concept which was done by using a scale model. Once the technical concept had been proven viable, the next step was to develop a prototype Ampelmann system fit for its purpose and show that safe ship-based transfers to offshore wind turbines are possible in sea states well above HS=1.5m. This development had to incorporate a consistent safety philosophy throughout all design, construction and
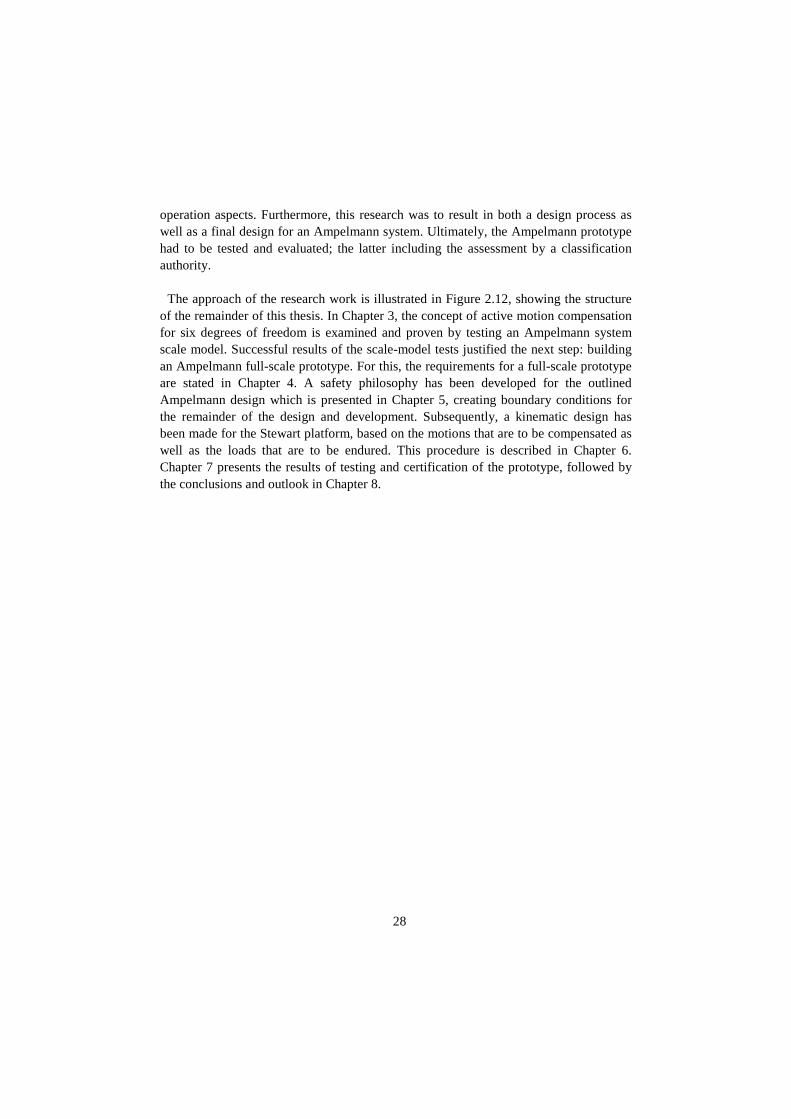
28
operation aspects. Furthermore, this research was to result in both a design process as well as a final design for an Ampelmann system. Ultimately, the Ampelmann prototype had to be tested and evaluated; the latter including the assessment by a classification authority.
The approach of the research work is illustrated in Figure 2.12, showing the structure
of the remainder of this thesis. In Chapter 3, the concept of active motion compensation for six degrees of freedom is examined and proven by testing an Ampelmann system scale model. Successful results of the scale-model tests justified the next step: building an Ampelmann full-scale prototype. For this, the requirements for a full-scale prototype are stated in Chapter 4. A safety philosophy has been developed for the outlined Ampelmann design which is presented in Chapter 5, creating boundary conditions for the remainder of the design and development. Subsequently, a kinematic design has been made for the Stewart platform, based on the motions that are to be compensated as well as the loads that are to be endured. This procedure is described in Chapter 6. Chapter 7 presents the results of testing and certification of the prototype, followed by the conclusions and outlook in Chapter 8.
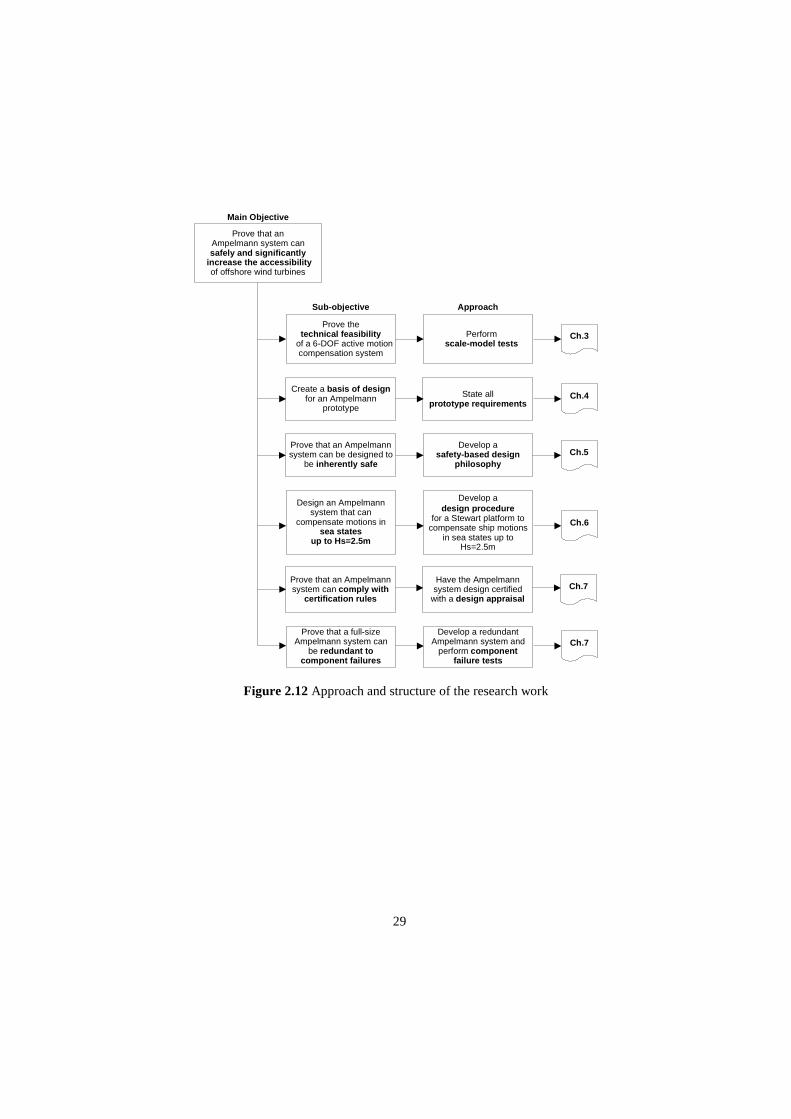
29
Figure 2.12 Approach and structure of the research work
Prove that an Ampelmann system cansafely and significantly
increase the accessibility of offshore wind turbines
Prove thetechnical feasibility
of a 6-DOF active motion compensation system
Create a basis of design for an Ampelmann
prototype
Prove that an Ampelmann system can be designed to
be inherently safe
Design an Ampelmann system that can
compensate motions in sea states
up to Hs=2.5m
Prove that a full-size Ampelmann system can
be redundant to component failures
Prove that an Ampelmann system can comply with
certification rules
Perform scale-model tests
State allprototype requirements
Develop asafety-based design
philosophy
Develop a design procedure
for a Stewart platform to compensate ship motions
in sea states up to Hs=2.5m
Develop a redundant Ampelmann system and
perform component failure tests
Have the Ampelmann system design certified
with a design appraisal
Ch.3
Ch.4
Ch.5
Ch.6
Ch.7
Ch.7
ApproachSub-objective
Main Objective

30

31
3. Ampelmann Scale Model Tests
3.1 Introduction In order to judge the viability of the Ampelmann system for offshore personnel
transfer, the first step was to prove the practical use of active motion compensation by means of a physical model. A small-sized scale model of the system was therefore assembled and tested first. The objective of this proof-of-concept phase was to prove that it is possible to compensate random ship motions using a Stewart platform combined with a measuring system. The combined system should be both fast and accurate enough to counteract the measured motions of the surface that the platform is mounted on in order to create a (nearly) stationary upper platform. In its most simplified form, the Ampelmann system will comprise three components: a motion sensor, a Stewart platform and a control system including software that can convert the motion data to the Stewart platform input in real-time. This basic system configuration is shown in Figure 3.1 and corresponds to the configuration of other active motion compensating systems as described in section 2.3.
Figure 3.1 Basic Ampelmann configuration In this chapter the requirements of the model of the system are stated first in section
3.2, followed by a description of the testing facilities used during this phase in section 3.3. Next, three main components of the Ampelmann system will be described: motion sensor (section 3.4), Stewart platform (section 3.5) and control system (section 3.6). Finally, the performed tests are described in sections 3.7 and 3.8, and the results are being evaluated in section 3.9.
3.2 Requirements for Scale Model Tests Motion sensors and Stewart platforms are commercial products, readily available on
the market. Since the combination of a motion sensor and a Stewart platform with the purpose of actively compensating motions was new, custom-made software had to be produced to enable motion data transfer from the motion sensor to the Stewart platform. A series of tests was to be performed to verify that (simulated) ship motions can be compensated. This required a test model, test facilities and procedures. Since a smaller Stewart platform is less expensive and requires simpler testing facilities, the physical model was chosen to be small-scale to minimize costs.
Motion Sensor
Control System
Stewart Platform

32
The main objective of testing a physical model was to verify that the combination of
the different technologies enables adequate motion compensation. Two characteristics are of high importance for this: accuracy and latency. Inaccuracy of either the measured motions (by the motion sensor) or the counteracting platform motions (by the Stewart platform) can result in residual motions of the transfer deck, defined here as motions relative to the fixed world due to insufficient compensation. The total latency of the system, defined here as the time lag between the actual ship motion and the counteracting platform motion, will also result in residual motions. Latencies occur in all three system components: the motion sensor, converter software and Stewart platform. Both the inaccuracies and the latencies of the different components are difficult to measure: any reference measurement device has a latency and inaccuracy of its own. Therefore, measuring the residual motions of the transfer deck appears to be the most appropriate way to validate the motion compensation capability during the tests. The residual motions of the transfer deck must be small to provide personnel with a base stable enough to stand and walk on in a safe manner.
The motion compensating capabilities of the physical model had to be tested in the
frequency range of realistic ship motions. Table 1.3 in Chapter 1 provided a scatter diagram of the sea states at a typical Dutch offshore site in the vicinity of two existing wind farms. This scatter diagram shows that practically all sea states have a mean zero-crossing period between 2 and 10 seconds. This implies that the mean wave frequencies of the sea states are expected to be in the range of 0.1 – 0.5 Hz. Since ship motions are wave induced, the ship motions in all six degrees of freedom are expected to be within this same frequency range. Therefore, the scale model tests were to be performed using motions in the frequency range between 0.1 and 0.5 Hz.
The question to be answered next was whether successful testing of a model with a
small Stewart platform would also prove the proper functioning of a full-scale model. The plan was to use the same motion sensor and converter software in both the small-scale and full scale model, narrowing the question down to whether a large Stewart platform can perform motions with the same accuracy and speed as a small one. Large Stewart platforms are commonly used for flight simulators, which always require a very precise motion control. Both, experts on hydraulics and flight simulators confirmed that the scale of a Stewart platform has only a minor influence on the motion performance; the accuracy of platform motions is predominantly determined by the cylinder characteristics, type of valves and the control system.
This led to the following requirements for the technical feasibility tests:
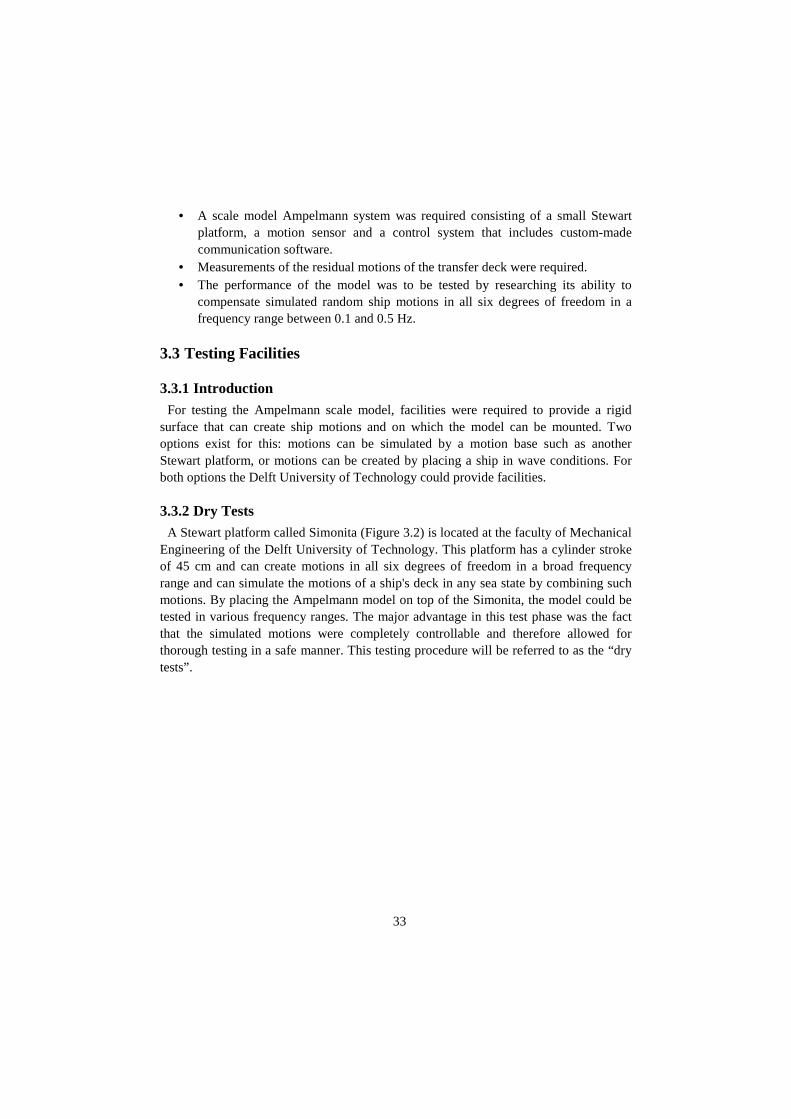
33
• A scale model Ampelmann system was required consisting of a small Stewart platform, a motion sensor and a control system that includes custom-made communication software.
• Measurements of the residual motions of the transfer deck were required. • The performance of the model was to be tested by researching its ability to
compensate simulated random ship motions in all six degrees of freedom in a frequency range between 0.1 and 0.5 Hz.
3.3 Testing Facilities
3.3.1 Introduction For testing the Ampelmann scale model, facilities were required to provide a rigid
surface that can create ship motions and on which the model can be mounted. Two options exist for this: motions can be simulated by a motion base such as another Stewart platform, or motions can be created by placing a ship in wave conditions. For both options the Delft University of Technology could provide facilities.
3.3.2 Dry Tests A Stewart platform called Simonita (Figure 3.2) is located at the faculty of Mechanical
Engineering of the Delft University of Technology. This platform has a cylinder stroke of 45 cm and can create motions in all six degrees of freedom in a broad frequency range and can simulate the motions of a ship's deck in any sea state by combining such motions. By placing the Ampelmann model on top of the Simonita, the model could be tested in various frequency ranges. The major advantage in this test phase was the fact that the simulated motions were completely controllable and therefore allowed for thorough testing in a safe manner. This testing procedure will be referred to as the “dry tests”.
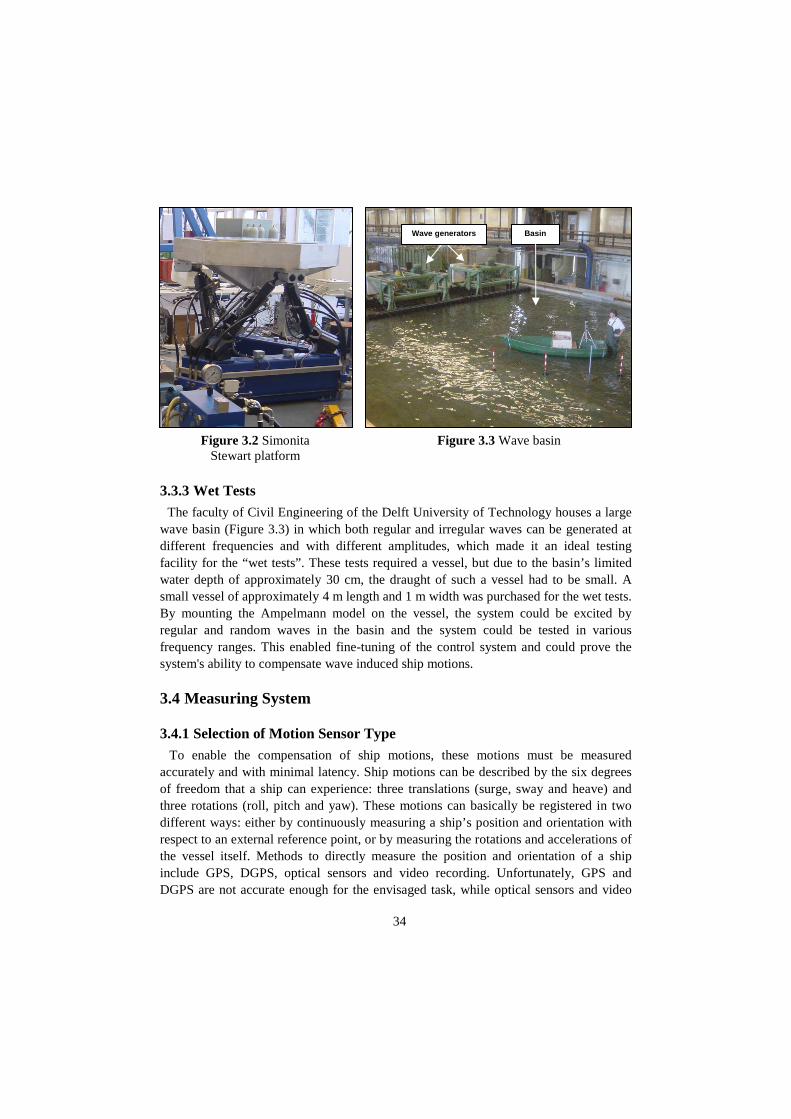
34
Figure 3.2 Simonita Stewart platform
Figure 3.3 Wave basin
3.3.3 Wet Tests The faculty of Civil Engineering of the Delft University of Technology houses a large
wave basin (Figure 3.3) in which both regular and irregular waves can be generated at different frequencies and with different amplitudes, which made it an ideal testing facility for the “wet tests”. These tests required a vessel, but due to the basin’s limited water depth of approximately 30 cm, the draught of such a vessel had to be small. A small vessel of approximately 4 m length and 1 m width was purchased for the wet tests. By mounting the Ampelmann model on the vessel, the system could be excited by regular and random waves in the basin and the system could be tested in various frequency ranges. This enabled fine-tuning of the control system and could prove the system's ability to compensate wave induced ship motions.
3.4 Measuring System
3.4.1 Selection of Motion Sensor Type To enable the compensation of ship motions, these motions must be measured
accurately and with minimal latency. Ship motions can be described by the six degrees of freedom that a ship can experience: three translations (surge, sway and heave) and three rotations (roll, pitch and yaw). These motions can basically be registered in two different ways: either by continuously measuring a ship’s position and orientation with respect to an external reference point, or by measuring the rotations and accelerations of the vessel itself. Methods to directly measure the position and orientation of a ship include GPS, DGPS, optical sensors and video recording. Unfortunately, GPS and DGPS are not accurate enough for the envisaged task, while optical sensors and video
Basin Wave generators

35
recording would require equipment to be placed on a fixed structure. An Inertial Measurement Unit (IMU) can measure motions in all six degrees of freedom using three gyroscopes and three accelerometers. The gyroscopes provide rotational velocities which are integrated once to find the rotations. The positions are derived from the three measured accelerations by double integration. However, these computations are known to cause drift. When accelerations are measured, the gravitational acceleration is always included in the raw measurements. This gravitational acceleration needs to be subtracted from the measurements. For this, the unit needs to find the exact direction of gravity. Small errors in the rotational measurements lead to errors in the assumed direction of gravity. This results in small errors in all three accelerations when gravity is subtracted. Eventually these errors in the accelerations can cause drift in the computed positions, since the double integration can diverge to infinity very quickly with time. Drift effects can be mitigated by imposing on the translational data a high-pass filter with a cut-off frequency near zero. While bearing in mind the possible drift effects, an IMU appears to be the most apt sensor to use in a motion compensation system.
3.4.2 Testing of Motion Sensors Two different IMU systems were made available for the tests by the dredging
company Royal Boskalis Westminster N.V.: a Seatex MRU and an Octans III manufactured by iXSea. Both measuring devices are commonly used by Boskalis during dredging operations. To examine the drift effects as well as accuracy, the sensors were tested on top of a motion platform (Simonita) as shown in Figure 3.4 and elaborated upon in Appendix A1. By having the Simonita platform perform different motions and comparing these motions with the resulting sensor measurements the drift and the accuracy of the sensors was examined. The drift problems of the Seatex MRU were too large to ignore. The iXSea Octans, shown in Figure 3.5, had negligible drift and only small errors and was therefore considered suitable for use in the Ampelmann system. The absolute difference between the controlled platform translations and the Octans measurements did not exceed 3 cm, which was smaller than the accuracy of 5 cm claimed by the manufacturer. The difference between the intended platform rotations and the measured rotations (absolute rotational errors) was up to 0.3 degrees against a 0.01 degrees accuracy claimed by the manufacturer. However, these larger errors were an inaccuracy of the Stewart platform motions, rather than inaccuracy of the Octans sensors as confirmed by the Simonita operator. While testing the Octans, contact was made with its manufacturer iXSea, who was prepared to provide an Octans during the subsequent test phases and willing to assist with their expertise.

36
Figure 3.4 Test set-up with motion sensor mounted on the SIMONITA
3.4.3 Octans Technology The Octans system contains three fibre optic gyroscopes (FOGs), three accelerometers
and a real-time DSP (digital signal processing) computer. While the conventional mechanical gyroscopes use a rapidly spinning wheel to measure rotations, FOGs utilize a physical phenomenon called the Sagnac Effect. Since understanding this phenomenon requires knowledge of special relativity, only a simplified inaccurate physical interpretation of the Sagnac Effect will be given here. Two pulses of light are injected simultaneously into the two opposite ends of a coil of optical fibre as shown in Figure 3.6. In a motionless situation, the time to travel through the coil will be the same in both directions, and the two pulses will therefore exit the fibre at the same time (Figure 3.7a and b). If the coil is rotating around its central axis however, the two pulses will exit the coil at different times: relative to the coil the rotation of the coil “speeds up” one pulse and “slows down” the other (Figure 3.7a and c). The rotational speed of the coil can then be determined through the measurement of this time shift. The FOG technology [21] has two significant advantages over conventional mechanical gyroscopes. Since it has no moving parts, it is less sensitive to damage. Secondly, this technology allows for better measurement accuracies. The three FOGs therefore enable continuous measurement of the Octans rotation rate, while the three accelerometers provide the sum of the acceleration and apparent gravity. The Octans computer finally converts this raw data into three translations (surge, sway and heave) and three rotations (roll, pitch and heading) after filtering out the gravitational acceleration and the earth’s rotation rate. The roll and pitch angles are measured relative to the horizontal plane orthogonal to the direction of gravity. True heading is measured relative to the North direction from which the yaw can be derived. The heave, surge and sway outputs are high-pass filtered
Motion sensor
SIMONITA
SIMONITA Motion control

37
using a cut-off frequency close to zero, causing the outputs to always return to zero when Octans is static.
Figure 3.5 Octans motion sensor Figure 3.6 Coil of optical fibre
Figure 3.7 The Sagnac Effect
3.5 Stewart Platform
3.5.1 Introduction The Stewart platform is a mechanism that consists of a rigid top and a rigid base,
connected by six linear actuators, enabling the two bodies to move relative to each other in six degrees of freedom (6DoF). Typical for a Stewart platform is its (nearly) octahedral configuration, which distinguishes it from other types of hexapods. An octahedron is a spatial geometrical figure composed of eight equilateral triangles as shown in Figure 3.8. It can be visualized as either two pyramids attached at their bottom sides or as two triangles connected through six lines.
Figure 3.8 An octahedron visualized as two pyramids attached at their bottom sides and as two triangles connected through six lines
a b
c
rotaterotate
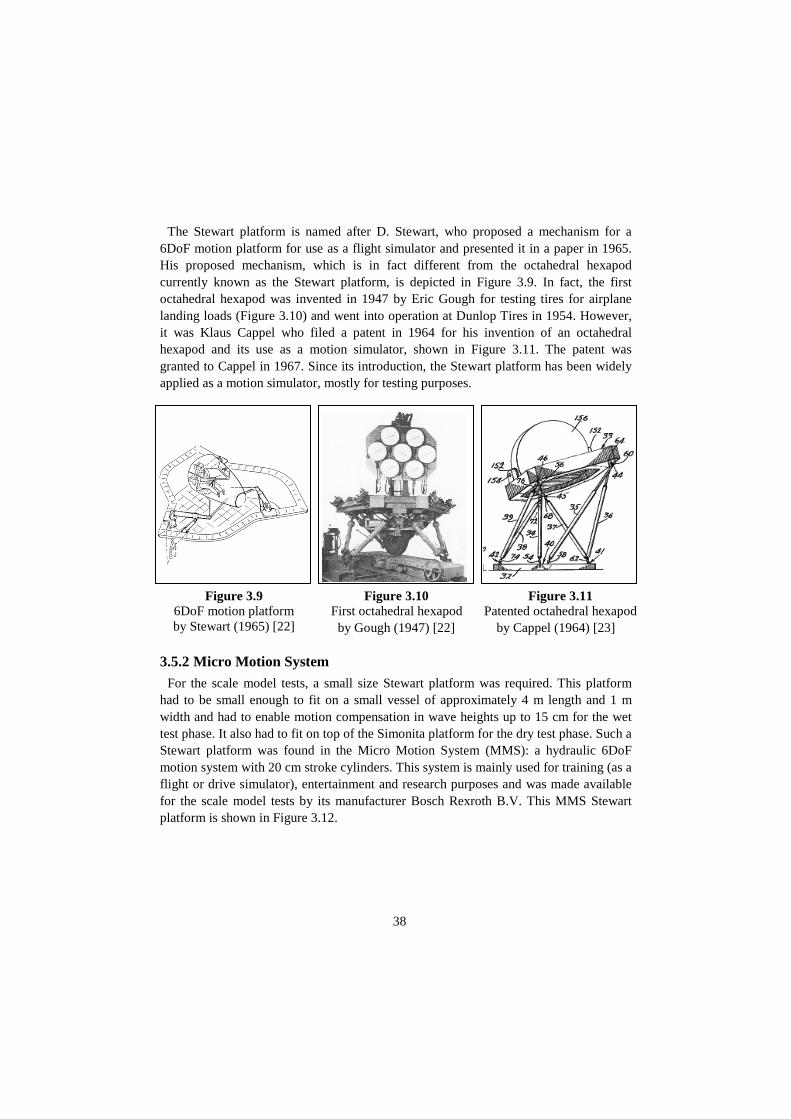
38
The Stewart platform is named after D. Stewart, who proposed a mechanism for a
6DoF motion platform for use as a flight simulator and presented it in a paper in 1965. His proposed mechanism, which is in fact different from the octahedral hexapod currently known as the Stewart platform, is depicted in Figure 3.9. In fact, the first octahedral hexapod was invented in 1947 by Eric Gough for testing tires for airplane landing loads (Figure 3.10) and went into operation at Dunlop Tires in 1954. However, it was Klaus Cappel who filed a patent in 1964 for his invention of an octahedral hexapod and its use as a motion simulator, shown in Figure 3.11. The patent was granted to Cappel in 1967. Since its introduction, the Stewart platform has been widely applied as a motion simulator, mostly for testing purposes.
Figure 3.9 6DoF motion platform by Stewart (1965) [22]
Figure 3.10 First octahedral hexapod by Gough (1947) [22]
Figure 3.11 Patented octahedral hexapod
by Cappel (1964) [23]
3.5.2 Micro Motion System For the scale model tests, a small size Stewart platform was required. This platform
had to be small enough to fit on a small vessel of approximately 4 m length and 1 m width and had to enable motion compensation in wave heights up to 15 cm for the wet test phase. It also had to fit on top of the Simonita platform for the dry test phase. Such a Stewart platform was found in the Micro Motion System (MMS): a hydraulic 6DoF motion system with 20 cm stroke cylinders. This system is mainly used for training (as a flight or drive simulator), entertainment and research purposes and was made available for the scale model tests by its manufacturer Bosch Rexroth B.V. This MMS Stewart platform is shown in Figure 3.12.

39
Figure 3.12 Micro Motion System
Besides the Stewart platform, the main components of the Micro Motion System are a
Hydraulic Power Unit (HPU) to provide the hydraulic pressure, a Motion Control Cabinet (MCC) to house the electronics and the MMS Motion Computer for controls. To create real-time motions of the Stewart platform, real-time set points for all six degrees of freedom (surge, sway, heave, roll, pitch and yaw) are to be sent from a host computer through an Ethernet interface to the MMS Motion Computer since the latter computer cannot be programmed by users. No host computer is included in the MMS; a host computer with dedicated Converter Software to convert the Octans measurement data into real-time motion set points for the Motion Computer had to be produced for this scale model. The entire Ampelmann scale model set-up can now be schematized as shown in Figure 3.13.
Figure 3.13 Ampelmann scale model set-up
3.6 Control System Special software had to be written to enable the Octans measurements to be instantly
transformed into input for the Micro Motion System. This software, the Ampelmann Converter Software, reads out the Octans data from a serial port, converts this data to the proper protocol for the MMS control and enables transmitting the output through an
Octans Host Computer
Micro Motion System
MMS Motion
Computer
Stewart Platform MCC
HPU
Converter Software
Motion Sensor Control System Stewart Platform (incl. HPU)

40
Ethernet connection. In addition, a user interface was added to set the communication and filter parameters, monitor the inputs and outputs and enter platform commands.
Since this software was custom-made, it had to be tested thoroughly before starting the
two test phases. This was done first by performing motions with the Octans and comparing these motions to the Octans output in its own monitoring software. Next, the Octans output was compared to the Converter input. This input was used directly as Converter output to serve in turn as input for the MMS. Finally, visual motion tests were performed, where the Octans was used as a 6DoF "joystick" to move the MMS (Figure 3.14 and Appendix A2) providing the first satisfactory results and proving that the input (manual manipulation of the Octans) and output (MMS motions) were the same.
Next, the control system had to be prepared to enable motion compensation in the test
phases. The principle of motion compensation is illustrated in Figure 3.15. Prior to motion compensation, the Stewart platform starting position has to be at half of its maximum heave elevation to enable motion compensation in all directions. This position is called its neutral position and is shown in Figure 3.15a. Subsequently the surface that the Stewart platform is mounted on can be moved. If the platform is not compensating, the top plate representing a transfer deck will experience translations and rotations (Figure 3.15b). To counteract these motions, the Stewart platform has to perform the exact opposite motions for the top plate to obtain its original position and orientation (Figure 3.15c). If these opposite motions are performed simultaneously, the top plate will remain motionless relative to the fixed world and active motion compensation will be achieved.
Figure 3.14 Testing of the control software by manipulating the Octans and visually checking the MMS motions

41
Rigid Surface
Figure 3.15a) Stewart platform in
neutral position
b) Surface moves; motion of top plate if platform is not
compensating
c) Platform performs opposite motion causing
top plate to obtain original position and orientation
Thus for motion compensation the control system needs to know the “virtual” motions
of the centre of the MMS top plate as if it was in neutral position and moving with the rigid surface it is mounted on. After the Octans is mounted on a rigid surface together with the MMS, the coordinates of the centre of the top plate of the MMS in its neutral position (half of its maximum heave elevation) are to be determined within the Octans reference frame and entered into the Octans software (Figure 3.16a). The Octans can subsequently measure the 6DoF motions of the MMS top plate as if the platform was in neutral position and not compensating motions (Figure 3.16b).
Figure 3.16a) Coordinates of centre of Stewart platform top plate in Octans
reference frame
b) Octans measuring “virtual” top plate motions
3.7 Dry Tests
3.7.1 Dry Test Set-Up The dry tests have been performed by placing the Octans and MMS on the larger
Stewart platform Simonita. The test set-up is shown in Figure 3.17. By connecting Octans and MMS to the host computer, the total arrangement could be used to
Octans Reference Frame
Stewart platform Top Plate
Octans
Motion Measured by Octans
x
y
z
Stewart Platform
Rigid Surface
Motion Oppostie Motion

42
compensate motions induced by the supporting Stewart platform and as such this arrangement constituted the first Ampelmann system. Tests were performed for each degree of freedom first; this was done using regular sinusoidal motions at different frequencies for each degree of freedom. Secondly, tests were performed with motions in all six degrees of freedom combined (Appendix A3). The residual motions of the upper platform of the MMS during motion compensation were measured using fixed laser beams pointing on targets on the top deck of the upper platform. These targets enabled a visual representation of the residual motions of the MMS upper plate (Figure 3.18). Deviations of the laser points hitting the target from its centre gave an instantaneous insight in the accuracy of motion compensation.
Figure 3.17 Dry test set-up Figure 3.18 Laser beams pointing on targets
3.7.2 Performance The results of the motion compensation tests for the individual three translations have
been plotted in Figure 3.19. This figure shows that the system performs quite well for frequencies from 0.2 to 0.3 Hertz, since the residual motions of the MMS upper plate are within the accuracy of the motion sensor. However, for frequencies outside this range, the errors become larger. When the low frequency motions at 0.1 Hz are considered, the translational accelerations become very low (≤ 0.04 m/s2) due to the very small motion amplitudes; this causes less accurate Octans measurements since positions are derived from the accelerations. When motions with a frequency of 0.4 Hz and up are to be compensated, the MMS Stewart platform reaches its velocity boundaries: 0.25m/s for surge and sway, 0.20 m/s for heave. Consequently, the compensating platform can no longer keep up with the motions of the lower platform, resulting in residual motions of the MMS top plate and the targets.
Laser Beam Target

43
Figure 3.19 Single DoF tests:
Residual motions for translational motions
Figure 3.20 Single DoF tests:
Residual motions for rotational motions
In Figure 3.20 the results are shown of the motion compensation tests per rotational
degree of freedom. Again, the system performs quite well for frequencies from 0.2 to 0.3 Hertz and errors stay within the accuracy of the motion sensor. For these tests the Simonita performed pure rotations. As a consequence, a roll motion at the bottom of the MMS induces a sway motion at the MMS upper platform level that also has to be counteracted. Similarly, a pitch motion produces a surge motion at the MMS top plate level. Due to these combined motions that were to be counteracted by the MMS, the maximum MMS velocities were reached at test frequencies of 0.4 Hertz and up for the roll and pitch tests. At frequencies lower than 0.2 Hertz, the translational accelerations of the MMS upper platform again become very low causing less accurate Octans measurements. Because the yaw motion causes no additional translations at the MMS top plate level, the compensation of this motion showed good results: within 3cm for sinusoidal motions in frequencies up to 0.4 Hertz compared to deviations of 7cm when motions are not compensated.
Finally, tests were performed with motions in all six degrees of freedom combined,
using amplitudes of 7 cm for all three translations and 3 degrees for the three rotations. During these tests the displacements of the upper platform stayed well within 2 cm as long as the motions of the lower platform stayed in the mentioned frequency range of 0.2 to 0.3 Hz. This does not cover the entire required frequency range mentioned earlier and which was set at 0.1 to 0.5 Hz, but the performance was enhanced to cover a wider frequency range at a later stage during the wet tests.
Residual motions per translational DOF
0 1 2 3 4 5 6 7 8
0 0.2 0.4 0.6
y (A=10cm) x (A=10cm) z (A=8cm)
Frequency [Hz] Res
idua
l Mot
ion
Am
plitu
de [c
m]
Residual motions per rotational DOF
0 1 2 3 4 5 6 7
0 0.2 0.4 0.6
Pitch (A=0.1rad)Roll (A=0.1rad)
Yaw (A=0.1rad)
Frequency [Hz] Res
idua
l Mot
ion
Am
plitu
de [c
m]

44
A
B
C
D
E
F
3.8 Wet Tests
3.8.1 Wet Test Set-Up After finishing the dry tests the wet tests were started in the wave basin. The very first
problem appeared immediately when the system was engaged: resonance of the vessel occurred in the roll direction (Appendix A4). During the preparation of this vessel, its keel was removed to prevent hitting the bottom of the basin. Consequently, this resulted in reduced damping around its longitudinal axis and in combination with the MMS mounted on the vessel this led to resonance of the system. Since the MMS has roughly the same mass as the boat, the cylinders of the MMS could easily push the boat too far during motion compensation. This problem was solved by welding roll-dampers on each side of the boat. This simple solution proved to be effective. The wet test set-up can be seen in Figure 3.21. Similar to the dry tests, the performance was measured by having a fixed laser beam pointing on a target placed on the MMS upper platform.
Figure 3.21 Wet test set-up
3.8.2 Performance Once the roll resonance problem was solved, a second problem was faced: the motion
compensation performance in the basin was poor. The waves in the frequency range of 0.2 to 0.3 Hertz were exactly the waves that did not cause much excitation to the boat. Waves with a higher frequency did cause the vessel to move as desired, but the motions were badly compensated by the Ampelmann system. However, this was not due to the velocity limitations of the MMS; the maximum velocities resulting from the vessel
A Mooring Lines B Roll Dampers C Octans D Wave height Measurement E Hydraulic Pump F Stewart Platform

45
motions were well within the boundaries. The poor performance was the result of inaccuracies of the measuring system. According to manufacturer iXSea, the Octans is programmed to perform optimally in the frequency range up to 0.3 Hz because it is the most common frequency range for sea waves and wave induced vessel motions. The lower frequencies are filtered out to prevent drift in the measurements; higher frequencies which can often come from machinery on board of a vessel are also preferably removed. To improve the system, a filter was added to the Converter software in order to amplify the translational motions at higher frequencies as measured by the Octans. Consequently, the translations above 0.3Hz could be registered more accurately and these enhanced values were used to control the MMS. This led to a much better performance (Appendix A5). The displacements of the upper platform were reduced to less than 1 cm for waves with a frequency up to 0.55 Hertz (compared to deviations of 7cm without motions compensation). This was a significant improvement to the Ampelmann system, now enabling it to compensate waves in a wide range of frequencies.
Motions due to regular waves and simulated sea states in a frequency range from 0.2 to
0.55 Hz could now be compensated. This corresponds to (mean zero-crossing) wave periods between 1.8 and 5 seconds. When observing the mean zero-crossing periods TZ in the YM6 scatter diagram (Table 1.3), this covers about 70 % of all sea states at the given site in the Dutch North Sea. Sea states with wave periods lower than 1.8 s hardly occur; when they occur this is always in combination with very low significant wave heights (up to 0.25m). Waves with periods higher than 5s could not be examined because they caused negligible motions of the vessel in this test set-up. Such periods are quite common in real sea conditions, however, but mostly in combination with high waves and therefore large translational vessel motions. According to the Octans specifications [21] its accuracy for heave, surge and sway measurements is either 5cm or 5%, whichever is highest. This implies that in such wave conditions these measurements will have small relative errors and accurate motion compensation can be achieved.
3.8.3 Dynamics The roll resonance phenomenon as encountered during the wet test phase called for a
more thorough examination of the dynamic effects that motion compensation may have on a vessel. A computational model was prepared to enable a simulation of the observed resonance during the wet tests and examine the influence of different parameters on the degree of resonance.
A two-dimensional computational model to simulate the roll resonance was generated
in Simulink, using SimMechanics for the structural components of the Stewart platform. The vessel was modelled as a solid triangle, hinged to the fixed world at the bottom and

46
connected to springs and dampers at both sides. The hinged connection serves as the roll axis, whereas the spring-dampers model the hydrodynamics. An illustration of this model is shown in Figure 3.22 including the axis conventions for sway, heave and roll. Values for the damping coefficient and the spring constant were deduced from a model of the used vessel without keel using the strip theory based computer program Seaway. A virtual sensor at the centre of the vessel deck measured the vessel rotations and translations to determine the required motion of the Stewart platform for motion compensation. A time delay function was used to model the time lag between the actual vessel motion and the Stewart platform motion. To start the simulation, the vessel was given an initial moment around the roll axis.
Figure 3.22 Computational model to simulate roll resonance
If the Stewart platform on top of the vessel is not in compensation mode, a small roll
motion will damp out over time. However, when the Stewart platform’s active motion compensation is engaged, the simulation model showed a resonant behaviour similar to the model used in the wet tests (Appendix A6). The resonant effect is illustrated in Figure 3.23 and can be explained as follows.
a b c d e
Figure 3.23 Roll resonance
(a) An initial moment around the roll axis causes the modelled vessel to make a small positive roll rotation. Due to the delay of the compensation, the platform will first
y
z
φ

47
follow this roll motion and due to the vertical distance between top plate and hinge, the top plate will also experience a roll induced sway to the left.
(b) After the small time lag, the platform wants to compensate for the measured motions, and therefore the top plate will move to the right relative to the vessel.
(c) Meanwhile, the springs restore the initial roll, causing the vessel to rotate in the negative roll direction. When the vessel rotation crosses the zero point, the centre of gravity (CoG) of the top plate is on the right side of the hinge, causing a rolling moment in the negative roll direction. At this moment, the vessel is already rolling in the negative roll direction and the CoG on the right side of the hinge will now amplify this roll motion, increasing the next roll amplitude.
(d) By the time the roll motion reaches its negative roll amplitude, the top plate is compensating for its virtual sway to the right by moving the platform to the left.
(e) The correction of the sway leads to an overshoot at the left side, now causing the positive roll motion to increase. At this moment, the roll motion is governed by the motions of the top plate: the horizontal displacements of the top plate keep increasing the roll motion amplitudes.
The resonant effect is caused by the shift of the top plate’s CoG in combination with
the horizontal acceleration of the top plate’s mass; both phenomena will increase the roll motion when the system’s damping is insufficient.
Subsequently the effect of parameter variations was studied. First, the time lag was
varied. It was found that for an increasing time lag, the roll amplitude increases faster. Secondly, the mass of the top plate was varied: an increasing top plate mass significantly increases the resonant behaviour. Finally, the damping was increased. At a certain value, the damping is large enough to stop the model resonance. This was already proven in the wet test: applying bilge keels as roll dampers solved the resonance problem.
3.9 Conclusions The dry and wet tests performed with a small scale Ampelmann model gave good
insight in the possibilities as well as the limitations of active motion compensation using the combined technologies of an Octans motion sensor and a hydraulic Stewart platform. During the wet tests in a random wave field, the Ampelmann scale model managed to keep the upper platform of the MMS nearly motionless. The residual motions registered at the targets on the MMS upper deck were less than 1 cm in waves with frequencies up to 0.55 Hertz. These residual motions were considered small enough to conclude that the results of this proof-of-concept phase justified continuing with the next phase: creating a prototype.

48
With respect to the tests performed on the scale model Ampelmann, the following conclusions can be drawn:
• The Octans was accurate and fast enough to function in the Ampelmann system.
• The MMS Stewart platform was accurate enough to function in the Ampelmann system, and fast enough to compensate motions within its velocity and excursion limits.
• With dedicated filters in the Converter software, the Ampelmann scale model works properly at wave frequencies from 0.2 to 0.55 Hertz, corresponding to wave periods ranging from 1.8 to 5 seconds.
• Sea states with mean zero-crossing periods shorter than 1.8 seconds barely occur at sea and when they do it is in combination with significant wave heights of less than 0.25 metres. In such wave conditions vessel motions remain small enough to enable safe transfers without motion compensation.
• The upper platform can be kept practically motionless on a moving vessel. Maximum displacements of the upper platform were less than 1 cm compared to the fixed world, whilst they would have been 7cm without having the Ampelmann system compensating motions.
In preparation of designing a prototype, the following was concluded:
• Vessel motions with periods longer than 5 seconds could not be tested during the wet tests, but are common in real sea conditions. In such conditions, however, the Octans is expected to perform within its specifications and motion compensation can be achieved.
• The Ampelmann prototype requires a Stewart platform much larger than the MMS. Such Stewart platforms are commonly used as flight simulators and the technology used in these platforms has proven reliable. Therefore no unforeseen problems are expected in its use for motion compensation in the Ampelmann prototype.

49
4. Requirements for a Prototype: Ampelmann Demonstrator
4.1 Introduction The Ampelmann scale model tests proved that real-time compensation of wave
induced vessel motions is technically feasible. The motion sensor, Stewart platform and control system applied in the system were all accurate and fast enough to counteract wave induced vessel motions, keeping the resulting motions of a transfer deck relative to the fixed world within acceptable limits. This result justified the next step: creating a full-scale prototype to prove that an Ampelmann system can provide safe access to offshore wind turbines with the purpose of significantly and safely increasing the accessibility of wind turbines in offshore wind farms. In comparison with the scale model system, this task presented three new main challenges. The first and most crucial challenge was to make the integral Ampelmann system inherently safe. This implies that no system failure or human error may cause a hazardous situation for personnel on or near the Ampelmann system. Secondly, active motion compensation had to be proved using a Stewart platform large enough to counteract the motions of a sea-going vessel in sea states with significant wave heights of 2.5 metres. A third important challenge was to prove its use in offshore conditions. Although Stewart platforms with cylinder strokes exceeding 1 metre are commonly used as flight simulators, the application of such a platform in offshore conditions is new.
A prototype phase was considered of crucial importance for the further development of
the Ampelmann system to a commercial product. To enable efficient design and engineering of future Ampelmann systems, all steps of the prototype development were to be studied in detail in order to eventually arrive at a blueprint for the design process. This chapter describes the approach towards the prototype development, as well as the requirements selected to serve as a basis of design for the development of the Ampelmann prototype, which was named the Ampelmann Demonstrator.
4.2 Prototype Development
4.2.1 In-house Development As stated, the primary components of an Ampelmann system are a motion sensor,
control system and Stewart platform. As concluded (Chapter 3) the Octans motion sensor was fast and accurate enough to be used in the Ampelmann Demonstrator. Stewart platforms (including their control system) have been widely applied in

50
applications varying from flight and drive simulation to testing and rehabilitation facilities. However, for such applications Stewart platforms remain indoors under controlled climatological conditions. Furthermore, their design is governed by the specific application and corresponding motion and load carrying demands.
The Ampelmann has to be designed for motion compensation in offshore conditions
while meeting stringent safety requirements. For these reasons using an off-the-shelf Stewart platform like the MMS was not an option. It was therefore decided to develop the Demonstrator in-house at the Delft University of Technology. This was made possible by funding by the We@Sea offshore wind energy research programme, the Delft University of Technology and Shell, while Smit International was willing to provide a vessel for offshore tests and demonstrations.
4.2.2 Safety Considerations Throughout the development of the Ampelmann Demonstrator, safety of the system
and its use was a prime driver. The incorporation of safety has been achieved in three stages: safety aspects were included in the design phase, the developed safety features were thoroughly tested during the commissioning phase and finally an objective safety assessment had to be performed of the integral system design and construction by means of a certification process.
The Ampelmann is a complex system which comprises structural components, electric
and hydraulic power supply and a control system. To incorporate safety in the Ampelmann Demonstrator a safety philosophy had to be chosen first. Since the Ampelmann is a highly automated system and people will stand and walk on the transfer deck and the gangway, the entire system design had to be evaluated thoroughly in such a way that all risks related to component failures could be analysed and mitigated. Consideration was also given to the risk of human errors. An operational procedure was developed such that hazardous situations due to human errors will be prevented. Based on this safety philosophy the design of the Ampelmann system and the operational procedure are to be developed. The safety philosophy and the consequences of this philosophy for the system design and the operational procedure are addressed in Chapter 5.
During the design phase special consideration was given to the design of the Stewart
platform architecture. This design is to ensure that full motion compensation could be achieved in sea states up to HS = 2.5m. The Stewart platform design is elaborated upon in Chapter 6.
After completion of the design and construction of the Ampelmann system including
its operational procedures, a series of tests and an objective assessment of the system
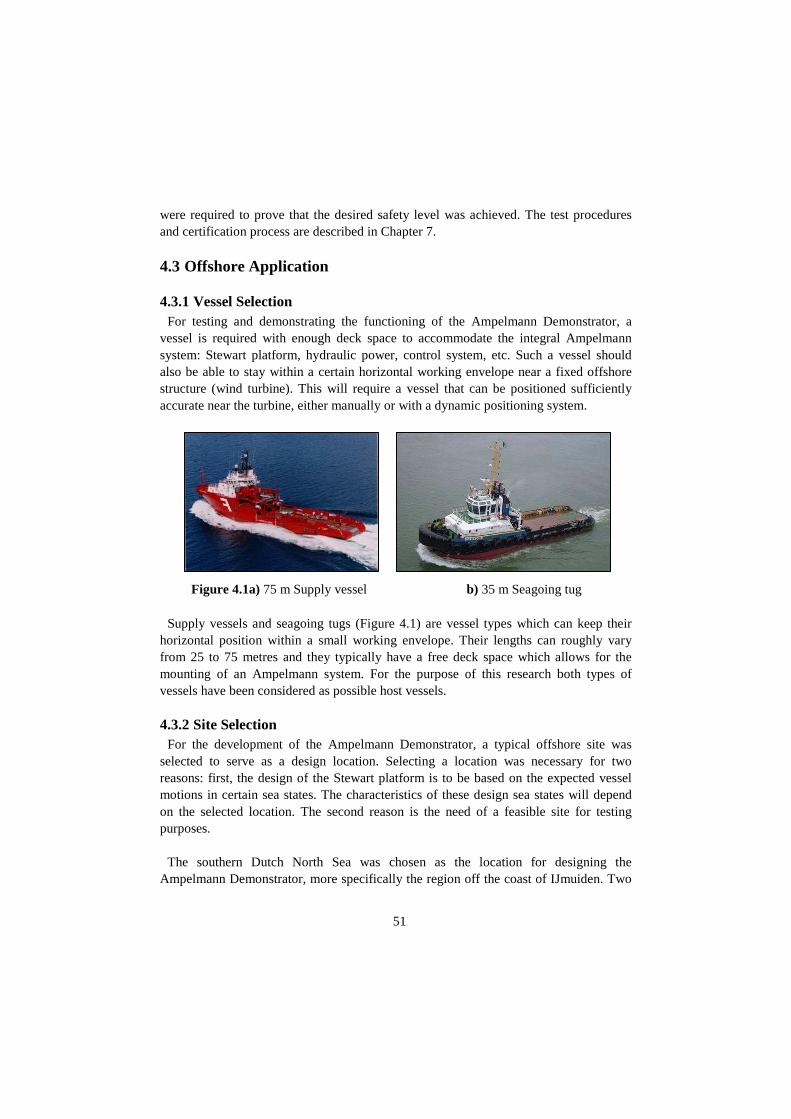
51
were required to prove that the desired safety level was achieved. The test procedures and certification process are described in Chapter 7.
4.3 Offshore Application
4.3.1 Vessel Selection For testing and demonstrating the functioning of the Ampelmann Demonstrator, a
vessel is required with enough deck space to accommodate the integral Ampelmann system: Stewart platform, hydraulic power, control system, etc. Such a vessel should also be able to stay within a certain horizontal working envelope near a fixed offshore structure (wind turbine). This will require a vessel that can be positioned sufficiently accurate near the turbine, either manually or with a dynamic positioning system.
Supply vessels and seagoing tugs (Figure 4.1) are vessel types which can keep their
horizontal position within a small working envelope. Their lengths can roughly vary from 25 to 75 metres and they typically have a free deck space which allows for the mounting of an Ampelmann system. For the purpose of this research both types of vessels have been considered as possible host vessels.
4.3.2 Site Selection For the development of the Ampelmann Demonstrator, a typical offshore site was
selected to serve as a design location. Selecting a location was necessary for two reasons: first, the design of the Stewart platform is to be based on the expected vessel motions in certain sea states. The characteristics of these design sea states will depend on the selected location. The second reason is the need of a feasible site for testing purposes.
The southern Dutch North Sea was chosen as the location for designing the
Ampelmann Demonstrator, more specifically the region off the coast of IJmuiden. Two
Figure 4.1a) 75 m Supply vessel b) 35 m Seagoing tug

52
operational wind farms, Offshore Windpark Egmond aan Zee (OWEZ) and Prinses Amalia, are situated in this area (Figure 4.2) therefore offering a realistic design case. In addition, the YM6 wave buoy is situated in the same area providing real long-term wave measurements. A final advantage of this location was the presence of the OWEZ wind farm. This farm is owned by Shell, who was also a sponsor of the development of the Demonstrator. Shell agreed to allow the Ampelmann Demonstrator to be tested near one of the turbines in this wind farm.
Figure 4.2 Design Location for Demonstrator: southern Dutch North Sea
4.4 Demonstrator Size Constraints
4.4.1 Motion Requirements As shown (section 2.2.4) a significant increase in accessibility can be achieved for the
region in the Dutch North Sea where the YM6 wave buoy is located when an access system has the capability to operate in sea states with a significant wave height up to 2.5 metres. A further increase of the operational limit has only a small effect on the total accessibility since sea states with a significant wave height exceeding 2.5 metres have a probability of occurrence of less than 10%. The design of the Ampelmann Demonstrator has therefore been based on providing full vessel motion compensation in sea states up to a significant wave height of 2.5 metres. With this limiting condition the sea states with HS = 2.5m are expected to induce the largest ship motions given the type of vessels anticipated to be used. With the probability of occurrence of sea states with HS = 2.5m with a mean wave period larger than 6 seconds being marginal, two design sea states for the Ampelmann Demonstrator have therefore been defined based on the scatter diagram of the anticipated design location (Table 4.1):
Prinses Amalia
YM6 Wave Buoy
IJmuiden
OWEZ
North Sea
United Kingdom Netherlands
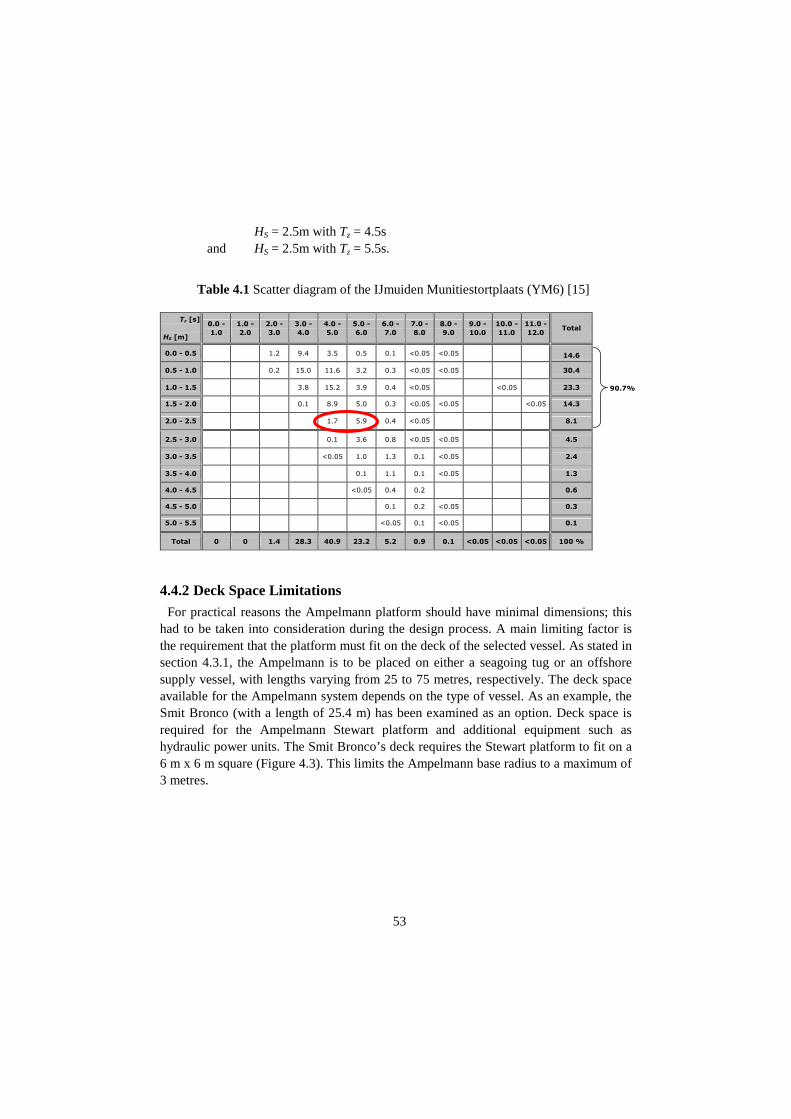
53
HS = 2.5m with Tz = 4.5s
and HS = 2.5m with Tz = 5.5s.
4.4.2 Deck Space Limitations For practical reasons the Ampelmann platform should have minimal dimensions; this
had to be taken into consideration during the design process. A main limiting factor is the requirement that the platform must fit on the deck of the selected vessel. As stated in section 4.3.1, the Ampelmann is to be placed on either a seagoing tug or an offshore supply vessel, with lengths varying from 25 to 75 metres, respectively. The deck space available for the Ampelmann system depends on the type of vessel. As an example, the Smit Bronco (with a length of 25.4 m) has been examined as an option. Deck space is required for the Ampelmann Stewart platform and additional equipment such as hydraulic power units. The Smit Bronco’s deck requires the Stewart platform to fit on a 6 m x 6 m square (Figure 4.3). This limits the Ampelmann base radius to a maximum of 3 metres.
Table 4.1 Scatter diagram of the IJmuiden Munitiestortplaats (YM6) [15]
Tz [s]
HS [m]
0.0 -
1.0
1.0 -
2.0
2.0 -
3.0
3.0 -
4.0
4.0 -
5.0
5.0 -
6.0
6.0 -
7.0
7.0 -
8.0
8.0 -
9.0
9.0 -
10.0
10.0 -
11.0
11.0 -
12.0 Total
0.0 - 0.5 1.2 9.4 3.5 0.5 0.1 <0.05 <0.05
14.6
0.5 - 1.0 0.2 15.0 11.6 3.2 0.3 <0.05 <0.05 30.4
1.0 - 1.5 3.8 15.2 3.9 0.4 <0.05 <0.05 23.3
1.5 - 2.0 0.1 8.9 5.0 0.3 <0.05 <0.05 <0.05 14.3
2.0 - 2.5
1.7 5.9 0.4 <0.05 8.1
2.5 - 3.0 0.1 3.6 0.8 <0.05 <0.05 4.5
3.0 - 3.5 <0.05 1.0 1.3 0.1 <0.05 2.4
3.5 - 4.0 0.1 1.1 0.1 <0.05 1.3
4.0 - 4.5 <0.05 0.4 0.2 0.6
4.5 - 5.0 0.1 0.2 <0.05 0.3
5.0 - 5.5 <0.05 0.1 <0.05 0.1
Total 0 0 1.4 28.3 40.9 23.2 5.2 0.9 0.1 <0.05 <0.05 <0.05 100 %
90.7%
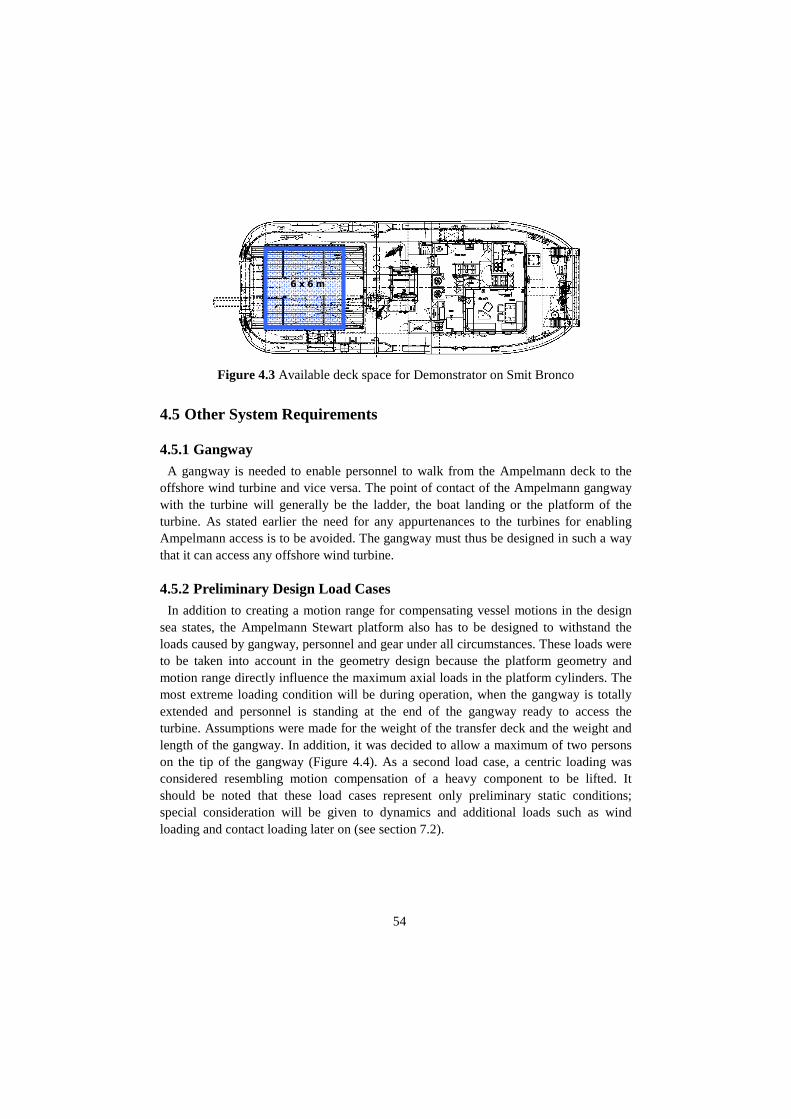
54
Figure 4.3 Available deck space for Demonstrator on Smit Bronco
4.5 Other System Requirements
4.5.1 Gangway A gangway is needed to enable personnel to walk from the Ampelmann deck to the
offshore wind turbine and vice versa. The point of contact of the Ampelmann gangway with the turbine will generally be the ladder, the boat landing or the platform of the turbine. As stated earlier the need for any appurtenances to the turbines for enabling Ampelmann access is to be avoided. The gangway must thus be designed in such a way that it can access any offshore wind turbine.
4.5.2 Preliminary Design Load Cases In addition to creating a motion range for compensating vessel motions in the design
sea states, the Ampelmann Stewart platform also has to be designed to withstand the loads caused by gangway, personnel and gear under all circumstances. These loads were to be taken into account in the geometry design because the platform geometry and motion range directly influence the maximum axial loads in the platform cylinders. The most extreme loading condition will be during operation, when the gangway is totally extended and personnel is standing at the end of the gangway ready to access the turbine. Assumptions were made for the weight of the transfer deck and the weight and length of the gangway. In addition, it was decided to allow a maximum of two persons on the tip of the gangway (Figure 4.4). As a second load case, a centric loading was considered resembling motion compensation of a heavy component to be lifted. It should be noted that these load cases represent only preliminary static conditions; special consideration will be given to dynamics and additional loads such as wind loading and contact loading later on (see section 7.2).
6 x 6 m

55
Load Case 1 Load Case 2
F1 40 kN 100 kN
F2 20 kN
F3 2 kN
Ftotal 62 kN 100 kN
X1 12 m
X2 6 m
Figure 4.4 Preliminary design load cases
4.5.3 Installation on Vessel It is considered important that the integral Ampelmann system can be easily installed
on a dedicated vessel. The configuration of the Ampelmann should therefore be modular: it is desired to have the Ampelmann installed in as few lifts as possible. It can therefore be practical to have the Stewart platform pre-assembled with top deck and gangway, and to have all other equipment such as the hydraulic power and the control system in containers. Also, the mounting can be facilitated by having lifting aids pre-installed on the modules and connection aids on Ampelmann and vessel. After the system is mounted, a minimum number of activities should be required to start up the Ampelmann, making it a "plug and play" system.
4.6 List of Requirements With the objectives for the Demonstrator development clearly defined, the following
list of requirements was made: Safety
• The design of the Ampelmann Demonstrator and the operational procedure are to be developed based on a safety philosophy.
• The safety of the Ampelmann Demonstrator shall be proven by a series of tests as well as by an assessment of a certifying authority.
Stewart platform
• The Stewart platform will be developed in-house at the Delft University of Technology.
Load Case 1
Load Case 2

56
• The Stewart platform will be designed to compensate ship motions in sea states up to HS = 2.5 metres.
• The Stewart platform base has to fit on a deck space of 6 by 6 metres. Vessel
• For motion compensation tests a host vessel is required. • For motion compensation tests including personnel transfers to an offshore
wind turbine a host vessel is required able to position itself near a turbine within a small working envelope.
• A host vessel needs to have enough deck space to fit the entire Ampelmann system: Stewart platform, hydraulic power, control system and other ancillary equipment.
Gangway
• A gangway is required to access a wind turbine from the stationary Ampelmann transfer deck.
• Gangway landing on an offshore wind turbine should not require any special provisions on the turbine.
4.7 Preliminary Concept of Ampelmann Demonstrator Based on the stated requirements, a preliminary set-up of the Ampelmann system was
made. Figure 4.5 shows a schematic representation of this Ampelmann system with its basic components.
Figure 4.5 Overview of Ampelmann Demonstrator system components
Stewart Platform
Hydraulic Power Unit
Ampelmann
Control System
User Interface
Octans data
data
data
pressure
Gangway
Motion Sensor Control System Stewart Platform (incl. HPU)

57
5. Safety Philosophy and Consequences for Design and Operation
5.1 Introduction Safety is defined in this report as a state of being safe from undergoing or causing
injury or loss. The Ampelmann system is an automated electronic-hydraulic system with a large number of components; all of these components have a likelihood of failure, either due to wear or other internal cause, or due to damage by some external cause. In addition, during operation the possibility of human errors has to be taken into account. The safety of the Ampelmann system can therefore be defined as the degree of certainty that no injury or loss is caused by any Ampelmann component failure or any human error.
A safety-based design philosophy was therefore required to show explicitly how
safety can be achieved in case a human error or component failure occurs. This chapter presents different safety philosophies from which the chosen philosophy was applied to arrive at a safety-based design of the system and of the operational procedure.
5.2 Safety Philosophy
5.2.1 Introduction To incorporate safety in the design of the Ampelmann Demonstrator a safety
philosophy was to be decided upon first. This section addresses safety philosophies as used in three different industries, which have been selected for their use of electronically actuated systems similar to the Ampelmann system. This means that these systems require constant data input from a sensor, have a processing unit and ultimately control one or more actuators, either with or without feedback. Another characteristic of the systems used in these industries is that component failures can lead to human injury or loss.
5.2.2 Medical Device Industry One of the first industries that needed to develop a safety-based design approach for
its equipment was the medical device industry. Especially equipment containing complex software becomes very safety-critical. The original approach towards safety was to follow the single-fault hypothesis, which states that no single fault may lead to death or injury. The main parameter for this approach is the time period that this hypothesis has to hold. For example, a dialysis machine has to be able to finish its therapy session in a period varying from 30 minutes up to 3 hours.

58
While medical devices became more complex over the years, the single-fault
hypothesis became less attractive, causing the industry to shift to a risk-based approach. This approach identifies all possible causes of death or injury, the likelihood of their occurrence and their level of consequence. Subsequently, a cause can be eliminated, the likelihood of occurrence can be decreased or the level of consequence can be reduced. For a medical device, the reliability regime must then be determined: a system can be designed to be either fail-safe or fault-tolerant [24]. A fail-safe system is designed to have a safe state to which the system is commanded in case of a failure. A safe state is a state of the system that cannot cause any death or injury, although the availability of the system may be compromised. In this case, fault-detection mechanisms are a prerequisite. If a system is fault-tolerant, it will be able to continue performing its required function in the presence of faults. Fault-tolerant systems tend to be more complex to design and are more costly than fail-safe systems. For this reason, medical device manufacturers aim at designing systems with a fail-safe state.
In comparison with other safety-critical industries, such as the aircraft industry, the
medical device industry is way behind when safety philosophy is concerned. First of all this is due to the number of lives at risk during an operation of one specific device: in the medical world it will always be only one patient that depends on a medical device, whereas in an airplane the lives of over 300 persons can be at stake. Besides this, the human interaction factor plays a major role: a doctor or assistant can see or hear if a patient is not reacting in the proper manner and there is usually enough time to respond to a detected error [25].
5.2.3 Aircraft Industry Probably the most advanced industry in safety-based design is the aircraft industry.
Driven by the aim to reduce weight and improve reliability, mechanical and hydraulic linkages that ran from the cockpit throughout the aircraft started being replaced by lightweight electronics that could perform the same functions. This led to the so-called fly-by-wire systems: a fly-by-wire system literally replaces the mechanical control of the aircraft with an electrical interface. In addition to the substantial decrease in weight, electronic systems also require less maintenance. Further to fly-by-wire systems, autopilots and automatic landing systems have been developed, making it possible to land a plane in zero visibility. But whatever the advantages, reliability is the main concern of all flight control systems: a failure can leave the pilot with no control of the plane with possibly catastrophic effects. For this reason safety-based design is used for flight control systems.
When considering an autopilot system, by lack of a fail-safe state there are two typical
arrangements: fail-operational or fail-passive. A system is called fail-operational when

59
it has the ability to continue to manoeuvre the aircraft unaffected after the failure of one component in the system. A component failure will compromise the proper functioning of a lane (a serially connected sequence of components) implying that another lane can take over the first lane’s functionalities. A fail-operational system is able to detect, identify and isolate the failure while engaging the second lane. This reliability regime is actually equal to the fault-tolerant design in the medical device industry; in the remainder of this document the term fail-operation shall be used. When an autopilot system is designed to be fail-passive, a failure will not cause large flight path disturbances and the system will leave the aircraft in trim for manual control.
Figure 5.1a) Fail-passive control system [27] b) Fail-operational control systems [27]
In conclusion it can be stated that the regulations and standards for fly-by-wire systems
are in a very advanced stage. This can however lead to very complex control systems with high costs. Figure 5.1a shows the configuration of a conventional fail-passive system, while Figure 5.1b illustrates a fail-operational system. Note that most critical components are placed in threefold for redundancy. To obtain maximum independency between failures in the computers, different kinds of processors, software and compilers are being used, all programmed according to the same requirements. [26] [27] [28] [29] [30]
5.2.4 Automotive Industry Following the developments in the aircraft industry, there is a clear trend in the
automotive industry at the moment to apply more electronic systems in cars. This trend started with the introduction of digitally controlled combustion engines with fuel injection and digitally controlled anti-lock brake systems (ABS) in the late 1970's, and is currently becoming more involved with the development of so-called x-by-wire systems. X-by-wire systems consist of a driver's operating unit whose electrical output is processed by micro-controllers that manage the driver's commanded activity via electrical actuators (in compliance with fly-by-wire). Throttle-by-wire, shift-by-wire and driver's assistance systems have been used successfully for many years now [31].
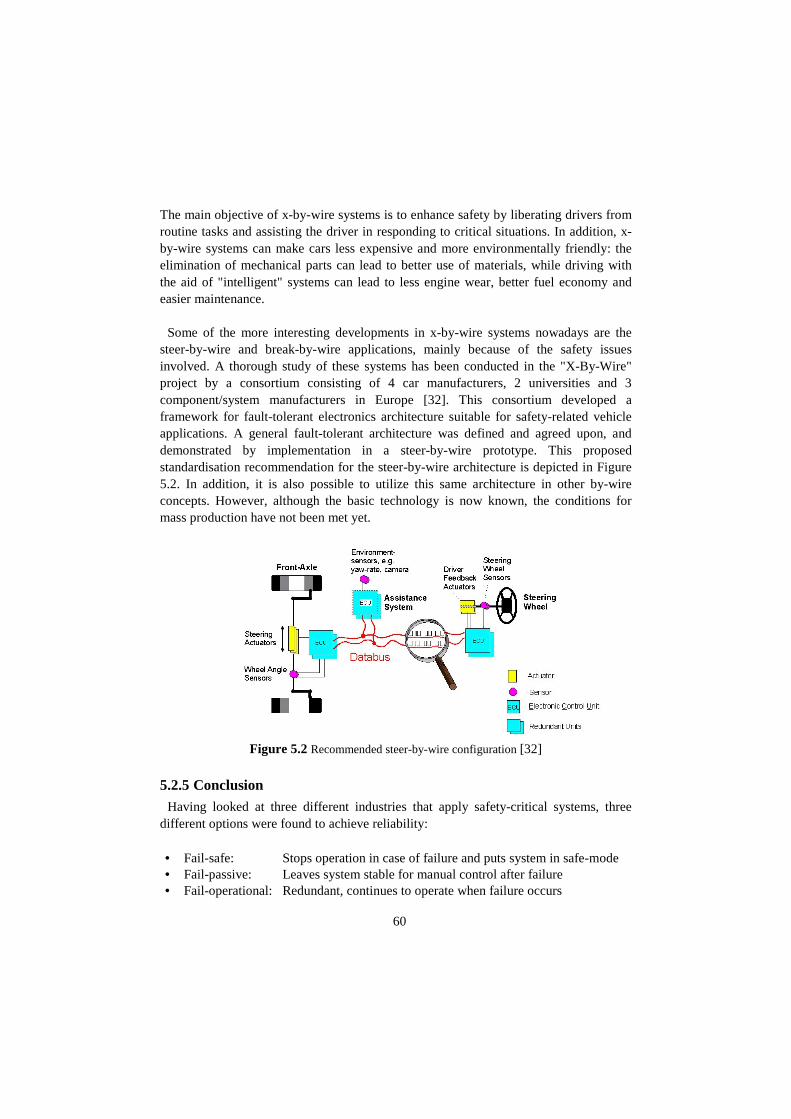
60
The main objective of x-by-wire systems is to enhance safety by liberating drivers from routine tasks and assisting the driver in responding to critical situations. In addition, x-by-wire systems can make cars less expensive and more environmentally friendly: the elimination of mechanical parts can lead to better use of materials, while driving with the aid of "intelligent" systems can lead to less engine wear, better fuel economy and easier maintenance.
Some of the more interesting developments in x-by-wire systems nowadays are the
steer-by-wire and break-by-wire applications, mainly because of the safety issues involved. A thorough study of these systems has been conducted in the "X-By-Wire" project by a consortium consisting of 4 car manufacturers, 2 universities and 3 component/system manufacturers in Europe [32]. This consortium developed a framework for fault-tolerant electronics architecture suitable for safety-related vehicle applications. A general fault-tolerant architecture was defined and agreed upon, and demonstrated by implementation in a steer-by-wire prototype. This proposed standardisation recommendation for the steer-by-wire architecture is depicted in Figure 5.2. In addition, it is also possible to utilize this same architecture in other by-wire concepts. However, although the basic technology is now known, the conditions for mass production have not been met yet.
Figure 5.2 Recommended steer-by-wire configuration [32]
5.2.5 Conclusion Having looked at three different industries that apply safety-critical systems, three
different options were found to achieve reliability: • Fail-safe: Stops operation in case of failure and puts system in safe-mode • Fail-passive: Leaves system stable for manual control after failure • Fail-operational: Redundant, continues to operate when failure occurs
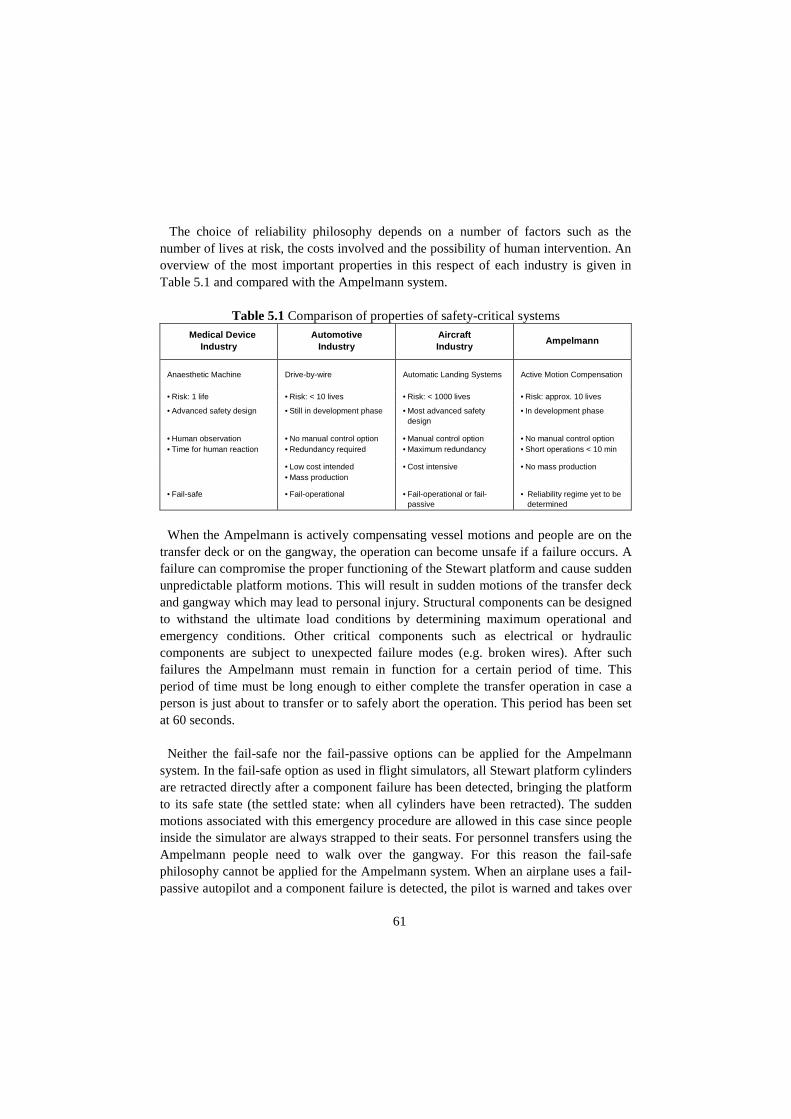
61
The choice of reliability philosophy depends on a number of factors such as the
number of lives at risk, the costs involved and the possibility of human intervention. An overview of the most important properties in this respect of each industry is given in Table 5.1 and compared with the Ampelmann system.
Table 5.1 Comparison of properties of safety-critical systems
Medical Device Industry
Automotive Industry
Aircraft Industry
Ampelmann
Anaesthetic Machine
Drive-by-wire
Automatic Landing Systems
Active Motion Compensation
• Risk: 1 life • Risk: < 10 lives • Risk: < 1000 lives • Risk: approx. 10 lives
• Advanced safety design • Still in development phase • Most advanced safety design
• In development phase
• Human observation • Time for human reaction
• No manual control option • Redundancy required
• Manual control option • Maximum redundancy
• No manual control option • Short operations < 10 min
• Low cost intended • Mass production
• Cost intensive
• No mass production
• Fail-safe • Fail-operational • Fail-operational or fail-passive
• Reliability regime yet to be determined
When the Ampelmann is actively compensating vessel motions and people are on the
transfer deck or on the gangway, the operation can become unsafe if a failure occurs. A failure can compromise the proper functioning of the Stewart platform and cause sudden unpredictable platform motions. This will result in sudden motions of the transfer deck and gangway which may lead to personal injury. Structural components can be designed to withstand the ultimate load conditions by determining maximum operational and emergency conditions. Other critical components such as electrical or hydraulic components are subject to unexpected failure modes (e.g. broken wires). After such failures the Ampelmann must remain in function for a certain period of time. This period of time must be long enough to either complete the transfer operation in case a person is just about to transfer or to safely abort the operation. This period has been set at 60 seconds.
Neither the fail-safe nor the fail-passive options can be applied for the Ampelmann
system. In the fail-safe option as used in flight simulators, all Stewart platform cylinders are retracted directly after a component failure has been detected, bringing the platform to its safe state (the settled state: when all cylinders have been retracted). The sudden motions associated with this emergency procedure are allowed in this case since people inside the simulator are always strapped to their seats. For personnel transfers using the Ampelmann people need to walk over the gangway. For this reason the fail-safe philosophy cannot be applied for the Ampelmann system. When an airplane uses a fail-passive autopilot and a component failure is detected, the pilot is warned and takes over

62
the aircraft control manually. However, manual control of the Ampelmann system for motion compensation is not possible and therefore a fail-passive design cannot be applied to this system. This only leaves the fail-operational architecture to be implemented in the Ampelmann system. As shown in Figure 5.2 the steer-by-wire configuration was made fail-operational by making all critical components redundant. The same strategy has therefore been applied for the Ampelmann Demonstrator leading to the following requirements:
• Operation must continue after a single component failure • The ride-through-failure must work for at least 60 seconds
The consequences of this reliability regime on the system design and on the
operational procedure are presented in the remainder of this chapter.
5.3 Safety-based System Design
5.3.1 Introduction In order to achieve a fail-operational Ampelmann system a thorough analysis of the
preliminary system set-up (Figure 4.5) was necessary. After this analysis a system design must emerge in compliance with the fail-operational safety philosophy: no single component failure may interrupt the normal operational procedure. To address the safety-based design of the Ampelmann Demonstrator the following main functional requirements have been identified:
• Stewart platform motion range • Stewart platform motion integrity • Safe operational procedure • Structural integrity
Stewart platform motion range The Ampelmann system is to achieve an increase in accessibility of offshore wind
turbines by providing a motionless transfer deck and gangway for safe transfers in environmental conditions up to the design sea states. For this, the Stewart platform is required to have the physical ability to create the motions necessary for such vessel motion compensation: the motion range of the platform has to be large enough to enable counteracting these vessel motions.
Stewart platform motion integrity To provide adequate motion compensation during transfer operations, the Stewart
platform motions need to be accurate and with a minimal latency. This implies that no

63
component failure may hamper these motions. This functionality is defined here as the motion integrity of the Stewart platform and is treated by addressing the following sub-functionalities:
• Electric power supply: to provide electricity to the system • Hydraulic power supply: to provide hydraulic pressure and flow to the system • Motion control: to provide accurate and continuous Stewart platform motions
Safe operational procedure A clear safety-based operational procedure is to be defined in order to ensure safe
personnel transfers to offshore wind turbines. In addition, emergency procedures are to be determined.
Structural integrity The Stewart platform and gangway have to be able to carry all relevant loads during
operational and emergency conditions as well as during transportation. This calls for adequate design and fabrication of all structural components.
5.3.2 Failure Modes and Effects Analysis With the safety philosophy determined, the design process has been started by
applying a Failure Modes and Effects Analysis (FMEA) on the preliminary set-up of the Ampelmann Demonstrator (section 4.7). Such an analysis deals with the possible failures on all system components and examines the effect of each failure. If the effect can result in malfunctioning of the Stewart platform or in any other hazardous situation, directly or indirectly, a measure is taken to either reduce the risk of occurrence of failure or minimize the effect. This was done for all components until a system design emerged where component failures could not cause unsafe effects. This means that after any component failure the Ampelmann system should be able to continue its functionalities for at least 60 seconds in a safe operational manner.
As a result of the FMEA it was concluded that all non-structural critical components in
the system required for motion integrity have to be made redundant (sections 5.3.3 to 5.3.5). To enable adequate motion compensation by the platform in the design sea states defined earlier, special consideration had to given to the design of the Stewart platform’s geometry to provide a sufficient motion range (section 5.3.6). The required safety of structural components can be achieved by proper design and manufacturing of these components as will be explained in 5.3.7. The safety-based operational procedure is treated in 5.4.

64
5.3.3 Electric Power Supply For the Ampelmann to be a “plug and play” system it was decided to only have a
single connection to a vessel’s electric power supply of 230 Volts. However, having one electric power connection would make the Ampelmann very vulnerable to power failures. To overcome this problem, Uninterruptable Power Supply (UPS) units were incorporated in the system. These units provide line regulation as well as emergency power to all connected equipment by supplying power from a battery when electric power from the vessel becomes unavailable. A UPS can typically provide uninterrupted power to equipment for 5 to 15 minutes. Six UPS units have been integrated in the Ampelmann system to ensure uninterrupted power to the equipment.
5.3.4 Hydraulic Power Supply To provide the Ampelmann system with hydraulic power a Hydraulic Power Unit
(HPU) is required. Regarding the hydraulic system two main failure modes can be identified: insufficient hydraulic power supply resulting in not being able to deliver the required pressure and flow, and HPU failure resulting in a total loss of pressure in the system.
Insufficient power The envisaged HPU uses a diesel engine to provide a constant pressure to the
hydraulic system. To determine the HPU power requirement, the following equation applies:
1P p Q
η= ⋅ ⋅ (5.1)
Where: P = Required power [W] p = Hydraulic pressure [N/m2 = 10-5 bar] Q = Volumetric flow rate [m3/s] η = Efficiency, typically around 0.85 [-] The hydraulic pressure to be used for the Ampelmann system was pre-determined at
250 bar, which is an industry standard. The maximum power requirement can then be determined by calculating the maximum flow rate in the system during motion compensation. The total system flow rate can be determined by summation of the flow rate in each Stewart platform cylinder, which equals (see Figure 5.3):
cyl cyl cylQ V A= ⋅ (5.2)
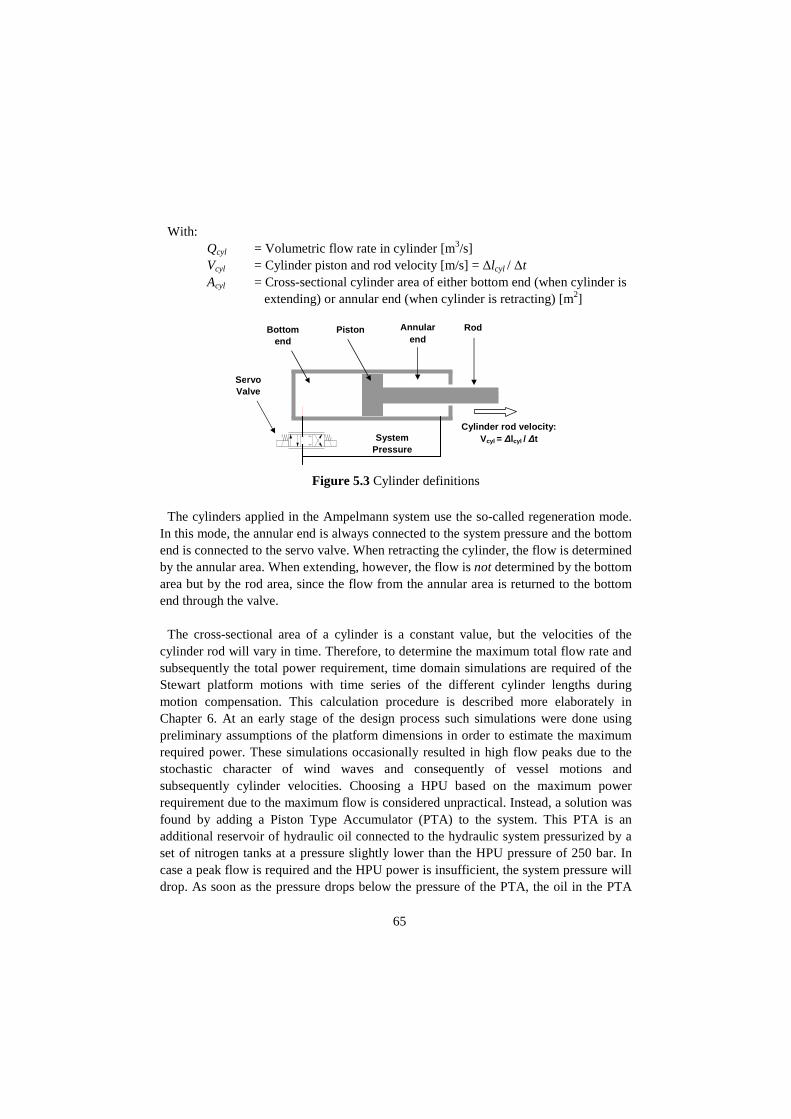
65
With: Qcyl = Volumetric flow rate in cylinder [m3/s]
Vcyl = Cylinder piston and rod velocity [m/s] = ∆lcyl / ∆t Acyl = Cross-sectional cylinder area of either bottom end (when cylinder is extending) or annular end (when cylinder is retracting) [m2]
The cylinders applied in the Ampelmann system use the so-called regeneration mode.
In this mode, the annular end is always connected to the system pressure and the bottom end is connected to the servo valve. When retracting the cylinder, the flow is determined by the annular area. When extending, however, the flow is not determined by the bottom area but by the rod area, since the flow from the annular area is returned to the bottom end through the valve.
The cross-sectional area of a cylinder is a constant value, but the velocities of the
cylinder rod will vary in time. Therefore, to determine the maximum total flow rate and subsequently the total power requirement, time domain simulations are required of the Stewart platform motions with time series of the different cylinder lengths during motion compensation. This calculation procedure is described more elaborately in Chapter 6. At an early stage of the design process such simulations were done using preliminary assumptions of the platform dimensions in order to estimate the maximum required power. These simulations occasionally resulted in high flow peaks due to the stochastic character of wind waves and consequently of vessel motions and subsequently cylinder velocities. Choosing a HPU based on the maximum power requirement due to the maximum flow is considered unpractical. Instead, a solution was found by adding a Piston Type Accumulator (PTA) to the system. This PTA is an additional reservoir of hydraulic oil connected to the hydraulic system pressurized by a set of nitrogen tanks at a pressure slightly lower than the HPU pressure of 250 bar. In case a peak flow is required and the HPU power is insufficient, the system pressure will drop. As soon as the pressure drops below the pressure of the PTA, the oil in the PTA
Figure 5.3 Cylinder definitions
Bottom end
Piston Rod Annular end
Cylinder rod velocity: Vcyl = ∆lcyl / ∆t
Servo Valve
System Pressure
66
will flow into the system enabling enough flow rate to meet the temporary peak demand. After the peak demand, the PTA is filled again with oil due to the higher pressure delivered by the HPU.
Loss of system pressure The second main failure mode in the hydraulic power supply is the failure of the HPU
resulting in no system pressure. To cope with such a failure mode a second HPU is added to the system, to be functioning simultaneously with the first HPU. Should either of the two HPU’s stop functioning, the Ampelmann system can still continue operating normally. In case both HPUs stop functioning the PTA is able to provide enough flow and pressure to keep the Ampelmann operational for at least 60 seconds.
5.3.5 Motion Control
Preliminary set-up for motion control To enable the Stewart platform to compensate vessel motions, all six Stewart platform
cylinders need to be actuated in such a way that the Ampelmann transfer deck becomes (nearly) motionless. In the preliminary set-up this required the following components:
• Octans • High Speed Controller (HSC) • Six Stewart platform cylinders with:
o Valves o Position Transducers
• HPU • User Interface
The preliminary set-up for active motion compensation is shown in Figure 5.4.

67
Figure 5.4 Preliminary set-up for motion control
Motion Control Process The motion control process is best explained using Figure 5.4. The Octans provides
measurements of the ship motions in six degrees of freedom in an inertial frame. These motions are registered by a High Speed Controller (HSC) which first determines the required cylinder lengths (called set points) for all cylinders to keep the transfer deck motionless relative to the fixed world. This is done by performing a kinematic calculation which is explained in detail in Chapter 6. Once these set points have been calculated, the valve control module of the HSC software determines the control signal to be sent to the respective cylinder valves in order to acquire the desired cylinder length. This module is presented in a flow diagram in Figure 5.5. The valve control signal is determined by a combination of two methods: Proportional control and Feed Forward control. The Proportional control method determines a control signal by first calculating the control error of each cylinder, which is actually the difference between the set point and the measured cylinder position. To measure the actual cylinder positions each cylinder is equipped with a position transducer. Multiplying each control error with a gain factor then creates the proportional part of the control signal. For the feed forward part of the control signal first the required cylinder velocities are derived from the cylinder set points. The feed forward part of the control signal is then determined by multiplying the required cylinder velocity of each cylinder with a feed forward gain factor. Summation of the proportional and the feed forward control parts give the preliminary control signal for each cylinder. The final control signals are determined through so-called lookup tables used to account for the non-linear properties and slightly different characteristics of all valves. These lookup tables relate the valve control signal to the resulting flow through the valve and consequently to the cylinder
Valve Control
Octans
Valve
Kinematic Calculation
Position Transducer
Ship Motions
Set Points Cylinder Lengths
Valve Control Signal
High Speed Controller
Measured Cylinder Lengths
Hydraulic pressure
Stewart platform Cylinders
User Interface
HPU
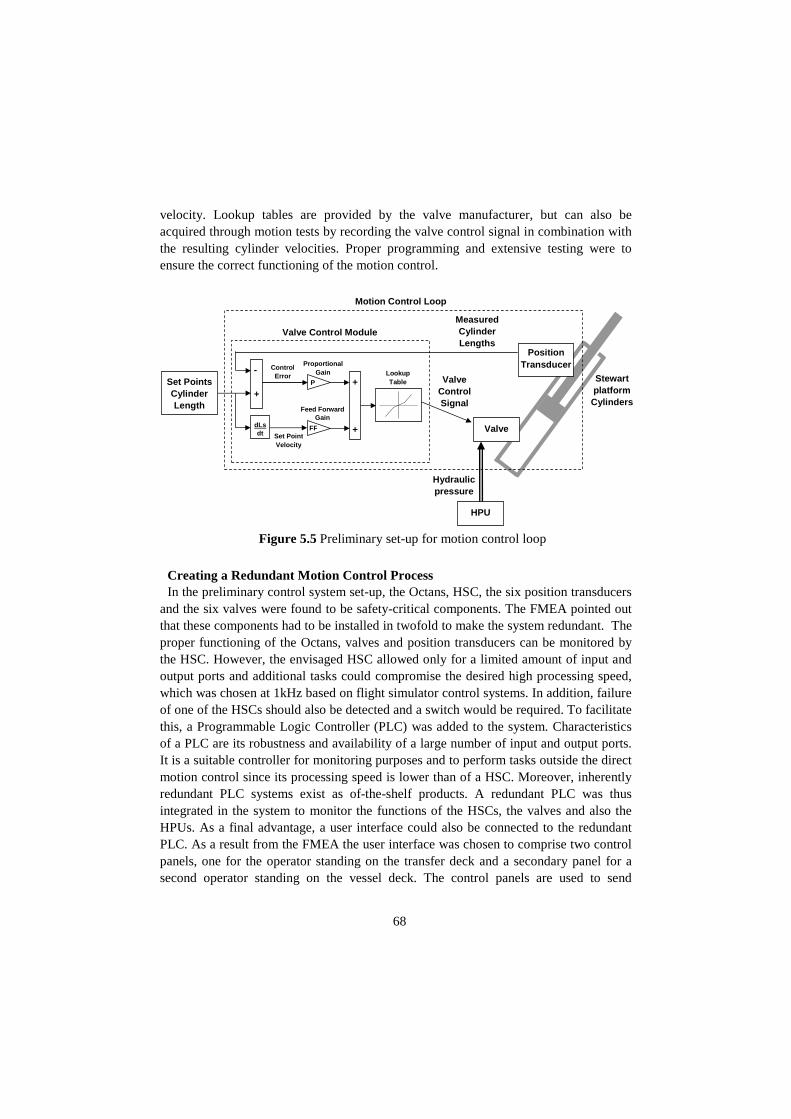
68
velocity. Lookup tables are provided by the valve manufacturer, but can also be acquired through motion tests by recording the valve control signal in combination with the resulting cylinder velocities. Proper programming and extensive testing were to ensure the correct functioning of the motion control.
Figure 5.5 Preliminary set-up for motion control loop
Creating a Redundant Motion Control Process In the preliminary control system set-up, the Octans, HSC, the six position transducers
and the six valves were found to be safety-critical components. The FMEA pointed out that these components had to be installed in twofold to make the system redundant. The proper functioning of the Octans, valves and position transducers can be monitored by the HSC. However, the envisaged HSC allowed only for a limited amount of input and output ports and additional tasks could compromise the desired high processing speed, which was chosen at 1kHz based on flight simulator control systems. In addition, failure of one of the HSCs should also be detected and a switch would be required. To facilitate this, a Programmable Logic Controller (PLC) was added to the system. Characteristics of a PLC are its robustness and availability of a large number of input and output ports. It is a suitable controller for monitoring purposes and to perform tasks outside the direct motion control since its processing speed is lower than of a HSC. Moreover, inherently redundant PLC systems exist as of-the-shelf products. A redundant PLC was thus integrated in the system to monitor the functions of the HSCs, the valves and also the HPUs. As a final advantage, a user interface could also be connected to the redundant PLC. As a result from the FMEA the user interface was chosen to comprise two control panels, one for the operator standing on the transfer deck and a secondary panel for a second operator standing on the vessel deck. The control panels are used to send
Valve
- +
Position Transducer
Valve Control Signal
Valve Control Module
Measured Cylinder Lengths
Hydraulic pressure
Stewart platform Cylinders
HPU
Control Error
dLs dt
Proportional Gain
Feed Forward Gain
P
FF
+ +
Set Point Velocity
Lookup Table
Set Points Cylinder Length
Motion Control Loop
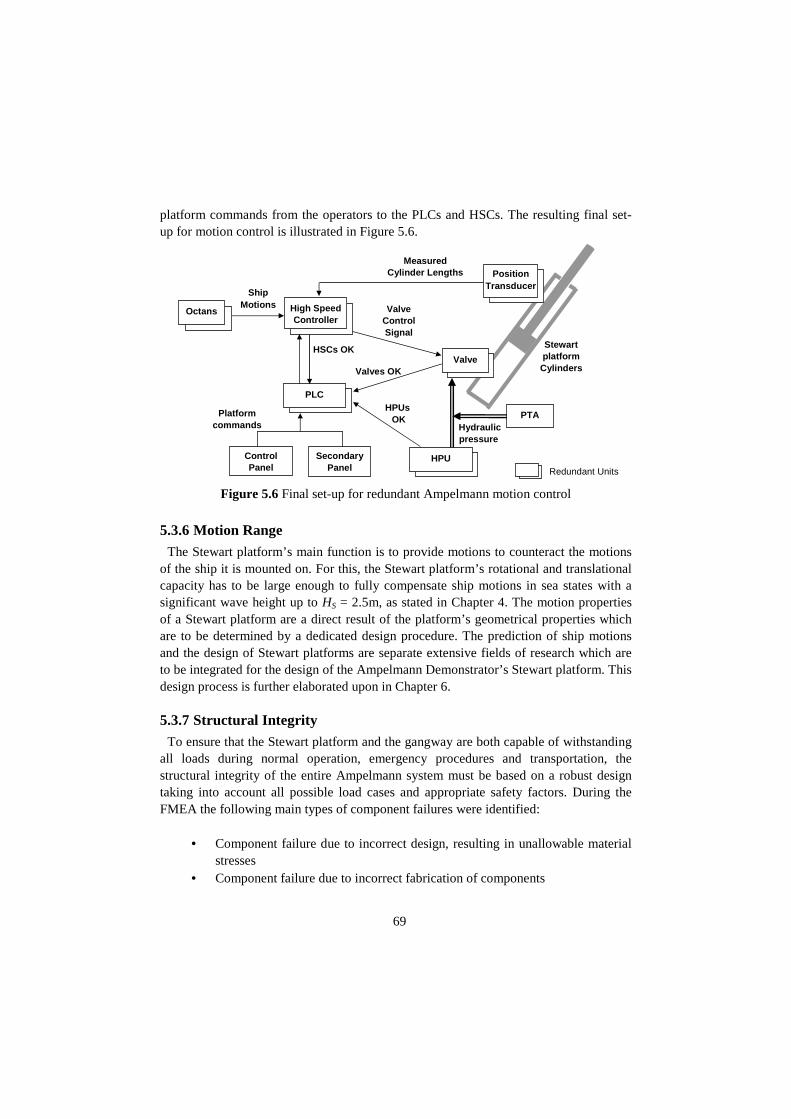
69
platform commands from the operators to the PLCs and HSCs. The resulting final set-up for motion control is illustrated in Figure 5.6.
Figure 5.6 Final set-up for redundant Ampelmann motion control
5.3.6 Motion Range The Stewart platform’s main function is to provide motions to counteract the motions
of the ship it is mounted on. For this, the Stewart platform’s rotational and translational capacity has to be large enough to fully compensate ship motions in sea states with a significant wave height up to HS = 2.5m, as stated in Chapter 4. The motion properties of a Stewart platform are a direct result of the platform’s geometrical properties which are to be determined by a dedicated design procedure. The prediction of ship motions and the design of Stewart platforms are separate extensive fields of research which are to be integrated for the design of the Ampelmann Demonstrator’s Stewart platform. This design process is further elaborated upon in Chapter 6.
5.3.7 Structural Integrity To ensure that the Stewart platform and the gangway are both capable of withstanding
all loads during normal operation, emergency procedures and transportation, the structural integrity of the entire Ampelmann system must be based on a robust design taking into account all possible load cases and appropriate safety factors. During the FMEA the following main types of component failures were identified:
• Component failure due to incorrect design, resulting in unallowable material
stresses • Component failure due to incorrect fabrication of components
Valve
Ship Motions
Valve Control Signal
Measured Cylinder Lengths
Stewart platform Cylinders
Octans
Octans
High Speed Controller
Position Transducer
Valve
Redundant Units
PLC
Valves OK
HPU
Hydraulic pressure
HPUs OK
HSCs OK
PTA
Control Panel
Secondary Panel
Platform commands
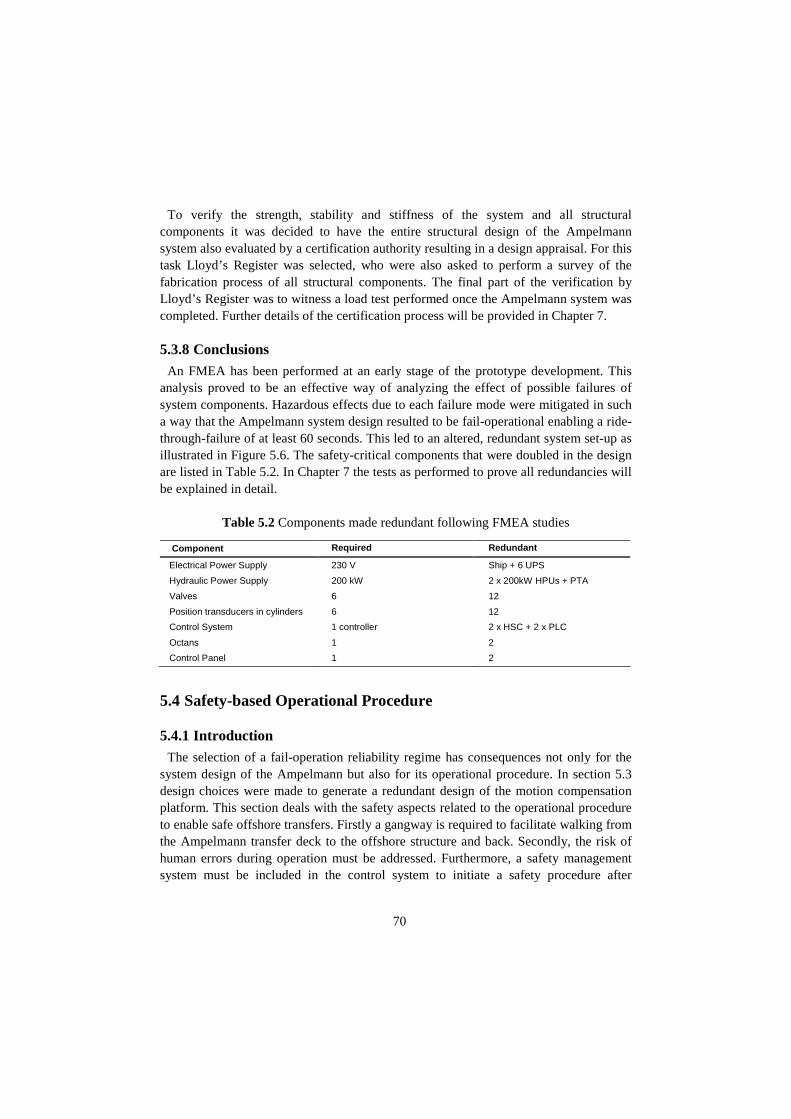
70
To verify the strength, stability and stiffness of the system and all structural components it was decided to have the entire structural design of the Ampelmann system also evaluated by a certification authority resulting in a design appraisal. For this task Lloyd’s Register was selected, who were also asked to perform a survey of the fabrication process of all structural components. The final part of the verification by Lloyd’s Register was to witness a load test performed once the Ampelmann system was completed. Further details of the certification process will be provided in Chapter 7.
5.3.8 Conclusions An FMEA has been performed at an early stage of the prototype development. This
analysis proved to be an effective way of analyzing the effect of possible failures of system components. Hazardous effects due to each failure mode were mitigated in such a way that the Ampelmann system design resulted to be fail-operational enabling a ride-through-failure of at least 60 seconds. This led to an altered, redundant system set-up as illustrated in Figure 5.6. The safety-critical components that were doubled in the design are listed in Table 5.2. In Chapter 7 the tests as performed to prove all redundancies will be explained in detail.
Table 5.2 Components made redundant following FMEA studies
Component Required Redundant
Electrical Power Supply 230 V Ship + 6 UPS
Hydraulic Power Supply 200 kW 2 x 200kW HPUs + PTA
Valves 6 12
Position transducers in cylinders 6 12
Control System 1 controller 2 x HSC + 2 x PLC
Octans 1 2
Control Panel 1 2
5.4 Safety-based Operational Procedure
5.4.1 Introduction The selection of a fail-operation reliability regime has consequences not only for the
system design of the Ampelmann but also for its operational procedure. In section 5.3 design choices were made to generate a redundant design of the motion compensation platform. This section deals with the safety aspects related to the operational procedure to enable safe offshore transfers. Firstly a gangway is required to facilitate walking from the Ampelmann transfer deck to the offshore structure and back. Secondly, the risk of human errors during operation must be addressed. Furthermore, a safety management system must be included in the control system to initiate a safety procedure after

71
detecting the failure of any component. Finally, the normal operational procedure for transferring personnel to and from offshore structures is presented.
5.4.2 Telescopic Access Bridge and Functionalities To enable walking safely from the transfer deck to an offshore structure a dedicated
gangway has been designed: the Telescopic Access Bridge (TAB). To allow positioning of the tip of this gangway against any point of access on an offshore wind turbine this TAB was designed to have three degrees of freedom: telescoping, luffing and slewing (Figure 5.7).
Figure 5.7 Degrees of freedom of the Telescopic Access Bridge The telescoping motion translates the extendable part of the TAB inwards and
outwards, the luffing motion rotates the TAB upwards and downwards and the slewing motion rotates TAB and transfer deck jointly around the transfer deck’s vertical centre axis. Once the transfer deck motions are actively compensated by the Stewart platform, the TAB can be positioned towards the offshore structure using the slewing, luffing and telescoping systems. As soon as it touches the structure, all systems are switched to the free-floating mode. In this mode, the telescoping system is constantly pushing outward. This means the tip introduces a small constant force on the structure. Should the vessel slowly drift away, the TAB will automatically extend under this force, with the tip maintaining contact with the structure so no gap appears. When the vessel moves towards the structure, the TAB will be pushed inwards; pressure relief valves then allow the TAB to retract automatically. In the slewing and luffing direction, the hydraulic overflow works in a similar fashion. With the TAB in free-floating mode, any residual motion of the transfer deck is compensated passively. The freedom of movement is such
Telescoping
Luffing
Slewing

72
that even in the emergency case, when the Ampelmann motion compensation capability is lost and all cylinders will be retracted until settled position is reached, the TAB’s passive system still allows the tip to stay in contact with the offshore structure.
5.4.3 Risk of Human Errors and Platform States As mentioned in the previous chapter special consideration has to be given to the risk
of human errors. The Ampelmann is operated through the user interface: the control panels. The prime operator is located on the transfer deck and operates the Ampelmann system from its starting position (all platform cylinders retracted) to motion compensation mode and back by commanding it into different platform states. To ensure safe operating a set of four platform states was defined for the Ampelmann Stewart platform:
• Safe Mode • Settled Sate • Neutral State • Engaged Sate
Safe Mode When the hydraulic pressure in the system is turned on, the platform will always be in
safe mode. In this mode all valves receive a small negative control signal from the control system causing a retracting force in the platform cylinders in order to keep them safely retracted. The Motion Control Loop depicted in Figure 5.5 is thus by-passed thereby excluding cylinder motions due to possible malfunction of the position transducers.
Settled State After the hydraulic pressure in the system is turned on and while the system is in safe
mode, the PLC performs a pre-starting check. This check includes a verification of the proper functioning of the platform cylinders’ position transducers. If the pre-starting check is successful, the control system automatically commands the platform to its settled state. In this state all cylinders are still kept at their minimal lengths, but now the cylinder valves are controlled by the Motion Control Loop (Figure 5.5). Thus motion control of the cylinders is now enabled: if the cylinder length set points are altered, the cylinders will move.
Neutral State The operator decides when the platform is ready to be raised into its neutral position,
which is defined as the elevation of the transfer deck at half of its maximum heave capacity. This is done after all personnel have boarded the transfer deck and the TAB is

73
in its retracted position and positioned outwards from the vessel. When the neutral command is given, the Motion Control Loop commands all platform cylinders from settled to neutral position using a smooth trajectory of 10 seconds.
Engaged State As soon as the PLC confirms that the platform has reached its neutral position, the
system is allowed to be engaged. The engaged platform state is defined as the state in which the cylinder valves are controlled by the motion control loop to actively compensate the vessel motions. For this, the cylinder lengths set points are determined by the kinematic calculation module which uses the Octans measurements. The engaged state thus equals the motion compensation mode. Once the engaged mode has been activated by the operator, a cross fader provides a smooth transition of 10 seconds between the neutral and the engaged platform states. The aforementioned four platform states are illustrated in Figure 5.8.
Figure 5.8 Definition of Ampelmann Stewart platform states To prevent the occurrence of hazardous situations due to human errors, each shift
between states is preceded by a set of checks: switching to another state is enabled only when a set of criteria has been met. Also, a predefined sequence between sets was made mandatory. This sequence is depicted in Figure 5.9 and shows that the operator can only use the Settled, Neutral and Engaged commands. However, in case of an emergency the platform will be commanded into its safe mode. All cylinders will then slowly retract until the platform has reached its fully retracted position. This emergency case is further explained in the next section.
Safe Mode: All cylinders kept retracted by constant pre-defined valve control signal Settled State: All cylinders kept at minimum length by motion control loop
Neutral State: Transfer deck kept at half of maximum heave elevation by motion control loop
Engaged State: Transfer deck kept motionless in inertial frame by motion control loop

74
Figure 5.9 Sequence of platform states
5.4.4 Operational Safety Management To relate all possible component failures to the operational procedures, several HAZID
(Hazard Identification) meetings were held with all stakeholders during the development of the Ampelmann Demonstrator. The outcome of these meetings led to the drafting of the ASMS: the Ampelmann Safety Management System. In this safety system hosted by the PLC, all possible failures are connected to a warning level. Table 5.3 shows the 4 levels: green for all normal, yellow for minor warnings, such as clogged filters, orange for the occurrence of a single component failure, but being backed up by the redundant unit, and code red for system failure: double failures.
Table 5.3 ASMS (Ampelmann Safety Management System)
failure mode codes and actions
Code Status Action
Green All OK Operational Yellow Alert Operational Orange Non critical failure Finish operation: 1 min.
Red Critical failure Finish or hold on: 5 sec.
In case of a code orange a redundancy is lost and failure of the back-up component
would lead to a system failure. It is therefore preferred to end the operation and have the platform return to safe mode. When a person is on the TAB or just about to transfer, however, it is recommended to finish that transfer first. The ASMS allows one minute for this which is considered sufficient. After that the control system will automatically generate a code red to prevent further use of the non-redundant system. In case of a code red, the control system automatically commands the Stewart platform into the safe mode since this is an emergency condition.
The colour codes are only visible for the operator, who also has the overview to assess
whether the person transferring must abort or finish his transfer before returning the system to its safe mode. Only code red is relayed to all of the crew: alarm lights will
Safe Mode
Settled
Neutral
Engaged
Operational States
Auto after Pre-starting Check OK
Operator Command
Operator Command
Operator Command
Operator Command
Auto after 2s when returning
from Neutral Emergency Condition

75
flash and sirens will sound. The person transferring has 5 seconds before the system will retract itself from the structure. This person can either complete the transfer or step back and hold tight. The alarm tree and the layout of the control panel are shown in Figure 5.10 and Figure 5.11.
It must be noted that both in the software and hardware design special attention must
be given to the separation between the motion control system (ensured through motion integrity), the safety system (ensured through the ASMS) and the alarm system (alarm sounds and lights). No component failure of the motion control system may compromise the functionality of the safety system or the alarm system.
Figure 5.10 Alarm tree on transfer deck
Figure 5.11 Control panel with platform and TAB controls and failure mode status lights
5.4.5 Normal Operational Procedure After having defined the different platform states and TAB functionalities, the normal
operational procedure could be established. The different stages within one cycle of the Ampelmann operational procedure are illustrated in Figure 5.12.
It is noted here that although large effort has been put in minimizing risks due to
human errors, it is evident that any person operating the Ampelmann system should be properly trained. A trained operator must have basic knowledge of the Ampelmann system and have the skills to perform the entire operational procedure, including properly positioning the TAB against a landing point and assessing whether it is safe for personnel to walk over the TAB. In addition, an operator should be conscious of the Ampelmann Safety Management System (ASMS) and aware of the safety procedures.
Operational Code Yellow
Code Orange
Code Red
Maintenance
SETTLED NEUTRAL ENGAGED Luff Up
Luff Down
Telescope Out
Telescope In
Slew Left
Slew Right
Free Floating Transfer
OFF
Override Pre-Starting Check
Emergency Shut Down
ON
All Dead
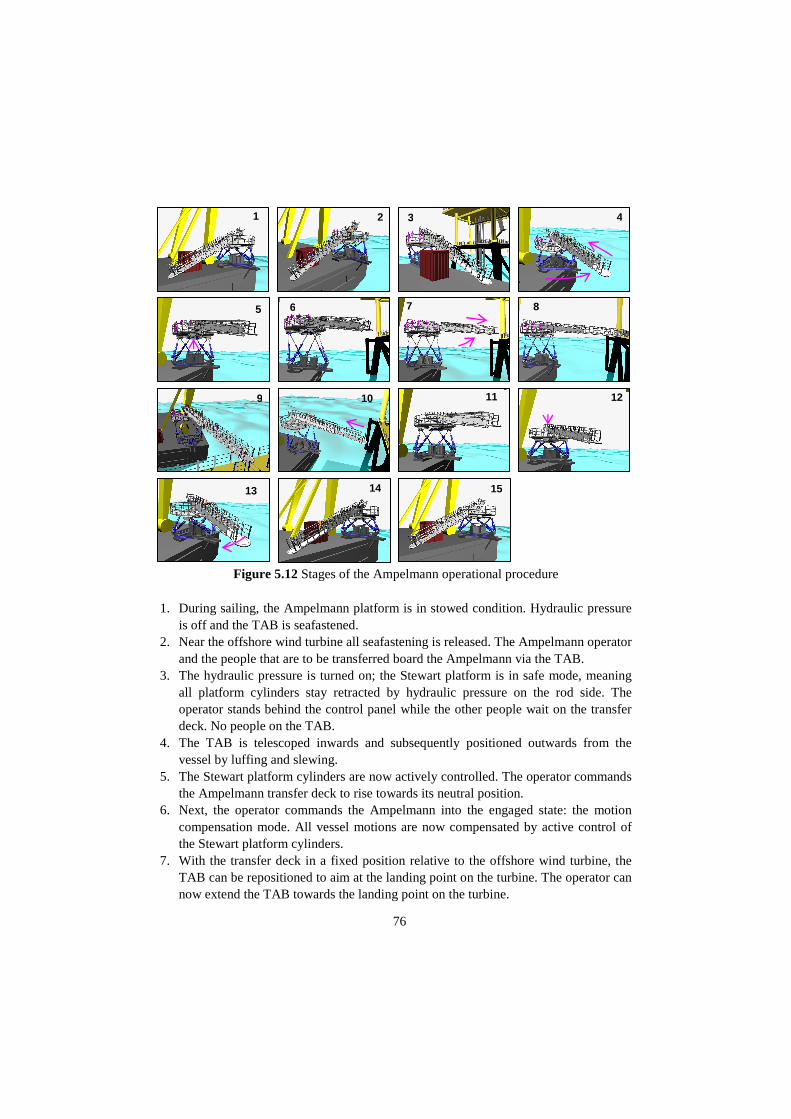
76
Figure 5.12 Stages of the Ampelmann operational procedure 1. During sailing, the Ampelmann platform is in stowed condition. Hydraulic pressure
is off and the TAB is seafastened. 2. Near the offshore wind turbine all seafastening is released. The Ampelmann operator
and the people that are to be transferred board the Ampelmann via the TAB. 3. The hydraulic pressure is turned on; the Stewart platform is in safe mode, meaning
all platform cylinders stay retracted by hydraulic pressure on the rod side. The operator stands behind the control panel while the other people wait on the transfer deck. No people on the TAB.
4. The TAB is telescoped inwards and subsequently positioned outwards from the vessel by luffing and slewing.
5. The Stewart platform cylinders are now actively controlled. The operator commands the Ampelmann transfer deck to rise towards its neutral position.
6. Next, the operator commands the Ampelmann into the engaged state: the motion compensation mode. All vessel motions are now compensated by active control of the Stewart platform cylinders.
7. With the transfer deck in a fixed position relative to the offshore wind turbine, the TAB can be repositioned to aim at the landing point on the turbine. The operator can now extend the TAB towards the landing point on the turbine.
1 2 3 4
5 6 8 7
11 12 9
15
10
13 14

77
8. When the end of the TAB is within 1 metre of the landing point, the TAB tip is moved outward and will contact the landing point using constant pressure on a telescoping cylinder. After contact, the luffing cylinders and the slewing motors will switch into passive mode.
9. The operator assesses the situation: if everything is OK, the operator switches on a green light and one person at a time can walk over the TAB to the structure.
10. After all people have been transferred, the passive mode of luffing, telescoping and slewing is turned off while the operator retracts the TAB and slews away from the structure.
11. With the TAB away from the structure, the operator switches the motion compensation off and the transfer deck gently fades into its neutral position, now moving along with the vessel.
12. Directly after the neutral position has been reached, the operator can command the transfer deck back to its settled position. Once the settled position is detected by the control system, the platform cylinders are directly switched into safe mode.
13. The operator now uses the telescoping, slewing and luffing functions of the TAB to manoeuvre it back on the vessel deck.
14. Once the TAB is correctly returned to its base position, the hydraulic pressure can be turned off. The operator and any other people can walk from the transfer deck over the TAB back on board of the vessel.
15. The Ampelmann platform is returned to its stowed position with the use of sea fastening when necessary.
5.4.6 Conclusions To facilitate safe and easy access from the Ampelmann transfer deck to a landing
point on a wind turbine, a dedicated gangway has been developed. This Telescopic Access Bridge (TAB) incorporates three degrees of freedom which enable the operator to position the tip of the gangway against any envisaged landing point. The free floating functions of the TAB serve as a safety feature to keep the gangway tip pressed against the landing point, also in case of an emergency.
An operational procedure has been defined for allowing safe transfers. Trained
operators command the Ampelmann system through different platform states, while the Ampelmann Safety Management System (ASMS) continuously monitors all system functionalities and warns the operator in case a component failure compromises the systems redundancy.
5.5 Summary It was decided to design the Ampelmann Demonstrator according to a fail-operational
reliability regime, implying that no component failure may compromise the system’s
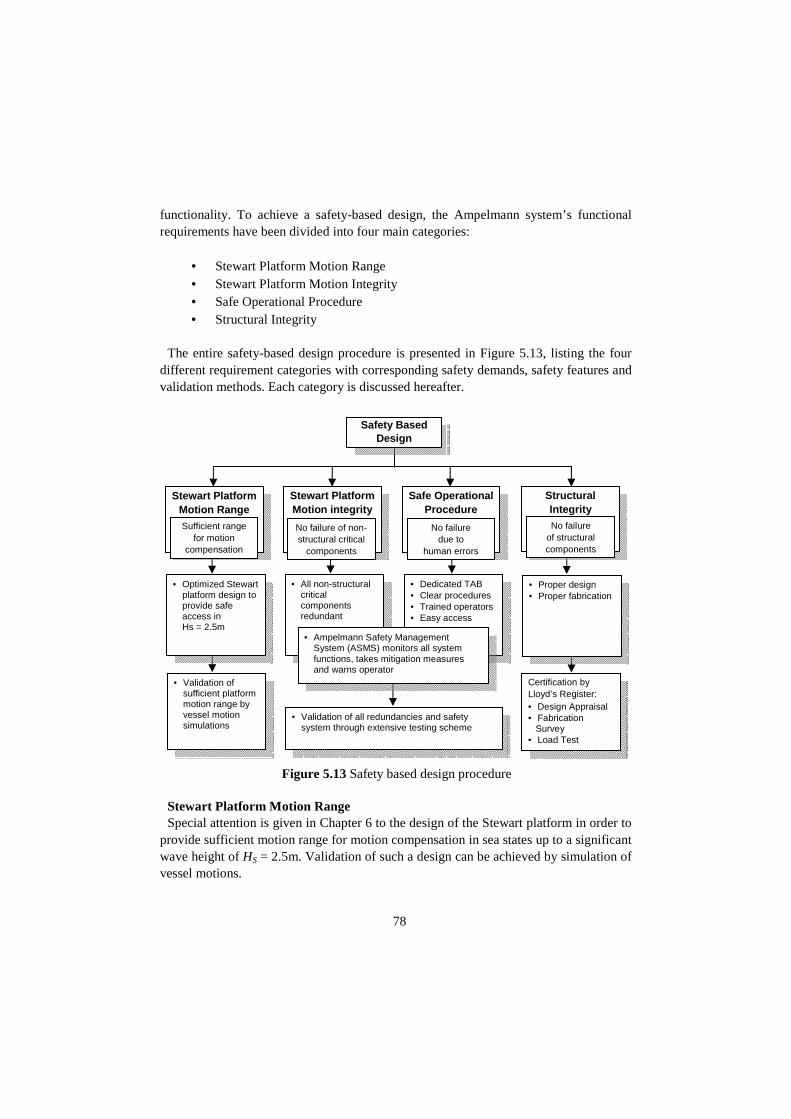
78
functionality. To achieve a safety-based design, the Ampelmann system’s functional requirements have been divided into four main categories:
• Stewart Platform Motion Range • Stewart Platform Motion Integrity • Safe Operational Procedure • Structural Integrity
The entire safety-based design procedure is presented in Figure 5.13, listing the four
different requirement categories with corresponding safety demands, safety features and validation methods. Each category is discussed hereafter.
Figure 5.13 Safety based design procedure Stewart Platform Motion Range Special attention is given in Chapter 6 to the design of the Stewart platform in order to
provide sufficient motion range for motion compensation in sea states up to a significant wave height of HS = 2.5m. Validation of such a design can be achieved by simulation of vessel motions.
Safety Based Design
Certification by Lloyd’s Register: • Design Appraisal • Fabrication
Survey • Load Test
• Proper design • Proper fabrication
Structural Integrity No failure
of structural components
• Validation of sufficient platform motion range by vessel motion simulations
• Optimized Stewart platform design to provide safe access in Hs = 2.5m
Stewart Platform Motion Range
Sufficient range for motion
compensation
• Validation of all redundancies and safety system through extensive testing scheme
• All non-structural critical components redundant
• Dedicated TAB • Clear procedures • Trained operators • Easy access
• Ampelmann Safety Management System (ASMS) monitors all system functions, takes mitigation measures and warns operator
Stewart Platform Motion integrity
Safe Operational Procedure
No failure of non-structural critical
components
No failure due to
human errors

79
Stewart Platform Motion Integrity In order to have the Stewart platform motion system and its control system fail-
operational all non-structural critical components were designed to be redundant. This set-up allows the system to ride through any component failure for at least 60 seconds. As soon as such a component fails the Ampelmann Safety Management System (ASMS) will detect this failure and immediately take mitigating measures: isolate the failure and switch to the redundant component. In addition the operator is warned to finish the operation within one minute.
The electrical plan, hydraulic plan and motion control were integrated in the entire
system in such a way that theoretically the system design complied with the fail-operational safety philosophy. However, the proper functioning of this system design had to be proven in practice through a series of tests on the Ampelmann Demonstrator. These tests are described in Chapter 7.
Safe Operational Procedure In addition to the redundancies in the Stewart platform, the risks due to human errors
were addressed thoroughly. A dedicated Telescoping Access Bridge (TAB) has been designed, that can safely be positioned for easy access. Furthermore a clear operational procedure has been created including pre-defined platform states being monitored by the control system. The entire procedure is being backed-up by the Ampelmann Safety Monitoring System (ASMS) which monitors all system functions; in case of a component failure it takes mitigation measures and warns the operator. Ampelmann operators should be trained adequately. Validation of the ASMS and the operational procedure is provided by a series of tests presented in Chapter 7.
Structural Integrity To ensure the structural integrity of the Ampelmann system, failure of structural
components should be avoided by appropriate design and manufacturing of these components. This process has been validated by a certification process performed by Lloyd’s Register described in detail in Chapter 7.

80

81
6. Stewart Platform Design
6.1 Introduction The Stewart platform as applied in the Ampelmann system can move in all six degrees
of freedom to keep a transfer deck motionless on a moving vessel. The motion range of the Stewart platform used for the Ampelmann Demonstrator has to be large enough to compensate the motions on the envisaged host vessels (seagoing tugs or supply vessels with lengths of 25m and more) in the design sea state with a significant wave height of 2.5m. While the required motion range of a Stewart platform is dictated by the vessel motions in the design sea state, the platform’s architecture determines its physically possible motion range. To realize full motion compensation, the vessel motions should be within the Stewart platform’s motion range capability. In addition, the effect of the Stewart platform’s configuration on the forces in the platform’s cylinders must be examined. This chapter elaborates on how to arrive at the preferred architecture of the Stewart platform for the Ampelmann Demonstrator in relation to the required motion range.
In section 6.2 the basics of a Stewart platform are treated. Section 6.3 deals with the
modelling of waves and simulation of vessel motions. Subsequently, a design method for a Stewart platform is presented in section 6.4 which is based on the predicted vessel motions that are to be compensated. In section 6.5, another method to arrive at the Stewart platform design is shown based on the similarity between different existing Stewart platforms. Optimization of the platform architecture is addressed in section 6.6, leading not only to the final design of the Stewart platform as used in the Ampelmann prototype but also to a preferred design procedure. The different design methods are evaluated in section 6.7.
6.2 Stewart Platform Basics
6.2.1 General Definitions Stewart platforms comprise a rigid base frame and a rigid top frame, connected by six
linear actuators. At both ends, each actuator is attached to the frames by means of gimbals: mechanical devices that allow rotation in one or more of their degrees of freedom. This basic Stewart platform arrangement is shown in Figure 6.1.

82
x y
z
x y
z
ot
Top Frame
Actuator (6x)
Gimbal at top (6x)
Base Frame
ob
Gimbal at base (6x)
The specific composition of a Stewart platform is referred to as its architecture and is
determined by a set of parameters. Throughout the literature found on Stewart platforms, many different symbols are being used to describe the same set of parameters (for example [33] and [34]). For this research a definition of all parameters and their symbols will be given. The most commonly applied Stewart platform design is the rotationally symmetric architecture, which implies that the gimbal pairs at the upper and lower frame are placed at intervals of 120 degrees and the locations of the six upper and six lower gimbal joints can be mapped on circles [34]. In this thesis only rotationally symmetric Stewart platforms will be considered, since their architecture is the most commonly applied and therefore widely described in literature.
This architecture also presents some practical advantages, such as the use of six
identical cylinders and repetitive design for the gimbal pairs. With this assumption, the Stewart platform geometry can be described by a total of six
parameters. Four parameters define the top and base frame geometries: Rt = Radius top frame [m] Rb = Radius base frame [m]
γt = Half separation angle between top gimbal pairs [rad] γb = Half separation angle between base gimbal pairs [rad]
Figure 6.1 Stewart platform arrangement

83
These parameters are shown in Figure 6.2.
Figure 6.2 a) Base frame parameters and base gimbal points
b) Top frame parameters and top gimbal points
Related to the four parameters that determine the base and top frame geometry are the
following two variables: st = Half separation distance between top gimbal pairs [m] sb = Half separation distance between base gimbal pairs [m]
Where: sint t ts R γ= and sinb b bs R γ= (6.1)
The base and top gimbal x and y coordinates can be determined in the base frame
coordinate system fixed to Ob and in the top frame coordinate system attached to Ot
(Figure 6.2), respectively, through the parametric notations given in Table 6.1.
Table 6.1 Parametric notation of gimbal coordinates
( ) ( )( ) ( )( ) ( )( ) ( )( ) ( )
( ) ( )
( ) ( )( ) ( )
( )
1 1
2 2
3 3
4
5
6
cos sin cos 1 3 sin 1 3
cos 2 3 sin 2 3 cos 1 3 sin 1 3
cos 2 3 sin 2 3 cos sin
cos 4 3 sin 4 3
cos 4 3 sin 4 3
cos sin
b b b b t t t t
b b b b t t t t
b b b b t t t
b b b b
b b b b
b b b b
x y x y
b R R t R R
b R R t R R
b R R t R R
b R R
b R R
b R R
γ γ π γ π γπ γ π γ π γ π γπ γ π γ π γ ππ γ π γπ γ π γγ γ
− −− − + ++ + − −− −+ +
− −
( )( ) ( )
( ) ( )( ) ( )
4
5
6
cos sin
cos 5 3 sin 5 3
cos 5 3 sin 5 3
t
t t t t
t t t t
t t t t
t R R
t R R
t R R
γπ γ π γ
π γ π γπ γ π γ
+ +− −+ +
x
y
120°
sb
Rb
Ob
120°
b2
b1
b3
b4
b5
b6
γb
y
120°
t1
t6
t5
t4
t3
t2
120°
st
Rt
Ot
x γt

84
With: bi = Base gimbal of actuator i for i = 1,2,...,6 ti = Top gimbal of actuator i for i = 1,2,...,6 The remaining two parameters for defining the Stewart platform architecture are
related to the linear actuators as shown in Figure 6.1; these linear actuators (cylinders) are shown in Figure 6.3:
lmin = Minimum cylinder length [m] lmax = Maximum cylinder length [m] The cylinder length properties can also be given by another set of parameters: lstroke = Cylinder stroke length [m] ldead = Cylinder dead length [m] The stroke length corresponds to the extendable part of the cylinder, the dead length
accounts for the part that is not used for extension. A minimum dead length is necessary to fit the gimbals and their connections to the cylinder. The total cylinder length is defined here as the distance between the two gimbal centres. The minimum and maximum cylinder lengths are related to the stroke and dead length according to the following equations:
min dead strokel l l= + (6.2)
max 2*dead strokel l l= + (6.3)
Figure 6.3 Cylinder length parameters The neutral length of a cylinder can be defined as the gimbal to gimbal distance of a
cylinder at half its stroke length. It is noted that the neutral cylinder length will slightly
Minimum cylinder length: lmin
Stroke length
Dead length
lmin = ldead + lstroke
Maximum cylinder length: lmax
Stroke length
lmax = ldead + 2*lstroke
Dead length Stroke length
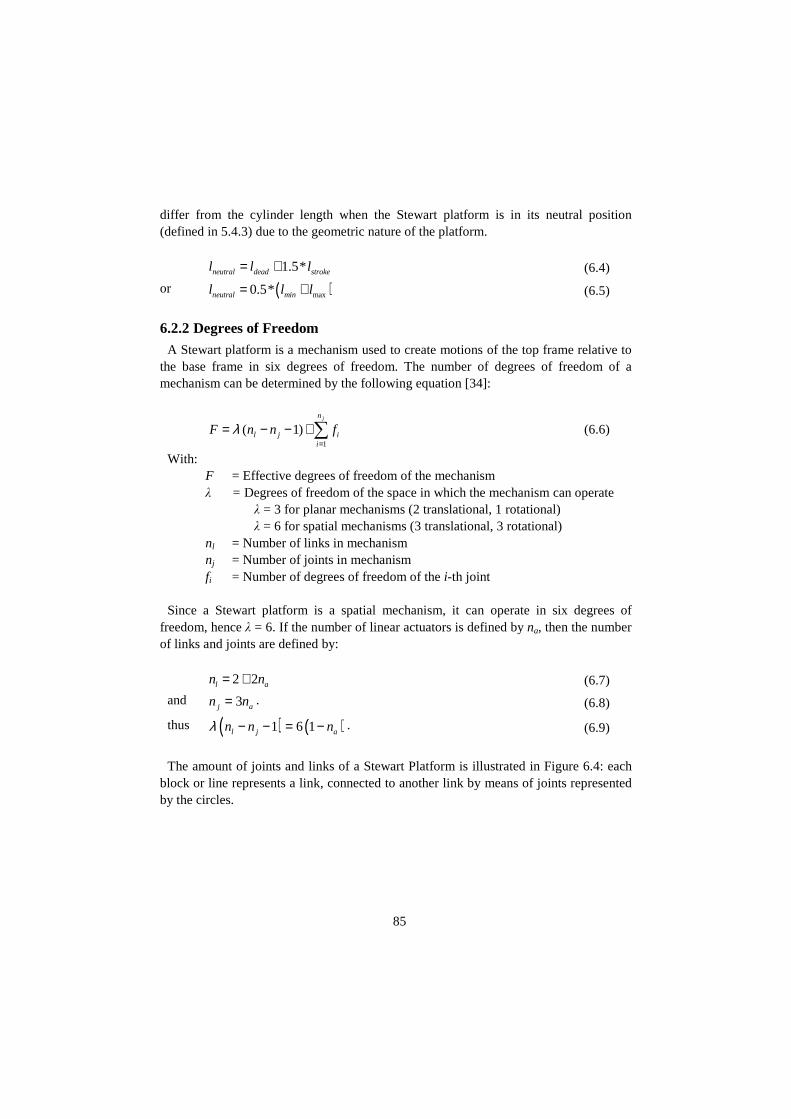
85
differ from the cylinder length when the Stewart platform is in its neutral position (defined in 5.4.3) due to the geometric nature of the platform.
1.5*neutral dead strokel l l= + (6.4)
or ( )max0.5*neutral minl l l= + (6.5)
6.2.2 Degrees of Freedom A Stewart platform is a mechanism used to create motions of the top frame relative to
the base frame in six degrees of freedom. The number of degrees of freedom of a mechanism can be determined by the following equation [34]:
1
( 1)jn
l j ii
F n n fλ=
= − − +∑ (6.6)
With: F = Effective degrees of freedom of the mechanism λ = Degrees of freedom of the space in which the mechanism can operate λ = 3 for planar mechanisms (2 translational, 1 rotational) λ = 6 for spatial mechanisms (3 translational, 3 rotational) nl = Number of links in mechanism nj = Number of joints in mechanism fi = Number of degrees of freedom of the i-th joint Since a Stewart platform is a spatial mechanism, it can operate in six degrees of
freedom, hence λ = 6. If the number of linear actuators is defined by na, then the number of links and joints are defined by:
2 2l an n= + (6.7)
and 3j an n= . (6.8)
thus ( ) ( )1 6 1l j an n nλ − − = − . (6.9)
The amount of joints and links of a Stewart Platform is illustrated in Figure 6.4: each
block or line represents a link, connected to another link by means of joints represented by the circles.

86
Figure 6.4 Links and joints in a Stewart platform
Furthermore, the total number of degrees of freedom of all joints can be given as
1
( )jn
i a b c ti
f n f f f=
= + +∑ (6.10)
where: ft = Degrees of freedom of joint at top level fc = Degrees of freedom of joint at cylinder level fb = Degrees of freedom of joint at base level Using (6.9) and (6.10) equation (6.6) can be rewritten as:
( )6(1 )a a i i iF n n f f f= − + + + (6.11)
Since the number of actuators equals na = 6 and the required number of degrees of
freedom for the Stewart Platform is F = 6, Equation (6.11) can now be simplified to: 6t c bf f f+ + = (6.12)
This means that the number of DoFs that a mechanism has depends on the types of
joints between the links. For the joints connecting the cylinders to either the top or the base plate, the types that can be used are shown in Table 6.2 [35]:
top level
cylinder level
base level

87
Table 6.2 Joints at plate level
Names Number of degrees of freedom
Letter Symbol
Typical form
Universal joint Hooke joint (English) Cardan joint (continental Europe)
2 U
Spherical joint Ball joint Spherical pair
3 S
The joints at cylinder level can also be of two different types as presented in Table 6.3:
Table 6.3 Joints at cylinder level
Names Number of degrees of freedom
Letter Symbol
Typical form
Prismatic joint Slider Sliding pair
1 P
Cylindrical joint Cylindrical pair
2 C
To ensure that the Stewart platform has six degrees of freedom, the selection of the
type of joints must be in compliance with Equation (6.12). This restraint leads to three options for joint combinations shown in Table 6.4:
Table 6.4 Stewart platform joint combinations
option 1 option 2 option 3
joint type f joint type f joint type F
top level S 3 U 2 U 2
cylinder level P 1 P 1 C 2
base level U 2 S 3 U 2
ft + fc + fb 6 6 6
For the use in offshore conditions, universal joints are generally preferred over
spherical joints due to lower costs and higher robustness. Additionally, uniformity of the joints at top and base level has a practical advantage. For this reason option 3 has been

88
chosen for the Ampelmann prototype Stewart platform. A prerequisite for this option is that the cylinders function as a cylindrical joint: the rod should be able to rotate freely around its axis relative to the casing.
6.2.3 Kinematics The pose (or configuration) of a Stewart platform at any arbitrary point in time can be
defined by the position and orientation of the top and base frame in relation to each other. Given this relative position and orientation, all six actuator lengths can be determined; this calculation procedure is named inverse kinematics [36]. The derivation of the pose of a Stewart platform with given actuator lengths, is referred to as forward kinematics. The forward kinematics problem has more than one solution, whereas the inverse kinematics problem has a single solution.
Inverse Kinematics A calculation procedure for the inverse kinematics of a Stewart platform shall be given
here. Assume a Stewart platform in a certain pose, given by three rotations and three translations of the top frame relative to the base frame. When considering the coordinate system attached to the centre of the base frame Ob, the position of the centre of the top frame C can be described by vector c that is defined as:
C
C
C
x
c y
z
=
with respect to the Ob coordinate system. (6.13)
The three rotations of the top frame relative to Ob are defined as:
1. rotation about the xb-axis; the angle is called roll φ 2. rotation about the yb-axis; the angle is called pitch θ 3. rotation about the zb-axis; the angle is called yaw ψ
The coordinates of a top frame gimbal ti can be described by a fixed vector ti in the Ot
coordinate system. In order to express the top gimbals positions in the base frame coordinate system, the three rotations of the top frame relative to the base frame are to be taken into account. The angles of these three rotations are defined as Euler angles. However, the sequence in which these rotations are executed is important: when the same rotations are performed in a different order, the final orientation will differ as well. The sequence of rotations, referred to as the Euler rotation sequence, is mostly denoted by using numbers 1, 2 and 3 for the rotations around the x, y and z axis, respectively [37]. The most commonly used rotation sequence is the 3-2-1 rotation: first yaw, then
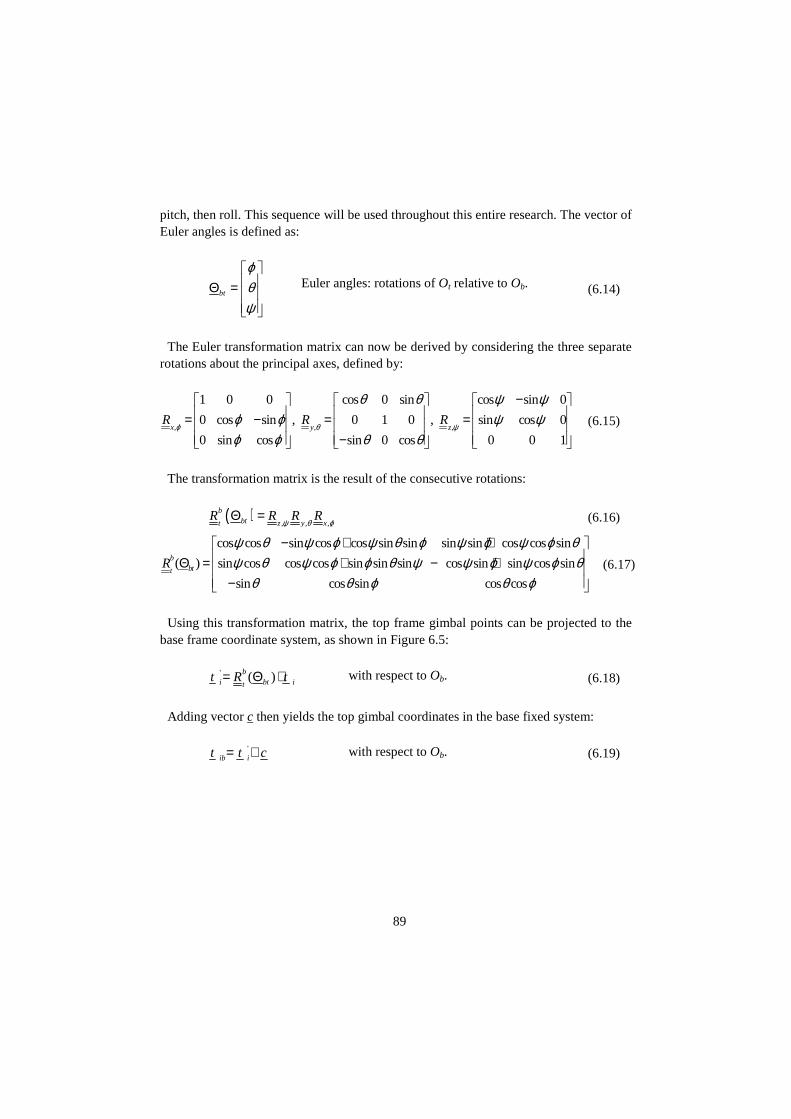
89
pitch, then roll. This sequence will be used throughout this entire research. The vector of Euler angles is defined as:
bt
ϕθψ
Θ =
Euler angles: rotations of Ot relative to Ob. (6.14)
The Euler transformation matrix can now be derived by considering the three separate
rotations about the principal axes, defined by:
, , ,
1 0 0 cos 0 sin cos sin 0
0 cos sin , 0 1 0 , sin cos 0
0 sin cos sin 0 cos 0 0 1x y z
R R Rϕ θ ψ
θ θ ψ ψϕ ϕ ψ ψϕ ϕ θ θ
− = − = = −
(6.15)
The transformation matrix is the result of the consecutive rotations:
( ), , ,
bbtt z y x
R R R Rψ θ ϕ
Θ = (6.16)
cos cos sin cos cos sin sin sin sin cos cos sin
( ) sin cos cos cos sin sin sin cos sin sin cos sin
sin cos sin cos cos
bbtt
R
ψ θ ψ ϕ ψ θ ϕ ψ ϕ ψ ϕ θψ θ ψ ϕ ϕ θ ψ ψ ϕ ψ ϕ θ
θ θ ϕ θ ϕ
− + + Θ = + − + −
(6.17)
Using this transformation matrix, the top frame gimbal points can be projected to the
base frame coordinate system, as shown in Figure 6.5:
' ( )bbti it
t R t= Θ ⋅ with respect to Ob. (6.18)
Adding vector c then yields the top gimbal coordinates in the base fixed system:
'ib it t c= + with respect to Ob. (6.19)

90
Figure 6.5 Vectors used for actuator length calculation
Next, the length vector l can be derived for each actuator:
i ib il t b= − (6.20)
Finally, the absolute gimbal-to-gimbal actuator lengths can be determined.
i il l= (6.21)
The latter step completes the inverse kinematics sequence, computing six actuator
lengths from a given top frame position and orientation. Forward Kinematics Forward kinematics determines the position and orientation of the top frame relative to
the base frame, given the six actuator lengths. In geometrical sense, it is equivalent to the problem of placing a rigid body in such a way that six of its given points lie on six given spheres. In [36] this problem is described analytically through the following equation:
2
2( )bbt i i it
R t c b lΘ ⋅ + − = for i = 1,…,6. (6.22)
This problem is known to have 40 solutions in the complex domain, found by
determining the roots of a 40th-order univariate polynomial equation [38]. Other approaches were developed to reduce the number of solutions. For instance, by assuming the coalescence of all gimbal pairs the manipulator can be simplified to a 3-3 Stewart platform mechanism (3 upper and 3 lower gimbal points), which yields 16 different positions and orientations for the top frame. However, no analytical approach leads to a single solution for the forward kinematics problem. Numerical approaches
Ob
Ot
bi
ti
bi
ti’
c
ti
l i
C
tib
91
that directly resort to nonlinear-equation-solving algorithms can compute one real solution if a good starting point is given in the form of a neighbouring pose [36]. Both in time domain simulations as well as in real Stewart platform motions, such a pose is available from the previous time step. Normally a Newton-Raphson iteration is applied for this.
Forward kinematics can be used to determine the actual top frame position and
orientation relative to the base frame from the measured cylinder lengths. For the Ampelmann system this process can be used to determine the residual motions of the transfer deck. However, since forward kinematics involves iterations which require computational effort and time this process is not included in the control system. For the motion control of a Stewart platform forward kinematics is not essential. To enable top frame motions relative to base frame in all six degrees of freedom set points for all six cylinder lengths are necessary; these lengths are calculated through inverse kinematics.
6.2.4 Singularities In order to ensure the proper functioning of a Stewart platform, singularities of the
mechanism must be avoided. Mechanical singularity in a platform can be defined as the configuration or pose of a mechanism that causes unpredictable behaviour. In [34] singularity is described as the condition in which the command input vector is unable to effectuate completely the control of the output vector comprising the position and orientation of the end-effector, the top frame. In the case of serial manipulators, singularity results in the loss of one or more degrees of freedom; when considering parallel architectures such as the Stewart platform, singularity causes one or more additional DoFs.
In [33] the singularity types of a parallel manipulator are conveniently classified into
three categories: Architecture singularities This singularity is caused by the architecture of the Stewart platform and will exist for
all configurations inside the entire or part of the manipulator workspace. In the specific case of the rotationally symmetrical Stewart platform that is considered within this research, architecture singularity occurs when the half separation angles between the gimbal pairs of both top and base frame, γt and γb, are equal to π/6 [34]. In this architecture the gimbal points on both frames form regular hexagons and the yaw rotation becomes undetermined. Architecture singularities can thus be avoided by proper choice of these angles.
92
Configuration singularities A singularity caused by a particular pose of the platform. This kind of singularity can
lead to instability of the platform. Near-singularities can cause high axial actuator forces and should therefore be avoided. This can be done by analyzing the dexterities (see 6.2.5) of a platform within its workspace: in case of a configuration singularity, the dexterity at this pose equals zero. The calculation of dexterities is therefore crucial for determining a proper Stewart platform architecture; this calculation is treated in the next section.
Formulation singularities This kind of singularity is associated with particular formulation methods. For
instance, if the top plate orientation is represented through Euler-3-2-1 angles, the kinematic model will become singular if the second Euler angle equals ±π/2 radians. However, the application of the Ampelmann system will not require rotations of such magnitude thus formulation singularities will always be avoided.
6.2.5 Dexterity A straight-forward and accepted method to avoid configuration singularities within the
entire workspace of a specific Stewart platform architecture is to calculate its dexterities. The dexterity is a characteristic value of a certain Stewart platform in a given pose; its value can range from a maximum of one to a minimum of zero, where a value of zero indicates the occurrence of singularity. High dexterity values indicate an efficient use of the actuator length changes relative to the Stewart platform motions: from a given pose with a corresponding high dexterity, any actuator motion causes a significant platform motion. A low dexterity on the other hand indicates the proximity to singularity or the occurrence of singularity when the dexterity equals zero. Therefore, it is essential to assess any Stewart platform architecture by running dexterity calculations throughout its entire workspace, i.e. in all possible poses. Based upon a great deal of experience in designing and analyzing Stewart platforms for flight simulator motion bases, Advani [34] suggests a minimum allowable dexterity of 0.2 in order to keep actuator forces and velocities within reasonable limits.
In order to calculate the dexterity of a platform in a given pose, the following steps are
taken. First, the ratios between changes in platform position and changes in cylinder lengths are registered in the Jacobian matrix:

93
1 1 1 1 1 1
2 2 2 2 2 2
3 3 3 3 3 3
4 4 4 4 4 4
5 5 5 5 5 5
6 6 6 6 6 6
l l l l l lx y z
l l l l l lx y z
l l l l l lx y z
l l l l l lx y z
l l l l l lx y z
l l l l l lx y z
J
ϕ θ ψ
ϕ θ ψ
ϕ θ ψ
ϕ θ ψ
ϕ θ ψ
ϕ θ ψ
∂ ∂ ∂ ∂ ∂ ∂∂ ∂ ∂ ∂ ∂ ∂∂ ∂ ∂ ∂ ∂ ∂∂ ∂ ∂ ∂ ∂ ∂
∂ ∂ ∂ ∂ ∂ ∂∂ ∂ ∂ ∂ ∂ ∂∂ ∂ ∂ ∂ ∂ ∂∂ ∂ ∂ ∂ ∂ ∂
∂ ∂ ∂ ∂ ∂ ∂∂ ∂ ∂ ∂ ∂ ∂
∂ ∂ ∂ ∂ ∂ ∂∂ ∂ ∂ ∂ ∂ ∂
=
(6.23)
Or ll x J x
x
∂= = ⋅∂
ɺ ɺ ɺ (6.24)
where x = [x y z φ θ ψ]T Platform position vector
l = [l1 l2 l3 l4 l5 l6]T Cylinder length vector
The Jacobian must be calculated for all possible poses within the Stewart platform’s
workspace. Every column in this matrix is calculated by implementing a small change of value in one degree of freedom and then calculating the rate of change in all six leg lengths.
Next, the condition number of the Jacobian can be derived by using its norm:
1J Jκ −= (6.25)
Singular value decomposition can be used to produce the diagonal matrix of singular
values of J:
1
2
3
4
5
6
0 0 0 0 0
0 0 0 0 0
0 0 0 0 0
0 0 0 0 0
0 0 0 0 0
0 0 0 0 0
SJ
σσ
σσ
σσ
=
(6.26)
Using the minimum and maximum singular values from this matrix gives another
method to derive the condition number of the Jacobian:

94
( )( )
max
min
J
J
σκ
σ= (6.27)
Finally, the dexterity is defined as the inverse of the condition number:
( )( )
max
min
1 JDexterity
J
σκ σ
= = (6.28)
6.2.6 Workspace The main functionality of a Stewart platform is to provide motions; therefore its most
significant property is its motion range, or workspace. The workspace of a Stewart platform can be defined as the total 6DoF motion range of the platform, encompassing all poses in which the cylinder lengths meet the following criterion:
min maxil l l≤ ≤ for i = 1,2,…,6 (6.29)
Since a Stewart platform allows motions in six degrees of freedom, the workspace
should also be described in six degrees of freedom. This presents a practical problem since the maximum allowable motion in each degree of freedom depends on the motions in all other degrees of freedom. For example, if the top frame has a certain yaw angle, the maximum heave excursion will be reduced compared to a situation with no yaw angle. This is caused by the fact that for maintaining a certain yaw angle a part of the stroke length must remain “reserved”. The method to determine the total 6DoF workspace is to create a large set of platform poses (by varying all degrees of freedom with small step sizes) and checking each pose with the criterion in Equation (6.29). The total 6DoF workspace can then be presented by an extensive list of possible platform poses.
Another method to provide insight in the workspace of a Stewart platform is to plot the
two-dimensional translational workspaces of the platform, while keeping the three rotations and one translation disengaged. The working range limits of each cylinder can then be plotted by circles. Examples of such plots are given in Figure 6.6, Figure 6.7 and Figure 6.8: the hatched area represents the workspace of the centre of the top frame in the given plane.

95
Figure 6.6 Workspace in the Oxz-plane Figure 6.7 Workspace in the Oyz-plane
Figure 6.8 Workspace in the Oxy-plane Finally, a simplified and accepted way to describe the properties of a workspace is to
present the maximum non-simultaneous excursions of the platform in each degree of freedom. These excursions can be determined by varying the translation or rotation in one degree of freedom at a time until the criterion in Equation (6.29) is no longer met. For practical reasons the starting point of this calculation is the neutral position of the platform, i.e. at half of its maximum heave. This method enables a fast quantitative comparison of workspace between different Stewart platform architectures and is therefore used in the remainder of this research.
6.2.7 Cylinder Loads To ensure the proper design of the structural components of the Ampelmann
Demonstrator it is essential to determine the maximum occurring axial loads in the Stewart platform’s cylinders. For a given loading condition on the upper platform, these loads depend both on the Stewart platform’s architecture as well as on the Stewart platform’s pose at any given moment. The influence of the Stewart platform’s architecture on the maximum cylinder loads is examined in section 6.6. The determination of the axial cylinder loads in a certain pose is treated in this section.
z z
x y
x
y

96
A Stewart platform’s pose is given by the relative position between the upper and lower part of the platform. Since the upper part of the platform will always be level during motion compensation, the cylinder loads are directly caused by the positions and rotations of the base frame mounted on the vessel, determined by the surge, sway, heave, roll, pitch and yaw of the vessel. For every Stewart platform pose combined with a set of known external loads there is one unique solution for the axial cylinder forces.
There are six external loads working on the upper platform:
Fx = External force in x-direction [N] Fy = External force in y-direction [N] Fz = External force in z-direction [N] Mx = External bending moment around x-axis [Nm] My = External bending moment around y-axis [Nm] Mz = External bending moment around z-axis [Nm].
These loads are counteracted by the normal forces in the six cylinders (Figure 6.9):
Ni = Axial force in cylinder i [N] for i = 1,2,…,6
Figure 6.9 Loads on Stewart platform and cylinder reaction forces
The six unknown axial cylinder forces can be determined using the following six
equations around a virtual point T located at the centre of the top frame gimbal points:
N4 N2
N3
N5 N6
N1
Fx
Fy Fz
Mx
My
Mz
T

97
0; 0; 0; 0; 0; 0.x y z x y zF F F M M MΣ = Σ = Σ = Σ = Σ = Σ = (6.30)
The reaction forces in the cylinders depend on the directionality of each cylinder in a
given platform pose. This directionality can be expressed by the unit vector of each cylinder’s length:
,
,
,
ˆˆ ˆ .
ˆ
l i
ii l i
il i
xl
l yl
z
= =
(6.31)
With the upper platform being positioned in the horizontal plane, the normal forces in
each of the six cylinders can be determined for any given pose. Equation (6.30) can be rewritten to the following matrix equation:
1 2 3 4 5 6
1 2 3 4 5 6
1 2 3 4 5 6
1 1 2 2 3 3 4 4 5 5 6 6
1 1 2 2 3 3 4 4 5 5 6 6
1 1 1 1 2 2 2
ˆ ˆ ˆ ˆ ˆ ˆ
ˆ ˆ ˆ ˆ ˆ ˆ
ˆ ˆ ˆ ˆ ˆ ˆ
ˆ ˆ ˆ ˆ ˆ ˆ
ˆ ˆ ˆ ˆ ˆ ˆ
ˆ ˆ ˆ ˆ
l l l l l l
l l l l l l
l l l l l l
t l t l t l t l t l t l
t l t l t l t l t l t l
t l t l t l t
x x x x x x
y y y y y y
z z z z z z
y z y z y z y z y z y z
x z x z x z x z x z x z
x y y x x y y x
⋅ ⋅ ⋅ ⋅ ⋅ ⋅⋅ ⋅ ⋅ ⋅ ⋅ ⋅
⋅ − ⋅ ⋅ − ⋅
1
2
3
4
5
2 3 3 3 3 4 4 4 4 5 5 5 5 6 6 6 6 6ˆ ˆ ˆ ˆ ˆ ˆ ˆ ˆ
x
y
z
x
y
l t l t l b l t l t l t l t l t l z
N F
N F
N F
N M
N M
x y y x x y y x x y y x x y y x N M
= −
⋅ − ⋅ ⋅ − ⋅ ⋅ − ⋅ ⋅ − ⋅
(6.32)
Given the six loads working on the upper platform, the upper platform coordinates and
the unit vectors of the cylinder lengths, this equation can be solved thus the cylinder forces at any platform pose can be determined.
6.3 Modelling of Waves and Simulation of Vessel Motions
6.3.1 Introduction Since the Ampelmann system uses the Stewart platform to counteract wave induced
ship motions, wave modelling and vessel motion simulation are important elements when designing the Ampelmann Stewart platform. A description of wave modelling and vessel motion simulation shall therefore be given in this section.
6.3.2 Wave Modelling In the previous chapters it has been shown that the limiting wave conditions for any
ship-based access method are determined by safety considerations. When wave conditions (and thus related vessel motions) reach a certain limit the safety of

98
transferring personnel is compromised and transfers must be postponed; this sea state limit is obviously also dependent upon type and capabilities of the transfer method and the vessel. These limiting wave conditions for access can be described by the maximum significant wave height HS of a sea state. In order to increase the accessibility of an offshore wind turbine at a certain location, the workability limit of the access method should be increased. For the Ampelmann Demonstrator this limit has been set at a significant wave height HS of 2.5 metres. As explained in section 4.3.2, location YM6 off the Dutch coast has been selected for the Ampelmann Demonstrator design case. To obtain an accessibility of 90%, two limiting sea states have been determined:
HS = 2.5m and Tz = 4.5s
and HS = 2.5m and Tz = 5.5s. Wave Spectrum A method to statistically describe the wave properties in a sea state is through the use
of a wave variance density spectrum, generally referred to as a wave spectrum. Such a spectrum plots the distribution of the variance of wave elevations as a function of the wave frequencies or, as in the following equation, the angular frequencies:
21( ) ( )
2 aS dζ ω ω ζ ω= (6.33)
where: Sζ (ω) = Wave variance density spectrum [m2s/rad] ω = Angular frequency [rad/s] ζa = Wave amplitude [m] ½ζa
2 = Variance of wave elevation [m2] Standard wave spectra have been developed to describe a wave climate using a limited amount of parameters. Two frequently used standard wave spectra are shown in Figure 6.10:
• The Pierson-Moskowitz wave spectrum, for fully developed seas • The JONSWAP wave spectrum, for fetch limited wind generated seas.
Figure 6.10 JONSWAP and Pierson-Moskowitz wave spectra
ω [rad/s]
JONSWAP
Pierson-Moskowitz
Sζ (ω) [m2s/rad]

99
The Pierson-Moskowitz (PM) spectrum can be expressed as follows:
5 4
( ) expPM
A BS ω
ω ω = −
(6.34)
with: 4
234
z
s
T
HA
π= and 4
316
zTB
π= (6.35)
where: SPM (ω) = Pierson-Moskowitz variance density spectrum [m2s/rad] ω = Angular frequency [rad/s]
HS = Significant wave height [m] Tz = Mean zero wave-crossing period [s].
The JONSWAP spectrum is based on wave measurements carried out in 1968 and 1969 during the Joint North Sea Wave Project (JONSWAP) in the North Sea. This spectrum has the shape of the Pierson-Moskowitz spectrum [14], but is modified by a peak enhancement. The JONSWAP spectrum follows from the formulas below:
⋅
−⋅=
−⋅−2
2
1exp
45exp)(
m
m
BAnfSJS
σωωω
γωω
ω (6.36)
with: 4
234
z
s
T
HA
π= and 4
316
zTB
π= (6.37)
and: 41
5
4
= Bmω , (6.38)
where: SJS (ω) = JONSWAP variance density spectrum [m2s/rad] nf = Normalising factor between JONSWAP and PM spectrum [-]
γ = Peak shape parameter [-] ωm = Modal angular frequency [rad/s] σ = Numerical parameter [-] = σa for ω < ωm = σb for ω ≥ ωm
The average values for the spectrum’s peak shape parameter and numerical parameters were taken from the measurements of the Joint North Sea Wave Project. They are: 3.3=γ (6.39)
07.0=aσ (6.40)

100
and 09.0=bσ . (6.41)
For the value of the peak shape parameter given in (6.39), the offshore group at the Delft University of Technology found a normalising factor for equation (6.36) of [39]: nf = 0.625. (6.42) With the given equations, the design spectra can be derived as shown in Figure 6.11.
Figure 6.11 Design wave spectra for the Ampelmann system Wave Simulation The surface elevation of a wave is a stochastic variable which is assumed to be
Gaussian. From a wave variance density spectrum, a wave time series can be derived using the random-phase/amplitude model [40]. Although wave time series shall not directly be used in the vessel motion based design method, it does allow for a visualization of the magnitudes of the wave heights. Therefore, a brief description of the random-phase/amplitude model shall be given here.
In order to transform a wave spectrum to a wave time series, the spectrum has to be
changed from its continuous form to a discrete form. For this, a small bandwidth ∆ω is chosen. A series of equidistant angular frequencies ωn is then created, which are located in the centre of each bandwidth. Figure 6.12 shows a frequency ωn and the bandwidth around this frequency.
Wave Spectra
0
0.2
0.4
0.6
0.8
1
1.2
1.4
1.6
0 0.5 1 1.5 2 2.5 3
PM
JSSζ (ω)
[m2s/rad]
ω [rad/s]
Tz = 5.5s Hs = 2.5m Tz = 4.5s
Hs = 2.5m
Pierson-Moskowitz JONSWAP

101
Figure 6.12 Continuous wave spectrum and equidistant bandwidths
Now the area under the graph for this bandwidth divided by the bandwidth value can
be considered to be the discrete value of S* for ωn. In formula:
* 1( ) ( )
n
n
nS S dω ω
ζ ζω ω
ω ω ωω
+∆
−∆
= ⋅∆ ∫ (6.43)
with: Sζ* = Discrete wave variance density spectrum [m2s/rad]. ∆ω = Angular frequency bandwidth [rad/s].
Figure 6.13 Discrete wave spectrum Doing this for the complete series of angular frequencies leads to a discrete wave
spectrum, as shown in Figure 6.13, where the discrete values are represented by dots. The sea state can now be described in the time domain as a summation of many different harmonic waves, also known as a Fourier series:
,
1
( ) cos( )N
a n n nn
t tζ ζ ω ε=
= +∑ (6.44)
with: ζ = Surface elevation [m]
n = Harmonic wave index number [-] N = Number of wave frequencies [-] ζa,n = Amplitude of wave n [m] ωn = Angular frequency of wave n [rad/s] t = Time [s]
ω [rad/s]
Sζ (ω) [m2s/rad]
∆ω
ωn
ω [rad/s]
Sζ* (ωn) [m2s/rad]
ωn

102
εn = Phase shift of wave n [rad]. For each angular frequency a wave amplitude and a phase shift is required. To comply
with the random-phase/amplitude model, these phase shifts are to be chosen randomly from a uniform distribution in the range from -π to +π. The amplitude can be derived from the discrete wave spectrum with the following equation:
* 2,
1( )
2n a nSζ ω ω ζ⋅ ∆ = (6.45)
or *, 2 ( )a n nSζζ ω ω= ⋅ ⋅∆ . (6.46)
An irregular wave can now be fully derived from a given spectrum. Figure 6.14 shows
a wave time series derived from a Pierson-Moskowitz spectrum with HS = 2.5 metre and Tz = 4.5 seconds.
It is noted that the computation of time series from spectra as presented in this section
can also be done using Inverse Fast Fourier Transformation (IFFT) with the same results. Similarly, to derive spectra from time series the Fast Fourier Transformation (FFT) can be used. These fast transformations decrease computational time significantly compared to the approach using the summation of harmonic waves and have therefore been applied throughout this entire research. However, due to the limited insight provided by the complex notations of FFT and IFFT, the notation using summation of harmonic waves has been adopted in this thesis.
Directional spreading The previously described wave spectra are uni-directional wave spectra as they
provide information about waves travelling in one direction only; the crests are parallel to each other and perpendicular to the wave direction. Such waves are called long-crested waves (Figure 6.15) and their related wave model is used for the design of most offshore structures. In reality, however, the wave energy at a point has an angular
Figure 6.14 Simulated wave time series for PM spectrum HS=2.5m and Tz=4.5s

103
distribution around a mean direction. This causes waves to become short-crested (Figure 6.16). The prediction of wave-induced ship motions is preferably done using short-crested waves because they provide more accurate results.
Figure 6.15 Sea surface with long-crested waves [41]
Figure 6.16 Sea surface with short-crested waves [41]
The same principle used to model long-crested seas in time domain can be applied to
model a short-crested sea. The water surface elevation of a long-crested sea was described previously as a summation of a large number of independent harmonic waves, each with their own frequency, amplitude and random phase shift; a short-crested sea can be expressed by adding harmonic waves with different directions. The sea surface elevation can then be expressed mathematically as the summation of long-crested waves coming from different directions:
, , ,
1 1
( ) cos( )M N
a n m n n mm n
t tζ ζ ω ε= =
= +∑∑ (6.47)
where: m = Wave direction index number [-]
M = Number of wave directions [-] N = Number of wave frequencies [-]
ζa,n,m = Amplitude of wave component n travelling in direction m [m] ωn = Angular frequency of wave n [rad/s]
εn,m = Phase shift of wave n travelling in direction m [rad] Again, similar to the process for long-crested waves, a short-crested wave time series
can be derived from a wave spectrum. For this, a directional wave variance density spectrum is required, defined as the product of a uni-directional wave variance density spectrum and a directional spreading function: ( , ) ( ) ( )S D Sζ ζω µ µ ω= ⋅ (6.48)
where: Sζ (ω, µ) = Directional wave variance density spectrum [m2s/rad2] µ = Wave direction [rad]

104
D (µ ) = Directional spreading function [rad-1] Sζ (ω) = Uni-directional wave variance density spectrum [m2s/rad] A widely accepted directional spreading function is the cosine-2s model [42], given
by:
( )222 2cos
( )0
s forD
otherwise
π ππ µ µ µ µµ − − ≤ − ≤
=
(6.49)
where: µ = Mean wave direction [rad]
s = Spreading parameter [-], to be increased for narrowing of the directional spread
An example of a cosine-2s directional wave spectrum is given in Figure 6.17. It is
noted that for keeping the total amount of energy in directionally spreaded waves equal to the amount of energy in uni-directional waves, the directional spreading function integrated over µ from 2
πµ − to 2πµ + radians must give unity.
Figure 6.17 Directional wave spectrum
6.3.3 Vessel Motions
Reference Frames Now that the design sea state can be expressed in a wave spectrum, the next step is to
derive vessel motions for a given sea state. For this, the behaviour of a vessel in waves must be predicted. As mentioned, the motions of a vessel are defined by six degrees of freedom: three translations (surge, sway and heave) and three rotations (roll, pitch and yaw). Subsequently, an arbitrary point on a vessel in motion can be described in
µ [rad]
2πµ −
Sζ (ω, µ) [m2s/rad2]
µ
2πµ +
ω [rad/s]

105
different reference frames. In this research, two frames are applied: the body fixed frame and the hydrodynamic frame [43].
• Body-fixed frame (b-frame) This reference frame is fixed to the vessel and has its origin in the Centre of Gravity (CoG) of the vessel. The xb-axis points towards the bow, the yb-axis towards portside and the zb-axis upwards. • Hydrodynamic frame (h-frame) The hydrodynamic frame is an inertial frame, which is by definition a frame of reference in which the motion of a particle not subject to forces is a straight line. This implies that an inertial frame is either “fixed” to the “fixed” world, or travels in this world with a constant speed in a straight line. For Ampelmann operations, when the vessel is positioned next to a wind turbine, the average speed of the vessel is zero thus the hydrodynamic frame is fixed. The origin Oh is defined in such a way that when the vessel is in its equilibrium position, the zh-axis passes through the CoG of the vessel. The xh-yh plane is placed parallel to the still-water plane, the xh-axis points towards the bow, the yh-axis towards portside and the zh-axis upwards. The origin Oh is chosen to coincide with the equilibrium position of the CoG here. Since the orientation of the h-frame axes is the same as the orientation in the b-frame, the h-frame and the b-frame will coincide when the vessel is in its equilibrium position, i.e. in still water.
The body fixed frame can be used to describe the location and orientation of any object
fixed to the vessel, e.g. the Ampelmann base frame. The motions of the vessel in all six degrees of freedom are described relative to the hydrodynamic frame. An illustration of both frames is given in Figure 6.18.
Figure 6.18 Hydrodynamic and body-fixed frame
xb yb
zb
CoG
xh yh
zh sway (y) surge (x)
heave (z)
roll (φ)
yaw (ψ)
pitch (θ)
Oh

106
Vessel Response in Regular Waves When a vessel is considered in a regular (harmonic) wave, the vessel response
resulting from the wave excitation will be harmonic as well and have the same frequency as the wave. The response to such a wave is specific for a vessel and the direction of the incoming waves and can be written as follows for a certain location on a vessel:
: ( ) cos( )
: ( ) cos( )
: ( ) cos( )
: ( ) cos( )
: ( ) cos( )
: ( ) cos( )
a x
a y
a z
a
a
a
surge x t x t
sway y t y t
heave z t z t
roll t t
pitch t t
yaw t t
ζ
ζ
ζ
ϕζ
θζ
ψζ
ω εω εω ε
ϕ ϕ ω εθ θ ω εψ ψ ω ε
= +
= +
= +
= +
= +
= +
(6.50)
where: xa ya za φa θa ψa = Motion amplitudes [m] [rad]
ω = Angular frequency of wave and responses [rad/s] t = Time [s] εxζ εyζ εzζ εφζ εθζ εψζ = Phase difference between wave and motion [rad]. In a harmonic wave, the amplitude of vessel motions in each degree of freedom is
assumed to be linearly proportional to the wave amplitude [14]. This assumption is used throughout the remainder of this thesis. The relationship between wave amplitude and vessel motion amplitude can be described using a Motion Response Amplitude Operator (MRAO, often referred to as RAO). A motion RAO serves as a transfer function that relates the wave elevation to the vessel motions; it is defined as the ratio between the amplitude of a vessel motion to the amplitude of a regular wave. Motion RAOs are described as a function of the wave frequency in each degree of freedom:
: ( ) ( ) : ( ) ( )
: ( ) ( ) : ( ) ( )
: ( ) ( ) : ( ) ( )
a ax
a a
a ay
a a
a az
a a
x m radsurge RAO roll RAO
m m
y m radsway RAO pitch RAO
m m
z m radheave RAO yaw RAO
m m
ϕ
θ
ψ
ϕω ω ω ωζ ζ
θω ω ω ωζ ζ
ψω ω ω ωζ ζ
= =
= =
= =
(6.51)
RAOs are specific for a vessel’s shape and mass (distribution) and also depend on the
examined location on the vessel as well as the incoming wave direction. The incoming

107
wave direction µ is defined as the angle between the orientation of the vessel and the direction of wave speed c as shown in Figure 6.19. RAOs can be obtained either from model tests in a basin or from computer simulations; they are usually determined at the ship’s centre of gravity for various wave directions.
Figure 6.19 Definition of incoming wave direction In addition to the motion RAOs also for all six degrees of freedom the phase
differences between wave surface elevation and motion response have to be determined. Similar to RAOs, phase differences are also a function of the wave frequency and dependent on the vessel characteristics, examined location on the vessel and the incoming wave direction. For a given wave direction, the six RAOs of a vessel and the corresponding phase differences between wave elevation and vessel motions can be determined either through model testing in a wave basin or using diffraction computer programs like DELFRAC or WAMIT. As an example, the RAOs and phase differences are plotted in Figure 6.20 for a 33 metre tug at the CoG with a wave direction of 165°.
The vessel motion response in a regular wave can now be defined. As an example the
heave motion is given by:
( ) ( ) cos( ( ))z a zz t RAO t ζω ζ ω ε ε ω= ⋅ + + (6.52)
with: z = Heave [m] RAOz = Motion Response Amplitude Operator of the heave motion [m/m]
ζa = Amplitude of wave [m] ω = Angular frequency of wave [rad/s]
ε = Phase shift of wave [rad] εzζ = Phase difference between wave elevation and heave at CoG [rad].
Beam waves 90°
Wave profile
yh
Oh
Wave length
xh µ
c
Following waves 0°
Head waves 180°
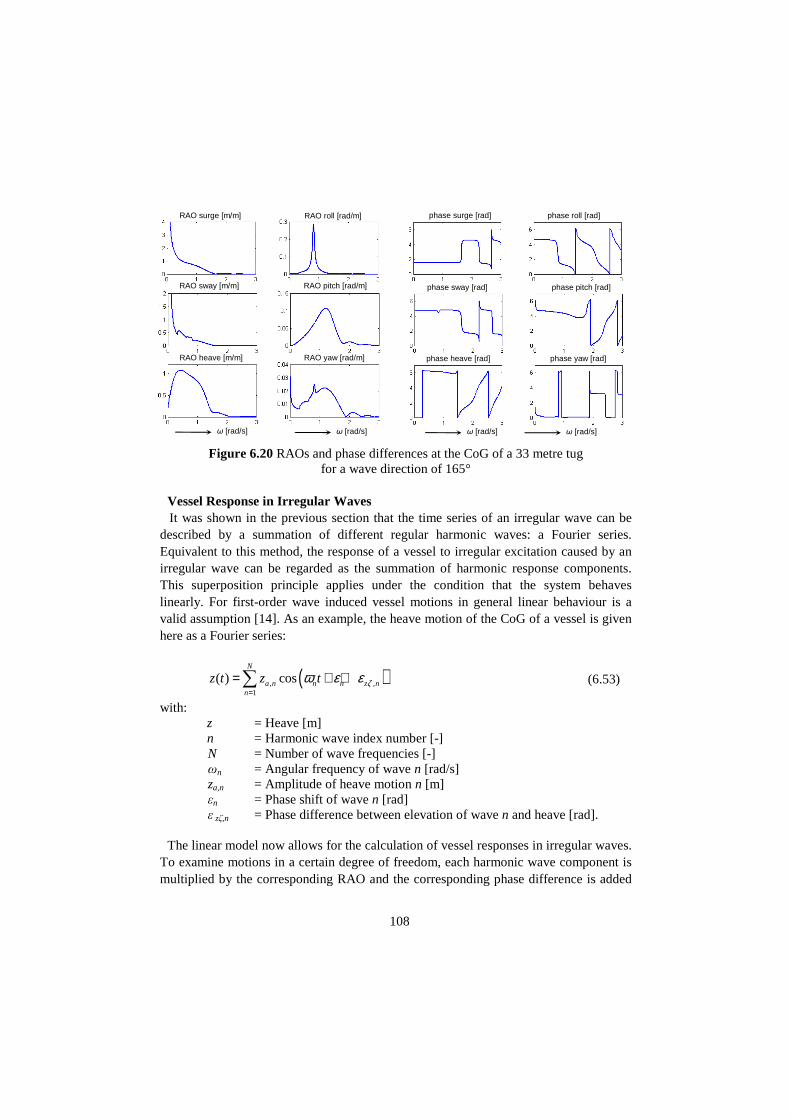
108
Figure 6.20 RAOs and phase differences at the CoG of a 33 metre tug for a wave direction of 165°
Vessel Response in Irregular Waves It was shown in the previous section that the time series of an irregular wave can be
described by a summation of different regular harmonic waves: a Fourier series. Equivalent to this method, the response of a vessel to irregular excitation caused by an irregular wave can be regarded as the summation of harmonic response components. This superposition principle applies under the condition that the system behaves linearly. For first-order wave induced vessel motions in general linear behaviour is a valid assumption [14]. As an example, the heave motion of the CoG of a vessel is given here as a Fourier series:
( ), ,1
( ) cosN
a n n n z nn
z t z t ζω ε ε=
= + +∑ (6.53)
with: z = Heave [m] n = Harmonic wave index number [-]
N = Number of wave frequencies [-] ωn = Angular frequency of wave n [rad/s] za,n = Amplitude of heave motion n [m] εn = Phase shift of wave n [rad] ε zζ,n = Phase difference between elevation of wave n and heave [rad].
The linear model now allows for the calculation of vessel responses in irregular waves.
To examine motions in a certain degree of freedom, each harmonic wave component is multiplied by the corresponding RAO and the corresponding phase difference is added
ω [rad/s] ω [rad/s] ω [rad/s] ω [rad/s]
RAO surge [m/m] RAO roll [rad/m]
RAO sway [m/m] RAO pitch [rad/m]
phase surge [rad] phase roll [rad]
phase sway [rad] phase pitch [rad]
RAO heave [m/m] phase heave [rad] phase yaw [rad]RAO yaw [rad/m]

109
to the argument. The sum of all response components then yields the irregular response in a Fourier series of the specified motion, heave in this example:
( ),1
( ) ( ) cos ( )N
z n a n n n z nn
z t RAO t ζω ζ ω ε ε ω=
= ⋅ + +∑ (6.54)
with: RAOz = Motion Response Amplitude Operator of the heave motion [m/m] ζa,n = Amplitude of wave n [m].
Vessel Response Spectra Similar to the description of an irregular wave, the time series of a vessel motion in
any degree of freedom can be presented by means of a Fourier series, and by a variance density spectrum. Note, however, that the phase angle information is lost in this notation. Such a spectrum is generally referred to as a response spectrum; an example is given here for the notation of the heave response spectrum:
21( ) ( )
2z aS d zω ω ω= ⋅ (6.55)
with: Sz (ω) = Variance density spectrum of heave response [m2s/rad]
½za2 = Variance of heave motion [m2].
This notation is comparable to the wave spectrum notation of equation (6.33). Since
linear proportionality has been assumed between a harmonic wave and a vessel motion in any degree of freedom, the motion amplitude for any given frequency can directly be determined from the wave amplitude using the RAO. An example is given for the heave motion:
( )a z az RAOω ζ= ⋅ (6.56)
With the wave spectrum and response spectra all being proportional to the square of
the amplitudes, the spectrum of a vessel motion is the response spectra can be derived directly using the RAO squared:
2( ) ( )z zS RAO Sζω ω= ⋅ (6.57)
The use of RAOs enables a fast determination of vessel response spectra for any given
wave spectrum. This provides good insight in the vessel behaviour for any sea state. An example is shown in Figure 6.21: response spectra are plotted for heave motions in sea states modelled with a JONSWAP spectrum with HS = 2.5m and Tz = 3.5s, 4.5s and 5.5s. For a given wave direction and a specific location on the vessel only one RAO is

110
used to determine the response spectra in the different sea states. The figure clearly shows the effect of the mean wave period on the vessel behaviour.
Figure 6.21 Heave response spectra for different sea states From these response spectra, the significant response height Hz1/3 (the average of
highest 1/3 of response heights) and the mean zero-crossing period Tzz of the heave motion can be derived. These values enable a good insight in the vessel’s behaviour in different sea states and can be found by calculating the moments of the area under the spectrum with respect to the vertical axis at ω = 0. If m denotes a moment, the nth order moment of the heave response spectrum is defined by mnz:
( )0
nnz zm S dω ω ω
∞
= ⋅ ⋅∫ (6.58)
From the spectral moments of the response, the significant response height and mean
zero-crossing period of the response motion can be determined through:
1/3 04z zH m= ⋅ (6.59)
and 0
2
2 zzz
z
mT
mπ= ⋅ . (6.60)
0 1 2 3 0
0.5
1
1.5 JS1: Tz=3.5 s , Hs=2.5 m
0 1 2 3 0
0.5
1
1.5 JS2: Tz=4.5 s , Hs=2.5 m
0 1 2 3 0
0.5
1
1.5 JS3: Tz=5.5 s , Hs=2.5 m
0 1 2 3 0
0.5
1
0 1 2 3 0
0.5
1
0 1 2 3 0
0.5
1
0 1 2 3 0
0.2
0.4
0.6
0 1 2 3 0
0.2
0.4
0.6
0 1 2 3 0
0.2
0.4
0.6
1 /
z
/
2
Varin
ace
Den
sity
W
ave [m
2 s]
Var
inace
Dens
ity
Hea
ve [m
2 s]
RA
O H
eav
e [m
/m]
ω [rad/s] ω [rad/s] ω [rad/s]
Hz1/3 = 1.38 m Tzz = 7.9 s
Hz1/3 = 0.77 m Tzz = 6.9 s
Hz1/3 = 0.32 m Tzz = 5.3 s
Sζ(ω)
(RAOz(ω))2
*
=
Sz(ω)

111
Vessel motion time series in long-crested waves Although response spectra provide fast insight in the vessel motions in different sea
states, designing a Stewart platform for compensation of these motions will require time series of the simultaneous motions in all six degrees of freedom. As was shown in [41], the geometry of a Stewart platform does not allow for straight-forward derivation of required cylinder lengths in the frequency domain. Moreover, time series can provide better insight for the remainder of the design process since they enable visualization of a compensating platform. Vessel motion time series in long-crested waves (Figure 6.15) can be created using the response spectra of all six degrees of freedom. An example for the derivation of the heave response time series is given hereinafter.
The process of deriving a vessel motion from a response spectrum is similar to the
conversion of wave spectra into wave time series. The upper row of Figure 6.22 illustrates the derivation of a wave time series: from a variance density wave spectrum (upper left) and randomly chosen phase shifts (upper centre), a wave time series (upper right) can be calculated using the random-phase/amplitude model described earlier. The vessel response characteristics of the heave motion are depicted in the centre row of Figure 6.22 for a given wave direction. As explained in Equation (6.57), the heave response spectrum (lower left) is calculated by multiplying the wave spectrum with the heave motion RAO squared. The corresponding phase angles (lower centre) are found by adding the characteristic phase differences of the vessel response to the random phase shifts of the wave. Ultimately, the heave response time series (lower right) can be calculated using the random-phase/amplitude model. The resulting time series can be described by the following Fourier series:
( )1
( ) 2 ( ) cos ( ) ( )rN
z n n n z nn
z t S t ζω ω ω ε ω ε ω=
= ⋅ ⋅∆ ⋅ + +∑ . (6.61)

112
Figure 6.22 Derivation of response time series To determine the time series of the vessel motions in any other degree of freedom, the
same procedure can be followed. To acquire the time series for any degree of freedom for the same particular wave time series, the same wave spectrum and corresponding wave phase shifts are to be used. The vessel motions in all six degrees of freedom can now be simulated for any vessel in any sea state. The simulation procedure is presented in Figure 6.23. For this procedure, a design sea state is required and a vessel needs to be selected. From the design sea state the wave spectrum can be deduced and a wave time series can be simulated using the random-phase/amplitude model. For the selected vessel the motion RAOs with corresponding phase differences are required for a certain point on the vessel and for a specific wave direction. Subsequently, the vessel response spectra and the vessel motions can be simulated.
Figure 6.23 Simulation of vessel motions in six degrees of freedom
Vessel Selection
Wave Time Series
Design Sea State
Wave Spectrum
6 x RAOs &
Phase Differences
6 x Vessel Response
Spectra & Phase Angles
6DoF Vessel Motions
wave characteristics
heave response
vessel response characteristics
for heave motion
ω [rad/s] ω [rad/s] t [s]
Sz
[m2 s]
R
AO
z [m
/m]
Sζ
[m2 s]
Spectra Phase Angles Time Series
ε [r
ad]
z [m
]
ε zζ
[rad
] ε
+ ε
zζ [r
ad]
ζ [m
]

113
Vessel motion time series in short-crested waves The determination of vessel motions in short-crested seas is comparable to the
calculation procedure in long-crested waves, except that in short-crested seas directionalities have to be taken into account. This calculation procedure therefore requires a directional wave spectrum as well as RAOs and phase differences for various incoming wave directions µ for all six degrees of freedom.
As an example, an RAO for the heave motion is plotted in Figure 6.24 for all incoming
wave directions, showing the effect of the incoming wave directions on the motion. Similarly, the phase differences between wave elevation and heave have been plotted as a function of both wave frequency and the incoming wave direction (Figure 6.25).
Figure 6.24 RAO for heave z as a function of the incoming wave direction µ
Figure 6.25 Phase differences εzζ between wave elevation and heave as a
function of wave frequency and the incoming wave direction µ
For a given directional wave spectrum and known RAOs, the response spectrum for
the heave motion is determined directly through:
2( , ) ( , ) ( , )z zS RAO Sζω µ ω µ ω µ= ⋅ (6.62)
As was shown in Equations (6.47) and (6.48), the dominant wave direction µ is a
required input parameter to derive the directional wave spectrum Sζ. The resulting vessel motion in short-crested waves can now be determined; an
example is given here for the heave motion:
( ), , ,1 1
( ) ( , ) cos ( , )M N
z n m a n m n n m z n mm n
z t RAO t ζω µ ζ ω ε ε ω µ= =
= ⋅ + +∑∑ (6.63)
RAOz [m/m]
µ [rad] 0
ω [rad/s]
0
εzζ [rad]
µ [rad] 0
ω [rad/s]
0
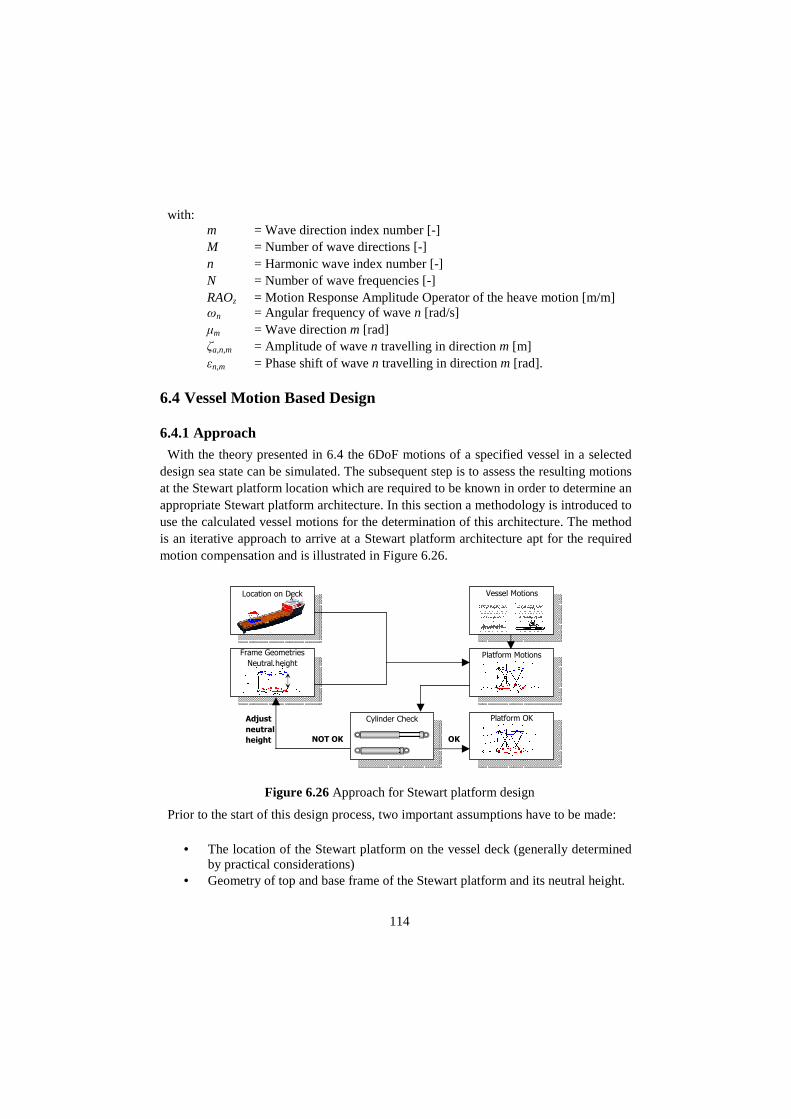
114
Adjust
neutral
height
NOT OK OK
Location on Deck
Cylinder Check
Vessel Motions
Platform Motions
Frame Geometries
Neutral height
Platform OK
with: m = Wave direction index number [-] M = Number of wave directions [-] n = Harmonic wave index number [-] N = Number of wave frequencies [-]
RAOz = Motion Response Amplitude Operator of the heave motion [m/m] ωn = Angular frequency of wave n [rad/s]
µm = Wave direction m [rad] ζa,n,m = Amplitude of wave n travelling in direction m [m]
εn,m = Phase shift of wave n travelling in direction m [rad].
6.4 Vessel Motion Based Design
6.4.1 Approach With the theory presented in 6.4 the 6DoF motions of a specified vessel in a selected
design sea state can be simulated. The subsequent step is to assess the resulting motions at the Stewart platform location which are required to be known in order to determine an appropriate Stewart platform architecture. In this section a methodology is introduced to use the calculated vessel motions for the determination of this architecture. The method is an iterative approach to arrive at a Stewart platform architecture apt for the required motion compensation and is illustrated in Figure 6.26.
Prior to the start of this design process, two important assumptions have to be made:
• The location of the Stewart platform on the vessel deck (generally determined by practical considerations)
• Geometry of top and base frame of the Stewart platform and its neutral height.
Figure 6.26 Approach for Stewart platform design

115
After a simulation of the vessel motions and the platform motions, the minimum and
maximum cylinder lengths required for full motion compensation can be determined. Subtracting the minimum from the maximum length generates the minimum required stroke length of the cylinders. A check is necessary to verify if the stroke length plus a minimum dead length does not exceed the minimum cylinder length. If this requirement is not met, the neutral height of the top frame must be increased and the simulation must be repeated until the requirement is met. The preferred platform architecture is found for the smallest neutral height that satisfies the cylinder check.
6.4.2 Stewart Platform Design Procedure
Base Frame Motions Although RAOs can be determined for any location on a vessel, a set of RAOs as
provided by the vessel manufacturer or owner has usually been determined for the centre of gravity (CoG). The Stewart platform will generally be located at a certain distance from this CoG. As a consequence, the motions that are to be compensated by the Stewart platform will generally be larger than the motions at the CoG, mainly due to the pitch induced heave. A transformation is required to deduce the motions of the Ampelmann base frame from the motions at the CoG. Hereinafter, the derivation of the motions of the geometrical centre of the Ampelmann base frame gimbal points, defined as point B (Figure 6.27), will be determined using the known motions at the CoG.
The three rotations of a vessel (roll, pitch and yaw) are defined with respect to the
hydrodynamic frame. If the vessel is assumed to be a rigid body, the same rotations apply for all points on the vessel, including point B (Figure 6.27). Due to these rotations the translations in the hydrodynamic frame of this point B will differ from the translations of the CoG.
Figure 6.27 Geometrical centre of the Ampelmann base frame gimbal points B projected in hydrodynamic and body-fixed frame
xb yb
zb
CoG
xh yh
zh B
ch
bb
bh
Oh

116
The transformation of point B to the hydrodynamic frame can be performed as follows. The translations of the vessel at any point in time are defined by the coordinates of the CoG in the h-frame:
CoG
h CoG
CoG
x
c y
z
=
with respect to Oh in the h-frame. (6.64)
The position of the centre of the base frame B is defined in the b-frame by:
The coordinates of point B in the hydrodynamic frame can be determined by:
with:
hb
ϕθψ
Θ =
Euler angles: rotations of the b-frame relative to the h-frame.
(6.67)
where: ( )h
b hbR Θ = Transformation matrix from b-frame to h-frame
hbΘ = Vector of Euler angles.
The description of rotations in a three dimensional system require a specific order of
these rotations to have a unique solution, thereby defining the Euler angles as stated in 6.2.3. However, there is no industry standard for the Euler rotation sequence applied for the determination of RAOs [37]. Therefore when rotations are derived from a set of RAOs the order of these rotations is usually unknown. RAOs provide linearized solutions for the rotation angles and the resulting angles are generally small (<15°) the transformation of point B to the hydrodynamic frame can also be performed using the linear transformation matrix with negligible errors. A linear transformation matrix is independent of the order of rotations.
B
b B
B
x
b y
z
=
with respect to the CoG in the b-frame. (6.65)
( )hh b hb hbb R b c= Θ ⋅ + with respect to Oh in the h-frame. (6.66)

117
This linearization saves computational time and facilitates the design process which is
important when looking at various positions of the Ampelmann on the vessel deck. In a similar manner the coordinates of the base frame gimbals can be determined by:
where:
,i hb = Position vector of base frame gimbal i in the h-frame for i = 1,2,…,6
,i bb = Position vector of base frame gimbal i in the b-frame for i = 1,2,…,6.
Cylinder length calculation As explained in section 6.2.1 the geometry of top and base platform can be described
by four parameters: the radii of top and base frame and the angles (or distances) between pairs of gimbals. To start the iterative design procedure, first a neutral height of the upper frame relative to the base frame is needed, defined by zneutral. If the geometrical centre of the Ampelmann top frame gimbal points is defined as point T, its position is defined by
To enable motion compensation the top frame must remain fixed in the hydrodynamic
frame and should therefore not be influenced by the vessel motions. Since the h-frame origin Oh was chosen to coincide with the equilibrium position of the CoG (section 6.3.3), the position of T in the h-frame is therefore defined by
The lengths of each cylinder can now be calculated through:
, ,i i h i hl t b= − (6.72)
1
1
1h b hb b c
ψ θψ ϕθ ϕ
− = − ⋅ + −
with respect to Oh in the h-frame. (6.68)
, ,
1
1
1i h i b hb b c
ψ θψ ϕθ ϕ
− = − ⋅ + −
with respect to Oh in the h-frame. (6.69)
T B
b T B
T B neutral
x x
t y y
z z z
= = +
with respect to the CoG in the b-frame. (6.70)
h bt t= with respect to Oh in the h-frame. (6.71)

118
and
i il l= (6.73)
Cylinder Check Once the motions of a selected vessel in a design sea state have been calculated and
the location of the Stewart platform on the vessel deck has been determined, the motions of the base frame gimbal points can be deduced. While the base frame moves with the vessel, the top frame (including its gimbals) should remain motionless thus providing motion compensation. With this assumption and by simulating the motions of all gimbal points, at each time step the required cylinder lengths for full motion compensation can be calculated. From such a simulation the minimum and maximum cylinder lengths throughout the simulated time series can be determined. Consequently the minimum stroke length required to enable full motion compensation can be derived through the following equation:
A practical minimum dead length, required to accommodate the upper and lower
gimbal connections, must be defined beforehand. To achieve full motion compensation the derived stroke length has to satisfy the following criterion in accordance with the definitions stated previously in Figure 6.3:
lmin - lstroke ≥ ldead (6.75)
If this restriction is not met, the studied Stewart platform cannot fully compensate the
simulated motions: the stroke length will not “fit” into the fully retracted cylinder. The neutral height of the platform should then be adjusted and the process is repeated until the cylinder dimensions satisfy the stated criterion. The smallest neutral height that satisfies this criterion will produce the final architecture. A larger neutral height will increase the total cylinder length, which can significantly influence the critical buckling force as elaborated in section 7.2.5.
6.4.3 Design Case
Platform Architecture For the design case of the prototype, the top and base frame dimensions have been
based on the available deck space on board of a small vessel. The deck space limitations were defined in Chapter 4 as 6 by 6 metres. Therefore the radii of both top and base frame have been set at 3 metres. To provide adequate room for the gimbals, a practical separation angle of 30° (equal to a half separation angle of 15°) has been chosen between the gimbal pairs in both top and base frame. With setting these parameters, the
lstroke = lmax - lmin (6.74)

119
geometry of both frames is determined. Furthermore, after expert advice, the dead length of the cylinders was set at 0.5 metre.
Design Sea State The design sea states for the Ampelmann prototype were defined (section 4.3.2) as
being HS = 2.5m with Tz = 4.5s and HS = 2.5m and Tz = 5.5s. A quick analysis reveals that the largest vessel motions and therefore the largest required cylinder strokes will occur in the sea state with Tz = 5.5s. This sea state shall be used for all further design exercises.
Vessel Length Variation To examine the effect of the vessel length on the Stewart platform cylinder
requirements a small study has been carried out. The vessel motions were simulated in the design sea state with an incoming wave direction of 165 degrees. Motion RAOs for different vessel lengths were obtained from DELFRAC, a linear three-dimensional radiation–diffraction code, by scaling a generic supply vessel design. For this study the Ampelmann platform was located at 10 metres from the CoG of each vessel towards the aft. For each calculation, a set of 10 simulation runs of 3 hours was done; the neutral height was adjusted until the cylinder check criterion was met. The results of this design exercise are shown in Figure 6.28.
Figure 6.28 Required cylinder lengths for varying vessel lengths for full motion compensation in the design sea state
Position on deck Also the effect on the required cylinder lengths has been studied as a function of the
location of the Ampelmann on deck. Applying the same conditions as in the previous
Required Cylinder Lengths vs Vessel Lengths Ampelmann at 10 meters from the center of gravity
Hs = 2.5m Tz = 5.5s Wave dir = 165º
Vessel Length [m]
Cyl
inde
r Le
ngth
s [m
]
0
1
2
3
4
5
6
7
8
20 30 40 50 60 70 80
Lmax Lneutral Lmin

120
study, but now using the RAOs of a 50m supply vessel, the required cylinder lengths were determined for different Ampelmann locations on deck. The advantage of placing the Ampelmann close to the CoG is significant as illustrated in Figure 6.29.
Figure 6.29 Required cylinder lengths when varying the Ampelmann location on deck
6.4.4 Evaluation The cylinder lengths are preferably kept as small as possible for economical reasons
(cylinders have to resist buckling and a length increase will require thicker cylinders and a larger power requirement). With two design exercises performed for the Stewart platform some conclusions can already be drawn here. To minimize cylinder lengths it is favourable to use a vessel of 50 m or longer; the response of smaller vessels in the design sea state results in an increase of the required cylinder length. Also, it can be advised to have the Ampelmann located not too far from the vessel CoG, since the required cylinder lengths will increase significantly when the distance to the CoG exceeds 10 m when mounted on a 50 m vessel.
This vessel motion based design method has some important disadvantages. First of
all, vessel motions are stochastic variables and the resulting minimum and maximum values for the required cylinder lengths will depend on total simulation time used while still including a random aspect. The second downside of this design method is that it is iterative and therefore cumbersome. A final disadvantage is that for this design method all but one platform variable remains fixed. This design procedure leads to a required
Required Cylinder Lengths vs Ampelmann location on deck
Ampelmann mounted on a 50m supply vessel
Hs = 2.5m Tz = 5.5m Wave dir = 165º
0
1
2
3
4
5
6
7
8
9
10
-5,00 -7,50 -10,00 -12,50 -15,00 -17,50 -20,00
Distance between the CoG and the Ampelmann lower frame centre [m]
Cyl
inde
r L
engt
hs [m
]
Lmin Lneutral Lmax
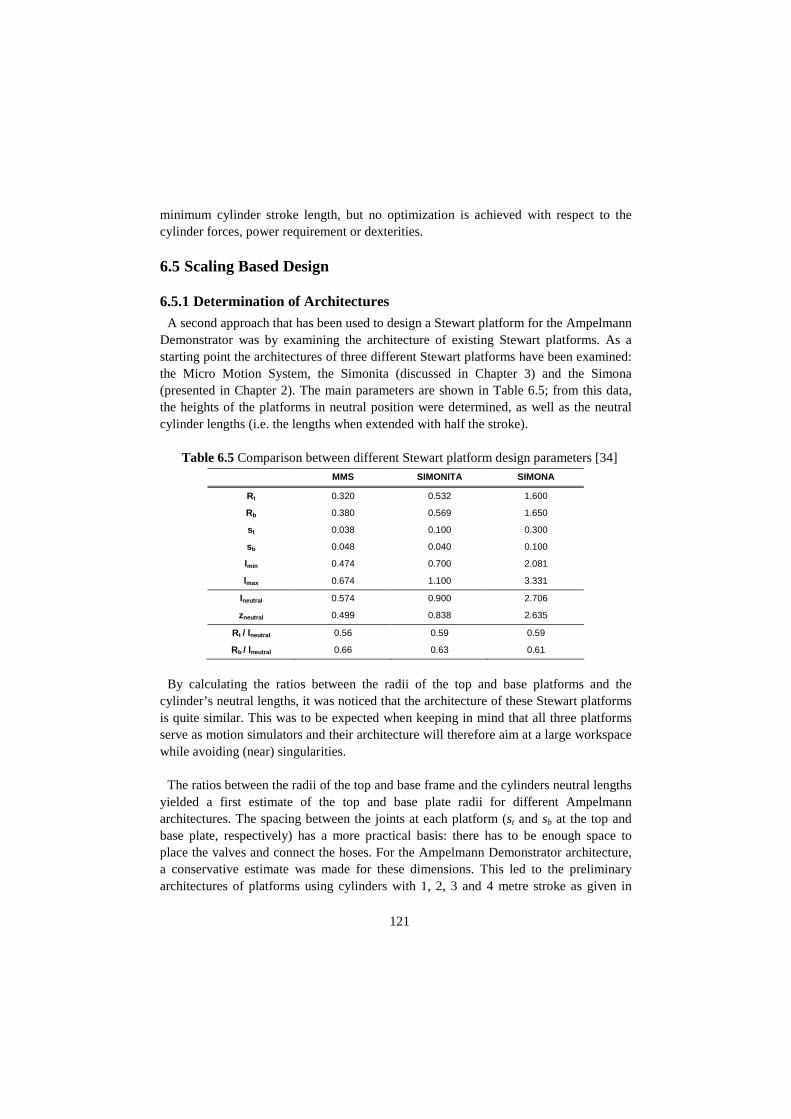
121
minimum cylinder stroke length, but no optimization is achieved with respect to the cylinder forces, power requirement or dexterities.
6.5 Scaling Based Design
6.5.1 Determination of Architectures A second approach that has been used to design a Stewart platform for the Ampelmann
Demonstrator was by examining the architecture of existing Stewart platforms. As a starting point the architectures of three different Stewart platforms have been examined: the Micro Motion System, the Simonita (discussed in Chapter 3) and the Simona (presented in Chapter 2). The main parameters are shown in Table 6.5; from this data, the heights of the platforms in neutral position were determined, as well as the neutral cylinder lengths (i.e. the lengths when extended with half the stroke).
Table 6.5 Comparison between different Stewart platform design parameters [34]
MMS SIMONITA SIMONA
Rt 0.320 0.532 1.600
Rb 0.380 0.569 1.650
st 0.038 0.100 0.300
sb 0.048 0.040 0.100
lmin 0.474 0.700 2.081
lmax 0.674 1.100 3.331
lneutral 0.574 0.900 2.706
zneutral 0.499 0.838 2.635
Rt / lneutral 0.56 0.59 0.59
Rb / lneutral 0.66 0.63 0.61
By calculating the ratios between the radii of the top and base platforms and the
cylinder’s neutral lengths, it was noticed that the architecture of these Stewart platforms is quite similar. This was to be expected when keeping in mind that all three platforms serve as motion simulators and their architecture will therefore aim at a large workspace while avoiding (near) singularities.
The ratios between the radii of the top and base frame and the cylinders neutral lengths
yielded a first estimate of the top and base plate radii for different Ampelmann architectures. The spacing between the joints at each platform (st and sb at the top and base plate, respectively) has a more practical basis: there has to be enough space to place the valves and connect the hoses. For the Ampelmann Demonstrator architecture, a conservative estimate was made for these dimensions. This led to the preliminary architectures of platforms using cylinders with 1, 2, 3 and 4 metre stroke as given in
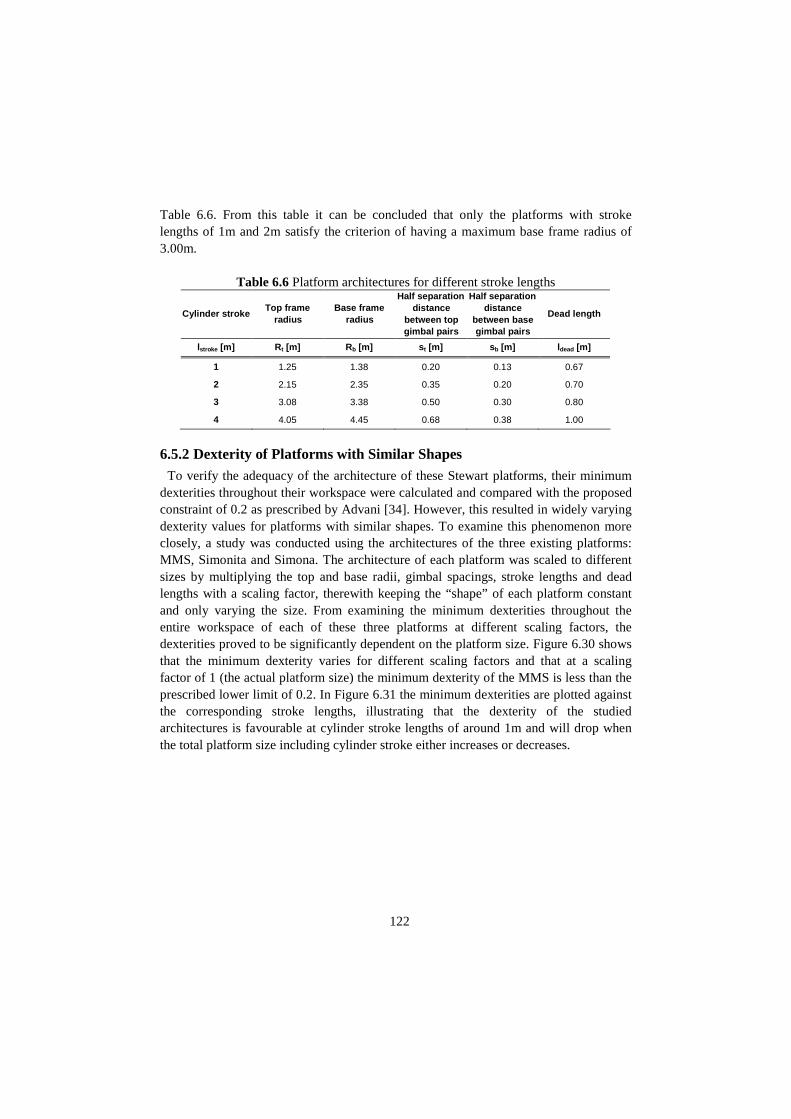
122
Table 6.6. From this table it can be concluded that only the platforms with stroke lengths of 1m and 2m satisfy the criterion of having a maximum base frame radius of 3.00m.
Table 6.6 Platform architectures for different stroke lengths
6.5.2 Dexterity of Platforms with Similar Shapes To verify the adequacy of the architecture of these Stewart platforms, their minimum
dexterities throughout their workspace were calculated and compared with the proposed constraint of 0.2 as prescribed by Advani [34]. However, this resulted in widely varying dexterity values for platforms with similar shapes. To examine this phenomenon more closely, a study was conducted using the architectures of the three existing platforms: MMS, Simonita and Simona. The architecture of each platform was scaled to different sizes by multiplying the top and base radii, gimbal spacings, stroke lengths and dead lengths with a scaling factor, therewith keeping the “shape” of each platform constant and only varying the size. From examining the minimum dexterities throughout the entire workspace of each of these three platforms at different scaling factors, the dexterities proved to be significantly dependent on the platform size. Figure 6.30 shows that the minimum dexterity varies for different scaling factors and that at a scaling factor of 1 (the actual platform size) the minimum dexterity of the MMS is less than the prescribed lower limit of 0.2. In Figure 6.31 the minimum dexterities are plotted against the corresponding stroke lengths, illustrating that the dexterity of the studied architectures is favourable at cylinder stroke lengths of around 1m and will drop when the total platform size including cylinder stroke either increases or decreases.
Cylinder stroke Top frame
radius Base frame
radius
Half separation distance
between top gimbal pairs
Half separation distance
between base gimbal pairs
Dead length
lstroke [m] Rt [m] Rb [m] st [m] sb [m] ldead [m]
1 1.25 1.38 0.20 0.13 0.67
2 2.15 2.35 0.35 0.20 0.70
3 3.08 3.38 0.50 0.30 0.80
4 4.05 4.45 0.68 0.38 1.00

123
Figure 6.30 Dexterity versus scaling
factor (=1 for original Stewart platform) Figure 6.31 Dexterity versus stroke length
The reason for the size dependency of dexterity can be found in the difference in the
effect that cylinder motions have on the translations and on the rotations. This is explained with the use of Figure 6.32 and Figure 6.33. Figure 6.32 illustrates a small platform performing a translation and a scaled larger platform in the same pose. The ratio between the translation and the cylinder extension of both platforms is the same. In Figure 6.33 both platforms perform a rotation. Now the ratio between rotation and cylinder extension not the same: to arrive at the same rotation the smaller platform requires a smaller cylinder extension than the larger platform. Following the “philosophy” of dexterity, this would mean that the larger platform has a less efficient use of its change in cylinder length, only due to scaling.
Figure 6.32 Scaled translation pose
Figure 6.33 Scaled rotation pose
Dexterity vs Stroke Lengthfor scaled architectures
0.0
0.1
0.2
0.3
0.4
0.5
0.00 2.00 4.00 6.00 8.00 10.00
Stroke Length [m]
Dex
terit
y
SIMONA
MMS
SIMONITA
Dexterity vs scaling factor
0,00,10,10,20,20,30,30,4
0,40,5
0,0 2,0 4,0 6,0 8,0 10,0
scaling factor
Dex
terit
y
SIMONA
MMS
SIMONITA
dl1 dz1
dz2 dl2
1 2
1 2
dl dl
dz dz=
1 2
1 2
1 2
:
:
now
dl dland
d d
ϕ ϕ
ϕ ϕ
=
≠
dl1
dl2
dφ1
dφ2

124
It was shown earlier (Section 6.2.5) that dexterity is determined by the inverse of the condition number of the Jacobian:
1
1 1Dexterity
J Jκ −= =
(6.76)
1 1 1 1 1 1
2 2 2 2 2 2
3 3 3 3 3 3
4 4 4 4 4 4
5 5 5 5 5 5
6 6 6 6 6 6
l l l l l lx y z
l l l l l lx y z
l l l l l lx y z
l l l l l lx y z
l l l l l lx y z
l l l l l lx y z
J
ϕ θ ψ
ϕ θ ψ
ϕ θ ψ
ϕ θ ψ
ϕ θ ψ
ϕ θ ψ
∂ ∂ ∂ ∂ ∂ ∂∂ ∂ ∂ ∂ ∂ ∂∂ ∂ ∂ ∂ ∂ ∂∂ ∂ ∂ ∂ ∂ ∂
∂ ∂ ∂ ∂ ∂ ∂∂ ∂ ∂ ∂ ∂ ∂∂ ∂ ∂ ∂ ∂ ∂∂ ∂ ∂ ∂ ∂ ∂
∂ ∂ ∂ ∂ ∂ ∂∂ ∂ ∂ ∂ ∂ ∂
∂ ∂ ∂ ∂ ∂ ∂∂ ∂ ∂ ∂ ∂ ∂
=
(6.77)
The values in the Jacobian are defined by the ratios between cylinder length changes
and the platform translations as well as the ratios between cylinder length changes and the platform rotations. Since scaling alters the ratios between cylinder length changes and the platform rotations, the Jacobian and therefore the dexterity changes with scaling. As a result, the value of a constraint for the minimum dexterity will always be arbitrary and will depend on a Stewart platform size. The only hard constraint is zero: that is when a degree of freedom is added and the system behaviour becomes unpredictable. Therefore, in the remainder of this research only qualitative comparisons will be made between dexterities of different platforms, and only when the sizes of these platforms are comparable.
6.5.3 Evaluation The different architectures of Stewart platforms for the Ampelmann system which
were scaled from existing platforms all resulted in efficient workspaces and (near) singularities were avoided. However, during this scaling based design stage no study was conducted to research whether variation of the different architecture parameters can result in an increase of the motion range, thus optimizing the workspace.
In addition, the axial cylinder forces were yet to be studied. A significant difference
between the Ampelmann system on the one hand and the MMS, Simonita and Simona on the other hand is the loading condition. Since the Ampelmann has to be equipped with a gangway of considerable mass (section 4.5.2), a large bending moment (which is absent in the other three systems) occurs at the centre of the Stewart platform top frame. To counteract this large bending moment, the axial cylinder loads will decrease in some of the cylinders and increase in other cylinders, resulting in higher maximum cylinder
125
forces. This effect can be reduced by increasing the top and base frame radii: any external bending moment around a horizontal axis is counteracted by the vertical component of the axial force in the cylinders. The magnitudes of the required axial forces depend on the lever arms of these forces, which are related to the top and base frame radii: a platform with larger radii will require smaller cylinder forces to counteract the same external moment. However, such an alteration of a platform architecture leads to a change in its workspace and thus its maximum excursions. It is apparent that a design method is preferred in which optimization is enabled for not only workspace and dexterities, but also for the cylinder forces.
6.6 Stroke Based Design including Optimization
6.6.1 Introduction At the point in time when the Stewart platform architecture for the Ampelmann
Demonstrator needed to be decided upon in order to achieve timely delivery for the tests, it was not yet known which vessel the Ampelmann would be mounted on for tests, demonstrations or future transfer operations. A vessel motion based design was therefore not considered an option. The scaling based design procedure yielded platform architectures which were not yet optimized; the effects of parameter variations on the resulting workspace, dexterities and cylinder forces were still to be examined. Therefore a third design method was developed.
For this design process a fixed cylinder stroke length was selected first. To create a
range of Stewart platform architectures with these cylinders, the other five Stewart platform parameters were varied: the radii of the top and bottom frame, top and bottom gimbal pair distances and the cylinder dead length. By examining the calculated workspace, dexterities and cylinder forces of the different platform architectures a preferred architecture could be selected.
6.6.2 Stewart Platform Design Procedure The design procedure is illustrated in Figure 6.34; all blocks in this process are treated
in this section.

126
Stroke Length For this design procedure the stroke length of all six cylinders was chosen as the only
fixed input parameter within the platform architecture. This stroke length was set at 2 metres. A design for a system with this stroke length was initially requested by potential Ampelmann users while a preliminary study showed that this stroke length will enable motion compensation in the previously defined design sea states.
Load Cases In the design process, two preliminary load cases (see Section 4.5.2) were considered:
a centric loading caused by the transfer deck combined with an eccentric loading caused by the gangway and personnel standing on the tip and a centric loading of a heavy component. It must be mentioned here that these load cases have been used solely to enable a qualitative comparison between the different platform architectures and the effect on the cylinder loads. The final detailed loading conditions are addressed in Chapter 7, where the loads are determined in accordance with design codes and dynamic effects are taken into account.
Size Constraints When choosing values for the top and base radii, special consideration was given to
the size limitations mentioned earlier: a maximum base radius of 3.00 metres. Furthermore, the top radius was not to exceed the base radius due to structural considerations.
Other Architecture Parameters The architecture of a rotationally symmetric Stewart Platform can be described by 6
parameters (Section 6.2.1). The parameters and the variations of their values used for this design procedure are listed in Table 6.7.
Figure 6.34 Stroke based design procedure
Calculation Procedure
Design Considerations
Stroke Length
Platform Architecture
Load Cases
Other Architecture Parameters
Size Constraints

127
Minimum
value Maximum
value Step size
Rt 2.50 m 3.00 m 0.25 m
Rb 2.50 m 3.00 m 0.25 m
st 0.25 m 1.00 m 0.25 m
sb 0.25 m 1.00 m 0.25 m
lstroke fixed value = 2.00 m
ldead 0.75 m 1.75 m 0.25 m
Calculation Procedure The parameter variations as listed in Table 6.7 were used to create an extensive set of
different Stewart platform architectures. Subsequently, various calculations have been performed in MATLAB for all resulting platform architectures. The following steps have been performed:
1. The 6DoF workspace was determined by varying the three displacements and the
three rotations of the base frame in small steps while the top plate remains fixed. When one of the cylinders reaches its minimum or maximum length, the workspace limit is found. This yielded a large amount of platform poses, and the non-simultaneous system excursions as defined in 6.2.6 could be deduced
2. For poses covering the entire workspace the dexterity of the platform was calculated and the minimum dexterity was determined.
3. For the design load cases the axial forces in the six cylinders were calculated for each pose resulting in maximum pushing and pulling forces.
For each platform architecture the calculation procedure provided:
• Non-simultaneous system excursions • Minimum and maximum dexterity • Minimum and maximum axial forces in cylinders
The different geometries have been assessed and an optimal architecture could be
selected based on a set of design considerations. Analysis of the Calculation Results The calculation procedure for a large set of Stewart platform architectures enabled a
good assessment of the effects of the different parameters on the platform characteristics. The characteristics most influenced by alteration of architecture
Table 6.7 Stewart platform architecture parameter variations

128
parameters are the maximum and minimum cylinder forces. By using larger top and base frame radii, these values can decrease significantly. Moreover, reduction of the separation distances between the gimbal pairs at the top and bottom were found beneficial for keeping the extreme cylinder forces low. The correlation between the Stewart platform parameters and the maximum excursions was less straight-forward, as was the relationship between the design parameters and the minimum and maximum dexterities.
Nevertheless, a clear relationship was found between the minimum occurring
dexterities of the examined platforms and the extreme cylinder forces as shown in Figure 6.35: the architectures with the lowest values for minimum dexterity experience the largest cylinder forces. In addition, low values for minimum dexterity are also related to smaller heave excursions (Figure 6.36).
Figure 6.35 Extreme cylinder forces vs. minimum dexterity
of different platform architectures
Figure 6.36 Heave excursion vs. minimum dexterity
of different platform architectures Design Considerations As a conclusion from the previous two figures it can be stated that platform
architectures with a minimum dexterity below a certain value are preferably not considered due to the associated higher cylinder forces and smaller heave motion range. Although the choice of such a threshold value remains arbitrary, the use of a threshold value is a straight-forward method to discard the less appropriate architectures. In this design process, all platforms with a minimum dexterity of less than 0.12 have been rejected for this specific platform size category.
Subsequently, a trade-off had to be made between a platform architecture that creates
a large motion range, and one that results in low axial cylinder forces. Since the Ampelmann aims to compensate ship motions, the functionality of this system increases with a larger workspace. Generally, when comparing the maximum ship motions in each degree of freedom to the non-simultaneous excursions of a Stewart platform, it becomes clear that the limiting degree of freedom of a Stewart platform is always the
Cylinder Forces vs. Minimum Dexterity
0
0.04
0.08
0.12
0.16
0.2
-400 -300 -200 -100 0 100 200 300 400
Extreme cylinder forces [kN]
Min
imum
De
xter
ity [-
]
Fmax
Fmin
Heave Excursion vs. Minimum Dexterity
0
0.04
0.08
0.12
0.16
0.2
2 2.1 2.2 2.3 2.4 2.5 2.6 2.7 2.8
Heave excursion [m]
Min
imum
Dex
terit
y [-
]
Heave excursion capability[m]

129
heave. A platform with an architecture that can perform large heave excursions is therefore preferred. On the other hand, having high axial cylinder forces, either in tension or compression, call for cylinders with a larger rod and casing diameters, which calls for larger components and a larger power requirement, making the platform more expensive. For the latter reason, the architectures with the highest cylinder loads were discarded to create a shortlist of preferred platform architectures.
Preferred Architecture After discarding all architectures with the lowest minimum dexterities and the highest
axial cylinder forces, the platform architectures best fit for the Ampelmann could be listed (Table 6.8). Finally, the architecture with the largest heave excursion capability was selected as the preferred Stewart platform architecture to be applied for the Ampelmann Demonstrator.
Table 6.8 Shortlist of architectures for the Ampelmann Demonstrator Stewart platform
6.6.3 Evaluation The stroke based design method proved to be an efficient way to determine a final
Stewart platform architecture since it provided insight in the three most important resulting platform characteristics: workspace, dexterities and cylinder forces. However, the final architecture selection remains arbitrary; Table 6.8 presents alternative platform architectures of which the heave excursion, minimum dexterity and cylinder forces differ only slightly from the chosen concept. Nevertheless, the design method provides a clear procedure for determining future Stewart platform architectures for Ampelmann systems, also in case the design requirements are altered.
Architecture parameters [m] Platform
height [m]
Axial Cylinder
Forces [kN] Dexterity [-]
Non- simultaneous
Excursions [m]
Non-simultaneous Excursions [°]
Rt Rb st sb ldead Settled Neutral Fmax Fmin Max Min x y z φ θ ψ
2.75 3.00 0.25 0.25 1.25 2.15 3.40 66.8 -33.7 0.233 0.149 3.63 3.31 2.50 55 53 76
3.00 3.00 0.25 0.25 1.50 2.39 3.63 66.3 -35.2 0.234 0.154 3.79 3.43 2.48 50 48 73
2.75 3.00 0.25 0.50 1.00 2.02 3.25 67.8 -35.7 0.233 0.138 3.59 3.30 2.46 55 53 75
2.50 3.00 0.25 0.25 1.25 2.25 3.47 65.4 -34.2 0.231 0.133 3.59 3.29 2.45 61 58 83
3.00 3.00 0.25 0.50 1.25 2.27 3.49 67.6 -38.1 0.234 0.145 3.75 3.42 2.44 50 47 72
3.00 3.00 0.50 0.25 1.25 2.27 3.49 67.2 -37.7 0.234 0.150 3.75 3.42 2.44 51 48 72
2.75 3.00 0.25 0.25 1.50 2.51 3.72 65.9 -36.3 0.233 0.139 3.74 3.41 2.42 55 52 79
2.50 3.00 0.25 0.50 1.00 2.10 3.31 66.5 -34.5 0.232 0.124 3.56 3.28 2.42 61 57 81
3.00 3.00 0.25 0.25 1.75 2.74 3.95 68.3 -37.5 0.234 0.146 3.89 3.53 2.41 50 47 76

130
6.7 Evaluation of Design Methods
6.7.1 General Stewart Platform Design The architecture of a rotationally symmetrical Stewart platform is determined by six
parameters: the top and base radii, the separation distance between gimbal pairs at top and base, the cylinder stroke and the cylinder dead length. These six parameters determine the motion range (or workspace) of a platform, which is one of a platform’s key characteristics. In the case of the Ampelmann Demonstrator, a larger workspace will allow compensating larger ship motions. The design of the architecture of the Ampelmann Stewart platform must therefore be focussed on a workspace as large as possible. In addition, platforms under the same loading but with different architecture parameters will have different values for the maximum cylinder forces. These forces are preferably kept as low as possible to keep the size and associated costs of the cylinders, the hydraulic components and the power requirement low.
Stewart platforms with a different architecture but of similar size can be compared by
calculating the dexterities throughout the entire workspace for each platform. The minimum dexterity of each platform provides good insight in both the motion range and the maximum cylinder forces in a qualitative sense: the platforms with the lowest minimum dexterities are associated with small workspaces and high cylinder forces. Although choosing a threshold value for minimum dexterity is arbitrary, it enables discarding a large set of less appropriate platform architectures. In addition, this calculation facilitates detection of configuration singularity: when the dexterity equals zero, singularity occurs.
6.7.2 Vessel Motion Based Design The Ampelmann system is to be mounted on a host vessel at a certain location on
deck. When the host vessel and mounting location on deck are known, and Motion Response Amplitude Operators (RAOs) of the vessel are available, the motion of this vessel in various sea states can be simulated. Subsequently, the required Stewart platform cylinder lengths can be determined for any sea state and incoming wave direction. The vessel motion based design procedure presented in 6.4 can be recommended in case an Ampelmann system is to be mounted permanently on a known host vessel. However, it is advised to perform this procedure for various architecture parameters while calculating both the minimum dexterities (to exclude singularities) and the maximum cylinder forces. A selection of the preferred architecture can then be based on the platform with the lowest cylinder forces; the aptness of the workspace is already included in this design process.
131
6.7.3 Scaling Based Design The architectures of three existing Stewart platforms were compared by determining
the ratios between the radii of the top and base platforms and the cylinders’ neutral lengths. Since the values of these ratios were almost the same, the question arose whether it is possible to design an appropriate platform architecture by merely scaling the six parameters (top and base radii, separation distance between gimbal pairs at top and base, cylinder stroke and cylinder dead length) by a constant scaling factor. In theory, the translational motion range should increase by this same scaling factor, while the rotational motion range remains the same. However, scaling of the separation distances and the dead length can be hampered by practical considerations: they require some minimum value to fit the gimbals and the cylinder ends. In addition, the maximum cylinder forces will not be increased by the same scaling factor, neither will the minimum dexterity. A calculation procedure is therefore still necessary to acquire forces and dexterities and optimization must still be achieved by altering the design parameters.
6.7.4 Stroke Based Design Since the Ampelmann Demonstrator had no envisaged permanent host vessel, there
was no fixed motion range requirement. The deck space limitations given in Chapter 3 gave a maximum value for the base radius; the top radius was chosen not to be larger than the base radius. While the stroke length was chosen fixed at 2.0 metres, all other architecture parameters were varied, creating a large set of architectures. For all these different architectures, the extreme cylinder forces and minimum dexterity was determined. By first discarding all designs with a minimum dexterity below a chosen threshold and subsequently rejecting the architectures with the highest extreme cylinder forces, a shortlist of architectures was reached. From this list, the platform providing the largest heave motion range was selected.
The stroke based design process yielded the final Stewart platform architecture for the
Ampelmann Demonstrator as well as a clear procedure for determining future Stewart platform architectures for Ampelmann systems in case design requirements are altered. It should be noted, however, that the final loading condition was not yet determined during this design process: the transfer deck and gangway were not designed at the time. To acquire the optimized architecture for a chosen cylinder stroke length, the exact loading condition must of course be applied.
6.7.5 Validation of Platform Motion Range Subsequently, the motion compensation capacity of the selected Stewart platform
architecture was examined for three different vessel types. For this, the motions in all six degrees of freedom were simulated for these vessels in different sea states

132
(significant wave height in steps of 0.5m) to calculate if the platform stays within its motion range. It was found in [41] that the statistical properties of these simulations are constant when a time length of 20 hours is used. Simulations of 20 hours were therefore done for each vessel, with the Ampelmann placed at 1 metre from the vessel’s side and aft. Due to the stochastic nature of waves and consequently of vessel motions, however, motions outside the Stewart platform’s workspace can always occur. A certain amount of residual motions of the platform must therefore be accepted. It was decided to theoretically approve offshore access when the residual translational motions of the transfer deck stay within a chosen limit of 0.5 metres. This choice is justified by the passive motion compensating capacity of the TAB, which allows for residual motions without compromising the transfer operation.
The results of these assessments are presented in Figure 6.37, including an estimate of
the contribution of the Ampelmann mass (estimated here at 10 tons) to the roll mass moment of inertia Ixx of the vessel. The figure shows that the objective of enabling motion compensation in a sea state of HS=2.5m is reached when the Ampelmann is mounted on a 50m vessel with an incoming wave direction of 165°.
Figure 6.37 Motion compensating capacity of the Ampelmann Demonstrator design on different vessels
Vessel type: Anchor handling tug Dimensions: 24m x 10m x 2.75m Displacement: 120 tons Max. sea state: Hs = 2.0m Workability: 85% (S. North Sea) Contribution to Ixx: 10%
Vessel type:: Multi purpose vessel Dimensions: 50m x 12m x 3.80m Displacement: 900 tons Max. sea state: Hs = 2.5m Workability: 93% (S. North Sea) Contribution to Ixx: 1.0%
Vessel type: Offshore support vessel Dimensions: 70m x 16m x 5.60m Displacement: 4000 tons Max. sea state: Hs = 3.0m Workability: 97% (S. North Sea) Contribution to Ixx: 0.1%

133
7. Certification and Tests
7.1 Introduction To enlarge operational weather windows for offshore turbine maintenance, the
Ampelmann system is to provide safe access to these structures in sea states with significant wave heights larger than the accessibility limit of the currently used access systems. For this, the Ampelmann system has to meet the highest offshore safety standards. An objective statement on the design, fabrication and operation of the system is therefore essential. To acquire such a certificate, Lloyd’s Register has been asked to perform a design appraisal, survey the fabrication of the components and witness full scale tests after completion of the system. In addition, to prove that the Ampelmann is an inherently safe system an extensive series of tests have been performed. This chapter describes the certification process by Lloyd’s Register as well as the different tests that have been performed on the Ampelmann Demonstrator.
7.2 Certification
7.2.1 Introduction As stated in Chapter 5, one of the main requirements of the safety based design of the
Ampelmann system is to have no failure of any structural component. The structural integrity of all components has been ensured in three stages: proper design of the system and its components, proper fabrication of all components and a test to prove the load bearing capacity of the integral system. Lloyd’s Register, an independent certifying authority whose services include risk assessments, was contracted to objectively assess these three stages:
• The structural design was to be assessed through a design appraisal • A fabrication survey was to ensure proper fabrication and use of the specified
material • The bearing capacity of the integral system was to be tested and witnessed by
a surveyor
7.2.2 Code for Lifting Appliances in a Marine Environment Lloyd’s Register has been requested to perform a design appraisal of the structural
design of the Ampelmann system. As there are no specific codes for these types of systems Lloyd’s Register considered its “Code for Lifting Appliances in a Marine Environment” (CLAME) of January 2003 [44] as being the most appropriate to verify the structural integrity of the Ampelmann. Although different in nature, an Ampelmann

134
system can be compared to an offshore crane in the sense that both systems are designed to lift a predetermined maximum load on board of a vessel in offshore conditions.
CLAME defines four load combinations to be used for the design of lifting appliances
(Table 7.1). Each of these cases defines a loading condition for the total structure and its components. The resulting stress in all components has to be lower than the allowable stress of the material. The maximum allowable stress in any component is to be taken as the material yield stress of the component concerned multiplied by a stress factor F defined by Lloyd’s Register and which depends on the load case considered.
Table 7.1 Load Cases defined by Lloyd’s Register in CLAME
Load Case Stress factor F
Case 1 Crane operating without wind 0.67
Case 2 Crane operating with wind 0.75
Case 3 Crane in stowed condition 0.85
Case 4 Crane subjected to exceptional loading 0.85
Definitions In these load cases CLAME uses several terms which are defined as follows: Safe Working Load
(SWL) Maximum static load which the appliance is certified to lift.
Live Load Sum of the Safe Working Load (SWL) of an appliance and the static weight of any component of the appliance which is directly connected to, and undergoes the same motion as, the safe working load during the lifting operation.
Dead Load Self-weight of all components of the lifting appliance which are not included in the Live Load.
Duty Factor Makes allowances for the regularity with which a lifting application is used and the severity of load lifted with respect to the SWL. A single duty factor Fd = 1.20 is to be used for all offshore cranes.

135
Hoisting Factor Accounts for all dynamic effects not explicitly determined and separately accounted for.
The dynamic force due to hoisting for offshore cranes is to include the effect of relative movement of the crane and load in addition to normal hoisting shock and dynamic effects.
When a motion compensator, shock absorber, or similar device is fitted, proposals to use lower hoist factors will be specially considered.
Load Case 1 Load case 1 accounts for the loading condition of the crane when operating without
wind and is defined by:
( )1 1 2 3d g h h hF L F L L L L + + + +
with: Fd = Duty factor [-] Fh = Hoisting factor [-] Lg = Dead loads [N] Ll = Live loads [N] Lh1 = Horizontal component of live load due to heel and trim [N] Lh2 = Next most unfavourable horizontal load [N] (usually due to slewing acceleration) Lh3 = Horizontal component of dead load due to heel and trim [N]
Load Case 2 Load case 2 is used for the loading condition of the crane operating with wind loads:
( )1 1 2 3d g h h h wF L F L L L L L + + + + +
with: Lw = Most unfavourable wind load [N] Load Case 3 Load case 3 considers the crane in its stowed condition when subjected to forces
resulting from accelerations due to the vessel’s motions and static inclination combined with wind loads. The crane is to withstand two load combinations:
(a) Acceleration normal to deck of ± 1.0 g.
Acceleration parallel to deck in fore and aft direction of ± 0.5 g. Static heel of 30°. Wind of 63 m/s acting in fore and aft direction.
136
(b) Acceleration normal to deck of ± 1.0 g.
Acceleration parallel to deck in transverse direction of ± 0.5 g. Static heel of 30°. Wind of 63 m/s acting in a transverse direction.
Load Case 4 Load case 4 considers the following exceptional load conditions:
• Coming into contact with buffers • Failure of hoist wire or sudden release of load for cranes with counterweight • Test loading
7.2.3 Definition of Ampelmann Load Cases for Design Appraisal The load cases defined in CLAME are applicable for the design of different marine
lifting appliances such as offshore cranes. These cases have been based on: • Operational Conditions (Load cases 1 and 2) • Stowed Condition (Load case 3) • Special Cases (Load case 4)
The use of the Ampelmann system will, however, differ considerably from the use of a
crane when regarding the operational conditions as well as the special cases. For this reason both the operational procedure and special cases of the Ampelmann system will be looked upon in-depth in this section to provide tailored load cases for this specific system.
Operational Conditions In operational conditions the first difference between the Ampelmann system and a
crane is the fact that the Ampelmann can provide motion compensation in six degrees of freedom for all components above the upper gimbal level: the Telescopic Access Bridge (TAB), the transfer deck assembly, the foundation and upper frame (upper gimbal chairs, upper gimbals and coupling frames). These components combined form the superstructure as shown in Figure 7.1. In addition the live loads, personnel in this case, are also kept motionless during motion compensation. As a result the accelerations that the host vessel will encounter do not apply on the motion compensated masses. This causes a significant reduction of the resulting loads in the system during operations. Furthermore the operational procedure as presented in section 5.4.5 results in different load cases that apply during different stages within the procedure. For instance, people will only walk over the TAB when motion compensation is active. Another important difference is the load carrying capacity intended: a crane will generally have a large load carrying capacity compared to its own weight, whereas the Ampelmann carries
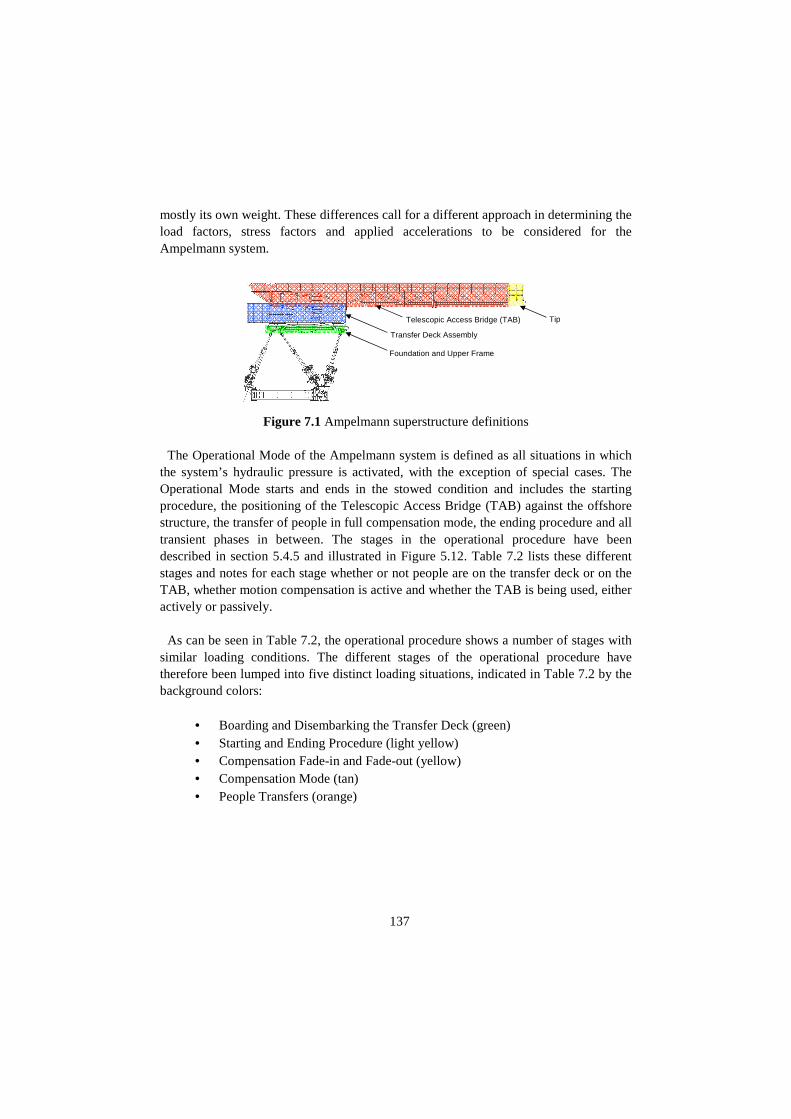
137
mostly its own weight. These differences call for a different approach in determining the load factors, stress factors and applied accelerations to be considered for the Ampelmann system.
Figure 7.1 Ampelmann superstructure definitions The Operational Mode of the Ampelmann system is defined as all situations in which
the system’s hydraulic pressure is activated, with the exception of special cases. The Operational Mode starts and ends in the stowed condition and includes the starting procedure, the positioning of the Telescopic Access Bridge (TAB) against the offshore structure, the transfer of people in full compensation mode, the ending procedure and all transient phases in between. The stages in the operational procedure have been described in section 5.4.5 and illustrated in Figure 5.12. Table 7.2 lists these different stages and notes for each stage whether or not people are on the transfer deck or on the TAB, whether motion compensation is active and whether the TAB is being used, either actively or passively.
As can be seen in Table 7.2, the operational procedure shows a number of stages with
similar loading conditions. The different stages of the operational procedure have therefore been lumped into five distinct loading situations, indicated in Table 7.2 by the background colors:
• Boarding and Disembarking the Transfer Deck (green) • Starting and Ending Procedure (light yellow) • Compensation Fade-in and Fade-out (yellow) • Compensation Mode (tan) • People Transfers (orange)
Transfer Deck Assembly
Telescopic Access Bridge (TAB)
Foundation and Upper Frame
Tip

138
stage Condition People on deck
People on TAB
Motion Compen-
sation Notes
Slewing/ Luffing/
Telescoping
1 Stowed Condition no no no No hydraulic pressure no
2 People Boarding yes yes no Pressure, safe mode no
3 Safe Mode yes no no All 6 cylinders retracted no
4 Moving TAB outwards yes no no Telescoping, Luffing, Slewing active
Safe to Settled yes no no Moving with vessel no
Settled yes no no Active motion control no
5 Settled to Neutral yes no no Moving with vessel no
Neutral yes no no Moving with vessel no
6 Neutral to Engaged yes no Compensation Fade-in no
Engaged yes no yes Motion Compensation
7 Positioning TAB yes no yes Slewing, Luffing, Telescoping active
Free Floating yes no yes Constant pushing force TAB passive
8 Contact Structure yes no yes TAB tip resting on landing point passive
9 People Transfer yes yes yes people walking over TAB passive
10 Retraction TAB yes no yes Telescoping active
11 Engaged to Neutral yes no Compensation Fade-out no
Neutral yes no no Moving with vessel no
12 Neutral to Settled yes no no Moving with vessel no
Settled yes no no Moving with vessel no
Settled to Safe yes no no Moving with vessel no
Safe yes no no All 6 cylinders retracted no
13 Moving TAB to vessel yes no no Telescoping, Luffing, Slewing active
14 People Disembarking yes yes no Locked no
15 Stowed Condition no no no Locked , no pressure no
In the loading situation where people board or disembark the transfer deck, the control
system is in its safe mode and the Stewart platform in its settled position. In the settled position the load path within the system is the same as in the stowed condition. Since the stowed condition presents a more severe loading condition including large vessel accelerations, the boarding and disembarking loading condition can be omitted. Furthermore, the condition during compensation fade-in and fade-out is a transient state between the platform’s neutral state (taken into account during the starting and ending procedure) and full motion compensation. The load situation in this transient state will therefore not be considered.
Table 7.2 The different stages in the Ampelmann operational procedure

139
As a result, three typical and determining load cases are defined for the Ampelmann system during its operational mode as presented in Table 7.3:
Table 7.3 Determining load cases in the Ampelmann operational mode
People on deck
People on TAB
Motion Compen-
sation
Slewing/ Luffing/
Telescoping Notes
1 Starting/Ending yes no no active * Trajectory between Settled and Neutral * Accelerations of vessel * People on transfer deck
2 Compensation Mode yes no yes active
* Platform pose within workspace * Motion Compensation active * People on deck, none on TAB * Active Slewing, luffing, telescoping
3 People Transfers yes yes yes passive
* Platform pose within workspace * Motion Compensation active * Contact with structure * People on deck * Max 1p on TAB * Passive Slewing, luffing, telescoping
Stowed Condition The second load case to be considered is the stowed condition. In the Stowed
Condition, the Ampelmann system is not pressurized and in its settled position. During the Stowed Condition, the tip of the TAB is sea fastened, enabling horizontal and vertical load transfer from the tip to the vessel deck. This load case can be considered similar to CLAME load case 3. Special Cases Next to the Operational Mode and the Stowed Condition two Special Cases have been
defined for the Ampelmann system, which will be referred to as Emergency Cases. The first Emergency Case is when a double failure occurs during the Operational
Mode; the control system will then cause the motion compensation to abort. As a result, the control system will retract all six Stewart platform cylinders within 10 seconds to reach the platform’s settled position. As a conservative assumption one person is considered to be standing on the tip when a failure like this occurs.
The second Emergency Case accounts for the situation in a normal operation during
motion compensation when an injured person needs to be carried over the TAB by two other persons. This situation results in 3 persons standing on the tip of the TAB in the most extended position as the worst case.
All Ampelmann Load Cases As a result a total of six load cases have been presented to Lloyd’s Register to be used
for the design appraisal of the Ampelmann system. They are listed in the most right

140
column of Figure 7.2. Lloyd’s Register agreed to the applicability and use of these load cases for the Ampelmann design appraisal.
Figure 7.2 CLAME load cases and resulting Ampelmann load cases as agreed with Lloyd’s Register
7.2.4 Resulting Ampelmann Design Loads After having defined the six different load cases for the Ampelmann, the
corresponding design loads were determined for each load case. For this, the used working loads, factors and parameter values have been determined first; these conditions are presented in Table 7.4 and will be discussed hereinafter.
Load Case 1
Load Case 2
Load Case 3
Load Case 4
CLAME Offshore Crane
Crane Operations - with wind - without wind
Stowed Condition
Special Cases
Contact with buffers
Failure of Host Wire
Test Loading
Ampelmann System
Stowed Condition
Emergency Cases
Starting / Ending
Compensation Mode
People Transfers
Double Failure
3 Persons on Tip
Ampelmann Operations - with wind - without wind
Ampelmann Load Cases
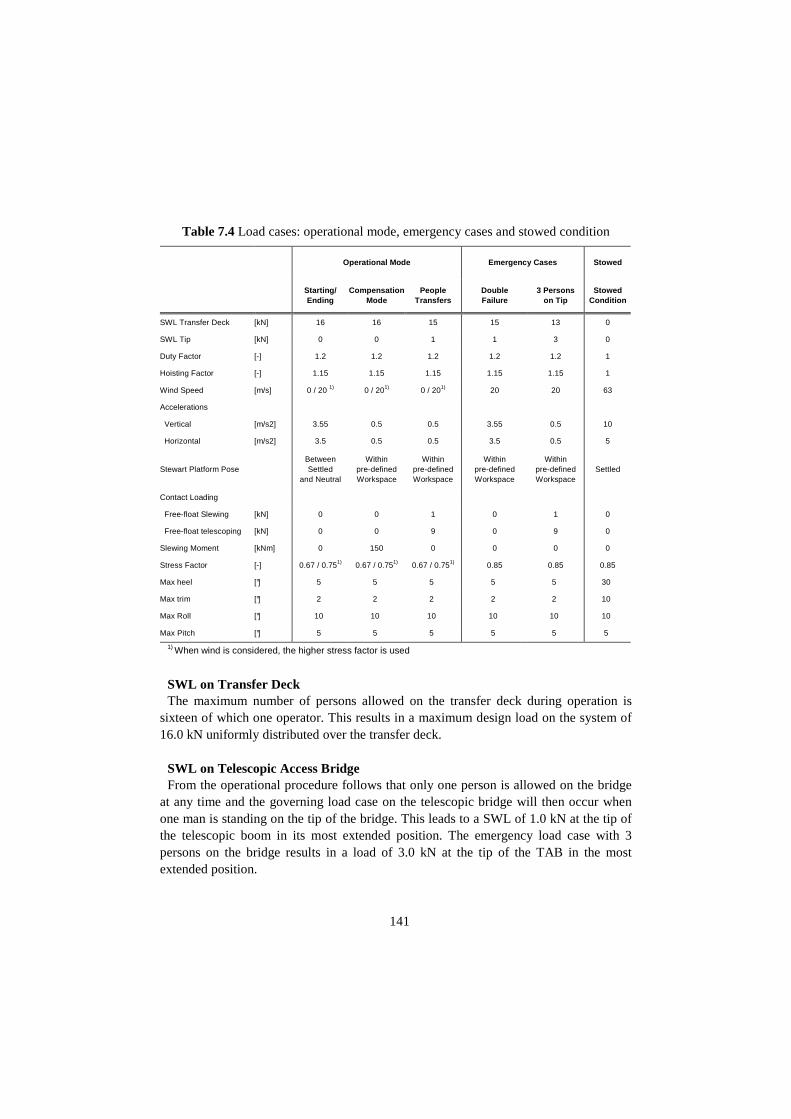
141
Table 7.4 Load cases: operational mode, emergency cases and stowed condition
SWL on Transfer Deck The maximum number of persons allowed on the transfer deck during operation is
sixteen of which one operator. This results in a maximum design load on the system of 16.0 kN uniformly distributed over the transfer deck.
SWL on Telescopic Access Bridge From the operational procedure follows that only one person is allowed on the bridge
at any time and the governing load case on the telescopic bridge will then occur when one man is standing on the tip of the bridge. This leads to a SWL of 1.0 kN at the tip of the telescopic boom in its most extended position. The emergency load case with 3 persons on the bridge results in a load of 3.0 kN at the tip of the TAB in the most extended position.
Operational Mode Emergency Cases Stowed
Starting/ Ending
Compensation Mode
People Transfers
Double Failure
3 Persons on Tip
Stowed Condition
SWL Transfer Deck [kN] 16 16 15 15 13 0
SWL Tip [kN] 0 0 1 1 3 0
Duty Factor [-] 1.2 1.2 1.2 1.2 1.2 1
Hoisting Factor [-] 1.15 1.15 1.15 1.15 1.15 1
Wind Speed [m/s] 0 / 20 1) 0 / 201) 0 / 201) 20 20 63
Accelerations
Vertical [m/s2] 3.55 0.5 0.5 3.55 0.5 10
Horizontal [m/s2] 3.5 0.5 0.5 3.5 0.5 5
Stewart Platform Pose Between Settled
and Neutral
Within pre-defined Workspace
Within pre-defined Workspace
Within pre-defined Workspace
Within pre-defined Workspace
Settled
Contact Loading
Free-float Slewing [kN] 0 0 1 0 1 0
Free-float telescoping [kN] 0 0 9 0 9 0
Slewing Moment [kNm] 0 150 0 0 0 0
Stress Factor [-] 0.67 / 0.751) 0.67 / 0.751) 0.67 / 0.751) 0.85 0.85 0.85
Max heel [°] 5 5 5 5 5 30
Max trim [°] 2 2 2 2 2 10
Max Roll [°] 10 10 10 10 10 10
Max Pitch [°] 5 5 5 5 5 5
1) When wind is considered, the higher stress factor is used

142
Duty Factor As the Ampelmann system is used for offshore applications, the duty factor as
normally applied for offshore cranes is used: Fd =1.2. (CLAME ch3-3.2) The duty factor applies to both, the live and the dead loads.
Hoisting factor The hoisting factor accounts for all dynamic effects that are not explicitly determined
and separately accounted for. When cranes are considered, this factor is related to the maximum hoisting speed. The Ampelmann system aims to counteract all wave induced vessel motions (and thus velocities) during operation. In addition, all starting and ending procedures have been programmed with gentle fade-ins and fade-outs, resulting in no shocks i.e. dynamic effects. Also, no hoisting shocks can occur since the appliance is not used for hoisting. During the starting/ending procedure, the maximum velocity used to raise the upper part of the Ampelmann is pre-defined in the control system and equals 0.25m/s. The extension/retracting speed of the telescoping bridge is limited to 0.1 m/s; during the luffing procedure, the maximum vertical speed at the tip equals 0.15m/s when the TAB is fully extended. All cylinders have a soft start/stop procedure due to ramp-up ramp-down valve electronics. Relating these velocities to the Code for Lifting appliances, the hoisting factor corresponding to a hoisting velocity of 0.25m/s is found to be between 1.1 and 1.15 depending on the crane type. A hoisting factor of 1.15 therefore seems conservative and appropriate for use in Ampelmann load calculations. This value applies on the live loads: all loads that undergo a certain motion during the operational procedure.
The Stewart platform has been designed in such a way, that it is able to compensate the
expected vessel motions (based on a 50m vessel in 2.5m significant wave height). However, depending on the vessel type and location of the Ampelmann on the vessel, and also taking into account the stochastic character the waves and resulting vessel motions, there will always be a chance that the cylinder stroke is insufficient to compensate an incidentally large motion. Precautions have been taken to prevent dynamic shocks of the transfer deck and TAB when the cylinders reach their buffers through a “soft-stop” by the control software.
Wind Speed The wind forces are to be calculated according to CLAME regulations. The maximum
wind speed during the operational procedure is assumed to be 20 m/s. The maximum wind speed for the emergency case is also set at 20 m/s, since an emergency can only occur during operations. For the Stowed Condition, the maximum wind speed is 63 m/s.

143
Vertical and Horizontal Accelerations To calculate the loading conditions the accelerations of all masses are to be taken into
account. However, when the Ampelmann system is in operation the ship motions are counteracted by the Stewart platform keeping the superstructure and boarded personnel nearly motionless. Due to inaccuracies of the measuring devices and the control system residual motions and thus horizontal and vertical accelerations can occur. Consequently, Lloyd’s Register recommended taking into account residual horizontal and vertical accelerations of the transfer deck and TAB during motion compensation of 0.5 m/s2. This proved to be a very conservative assumption as shown by measurements during the test phases (section 7.3.3).
In three of the load cases presented in Table 7.4 the superstructure and personnel will
be subject to the accelerations of the host vessel:
• Stowed Condition • Operational Mode during Starting and Ending • Emergency Case Double Failure
During the Stowed Condition, the structure has to be able to withstand the survival
condition of the vessel on which it is mounted. The survival conditions are defined by a vertical acceleration of +/-1g, a horizontal acceleration of +/-0.5g, a heel of 30º and a trim of 10º, all in accordance with CLAME load case 3. As a result, the accelerations to consider in the Stowed Condition equal 10 m/s2 vertically and 5 m/s2 horizontally.
The accelerations that are to be taken into account in the survival condition will not
apply during operations. To perform transfer operations safely, operational conditions should be defined first. Operational limits can be defined by the maximum environmental conditions (sea states) in which the Ampelmann system is able to counteract (nearly) all host vessel motions. However, as stated in Chapter 6, the motions to be counteracted by the Ampelmann system depend not only on the sea state in which it is operation, but also on the vessel characteristics (dynamic behaviour represented by Response Amplitude Operators), the location of the Ampelmann system on the vessel deck and the direction of the incoming waves. The operational limits will therefore be specific for each vessel in combination with the location of the Ampelmann on deck. As a consequence, the determination of the maximum accelerations during operational conditions will be case-specific. Nevertheless, a value should be defined for the maximum accelerations during operational conditions to take into account for the design appraisal. After consultation with Lloyd’s Register, based on generic ship motion calculations in accordance with CLAME the maximum horizontal and vertical accelerations during operations was chosen at 3.5 m/s2.

144
In the Operational Mode the superstructure is raised from settled to neutral height before motion compensation is engaged; this is called the starting procedure. Similarly, after motion compensation is disengaged the superstructure is lowered back to its settled position. During both the Starting and Ending procedure, the maximum accelerations of the Ampelmann system are therefore equal to the maximum accelerations encountered by the host vessel. In addition, the superstructure of the Ampelmann system encounters accelerations due to its motion path of 1.25m between the settled and neutral position. The control system runs this motion path in a predefined S-curve of 10 seconds with a constant acceleration of +/-0.05 m/s2, while reaching a maximum velocity of 0.25m/s. The maximum value for the vertical acceleration during the starting/ending procedure was therefore set at 3.55 m/s2.
In the Emergency Case Double Failure, the motion compensation will end with a soft
stop and all Stewart platform cylinders will slowly retract. This procedure is similar to the Ending procedure. The accelerations to be taken into account in the Double Failure load case have therefore also been set at 3.55 m/s2
vertically and 3.5 m/s2 horizontally. Stewart platform poses The Stewart platform has two basic static poses (or positions): the settled and the
neutral position. The settled position is defined as the platform position with the six platform cylinders fully retracted. When the cylinders are fully extended, the platform has a shift of 2.50 metres normal to the bottom frame. The position between the minimum and maximum platform height is defined as the neutral position: a shift of 1.25 metres from the settled position, normal to the bottom frame (Figure 7.3). When the platform is in stowed condition, the platform is always in the settled position. During the Starting and Ending procedure, the platform moves strictly between settled and neutral position in a trajectory normal to the base frame. These positions are not to be confused with the platform states mentioned in section 5.4.3, which indicate the platform’s condition in the control system.
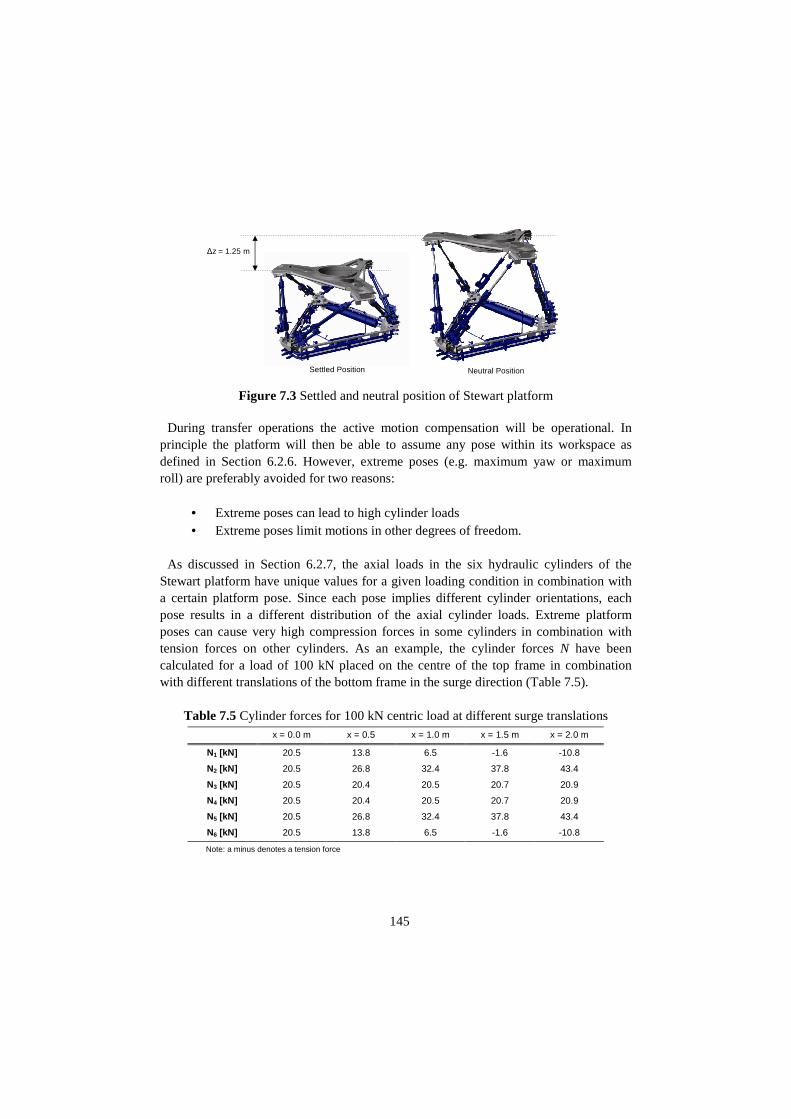
145
Figure 7.3 Settled and neutral position of Stewart platform During transfer operations the active motion compensation will be operational. In
principle the platform will then be able to assume any pose within its workspace as defined in Section 6.2.6. However, extreme poses (e.g. maximum yaw or maximum roll) are preferably avoided for two reasons:
• Extreme poses can lead to high cylinder loads • Extreme poses limit motions in other degrees of freedom.
As discussed in Section 6.2.7, the axial loads in the six hydraulic cylinders of the Stewart platform have unique values for a given loading condition in combination with a certain platform pose. Since each pose implies different cylinder orientations, each pose results in a different distribution of the axial cylinder loads. Extreme platform poses can cause very high compression forces in some cylinders in combination with tension forces on other cylinders. As an example, the cylinder forces N have been calculated for a load of 100 kN placed on the centre of the top frame in combination with different translations of the bottom frame in the surge direction (Table 7.5).
Table 7.5 Cylinder forces for 100 kN centric load at different surge translations
x = 0.0 m x = 0.5 x = 1.0 m x = 1.5 m x = 2.0 m
N1 [kN] 20.5 13.8 6.5 -1.6 -10.8
N2 [kN] 20.5 26.8 32.4 37.8 43.4
N3 [kN] 20.5 20.4 20.5 20.7 20.9
N4 [kN] 20.5 20.4 20.5 20.7 20.9
N5 [kN] 20.5 26.8 32.4 37.8 43.4
N6 [kN] 20.5 13.8 6.5 -1.6 -10.8
Note: a minus denotes a tension force
∆z = 1.25 m
Settled Position Neutral Position

146
Extreme platform poses will also limit the motions in other degrees of freedom. For example, a large yaw rotation will “reserve” a large part of the stroke length and will thus reduce the possible excursions in all other degrees of freedom. It is therefore preferred to avoid extreme platform motions. Residual motions during people transfers can then be accounted for by the free floating functions of the TAB.
For the two aforementioned reasons the total platform workspace has been limited by
the control software. Based on the maximum heave amplitude of the Ampelmann Demonstrator of 1.25 m, the maximum heave amplitude has been limited to 1.2 m to account for the cylinder buffer lengths of 5 cm. Since extensive ship motion simulations (Chapter 6) have shown that the heave motion presents the governing translation, the combined translations have been programmed to stay within a defined sphere with a radius of 1.2 metre from the platform's neutral position:
x2 + y2 + z2
≤ 1.22
Furthermore, the rotations have been programmed to be limited to the following
values: Maximum roll = +/- 10 degrees Maximum pitch = +/- 5 degrees Maximum yaw = +/- 15 degrees. The Ampelmann platform will be kept in its workspace boundaries at all times by the
control system. The workspace boundaries are shown in Figure 7.4, Figure 7.5 and Figure 7.6. The translational workspace is shown in grey and the rotational workspace is shown in blue in all three two-dimensional views.
Figure 7.4 Rotational and translational workspace boundaries in the x-y plane
x
y
R=1.2m
ψ=30°
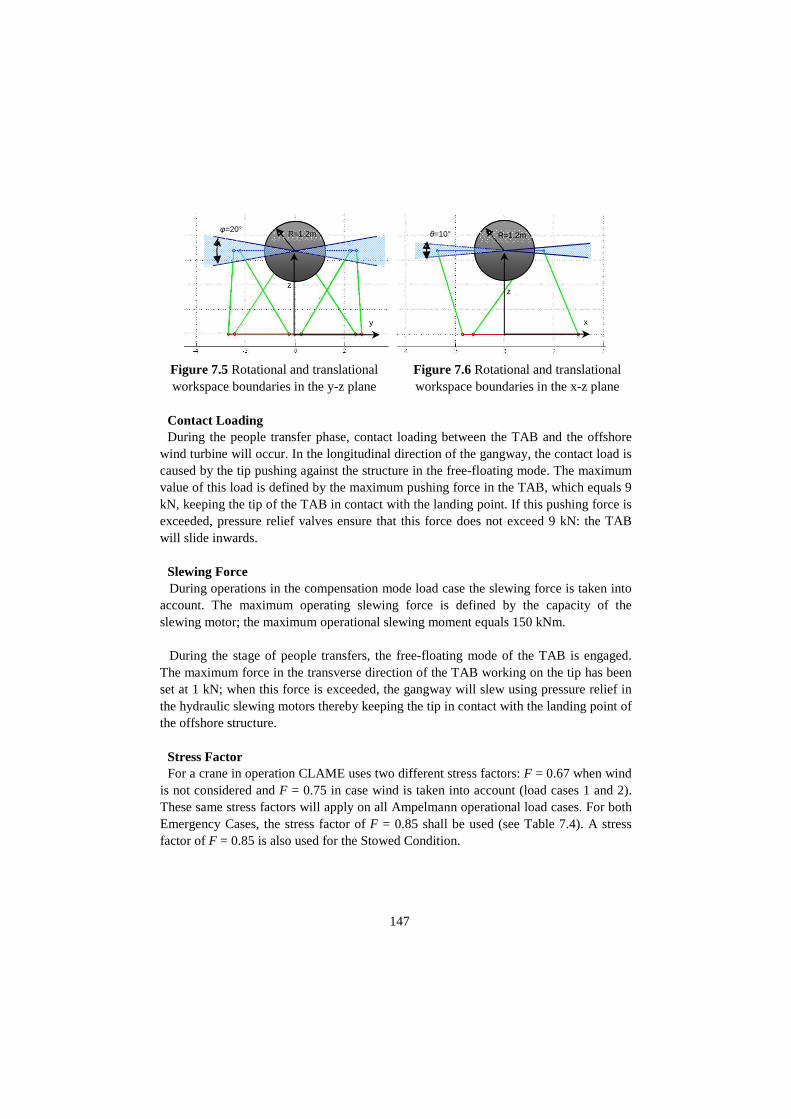
147
Figure 7.5 Rotational and translational workspace boundaries in the y-z plane
Figure 7.6 Rotational and translational workspace boundaries in the x-z plane
Contact Loading During the people transfer phase, contact loading between the TAB and the offshore
wind turbine will occur. In the longitudinal direction of the gangway, the contact load is caused by the tip pushing against the structure in the free-floating mode. The maximum value of this load is defined by the maximum pushing force in the TAB, which equals 9 kN, keeping the tip of the TAB in contact with the landing point. If this pushing force is exceeded, pressure relief valves ensure that this force does not exceed 9 kN: the TAB will slide inwards.
Slewing Force During operations in the compensation mode load case the slewing force is taken into
account. The maximum operating slewing force is defined by the capacity of the slewing motor; the maximum operational slewing moment equals 150 kNm.
During the stage of people transfers, the free-floating mode of the TAB is engaged.
The maximum force in the transverse direction of the TAB working on the tip has been set at 1 kN; when this force is exceeded, the gangway will slew using pressure relief in the hydraulic slewing motors thereby keeping the tip in contact with the landing point of the offshore structure.
Stress Factor For a crane in operation CLAME uses two different stress factors: F = 0.67 when wind
is not considered and F = 0.75 in case wind is taken into account (load cases 1 and 2). These same stress factors will apply on all Ampelmann operational load cases. For both Emergency Cases, the stress factor of F = 0.85 shall be used (see Table 7.4). A stress factor of F = 0.85 is also used for the Stowed Condition.
y
z
φ=20° R=1.2m
x
z
θ=10° R=1.2m

148
Resulting Loads The determination of all resulting loads in the different load cases has been elaborated
upon in the Ampelmann Demonstrator Basis of Design, which was used by Lloyd’s Register as the main reference document to conduct the design appraisal. The resulting loads at the centre of the top frame of the Stewart platform (the upper gimbal level) have been calculated using an extensive spreadsheet in order to enable the cylinder load calculations described in the next section. Table 7.6 shows the resulting calculated loads on the Stewart platform at the centre of the upper gimbal level for all load cases.
Normal Operation Emergency Cases
Starting/ Ending
Motion Compensation
People Transfers
Double Failure
3 Persons on tip
Stowed Condition
Fx [kN] 54 7 8 54 8 54
Fy [kN] 65 8 17 65 17 81
Fz [kN] 233 167 160 233 160 217
Mx [kNm] 494 356 344 523 388 529
My [kNm] 40 5 6 41 6 37
Mz [kNm] 121 167 31 129 33 142
7.2.5 Cylinder Buckling Check With the loading conditions defined for all load cases, a check on all structural
components and connections could be performed. Stress calculations were performed by the different manufacturers for all components in accordance with the Basis of Design. Subsequently Lloyd’s Register performed a verification of all calculations ultimately leading to a Design Appraisal Document (DAD).
Special consideration shall be given in this section to the assessment of the Stewart
platform’s six hydraulic cylinders. The cylinder rods must be checked for buckling in the different load cases. Due to the Stewart platform’s motion characteristics, different axial loads will occur in each different platform pose, in combination with specific cylinder lengths for each pose. Subsequently, all combinations of axial loads and cylinder lengths have to be checked against the buckling criterion.
Critical Buckling Force As a conservative assumption Lloyd’s Register stated that for the buckling calculations
the cylinder was to be modelled over its entire length using the properties of the cylinder rod. CLAME Ch3-2.19 to 2.21 is then used to determine the maximum allowable stress in the rod as a function of the cylinder length. The effective cylinder length corresponds to length Lk as presented in Figure 7.7. This is the length between the upper and lower gimbal points.
Table 7.6 Resulting loads at centre of upper gimbal level for the Ampelmann load cases

149
Figure 7.7 Schematic Cylinder Representation
Next, the slenderness ratio of the cylinder modelled as a rod can be determined:
kK L
sr
=
With: K = A constant which depends on the end constraint conditions of the member and is obtained from CLAME 3.2.8 [-] Lk = Effective rod length, depends on platform pose [m] r = Effective radius of gyration = √ (Irod /Arod) [m] With the cylinders being free to rotate but constrained against translation at both ends,
value K equals 1.0 for the modelled rod in accordance with CLAME table 3.2.8. Subsequently CLAME table 3.2.10 presents a table assigning a critical compressive stress σcr to the rod as a function of its slenderness, its material yield stress and a Robertson constant a. The Robertson constant accounts for the cross-sections of the rod and the axes of buckling [45]. The Ampelmann Stewart platform cylinder rods are made of C45 with a rod diameter of 90 mm. As a result, a material yield stress of 370 N/mm2
is used in combination with a Robertson constant of 5.5, which applies for rod diameters over 40 mm. The critical compressive stress σcr of the rod can now be determined as a function of the effective rod length Lk as shown in Figure 7.8.
Figure 7.8 Critical compressive stress σcr as a function of effective cylinder length Lk Subsequently the maximum allowable axial cylinder load due to buckling can be
determined for the different load cases using the following equation:
Effective cylinder length: Lk
Effective cylinder length: Lk
Cylinder rod

150
max cr rodN F Aσ= ⋅ ⋅
With: Nmax = Maximum allowable axial force in cylinder [N] F = Load case dependent stress factor [-] σcr = Critical compressive stress [N/mm2] Arod = Cross-sectional area of rod [mm2] Finally, the buckling check can be performed for each load case by applying the
resulting loads at upper gimbal level (Table 7.6) on the Stewart platform in a large amount of different poses throughout its limited workspace defined in section 7.2.4. The results are shown in Figure 7.9, where the black line represents the maximum allowable axial cylinder force; the coloured dots represent the actual cylinder forces in different platform poses with each colour representing a different cylinder and each dot representing a different platform pose. From these graphs it can be concluded that the buckling criterion of the cylinders has been met for all relevant load cases.
Figure 7.9 Cylinder buckling check in the different load cases for all platform poses within the limited workspace
Starting/Ending Compensation Mode People Transfer
Double Failure 3 Persons on Tip
Allowable buckling force as a function of cylinder length (Lcyl)
Each colour represents a cylinder; Each dot represents a platform pose
=
151
7.2.6 Fabrication Survey The certification process for lifting appliances requires that in addition to the design
appraisal, both the fabrication and functional testing of the lifting equipment is witnessed by Lloyd’s Register surveyors. The fabrication survey of the Ampelmann Demonstrator included the following scope:
1. Identification of materials against relevant mill test certificates 2. Review of welding procedures and welder qualifications 3. Review of NDE-procedures, -personnel qualifications and -reports 4. Review of test reports of the N2 pressure cylinders and the Piston Type
Accumulator 5. Monitoring of fabrication activities and inspecting of components 6. Monitoring of assembly 7. Final visual inspection of assembly 8. Witnessing of functional testing 9. Review of data book
After appropriate completion of the aforementioned activities an inspection statement
was issued (Appendix B).
7.2.7 Overload Test As an additional part of the certification process an overload test was conducted with
the Ampelmann system mounted on the deck of the Smit Bronco. This test was conducted in the harbour of Harlingen in the Netherlands. The load used was equal to 1.5 times the maximum SWL on the tip (in load case Emergency Condition - 3 Persons on Tip) resulting in a certified test load of 450kg mounted at the tip with the Telescopic Access Bridge (TAB) at its maximum outreach of 15 m. The TAB was luffed and slewed +/- 5 degrees and telescoped 1m. After completion of the test, the TAB, transfer deck and Stewart platform were visually inspected and found sound, with no deformations or defects observed. After completion of this test an inspection statement was issued (see Appendix B).
7.3 Test Phases
7.3.1 Motion Tests
Position Control on Cylinders After the Stewart platform of the Ampelmann Demonstrator was fully assembled, the
first series of motion tests was performed: position control tests on each cylinder. For these tests each cylinder was individually controlled to perform sine wave motions as shown in Figure 5.5. The first step was to verify the lookup tables as provided by the

152
valve manufacturer against logged valve control signals in combination with the resulting cylinder velocities during motions. This enabled enhancement of the lookup tables which form an important part of the valve control module. Subsequently, the proportional gain and the feed forward gain in the control system could be tuned in such a way that during the sine wave test motions the control error for each cylinder was minimized.
Figure 7.10 Preliminary set-up for valve control
After enhancement of the lookup tables and tuning of the control gains, an accurate
motion performance was achieved. However, accuracy loss occurred at the extremes of the harmonic motion, thus where the velocity changes direction. The result was a small shocking cylinder movement at the amplitude of each motion. After a thorough analysis this was found to be caused by the valve spool characteristics. The initially chosen valve had a spool with a 10% overlap as shown in Figure 7.11. The advantages of such an overlap are a more secure null position and less leakage. However, as a result such a valve also has a deadband (Figure 7.11) since zero flow is associated with a significant band of the spool position. As a consequence, reversing the flow in the cylinder requires a “jump” in the valve control signal as well as the spool position. This jump caused the small shock motion of the cylinders at the amplitude of each motion. In addition the deadband caused poor and inaccurate performance at flows around zero.
Valve
- +
Position Transducer
Sine Wave
Valve Control Signal
Valve Control
Measured Cylinder Lengths
Hydraulic pressure
Stewart platform Cylinders
HPU
Control Error
dLs dt
Proportional Gain
Feed Forward Gain
P
FF
+ +
Set Point Velocity
Lookup Table
Set Points Cylinder Length

153
Figure 7.11 Characteristics of a valve with an overlap spool
To improve the performance, it was decided to have the spools modified. The overlap
was reduced to 1.5% which is considered a critical lap (a smaller lap can cause spool instability in the null position since flow can easily leak to the A or B actuator ports). This significantly reduced the deadband. In addition the spool was machined into a progressive spool; this altered spool shape enables higher flow accuracies at small valve control signals. These alterations are shown in Figure 7.12 and led to smooth cylinder motions when reversing the flow. As a result, the shock motion of the cylinders at the amplitude of each motion was eliminated.
Figure 7.12 Characteristics of a valve with progressive spool and critical lap
Full Workspace Test Although the platform motions as defined in 7.2.4 are kept within the predefined limits
by the control system, control errors can result in poses outside of this envelope. Therefore the platform was tested in its full workspace to verify that the cylinder motions do not become physically hampered in any pose. This can occur by design flaws, for instance in the geometry of the gimbals, or insufficient length of the hydraulic hoses. To this extent all cylinders were fully extended, first individually and later in different combinations. An example of one of the workspace tests is shown in Figure 7.13.
Flow
Valve control signal
Deadband
Overlap
Pressure In
A B
Flow
Valve control signal
Reduced deadband
Critical lap
Pressure In
A B
Progressive spool
Enhanced flow accuracy at small flows

154
Figure 7.13 Workspace test
6DoF test In the high speed controller, the kinematic calculation module calculates the required
cylinder lengths based on the desired relative translations and rotations between the Stewart platform’s top and bottom frame. This module was programmed based on the theories as described in Chapter 6. To test this module and the actual resulting motion performance of the Stewart platform, the upper frame of the platform was commanded to perform surge, sway, heave, roll, pitch and yaw motions, individually and in different combinations as well as at various frequencies. The proper functioning of this module was checked visually by observing all platform motions.
7.3.2 Redundancy Tests In accordance with the fail-operational reliability format as defined in 5.2 the system
was designed and built to have all critical non-structural components redundant. This resulted in the system set-up presented in Figure 7.14 (shown previously in Chapter 5). All of the critical functions were tested on their redundant behaviour by putting a single component out of order and record that the Ampelmann automatically calls upon its installed redundant component. Meanwhile, the entire system has to continue functioning safely and without any noticeable effect for the predefined period of time.

155
Figure 7.14 Final set-up for redundant motion control
Position transducers The position transducers form an essential part of the motion control loop, since the
measured cylinder lengths are continuously required to enable control of the cylinder behaviour. The redundancy of the six main measuring units, which are placed inside each cylinder, was achieved by installing an additional external position transducer on each cylinder. At the start of each operation, when the platform is in safe mode and all cylinders are retracted, the High Speed Controller (HSC) automatically checks whether all transducers detect the cylinders at their minimum length. To account for the occurrence of possible noise peaks low-pass filters and rate limiters were included in the control system, resulting in a smooth an accurate position signal. If a wire would break, this is immediately detected by the HSC which directly switches its input signal to the external transducer of the relevant cylinder. This safety procedure was tested during platform motions by disconnecting the internal position transducer. The broken wire was immediately detected and the switch was made correctly to the back-up transducer. The effects on the platform motions were negligible.
Valves In compliance with the safety philosophy, two valves were installed on each cylinder.
During operation, both valves receive the voltage necessary to perform the desired motion, but only one valve per cylinder is enabled by the Programmable Logic Controller (PLC), thus only one valve is operational at any time. When a valve is enabled by the PLC and receives correct power supply, this valve returns a Valve Ready signal to the PLC. When the power supply of the first valve fails, it will stop functioning (the spool returns to its centred null position using springs) and the Valve Ready signal
Valve
Ship Motions
Valve Control Signal
Measured Cylinder Lengths
Stewart platform Cylinders
Octans
Octans
High Speed Controller
Position Transducer
Valve
Redundant Units
PLC
Valves OK
HPU
Hydraulic pressure
HPUs OK
HSCs OK
PTA
Control Panel
Secondary Panel
Platform commands

156
is stopped by the valve. When this Valve Ready signal stops, the PLC is triggered to perform a valve switch: the other valve is directly enabled and takes over the full motion control. This procedure was tested by disconnecting the power supply of the first valve during platform motions. This redundancy was tested successfully: the valve switch procedure is so fast that it was difficult to notice it visually.
Another trigger for a valve switch is the position error logic signal. Each valve
monitors its own spool position during operation by comparing the spool position to the expected position related to the valve voltage signal. This is to detect stick slip due to particles in the hydraulic oil. If the spool position has an error of over 30% for longer than 490 ms, the position error logic output signal is set to low and the PLC switches to the redundant valve using the enable signals.
Hydraulic Power Units The hydraulic power unit (HPU) was made redundant by using two units, each with
enough capacity to actuate the entire Ampelmann system. Both units run simultaneously during operation; if one unit stops, the operation can continue without any effects. The PLC will detect the stopping of a HPU and will trigger a “code orange” since redundancy is lost. This was tested successfully and in addition both HPUs were stopped to test the functionality of the Piston Type Accumulator (PTA). This proved that the 300 litres of pressurized hydraulic oil inside the PTA allow for at least 30 seconds of platform motions after both HPUs are stopped.
High Speed Controller During the redundancy tests, two high speed controllers were used: one as the master
and the other as the slave controller. The master controller was continuously monitored by the PLC using a live signal. As soon as this signal was low, the PLC would make a switch to reroute all input and output signals to the slave controller. This set-up was tested during platform motions by simply turning off the master controller. However, this procedure caused the platform to make a sudden shock motion which is considered unacceptable during operations. Analysis of the switch procedure revealed the cause of this shock motion: when the master controller is switched off, it takes a small time interval (some milliseconds) for the live signal to drop under the threshold for the PLC to consider it as a low signal. After this interval, a switch has to be made for the valve signal from the master controller to the slave controller output, which also takes some time. In this time, a random analogue signal is sent from the shut down master controller to the valves, resulting in random cylinder behaviour for a period of around 20 ms: enough to cause a shock motion. After this shock, when the switch has been completed, the platform returns to the normal motion path.
157
After this test it was concluded that having the two high speed controllers in the system set-up as previously described, resulted in a less safe situation than having only one controller since the reliability of the high speed controller was considered to be much higher than the reliability of the physical switch. It was therefore decided to adjust the system set-up by adding a processor to the overall control system that functions as a “watchdog”: it monitors the functioning of the high speed controller and sends the platform to its safe mode in case the controller stops. This adjustment is discussed later in this document.
Programmable Logic Controller For the Ampelmann prototype, a set of 2 PLCs have been used which are
commercially available as a redundant pair and are commonly used in safety-critical applications. They work according to the master/slave concept with the slave on hot stand-by. A number of integrity signals from each PLC are continuously monitored by the other PLC. In case the master PLC fails, the slave PLC immediately takes over all functions. This redundancy has been tested by switching off the master PLC during platform motions. The platform motions continued normally and no effect was observed.
Octans With the Octans being the main source of data used for motion compensation, having a
redundant Octans was a logical step. However, having two Octans systems connected to the same HSC immediately created signal errors, with sudden peaks appearing randomly in the motion data received from both sensors. Simultaneous logging directly from both Octans systems revealed that this error was not coming from the Octans data. Although the exact reason for these odd errors was not found, the suspicion is an overflow in the high speed controller buffering: while using only one Octans in combination with data logging in the high speed controller, the same random peaks appeared. It was concluded that it was safer to have an additional processor with a “watchdog” function monitoring the Octans functions, similar to the monitoring of the high speed controller.
Adapted system configuration After the first series of redundancy tests, the system set-up was adjusted as shown in
Figure 7.15, with the Octans and HSC non redundant. Instead, a dedicated watchdog processor was integrated to monitor the critical functions of both the Octans and the HSC. As soon as a failure is detected through either the HSC live signal, the Octans data flow check or the Octans system check, the watchdog overrides the valve signals by first fading them to 0 Volt and subsequently reducing them to the safe mode voltages causing the platform cylinders to retract at a pre-programmed speed to have the Ampelmann system arrive in its settled position.
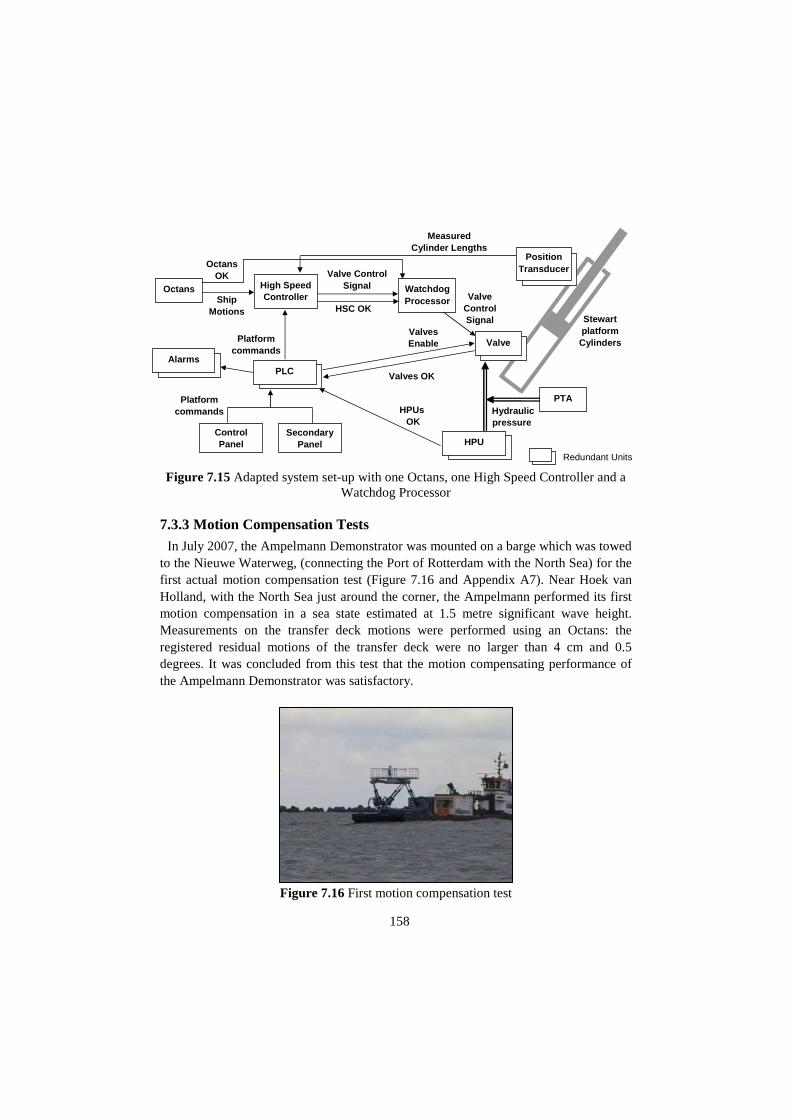
158
Figure 7.15 Adapted system set-up with one Octans, one High Speed Controller and a Watchdog Processor
7.3.3 Motion Compensation Tests In July 2007, the Ampelmann Demonstrator was mounted on a barge which was towed
to the Nieuwe Waterweg, (connecting the Port of Rotterdam with the North Sea) for the first actual motion compensation test (Figure 7.16 and Appendix A7). Near Hoek van Holland, with the North Sea just around the corner, the Ampelmann performed its first motion compensation in a sea state estimated at 1.5 metre significant wave height. Measurements on the transfer deck motions were performed using an Octans: the registered residual motions of the transfer deck were no larger than 4 cm and 0.5 degrees. It was concluded from this test that the motion compensating performance of the Ampelmann Demonstrator was satisfactory.
Figure 7.16 First motion compensation test
Ship Motions
Valves OK
HPUs OK
HSC OK
Control Panel
Secondary Panel
Valve
Valve Control Signal
Measured Cylinder Lengths
Stewart platform Cylinders
Position Transducer
Valve
Redundant Units
HPU
Hydraulic pressure
PTA
Platform commands
Watchdog Processor
Platform commands
Valves Enable
Valve Control Signal
High Speed Controller
Octans
Octans OK
Alarms
PLC

159
7.3.4 Operational tests
Operation and Emergency Simulation For the final test of the Ampelmann Demonstrator, a person was to access an offshore
wind turbine from a vessel using the Ampelmann system. Before performing such a test, however, the operational procedure of personnel transfer was extensively tested onshore first. To this extent a full scale dummy wind turbine boat landing with ladder was assembled, copied from a typical offshore wind turbine (Figure 7.17). An inherent advantage of the Ampelmann system is that its Stewart platform can function as a ship motion simulator. The transfer deck could thus be controlled to perform pre-described ship motions simulating the situation of the transfer deck when the Ampelmann is disengaged. Motion compensation could also be simulated, either by keeping the platform steady in its neutral position, or by creating the expected residual motions like recorded during the outdoor tests in July 2007.
This test set-up, shown in Figure 7.17, enabled simulating the entire operational
sequence of transferring a crew from the deck of a vessel to the Ampelmann transfer deck, positioning the gangway against the turbine boat landing and transferring people to the dummy offshore wind turbine ladder. This onshore test configuration also served as the main training facility for Ampelmann operators.
Figure 7.17 Operation simulation with full scale dummy boat landing In addition to the operation simulations, emergencies were also simulated by manually
creating a failure in one of the critical components, for instance by disconnecting a valve’s power supply or a position transducer. This way the Ampelmann system could be tested on its operational continuation and the Ampelmann Safety Monitoring System (ASMS) could be tested as well. Any loss of redundancy should send the ASMS into a code orange, which becomes a code red after a pre-determined time interval if the

160
operator fails to finish the operation himself. Also, the functioning of the watchdog was successfully tested: a shutdown of either the Octans or the HSC gently sent the Ampelmann Stewart platform to a safe mode with all cylinders retracted. In addition, the gangway and free-floating functions of telescoping, luffing and slewing were found to passively follow the different transfer deck motions.
Offshore Access Test The final operational test was performed in December 2007 at the Offshore Windpark
Egmond aan Zee (OWEZ). For this test the Ampelmann system was mounted on the deck of the Smit Bronco, a 25 m tug boat. A crew was transferred to and from an offshore wind turbine in a safe, fast and easy way (Figure 7.18). Unfortunately for this test, the wave conditions were mild during this test: the significant wave height did not exceed 0.5 m. Nevertheless, this test proved the operational procedure of the system including personnel transfer. With this first operational test, the design and development of the Ampelmann Demonstrator had been completed, although after this test some alterations were made to the system to enhance its safety and performance as described in the next chapter. Nevertheless, motion compensation and safe transfers of personnel were still to be proved in wave conditions with a significant wave height of 2.5 m.
Figure 7.18 First operational test
7.4 Evaluation The objective of the presented certification work and tests in this chapter was to prove
the safety of all of the Ampelmann system’s critical components and ultimately prove its main functionality, which is to provide safe access to offshore wind turbines by motion compensation. A separation has been made between structural and non-structural items of the Ampelmann system’s critical components. The safety of the

161
system was proven through a certification process and redundancy tests, while the functionality was confirmed by operational tests.
Certification The safety of all critical structural components has been achieved by proper design and
proper fabrication. Both the design and fabrication of all structural components was verified through independent assessment by Lloyd’s Register, who also witnessed an overload test. The design appraisal, however, proved to be a challenging task since no specific regulations existed to verify the Ampelmann Demonstrator design. Based on Lloyd’s Register’s Code for Lifting Appliances in a Marine Environment, a set of load cases has been developed specifically focused on the Ampelmann purpose and operational procedure. These load cases were agreed with Lloyd’s Register, who ultimately issued a full certification of the entire structural design.
Redundancy Tests In accordance with the fail-operational safety philosophy all critical non-structural
components were installed redundantly. The correct functioning of these components is constantly being monitored by the Ampelmann Safety Management System (ASMS); failures are therefore detected immediately and the failure is to be isolated while the back-up component directly takes over the task. In two cases redundancy proved to create undesired effects. In the case of the High Speed Controller (HSC) a switch could not be made fast enough to its back-up unit, thereby causing an unacceptable shock motion during this switch. When the back-up Octans was installed, the data integrity was compromised, probably by a buffer overload. For both cases a solution was found by using a dedicated processor as a watchdog to independently monitor the functions of the HSC and Octans. In case the watchdog monitors a failure, the platform is set in safe mode. It is noted that this was only a temporary solution; the arrangement was later altered to enable the originally envisaged hardware architecture, including two HSCs and two Octans (as will be described in the next chapter). After all other redundancies were tested satisfactorily, the Ampelmann Demonstrator was considered ready to be tested in operation.
Operational Tests As a final Ampelmann safety aspect the risk of human errors had to be addressed. To
prevent such errors, the operational procedure had to be flawless. For this, first the Ampelmann was tested on its motion compensation capacity, where it proved its compensating capacities in a sea state with a significant wave height of 1.5m. Subsequently, the entire operational procedure was tested onshore using a dummy landing zone based on an offshore wind turbine’s boat landing and ladder. This allowed training operators for the entire procedure including positioning the tip against the
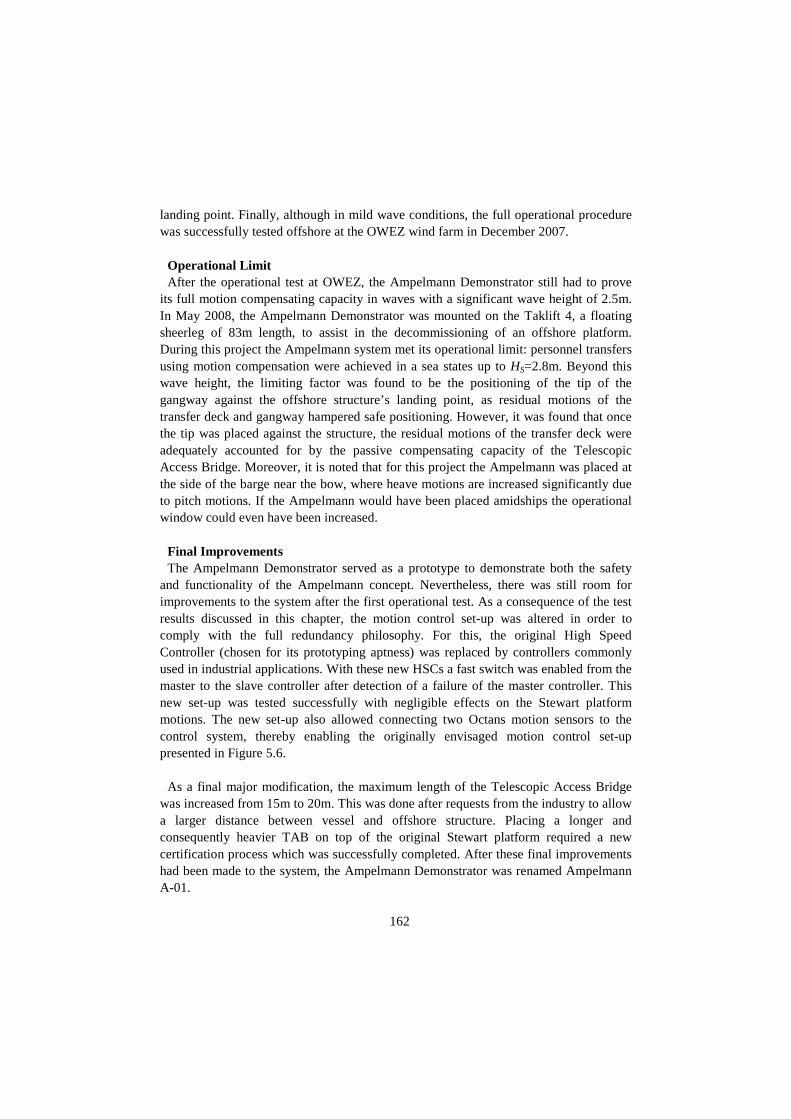
162
landing point. Finally, although in mild wave conditions, the full operational procedure was successfully tested offshore at the OWEZ wind farm in December 2007.
Operational Limit After the operational test at OWEZ, the Ampelmann Demonstrator still had to prove
its full motion compensating capacity in waves with a significant wave height of 2.5m. In May 2008, the Ampelmann Demonstrator was mounted on the Taklift 4, a floating sheerleg of 83m length, to assist in the decommissioning of an offshore platform. During this project the Ampelmann system met its operational limit: personnel transfers using motion compensation were achieved in a sea states up to HS=2.8m. Beyond this wave height, the limiting factor was found to be the positioning of the tip of the gangway against the offshore structure’s landing point, as residual motions of the transfer deck and gangway hampered safe positioning. However, it was found that once the tip was placed against the structure, the residual motions of the transfer deck were adequately accounted for by the passive compensating capacity of the Telescopic Access Bridge. Moreover, it is noted that for this project the Ampelmann was placed at the side of the barge near the bow, where heave motions are increased significantly due to pitch motions. If the Ampelmann would have been placed amidships the operational window could even have been increased.
Final Improvements The Ampelmann Demonstrator served as a prototype to demonstrate both the safety
and functionality of the Ampelmann concept. Nevertheless, there was still room for improvements to the system after the first operational test. As a consequence of the test results discussed in this chapter, the motion control set-up was altered in order to comply with the full redundancy philosophy. For this, the original High Speed Controller (chosen for its prototyping aptness) was replaced by controllers commonly used in industrial applications. With these new HSCs a fast switch was enabled from the master to the slave controller after detection of a failure of the master controller. This new set-up was tested successfully with negligible effects on the Stewart platform motions. The new set-up also allowed connecting two Octans motion sensors to the control system, thereby enabling the originally envisaged motion control set-up presented in Figure 5.6.
As a final major modification, the maximum length of the Telescopic Access Bridge
was increased from 15m to 20m. This was done after requests from the industry to allow a larger distance between vessel and offshore structure. Placing a longer and consequently heavier TAB on top of the original Stewart platform required a new certification process which was successfully completed. After these final improvements had been made to the system, the Ampelmann Demonstrator was renamed Ampelmann A-01.

163
8. Conclusions and Outlook
8.1 Conclusions
8.1.1 Introduction The development of the Ampelmann from initial idea into a fully functional prototype
presented many challenges. The most prominent were: (1) prove the concept of active motion compensation in all six degrees of freedom by means of scale model tests and (2) build a prototype, the Ampelmann Demonstrator, to prove its ability of providing safe access to offshore wind turbines. The prototype has been developed with a strong emphasis on the inherent safety of the system: the transfer system has been designed to be fail-operational. The Ampelmann Demonstrator system’s critical safety features have been addressed and assessed through four main functional requirements:
• Stewart platform motion range • Stewart platform motion integrity • Safe operational procedure • Structural integrity.
8.1.2 Scale Model tests The basic Ampelmann principle has been defined as the compensation of motions of a
transfer deck on a vessel moving in six degrees of freedom by combining Stewart platform technology with advanced motion measurement. Proving this principle required performing a series of tests for which a small sized platform was used and which was connected to a motion sensor through a host computer with custom made software.
These tests demonstrated that both a motion sensor and a Stewart platform can be fast
and accurate enough to keep a transfer deck nearly motionless on a moving underground. The test results led to the conclusion that for the frequencies of interest motion compensation in six degrees of freedom is technically feasible provided that a drift free motion sensor is used and signal filtering in the software is properly adjusted. The results also justified the next step of this research: building a full-scale Ampelmann prototype.
8.1.3 Stewart Platform Motion Range To increase the accessibility of offshore wind turbines, it was concluded that the
Ampelmann system should enable safe transfers in sea states with a significant wave

164
height of 2.5m. For this, the Stewart platform requires a motion range large enough to provide sufficient motion compensation of the transfer deck during mentioned sea states.
The motion range of a Stewart platform relates directly to its six architecture
parameters; the extreme forces in the platform cylinders within this motion range (for a given load case) are also related to these architecture parameters. To come to an appropriate Stewart platform architecture for an Ampelmann system, its architecture parameters have been varied to create a large set of different architectures, enabling assessment of the motion range and extreme cylinder forces (preferably minimized for cost reduction) of the different architectures. For each architecture the minimum dexterity throughout the entire motion range must be calculated to verify that no singularity occurs. The value of the minimum dexterity also enables a good qualitative assessment of the different architectures: the lowest values are associated with small motion ranges combined with high cylinder forces. Omitting the platforms with the lowest minimum dexterities is a fast method to reach a shortlist of the most apt architectures. Ultimately, the designer can make a trade-off between a platform with a large motion range and a platform with low extreme cylinder forces. For the Ampelmann Demonstrator the architecture with the largest heave motion range was selected.
In a given sea state, the required motion range for sufficient motion compensation by
the Ampelmann system depends highly on the vessel type, the location of the Ampelmann on deck of this vessel and the incoming wave direction. The workability limit of the Ampelmann Demonstrator must therefore be stated for specific cases and can be calculated using the results of vessel motion simulations.
8.1.4 Stewart Platform Motion Integrity No single component failure may hamper the operational procedure of the
Ampelmann; therefore the system had to be designed in accordance with a fail-operational reliability regime. To achieve such reliability it has been concluded that all non-structural critical components have to be installed redundantly to ensure the integrity of the Stewart platform motions.
It proved to be feasible to arrive at a set-up for the entire Ampelmann motion control
architecture that is fail-operational, thus allowing the operational procedure to continue normally for at least 60 seconds after any single component failure. Nevertheless, it is imperative to verify the proper functioning of a redundant configuration: an extensive series of tests performed on the Ampelmann Demonstrator revealed that the redundant set-up of some components led to unpredictable undesired effects. This was remedied

165
later by using components especially apt for the purpose of redundancy. Thus in addition to the selection of appropriate components for a redundant configuration, performing failure tests is a must.
8.1.5 Safe Operational Procedure A purpose-built gangway is crucial for safe and easy access from the Ampelmann
transfer deck to an offshore wind turbine; a Telescopic Access Bridge (TAB) was therefore custom-made for this project. To position the TAB against the landing point on an offshore structure the TAB should be equipped with motion control in three degrees of freedom: slewing, luffing and telescoping. By having these three degrees of freedom go into a free-floating mode after the tip contacts the structure, residual motions of the transfer deck can be allowed for with no additional risks.
The Ampelmann Safety Management System (ASMS) has been developed to monitor
all motion system functionalities and switch to a back-up component in case of a component failure. In such case, a safety procedure is engaged by the ASMS, allowing the operator to finish the transfer operation within one minute before automatically ending the operation, while warning the operator (first minute) and personnel (after first minute) using audible and visual alarms. After extensively testing the operational and safety procedures of the Ampelmann Demonstrator it was concluded that the proposed operational procedure yields a safe and easy transfer routine, whereas the selected safety procedure provides sufficient time to abort the operation safely at any point in time.
8.1.6 Structural Integrity All of the Ampelmann Demonstrator’s critical structural components had to be
designed and manufactured properly to withstand the ultimate loading conditions. This presented a practical problem since no specific design codes existed for the design appraisal of a system such as the Ampelmann. It proved to be possible, however, to specifically outline load cases for the Ampelmann system by thoroughly assessing the different stages within the operational procedure and accounting for the emergency cases.
8.1.7 Design Inclusive Research Due to the nature of this thesis it was considered imperative to include design activities
in the research in order to check whether all stated sub-objectives had been met and to develop new knowledge. The applied design inclusive research approach was first manifested in the safety-based system design to gain insight in the viability of a fail-operational system set-up. Secondly, the dedicated design of the Ampelmann Stewart platform was necessary to reach an architecture apt for the required vessel motion compensation, thereby integrating the fields of research of ship motions and Stewart

166
platforms. Finally the design of the Ampelmann Demonstrator’s structural components was used for verification of the structural integrity against the load cases developed specifically for the Ampelmann system. All three design actions combined contributed to the development of the Ampelmann Demonstrator, the testing of which in turn facilitated the validation of these design actions.
Within this research the most prominent design action was designing the architecture
of the Ampelmann Stewart platform. Three design methods have been studied which have all lead to valuable conclusions. The vessel motion based design method created insight in the influence of both vessel length and the location of the Ampelmann on the vessel deck on the required cylinder lengths. Although this method will be useful when designing an Ampelmann system for a known dedicated host vessel, this research was specifically focussed on creating an Ampelmann system to be used for a wide range of vessels; therefore other design methods were examined. A platform design method based on the scaling of an existing platform architecture proved to give a good starting point to yield a platform with a large workspace while avoiding singularities. Nevertheless, optimization of the platform (i.e. increase of workspace and decrease of maximum cylinder forces) can still be achieved by alteration of the design parameters. The design procedure which led to the architecture applied in the Ampelmann Demonstrator Stewart platform was based on assuming a cylinder stroke of 2 metres while having all other design parameters variable during the design process for optimization of both workspace and cylinder loads.
With this stroke based design process a final Stewart platform architecture was
reached which met all predefined requirements. However, for this Ampelmann design to achieve full motion compensation in sea states with a significant wave height of 2.5 metres it has to be mounted on a vessel with a length of 50 metres or more. If a smaller vessel is used the workability will be reduced since the use of smaller vessels will generally result in larger motions. For this research, this has been accepted: the limited deck space of a 25 metre vessel does not allow for an Ampelmann footprint larger than the predefined 6 by 6 metres. And although vessels of over 50 metres in length may allow for a larger footprint, in practice it is found that deck space is always scarce and therefore the chosen footprint is considered convenient, also for larger vessels. As a final conclusion, it can be stated that further optimization of the Stewart platform architecture could have been possible if the final exact design loads would have been known at forehand. However, these loads are mainly caused by the dead weight of the platform, which in turn was determined by the result of the component design. This shows that design inclusive research has been inevitable for a process as presented in this thesis.

167
Overall, the design included in this research facilitated the validation of the hypothesis stated in 2.5.3, that the combined technologies of a Stewart platform and a motion sensor enable compensating wave induced vessel motions in six degrees of freedom. This is an addition to scientific knowledge in the field of active motion compensation and opens doors for other Stewart platform applications on vessels.
8.1.8 Main Research Objective The main objective of this thesis was to prove that an Ampelmann system can, in a
safe manner, significantly increase the accessibility of offshore wind turbines when compared to presently used systems. The significant increase in accessibility was quantified in this study by proving that the Ampelmann Demonstrator could safely perform personnel transfers in sea states with a significant wave height of 2.5m. To address the safety aspect of this objective, the development of both, the system design and the operational procedure were safety-based. The resulting system, the Ampelmann Demonstrator, has been validated through an extensive series of tests as well as through a certification scheme. It can be concluded from the findings of this work that the required safety demands have been met both in theory and in practice. Concerning the increase in accessibility, computer simulations and at a later stage operational offshore experience have proven that safe personnel transfers are feasible in sea states with a significant wave height of at least 2.5m.
8.2 Outlook
8.2.1 Status by the Summer of 2010 After an offshore transfer demonstration at OWEZ, some final alterations were made
to the Ampelmann Demonstrator, the most prominent ones being the reinstatement of the fully redundant motion control set-up and the installation of a longer gangway. This enhanced version of the Ampelmann Demonstrator was named A-01; the second Ampelmann system named A-02 was built in 2009. During the first half of 2010, Ampelmann systems A-03 and A-04 were constructed. All four Ampelmann systems are commercially available and have been applied in different offshore projects. Amongst these projects are the decommissioning of an offshore platform (Figure 8.1 and Appendix A8), where motion compensation was achieved in sea states up to HS=2.8m, and the installation of transition pieces of offshore wind turbines (Figure 8.2). By the summer of 2010, the four Ampelmann systems have jointly provided over 25.000 personnel transfers to more than 100 offshore structures from over 15 different vessels in projects off the coast of four different continents.
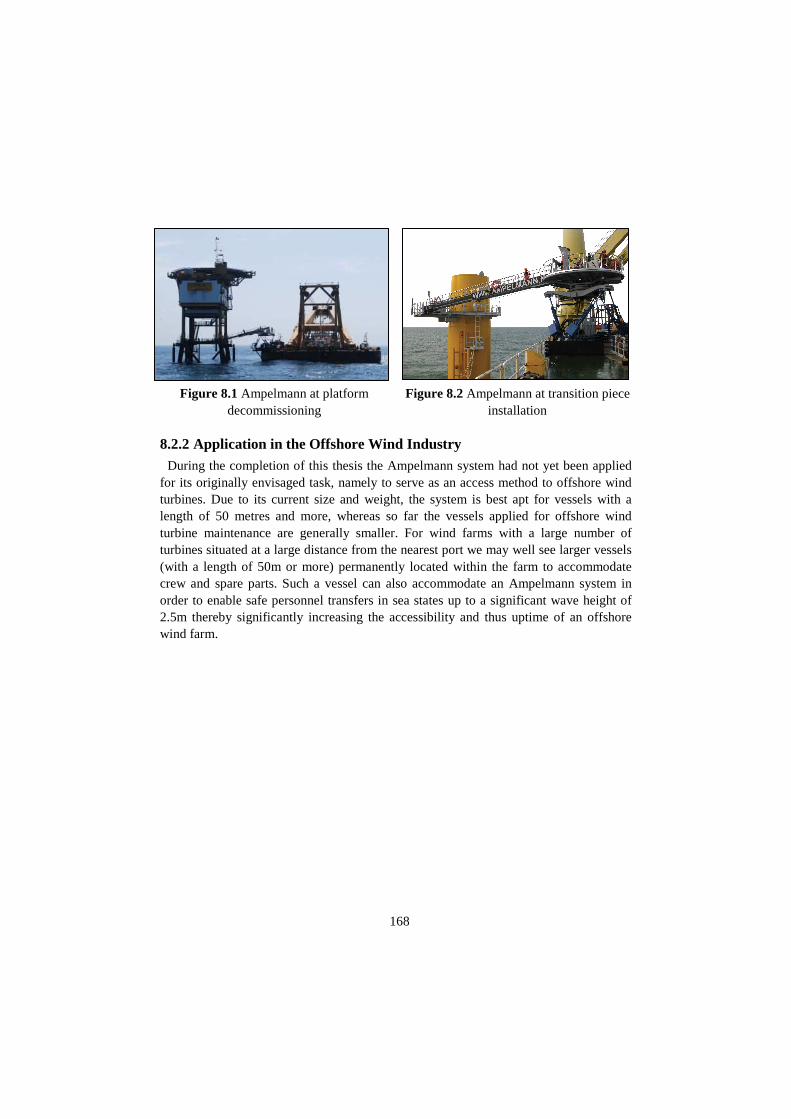
168
8.2.2 Application in the Offshore Wind Industry During the completion of this thesis the Ampelmann system had not yet been applied
for its originally envisaged task, namely to serve as an access method to offshore wind turbines. Due to its current size and weight, the system is best apt for vessels with a length of 50 metres and more, whereas so far the vessels applied for offshore wind turbine maintenance are generally smaller. For wind farms with a large number of turbines situated at a large distance from the nearest port we may well see larger vessels (with a length of 50m or more) permanently located within the farm to accommodate crew and spare parts. Such a vessel can also accommodate an Ampelmann system in order to enable safe personnel transfers in sea states up to a significant wave height of 2.5m thereby significantly increasing the accessibility and thus uptime of an offshore wind farm.
Figure 8.1 Ampelmann at platform decommissioning
Figure 8.2 Ampelmann at transition piece installation
169
References [1] World Wind Energy Association (2009) World Wind Energy Report 2008 [2] European Wind Energy Association (2005) Prioritising Wind Energy
Research – Strategic Research Agenda of the Wind Energy Sector [3] European Wind Energy Association (2009) Wind Energy - The Facts [4] Efiong, A. and Crispin, A. (2007) Wind turbine manufacturers; here comes
pricing power, Merrill Lynch, United Kingdom [5] Boccard, N. (2008) Capacity Factor of Wind Power – Realized values vs.
Estimates, paper, University of Gerona [6] Obdam, T., Rademakers, L., Braam, H. and Eecen, P. (2007) Estimating
Costs of Operation & Maintenance for Offshore Wind Farms, Energy research Centre of the Netherlands, the Netherlands
[7] Rademakers, L., Braam, H., Zaaijer, M., and Bussel, G. van (2003) Assessment and Optimisation of Operation and Maintenance for Offshore Wind Turbines, the Netherlands
[8] Rademakers, L, and H. Braam (2002) O&M Aspects of the 500 MW Offshore Wind Farm at NL7 – Baseline Configuration, DOWEC 10080 rev 2
[9] Rademakers, L, and H. Braam (2003) O&M Aspects of the 500 MW Offshore Wind Farm at NL7 – Optimization Study, DOWEC 10090 rev 1
[10] Bussel, G. van and W. Bierbooms (2003) The DOWEC Offshore Reference Windfarm: analysis of transportation for operation and maintenance, Wind Engineering Volume 27, No. 5, p 381-392
[11] Haake, T. (2002) The 25m SWATH@A&R Windpark Tender – A Safe Way for Transfer of Service personnel to Offshore Windmills, Germany
[12] International Association of Oil & Gas Producers (2005-2008) Safety Performance Indicators – 2005-2008 data
[13] Det Norske Veritas (2010) Access to offshore wind facilities – What can we learn from other industries?, BWEA Health & Safety 2010 Conference
[14] Journée, J. and Massie, W. (2001) Offshore Hydromechanics, Delft University of Technology
[15] www.golfklimaat.nl (2009) [16] Albers, P.S. (2010) Motion Control in Offshore and Dredging, Springer
Verlag, Germany. ISBN 978-90-481-8802-4 [17] Wouts, R. (2004) Keeping an even keel, Cranes Today, February p 34-37 [18] www.stable.no (2009) [19] Tempel, J. van der, Molenaar, D-P., Mulder, H., Cerda Salzmann, D. and
Hoonings, S. (2006) Vaartuig voor het overzetten van personen of goederen op een offshoreconstructie, Patent NL20041027103 20040924

170
[20] Horváth, I. (2008) Differences between ‘research in design context’ and ‘design inclusive research’ in the domain of industrial engineering, Journal of Design Research, Vol. 7, No. 1 p 61-83
[21] iXSea (2008) Octans User Guide [22] Stewart, D. (1965) A Platform with Six Degrees of Freedom, UK Institution of
Mechanical Engineers Proceedings 1965-66, Vol 180, Pt 1, No 15 [23] Cappel, K. (2006) Motion Simulator,US patent No. 3,295,224 [24] Garnsworthy, J. and Bell, P. (2004) What can the medical device industry
teach us about safety [25] Dankelman, J. (2006) Personal communication [26] Theunissen, E. (2006) Personal communication [27] Theunissen, E. (2006) Avionics, Lecture Notes, Delft University of
Technology [28] Johnson, L. (1992) DO-178B, "Software Considerations in Airborne Systems
and Equipment Certification" [29] Joint Aviation Authorities (1994) Joint aviation requirements, JAR-25, Large
aeroplanes, Cheltenham: Civil Aviation Authority [30] Vestal, S. (2005) Real Time and Embedded Systems, Lecture Notes, University
of Minnesota [31] Baleani, M., Ferrari, A., Mangeruca, L., Sangiovanni-Vincentelli, A., Peri,
M., and Pezzini S. (2003) Fault-Tolerant Platforms for Automotive Safety-Critical Applications
[32] X-By-Wire Team (1998) X-By-Wire, Safety Related Fault Tolerant Systems in Vehicles
[33] Ma, O. and Angeles, J. (1991) Architecture Singularities of Platform, Proceedings of the 1991 IEEE International Conference on Robotics and Automation
[34] Advani, S.K, The Kinematic Design Of Flight Simulator Motion-Bases, PhD Thesis, Delft University of Technology, 1998. ISBN 90-407-1672-2
[35] Waldron, KJ and Kinzel, G.L. (2004) Kinematics, Dynamics and Design of Machinery, John Wiley & Sons, Inc., United States of America,. ISBN 0-471-24417-1
[36] Dasgupta, B. and Mruthyunjaya, T.S. (1999) The Stewart platform manipulator: a review, Mechanism and Machine Theory 35 (2000) 15-40, Elsevier Science Ltd.
[37] Hughes, N.H. (2008) Quaternion to Euler Angle Conversion for Arbitrary Rotation Sequence Using Geometric Methods, Braxton Technologies, Colorado
[38] Innocenti, C. (2001) Forward Kinematics in the Polynomial Form of the General Stewart Platform, ASME Vol. 123, 254-260
[39] Vugts, J.H. (2001) Handbook of Bottom Founded Offshore Structures, Lecture notes, Delft University of Technology
171
[40] Holthuijsen, L.H. (2007) Waves in Oceanic and Coastal Waters, Delft University of Technology, Cambridge University Press. ISBN-13- 978-0-521-86028-4
[41] Göbel, A.J. (2006) Simulation of Ship Motions and Probabilistic Design of Ampelmann Platforms, Delft University of Technology
[42] Hughes, S.A. (1985) Directional Wave Spectra Using Cosine-Squared and Cosine 2S Spreading Functions, Coastal Engineering Technical Note, Mississippi
[43] Perez, T. (2005) Ship Motion Control, Springer-Verlag London Ltd. [44] Lloyd’s Register (2008) Code for Lifting Appliances in a marine Environment,
July 2008 [45] Topping, B.H.V. (1998) Advances in civil and structural engineering
computing for practice, Civil-Comp Press

172

173
Appendix A: Videos Appendix A1: IMU Test A short video of a test executed to measure the performance of an IMU motion sensor
can be downloaded at www.ampelmann.nl/appendices.
Appendix A2: 6DoF Joystick Test A short video of a visual motion test with the Octans motion sensor used as a 6DoF
"joystick" to move the MMS can be downloaded at www.ampelmann.nl/appendices.
Appendix A3: Scale Model Dry Test A short video of the dry test with the Ampelmann scale model can be downloaded at
www.ampelmann.nl/appendices.

174
Appendix A4: Scale Model Resonance A short video of the resonance that occurred during the Ampelmann scale model wet
tests can be downloaded at www.ampelmann.nl/appendices.
Appendix A5: Scale Model Wet Test A short video of a wet test with the Ampelmann scale model can be downloaded at
www.ampelmann.nl/appendices.
Appendix A6: Resonance Simulation A short video of the resonance simulated in Simulink can be downloaded at
www.ampelmann.nl/appendices.

175
Appendix A7: First Motion Compensation Test A short video of the motion compensation test of the Ampelmann Demonstrator can be
downloaded at www.ampelmann.nl/appendices.
Appendix A8: Ampelmann During Operation A short video of the Ampelmann Demonstrator during an operational procedure can be
downloaded at www.ampelmann.nl/appendices.

176
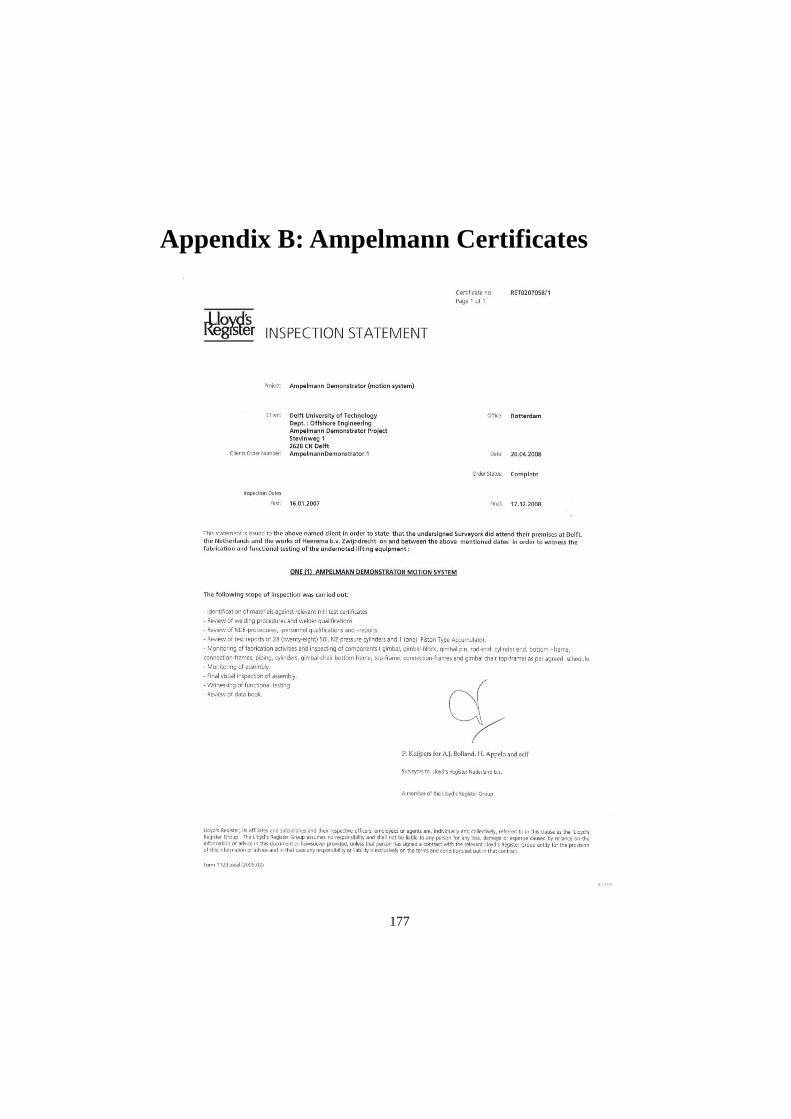
177
Appendix B: Ampelmann Certificates

178
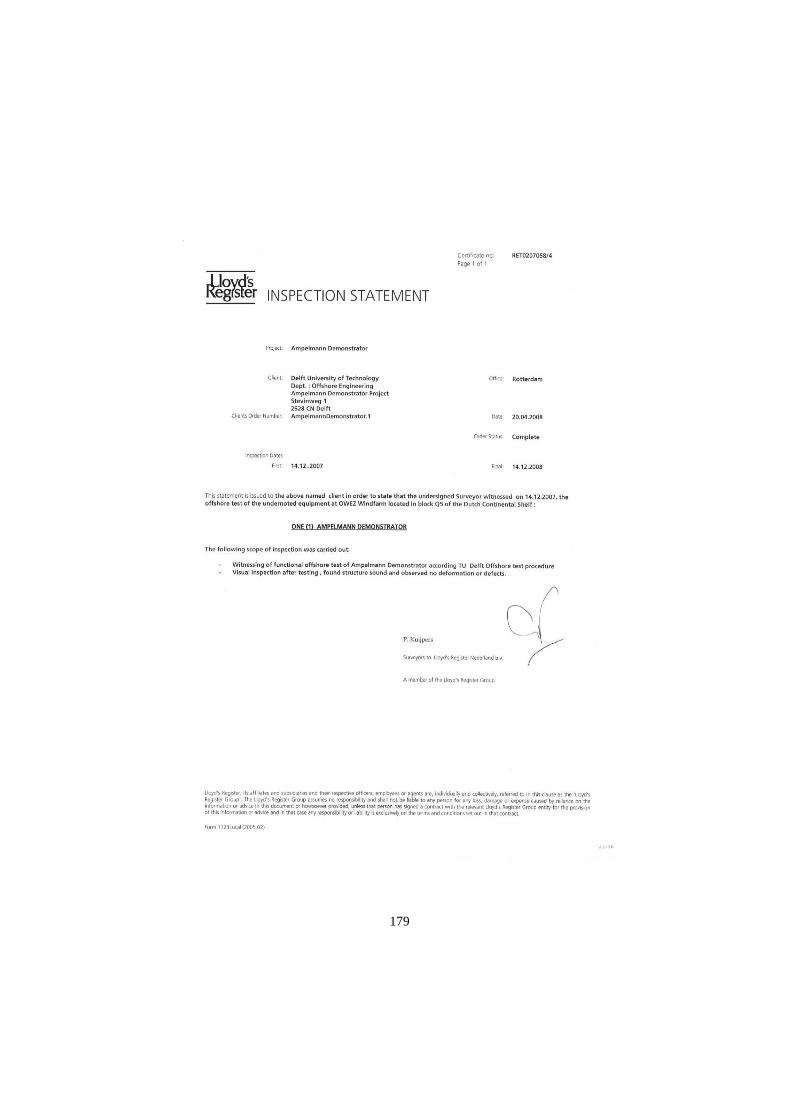
179

180
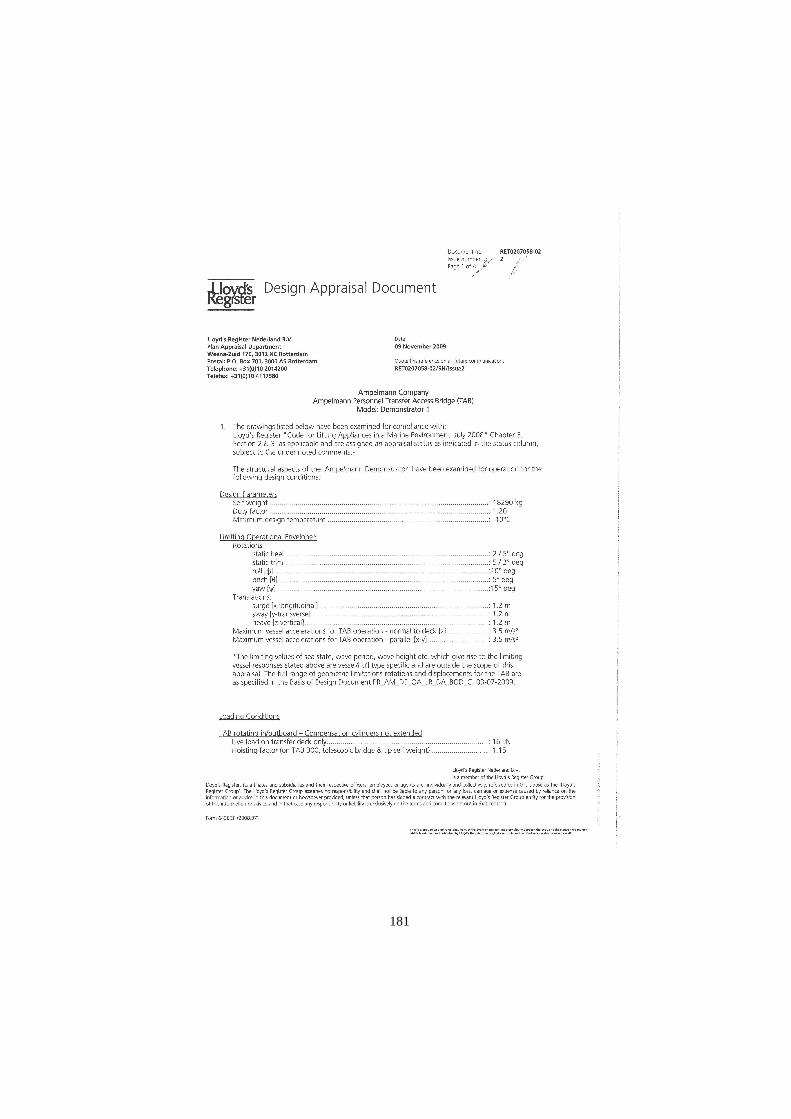
181

182

183

184

185
Samenvatting De afgelopen decennia is duurzame energie steeds belangrijker geworden als
alternatief voor het gebruik van fossiele brandstoffen. Van alle verschillende soorten duurzame energie heeft windenergie zich weten te ontplooien tot een kosteneffectieve alternatieve energiebron. Hierdoor is de windindustrie uitgegroeid tot een grote internationale bedrijfssector. Steeds meer windturbines worden offshore geplaatst, waar windcondities over het algemeen gunstiger zijn dan op het land. Een nadeel is echter dat offshore windparken qua investeringskosten en onderhoudskosten duurder zijn dan windparken op het land. Bovendien worden offshore windparken steeds verder uit de kust gebouwd waar de omgevingscondities ruiger zijn. Dit schept een uitdaging wat betreft het onderhoud van de windturbines. Momenteel wordt onderhoudspersoneel hoofdzakelijk met behulp van schepen naar de vaste offshore windturbines overgezet, waarbij een schip met de boeg tegen de windturbine drukt en men vanaf de boeg door middel van een ladder op de windturbine overstapt. Vanwege de veiligheid kunnen deze overstappen enkel plaatsvinden in rustige golfcondities met een significante golfhoogte (HS) tot ongeveer 1.5 meter. Offshore windparken op locaties met ruigere golfklimaten kennen daarom een verlaagde toegankelijkheid, wat lange stilstandtijden en verlies van inkomsten tot gevolg heeft.
De toegankelijkheid van offshore windturbines kan aanzienlijk worden verhoogd
indien personeel veilig naar de turbines kan worden overgezet in golfcondities met een significante golfhoogte tot 2.5 meter. Een dergelijke verhoogde toegankelijkheid vergt evenwel een nieuwe overstapmethode. Het nieuwe overstapsysteem dat in dit proefschrift wordt geïntroduceerd heet "Ampelmann" en maakt het veilig overzetten van personeel en goederen mogelijk door een schip te voorzien van een overstapdek dat stil kan staan ten opzichte van de vaste wereld. Dit dek is gemonteerd bovenop een zogeheten Stewart platform (vaak gebruikt als onderstel voor vluchtsimulatoren), wat een systeem is dat met behulp van zes hydraulische cilinders bewegingen kan maken in alle zes graden van vrijheid. Dit Stewart platform wordt gemonteerd op het dek van het schip. Om het overstapdek van het Stewart platform stil te laten staan ten opzichte van de vaste wereld, worden de bewegingen van het (dek van het) schip continu geregistreerd door een bewegingssensor. Hierdoor kunnen de cilinders van het Stewart platform vervolgens op een dusdanige wijze worden aangestuurd dat een stabiel en stilstaand overstapdek wordt gecreëerd. Een loopbrug vanaf het dek biedt vervolgens toegang tot de offshore windturbine. De doelstelling van dit onderzoek, waarvan de resultaten in dit proefschrift worden gepresenteerd, is te bewijzen dat het gebruik van een Ampelmann systeem de toegankelijkheid van offshore windturbines op een veilige manier kan verhogen.

186
Allereerst is onderzocht of de combinatie van de verschillende technologieën in het Ampelmann systeem (een Stewart platform en een bewegingssensor) een voldoende snelle en nauwkeurige aansturing kon leveren om een overstapdek op een bewegend schip bewegingloos te krijgen. Hiervoor is een reeks testen gedaan met een schaalmodel bestaande uit een klein Stewart platform, een bewegingssensor en speciaal voor dit project ontwikkelde software. Deze zogeheten proof-of-concept werd uitgevoerd door eerst het gecombineerde systeem bovenop een groter Stewart platform te plaatsen om scheepsbewegingen te simuleren. Zo konden de systeemprestaties worden getest en de besturing worden verbeterd. Vervolgens is het schaalmodel op een bootje van 4 meter in golfcondities op bewegingscompensatie getest, met positief resultaat. Deze schaalmodelproeven vormden het bewijs van het Ampelmann concept: het verkrijgen van een stilstaand overstapdek op een bewegend schip. De positieve testresultaten hebben geleid tot de volgende fase: het bouwen van een prototype.
Met dit prototype, de Ampelmann Demonstrator, moest bewezen worden dat het
mogelijk is personeel veilig over te zetten naar vaste offshore windturbines in echte zeecondities. Voorafgaand aan de ontwikkeling van de Ampelmann Demonstrator, zijn de volgende systeemeisen gesteld:
• Hoge veiligheidsnormen • Systeem toepasbaar op een breed scala aan schepen • Geen speciale toebehoren vereist op de windturbine • Toegankelijkheid in zeecondities tot HS = 2.5m.
Voor het ontwikkelen van een inherent veilig Ampelmann systeem werd een fail-
operational veiligheidsfilosofie toegepast. Dit betekent dat na het falen van een willekeurig component de overstapprocedure minstens 60 seconden normaal moet kunnen worden voortgezet. Dit is genoeg tijd om de overstapprocedure veilig te kunnen voltooien en het platform terug te krijgen in een veilige stand. Deze veiligheidsfilosofie is in het ontwerp van de Ampelmann Demonstrator geïntegreerd middels vier vereisten:
• Bewegingsbereik van het Stewart platform • Bewegingsintegriteit van het Stewart platform • Veilig operationele procedure • Integriteit van de constructie.
Het ontwerp van het Stewart platform moet voldoende bewegingsruimte bieden om
scheepsbewegingen te kunnen compenseren in zeecondities tot HS = 2.5m. Om de meest geschikte architectuur te bepalen voor het Stewart platform van de Ampelmann Demonstrator is een ontwerpprocedure ontwikkeld. Hiervoor is eerst een groot aantal mogelijke opties voor de architectuur parameters bepaald, bij een cilinder slaglengte van 2 meter en begrensde afmetingen van het boven- en onderframe. Vervolgens is voor

187
elke architectuur met een berekeningsprocedure het bewegingsbereik bepaald, alsook de extreme axiale cilinderkrachten. Ontwerpen die leidden tot de grootste cilinderkrachten zijn afgewezen omdat grote cilinderkrachten grotere cilinderdoorsneden vereisen met bijbehorende hogere kosten. Uiteindelijk werd de platformarchitectuur met het grootste verticale bewegingsbereik beschouwd als de meest geschikte voor de Ampelmann Demonstrator. De prestaties van dit platform zijn op verschillende typen schepen onderzocht door middel van bewegingsimulaties. Vastgesteld werd dat het gekozen Stewart platformontwerp bewegingscompensatie kan leveren in een zeetoestand van HS = 2.5m op schepen met een lengte vanaf 50 meter.
Voor goede bewegingscompensatie moeten de bewegingen van het Stewart platform
betrouwbaar zijn en niet beïnvloed worden door falende componenten. Alle niet constructieve kritische onderdelen van het Stewart platform zijn daarom redundant ontworpen om te voldoen aan de fail-operational veiligheidsfilosofie. Vanwege deze redundante samenstelling kan het systeem na een storing aan een kritisch onderdeel nog ten minste 60 seconden operationeel blijven. Zodra een dergelijk onderdeel faalt, wordt dit door het Ampelmann Safety Management System (ASMS) gedetecteerd. Dit systeem reageert onmiddellijk door de storing te isoleren en over te schakelen naar het reservecomponent. Bovendien wordt de operator gewaarschuwd om de operatie binnen een minuut te voltooien. Door middel van een uitgebreide reeks testen is bewezen dat het systeem fail-operational is.
Om de overstap van het personeel veiliger te maken is een operationele procedure
gedefinieerd. Het Ampelmann systeem wordt bediend volgens deze voorgeschreven operationele procedure door operators die hiervoor zijn opgeleid. Daarnaast houdt het ASMS voortdurend toezicht op alle systeemfuncties en waarschuwt het systeem de operator in geval van storing aan een onderdeel. De toegang vanaf het overstapdek van de Ampelmann naar een aanlandpunt op een windturbine wordt op een veilige en gemakkelijke manier mogelijk gemaakt door een loopbrug. Deze Telescopische Access Bridge (TAB) is uitgerust met drie graden van vrijheid die de operator in staat stellen het uiteinde van de loopbrug tegen een aanlandpunt te positioneren. De free-floating functies van de TAB zorgen ervoor dat contact met het aanlandpunt wordt behouden, zelfs wanneer het overstapdek restbewegingen ervaart en dienen tevens als veiligheidsprocedure om de loopbrug tegen het aanlandpunt gedrukt te houden in het geval van een noodsituatie. De veiligheid van deze operationele procedure is bevestigd door testen op land en offshore.
Om de integriteit van de constructie van de Ampelmann Demonstrator te kunnen
garanderen, zijn zowel het ontwerp als de fabricage van alle constructieve onderdelen van het systeem door de certificeringinstantie Lloyd's Register geëvalueerd. Voor de ontwerpbeoordeling leidde dit tot een praktisch probleem, omdat er geen specifieke
188
ontwerpregels bestonden voor een Ampelmann systeem. Op basis van de bestaande regels voor hijsapparatuur in een maritieme omgeving werden er zes specifieke belastinggevallen geformuleerd voor het Ampelmann systeem; deze werden akkoord bevonden door Lloyd's Register om te worden gebruikt voor de ontwerpbeoordeling. Gebaseerd op het ontwerp, de fabricage en een overbelastingsproef is een volledig certificaat afgegeven ter bevestiging van de integriteit van de constructie van de Ampelmann Demonstrator.
De ontwikkelingsfase van de Ampelmann Demonstrator is eind 2007 afgerond met een
geslaagde overstapdemonstratie op het Offshore Windpark Egmond aan Zee (OWEZ). In 2009 is het tweede Ampelmann systeem gebouwd, gevolgd door nog eens twee systemen in de eerste helft van 2010. De vier systemen zijn commercieel verkrijgbaar en zijn reeds toegepast in offshore windenergie projecten alsook olie -en gasprojecten. Tot en met de zomer van 2010 zijn met de vier Ampelmann systemen gezamenlijk meer dan 25.000 overstappen uitgevoerd in golfcondities tot HS = 2.8m. De volgende stap voor de Ampelmann is om gebruikt te worden voor de oorspronkelijk geplande taak, namelijk om de toegankelijkheid van offshore windturbines aanzienlijk te verbeteren. De Ampelmann technologie heeft zich bewezen als veilige methode voor het overzetten van personeel naar vaste offshore constructies in golfcondities met een significante golfhoogte van meer dan 2.5 meter, waardoor Offshore Access net zo makkelijk is geworden als het oversteken van de straat.

189
Curriculum Vitae David Cerda Salzmann was born in Antofagasta, Chile, on December 4th 1974. He
arrived in the Netherlands at the age of 2 and grew up in Amsterdam where he attended the Barlaeus Gymnasium to obtain his diploma in 1993. In that same year he started his academic education at the Delft University of Technology. At the faculty of Civil Engineering he graduated within the section of Offshore Engineering on his thesis entitled “Dynamic Response Calculations of Offshore Wind Turbine Monopile Support Structures” in 2004.
After graduating he started a PhD research at the Delft University of Technology under
the We@Sea programme. He investigated combined wind and wave influences on offshore wind turbines for a year leading to several papers, but fascinated by the Ampelmann idea he decided to focus on the development of the Ampelmann system leading to this thesis. During his time as a PhD student, he was involved in teaching different courses inside and outside the Offshore Engineering curriculum and acted as curriculum leader for a year. In 2007 he co-founded the Ampelmann Company.
He is currently working as an R&D manager at Ampelmann Operations and still
involved in education at the Offshore Wind group at the Delft University of Technology.