ADVANCED CONTROL FOR FLOATING OFFSHORE WIND TURBINES
117
ADVANCED CONTROL FOR FLOATING OFFSHORE WIND TURBINES DOCTORAL THESIS BY JOANNES OLONDRIZ ERDOZAIN Leioa, 2019 (c)2019 JOANNES OLONDRIZ ERDOZAIN
Transcript of ADVANCED CONTROL FOR FLOATING OFFSHORE WIND TURBINES
ADVANCED CONTROL FORFLOATING OFFSHORE WIND
TURBINES
DOCTORAL THESIS
BY
JOANNES OLONDRIZ ERDOZAIN
Leioa, 2019
(c)2019 JOANNES OLONDRIZ ERDOZAIN


ADVANCED CONTROL FORFLOATING OFFSHORE WIND
TURBINES
Doctoral thesis submitted for the degree of Doctor, accepted by the Electricity andElectronics Department of the Faculty of Science and Technology of theUniversity of the Basque Country UPV/EHU in partnership with Ikerlan
Technology Research Centre, Control and Monitoring area.
Principal co-supervisors:Prof. Dr. Santiago Alonso Quesada (University of the Basque Country UPV/EHU)
Dr. Carlos Calleja Elcoro (Ikerlan Technology Research Centre)
Advisor:Prof. Dr. Josu Jugo Garcıa (University of the Basque Country UPV/EHU)
Leioa, 2019


AUTORIZACION DEL/LA DIRECTOR/A DE TESIS
PARA SU PRESENTACION
Dr/a. _________________________________________con N.I.F.________________________
como Director/a de la Tesis Doctoral:
realizada en el Programa de Doctorado
por el Doctorando Don/ña. ,
autorizo la presentación de la citada Tesis Doctoral, dado que reúne las condiciones
necesarias para su defensa.
En a de de
EL/LA DIRECTOR/A DE LA TESIS
Fdo.:


AUTORIZACION DEL TUTOR/A DE TESIS
PARA SU PRESENTACION
Dr/a.
como Tutor/a de la Tesis Doctoral:
realizada en el Programa de Doctorado
por el Doctorando Don/ña. ,
y dirigida por el Dr./a ____________________________________________________________
autorizo la presentación de la citada Tesis Doctoral, dado que reúne las condiciones
necesarias para su defensa.
En a de de
EL/LA TUTOR/A DE LA TESIS
Fdo.:

CONFORMIDAD DEL DEPARTAMENTO
El Consejo del Departamento de __________________________________________________
_____________________________________________________________________________
en reunión celebrada el día ___ de __________ de ______ ha acordado dar la conformidad a la
admisión a trámite de presentación de la Tesis Doctoral titulada: ________________________
_____________________________________________________________________________
_____________________________________________________________________________
_____________________________________________________________________________
dirigida por el/la Dr/a. __________________________________________________________
y presentada por Don/ña. ________________________________________________________
ante este Departamento.
En _______________ a _____ de ____________________ de ________
VºBº DIRECTOR/A DEL DEPARTAMENTO SECRETARIO/A DEL DEPARTAMENTO
Fdo.: _____________________________ Fdo.: __________________________
AUTORIZACIÓN DEL DEPARTAMENTO


AUTORIZACIÓN DE LA COMISIÓN ACADÉMICA DEL PROGRAMA DE DOCTORADO
La Comisión Académica del Programa de Doctorado en
en reunión celebrada el día ____ de ___________ de 20___, ha acordado dar la
conformidad a la presentación de la Tesis Doctoral titulada: ____________
dirigida por el/la Dr/a.
y presentada por Don/Dña.
adscrito o adscrita al Departamento ____________________________________ _____________________________________________________________________
En a de de
EL/LA RESPONSABLE DEL PROGRAMA DE DOCTORADO
Fdo.: _____________________________________

ACTA DE GRADO DE DOCTOR O DOCTORA ACTA DE DEFENSA DE TESIS DOCTORAL
DOCTORANDO/A DON/DÑA.
TITULO DE LA TESIS:
El Tribunal designado por la Comisión de Postgrado de la UPV/EHU para calificar la Tesis
Doctoral arriba indicada y reunido en el día de la fecha, una vez efectuada la defensa por el/la
doctorando/a y contestadas las objeciones y/o sugerencias que se le han formulado, ha
otorgado por___________________la calificación de: unanimidad ó mayoría
SOBRESALIENTE / NOTABLE / APROBADO / NO APTO
Idioma/s de defensa (en caso de más de un idioma, especificar porcentaje defendido en cada
idioma):
Castellano _______________________________________________________________
Euskera _______________________________________________________________
Otros Idiomas (especificar cuál/cuales y porcentaje) ______________________________
En a de de
EL/LA PRESIDENTE/A, EL/LA SECRETARIO/A,
Fdo.: Fdo.:
Dr/a: ____________________ Dr/a: ______________________
VOCAL 1º, VOCAL 2º, VOCAL 3º,
Fdo.: Fdo.: Fdo.:
Dr/a: Dr/a: Dr/a:
EL/LA DOCTORANDO/A,
Fdo.: _____________________


ADVANCED CONTROL FOR FLOATING OFFSHORE WIND TURBINES
Author: Joannes Olondriz Erdozain
List of publications:
• Paper A: Olondriz J., Elorza I., Trojaola I., Pujana A., Landaluze J. On the
effects of basic platform design characteristics on floating offshore wind tur-
bine control and their mitigation. J. Phys. Conf. Ser. (Torque 2016), 753.
• Paper B: Olondriz J., Elorza I., Calleja C., Jugo J., Pujana A. Platform negat-
ive damping, blade root and tower base bending moment reductions with an
advanced control technique. WindEurope Conference & Exhibition 2017.
• Paper C: Olondriz J., Elorza I., Jugo J., Alonso-Quesada S., Pujana-Arrese A.An Advanced Control Technique for Floating Offshore Wind Turbines Based
on More Compact Barge Platforms. Energies 2018, 11, 1187.
• Paper D: Olondriz J. Jugo J., Elorza I., Alonso-Quesada S., Pujana-ArreseA. Alternative linearisation methodology for aero-elastic Floating Offshore
Wind Turbine non-linear models. J. Phys. Conf. Ser. (Torque 2018), 1037.
• Paper E: Olondriz J., Wei Y., Jugo J., Lemmer F., Elorza I., Alonso-QuesadaS., Pujana-Arrese A. Using Multiple Fidelity Numerical Models For Floating
Offshore Wind Turbine Advanced Control Design. Energies 2018, 11, 2484.
• Paper F: Olondriz J., Jugo J., Elorza I., Alonso-Quesada S., Pujana-ArreseA. A Blade Load Feedback Control for Floating Offshore Wind Turbines.
WindEurope Conference & Exhibition 2019.
• Paper G: Olondriz J., Jugo J., Elorza I., Alonso-Quesada S., Pujana-Arrese A.A Feedback Control Loop Optimisation Methodology for Floating Offshore
Wind Turbines. Energies (unpublished).


Gehien maite ditudan pertsonei, zuek
gabe hau ez litzatekeelako posible izango

Abstract
Wind energy is becoming the real green energy alternative to the con-
ventional fossil fuel sources, as the increment of the new wind farm
projects worldwide demonstrates. The offshore wind presents many
advantages compared to its onshore counterpart, but the current bottom-
fixed technology is limited by the water depth since the supporting
structures can only be installed in shallow water coastal areas. There-
fore, a solution to overcome this limitation has been developed by
mounting the wind turbines on floating structures, i.e. the Floating
Offshore Wind Turbines.
Early studies of Floating Offshore Wind Turbines have shown that con-
trol plays an important role for the dynamic behaviour of the system
due to the possible platform negative damping effect. Therefore, sev-
eral control techniques have been proposed in the last years in order
to avoid such a negative effect and improve the performance of the
Floating Offshore Wind turbines.
In this thesis, an advanced control technique has been designed and
tuned to improve the overall performance of Floating Offshore Wind
Turbines in terms of power regulation and global mechanical loadings,
as well as to reduce the impact of the waves in the floating platform
motion. Two platform concepts have been studied with more detail,
(1) the ITI Energy’s barge concept with 5-MW wind turbine and (2)
the 10-MW wind turbine on a TripleSpar concept. The first model has
been chosen because its basic and economic design, the fabrication and
installation advantages, and the challenges posed to the turbine control
system by less stable and more compact platforms. Furthermore, the

relationship between the fundamental platform dimensions and the op-erating performance, specially in terms of challenges posed to the tur-bine control system, is investigated with more compact barge models.Besides, the second model has been chosen to prove the scalability ofthe designed advanced control technique in a higher power rated windturbine mounted on a hydrodynamically more stable platform. Further-more, an optimisation methodology to automatically tune the advancedcontroller has been developed based on the Damage Equivalent Loadsresults, improving the manually tuned controller outcomes.
Two alternative linearisation strategies for Floating Offshore Wind Tur-bines are proposed. The first one uses the generator torque trimmingwhile the second applies the chirp signal methodology. The generatortorque trimmed linear models show acceptable results, while the chirpsignal methodology delivers the highest fidelity results respect to theidentification of the system modes.
For the hydrodynamic analysis of floating platforms, the open sourcecode NEMOH has been proposed to obtain the hydrodynamic matricesrequired for the simulation code FAST. The obtained results have beencompared with those obtained with WAMIT code, validating the ap-proach from the method development point of view.
The obtained results suggest a significant effectiveness of the designedadvanced control technique for reducing the mechanical loads sufferedin tower and blades while improving the wind turbine performance,contributing to achieve a cost effective solution for the Floating Off-shore Wind Turbine technology.

Acknowledgements
I would like to thanks Ikerlan Technology Research Centre for support-ing and giving me the opportunity of developing my PhD studies and,to my mates of the Control and Monitoring area who have help me inminor or major extent in the development of this work.
My deep gratitude is addressed to Josu Jugo and Santi Alonso fromBasque Country University UPV/EHU for providing me with excellentadvice, great support and never-ending encouragement.
Further, I would like to thank my colleagues at the Stuttgart Wind En-ergy institute for giving me the opportunity to make the enjoyable,unforgettable and successful PhD stay.
And finally and most importantly, I owe my deepest gratitude to myfriends, couple and family for showing an interest in my work, theirhelp in forgetting about it for some time and, their understanding ifthis was not possible.
Eskerrik asko,
Joannes O.

Contents
List of Figures xxv
List of Tables xxxi
Glossary xxxiii
Symbols xxxvii
1 Introduction 1
1.1 Offshore Wind Energy . . . . . . . . . . . . . . . . . . . . . . . 2
1.2 Motivation . . . . . . . . . . . . . . . . . . . . . . . . . . . . . . 5
1.3 Objectives, Scope, and Outline . . . . . . . . . . . . . . . . . . . 7
2 Background for Floating Offshore Wind Technology 9
2.1 Floating Technologies . . . . . . . . . . . . . . . . . . . . . . . . 10
2.2 Projects Worldwide . . . . . . . . . . . . . . . . . . . . . . . . . 14
2.3 Simulation Tools . . . . . . . . . . . . . . . . . . . . . . . . . . 18
2.4 Control . . . . . . . . . . . . . . . . . . . . . . . . . . . . . . . 21
2.4.1 Operating regions . . . . . . . . . . . . . . . . . . . . . . 22
2.4.2 Conventional control . . . . . . . . . . . . . . . . . . . . 24
2.4.3 Limitations of conventional control . . . . . . . . . . . . 30
2.4.4 Review of the control literature . . . . . . . . . . . . . . 33
2.5 Summary . . . . . . . . . . . . . . . . . . . . . . . . . . . . . . 37
xxi

CONTENTS
3 Floating Offshore Wind Turbine Modelling 393.1 Non-Linear Models . . . . . . . . . . . . . . . . . . . . . . . . . 40
3.2 The Linearisation of a Non-Linear Model . . . . . . . . . . . . . 43
3.2.1 Linearisation with FAST7 . . . . . . . . . . . . . . . . . 44
3.2.2 Alternative method for linearisation . . . . . . . . . . . . 49
3.2.3 Low-order linear models . . . . . . . . . . . . . . . . . . 54
3.3 A More Compact Barge Family . . . . . . . . . . . . . . . . . . . 57
3.3.1 Design basis . . . . . . . . . . . . . . . . . . . . . . . . 58
3.3.2 Hydrodynamic coefficients . . . . . . . . . . . . . . . . . 61
3.3.3 Model validation . . . . . . . . . . . . . . . . . . . . . . 65
3.3.4 Model linearisation . . . . . . . . . . . . . . . . . . . . . 67
3.4 Summary . . . . . . . . . . . . . . . . . . . . . . . . . . . . . . 69
4 Floating Offshore Wind Turbine Control 714.1 Baseline Control . . . . . . . . . . . . . . . . . . . . . . . . . . 72
4.1.1 NREL 5-MW . . . . . . . . . . . . . . . . . . . . . . . . 73
4.1.2 DTU 10-MW . . . . . . . . . . . . . . . . . . . . . . . . 77
4.2 Aerodynamic Platform Stabiliser Control . . . . . . . . . . . . . 79
4.2.1 Design . . . . . . . . . . . . . . . . . . . . . . . . . . . 81
4.2.1.1 NREL 5-MW ITI Energy . . . . . . . . . . . . 82
4.2.1.2 NREL 5-MW barge family . . . . . . . . . . . 85
4.2.1.3 Control loop implementation . . . . . . . . . . 89
4.2.2 Performance . . . . . . . . . . . . . . . . . . . . . . . . 90
4.2.2.1 Still water . . . . . . . . . . . . . . . . . . . . 92
4.2.2.2 Irregular sea state . . . . . . . . . . . . . . . . 99
4.2.2.3 Load analysis . . . . . . . . . . . . . . . . . . 109
4.2.3 Scalability in DTU 10-MW TripleSpar . . . . . . . . . . 111
4.3 Wave Rejection Control for NREL 5-MW ITI Energy Barge . . . 121
4.3.1 Design . . . . . . . . . . . . . . . . . . . . . . . . . . . 122
4.3.2 Control loop implementation . . . . . . . . . . . . . . . . 125
4.3.3 Performance . . . . . . . . . . . . . . . . . . . . . . . . 127
4.3.4 Load analysis . . . . . . . . . . . . . . . . . . . . . . . . 131
4.4 Result Discussion . . . . . . . . . . . . . . . . . . . . . . . . . . 133
xxii

CONTENTS
4.5 Summary . . . . . . . . . . . . . . . . . . . . . . . . . . . . . . 137
5 Control Optimisation 1395.1 Optimisation Methodology . . . . . . . . . . . . . . . . . . . . . 1405.2 Optimisation Results . . . . . . . . . . . . . . . . . . . . . . . . 1445.3 Summary . . . . . . . . . . . . . . . . . . . . . . . . . . . . . . 152
6 Conclusions and Recommendations 1536.1 Conclusions . . . . . . . . . . . . . . . . . . . . . . . . . . . . . 1546.2 Recommendations . . . . . . . . . . . . . . . . . . . . . . . . . . 156
Bibliography 159
A Additional Data 173A.1 Steady-State Operating Points . . . . . . . . . . . . . . . . . . . 173
B Simulink Schemes 175B.1 Chirp Signal Simulink Scheme . . . . . . . . . . . . . . . . . . . 175B.2 Control Simulink Scheme . . . . . . . . . . . . . . . . . . . . . . 176
C Software Input Files 177C.1 NEMOH Primary Input File . . . . . . . . . . . . . . . . . . . . 177C.2 HydroDyn Input File . . . . . . . . . . . . . . . . . . . . . . . . 179
D Simulation Results 181D.1 Manually Tuned Controller Performance Extreme-Events . . . . . 181D.2 Optimised Controller Performance Extreme-Events . . . . . . . . 182D.3 Time-Domain Simulations NREL 5-MW Beam-Draught Ratio 6
Barge . . . . . . . . . . . . . . . . . . . . . . . . . . . . . . . . 183
xxiii

List of Figures
1.1 Global offshore wind energy capacity according to GWEC. . . . . 3
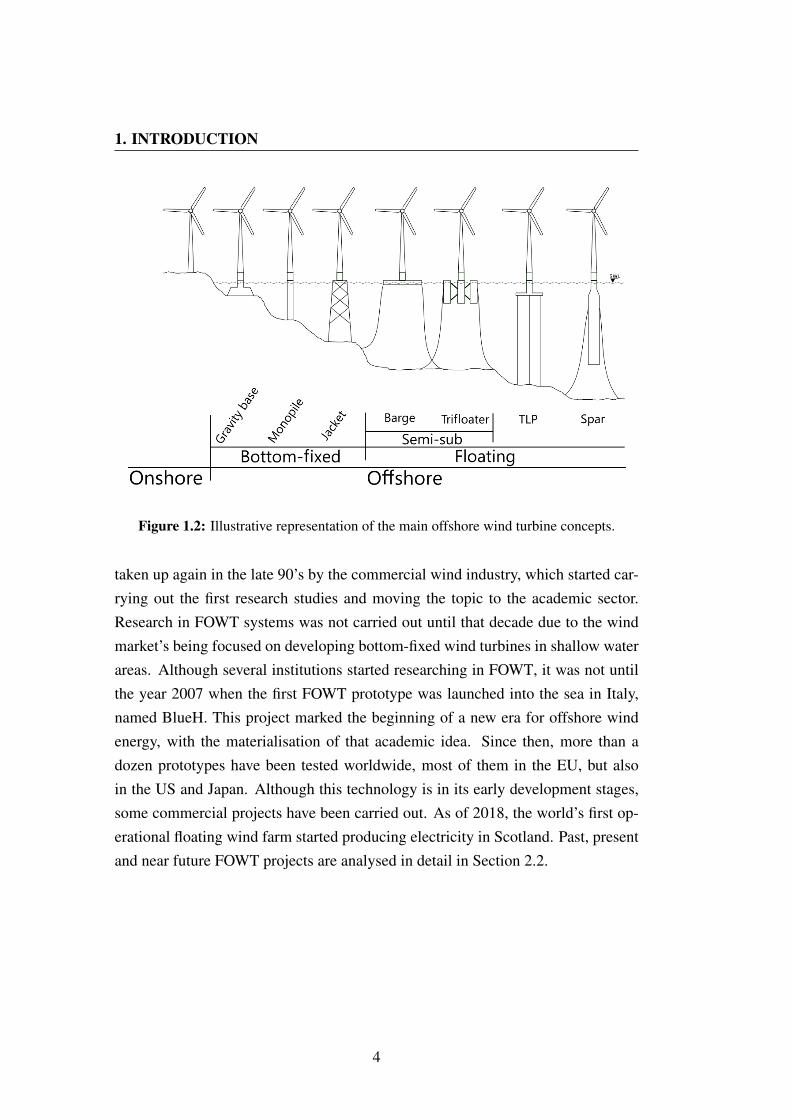
1.2 Illustrative representation of the main offshore wind turbine concepts. 4
2.1 The main Floating Offshore Wind Turbine platform concepts. . . . 10
2.2 Worldwide Floating Offshore Wind Turbine projects according to
the floating technology and Technology Readiness Level. . . . . . 17
2.3 Degrees of freedom of the motion of the barge [40]. . . . . . . . . 20
2.4 Operating regions of large scale wind turbines. . . . . . . . . . . 22
2.5 Below rated wind speed (Region II) wind turbine control loop. . . 24
2.6 λ and Cp representation. . . . . . . . . . . . . . . . . . . . . . . 25
2.7 Above rated wind speed (Region III) wind turbine control loop. . . 27
2.8 Flow chart for the conventional control of a wind turbine. . . . . . 28
2.9 Scheme of the transfer function for the root-locus analysis. . . . . 30
2.10 Platform-pitch mode root-locus map. . . . . . . . . . . . . . . . . 31
2.11 Controller-response natural frequency. . . . . . . . . . . . . . . . 32
2.12 Open-loop platform-pitch zero positions according to the wind speed. 32
3.1 NREL 5-MW ITI Energy’s barge [15] (left) and DTU 10-MW TripleS-
par [86] (right) wind turbine conceptual models. . . . . . . . . . . 42
3.2 Frequency response diagrams for the linearised models at 13 m/s. . 46
3.3 Generator speed closed-loop response with the proportional gains. 47
3.4 Representation of the first 1000 seconds of the chirp signal [81]. . 50
3.5 Simulation scheme for the chirp signal analysis. . . . . . . . . . . 50
xxv

LIST OF FIGURES
3.6 Frequency-domain response diagrams for the linearised models at
13 m/s. . . . . . . . . . . . . . . . . . . . . . . . . . . . . . . . . 51
3.7 Generator speed closed-loop response with the proportional gains
[81]. . . . . . . . . . . . . . . . . . . . . . . . . . . . . . . . . . 53
3.8 Bode (left) and Nyquist (right) diagrams of the SLOW and FAST
linear models. . . . . . . . . . . . . . . . . . . . . . . . . . . . . 55
3.9 Barge floating platform dimensions [80]. . . . . . . . . . . . . . . 59
3.10 The main properties and trends of the barge family [80]. . . . . . 60
3.11 Panel mesh of the barge family platform models. . . . . . . . . . 62
3.12 Hydrodynamic coefficients of the barge family [80]. . . . . . . . . 63
3.13 Open-loop platform-pitch motion eigenvalues [80]. . . . . . . . . 65
3.14 Platform-pitch free-decay test of both equivalent platform models. 66
3.15 Linearised Bode diagrams of the designed barge family and refer-
ence ITI Energy’s barge. . . . . . . . . . . . . . . . . . . . . . . 67
4.1 Platform-pitch natural mode of the barge family transfer functions. 74
4.2 NREL 5-MW blade-pitch detuned PI control gain-schedule. . . . 76
4.3 DTU 10-MW blade-pitch baseline PI control gain-schedule. . . . 77
4.4 DTU 10-MW baseline PI controller-response and platform-pitch
natural frequencies. . . . . . . . . . . . . . . . . . . . . . . . . . 78
4.5 Conventional rotor speed PI and the Aerodynamic Platform Stabil-
iser control loops [96]. . . . . . . . . . . . . . . . . . . . . . . . 79
4.6 Aerodynamic Platform Stabiliser control loop tuning Bode dia-
grams for the NREL 5-MW ITI Energy’s barge [96]. . . . . . . . 82
4.7 Closed-loop Bode diagrams from wind speed to platform-pitch angle
(top) and to generator speed (bottom) [96]. . . . . . . . . . . . . . 83
4.8 Aerodynamic Platform Stabiliser control loop tuning Bode dia-
grams for the NREL 5-MW more compact barge family [96]. . . . 85
4.9 Closed-loop Bode diagrams from wind speed to platform-pitch angle
(top) and to generator speed (bottom) [96]. . . . . . . . . . . . . . 87
4.10 Platform-roll time-domain results at 19 m/s stochastic wind speed
and still water conditions. . . . . . . . . . . . . . . . . . . . . . . 92
xxvi
LIST OF FIGURES
4.11 Time-domain simulation results at 19 m/s stochastic wind speed
and still water conditions. . . . . . . . . . . . . . . . . . . . . . . 93
4.12 The detail of the time-domain simulation results of Figure 4.11. . 95
4.13 Power spectral density of the time-domain simulation results at 19
m/s stochastic wind speed and still water conditions. . . . . . . . 96
4.14 Standard deviation of the time-domain simulation results at above
rated wind speed range and still water conditions. . . . . . . . . . 97
4.15 Time-domain simulation results at 19 m/s stochastic wind speed
and 1 m mean irregular wave height conditions. . . . . . . . . . . 100
4.16 Time-domain simulation results at 19 m/s stochastic wind speed
and 2 m mean irregular wave height conditions. . . . . . . . . . . 102
4.17 Power spectral density of the time-domain simulation results at
19 m/s stochastic wind speed and 1 and 2 m mean irregular wave
height conditions. . . . . . . . . . . . . . . . . . . . . . . . . . . 103
4.18 Standard deviation of the time-domain simulation results at 19 m/s
stochastic wind speed and 1 and 2 m mean irregular wave height
conditions. . . . . . . . . . . . . . . . . . . . . . . . . . . . . . . 104
4.19 Time-domain simulation results at 19 m/s stochastic wind speed
and 6 m mean irregular wave height conditions. . . . . . . . . . . 106
4.20 Standard deviation of the time-domain simulation results at 19 m/s
stochastic wind speed and 6 m mean irregular wave height conditions.107
4.21 Damage equivalent load of the NREL 5-MW ITI Energy barge’s
model with the Aerodynamic Platform Stabiliser controller. . . . . 109
4.22 Aerodynamic Platform Stabiliser control loop tuning Bode dia-
grams for the DTU 10-MW TripleSpar system. . . . . . . . . . . 112
4.23 Closed-loop Bode diagrams from wind speed to platform-pitch angle
(top) and to generator speed (bottom) of the DTU 10-MW TripleS-
par system. . . . . . . . . . . . . . . . . . . . . . . . . . . . . . 113
4.24 Closed-loop control system sensitivity analysis diagram. . . . . . 114
4.25 Probabilistic results of the buoys analysed data at the reference loc-
ation. . . . . . . . . . . . . . . . . . . . . . . . . . . . . . . . . 115
xxvii
LIST OF FIGURES
4.26 Time-domain simulation results of the DTU 10-MW TripleSpar at
19 m/s stochastic wind speed and 3 m mean irregular wave height
conditions. . . . . . . . . . . . . . . . . . . . . . . . . . . . . . . 116
4.27 Power spectral density of the time-domain simulation results at 19
m/s stochastic wind speed and 3 m mean irregular wave height con-
ditions. . . . . . . . . . . . . . . . . . . . . . . . . . . . . . . . 117
4.28 Standard deviation of the time-domain simulation results at 19 m/s
stochastic wind speed and 3 m mean irregular wave height conditions.118
4.29 Damage equivalent load of the DTU 10-MW TripleSpar model
with the Aerodynamic Platform Stabiliser controller. . . . . . . . 119
4.30 Damage equivalent loads of the platform-roll respect to the platform-
pitch results. . . . . . . . . . . . . . . . . . . . . . . . . . . . . . 120
4.31 The baseline Detuned PI, Aerodynamic Platform Stabiliser and Wave
Rejection feedback control loops. . . . . . . . . . . . . . . . . . . 121
4.32 Wave Rejection control loop tuning open-loop Bode diagrams. . . 122
4.33 Wave Rejection control loop closed-loop Bode diagrams. . . . . . 123
4.34 Closed-loop Bode diagrams from wind speed to platform-pitch angle
(top) and to generator speed (bottom). . . . . . . . . . . . . . . . 124
4.35 Aerodynamic Platform Stabiliser and Wave Rejection control loops
collector block diagram. . . . . . . . . . . . . . . . . . . . . . . 125
4.36 Time-domain simulation results at 19 m/s stochastic wind speed
and 6 m mean irregular wave height conditions. . . . . . . . . . . 128
4.37 Power spectral density of the time-domain simulation results at 19
m/s stochastic wind speed and 6 m mean irregular wave height con-
ditions. . . . . . . . . . . . . . . . . . . . . . . . . . . . . . . . 129
4.38 Standard deviation of the time-domain simulation results at 19 m/s
stochastic wind speed and 6 m mean irregular wave height conditions.130
4.39 Damage equivalent load of the NREL 5-MW ITI Energy’s barge
model with the Wave Rejection controller. . . . . . . . . . . . . . 131
4.40 Damage equivalent loads of the platform-roll respect to the platform-
pitch results. . . . . . . . . . . . . . . . . . . . . . . . . . . . . . 132
xxviii
LIST OF FIGURES
4.41 Box-plot of the overall time-series simulation results. In each windspeed, Detuned PI (left, dark-green), Aerodynamic Platform Sta-biliser (centre, blue) and Wave Rejection (right, dark-red) controlresults are shown. . . . . . . . . . . . . . . . . . . . . . . . . . . 134
4.42 Generator speed and generated electric power median detail of Fig-ure 4.41. In each wind speed, Detuned PI (left, dark-green), Aero-dynamic Platform Stabiliser (centre, blue) and Wave Rejection (right,dark-red) control results are shown. . . . . . . . . . . . . . . . . 135
4.43 Simulation series bending moment extreme results. In each sub-plot, Detuned PI (left, dark-green), Detuned PI & APS (centre,blue) and Detuned PI & APS & WR (right, dark-red) control resultsare shown. . . . . . . . . . . . . . . . . . . . . . . . . . . . . . . 136
5.1 Illustrative representation of the Pole and Zero Optimisation flow-chart. . . . . . . . . . . . . . . . . . . . . . . . . . . . . . . . . 143
5.2 Closed-loop Bode diagrams of the optimised controller. . . . . . . 1455.3 Optimised controller time-domain results at 19 m/s stochastic wind
speed and 6 m mean wave height. . . . . . . . . . . . . . . . . . 1465.4 Power spectral density of the optimised controller time-domain res-
ults. . . . . . . . . . . . . . . . . . . . . . . . . . . . . . . . . . 1475.5 Standard deviation of the optimised controller time-series. . . . . 1485.6 Damage equivalent loads of the optimised controller time series. . 1495.7 Simulation series box-plot results. In each wind speed, Detuned PI
(left, dark-green), manually tuned APS & WR (centre, dark-red)and optimised APS & WR (right, dark-yellow) control results areshown. . . . . . . . . . . . . . . . . . . . . . . . . . . . . . . . . 150
5.8 Simulation series bending moment extreme results. In each sub-plot, Detuned PI (left, dark-green), manually tuned APS & WR(centre, dark-red) and optimised APS & WR (right, dark-yellow)control results are shown. . . . . . . . . . . . . . . . . . . . . . . 151
xxix


List of Tables
2.1 Qualitative assessment of floating platform technologies. . . . . . 122.2 Floating Offshore Wind Turbine projects worldwide. . . . . . . . 142.3 Floating Offshore Wind Turbine simulation programs. . . . . . . . 18
3.1 The main parameters of the Floating Offshore Wind Turbine models. 423.2 Desired operating point at a wind speed of 13 m/s. . . . . . . . . . 443.3 Linear models convergence point at a wind speed of 13 m/s. . . . 453.4 System stability gain limit for each linearised model. . . . . . . . 463.5 System stability gain limit for each linearised model [81]. . . . . . 523.6 Barge family main properties. . . . . . . . . . . . . . . . . . . . 603.7 NEMOH’s input parameters. . . . . . . . . . . . . . . . . . . . . 61
4.1 NREL 5-MW blade-pitch detuned PI control parameters. . . . . . 75
5.1 Manually tuned and optimised control parameters values after ap-plying the PZO method. . . . . . . . . . . . . . . . . . . . . . . . 144
A.1 Defined steady-state operating points for above rated wind speed. . 174
xxxi


Glossary
APS Aerodynamic Platform Stabiliser
BEM Boundary Element MethodBPF Band-Pass FilterBVP Boundary-Value Problem
CAE Computer-aided Aeroelastic EngineeringCM Centre of MassCPC Collective Pitch Control
D DerivativeDAC Disturbance-Accomodating ControlDEL Damage Equivalent LoadsDLC Design Load CaseDNV-GL Det Norske Veritas and Germanischer LloydDOF Degree Of FreedomDTU Denmark Technical University
FAST Fatigue, Aerodynamics, Structures, and TurbulenceFFT Fast Fourier TransformationFOWT Floating Offshore Wind Turbines
GE General ElectricGK Gain-Correction FactorGM Metacentric HeightGS Gain-SchedulingGWEC Global Wind Energy Council
H∞ H-infinity
xxxiii

Glossary
HAWT Horizontal-Axis Wind TurbineHMPC Hybrid Model Predictive ControlHSS High Speed Shaft
I IntegralIEA International Energy AgencyIEC International Electrotechnical CommisionIPC Individual Pitch ControlIQR Inter-Quartile Range
JONSWAP Joint North Sea Wave Project
LCOE Levelised Cost Of EnergyLIDAR Light Detection and RangingLPF Low-Pass FilterLPV Linear Parameter-VarayingLQR Linear Quadratic Regulator
MBS Multi-Body SystemMIMO Multiple-Input Multiple-OutputMPC Model Predictive Control
NAME Naval Architecture and Marine EngineeringNMPZ Non-Minimum Phase ZerosNREL National Renewable Energy Laboratory
P ProportionalPD Proportional and DerivativePI Proportional and IntegralPID Proportional, Integral and DerivativePSD Power Spectral DensityPZO Pole and Zero Optimisation
RBF Radial Basis Function
SF State-FeedbackSISO Single-Input Single-OutputSLOW Simplified Low-Order Wind turbineSS State SpaceSTD Standard DeviationSWE Stuttgart Wind Energy
xxxiv

Glossary
SWL Still Water Level
TLP Tension Leg PlatformTPES Total Primary Energy SupplyTRL Technology Readiness LevelTSR Tip Speed Ratio
VPPC Variable Power Pitch Control
WAMIT Wave Analysis at MITWR Wave Rejection
xxxv


Symbols
a = control loop switching weighting factorA = amplitude of a sinusoidal waveAij = (i,j) component of the impulsive hydrodynamic-added-mass
matrixAs = the area of the section
β = incident-wave propagation heading directionBij = (i,j) component of the hydrodynamic-damping matrix
c = tower-platform interfaceCp = power coefficientCpmax = maximum power coefficient
ζϕ = damping ratio of the response associated with the equation ofmotion for the rotor-speed error
q¯
= set of second time derivatives of the system DOFq¯
= set of first derivatives of the system DOF
e = error value between a desired set-point and a measured feedback
f0 = initial frequency (sweep-sine signal)f1 = final frequency (sweep-sine signal)fk¯
= non-linear force vectorf(t) = instantaneous frequency
G = gear-box relationγ = propagation decay constant
h = barge internal structure density
xxxvii

Symbols
Hs = significant wave height
IDrivetrain = drivetrain inertia cast to the low-speed shaft
j = when not used as a subscript, this is the imaginary number,√−1
J = partial cost termJT = current cost functionJT0 = initial cost function
k = kth degree of freedomK = controller gain (PI controller)Kc = control loop switching static gainKlimit = controller gain limit to ensure system stabilityKi = integral gainKp = proportional gain
λ = (or TSR) ratio between the tangential speed of the blade tip andthe current wind speed
λopt = optimum TSR
M = mass matrixMxyT = tower-base-roll to -pitch bending momentMg = generator torqueMxB = blade-root-edgewise bending momentMxT = tower-base-roll bending momentMyB = blade-root-flapwise bending momentMyT = tower-base-pitch bending moment
NGear = high-speed to low-speed bear-box ratio
ω = angular frequencyΩg = generator speedΩ∗g = reference generator speedΩr = rotor speedΩr0 = rated rotor speedωϕn = natural frequency of the response associated with the equation
of motion for the rotor-speed errorωxn = natural frequency of the response associated with the equation
of motion of the platform-pitch in terms of the translation of thehub
xxxviii
Symbols
φ = phase anglePn = nominal mechanical power∂P/∂θ = sensitivity of the aerodynamic power to the rotor-collective
blade-pitch angle
q¯
= set of system DOF
R = radious of the rotorρ = air density
σ = change factor (PZO method)
t = timeT = time interval (sweep-sine signal)tc = barge shell thicknessθ = blade-pitch angleθ∗ = blade-pitch angle referenceθAPS = blade-pitch angle of the APS feedback loopθK = rotor-collective blade-pitch at which the pitch sensitivity has
doubled from its value at the rated operating pointθPI = blade-pitch angle of the PI feedback loopθyP = platform-pitch angleθxP = platform-roll angleθWR = blade-pitch angle of the WR feedback loopTi = integrator time constant (PI controller)Tp = peak spectral period
u¯
= vector of the control inputsud¯
= vector of the input disturbances
Vw = wind speed
W = weight of the partial cost term
Xi = ith component of the frequency- and direction-dependent com-plex incident-wave-excitation force on the support platform perunit wave amplitude
xOz = orthogonal axes x-z plane
xxxix


CHAPTER
1Introduction
This chapter aims to provide the context of the Ph.D. research done on the ad-vanced control of floating offshore wind turbines. An introduction to offshore windenergy is presented first, continuing with the motivation which has encouraged thedevelopment of this research, as well as its objectives and scope. An outline of thethesis is given at the end of this chapter.
1

1. INTRODUCTION
1.1 Offshore Wind EnergyGreenhouse gas emissions and the exhaustion of fossil resources have increased
the urgency of concerns about global warming as well as the necessity for devel-
oping renewable energy production alternatives worldwide. Since the early 70’s,
and thanks to supportive governmental policies, some sources of renewable en-
ergy, such as solar, hydro and wind electricity, have been gradually taking on an
important role in the world’s Total Primary Energy Supply (TPES). Concretely,
renewable energies have kept their rank as the third largest contributor to global
electricity production during the recent period. They accounted for 23.8% of world
generation, after coal (27.9%) and gas (27.7%), but ahead of nuclear (18.0%) and
oil (2.0%), according to the International Energy Agency (IEA) [1].
Among renewable energy technologies, the wind energy sector has experienced
a remarkable growth in the last decade. Currently, Asia is the largest wind energy
contributor in the world, followed by the EU, the US, and South America. The
global amount of accumulative wind energy capacity was 539, 123 MW in 2017,
according to the Global Wind Energy Council (GWEC)1. The vast majority of wind
energy is installed onshore; however, the expansion of the wind energy production
to offshore emplacements has contributed to this growth. After the first offshore
wind farm was installed in Denmark in 1991, called Vindeby, an exponential in-
crease has been seen in the cumulative offshore wind energy capacity worldwide
[2], as can be seen in the left side of Figure 1.1. The largest contributor is the
UK, amounting to 36.3% of the total installed offshore wind capacity, followed by
Germany with 28.5%, China with 14.8%, and so on.
Offshore wind energy production, i.e. the generation of electricity by means of
wind turbines installed at sea some miles offshore, has several advantages over con-
ventional onshore wind energy production: (1) the areas with the best wind quality
for wind energy production can be reached, so the offshore wind power generation
is higher per amount of installed capacity; (2) it solves the lack of available terrain
for new onshore wind farm emplacements, reducing the visual and noise pollution
for nearby neighbourhoods; and (3) it has a lesser environmental impact on the
forests as well as on wildlife [3].
1https://gwec.net/global-figures/graphs/
2

1.1 Offshore Wind Energy
Figure 1.1: Global offshore wind energy capacity according to GWEC.
The sea remains a vast space where at first sight there seems to be enough space
for offshore wind farms. Nevertheless, the current technological solutions for har-
vesting offshore wind energy, i.e. bottom-fixed wind turbines (gravity base, pilot,
jacket, ...) (see Figure 1.2), are designed for areas of shallow water, with depths
less than 80–100 m [4]. However, it is becoming progressively less economical
and more difficult (or impossible) to install in depths of water of more than 30–
40 metres [5][6]. This limitation reduces significantly the available offshore areas
worldwide for the installation of bottom-fixed wind turbines. Thus, an alternat-
ive solution to overcome this limitation is required, such as mounting the offshore
wind turbines onto a floating structure [7], i.e. the Floating Offshore Wind Turbines
(FOWT) (see Figure 1.2). This provides the chance to produce electricity in areas
of deep water, which is especially desirable for steeply-shelving coastal countries.
The first vision of mounting a large-scale wind turbine on a floating structure
was in 1972, by Professor William E. Heronemos at the University of Massachu-
setts, Amherst (MA, USA). Some publications appeared [8][9] before the idea was
3
1. INTRODUCTION
Figure 1.2: Illustrative representation of the main offshore wind turbine concepts.
taken up again in the late 90’s by the commercial wind industry, which started car-rying out the first research studies and moving the topic to the academic sector.Research in FOWT systems was not carried out until that decade due to the windmarket’s being focused on developing bottom-fixed wind turbines in shallow waterareas. Although several institutions started researching in FOWT, it was not untilthe year 2007 when the first FOWT prototype was launched into the sea in Italy,named BlueH. This project marked the beginning of a new era for offshore windenergy, with the materialisation of that academic idea. Since then, more than adozen prototypes have been tested worldwide, most of them in the EU, but alsoin the US and Japan. Although this technology is in its early development stages,some commercial projects have been carried out. As of 2018, the world’s first op-erational floating wind farm started producing electricity in Scotland. Past, presentand near future FOWT projects are analysed in detail in Section 2.2.
4

1.2 Motivation
1.2 MotivationAt present, bottom-fixed wind turbines are cheaper to build because they use the
existing onshore technology for their monopiles and jacket structures. The current
FOWT projects, however, require an individualised structure fabrication, mounting,
deployment and installation, including special boats and cranes for the installation
and towing, increasing all of them the final Levelised Cost Of Energy (LCOE) [10].
Once the floating technology reaches a more developed technological stage and the
floating platforms go into series production, mass production can reduce their fab-
rication cost. According to experts, the FOWT technology will take between 10
and 15 years to mature and be able to compete with the other currently available
sources of electricity. It is predicted that the demand for electricity will increase in
this period of time in relation to the population growth [11], increasing electricity
prices and, hence, making the FOWT technology more competitive. The polit-
ical commitments and agreements will also help in this regard, due to the global
concerns about the need for decarbonisation.
The hydrodynamic stiffness of the platforms in FOWT systems presents a rigid-
ity in the tower-base lower than that of the bottom-fixed or onshore wind turbines.
During performance, the stability of the system can be affected by the coupling
between the control of the wind turbine and the dynamics of the platform [12], ex-
citing motions of the platform [13][14] known as platform negative damping effect
[15]. This coupling produces an additional oscillatory movement of the overall
FOWT system, damaging its mechanical components [16], drastically reducing its
working life, and, hence, the profitability of the investment. This drawback can be
overcome by mechanical means with a large and heavy floating platform. In this
regard, a platform with a larger hydrostatic stiffness costs more to build [10], while
a less hydrodynamically stable platform affects the FOWT’s performance [17].
Therefore, the motivation for this thesis is to investigate the relation between
the fundamental FOWT performance features, especially in terms of the challenges
posed to the turbine control system by less hydrodynamically stable, more eco-
nomical and compact platforms. This poses great challenges for the development
of control algorithms able to improve the system performance, minimise the struc-
tural loads produced by wind and waves, and provides stable operation in the harsh
5

1. INTRODUCTION
offshore environments. The improvement of the FOWT system performance willprovide (1) alleviation of the stress suffered by the mechanical components, in-creasing the operational lifetime of the wind turbine, or the redesign of some com-ponents so as to make them more cost competitive, and (2) an increase in the qualityand amount of energy produced per operation time. All this will make the FOWTtechnology more efficient and competitive, contributing to the reduction of the useof other fossil fuels and polluting energy sources, which will promote the develop-ment of a greener world.
6
1.3 Objectives, Scope, and Outline
1.3 Objectives, Scope, and OutlineThe main objectives of this thesis can be summarised under three headings:
1. The reduction of the platform dynamics produced by low hydrodynamic stiff-
ness while improving the regulation of the generator speed, so as to improve
the tower and blade mechanical loads as well as the generator power quality.
2. The solution to achieve the previous objective must be cost effective and
feasible, not including any additional actuator, and being implementable to
different FOWT models.
3. Investigate the relation between the fundamental FOWT performance fea-
tures, especially in terms of the challenges posed to the turbine control sys-
tem by less hydrodynamically stable, more economical and compact plat-
forms.
The first objective addresses the principal development problem of the FOWTs,
where the platform’s low hydrodynamic stiffness and the wind turbine control reg-
ulation increase the platform dynamics, leading to a deterioration of the mechan-
ical components due to the increased loads and generator power quality due to the
increased generator speed excursions. A reduction in the mechanical loads will
improve the lifetime of the components and the profitability of the investment. The
second objective makes the solution cost effective, not including any complex ac-
tuator, and flexible enough to be implementable in different FOWT models. The
third objective aims to investigate the challenges posed to the control system by a
less hydrodynamically stable, more affordable and compact platform.
Chapter 2 presents the state of the art of the FOWTs worldwide. The main float-
ing technologies for a FOWT system are presented. The most significant FOWT
projects worldwide are listed and analysed. The available simulation tools for the
FOWT system are presented. The FOWT working regions, conventional baseline
control, and limitations are explained. A literature review of the control techniques
designed for FOWT systems previous to the development of this thesis is presented
at the end of the chapter.
7
1. INTRODUCTION
Chapter 3 presents the non-linear FOWT models used for the development ofthis thesis. The conventional linearisation process and the limitations found withthe FOWT systems are explained. An alternative method that avoids the presentedlinearisation issue is proposed. The process carried out for designing and modellingmore compact platforms is explained. The validation of the family of designedplatforms is presented before continuing with the next chapter.
Chapter 4 presents the baseline controllers implemented for the FOWT mod-els used in this thesis. The advanced control techniques design process, time- andfrequency-domain performances, and load analysis are then presented. The scalab-ility of the designed advanced control technique is demonstrated. A discussion ofthe results achieved with the proposed advanced control technique is given at theend of the chapter.
Chapter 5 proposes an optimisation process to improve the designed controlloop and performance. The optimisation method, time- and frequency-domain per-formances, and load analysis are presented. A discussion of the results achieved incomparison to those of a manually designed control is provided.
In Chapter 6, the main conclusions and contributions collected during the devel-opment of this thesis and, also, some directions and recommendations for furtherresearch are suggested.
8
CHAPTER
2Background for Floating
Offshore Wind Technology
This chapter presents the state of the art of the FOWTs. It focuses on the cur-rent status of the FOWT technology, including the previously published scientificresearches. This chapter provides a technological review to get a common pointof view for the reader and the author. Furthermore, the basic wind turbine controlconcepts and performance for the understanding of this thesis are explained.
9
2. BACKGROUND FOR FLOATING OFFSHORE WIND TECHNOLOGY
2.1 Floating TechnologiesThe floating technologies applied to the FOWTs comes from the oil & gas industry,which began using them for the design of floating stations since the 1930s, whenthe extraction of oil and gas was carried out in brackish coastal areas before goingdeeper into the open sea.
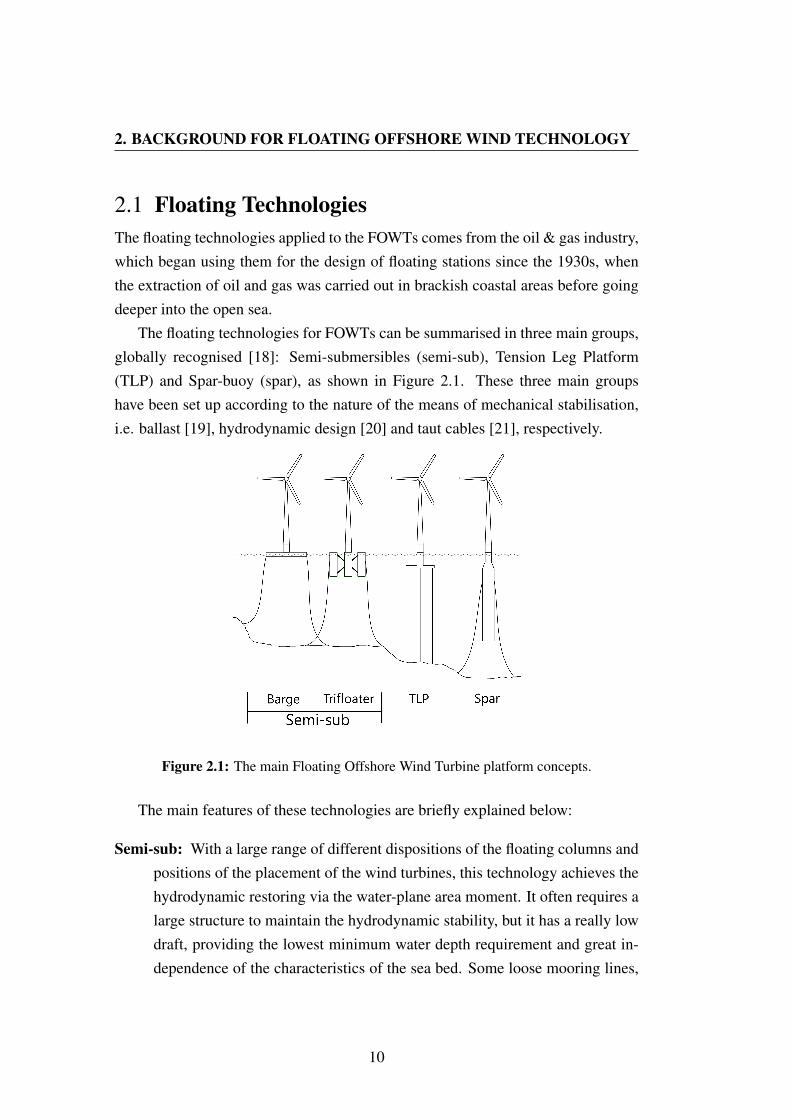
The floating technologies for FOWTs can be summarised in three main groups,globally recognised [18]: Semi-submersibles (semi-sub), Tension Leg Platform(TLP) and Spar-buoy (spar), as shown in Figure 2.1. These three main groupshave been set up according to the nature of the means of mechanical stabilisation,i.e. ballast [19], hydrodynamic design [20] and taut cables [21], respectively.
Figure 2.1: The main Floating Offshore Wind Turbine platform concepts.
The main features of these technologies are briefly explained below:
Semi-sub: With a large range of different dispositions of the floating columns andpositions of the placement of the wind turbines, this technology achieves thehydrodynamic restoring via the water-plane area moment. It often requires alarge structure to maintain the hydrodynamic stability, but it has a really lowdraft, providing the lowest minimum water depth requirement and great in-dependence of the characteristics of the sea bed. Some loose mooring lines,
10

2.1 Floating Technologies
usually three or four, keeps the system on a given spot with some drift dis-
placement freedom.
TLP: The platform is forced to be submerged through tension mooring ties fixed
to the seabed. It has very high axial stiffness (low vertical elasticity) aim-
ing to eliminate vertical motion, creating a buoyancy force to achieve the
hydrodynamic restoring. Usually, a small floating structure is required, but
challenges with the installation process and operational risks are frequent.
Normally three to five tension lines hold the wind turbine base submerged.
Spar: The large-diameter and single vertical elongated cylinder shape (between
70 and 120 m depth approx.) submerged into the water maintains the hydro-
dynamic restoring, thanks to the very low centre of mass, for ballast against
overturning. Thus, the centre of gravity must be lower than the centre of
buoyancy to ensure the hydrodynamic stability. Some loose mooring lines,
usually three, keep the system on a given spot with some drift displacement
freedom. This type of platform is designed for very deep sea water areas.
According to the installation site and the involved company, the FOWT concept
is stabilised by one of the mentioned floating technology, each one holding its pros
and cons [22], as shown in Table 2.1. The spar platform has a very high hydro-
dynamic stiffness due to the large under-water structure. This hydrodynamic sta-
bility provides a good behaviour in terms of wave-induced motions. However, the
huge structural dimensions and weight make its construction and installation quite
difficult, which involves increased costs. The semi-sub platform has the lowest
hydrodynamic stiffness due to its low draft and weight. Therefore, this floating
technology present the highest sensitivity to wave-induced motions. However, it
has the best advantages due to its construction and installation process, being the
most economical solution since the ‘concepts with the lowest steel mass have the
best performance with respect to LCOE’ [23]. Nevertheless, this is highly depend-
ent on the shape of the platform and the complexity of the building. The TLP
provides good hydrodynamic stiffness and low critical wave-induced motions due
to its low vertical elasticity. However, difficulties have been reported in keeping
system stable during transport and installation. Also, the cost of the anchoring of
11
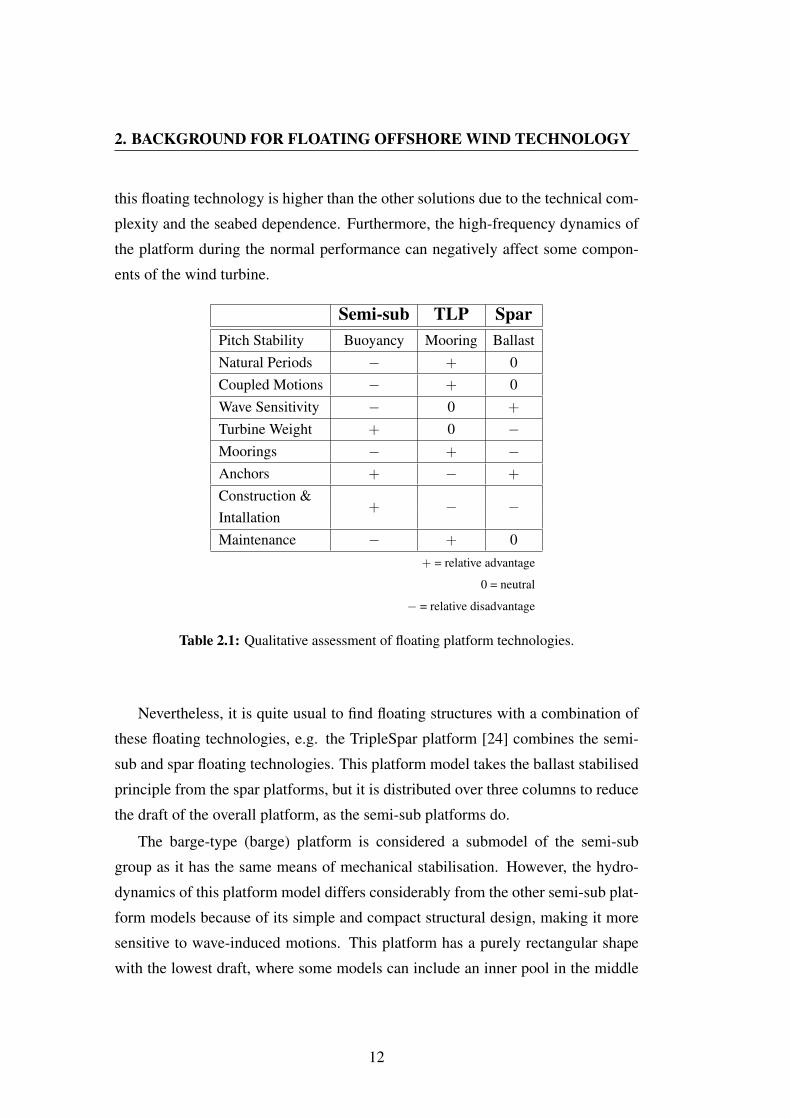
2. BACKGROUND FOR FLOATING OFFSHORE WIND TECHNOLOGY
this floating technology is higher than the other solutions due to the technical com-
plexity and the seabed dependence. Furthermore, the high-frequency dynamics of
the platform during the normal performance can negatively affect some compon-
ents of the wind turbine.
Semi-sub TLP SparPitch Stability Buoyancy Mooring BallastNatural Periods − + 0Coupled Motions − + 0Wave Sensitivity − 0 +
Turbine Weight + 0 −Moorings − + −Anchors + − +
Construction &+ − −
IntallationMaintenance − + 0
+ = relative advantage
0 = neutral
− = relative disadvantage
Table 2.1: Qualitative assessment of floating platform technologies.
Nevertheless, it is quite usual to find floating structures with a combination of
these floating technologies, e.g. the TripleSpar platform [24] combines the semi-
sub and spar floating technologies. This platform model takes the ballast stabilised
principle from the spar platforms, but it is distributed over three columns to reduce
the draft of the overall platform, as the semi-sub platforms do.
The barge-type (barge) platform is considered a submodel of the semi-sub
group as it has the same means of mechanical stabilisation. However, the hydro-
dynamics of this platform model differs considerably from the other semi-sub plat-
form models because of its simple and compact structural design, making it more
sensitive to wave-induced motions. This platform has a purely rectangular shape
with the lowest draft, where some models can include an inner pool in the middle
12

2.1 Floating Technologies
of the structure to increase the motion damping, such as the IDEOL’s Floatgen1
demonstrator [25]. This simple design facilitates the building process, installation,and decommissioning, which reduces the final LCOE. Apart from these improve-ments, the same pros and cons as those of semi-subs are hold.
There are other conceptual FOWT designs, which include more than one windturbine in the same large semi-sub platform, i.e. multi-turbine floating platforms[26][27]. In some cases, this multi-turbine floating system can also be combinedwith other energy production technologies, e.g. wave [28][29] or tidal [30].
1https://www.ideol-offshore.com/en/floatgen-demonstrator
13
2. BACKGROUND FOR FLOATING OFFSHORE WIND TECHNOLOGY
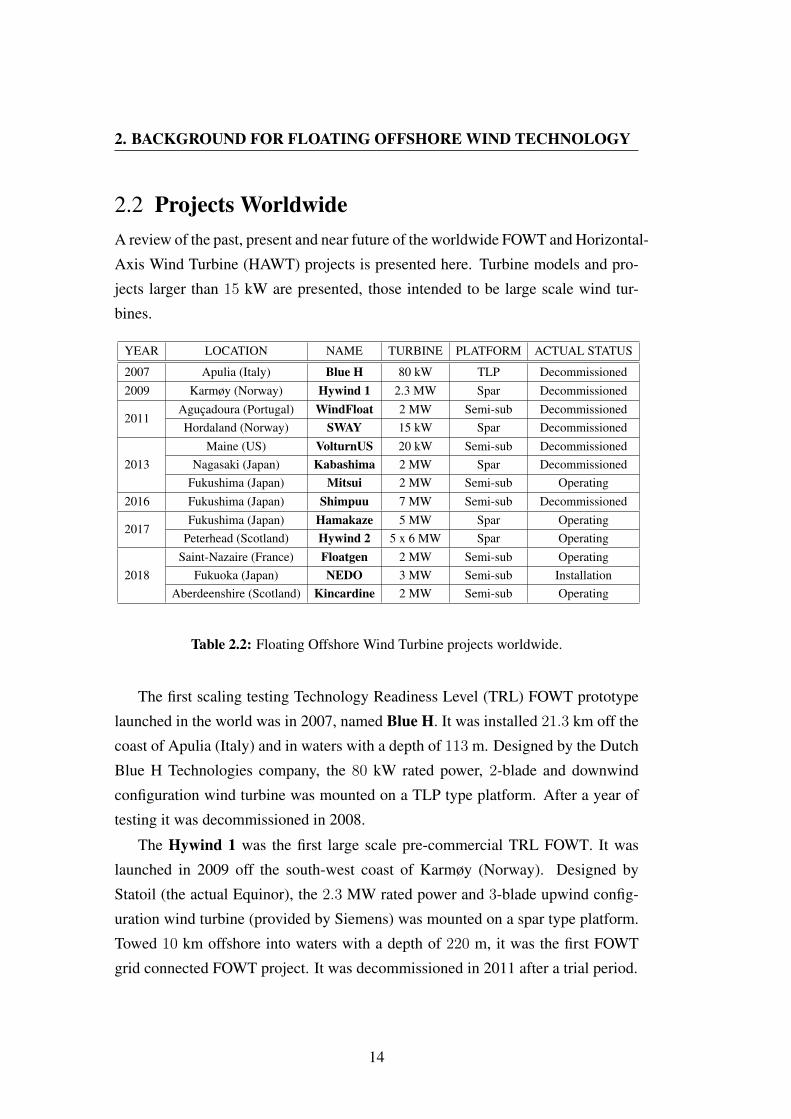
2.2 Projects WorldwideA review of the past, present and near future of the worldwide FOWT and Horizontal-
Axis Wind Turbine (HAWT) projects is presented here. Turbine models and pro-
jects larger than 15 kW are presented, those intended to be large scale wind tur-
bines.
YEAR LOCATION NAME TURBINE PLATFORM ACTUAL STATUS
2007 Apulia (Italy) Blue H 80 kW TLP Decommissioned2009 Karmøy (Norway) Hywind 1 2.3 MW Spar Decommissioned
2011Agucadoura (Portugal) WindFloat 2 MW Semi-sub DecommissionedHordaland (Norway) SWAY 15 kW Spar Decommissioned
2013Maine (US) VolturnUS 20 kW Semi-sub Decommissioned
Nagasaki (Japan) Kabashima 2 MW Spar DecommissionedFukushima (Japan) Mitsui 2 MW Semi-sub Operating
2016 Fukushima (Japan) Shimpuu 7 MW Semi-sub Decommissioned
2017Fukushima (Japan) Hamakaze 5 MW Spar Operating
Peterhead (Scotland) Hywind 2 5 x 6 MW Spar Operating
2018Saint-Nazaire (France) Floatgen 2 MW Semi-sub Operating
Fukuoka (Japan) NEDO 3 MW Semi-sub InstallationAberdeenshire (Scotland) Kincardine 2 MW Semi-sub Operating
Table 2.2: Floating Offshore Wind Turbine projects worldwide.
The first scaling testing Technology Readiness Level (TRL) FOWT prototype
launched in the world was in 2007, named Blue H. It was installed 21.3 km off the
coast of Apulia (Italy) and in waters with a depth of 113 m. Designed by the Dutch
Blue H Technologies company, the 80 kW rated power, 2-blade and downwind
configuration wind turbine was mounted on a TLP type platform. After a year of
testing it was decommissioned in 2008.
The Hywind 1 was the first large scale pre-commercial TRL FOWT. It was
launched in 2009 off the south-west coast of Karmøy (Norway). Designed by
Statoil (the actual Equinor), the 2.3 MW rated power and 3-blade upwind config-
uration wind turbine (provided by Siemens) was mounted on a spar type platform.
Towed 10 km offshore into waters with a depth of 220 m, it was the first FOWT
grid connected FOWT project. It was decommissioned in 2011 after a trial period.
14

2.2 Projects Worldwide
The WindFloat was the first FOWT large scale pre-commercial TRL mounted
in a tricolumn semi-sub type platform. It was launched in 2011 5 km off the coast
of Agucadoura (Portugal). The 3-blade upwind and 2 MW rated power wind tur-
bine (provided by Vestas) was connected to the Portuguese electrical grid. It was
decommissioned after a trial period.
In the same year, the SWAY scaling testing TRL FOWT was installed off the
coast of Hordaland (Norway). The 3-blade downwind configuration and 15 kW
rated power wind turbine was mounted on a spar floating technology platform. This
FOWT included a novel system of tension rods on the upwind side reinforcing the
tower and significantly reducing the steel weight of the tower as well as building
cost. It was decommissioned after a trial period.
In 2013, the VolturnUS American first scaling testing TRL FOWT was launched
off the coast of Maine (USA). The 3-blade and 20 kW rated power wind turbine
was mounted on a semi-sub floating technology platform. It was decommissioned
after a trial period.
In the same year, Kabashima, Japan’s first pre-commercial FOWT, was launched
off the coast of Nagasaki (Japan). The 3-blade downwind configuration and 2 MW
rated power wind turbine was mounted on the first concrete spar floating platform.
It was decommissioned after a trial period.
One month later, the Mitsui pre-commercial FOWT was installed off the coast
of Fukushima (Japan). The 3-blade downwind and 2 MW rated power wind turbine
was mounted on a four column compact semi-sub floating platform. At the same
time, the Kizuna substation was installed in the same location on an advanced spar
floating technology platform to transport the generated power to shore. Both float-
ing systems completed the first phase of the Fukushima Floating Offshore Wind
Farm Demonstration project.
In 2016, the second phase of the Fukushima project was carried out, where two
FOWT pre-commercial models were installed: the Shimpuu with a 3-blade upwind
configuration and 7 MW wind turbine mounted on a V-shape semi-sub platform,
and the Hamakaze with a 3-blade downwind configuration and 5 MW wind turbine
mounted on an advance spar platform. The installation phase was not finished
until the beginning of 2017. The Shimpuu wind turbine was decommissioned in
October 2018, earlier than planned, due to multiple malfunctions. There is very
15
2. BACKGROUND FOR FLOATING OFFSHORE WIND TECHNOLOGY
little information available about the current status of the Fukushima project. The
Hamakaze wind turbine is still operating.
In 2017 the Hywind 2 first floating wind farm project (also known as Hywind
Scotland Pilot Park) started operating off the Peterhead (Scotland) coast. This farm
is composed of five 6 MW, 3-blade upwind configuration wind turbines, all of them
mounted on spar floating platforms. The wind farm is connected to the Scottish
electric grid and currently is producing more power than was expected during the
design stage.
In 2018 the Floatgen and NEDO projects were being carried out in France and
Japan, respectively. Both are mounted on the IDEOL’s designed barge platform,
which includes a damping pool in the centre of the floating concrete square struc-
ture. The first one is located in the SEM-REV testing site 22 km off the Le Croisic
(France) coast in waters 30 m deep. The 3-blade upwind configuration and 2 MW
wind turbine is currently being tested under real operating conditions before being
decommissioned in the next year. The second one is located 15 km off the Shir-
ashima coast (Japan) in waters of 50 m depth. The 2-blade upwind and 3 MW wind
turbine is currently in the construction/installation phase.
Later, this same year, the Kincardine project, located 15 km off the Aberdeen-
shire coast in waters with a depth of 60 m, started delivering electric power to the
Scottish grid in 2018. In the first phase of the project, the installation of a 3-blade
upwind configuration and 2 MW wind turbine mounted on a semi-sub platform
inspired by the Portuguese WindFloat project was carried out. The second phase
of the project, scheduled for 2020, contemplates the installation of five 9.6 MW
FOWT farm in the same location.
Apart from these pre-commercial or scale prototypes of FOWTs, several con-
ceptual projects have been designed during these development years. The most
significant ones are shown in Figure 2.2, according to the floating technology and
the TRL. Sometimes, it is difficult to obtain detailed information about some pro-
jects and their development status due to the secrecy involved in these research
projects.
Although all the pre-commercial or commercial level FOWT projects are moun-
ted on semi-sub or spar type platforms, Figure 2.2 shows other scale testing level
projects mounted on semi-sub platforms. This means that the involved companies
16

2.2 Projects Worldwide
mostly bet on the semi-sub floating technology rather than the spar one. Further-more, this figure shows that the TLP floating technology is falling behind in theTRL race. There are neither pre-commercial nor commercial level projects beingdeveloped yet with the TLP floating technology.
VolturnUS (US)
Blue H (NL)Pelastar (US)
Gicon (GE)
CONCEPT DEVELOPMENT SCALE TESTING FULL SCALE PROTOTYPE
HiPR Wind (EU)W2Power (SP)
PRE-COMMERCIAL/COMMERCIAL
Floatgen (FR)
WindFloat (PT)NEDO (JP)
GustoMSC (NL)
Shimpuu (JP)
Kincardine (UK)
Mitsui (JP)
Hywind 2 (UK)
European Union (EU); France (FR); Germany (GE); Japan (JP); United Kingdom (UK); Netherland (NL); Norway (NO); Portugal (PT); Spain (SP); United States (US)
Nautica AFT (US)
Hywind 1 (NO)Sway (NO)
Sea Reed (FR)Nautilus (SP)
NezzySCD (GE)
Se
mi-
Su
bm
ers
ible TetraFloat (UK)
Sath (SP)
Hamakaze (JP)Kabashima (JP)
TL
P
WindCrete (SP)
EcoTLP DBD (US)TLPWind (SP)
Sp
ar-
Bu
oy
Figure 2.2: Worldwide Floating Offshore Wind Turbine projects according to thefloating technology and Technology Readiness Level.
Several projects are currently under development. Some of them are: the pre-viously mentioned Kincardine second phase project; the DounreayTri Hexiconmultiturbine with two 5 MW wind turbines scheduled for 2020; the NewEnglandAqua Ventus first phase project with two 6 MW semi-sub platforms inspired bythe VolturnUS prototype, to be installed in the UMaine Deepwater Offshore WindTest Site; the WindFloat Atlantic project formed by three 8.4 MW wind turbinesmounted on semi-sub platforms inspired by the WindFloat prototype, to be in-stalled where the previous WindFloat pilot FOWT was decommissioned; the Groix& Belle-Ile floating wind pilot farm project to install four 6-MW wind turbines offFrance’s Atlantic coast, and Golfe du Lion, Eolmed, and Provence Grand Largewind pilot farms projected off France’s Mediterranean coast; among others.
17

2. BACKGROUND FOR FLOATING OFFSHORE WIND TECHNOLOGY
2.3 Simulation ToolsSoftware for the simulation of wind turbines is based on a set of mathematical for-mulas to reproduce, on a computer, the performance of the system. It providesengineers with a preview of the behaviour of the designed part without running therisk of damaging a real wind turbine. For the research presented in this thesis, asimulation tool is required to test the designed control algorithms in a virtual windturbine model. The main drawback is that the FOWTs are very complex systems,which not only include aerodynamics, structural dynamics, and servo-elastic beha-viours, but also include the hydrodynamics and mooring dynamics of the floatingplatform. Therefore, several comprehensive testing, code-to-code comparison andvalidation campaigns are usually carried out. The aim of these campaigns is tocheck the accuracy of the simulation results with those obtained with a scaled orfull FOWT prototypes. Some of these code comparison projects are known as OC3(2005–2009) [31], OC4 (2010–2013) [32] and OC5 (2014–2018) [33]. Since theFOWT industry is quite new, more measurement data is needed to improve thecode validation and simulations. Nevertheless, an actual simulations provides avery good approach to the real dynamics of the FOWT systems. The most com-mon aero-hydro-servo-elastic simulation programs for FOWTs [34] [35], capableof performing integrated dynamic calculations, are listed in Table 2.3 below:
SOFTWARE DEVELOPER LICENSE
Bladed DNV-GL proprietaryFAST NREL open-sourceHAWC2 DTU Risoe proprietarySIMPACK SIMPACK AG proprietary3DFloat UMB proprietarySIMO/RIFLEX MARINTEK proprietaryADAMS MSC proprietary
Table 2.3: Floating Offshore Wind Turbine simulation programs.
Bladed, FAST, 3DFloat and HAWC2 are specific programs for the wind tur-bine sector, while SIMPACK, SIMO/RIFLEX and ADAMS can work for automot-ive, aeronautical, and robotic applications, among others. For the development of
18
2.3 Simulation Tools
this thesis, it was decided to use Fatigue, Aerodynamics, Structures, and Turbu-
lence (FAST) from National Renewable Energy Laboratory (NREL) due to: (1)
its great flexibility in modifying the parameters and characteristics of the FOWT
model, as well as the provided simulation options and the ability to obtain linear-
ised models; (2) the open-source nature of the software, which allows manipulating
the internal formulas if necessary, the free code downloading and diffusing in the
scientific community; (3) the available online FOWT models, preprocessor and
postprocessor data analysis tools, and technical forum support; (4) the wide use
of the software in the scientific community as evidenced by the large amount of
results published in research articles found in the literature; (5) the possibility of
linking the software with a Matlab/Simulink interface, enabling users to implement
advanced controls with convenient block diagrams in a simple and rapid form; and
(6) the positive evaluation of the FAST code by Germanischer Lloyd WindEnergy
GmbH certifier [36].
FAST is a Computer-aided Aeroelastic Engineering (CAE) tool for HAWT
simulation. This comprehensive aerolastic program is capable of predicting the
extreme and fatigue loads of onshore, offshore bottom-fixed and FOWT systems.
It joins the aerodynamic models (aero), hydrodynamic models (hydro), control and
electrical system (servo) dynamics models, and structural (elastic) models to en-
able time-domain aero-hydro-servo-elastic simulations. It is coupled with different
sub-modules for generating the wind fields (TurbSim/InfloWind) as well as com-
puting the aerodynamics (AeroDyn) and hydrodynamics (HydroDyn), as one can
see in [37] and [38].
FAST models combine the modal and multibody dynamics formulations [39].
It is formed by flexible and rigid bodies, where apart from the flexible ones, such
as the tower, blades, and drivetrain, the rest are modelled as rigid. FAST has the
ability to model 24 Degree Of Freedom (DOF) for a three-blade FOWT topology:
three platform translational DOF (surge, sway, and heave) and three rotational (roll,
pitch, and yaw)(6 DOF)(see Figure 2.3); the first and second modes of the tower
fore–aft and side-to-side (4 DOF); nacelle yaw (1 DOF); variable generator and
drivetrain rotational-flexibility (2 DOF); rotor- and tail-furl (2 DOF); and, the first
and second flapwise modes as well as the first edgewise mode for each blade (9
DOF). Blade teetering DOF can also be enabled for a two-blade wind turbine.
19

2. BACKGROUND FOR FLOATING OFFSHORE WIND TECHNOLOGY
Figure 2.3: Degrees of freedom of the motion of the barge [40].
Note that the 7th version of FAST, from now on FAST7, is going to be usedin this work only for the linearisation process of the FOWTs. For time-domainsimulations, the 8th version of FAST, from now on FAST8, will be used. The useof FAST7 is because during the development of this thesis FAST8 does not yethave the ability to linearise FOWT models.
20
2.4 Control
2.4 ControlThe wind turbine control system is based on sensors, actuators and the software thatlinks these elements [41]. The software processes the input signals from the sensorsand generates output signals for the actuators. The purpose of the control is, then, tomanage the right performance of the wind turbine by means of a supervisory systemduring all working states and conditions. The wind turbine is constantly monitoredby a software program to decide which action is going to be taken next. The mainobjective of the control system is the trade-off between the power tracking and thefatigue load reduction while ensuring the overall integrity of the wind turbine. Thatis:
• Extract the maximum energy from the wind.
• Guarantee the overall integrity and correct performance of the wind turbine.
• Minimise the fatigue loads and stresses of the mechanical components.
There are four different control levels, according to the purposes of the con-trol: the safety control level is the top level of the controller and is responsibleof ensuring the overall integrity of the wind turbine, activating an emergency stopif necessary; the supervisory control level is the next level and is responsible fordeciding on the operating region (see Subsection 2.4.1) of the wind turbine depend-ing on the environmental conditions, including shut-down and power-up, enablingdifferent components, verifying the status of the sensors, etc.; once the workingregion is determined, the working control level takes care of the generator torqueand blade-pitch angle so as to extract the maximum power from the wind in eachregion (see Subsection 2.4.2); the last level, the subsystem control level, operatesinside each actuator and follows the commands given by the working control levelto the actuator.
This study is focused on the working control level. Nevertheless, the super-visory control level is going to be explained for the correct understanding of theworking control level. The highest and lowest control levels, i.e. the safety andsubsystem control levels, are not going to be analysed since that is not necessaryfor the achievement of the objectives of this study.
21
2. BACKGROUND FOR FLOATING OFFSHORE WIND TECHNOLOGY
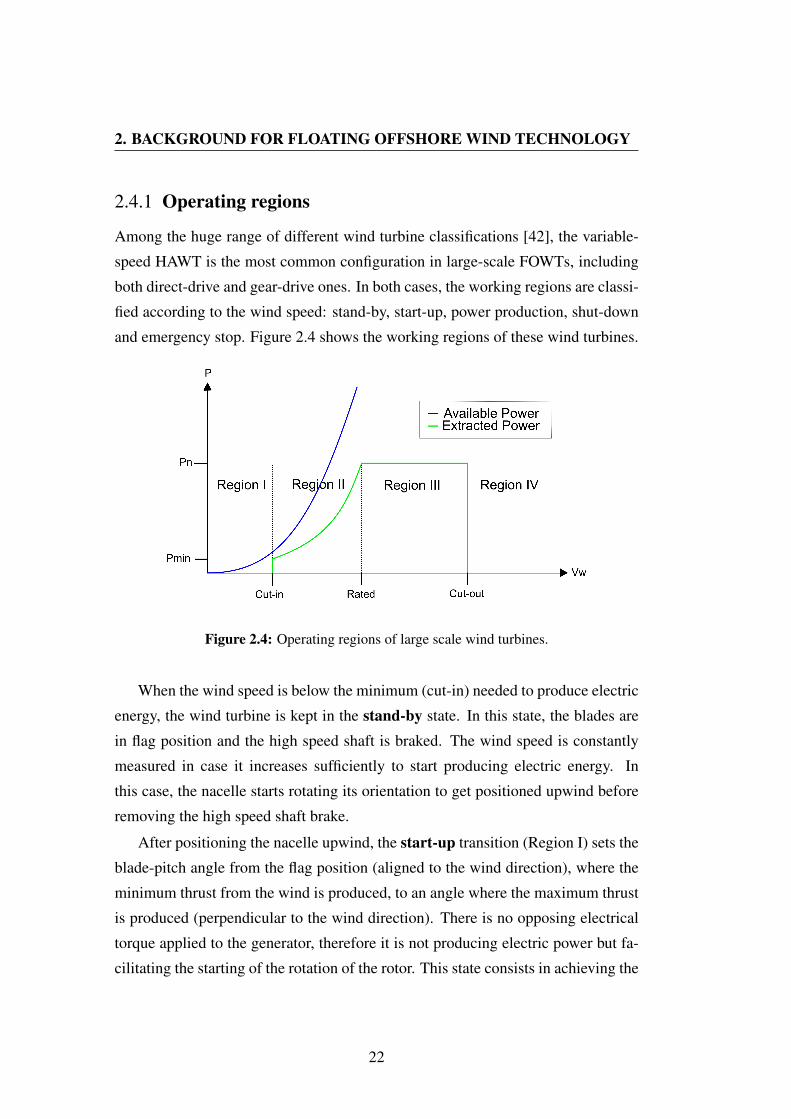
2.4.1 Operating regions
Among the huge range of different wind turbine classifications [42], the variable-
speed HAWT is the most common configuration in large-scale FOWTs, including
both direct-drive and gear-drive ones. In both cases, the working regions are classi-
fied according to the wind speed: stand-by, start-up, power production, shut-down
and emergency stop. Figure 2.4 shows the working regions of these wind turbines.
Figure 2.4: Operating regions of large scale wind turbines.
When the wind speed is below the minimum (cut-in) needed to produce electric
energy, the wind turbine is kept in the stand-by state. In this state, the blades are
in flag position and the high speed shaft is braked. The wind speed is constantly
measured in case it increases sufficiently to start producing electric energy. In
this case, the nacelle starts rotating its orientation to get positioned upwind before
removing the high speed shaft brake.
After positioning the nacelle upwind, the start-up transition (Region I) sets the
blade-pitch angle from the flag position (aligned to the wind direction), where the
minimum thrust from the wind is produced, to an angle where the maximum thrust
is produced (perpendicular to the wind direction). There is no opposing electrical
torque applied to the generator, therefore it is not producing electric power but fa-
cilitating the starting of the rotation of the rotor. This state consists in achieving the
22
2.4 Control
minimum rotational speed before starting to apply electrical torque to the generatorand, hence, produce electric power.
Once the wind turbine is in the power production state, it will be working inone of the two middle regions (Regions II or III) according to the wind speed. Ifthe wind speed spins the generator below its rated rotational velocity (below rated),then it will be working in Region II. This is also called the rotor torque regionbecause the generator torque is being actively controlled while the blade pitch-angle is fixed at the minimum angle (usually zero degrees, perpendicular to thewind direction) to generate the highest thrust. If the wind speed is high enough thatthe generator speed reaches or surpasses the rated or nominal rotational velocity(above rated), then it will be working in Region III. In this region, also calledthe generator speed or blade-pitch control region, the blade-pitch angle is activelycontrolled to regulate the generator speed, trying to keep it constant at the ratedvalue. The generator torque in this region can be kept constant at the rated value orcan be inversely proportional to the generator speed to aid in the regulation of theelectric power output.
If the wind exceeds the maximum tolerable speed (cut-out), then the shut-downprocess is activated in Region IV. The blades of the wind turbine increase theirangle to the flag position, reducing the thrust to the minimum, to progressivelydecrease the generator speed. When the rotational speed is sufficiently low, thenthe brake is activated to block the low speed shaft and in consequence immobilisethe turbine.
The emergency stop is only activated when a fault is detected during normaloperation or in a sudden emergency action. This stop is very fast and aggress-ive, not being as suitable as the normal shut-down, since the wind turbine suffersconsiderable mechanical loads.
23
2. BACKGROUND FOR FLOATING OFFSHORE WIND TECHNOLOGY
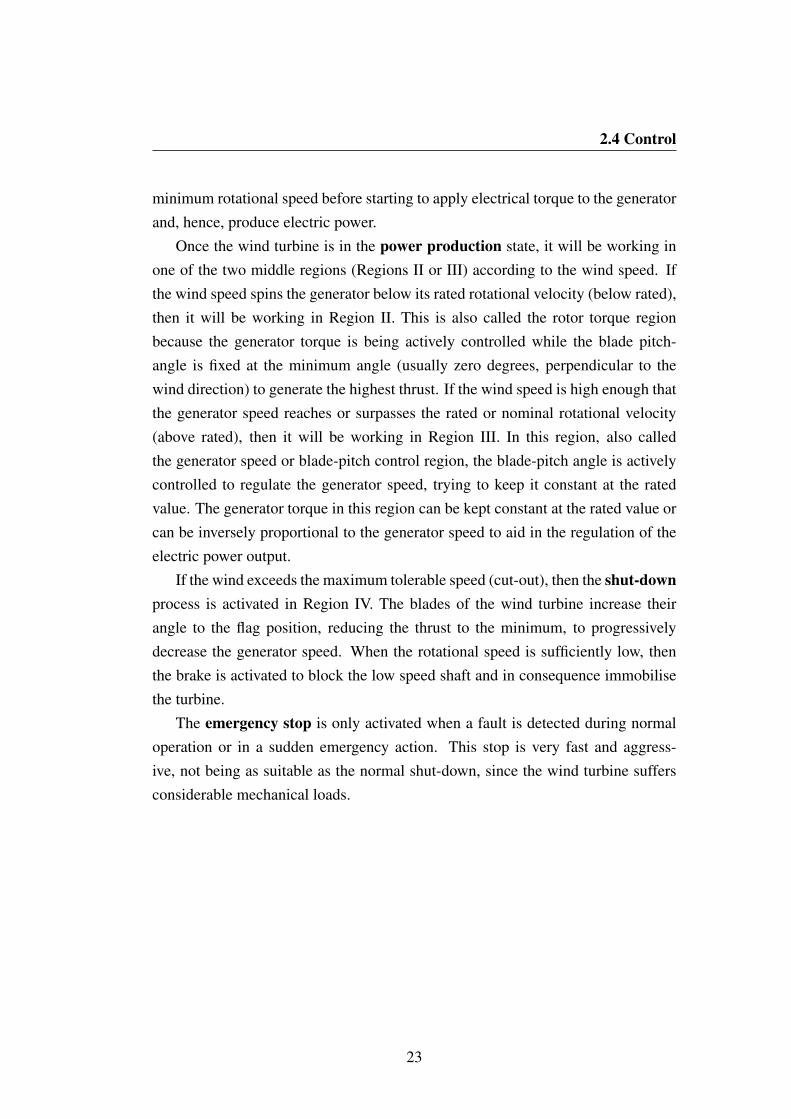
2.4.2 Conventional controlThe conventional wind turbine control technique for Region II and Region III isbased on Single-Input Single-Output (SISO) feedback loops. The Figure 2.5 rep-resents the control scheme when the wind turbine is operating below rated windspeed (Region II). The generator torque (Mg) is set according to the generator speed(Ωg) feedback.
Figure 2.5: Below rated wind speed (Region II) wind turbine control loop.
In such a Region II, Mg changes proportionally to the square of Ωg, followingthe optimal curve to extract the maximum power from the wind [43]. One can seethat
Mg = KΩ2g
K =1
2
πρR5Cpmax
λopt3G3
(2.1)
where ρ is the air density, R is the radius of the rotor, Cpmax is the maximumpower coefficient, λopt is the optimum Tip Speed Ratio (TSR), and G is the gear-box relation. The Cpmax indicates the maximum power that can be extracted fromthe wind, which is limited by Betz’s law [41] to 16/27 (59.3%) for an ideal windturbine. The λ is the ratio between the tangential speed of the blade tip and thecurrent wind speed, expressed as follows:
λ =ΩgR
VwG(2.2)
24

2.4 Control
The aerodynamic power extracted by a wind turbine can be expressed as
P =1
2πρR2V 3
wCp (2.3)
where Vw is the wind speed.
Therefore, the ability to extract the maximum available power from the wind
depends exclusively on λ, which is automatically regulated through Mg. This can
be seen in Figure 2.6, where if λ is higher than the optimum value due to the wind
speed is less than expected, then Ωg drops because the aerodynamic torque is less
than the opposing electric torque, Mg. If λ is less than the optimum due to the
wind speed is higher than the expected, then Ωg increases because the aerodynamic
torque is more than Mg. Nevertheless, if λ is in the stall zone, the automatic regu-
lation is lost because a higher wind speed results in a smaller aerodynamic torque.
Something similar happens at very low wind speeds (below cut-in), where Mg is
set to zero to let the rotor spins freely and leaves the stall zone if the wind speed is
sufficient.
Figure 2.6: λ and Cp representation.
Depending on the wind turbine model and rated power, Region I1/2 and Region
II1/2 can be implemented. Both of them consist in a linear transition between the
contiguous regions based on a torque slope to aid the start-up of the wind turbine
in Region I1/2, and to limit the tip speed (and, hence, the noise emissions due to the
turbulence in the blade tip) in Region II1/2.
25
2. BACKGROUND FOR FLOATING OFFSHORE WIND TECHNOLOGY
When the wind turbine is working in these regions, the blade-pitch angle (θ) is
fixed to the minimum angle (close to 0) to create the maximum thrust in the rotor
and, hence, the maximum aerodynamic torque, to capture the maximum power
from the wind.
When the wind turbine is operating above rated wind speed (Region III), the
control scheme is as shown in Figure 2.7. In this region, Cp is below the maximum
because the rated power and the nominal generator speed of the wind turbine have
been reached. Thus, the objective now is to keep the generator speed constant at the
rated value, by regulating the pitch angle of the blades, also known as active blade-
pitch control. The value of the blade-pitch angle, θ, is set through the well known
Proportional, Integral and Derivative (PID) controller according to the generator
speed error (e), where the error is the difference between the reference generator
speed (Ω∗g) and the current measured generator speed. The term Proportional (P)
is the proportional action, providing a control term proportional to the e, while the
term Integral (I) is the integral action, providing a control term proportional to the
integral over the time of such an error signal. The use of the Derivative (D) term
is not recommended [44] for wind turbine control. Therefore, the Proportional and
Integral (PI) controller can be expressed as
θ(t) = Kpe(t) +Ki
∫ t
0
e(τ)dτ (2.4)
Ki =Kp
Ti(2.5)
where Kp and Ki are the proportional and integral gains, respectively, and Ti rep-
resents the integration time of the controller.
In this region, Mg can be set constant at the rated value or, if it is wanted to
regulate the output power additionally to the blade-pitch PI control, then it is set
inversely proportional to the generator speed, given by
Mg =PnΩg
(2.6)
26

2.4 Control
Figure 2.7: Above rated wind speed (Region III) wind turbine control loop.
where Pn is the nominal mechanical power of the wind turbine.
The proportional gain of the PI must not behave linearly, since the aerody-
namic property of the wind turbine blades changes non-linearly within the above
rated wind speed range. This can be seen by analysing the sensitivity of the aerody-
namic power to the rotor-collective blade-pitch angle, as analysed in [15]. There,
a Gain-Scheduling (GS) is proposed using the blade-pitch angle from the previous
controller time step to calculate the Gain-Correction Factor (GK) at the next time
step:
GK(θ) =1
1 + θθK
(2.7)
where θK is the blade-pitch angle at which the pitch sensitivity has doubled from
its value at the rated operating point.
Two possibilities for the implementation of the blade-pitch control are known:
pitch-to-feather and pitch-to-stall [45]. The pitch-to-feather control increases the
wind turbine blade-pitch angle as the wind speed increases to reduce the thrust
and, hence, the generator speed. The pitch-to-stall reduces the blade-pitch angle
increasing the turbulence level downwind of the blade, increasing the aerodynamic
drag coefficient, resulting in a slow down of the generator speed. However, the ana-
lytical design of the pitch-to-stall algorithms is not suitable and the implementation
of the GS also presents some difficulties, since the operating point of the wind tur-
bine can not be known from the current blade-pitch angle. Thus, usually the large
wind turbines, with active blade-pitch control, are pitch-to-feather controlled.
27

2. BACKGROUND FOR FLOATING OFFSHORE WIND TECHNOLOGY
The switching between the below rated and above rated controllers is done by
measuring the generator speed as well as the blade-pitch angle and saturating the PI
controller, as can be seen in the flowchart in Figure 2.8. When the wind turbine is
operating below rated wind speed, the generator torque is actively regulating while
the error is negative due to the difference between the measured generator speed
and the rated generator speed. Then the ‘Integral Saturation’ block (anti-windup)
prevents the integrator from accumulating a negative value while the error is neg-
ative. During this region the ‘Pitch Limit Saturation’ block limits the proportional
value to zero. When the wind turbine starts operating above rated wind speed, be-
cause the generator speed is greater than the reference one, the generator torque is
fixed to rated or inversely proportional to the generator speed in Region III while
the PI regulates the blade-pitch angle to keep the generator speed close to the ref-
erence. In this case, the blade-pitch angle will be working between 0 and 90,
being limited by the ‘Pitch Limit Saturation’ block. The ‘Pitch Rate Saturation’
block simulates the dynamics of the maximum derivative of the blade-pitch actu-
ator. Furthermore, the blade-pitch control will never be activated if the generator
torque control is not working in Region III, and vice versa, the generator torque
will not leave Region III if the blade-pitch control is actively regulating. Some
Integrator
ProportionalGain
IntegralSaturation
IntegralGain
Pitch LimitSaturation
Pitch RateSaturation
Control RegionSelector
Torque-SpeedLookup Table
Torque LimitSaturation
Torque RateSaturation
GainSchedule
Ωg*
θ
Mg
Pitch control
Torque controlLow-Pass
Filter
+
+
+-
e
Ωg
Wind Turbine
Figure 2.8: Flow chart for the conventional control of a wind turbine.
28

2.4 Control
research studies are found in the literature about control switching strategies: (1)Shahsavari et al. presented an optimal Hybrid Model Predictive Control (HMPC)for switching between controllers and maximising the electrical power productionin [46]; and (2) Lindeberg et al. presented a more general study of the smoothtransition between controllers using the Model Predictive Control (MPC) in [47].
The blade-pitching can be done collectively or individually. Collective PitchControl (CPC) refers to when the pitch-angle of all the blades change in unison,and Individual Pitch Control (IPC) to when the pitch-angle of each blade changesindependently. The CPC is usually used as a preliminary approach to analyse thebehaviour of the wind turbine, but in a more developed design stage, and withlarge wind turbines, the IPC is highly recommended [45]. Several benefits for thealleviation of the blade loads are attributed to the IPC strategy, such as the reductionof the effect of wind shear, tower shadow, up-flow and shaft tilt. This can be doneby measuring the blade-root moments of each blade through a strain gauges.
29

2. BACKGROUND FOR FLOATING OFFSHORE WIND TECHNOLOGY
2.4.3 Limitations of conventional control
The concern in FOWTs is that when the wind turbine is operating in Region III,
and the blade-pitch PI controller is tuned as with onshore or bottom-fixed wind
turbines, a coupling between the platform-pitch motion and the blade-pitch control
can happen, known as platform negative damping [12][17]. This is due to the fact
that the blade-pitch PI controller of the onshore and bottom-fixed wind turbines is
tuned as vigorously as possible to regulate the generator speed close to the rated
value and avoid speed excursions due to wind gusts, not taking into account the
platform dynamics. Thus, when the wind flows, the thrust produced in the rotor
of the FOWT generates a downwind motion of the system due to the platform’s
low hydrodynamic stiffness. During this motion, the relative wind speed observed
by the wind turbine is less than the true wind speed, resulting in a slow down of
the generator speed. This is measured by the control unit, which tries to keep the
generator speed at the rated speed, reducing the blade-pitch angle and consequently
increasing the thrust in the rotor and, hence, increases even more the downwind
motion. Just the opposite happens when the FOWT is upwind. This effect may
lead to large resonant platform-pitch motions, increasing blade, tower, platform
and mooring line loads, as well as deteriorating the turbine performance.
In terms of control theory, this effect can be explained by analysing the root-
locus of the FOWT system. The root-locus is a graphical method for representing
the change of the poles and zeros of a transfer function with the variation of a
system parameter. In this case, the open-loop transfer function includes the blade-
pitch PI controller and the FOWT model from the blade-pitch angle to the generator
speed, as shown in Figure 2.9. The analysis is focused on the platform-pitch mode
Figure 2.9: Scheme of the transfer function for the root-locus analysis.
30
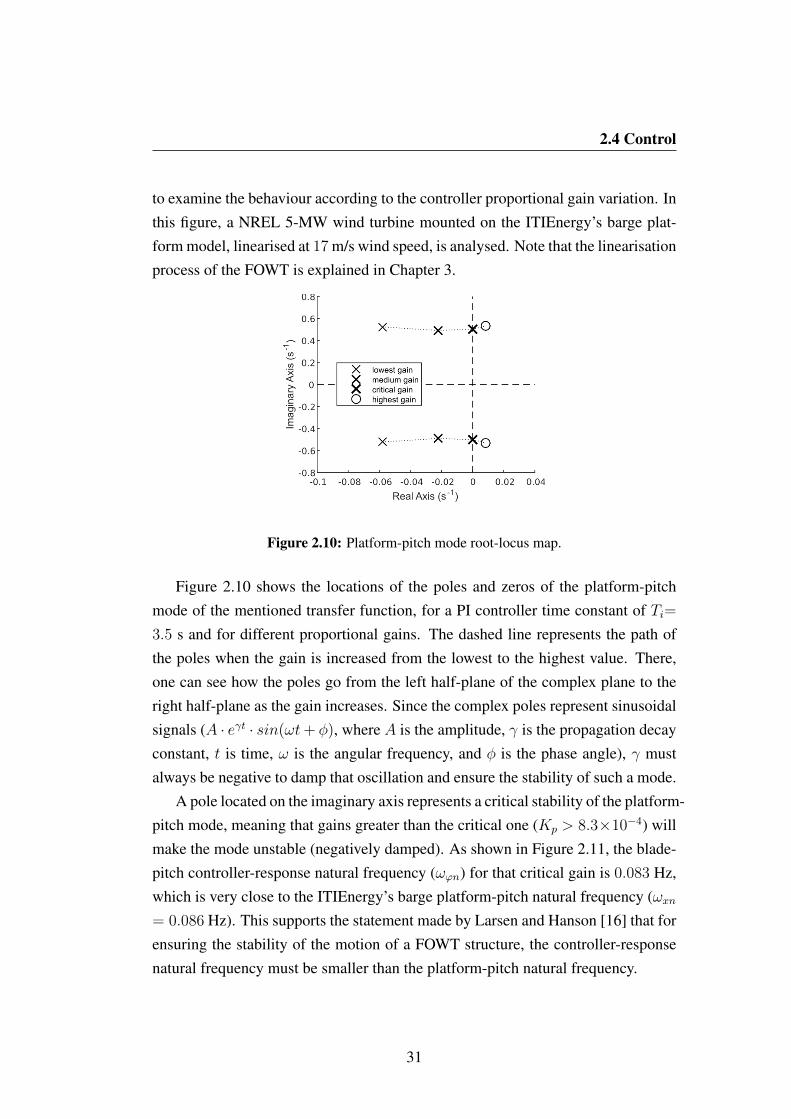
2.4 Control
to examine the behaviour according to the controller proportional gain variation. Inthis figure, a NREL 5-MW wind turbine mounted on the ITIEnergy’s barge plat-form model, linearised at 17 m/s wind speed, is analysed. Note that the linearisationprocess of the FOWT is explained in Chapter 3.
Figure 2.10: Platform-pitch mode root-locus map.
Figure 2.10 shows the locations of the poles and zeros of the platform-pitchmode of the mentioned transfer function, for a PI controller time constant of Ti=3.5 s and for different proportional gains. The dashed line represents the path ofthe poles when the gain is increased from the lowest to the highest value. There,one can see how the poles go from the left half-plane of the complex plane to theright half-plane as the gain increases. Since the complex poles represent sinusoidalsignals (A · eγt · sin(ωt+ φ), where A is the amplitude, γ is the propagation decayconstant, t is time, ω is the angular frequency, and φ is the phase angle), γ mustalways be negative to damp that oscillation and ensure the stability of such a mode.
A pole located on the imaginary axis represents a critical stability of the platform-pitch mode, meaning that gains greater than the critical one (Kp > 8.3×10⁻⁴) willmake the mode unstable (negatively damped). As shown in Figure 2.11, the blade-pitch controller-response natural frequency (ωϕn) for that critical gain is 0.083 Hz,which is very close to the ITIEnergy’s barge platform-pitch natural frequency (ωxn= 0.086 Hz). This supports the statement made by Larsen and Hanson [16] that forensuring the stability of the motion of a FOWT structure, the controller-responsenatural frequency must be smaller than the platform-pitch natural frequency.
31
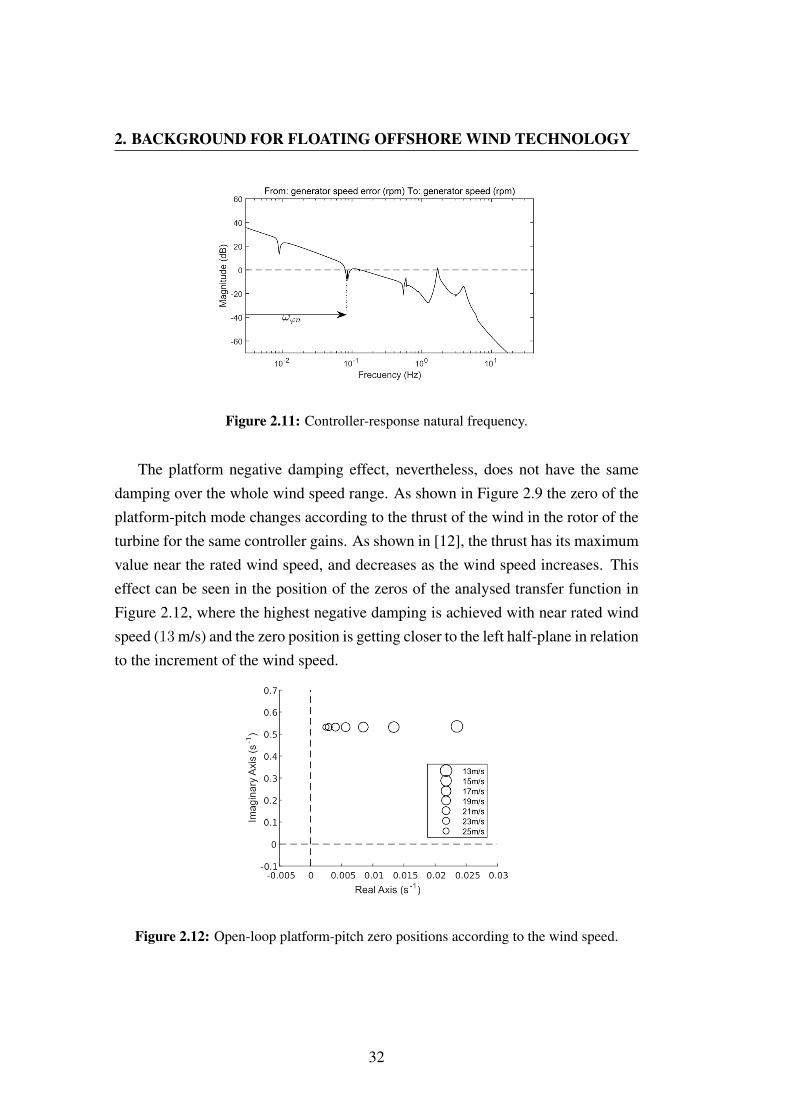
2. BACKGROUND FOR FLOATING OFFSHORE WIND TECHNOLOGY
Figure 2.11: Controller-response natural frequency.
The platform negative damping effect, nevertheless, does not have the samedamping over the whole wind speed range. As shown in Figure 2.9 the zero of theplatform-pitch mode changes according to the thrust of the wind in the rotor of theturbine for the same controller gains. As shown in [12], the thrust has its maximumvalue near the rated wind speed, and decreases as the wind speed increases. Thiseffect can be seen in the position of the zeros of the analysed transfer function inFigure 2.12, where the highest negative damping is achieved with near rated windspeed (13 m/s) and the zero position is getting closer to the left half-plane in relationto the increment of the wind speed.
Figure 2.12: Open-loop platform-pitch zero positions according to the wind speed.
32
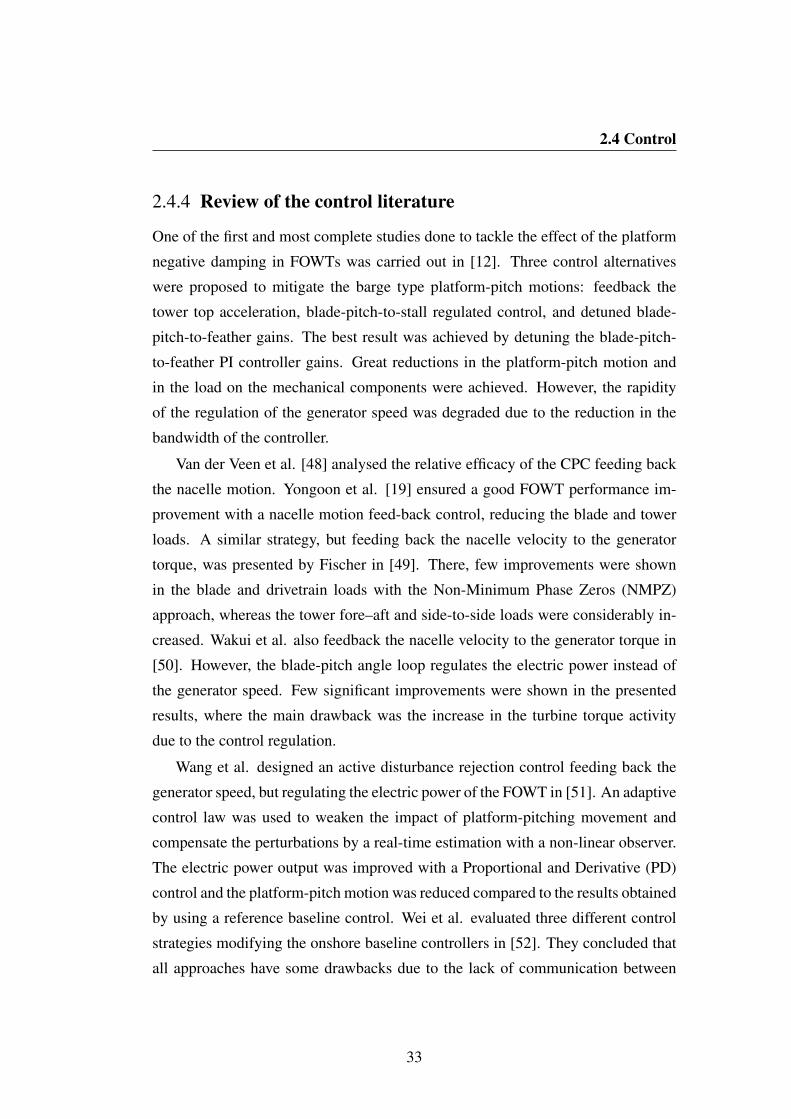
2.4 Control
2.4.4 Review of the control literature
One of the first and most complete studies done to tackle the effect of the platform
negative damping in FOWTs was carried out in [12]. Three control alternatives
were proposed to mitigate the barge type platform-pitch motions: feedback the
tower top acceleration, blade-pitch-to-stall regulated control, and detuned blade-
pitch-to-feather gains. The best result was achieved by detuning the blade-pitch-
to-feather PI controller gains. Great reductions in the platform-pitch motion and
in the load on the mechanical components were achieved. However, the rapidity
of the regulation of the generator speed was degraded due to the reduction in the
bandwidth of the controller.
Van der Veen et al. [48] analysed the relative efficacy of the CPC feeding back
the nacelle motion. Yongoon et al. [19] ensured a good FOWT performance im-
provement with a nacelle motion feed-back control, reducing the blade and tower
loads. A similar strategy, but feeding back the nacelle velocity to the generator
torque, was presented by Fischer in [49]. There, few improvements were shown
in the blade and drivetrain loads with the Non-Minimum Phase Zeros (NMPZ)
approach, whereas the tower fore–aft and side-to-side loads were considerably in-
creased. Wakui et al. also feedback the nacelle velocity to the generator torque in
[50]. However, the blade-pitch angle loop regulates the electric power instead of
the generator speed. Few significant improvements were shown in the presented
results, where the main drawback was the increase in the turbine torque activity
due to the control regulation.
Wang et al. designed an active disturbance rejection control feeding back the
generator speed, but regulating the electric power of the FOWT in [51]. An adaptive
control law was used to weaken the impact of platform-pitching movement and
compensate the perturbations by a real-time estimation with a non-linear observer.
The electric power output was improved with a Proportional and Derivative (PD)
control and the platform-pitch motion was reduced compared to the results obtained
by using a reference baseline control. Wei et al. evaluated three different control
strategies modifying the onshore baseline controllers in [52]. They concluded that
all approaches have some drawbacks due to the lack of communication between
33

2. BACKGROUND FOR FLOATING OFFSHORE WIND TECHNOLOGY
the different SISO feedbacks. They proposed an improvement of the controllers,
designing a model-based Multiple-Input Multiple-Output (MIMO) control strategy.
Some other approaches can be found in the literature applying the State-Feedback
(SF) control and Linear Quadratic Regulator (LQR) strategies for FOWT systems.
Namik et al. [53] designed a full SF control using a LQR for a barge FOWT sys-
tem. Afterwards, they implemented a periodic IPC and Disturbance-Accomodating
Control (DAC) in [54] for improving the performance of the FOWT reducing the
effects of the incident wind and wave disturbances. In a more recent article [55],
they proposed the IPC State Space (SS) control strategy and DAC, significantly
reducing the barge platform-pitch, -roll and -yaw motions, and tower loads. How-
ever, the cost of these reductions was an extensive use of the blade-pitch actuator,
where the blade-pitch rate was increased by 318% compared to the conventional
CPC baseline controller.
Christiansen et al. [56] designed a SF controller with a observer for the state
estimation combined with a wind speed and a LQR for optimal control. The overall
improvement of the spar type FOWT model performance was achieved at the cost
of increasing the blade-pitch activity. The blade-pitch rate increases by 392% and
the drivetrain torsion loads by 5%, in comparison to the baseline control. Their next
publication [57], based in the same control technique, includes the minimum thrust
and constant generator speed strategy for stabilising the floating system. Deteriora-
tion in the generator speed regulation and power production were registered as well
as an increment in the platform-pitch oscillations of 20%. The last publication [58]
based in the same control technique, but with an extended Kalman filter, shows the
reduction of the wave disturbances on the onshore controller performance.
A more developed SF controller was developed by Zuo et al. in [59]. They
proposed an additional robust adaptive control with an advanced memory-based
compensation module for the IPC. The power fluctuations, fatigue loads and plat-
form vibrations were reduced in comparison to the conventional SF controller. Ba-
gherieh et al. presented a sliding control technique for FOWT control in [60].
In comparison to the presented baseline controller, the generator speed deviation
was improved whereas the platform-pitch motions were increased considerably, in-
creasing the blade-pitch activity. In a more recent article [61], among the different
34
2.4 Control
control techniques compared, the best one for reducing the platform-pitch oscilla-
tions was the SF Linear Parameter-Varaying (LPV) GS strategy, while the best one
for regulating the electric power was the LQR GS control technique. Lemmer et al.
did a thorough system analysis in [62] considering the MIMO description including
control inputs and disturbances in a reduced FOWT model. They demonstrated that
the LQR can significantly reduce the system response and attenuate the excitation
from wave disturbances.
Two authors were found using a less common control technique for FOWTs,
such as fuzzy logic. Yang et al. [63] used this technique to combine the DAC and
the MPC algorithms. The DAC aimed at eliminating the effect of wind disturbances
and the MPC to remove the effect of wave disturbances. The proposed control
with IPC shows a performance better than that of the conventional CPC. Tahani
et al. also used fuzzy logic in [64] for controlling the foundation directions of the
VoulturnUS FOWT model, preventing additional movements and imbalances of the
wind turbine.
Some other articles treating the MPC can also be found. Schlipf et al. designed
a MPC for a spar type floating FOWT in [65]. Although good improvements were
shown in the shaft and blade loads, the main benefit was the reduction of the power
and rotor speed standard deviation, by up to 90%. However, the cost of these
improvements was a blade-pitch speed increase of about 228%. Raach et al. [66]
continued in this topic, including the IPC technique to reduce the loads on the blade
and minimise the yawing and pitching moments on the rotor hub. The blade loads
were significantly reduced compared with those obtained by using the baseline
controller. Chaaban et al. also presented the MPC but mounted on a barge platform
in [67]. The results show a good overall performance improvement except in the
generator power error, blade-pitch rate, and blade edgewise moment. Lemmer et
al. [68] also present a study with the same control technique implemented for
a double rated power capacity FOWT mounted on the TripleSpar platform. The
results show that the MPC damps the tower-top and platform-pitch motion better
than the presented baseline PI controller and reduces significantly the overshoot of
the rotor speed.
The robust H-infinity (H∞) control method is widely extended in FOWT sys-
tems too. Bakka et al. used the H∞ feedback control technique with pole placement
35

2. BACKGROUND FOR FLOATING OFFSHORE WIND TECHNOLOGY
constraints in [69] and [70], with a LPV FOWT model. The generator speed andtorque oscillations as well as the platform fore-aft displacement were reduced, butthe blade-pitch activity was considerably increased. They used a similar techniquein [71], but combining the H2 and H∞ control techniques, resulting in a good rotorspeed regulation and a tower-top displacement mitigation but increasing consider-ably the blade-pitch activity as well. Betti et al. also used the H∞ control tech-nique for spar and TLP mounted FOWTs in [72] and [21], respectively. Navalkaret al. presented a combination of feedback and feedforward control using the H∞criterion in [73]. They implemented the Light Detection and Ranging (LIDAR)technology for the feedforward control enabling the wind turbine for the meas-urement of the incoming wind. Hara et al. presented experimental results from ascaled model FOWT using the H∞ loop-shaping control in [74]. In comparison tothe presented baseline PI control, the rotor speed regulation and platform-pitch os-cillation were slightly improved whereas the blade-pith activity was considerablyincreased.
Lackner presented the Variable Power Pitch Control (VPPC) technique in [75]and [76]. This control technique consists in changing the generator speed set pointto a larger value when the platform is pitching upwind, and vice versa. The platformmotion is improved. However, the blade-pitch rate is considerably increased, byaround 40%.
Other interesting articles can be found in the FOWT literature, not directly re-lated with the negative platform damping control issue, but which some readersmay find of interest. Han et al. studied a method to compute the movable rangeas well as the position control of FOWT systems in [77]. There are a couple ofarticles about a novel control technique for Region II. First, Bagherieh et al. usedthe blade-pitch control for this region in [20]. Second, Wang et al. used a variabletorque control using an advanced Radial Basis Function (RBF) neural network in[78].
36
2.5 Summary
2.5 SummaryThree main types of floating support structures have been presented for FOWT
systems in Section 2.1. Taking into account the TRL analysis of the worldwide
projects of Section 2.2, the following summary can be made: (1) The semi-sub is
the most widely used floating support structure, being a promising solution due to
its advantages regarding to the fabrication, mounting and towing. Unfortunately, it
has the lowest hydrodynamic stiffness, resulting in a high sensitivity to the control
performance and wave induced motions. (2) The spar floating technology is slightly
less used, probably due to the high investment required for building the platform,
and the high complexity of the process of mounting the wind turbine. However,
it has the highest hydrodynamic stiffness and lowest sensitivity to the control per-
formance and wave induced motions, which imposes fewer requirements on the
control. (3) The TLP technology is the least used floating solution, mainly due to
the difficulties presented in its transportation and installation as well as the elevated
anchoring risk and cost. Therefore, the semi-sub floating platform has been chosen
as the most suitable floating technology for the development of this research due
to the challenges posed to the control requirements needed to counteract the low
hydrodynamics stiffness and, at the same time, reduce the high sensitivity to the
control performance and wave induced motions. This would alleviate the draw-
backs of the semi-subs, contributing to the advantages presented by this floating
technology and making it more competitive.
The simulation tool FAST has been found very appropriate for the develop-
ment of this thesis due to the advantages presented in Section 2.3, briefly: (1) its
high flexibility; (2) its open-source code; (3) the available online support; (4) its
wide use in the scientific community; (5) the possibility of linking it with Mat-
lab/Simulink; and (6) its positive code certification. FAST8 has been used for the
development of the time-domain simulations whereas FAST7 has been used only
for the FOWT linearisation process.
In the FOWT control literature review, several key notes have been collected:
(1) blade-pitch control detuning avoids the negative platform damping effect due to
the reduction in the controller bandwidth below the critical platform-pitch natural
frequency. However, this controller bandwidth reduction degrades the regulation of
37

2. BACKGROUND FOR FLOATING OFFSHORE WIND TECHNOLOGY
the generator speed, directly affecting the produced electric power quality; (2) sev-eral studies have attempted to optimise the PI controller through different optimalcontrol approaches or methods, such as LQR or H∞. However, in the majorityof the studies, there is a considerable increase in the blade-pitch activity, and, insome cases, a little improvement and/or even a deterioration of the mechanicalloads suffered by the wind turbine blades or tower were reported. Good resultshave been achieved with the MPC technique in the reduction of the blade loads,but an increase in the blade-pitch activity has been shown; (3) the selection of thecontroller type can be highly dependent on the floating technology, e.g. the H∞control strategy is only implemented in the spar and TLP platforms, which have ahigh hydrodynamic stiffness and low sensitivity to the controller induced platformmotions; and (4) the results of different considerations have been collected withthe nacelle feedback control method, improving the blade and tower loads in somecases, and showing a performance deterioration in others. Therefore, after ana-lysing the different control methods and performances, it can be summarised thatcomplex mathematical control algorithms show a high increase in the blade-pitchactivity, an uncertain efficacy in the reduction of the mechanical loads, and the con-trollers robustness is not guaranteed [79]. Thus, in this thesis, it has been decidedto resort to the basis of the control design that analyses the Bode diagrams of thesystem and manually shapes the transfer functions to ensure the desired systemresponse. In this way, the obtained performance results can be analysed and evalu-ated in terms of the efficacy of the proposed control method, determining whetherit is acceptable or not while comparing them to the performance results of the moremathematically complex FOWT controllers.
38
CHAPTER
6Conclusions and
Recommendations
This chapter summarises the main conclusions and contributions collected dur-ing the development of this thesis and, also, some recommendations for furtherresearch are suggested.
153

6. CONCLUSIONS AND RECOMMENDATIONS
6.1 ConclusionsThe offshore wind energy presents the potential to become the real alternative of
fossil fuels in the near future and, since the LCOE of the floating wind technology
will be reduced to competitive levels, the wind energy harvesting in deepwater
areas will become feasible. The amount of worldwide lunched FOWT prototypes,
the first floating pilot park and the many currently developing projects show the
interest in the floating wind technology, as presented in Chapter 2. Nevertheless,
greater engineering efforts have to be carried out to achieve the final design in
relation to the FOWT hydrodynamic stability, manufacturing cost reduction and
performance quality improvement.
This thesis contributes to the performance improvement of the FOWTs redu-
cing the tower and blade DELs via a feedback control technique, which is a tech-
nically feasible and economically affordable solution. In Chapter 4 an advanced
control technique has been presented. Remarkable results have been achieved with
the DTU 10-MW TripleSpar FOWT model in the overall above rated wind speed
and sea state conditions, where both the loads of the platform-base and blade-roots
have been successfully reduced below the reference. However, a high influence of
the platform hydrodynamic stability on the APS controller performance has been
registered as shown by the NREL 5-MW ITI Energy’s and more compact barge
platform FOWT models. The NREL 5-MW ITI Energy’s barge FOWT model
shows an effective APS control performance in the overall wind speed range under
still and smooth sea state conditions. However, in rough sea state conditions, the
wave induced platform motions highly influence the APS controller performance
increasing the blade loads. Therefore, an additional feedback control loop has been
designed to counteract the negative effect of the waves, i.e. the WR control loop.
The implementation of the WR controller improves the blades loads below the ref-
erence Detuned PI results, slightly increasing the loads in the tower. Furthermore,
the challenge of the APS controller to perform in a less hydrodynamically stable
and more compact platform has been investigated. From a certain beam-draught
ratio onwards, a great control potential for the FOWT performance improvement
has seen. However, an additional control loop will be required to counteract the
increment of the platform-roll dynamics.
154

6.1 Conclusions
Moreover, a non-linear model based optimisation process to further improvethe manually tuned APS and WR control loops designed for the NREL 5-MWITI Energy’s barge FOWT model has been presented in Chapter 5. This innovat-ive control optimisation proposes the automatisation of the feedback control looptuning process based on DEL results. The implementation of this optimisationmethod achieves significant improvements of the DELs in regards to the manuallytuned controller results while maintaining the time-domain performance. All theDEL results have been reduced below those of the reference Detuned PI controllerfor wind speeds from 17 m/s to above, reaching a maximum reduction of nearly20% in tower-base-pitch and 12% in blade-root-flapwise. Such a fact points out thepotential effectiveness of the designed advanced control technique for the improve-ment of the FOWT performance. Then, it validates the contribution of the novelproposed optimisation methodology for tuning feedback control loops in FOWTsystems.
The issue of the FAST7 software in regard to the linearisation process withlow hydrodynamic stability platforms affected by the negative damping has beenpresented in Chapter 3. Two alternatives to the conventional linearisation methodshave been proposed: (1) trimming the generator torque; and (2), the chirp signalmethodology. The first provides acceptable linear models while the second onedelivers the highest fidelity results respect to the identification of the system modes,contributing with a novel method for linearising FOWT systems. Additionally, thisthesis has explored the potential of an open-source modelling code NEMOH forgetting the hydrodynamic matrices of the designed more compact barge family,achieving accurate results in comparison to the more conventional codes validatingthe approach from the method development point of view.
In summary of the accomplishments, the objectives of the thesis have beensatisfied (1) improving the overall FOWT performance while reducing the towerand blade mechanical loads (2) by means of control techniques, which are scalableto different FOWT models, and (3) analysing the designed control performance ina more compact barge family. It is believed that the study presented in this thesiswould contribute to the common goal of reaching the final FOWT concept solutionand, supplying electric power from the deepwater areas to much of the world.
155
6. CONCLUSIONS AND RECOMMENDATIONS
6.2 RecommendationsThe linearisation process for FOWT systems will be included soon in OpenFAST
code, which will include the waves as a disturbance input. Then, this would be
helpful for analysing the APS control loop performance under the wave disturbance
and for further reducing the system DEL results by means of the control tuning.
An extra study would include the addition of the barge platform dimensions
in the presented optimisation methodology. This could help in the achievement of
an optimised barge model according to the advanced controller and, in the further
improvement of the FOWT performance.
The implementation of the IPC is strongly recommended due to the advantages
cited in Subsection 2.4.2. Concretely, such an implementation will alleviate the
blade loads, providing a retuning of the APS and WR controllers and, hence, the
chance to further improve the tower loads.
An additional platform-roll control loop is required for the NREL 5-MW model
mounted on a more compact beam-draught ratio 8 barge, as shown in Subsection
4.2.2.2. In this way, it is believed that the APS can provide a similar performance to
that of the ITI Energy’s barge platform, taking into account the physical limitations,
such as, the higher static platform-pitch inclination of a more compact barge.
It would be beneficial to expand the considered set of simulation cases for a
more realistic wind and wave conditions, including wind and wave misalignment,
according to one specific location including the on site collected environmental
data. This will allow a thorough load study of the mechanical components determ-
ining where the controller efforts should be focused on. In this case, if the advanced
controller results would be positive, it should be validated in a wave-tank test, first,
and in a sub- and full-scale prototype installed offshore, next.
The optimisation of the APS controller with the DTU 10-MW TripleSpar FOWT
model would be recommendable to quantify the controller potential for the per-
formance improvement.
For future works, the use of the reduced order and high fidelity FOWT models
for the optimisation method presented in this thesis would be recommendable. This
would decrease the computational time and give the chance to include additional
156
6.2 Recommendations
partial terms in the cost functions. Also, the optimisation process under the collec-ted environmental real data of the specific location where the FOWT is going to beinstalled would help the achievement of the best control parameter values for thatspecific location.
Although this thesis is focused on the development of an advanced controltechnique for above rated wind speed region, control switching issues have beenregistered between the below and above rated controllers when the wind turbineis operating near rated. Therefore, a general recommendation is done for the de-velopment of an advanced switching mechanism for the transitions of these twocontrollers, which is out of the scope of this thesis, that will improve the perform-ance of the wind turbine when operating near rated.
157


Bibliography
[1] International Energy Agency (IEA), “Renewables information: Overview2017,” tech. rep., 2017. 2
[2] Wind Europe, “Offshore Wind in Europe - Key trends and statistics 2017,”tech. rep., 2018. 2
[3] P. A. Lynn, Onshore and Offshore Wind Energy. Wiley, 2011. 2
[4] M. Bilgili, A. Yasar, and E. Simsek, “Offshore wind power developmentin Europe and its comparison with onshore counterpart,” Renewable and
Sustainable Energy Reviews, vol. 15, no. 2, pp. 905–915, 2011. 3
[5] W. Musial, S. Butterfield, and B. Ram, “Energy From Offshore Wind,” Off-
shore Technology Conference, 2006. 3
[6] W. De Vries, “Final report WP4.2: Support Structure Concepts for DeepWater Sites,” tech. rep., 2011. 3
[7] S. Butterfield, W. Musial, J. Jonkman, and P. Sclavounos, “EngineeringChallenges for Floating Offshore Wind Turbines,” Offshore Wind Confer-
ence, p. 13, 2005. 3
[8] L. Kilar, “Offshore Wind Energy Conversion System: Preview Of A Feasib-ility Study,” in Third Biennial Conf. & Workshop On Wind Energy Conver-
sion Systems, (Washington D.C., U.S.A.), 1977. 3
[9] J. Dixon and R. Swift, Offshore Wind Turbines: Platform Kinematics.BHRA Fluid Engng, 1981. 3
159

BIBLIOGRAPHY
[10] M. Kausche, F. Adam, F. Dahlhaus, and J. Großmann, “Floating offshore
wind - Economic and ecological challenges of a TLP solution,” Renewable
Energy, vol. 126, pp. 270–280, 2018. 5
[11] G. Koreneff, M. Ruska, J. Kiviluoma, J. Shemeikka, B. Lemstrom,
R. Alanen, and T. Koljonen, Future development trends in electricity de-
mand. No. 2470, VTT Tiedotteita - Valtion Teknillinen Tutkimuskeskus,
2009. 5
[12] J. Jonkman, “Influence of Control on the Pitch Damping of a Floating Wind
Turbine,” in 46th AIAA Aerospace Sciences Meeting and Exhibit, p. 1306,
ASME, 2008. 5, 30, 32, 33
[13] R. Ramos, “Optimal Vibration Control of Floating Wind Turbines in the
Presence of Nonlinearities,” in 32nd International Conference on Ocean,
Offshore and Arctic Engineering, ASME, 2013. 5
[14] A. Jose, J. Falzarano, and H. Wang, “A Study Of Negative Damping In Float-
ing Wind Turbines Using Coupled Program FAST-SIMDYN,” 1st Interna-
tional Offshore Wind Technical Conference (IOWTC), American Society of
Mechanical Engineers (ASME), 2018. 5
[15] J. Jonkman, “Dynamics modeling and loads analysis of an offshore floating
wind turbine,” tech. rep., 2007. xxv, 5, 27, 41, 42, 58, 62, 63, 73, 79, 115,
119, 140
[16] T. Larsen and T. D. Hanson, “A method to avoid negative damped low
frequent tower vibrations for a floating, pitch controlled wind turbine,” in
Journal of Physics: Conference Series, vol. 75, IOP Publishing, 2007. 5, 31
[17] E. Wayman and P. Sclavounos, “Coupled Dynamic Modeling of Floating
Wind Turbine Systems,” in Offshore Technology Conference, 2006. 5, 30,
105
[18] C. Ng and L. Ran, Offshore Wind Farms: Technologies, Design and Opera-
tion. Woodhead Publishing Series in Energy: Number 92, 2016. 10
160
BIBLIOGRAPHY
[19] O. Yongoon, K. Kwansu, K. Hyungyu, and P. Insu, “Control Algorithm of
a Floating Wind Turbine for Reduction of Tower Loads and Power Fluctu-
ation,” International Journal of Precision Engineering and Manufacturing,
2015. 10, 33
[20] O. Bagherieh and R. Nagamune, “Utilization of Blade Pitch Control in Low
Wind Speed for Floating Offshore Wind Turbines,” in American Control
Conference (ACC), 2014. 10, 36
[21] G. Betti, M. Farina, G. A. Guagliardi, A. Marzorati, and R. Scattolini, “De-
velopment of a Control-Oriented Model of Floating Wind Turbines,” IEEE
Transactions on Control Systems Technology, vol. 22, no. 1, 2014. 10, 36
[22] J. Jonkman and D. Matha, “A Quantitative Comparison of the Responses
of Three Floating Platforms,” in European Offshore Wind Conference and
Exhibition, 2010. 11
[23] A. Myhr, C. Bjerkseter, A. Agotnes, and T. A. Nygaard, “Levelised cost of
energy for offshore floating wind turbines in a lifecycle perspective,” Renew-
able Energy, vol. 66, pp. 714–728, 2014. 11
[24] J. Azcona, F. Vittori, U. Schmidt Paulsen, F. Savenije, G. Kapogiannis,
X. Karvelas, D. Manolas, S. Voutsinas, F. Amann, R. Faerron-Guzman, and
F. Lemmer, “INNWIND.EU D4.3.7: Design solutions for 10MW floating
offshore wind turbines,” tech. rep., CENER, 2017. 12, 54
[25] A. Alexandre, Y. Percher, T. Choisnet, R. Buils Urbano, and R. Harries,
“Coupled Analysis and Numerical Model Verification for the 2MW Float-
gen Demonstrator Project With IDEOL Platform,” in ASME 2018 1st Inter-
national Offshore Wind Technical Conference, ASME, nov 2018. 13
[26] Y. H. Bae and M.-H. Kim, “The Dynamic Coupling Effects of a MUFOWT
( Multiple Unit Floating Offshore Wind Turbine ) with Partially Broken
Blade,” Wind Energy, vol. 2, no. 2, pp. 89–97, 2015. 13
161
BIBLIOGRAPHY
[27] C. Rockmann, S. Lagerveld, and J. Stavenuiter, Aquaculture Perspective of
Multi-Use Sites in the Open Ocean. Springer International Publishing, 2017.
13
[28] A. Yde, M. M. Pedersen, S. B. Bellew, and E. al., “Experimental and Theor-
etical Analysis of a Combined Floating Wave and Wind Energy Conversion
Platform,” tech. rep., DTU Wind Energy, 2014. 13
[29] C. Perez-Collazo, D. Greaves, and G. Iglesias, “A review of combined wave
and offshore wind energy,” Renewable and Sustainable Energy Reviews,
vol. 42, pp. 141–153, 2015. 13
[30] D. Lande-Sudall, T. Stallard, and P. Stansby, “Co-located offshore wind and
tidal stream turbines: Assessment of energy yield and loading,” Renewable
Energy, vol. 118, pp. 627–643, 2018. 13
[31] J. Jonkman, “Definition of the Floating System for Phase IV of OC3,” tech.
rep., 2010. 18
[32] W. Popko, F. Vorpahl, A. Zuga, and E. Al., “Offshore Code Comparison Col-
laboration Continuation (OC4), Phase I—Results of Coupled Simulations of
an Offshore Wind Turbine with Jacket Support Structure,” in 22nd Interna-
tional Society of Offshore and Polar Engineers Conference, 2012. 18
[33] A. N. Robertson, F. Wendt, J. M. Jonkman, and E. Al., “OC5 Project Phase
II: Validation of Global Loads of the DeepCwind Floating Semisubmersible
Wind Turbine,” in 14th Deep Sea Offshore Wind R&D Conference, EERA,
2017. 18
[34] A. Cordle and J. Jonkman, “State of the Art in Floating Wind Turbine Design
Tools,” in International Offshore and Polar Engineering, 2011. 18
[35] J. Jonkman and A. Cordle, “State of the art in design tools for floating off-
shore wind turbines,” Tech. Rep. March, Deliverable Report Under (SES6),
UoWind project, Bristos, UK, 2010. 18
162
BIBLIOGRAPHY
[36] A. Manjock, “Design Codes FAST and ADAMS R© for Load Calculations ofOnshore Wind Turbines,” tech. rep., 2005. 19
[37] D. Matha and M. Kuhn, “Model Development and Loads Analysis of a WindTurbine on a Floating Offshore Tension Leg Platform,” European Offshore
Wind Conference, 2009. 19
[38] B. J. Jonkman and J. M. Jonkman, “FAST v8.16.00a-bjj,” tech. rep., NREL,2016. 19
[39] J. M. Jonkman and J. M. L. Buhl, “FAST User ’ s Guide,” tech. rep., 2005.19, 40, 44, 45, 55, 91
[40] “DNVGL-ST-0119 Design of Floating Wind Turbine Structures,” tech. rep.,DNV-GL, 2018. xxv, 20, 99, 122, 123
[41] T. Burton, D. Sharpe, N. Jenkins, and E. Bossanyi, Wind Energy Handbook.Chichester, UK: John Wiley & Sons, Ltd, 2001. 21, 24
[42] W. Tong, Wind Power Generation and Wind Turbine Design. WIT Press,2010. 22
[43] E. Bossanyi, “The Design of closed loop controllers for wind turbines,” Wind
Energy, vol. 3, 2000. 24
[44] M. H. Hansen, A. Hansen, T. J. Larsen, S. Oye, P. Sorensen, and P. Fuglsang,“Control design for a pitch-regulated, variable speed wind turbine,” tech.rep., 2005. 26, 73
[45] E. A. Bossanyi, “Wind Turbine Control for Load Reduction,” Wind Energy,vol. 6, 2003. 27, 29
[46] B. Shahsavari, O. Bagherieh, N. Mehr, R. Horowitz, and C. Tomlin, “Op-timal Mode-Switching and Control Synthesis for Floating Offshore WindTurbines,” in American Control Conference (ACC), 2016. 29
[47] E. Lindeberg, H. G. Svendsen, and K. Uhlen, “Smooth transition betweencontrollers for floating wind turbines,” Energy Procedia, vol. 24, 2012. 29
163
BIBLIOGRAPHY
[48] G. van der Veen, I. Couchman, and R. Bowyer, “Control of floating wind
turbines,” American Control Conference (ACC), pp. 3148–3153, 2012. 33
[49] B. Fischer, “Reducing rotor speed variations of floating wind turbines by
compensation of non-minimum phase zeros,” Renewable Power Generation,
IET, vol. 7, pp. 413–419, 2013. 33
[50] T. Wakui, M. Yoshimura, and R. Yokoyama, “Multiple-Feedback Control of
Power Output and Platform Pitching Motion for a Floating Offshore Wind
Turbine-Generator System,” Energy, 2017. 33
[51] L. Wang, H. Zhang, M. Cai, and Z. Luo, “Active Disturbance Rejection
Power Control for a Floating Wind Turbine,” in Chinese Control And De-
cision Conference (CCDC), 2017. 33
[52] W. Yu, F. Lemmer, D. Schlipf, P. W. Cheng, B. Visser, H. Links, N. Gupta,
S. Dankemann, B. Counago, and J. Serna, “Evaluation of control methods
for floating offshore wind turbines,” in DeepWind, 15th Deep Sea Offshore
Wind R&D Conference, EERA, 2018. 33, 72, 125
[53] H. Namik, K. A. Stol, and J. Jonkman, “State-space control of tower motion
for deepwater floating offshore wind turbines,” AIAA Aerospace Sciences
Meeting and Exhibit, 2008. 34
[54] H. Namik and K. A. Stol, “Disturbance Accommodating Control of Floating
Offshore Wind Turbines,” AIAA Aerospace Sciences Meeting including The
New Horizons Forum and Aerospace Exposition, 2009. 34
[55] H. Namik and K. A. Stol, “Performance analysis of individual blade pitch
control of offshore wind turbines on two floating platforms,” Mechatronics,
2011. 34
[56] S. Christiansen, T. Knudsen, and T. Bak, “Optimal Control of a Ballast-
Stabilized Floating Wind Turbine,” in IEEE International Symposium on
Computer-Aided Control System Design (CACSD), IEEE, sep 2011. 34
164

BIBLIOGRAPHY
[57] S. Christiansen, T. Bak, and T. Knudsen, “Minimun Thrust Load Control for
Floating Wind Turbine,” IEEE International Conference on Control Applic-
ations (CCA), 2012. 34
[58] S. Christiansen, T. Knudsen, and T. Bak, “Extended Onshore Control of a
Floating Wind Turbine with Wave Disturbance Reduction,” in The Science
of Making Torque from Wind, 2014. 34
[59] S. Zuo, Y. D. Song, L. Wang, and Q.-w. W. Song, “Computationally In-
expensive Approach for Pitch Control of Offshore Wind Turbine on Barge
Floating Platform,” The Scientific World Journal, 2013. 34
[60] O. Bagherieh and K. Hedrick, “Nonlinear Control of Floating Offshore Wind
Turbines Using Input / Output Feedback Linearization and Sliding Control,”
in ASME Dynamic Systems and Control Conference, 2014. 34
[61] O. Bagherieh and R. Nagamune, “Gain-scheduling control of a floating off-
shore wind turbine above rated wind speed,” Control Theory and Techno-
logy, 2015. 34, 72
[62] F. Lemmer, D. Schlipf, and P. W. Cheng, “Control design methods for float-
ing wind turbines for optimal disturbance rejection,” in The Science of Mak-
ing Torque from Wind, vol. 753, IOP Publishing, 2016. 35
[63] F. Yang, Q.-w. Song, L. Wang, S. Zuo, and S.-s. Li, “Wind and Wave
Disturbances Compensation to Floating Offshore Wind Turbine Using Im-
proved Individual Pitch Control Based on Fuzzy Control Strategy,” Abstract
and Applied Analysis, 2014. 35
[64] M. Tahani, E. Ziaee, A. Hajinezhad, P. Servati, M. Mirhosseini, and A. Sed-
aghat, “Vibrational simulation of offshore floating wind turbine and its dir-
ectional movement control by fuzzy logic,” in International Conference on
Sustainable Mobility Applications, Renewables and Technology (SMART),
IEEE, nov 2015. 35
165
BIBLIOGRAPHY
[65] D. Schlipf, F. Sandner, S. Raach, D. Matha, and P. W. Cheng, “Nonlinear
model predictive control of floating wind turbines,” International Offshore
and Polar Engineering, vol. 9, pp. 440–446, 2013. 35
[66] S. Raach, D. Schlipf, F. Sandner, D. Matha, and P. W. Cheng, “Nonlin-
ear Model Predictive Control of Floating Wind Turbines with Individual
Pitch Control,” in American Control Conference (ACC), (Portland, Oregon
(USA)), 2014. 35
[67] R. Chaaban and C.-P. Fritzen, “Reducing Blade Fatigue and Damping Plat-
form Motions of Floating Wind Turbines Using Model Predictive Control,”
in International Conference on Structural Dynamics EURODYN, 2014. 35
[68] F. Lemmer, S. Raach, D. Schlipf, and P. W. Cheng, “Prospects of Linear
Model Predictive Control on a 10 MW Floating Wind Turbine,” in Interna-
tional Conference on Ocean, Offshore and Arctic Engineering, 2015. 35
[69] T. Bakka and H. R. Karimi, “Robust H∞ Dynamic Output Feedback Con-
trol Synthesis with Pole Placement Constraints for Offshore Wind Turbine
Systmes,” Mathematical Problems in Engineering, 2012. 36
[70] T. Bakka and H. R. Karimi, “Robust Output Feedback H∞ Control Syn-
thesis with Pole Placement for Offshore Wind Turbine System: An LMI Ap-
proach,” in International Conference on Control Applications (CCA), 2012.
36
[71] T. Bakka and H. R. Karimi, “Mixed H2/H∞ Control Design for Wind Tur-
bine System with Pole Placement Constraints,” in Chinese Control Confer-
ence, 2012. 36
[72] G. Betti, M. Farina, A. Marzorati, R. Scattolini, and G. A. Guagliardi, “Mod-
eling and control of a floating wind turbine with spar buoy platform,” in
International Energy Conference and Exhibition (ENERGYCON), 2012. 36
166
BIBLIOGRAPHY
[73] S. T. Navalkar, J. W. Van Wingerden, P. A. Fleming, and G. A. M. Van Kuik,“Integrating robust Lidar-Based Feedforward with Feedback Control to En-hance Speed Regulation of Floating Wind Turbines,” in American Control
Conference, IEEE, 2015. 36
[74] N. Hara, Y. Nihei, K. Iijima, and K. Konishi, “Blade Pitch Control for Float-ing Wind Turbines: Design and Experiments Using a Scale Model,” in Con-
trol Technology and Applications (CCTA), IEEE, 2017. 36
[75] M. A. Lackner, “Controlling Platform Motions and Reducing Blade Loadsfor Floating Wind Turbines,” Wind Engineering, vol. 33, no. 6, pp. 541–553,2009. 36, 79
[76] M. A. Lackner, “An investigation of variable power collective pitch controlfor load mitigation of floating offshore wind turbines,” Wind Energy, vol. 16,no. 3, pp. 435–444, 2013. 36, 80
[77] C. Han, J. R. Homer, and R. Nagamune, “Movable Range and Position Con-trol of an Offshore Wind Turbine with a Semi-submersible Floating Plat-form,” in American Control Conference (ACC), 2017. 36
[78] L. Wang, S. Zuo, Y. D. Song, and Z. Zhou, “Variable Torque Control ofOffshore Wind Turbine on Spar Floating Platform Using Advanced RBFNeural Network,” Abstract and Applied Analysis, 2014. 36
[79] S. Skogestad and I. Postlethwaite, Multivariable Feedback Control: Analysis
and Design. John Wiley & Sons, 2nd ed., 2001. 38
[80] J. Olondriz, I. Elorza, I. Trojaola, A. Pujana, and J. Landaluze, “On theeffects of basic platform design characteristics on floating offshore wind tur-bine control and their mitigation,” in The Science of Making Torque from
Wind, IOP Publishing, 2016. xxvi, 39, 59, 60, 63, 65, 71
[81] J. Olondriz, J. Jugo, I. Elorza, S. Alonso-Quesada, and A. Pujana-Arrese,“Alternative linearisation methodology for aero-elastic Floating OffshoreWind Turbine non-linear models,” in The Science of Making Torque from
Wind, IOP Publishing, 2018. xxv, xxvi, xxxi, 39, 50, 52, 53
167

BIBLIOGRAPHY
[82] J. Olondriz, W. Yu, J. Jugo, F. Lemmer, I. Elorza, S. Alonso-Quesada, and
A. Pujana-Arrese, “Using multiple fidelity numerical models for floating
offshore wind turbine advanced control design,” Energies, vol. 11, no. 9,
pp. 2484–2497, 2018. 39, 71, 112
[83] K. J. Amstrong and R. M. Murray, Feedback Systems: An Introduction for
Scientists and Engineering. Princeton university press, 2010. 40
[84] K. Ogata, Ingenierıa de Control Moderna. Pearson Education, 5th ed., 2010.
40
[85] P. H. Jensen, T. Chaviaropolos, and A. Natarajan, “LCOE reduction for the
next generation offshore wind turbines,” tech. rep., 2017. 41
[86] F. Lemmer, K. Muller, Y. Wei, D. Schlipf, and P. W. Cheng, “Optimization of
Floating Offshore Wind Turbine Platforms With a Self-Tuning Controller,”
in Internationl Conference on Ocean, Offshore and Arctic (OMAE), ASME,
2017. xxv, 42, 140
[87] A. Raizada, V. Krishnakumar, and P. Singru, “System Identification : A
Study Of Various Methods For Continuous Systems,” in International and
National Conference on Machines and Mechanisms (iNaCoMM), 2015. 49
[88] R. Pintelon and J. Schoukens, System Identification: A Frequency Domain
Approach. John Wiley & Sons, Inc., 2004. 49
[89] S. W. Smith, The Scientist and Engineer’s Guide to Digital Signal Pro-
cessing. California Technical Publishing, 1997. 51
[90] F. Lemmer, “Multibody Modeling for Concept-Level Floating Offshore
Wind Turbine Design,” Multibody System Dynamics, 2018. 54
[91] F. Lemmer (ne Sandner), S. Raach, D. Schlipf, and P. W. Cheng, “Paramet-
ric Wave Excitation Model for Floating Wind Turbines,” Energy Procedia,
vol. 94, pp. 290–305, sep 2016. 54
168
BIBLIOGRAPHY
[92] F. Sandner, D. Schlipf, D. Matha, and P. W. Cheng, “Integrated Optimization
of Floating Wind Turbine Systems,” in International Conference on Ocean,
Offshore and Arctic Engineering (OMAE), 2014. 59, 77
[93] M. Penalba, T. Kelly, and J. Ringwood, “Using NEMOH for Modelling
Wave Energy Converters: A Comparative Study with WAMIT,” in Proceed-
ings of the 12th European Wave and Tidal Energy Conference (EWTEC),
(Cork, Ireland), p. 631, 2017. 63
[94] J. N. Newman and C. Lee, “WAMIT User Manual Version 7.0,” tech. rep.,
Massachusetts Institute of Technology, Department of Ocean Engineering,
2013. 65
[95] J. Olondriz, I. Elorza, C. Calleja, J. Jugo, and A. Pujana, “Platform negative
damping , blade root and tower base bending moment reductions with an ad-
vanced control technique,” in WindEurope Conference and Exhibition, IOP
Publishing, 2017. 71
[96] J. Olondriz, I. Elorza, J. Jugo, S. Alonso-Quesada, and A. Pujana-Arrese,
“An Advanced Control Technique for Floating Offshore Wind Turbines
Based on More Compact Barge Platforms,” Energies, vol. 11, pp. 1187–
1201, may 2018. xxvi, 71, 79, 82, 83, 85, 87
[97] R. Ramos, “Linear Quadratic Optimal Control of a Spar-Type Floating Off-
shore Wind Turbine in the Presence of Turbulent Wind and Different Sea
States,” Journal of Marine Science and Engineering, vol. 6, no. 4, p. 151,
2018. 72
[98] M. S. Khaniki, D. Schlipf, V. Pettas, and P. W. Cheng, “Control Design
For Disturbance Rejection in Wind Turbines,” in Annual American Control
Conference (ACC), IEEE, jun 2018. 72
[99] J. M. Jonkman, “Dynamics of offshore floating wind turbines-model devel-
opment and verification,” Wind Energy, vol. 12, pp. 459–492, 2009. 75
169
BIBLIOGRAPHY
[100] J. M. Jonkman and M. L. Buhl, “Development and Verification of a FullyCoupled Simulator for Offshore Wind Turbines,” in 45th AIAA Aerospace
Sciences Meeting and Exhibit, NREL/CP-500-40979, 2007. 75
[101] J. Jonkman and D. Matha, “Dynamics of Offshore Floating Wind Turbines-analysis of Three Concepts,” Wind Energy, vol. 14, pp. 557–569, 2011. 79
[102] S. Christiansen, T. Bak, and T. Knudsen, “Damping Wind and Wave Loadson a FloatingWind Turbine,” Energies, 2013. 83
[103] K. T. Magar and M. J. Balas, “Adaptive Individual Blade Pitch Control ToReduce Platform Pitch Motion Of A Floating Offshore Wind Turbine: Pre-liminary Study,” in Conference on Smart Materials, Adaptive Structures and
Intelligent Systems SMASIS, ASME, 2014. 83
[104] K. Kakita, N. Hara, and K. Konishi, “PI controller gain tuning with FRIT incollective blade pitch control of floating offshore wind turbines,” in 15th In-
ternational Conference on Control, Automation and Systems (ICCAS), IEEE,2015. 83
[105] IEC 61400-3, “Wind Turbines - Part 3: Design Requirements for Off-shore Wind Turbines,” tech. rep., International Electrotechnical Commission(IEC), 2009. 90, 99
[106] IEC 61400-1 Ed. 3, “Wind Turbines - Part 1: Design Requirements,” tech.rep., International Electrotechnical Commission (IEC), 2005. 90, 91
[107] J. M. Jonkman and D. Matha, “Dynamics of offshore floating wind turbines-analysis of three concepts,” Wind Energy, vol. 14, pp. 557–569, 2011. 90,99
[108] J. Jonkman, S. Butterfield, W. Musial, and G. Scott, “Definition of a 5-MWreference wind turbine for offshore system development,” Contract, no. Feb-ruary, pp. 1–75, 2009. 94
[109] J. Olondriz, J. Jugo, I. Elorza, S. Alonso-Quesada, and A. Pujana-Arrese, “AFeedback Control Loop Optimisation Methodology for Floating OffshoreWind Turbines,” Energies (unpublished), 2019. 139
170

BIBLIOGRAPHY
[110] M. Hall, B. Buckham, and C. Crawford, “Hydrodynamics-based floatingwind turbine support platform optimization: A basis function approach,”Renewable Energy, vol. 66, pp. 559–569, 2014. 140
[111] J. Gao and B. Sweetman, “Design optimization of hull size for spar-basedfloating offshore wind turbines,” Journal of Ocean Engineering and Marine
Energy, vol. 4, pp. 217–229, 2018. 140
[112] C. Scherer, P. Gahinet, and M. Chilali, “Multiobjective output-feedbackcontrol via LMI optimization,” IEEE Transactions on Automatic Control,vol. 42, no. 7, pp. 896–911, 1997. 140
171


APPENDIX
AAdditional Data
A.1 Steady-State Operating Points
173
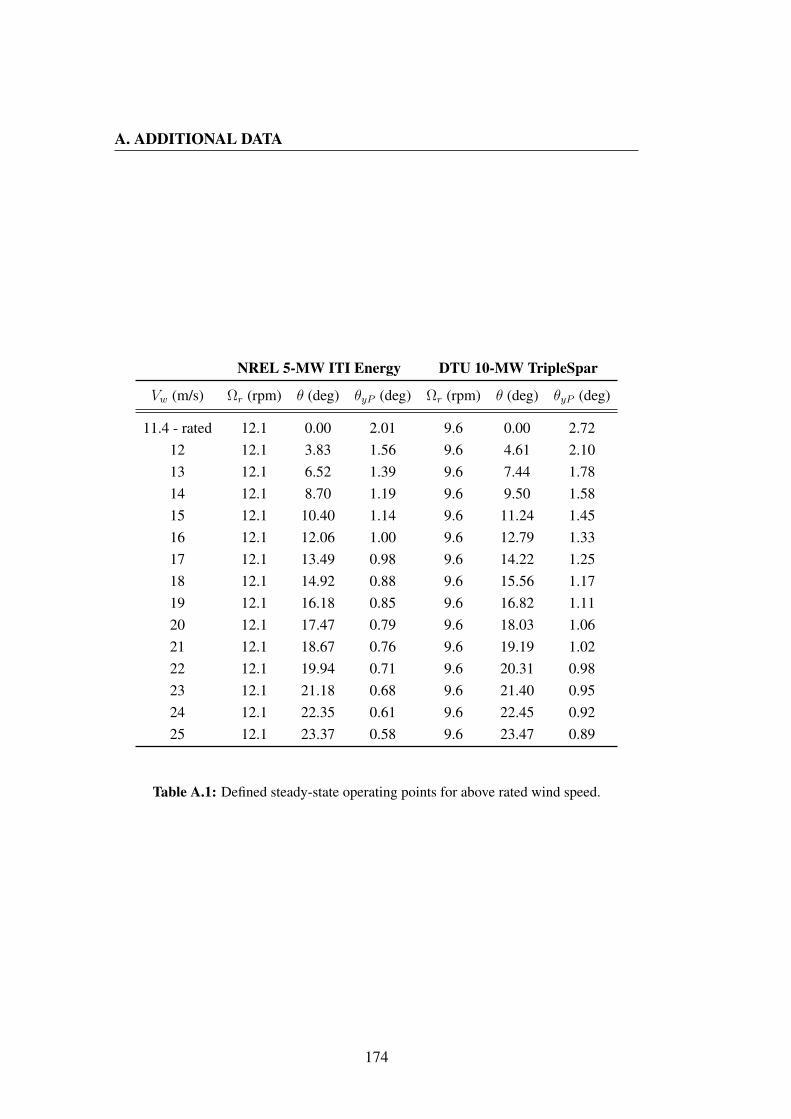
A. ADDITIONAL DATA
NREL 5-MW ITI Energy DTU 10-MW TripleSpar
Vw (m/s) Ωr (rpm) θ (deg) θyP (deg) Ωr (rpm) θ (deg) θyP (deg)
11.4 - rated 12.1 0.00 2.01 9.6 0.00 2.7212 12.1 3.83 1.56 9.6 4.61 2.1013 12.1 6.52 1.39 9.6 7.44 1.7814 12.1 8.70 1.19 9.6 9.50 1.5815 12.1 10.40 1.14 9.6 11.24 1.4516 12.1 12.06 1.00 9.6 12.79 1.3317 12.1 13.49 0.98 9.6 14.22 1.2518 12.1 14.92 0.88 9.6 15.56 1.1719 12.1 16.18 0.85 9.6 16.82 1.1120 12.1 17.47 0.79 9.6 18.03 1.0621 12.1 18.67 0.76 9.6 19.19 1.0222 12.1 19.94 0.71 9.6 20.31 0.9823 12.1 21.18 0.68 9.6 21.40 0.9524 12.1 22.35 0.61 9.6 22.45 0.9225 12.1 23.37 0.58 9.6 23.47 0.89
Table A.1: Defined steady-state operating points for above rated wind speed.
174

APPENDIX
BSimulink Schemes
B.1 Chirp Signal Simulink Scheme
175
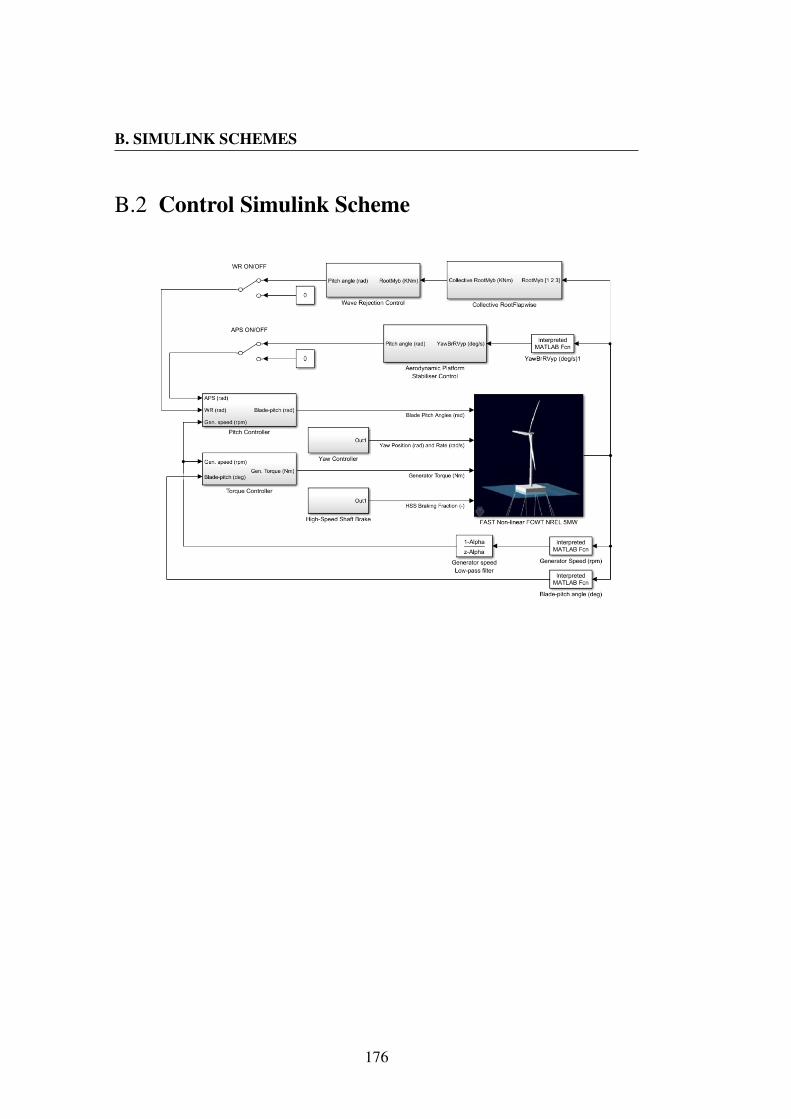
B. SIMULINK SCHEMES
B.2 Control Simulink Scheme
176

APPENDIX
CSoftware Input Files
C.1 NEMOH Primary Input File% Purpose : Cr ea t e t h e main f i l e f o r j o i n up Mesh . m, Nemoh .m and% postNemoh .m f i l e s t o g e n e r a t e from f r e e f l o a t i n g b o d i e s t h e% r e s u l t i n g h y d r o s t a t i c f o r c e s and hydrodynamic c o e f f i c i e n t s as% t h e p l o t s and f i g u r e s r e q u i e r e d .%% I n p u t s : you have t o d e c r i b e t h e p l a t f o r m f a c e s and . . .% W a t e r D e n s i t y : wa ter d e n s i t y [Kg /mˆ 3 ]% G r a v i t y : g r a v i t y a c c e l e r a t i o n [m/ s ˆ 2 ]% A : p l a t f o r m t o t a l volume [mˆ 3 ]% AR : a s p e c t r a t i o s% nBod ie s : number o f b o d i e s t o be meshed% n ( nBod ie s ) : number o f f a c e s o f t h e p l a t f o r m% X ( nBodies , n , 4 , 3 ) : c o o r d i n a t e s o f nodes o f each p a n e l% tX ( nBod ie s ) : t r a n s l a t i o n s% CG( nBodies , 3 ) : p o s i t i o n o f g r a v i t y c e n t r e% n f o b j ( nBod ie s ) : t a r g e t number o f p a n e l s f o r Aquaplus mesh% B : p l a t f o r m w i d t h% C : i n n e r i s l a n d w i d t h% D : p l a t a f o r m sumerged d e p t h% w : wave p e r i o d s% d i r : wave d i r e c t i o n s% d e p t h : sea d e p t h%% O u t p u t s : h y d r o s t a t i c s% KH. d a t : h y d r o s t a t i c s t i f f n e s s m a t r i c e s f i l e% CM. d a t : hydrodynamic added mass m a t r i c e s f i l e% CA . d a t : hydrodynamic damping c o e f f i c i e n t s m a t r i c e s f i l e%%
c l e a r a l lc l o s e a l l
s a v e d i r = pwd ; % Save c u r r e n t d i r e c t o r y ( main f o l d e r )
177

C. SOFTWARE INPUT FILES
% E n v i r o n m e n t a l c o n d i t i o n s :W a t e r D e n s i t y = 1025 ; % Water d e n s i t y [Kg /mˆ 3 ]G r a v i t y = 9 . 8 1 ; % G r a v i t y a c c e l e r a t i o n [m/ s ˆ 2 ]
% P l a t f o r m p h y s i c a lAR = [10 8 6 4 2 1 ] ; % Beam d r a u g h t r a t i oB = [ 4 0 . 2 3 35 .71 30 .98 2 5 . 8 6 ] ; % P l a t a f o r m w i d t hC = 1 0 . 0 ; % I n n e r i s l a n d w i d t hD = [ 4 . 0 2 2 4 .4639 5 .1639 6 . 4 6 4 7 ] ; % P l a t a f o r m d r a u g h t
A = Bˆ2∗D Cˆ2∗D; % P l a t f o r m w e t t e d volume [mˆ 3 ]
f o r c = 1 : l e n g t h (AR) % Run NEMOH f o r each A s p e c t R a t i oAR = AR( c ) ; % S e l e c t A s p e c t R a t i of p r i n t f ( ’ P l a t f o r m Aspec t R a t i o = %u ’ ,AR) % D i s p l a y c u r r e n t A s p e c t R a t i o
% P l a t f o r m c h a r a c t e r i s t i c sB = B( c ) ; % C u r r e n t p l a t f o r m w i d t hD = D( c ) ; % C u r r e n t p l a t f o r m d e p t h
% P l a t f o r m d e s c r i p t i o nnBodies =1; % Number o f b o d i e s t o meshn =10; % Number o f p l a t f o r m f a c e sX ( 1 , 1 , : , : ) = [B/ 2 0 . 0 0 . 0 ; B/ 2 0 . 0 D; B/ 2 B/ 2 D; B/ 2 B/ 2 0 . 0 ] ; % E x t e r i o r f a c e XX ( 1 , 2 , : , : ) = [B/ 2 B/ 2 0 . 0 ; B/ 2 B/ 2 D ; B/ 2 B/ 2 D ; B/ 2 B/ 2 0 . 0 ] ; % E x t e r i o r f a c e YX ( 1 , 3 , : , : ) = [ B/ 2 0 . 0 0 . 0 ; B/ 2 B/ 2 0 . 0 ; B/ 2 B/ 2 D ; B/ 2 0 . 0 D ] ; % E x t e r i o r f a c e XX ( 1 , 4 , : , : ) = [B/ 2 0 . 0 D; C/ 2 0 . 0 D; C/ 2 B/ 2 D; B/ 2 B/ 2 D ] ; % Bottom f a c e 1X ( 1 , 5 , : , : ) = [C/ 2 C/ 2 D ; C/ 2 C/ 2 D ; C/ 2 B/ 2 D; C/ 2 B/ 2 D ] ; % Bottom f a c e 2X ( 1 , 6 , : , : ) = [ C/ 2 0 . 0 D ; B/ 2 0 . 0 D ; B/ 2 B/ 2 D ; C/ 2 B/ 2 D ] ; % Bottom f a c e 3X ( 1 , 7 , : , : ) = [C/ 2 0 . 0 0 . 0 ; C/ 2 C/ 2 0 . 0 ; C/ 2 C/ 2 D; C/ 2 0 . 0 D ] ; % E x t e r i o r f a c e XX ( 1 , 8 , : , : ) = [C/ 2 C/ 2 0 . 0 ; C/ 2 C/ 2 0 . 0 ; C/ 2 C/ 2 D; C/ 2 C/ 2 D ] ; % E x t e r i o r f a c e YX ( 1 , 9 , : , : ) = [ C/ 2 0 . 0 0 . 0 ; C/ 2 0 . 0 D ; C/ 2 C/ 2 D ; C/ 2 C/ 2 0 . 0 ] ; % E x t e r i o r f a c e XX( 1 , 1 0 , : , : ) = [C/ 2 0 . 0 0 . 0 1 ; C/ 2 0 . 0 0 . 0 1 ; C/ 2 C/ 2 0 . 0 1 ; C/ 2 C/ 2 0 . 0 1 ] ; % Face i n ZtX ( 1 ) = 0 . 0 ; % T r a n s l a t i o n sCG( 1 , : ) = [ 0 . 0 0 . 0 D / 2 ] ; % F l o a t i n g c e n t e r o f t h e p l a t f o r mn f o b j ( 1 ) = 3000 ; % Number o f p a n e l s f o r t h e mesh
% H y d r o s t a t i c c a l c u l a t i o n[ H y d r o s t a t i c S t i f f n e s s ] = Mesh ( s a v e d i r , Wate rDens i ty , G r a v i t y , nBodies , n , X, tX , CG, n f o b j ) ; % Lunch Mesh .m
cd ( [ pwd , ’\mesh ’ ] ) ; % Change d i r e c t o r y from t h e main f o l d e r t o mesh f o l d e rc o p y f i l e ( ’ mesh1 . d a t ’ , ’ . . / ’ ) ; % Copy mesh1 . d a t f i l ecd ( ’ . . / ’ ) ; % Change d i r e c t o r y r e t u r n i n g t o t h e main f o l d e r
% Hydrodynamic da taw = [ 0 . 0 5 : 0 . 0 5 : 5 ] ; % Wave f r e q . [ rad / s ]d i r = 0 ; % Wave d i r e c t i o n [ grad ]d e p t h = 0 ; % Water d e p t h [m]
% Hydrodynamic c a l c u l a t i o n[ AddedMass , Rad ia t ionDamping ] = Nemoh (w, dir , d e p t h ) ; % Lunch Nemoh .m f i l e
% Data p r o c e s spostNemoh ( Wate rDens i ty , G r a v i t y , A, B ) ; % Lunch postNemoh .m f i l e
% Sa v i ng da ta f i l e s i n f o l d e r scd ( s a v e d i r ) ; % Re tu rn t o main f o l d e rAR = i n t 2 s t r (AR ) ; % Change AR from number t o s t r i n gmal l ado = i n t 2 s t r ( n f o b j ( 1 ) ) ; % Change n f o b j ( 1 ) from number t o s t r i n gfname = [ ’ A s p e c t R a t i o ’ AR ’ ’ ma l l ado ] ; % Cr ea te t h e name o f t h e f o l d e rmkdir ( ’ r e s u l t s ’ , fname ) ; % Cr ea te t h e f o l d e rm o v e f i l e ( ’ mesh /KH. d a t ’ , [ ’ r e s u l t s / ’ fname ] ) ; % Move KH. d a tm o v e f i l e ( ’ r e s u l t s /CA. d a t ’ , [ ’ r e s u l t s / ’ fname ] ) ; % Move CA . d a tm o v e f i l e ( ’ r e s u l t s /CM. d a t ’ , [ ’ r e s u l t s / ’ fname ] ) ; % Move CM. d a t
end
178
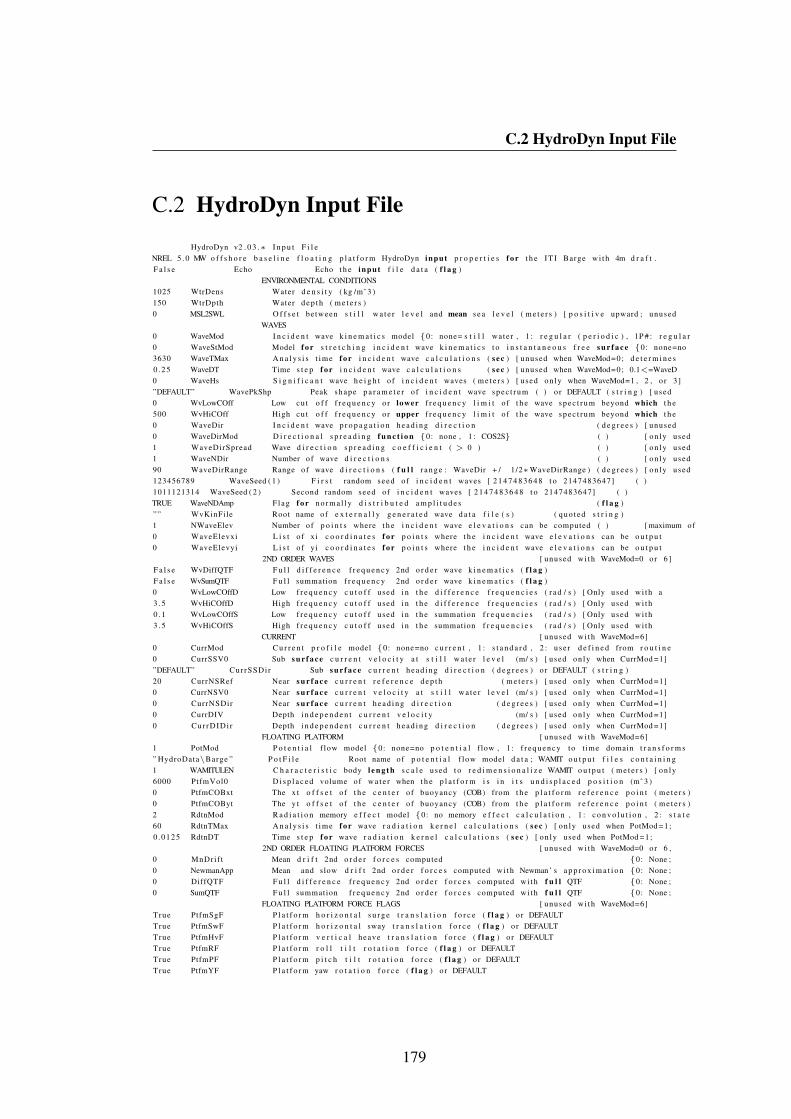
C.2 HydroDyn Input File
C.2 HydroDyn Input File
HydroDyn v2 . 0 3 .∗ I n p u t F i l eNREL 5 . 0 MW o f f s h o r e b a s e l i n e f l o a t i n g p l a t f o r m HydroDyn input p r o p e r t i e s f o r t h e I T I Barge wi th 4m d r a f t .F a l s e Echo Echo t h e input f i l e d a t a ( f l a g )
ENVIRONMENTAL CONDITIONS1025 WtrDens Water d e n s i t y ( kg /mˆ 3 )150 WtrDpth Water d e p t h ( m e t e r s )0 MSL2SWL O f f s e t be tween s t i l l w a t e r l e v e l and mean s e a l e v e l ( m e t e r s ) [ p o s i t i v e upward ; unused
WAVES0 WaveMod I n c i d e n t wave k i n e m a t i c s model 0: none= s t i l l water , 1 : r e g u l a r ( p e r i o d i c ) , 1P # : r e g u l a r0 WaveStMod Model f o r s t r e t c h i n g i n c i d e n t wave k i n e m a t i c s t o i n s t a n t a n e o u s f r e e s u r f a c e 0: none=no3630 WaveTMax A n a l y s i s t ime f o r i n c i d e n t wave c a l c u l a t i o n s ( s e c ) [ unused when WaveMod=0; d e t e r m i n e s0 . 2 5 WaveDT Time s t e p f o r i n c i d e n t wave c a l c u l a t i o n s ( s e c ) [ unused when WaveMod=0; 0.1<=WaveD0 WaveHs S i g n i f i c a n t wave h e i g h t o f i n c i d e n t waves ( m e t e r s ) [ used on ly when WaveMod=1 , 2 , o r 3 ]”DEFAULT” WavePkShp Peak shape p a r a m e t e r o f i n c i d e n t wave s p e c t r u m ( ) o r DEFAULT ( s t r i n g ) [ used0 WvLowCOff Low cut o f f f r e q u e n c y or lower f r e q u e n c y l i m i t o f t h e wave s p e c t r u m beyond which t h e500 WvHiCOff High cu t o f f f r e q u e n c y or upper f r e q u e n c y l i m i t o f t h e wave s p e c t r u m beyond which t h e0 WaveDir I n c i d e n t wave p r o p a g a t i o n h e a d i n g d i r e c t i o n ( d e g r e e s ) [ unused0 WaveDirMod D i r e c t i o n a l s p r e a d i n g f u n c t i o n 0: none , 1 : COS2S ( ) [ on ly used1 WaveDirSpread Wave d i r e c t i o n s p r e a d i n g c o e f f i c i e n t ( > 0 ) ( ) [ on ly used1 WaveNDir Number o f wave d i r e c t i o n s ( ) [ on ly used90 WaveDirRange Range of wave d i r e c t i o n s ( f u l l r a n g e : WaveDir + / 1/2∗WaveDirRange ) ( d e g r e e s ) [ on ly used123456789 WaveSeed ( 1 ) F i r s t random seed of i n c i d e n t waves [ 2 1 4 7 4 8 3 6 4 8 t o 2147483647] ( )1011121314 WaveSeed ( 2 ) Second random seed of i n c i d e n t waves [ 2 1 4 7 4 8 3 6 4 8 t o 2147483647] ( )TRUE WaveNDAmp Flag f o r n o r m a l l y d i s t r i b u t e d a m p l i t u d e s ( f l a g )”” WvKinFile Root name of e x t e r n a l l y g e n e r a t e d wave d a t a f i l e ( s ) ( qu o t ed s t r i n g )1 NWaveElev Number o f p o i n t s where t h e i n c i d e n t wave e l e v a t i o n s can be computed ( ) [ maximum of0 WaveElevxi L i s t o f xi c o o r d i n a t e s f o r p o i n t s where t h e i n c i d e n t wave e l e v a t i o n s can be o u t p u t0 WaveElevyi L i s t o f yi c o o r d i n a t e s f o r p o i n t s where t h e i n c i d e n t wave e l e v a t i o n s can be o u t p u t
2ND ORDER WAVES [ unused wi th WaveMod=0 or 6 ]F a l s e WvDiffQTF F u l l d i f f e r e n c e f r e q u e n c y 2nd o r d e r wave k i n e m a t i c s ( f l a g )F a l s e WvSumQTF F u l l summation f r e q u e n c y 2nd o r d e r wave k i n e m a t i c s ( f l a g )0 WvLowCOffD Low f r e q u e n c y c u t o f f used i n t h e d i f f e r e n c e f r e q u e n c i e s ( r a d / s ) [ Only used wi th a3 . 5 WvHiCOffD High f r e q u e n c y c u t o f f used i n t h e d i f f e r e n c e f r e q u e n c i e s ( r a d / s ) [ Only used wi th0 . 1 WvLowCOffS Low f r e q u e n c y c u t o f f used i n t h e summation f r e q u e n c i e s ( r a d / s ) [ Only used wi th3 . 5 WvHiCOffS High f r e q u e n c y c u t o f f used i n t h e summation f r e q u e n c i e s ( r a d / s ) [ Only used wi th
CURRENT [ unused wi th WaveMod=6]0 CurrMod C u r r e n t p r o f i l e model 0: none=no c u r r e n t , 1 : s t a n d a r d , 2 : u se r d e f i n e d from r o u t i n e0 CurrSSV0 Sub s u r f a c e c u r r e n t v e l o c i t y a t s t i l l w a t e r l e v e l (m/ s ) [ used on ly when CurrMod =1]”DEFAULT” CurrSSDir Sub s u r f a c e c u r r e n t h e a d i n g d i r e c t i o n ( d e g r e e s ) o r DEFAULT ( s t r i n g )20 CurrNSRef Near s u r f a c e c u r r e n t r e f e r e n c e d e p t h ( m e t e r s ) [ used on ly when CurrMod =1]0 CurrNSV0 Near s u r f a c e c u r r e n t v e l o c i t y a t s t i l l w a t e r l e v e l (m/ s ) [ used on ly when CurrMod =1]0 CurrNSDir Near s u r f a c e c u r r e n t h e a d i n g d i r e c t i o n ( d e g r e e s ) [ used on ly when CurrMod =1]0 CurrDIV Depth i n d e p e n d e n t c u r r e n t v e l o c i t y (m/ s ) [ used on ly when CurrMod =1]0 Cur rDIDi r Depth i n d e p e n d e n t c u r r e n t h e a d i n g d i r e c t i o n ( d e g r e e s ) [ used on ly when CurrMod =1]
FLOATING PLATFORM [ unused wi th WaveMod=6]1 PotMod P o t e n t i a l f low model 0: none=no p o t e n t i a l f low , 1 : f r e q u e n c y to t ime domain t r a n s f o r m s” HydroData\Barge ” P o t F i l e Root name of p o t e n t i a l f low model d a t a ; WAMIT o u t p u t f i l e s c o n t a i n i n g1 WAMITULEN C h a r a c t e r i s t i c body l e n g t h s c a l e used t o r e d i m e n s i o n a l i z e WAMIT o u t p u t ( m e t e r s ) [ on ly6000 PtfmVol0 D i s p l a c e d volume of w a t e r when t h e p l a t f o r m i s i n i t s u n d i s p l a c e d p o s i t i o n (mˆ 3 )0 PtfmCOBxt The x t o f f s e t o f t h e c e n t e r o f buoyancy (COB) from t h e p l a t f o r m r e f e r e n c e p o i n t ( m e t e r s )0 PtfmCOByt The y t o f f s e t o f t h e c e n t e r o f buoyancy (COB) from t h e p l a t f o r m r e f e r e n c e p o i n t ( m e t e r s )2 RdtnMod R a d i a t i o n memory e f f e c t model 0: no memory e f f e c t c a l c u l a t i o n , 1 : c o n v o l u t i o n , 2 : s t a t e60 RdtnTMax A n a l y s i s t ime f o r wave r a d i a t i o n k e r n e l c a l c u l a t i o n s ( s e c ) [ on ly used when PotMod =1;0 .0125 RdtnDT Time s t e p f o r wave r a d i a t i o n k e r n e l c a l c u l a t i o n s ( s e c ) [ on ly used when PotMod =1;
2ND ORDER FLOATING PLATFORM FORCES [ unused wi th WaveMod=0 or 6 ,0 MnDri f t Mean d r i f t 2nd o r d e r f o r c e s computed 0: None ;0 NewmanApp Mean and slow d r i f t 2nd o r d e r f o r c e s computed wi th Newman ’ s a p p r o x i m a t i o n 0: None ;0 DiffQTF F u l l d i f f e r e n c e f r e q u e n c y 2nd o r d e r f o r c e s computed wi th f u l l QTF 0: None ;0 SumQTF F u l l summation f r e q u e n c y 2nd o r d e r f o r c e s computed wi th f u l l QTF 0: None ;
FLOATING PLATFORM FORCE FLAGS [ unused wi th WaveMod=6]True PtfmSgF P l a t f o r m h o r i z o n t a l s u r g e t r a n s l a t i o n f o r c e ( f l a g ) o r DEFAULTTrue PtfmSwF P l a t f o r m h o r i z o n t a l sway t r a n s l a t i o n f o r c e ( f l a g ) o r DEFAULTTrue PtfmHvF P l a t f o r m v e r t i c a l heave t r a n s l a t i o n f o r c e ( f l a g ) o r DEFAULTTrue PtfmRF P l a t f o r m r o l l t i l t r o t a t i o n f o r c e ( f l a g ) o r DEFAULTTrue PtfmPF P l a t f o r m p i t c h t i l t r o t a t i o n f o r c e ( f l a g ) o r DEFAULTTrue PtfmYF P l a t f o r m yaw r o t a t i o n f o r c e ( f l a g ) o r DEFAULT
179

C. SOFTWARE INPUT FILES
PLATFORM ADDITIONAL STIFFNESS AND DAMPING∗ a l l z e r o s
AXIAL COEFFICIENTS1 NAxCoef Number o f a x i a l c o e f f i c i e n t s ( )AxCoefID AxCd AxCa AxCp( ) ( ) ( ) ( )1 0 . 0 0 0 . 0 0 1 . 0 0
MEMBER JOINTS2 N J o i n t s Number o f j o i n t s ( ) [ must be e x a c t l y 0 o r a t l e a s t 2 ]J o i n t I D J o i n t x i J o i n t y i J o i n t z i Jo in tAxID J o i n t O v r l p [ J o i n t O v r l p = 0 : do n o t h i n g a t j o i n t ,( ) (m) (m) (m) ( ) ( s w i t c h )1 0 .00000 0 .00000 4 . 0 0 0 0 0 1 02 0 .00000 0 .00000 0 .00000 1 0
MEMBER CROSS SECTION PROPERTIES1 NPropSets Number o f member p r o p e r t y s e t s ( )P ropSe t ID PropD PropThck( ) (m) (m)1 45 .13520 0 .00010
SIMPLE HYDRODYNAMIC COEFFICIENTS ( model 1 )SimplCd SimplCdMG SimplCa SimplCaMG SimplCp SimplCpMG SimplAxCa SimplAxCaMG SimplAxCp( ) ( ) ( ) ( ) ( ) ( ) ( ) ( ) ( )1 . 0 0 1 . 0 0 0 . 0 0 0 . 0 0 1 . 0 0 1 . 0 0 1 . 0 0 1 . 0 0 1 . 0 0
DEPTH BASED HYDRODYNAMIC COEFFICIENTS ( model 2 )0 NCoefDpth Number o f depth d e p e n d e n t c o e f f i c i e n t s ( )Dpth DpthCd DpthCdMG DpthCa DpthCaMG DpthCp DpthCpMG DpthAxCa DpthAxCaMG(m) ( ) ( ) ( ) ( ) ( ) ( ) ( ) ( )
MEMBER BASED HYDRODYNAMIC COEFFICIENTS ( model 3 )0 NCoefMembers Number o f member based c o e f f i c i e n t s ( )MemberID MemberCd1 MemberCd2 MemberCdMG1 MemberCdMG2 MemberCa1 MemberCa2 MemberCaMG1 MemberCaMG2MemberCp1 MemberCp2 MemberCpMG1 MemberCpMG2 MemberAxCa1 MemberAxCa2( ) ( ) ( ) ( ) ( ) ( ) ( ) ( )( ) ( ) ( ) ( ) ( ) ( ) ( ) ( )
MEMBERS1 NMembers Number o f members ( )MemberID MJointID1 MJointID2 MPropSetID1 MPropSetID2 MDivSize MCoefMod PropPo t [ MCoefMod=1: use( ) ( ) ( ) ( ) ( ) (m) ( s w i t c h ) ( f l a g )1 1 2 1 1 0 .5000 1 TRUE
FILLED MEMBERS0 N F i l l G r o u p s Number o f f i l l e d member g r oup s ( ) [ I f F i l l D e n s = DEFAULT, t h e n F i l l D e n s = WtrDens ;FillNumM F i l l M L i s t F i l l F S L o c F i l l D e n s( ) ( ) (m) ( kg /mˆ 3 )
MARINE GROWTH0 NMGDepths Number o f marine growth d e p t h s s p e c i f i e d ( )MGDpth MGThck MGDens(m) (m) ( kg /mˆ 3 )
MEMBER OUTPUT LIST0 NMOutputs Number o f member o u t p u t s ( ) [ must be < 10]MemberID NOutLoc NodeLocs [ NOutLoc < 1 0 ; node l o c a t i o n s a r e n o r m a l i z e d d i s t a n c e from t h e s t a r t o f( ) ( ) ( )
JOINT OUTPUT LIST0 NJOutputs Number o f j o i n t o u t p u t s [ Must be < 10]0 J O u t L s t L i s t o f J o i n t I D s which a r e t o be o u t p u t ( ) [ unused i f NJOutputs =0]
OUTPUTTrue HDSum Outpu t a summary f i l e [ f l a g ]F a l s e OutAl l Outpu t a l l use r s p e c i f i e d member and j o i n t l o a d s ( on ly a t each member2 OutSwtch Outpu t r e q u e s t e d c h a n n e l s t o : [1= Hydrodyn . out , 2= GlueCode . out , 3= bo th f i l e s ]”ES11 . 4 e2 ” OutFmt Outpu t format f o r n u m e r i c a l r e s u l t s ( q uo t e d s t r i n g ) [ n o t checked f o r”A11” OutSFmt Outpu t format f o r h e a d e r s t r i n g s ( qu o t ed s t r i n g ) [ n o t checked f o r
OUTPUT CHANNELS” Wave1Elev ” Wave e l e v a t i o n a t t h e p l a t f o r m r e f e r e n c e p o i n t ( 0 , 0 ) , (m)END of o u t p u t c h a n n e l s and end of f i l e . ( t h e word ”END” must a p p e a r i n t h e f i r s t 3 columns o f t h i s l i n e )
END of o u t p u t c h a n n e l s and end of f i l e . ( t h e word ”END” must a p p e a r i n t h e f i r s t 3 columns o f t h i s l i n e )”TTDspSS” Tower t o p / yaw b e a r i n g s i d e to s i d e ( t r a n s l a t i o n a l ) d e f l e c t i o n ( r e l a t i v eEND of input f i l e ( t h e word ”END” must a p p e a r i n t h e f i r s t 3 columns o f t h i s l a s t O u t L i s t l i n e )
180

APPENDIX
DSimulation Results
D.1 Manually Tuned Controller Performance Extreme-Events
Parameter Controller Type Conditions Value (KNm) Time (sec)
Min Vw = 25m/s Hs = 6m -5,431E+05 3172,2
Max Vw = 21m/s Hs = 6m 4,682E+05 2767,2
Min Vw = 15m/s Hs = 6m -4,338E+05 497,0
Max Vw = 13m/s Hs = 6m 4,772E+05 2767,1
Min Vw = 25m/s Hs = 6m -5,063E+05 3171,9
Max Vw = 13m/s Hs = 6m 4,806E+05 2767,2
Min Vw = 25m/s Hs = 6m -1,440E+05 598,6
Max Vw = 25m/s Hs = 6m 1,699E+05 1880,0
Min Vw = 23m/s Hs = 6m -1,253E+05 3252,2
Max Vw = 23m/s Hs = 6m 1,566E+05 3257,9
Min Vw = 25m/s Hs = 6m -1,670E+05 2304,0
Max Vw = 25m/s Hs = 6m 1,841E+05 1878,5
MyT
(TwrBsMyt)
Detuned PI
Detuned PI & APS
Detuned PI & APS & WR
MxT
(TwrBsMxt)
Detuned PI
Detuned PI & APS
Detuned PI & APS & WR
181

D. SIMULATION RESULTS
Parameter Controller Type Conditions Value (KNm) Time (sec)
Min Vw = 25m/s Hs = 6m -1,702E+04 498,8
Max Vw = 25m/s Hs = 6m 2,349E+04 506,6
Min Vw = 25m/s Hs = 6m -2,077E+04 2354,0
Max Vw = 25m/s Hs = 6m 2,438E+04 2351,0
Min Vw = 25m/s Hs = 6m -1,910E+04 498,7
Max Vw = 13m/s Hs = 6m 2,089E+04 326,2
Min Vw = 21m/s Hs = 6m -9,700E+03 1853,3
Max Vw = 23m/s Hs = 6m 1,037E+04 1782,9
Min Vw = 23m/s Hs = 6m -9,511E+03 1877,4
Max Vw = 21m/s Hs = 6m 1,016E+04 3172,6
Min Vw = 25m/s Hs = 6m -9,159E+03 2305,0
Max Vw = 23m/s Hs = 6m 8,747E+03 2674,8
MyB
(RootMyb1)
Detuned PI
Detuned PI & APS
Detuned PI & APS & WR
MxB
(RootMxb1)
Detuned PI
Detuned PI & APS
Detuned PI & APS & WR
D.2 Optimised Controller Performance Extreme-Events
Parameter Controller Type Conditions Value (KNm) Time (sec)
Min Vw = 25m/s Hs = 6m -5,431E+05 3172,2
Max Vw = 21m/s Hs = 6m 4,682E+05 2767,2
Min Vw = 25m/s Hs = 6m -5,063E+05 3171,9
Max Vw = 13m/s Hs = 6m 4,806E+05 2767,2
Min Vw = 19m/s Hs = 6m -4,816E+05 3172,1
Max Vw = 25m/s Hs = 6m 4,793E+05 2767,1
Min Vw = 25m/s Hs = 6m -1,440E+05 598,6
Max Vw = 25m/s Hs = 6m 1,699E+05 1880,0
Min Vw = 25m/s Hs = 6m -1,670E+05 2304,0
Max Vw = 25m/s Hs = 6m 1,841E+05 1878,5
Min Vw = 23m/s Hs = 6m -1,434E+05 2303,9
Max Vw = 25m/s Hs = 6m 1,411E+05 1610,8
Min Vw = 25m/s Hs = 6m -1,702E+04 498,8
Max Vw = 25m/s Hs = 6m 2,349E+04 506,6
Min Vw = 25m/s Hs = 6m -1,910E+04 498,7
Max Vw = 13m/s Hs = 6m 2,089E+04 326,2
Min Vw = 23m/s Hs = 6m -2,003E+04 498,5
Max Vw = 19m/s Hs = 6m 2,099E+04 326,1
Min Vw = 21m/s Hs = 6m -9,700E+03 1853,3
Max Vw = 23m/s Hs = 6m 1,037E+04 1782,9
Min Vw = 25m/s Hs = 6m -9,159E+03 2305,0
Max Vw = 23m/s Hs = 6m 8,747E+03 2674,8
Min Vw = 25m/s Hs = 6m -1,004E+04 1853,2
Max Vw = 25m/s Hs = 6m 9,080E+03 496,0
Detuned PI
Optimised APS & WR
Detuned PI
Optimised APS & WR
MyT
(TwrBsMyt)
MxT
(TwrBsMxt)
Manually APS & WR
Manually APS & WR
MyB
(RootMyb1)
Detuned PI
Optimised APS & WR
Detuned PI
Optimised APS & WR
MxB
(RootMxb1)
Manually APS & WR
Manually APS & WR
182

D.3 Time-Domain Simulations NREL 5-MW Beam-Draught Ratio 6 Barge
D.3 Time-Domain Simulations NREL 5-MW Beam-Draught Ratio 6 Barge
183


Declaration
I herewith declare that I have produced this work without the prohib-ited assistance of third parties and without making use of aids otherthan those specified; notions taken over directly or indirectly fromother sources have been identified as such. This work has not pre-viously been presented in identical or similar form to any examinationboard. Except where indicated by specific reference in the text, thework is the candidate’s own work. Work done in collaboration with,or with the assistance of, others, is indicated as such. Any views ex-pressed in the dissertation are those of the author.
This dissertation was finished in Leioa, 2019.


This page is intentionally left blank

![Requirements for the floating structure (Demo 1) · [R05] IEC 61400-3 “Wind turbines: design requirements for offshore wind turbines” [R06] “ode for construction and equipment](https://static.fdocuments.in/doc/165x107/60723a69583caa4770307f37/requirements-for-the-floating-structure-demo-1-r05-iec-61400-3-aoewind-turbines.jpg)