
Development of a clinical head and neck hyperthermia ... · Development of a Clinical Head and Neck...
177
Development of a clinical head and neck hyperthermia applicator Maarten Paulides
Transcript of Development of a clinical head and neck hyperthermia ... · Development of a Clinical Head and Neck...

Development of a clinical head and neck hyperthermia applicator
Maarten Paulides

Development of a Clinical Headand Neck Hyperthermia Applicator
Maarten Paulides

Colofon:Printing of this thesis was financed by Schmid & Partner Engineering AG (SPEAG),Zurich, Switzerland.
This research was financially supported by the Dutch Cancer Society (KWF Kankerbe-strijding).
The cover picture beautifully illustrates the complexity of interfering waves, as willalso occur during hyperthermia treatments with microwaves. The small figure is animpression of the developed head and neck applicator.
ISBN : 978-90-8891-009-8
Printed by : Uitgeverij Boxpress, Oisterwijk
Copyright : c© 2007 M.M. Paulides
All rights reserved. No part of this thesis may be reproduced, stored in a retrieval system
of any nature, or transmitted in any form by any means, electronic, mechanical, photo-
copying, recording or otherwise, included a complete form or partial transcription, without
the permission of the copyright owners.
Development of a Clinical Headand Neck Hyperthermia Applicator
Ontwikkeling van een klinische hoofd-hals hyperthermie applicator
Proefschrift
ter verkrijging van de graad van doctoraan de Erasmus Universiteit Rotterdam
op gezag van de rector magnificus
Prof.dr. S.W.J. Lamberts
en volgens besluit van het College voor Promoties.
De openbare verdediging zal plaatsvinden opdonderdag 18 oktober 2007 om 13.30 uur
door
Margarethus Marius Paulides
geboren te Waalwijk
Promotiecommissie
Promotoren: Prof.dr. P.C. Levendag
Prof.dr. ir. A.P.M. Zwamborn
Overige leden: Prof.dr. B.J.M. Heijmen
Prof.dr. P.M.T. Pattynama
Prof.dr. A.G. Tijhuis
Copromotor: Dr.ing. G.C. van Rhoon
The investigations presented in this thesis were carried out at the Department ofRadiation Oncology, Erasmus MC - Daniel den Hoed Cancer Center, Rotterdamand at the National Institute of Applied Physics (TNO), The Hague.
Address for correspondence:M.M. Paulides, Department of Radiation Oncology: Unit Hyperthermia, ErasmusMC - Daniel den Hoed Cancer Center, PO box 5201, 3008AE Rotterdam, TheNetherlands. ([email protected])
”Kleine lichtpuntjes op een slechte dag, zijn dat knipoogjes van God?”(Visje)
aan Petra
en beide families


Contents
1 Introduction 1
1.1 Background . . . . . . . . . . . . . . . . . . . . . . . . . . . . . . . . 2
1.2 Hyperthermia treatment . . . . . . . . . . . . . . . . . . . . . . . . . 2
1.2.1 Hyperthermia applicators . . . . . . . . . . . . . . . . . . . . 3
1.2.2 Head and neck hyperthermia . . . . . . . . . . . . . . . . . . . 4
1.3 The Dutch Cancer Society project . . . . . . . . . . . . . . . . . . . . 5
1.3.1 Approach . . . . . . . . . . . . . . . . . . . . . . . . . . . . . 6
1.4 Outline of this thesis . . . . . . . . . . . . . . . . . . . . . . . . . . . 7
2 Optimization of frequency and sources for a single antenna ring 9
2.1 Introduction . . . . . . . . . . . . . . . . . . . . . . . . . . . . . . . . 10
2.2 Materials and methods . . . . . . . . . . . . . . . . . . . . . . . . . . 12
2.2.1 Anatomy model . . . . . . . . . . . . . . . . . . . . . . . . . . 12
2.2.2 Applicator model . . . . . . . . . . . . . . . . . . . . . . . . . 13
2.2.3 Electromagnetic modelling . . . . . . . . . . . . . . . . . . . . 14
2.2.4 Evaluation . . . . . . . . . . . . . . . . . . . . . . . . . . . . . 15
2.3 Results . . . . . . . . . . . . . . . . . . . . . . . . . . . . . . . . . . . 16
2.3.1 Positioning and optimal number of dipoles in a single antennaring . . . . . . . . . . . . . . . . . . . . . . . . . . . . . . . . 16
2.3.2 Optimum operating frequency . . . . . . . . . . . . . . . . . . 17
2.3.3 Influence of the neck dimensions on the frequency . . . . . . . 20
2.4 Discussion . . . . . . . . . . . . . . . . . . . . . . . . . . . . . . . . . 21
2.4.1 Evaluation of the materials and methods . . . . . . . . . . . . 21
2.4.2 Discussion of the results . . . . . . . . . . . . . . . . . . . . . 23
2.5 Conclusion . . . . . . . . . . . . . . . . . . . . . . . . . . . . . . . . . 25
ii CONTENTS
3 Local SAR distortion by major anatomical structures 27
3.1 Introduction . . . . . . . . . . . . . . . . . . . . . . . . . . . . . . . . 28
3.2 Materials and methods . . . . . . . . . . . . . . . . . . . . . . . . . . 30
3.2.1 Creation of the average neck phantom . . . . . . . . . . . . . 30
3.2.2 Applicator model . . . . . . . . . . . . . . . . . . . . . . . . . 33
3.2.3 FDTD modelling . . . . . . . . . . . . . . . . . . . . . . . . . 33
3.2.4 Evaluation . . . . . . . . . . . . . . . . . . . . . . . . . . . . . 34
3.3 Results . . . . . . . . . . . . . . . . . . . . . . . . . . . . . . . . . . . 36
3.3.1 Influences per structure . . . . . . . . . . . . . . . . . . . . . . 36
3.3.2 Influences of structure dimensions . . . . . . . . . . . . . . . . 39
3.3.3 Influence of the outer contour approximation . . . . . . . . . . 41
3.4 Discussion . . . . . . . . . . . . . . . . . . . . . . . . . . . . . . . . . 43
3.4.1 Evaluation of the materials and methods . . . . . . . . . . . . 43
3.4.2 SAR and RD distributions: trends and clinical translation . . 44
3.5 Conclusions . . . . . . . . . . . . . . . . . . . . . . . . . . . . . . . . 45
4 Optimization of a multi-ring antenna array set-up 47
4.1 Introduction . . . . . . . . . . . . . . . . . . . . . . . . . . . . . . . . 48
4.2 Materials and methods . . . . . . . . . . . . . . . . . . . . . . . . . . 49
4.2.1 Anatomy and antenna arrangements . . . . . . . . . . . . . . 50
4.2.2 Electromagnetic modelling . . . . . . . . . . . . . . . . . . . . 54
4.2.3 Evaluation . . . . . . . . . . . . . . . . . . . . . . . . . . . . . 55
4.3 Results . . . . . . . . . . . . . . . . . . . . . . . . . . . . . . . . . . . 55
4.3.1 First series: ring radius and patient model orientation . . . . . 55
4.3.2 Second series: number of rings, amount of antennas per ringand ring distance . . . . . . . . . . . . . . . . . . . . . . . . . 58
4.4 Discussion . . . . . . . . . . . . . . . . . . . . . . . . . . . . . . . . . 58
4.5 Conclusions . . . . . . . . . . . . . . . . . . . . . . . . . . . . . . . . 62
5 Design of the patch antenna 63
5.1 Introduction . . . . . . . . . . . . . . . . . . . . . . . . . . . . . . . . 64
5.2 Materials and methods . . . . . . . . . . . . . . . . . . . . . . . . . . 66
5.2.1 Design requirements . . . . . . . . . . . . . . . . . . . . . . . 66
5.2.2 Application specific configuration . . . . . . . . . . . . . . . . 66
5.2.3 EM modelling . . . . . . . . . . . . . . . . . . . . . . . . . . . 67
5.2.4 Clinical antenna set-up: measurements and simulation . . . . . 69
5.3 Results . . . . . . . . . . . . . . . . . . . . . . . . . . . . . . . . . . . 71
5.3.1 Antenna design . . . . . . . . . . . . . . . . . . . . . . . . . . 71
5.3.2 Characteristics of the design under clinical conditions . . . . . 74
5.3.3 Clinical antenna set-up: measurements and simulation . . . . . 76
5.4 Discussion and conclusions . . . . . . . . . . . . . . . . . . . . . . . . 77

CONTENTS iii
6 Experimental SAR verification with a laboratory prototype 79
6.1 Introduction . . . . . . . . . . . . . . . . . . . . . . . . . . . . . . . . 80
6.2 Materials and methods . . . . . . . . . . . . . . . . . . . . . . . . . . 81
6.2.1 Prototype design . . . . . . . . . . . . . . . . . . . . . . . . . 81
6.2.2 EM modelling . . . . . . . . . . . . . . . . . . . . . . . . . . . 83
6.2.3 Measurements . . . . . . . . . . . . . . . . . . . . . . . . . . . 83
6.3 Results . . . . . . . . . . . . . . . . . . . . . . . . . . . . . . . . . . . 87
6.3.1 Reflection and cross-coupling . . . . . . . . . . . . . . . . . . 87
6.3.2 SAR tracks . . . . . . . . . . . . . . . . . . . . . . . . . . . . 87
6.3.3 Dynamic SAR steering . . . . . . . . . . . . . . . . . . . . . . 93
6.4 Discussion . . . . . . . . . . . . . . . . . . . . . . . . . . . . . . . . . 94
6.4.1 Evaluation of the materials and methods . . . . . . . . . . . . 94
6.4.2 Evaluation of the results . . . . . . . . . . . . . . . . . . . . . 94
6.4.3 Quality assurance . . . . . . . . . . . . . . . . . . . . . . . . . 96
6.5 Conclusions . . . . . . . . . . . . . . . . . . . . . . . . . . . . . . . . 97
7 The HYPERcollar: the clinical applicator design 99
7.1 Introduction . . . . . . . . . . . . . . . . . . . . . . . . . . . . . . . . 100
7.2 Materials and methods . . . . . . . . . . . . . . . . . . . . . . . . . . 101
7.2.1 Applicator system . . . . . . . . . . . . . . . . . . . . . . . . . 102
7.2.2 Characterization measurements . . . . . . . . . . . . . . . . . 104
7.2.3 Treatment planning . . . . . . . . . . . . . . . . . . . . . . . . 104
7.3 Results . . . . . . . . . . . . . . . . . . . . . . . . . . . . . . . . . . . 108
7.3.1 Comfort of the applicator . . . . . . . . . . . . . . . . . . . . 108
7.3.2 Characterization measurements . . . . . . . . . . . . . . . . . 108
7.3.3 Predicted SAR in a patient model . . . . . . . . . . . . . . . . 110
7.4 Discussion . . . . . . . . . . . . . . . . . . . . . . . . . . . . . . . . . 112
7.5 Conclusions . . . . . . . . . . . . . . . . . . . . . . . . . . . . . . . . 115
8 First result of the phase I study 117
8.1 Introduction . . . . . . . . . . . . . . . . . . . . . . . . . . . . . . . . 118
8.2 Materials and methods . . . . . . . . . . . . . . . . . . . . . . . . . . 118
8.2.1 Case description . . . . . . . . . . . . . . . . . . . . . . . . . . 118
8.2.2 Treatment planning . . . . . . . . . . . . . . . . . . . . . . . . 118
8.2.3 Procedure . . . . . . . . . . . . . . . . . . . . . . . . . . . . . 119
8.2.4 Goals of the heating session . . . . . . . . . . . . . . . . . . . 121
8.3 Results . . . . . . . . . . . . . . . . . . . . . . . . . . . . . . . . . . . 122
8.3.1 Evaluation of the heat session . . . . . . . . . . . . . . . . . . 122
8.3.2 SAR analysis . . . . . . . . . . . . . . . . . . . . . . . . . . . 124
8.4 Discussion . . . . . . . . . . . . . . . . . . . . . . . . . . . . . . . . . 127
8.5 Conclusion . . . . . . . . . . . . . . . . . . . . . . . . . . . . . . . . . 129

iv CONTENTS
9 General discussion and perspectives 1319.1 General discussion and perspectives . . . . . . . . . . . . . . . . . . . 132
9.1.1 Evaluation of the design approach . . . . . . . . . . . . . . . . 1329.1.2 Evaluation of the design . . . . . . . . . . . . . . . . . . . . . 1339.1.3 Evaluation of the HYPERcollar applicator system . . . . . . . 1349.1.4 Future work and perspectives . . . . . . . . . . . . . . . . . . 135
Summary 139
Samenvatting 143
Publications 147
Curriculum Vitae 151
Dankwoord / Acknowledgements 153

CHAPTER 1
Introduction

2 Introduction
1.1 Background
Worldwide, around 3-5% of patients suffering from cancer have tumours in the headand neck (H&N) region58,65,66. By definition, the term ”head and neck cancers”usually excludes tumours that occur in the eyes, in brain and in skin. The mostfrequently occurring cancers of the head and neck area are located in the oral cavityand the larynx.
The H&N region is often divided in five regions,each containing different tumour sites:
1. Oral cavity
2. Nasopharynx (area behind the nose)
3. Oropharynx
4. Hypopharynx (bottom part of the throat)
5. Larynx (voice box)
Figure 1.1: Indication of the different regions in the head and neck region.
In the H&N region, treatment of advanced tumours remains complex12 and loco-regional control poses a major therapeutic challenge20,79. The currently standard ra-diochemotherapy (RCT) generally results in a 5-year survival rate of 20% to 65%12.Furthermore, the toxicity related to the RCT treatment remains a major issue90.Often occurring early and late side effects are loss of swallowing function and xe-rostomia (loss of salivary function) leading to difficulties in speaking and eating.Therefore, a considerable effort is directed to improving treatment outcome whileminimizing toxicity: some examples of those are described in Section 2.1. Additionof hyperthermia (HT) to current treatment modalities may contribute to the loco-regional control of the tumours and generally the heat treatment has no contributionto the toxicity of the treatment98.
1.2 Hyperthermia treatment
In a HT treatment, energy is transferred into the patient to accomplish a therapeuticresult. In the Erasmus MC - Daniel den Hoed Cancer Center, HT is being appliedby inducing tumour temperatures between 40-44C for 30-60 minutes or longer98.Several Phase III trials10,44,99 have demonstrated the efficacy of the addition of aHT treatment to either radiotherapy (RT) or chemotherapy (ChT) in terms of localtumour control and/or survival rates. Further, these studies showed no clinicallyrelevant extra HT toxicity and, moreover, no enhancement of RT or ChT toxicity:a unique feature of a cancer treatment. The biological rationale for HT, however, is

1.2 Hyperthermia treatment 3
still not very well established18,47. Direct cell kill is not very likely at the ’mild’ tem-peratures that are generally obtained in the clinic during hyperthermia treatments(39-42C)18. Research nowadays focusses, amongst many others, on the effects ofHT on tumour oxygenation and vascular damage.
1.2.1 Hyperthermia applicators
Hyperthermia can be applied by whole-body, external or interstitial/intracavitarytechniques87. External HT applicators use ultrasound (US) or electromagnetic (EM)waves to direct energy to the target region. US provides similar heating options asEM but results in more bone-pain complaints during treatment6. For EM-baseddeep hyperthermia (DHT) there are both commercial and non-commercial deviceswhereas most devices for superficial HT (SHT) are developed in-house.
Applicators at the Daniel den Hoed Cancer Center
The HT treatment is divided in whole-body, deep-regional and superficial HT87. Thethreshold between deep and superficial HT is commonly considered to be at 4 cmmaximum depth of the treatment area. In the Daniel den Hoed Cancer Center, thecommercial BSD2000 Sigma-60 and Sigma-eye applicators (BSD Medical, USA) areused for DHT treatments in the pelvic region, and the in-house developed Lucitecone applicator (LCA)-system is used for superficial treatments.
BSD2000 system LCA system
Figure 1.2: Clinical applicators that are used within the hyperthermia unit.
Treatment planning
In some institutes, DHT treatments are preceded by patient-specific treatment plan-ning. However, treatment planning programs are used more commonly to investigatenovel applicator designs or general treatment changes to improve the heat delivery51.

4 Introduction
The first step of HT treatment planning is the generation of a segmentation (patientmodel) from computerized tomography (CT) or magnetic resonance imaging (MRI)scans. A model of the applicator and this segmentation are used to calculate thepower absorption (PA, [W/m3]) or specific absorption rate (SAR, [W/kg]) distri-bution in the patient by EM models. These EM models for treatment planning arecommonly based on the finite-element (FE) method or finite-difference time-domain(FDTD) method. A temperature distribution in the patient can be calculated fromthe power absorption distribution by applying Pennes’ bio-heat equation (PBHE78),or more elaborate algorithms including the (blood) vessel network, i.e. discrete vas-culature (DIVA) models, down to vessel sizes in the millimeter range51,67. The mainproblems with these thermal methods are long time-requirements for the generationof a vessel network and the large, poorly-predictable, variations in thermal prop-erties of tissues. Therefore, for applicator comparisons, developments and qualityassurance (QA) purposes, normally PA or SAR distributions are used.
1.2.2 Head and neck hyperthermia
A significant benefit of the addition of a HT treatment for superficially located tu-mours or metastatic lymph nodes in the H&N region has been reported in literature.Valdagni et al.94,95 demonstrated that with a non-specific HT-applicator already asignificant increase in local control (from 24% for RT alone versus 69% for RT plusHT) is achieved for metastatic lymph nodes, without additional toxicity. In a PhaseI/II study, Amichetti et al.2 showed improved treatment outcome also for HT inaddition to a hyperfractionated radiation schedule and no increase of the toxicity.
In our opinion, a major cause of the loss of interest in the combined treatmentof RT+HT for advanced H&N tumours lymph nodes has been the lack of an ap-propriate HT system to adequately heat these tumours. Further, the use of a spe-cific designed HT applicator consisting of an array of electromagnetic (EM) an-tenna elements is expected to result in large improvements in the quality of heatingarbitrarily-shaped target regions in the H&N region107.
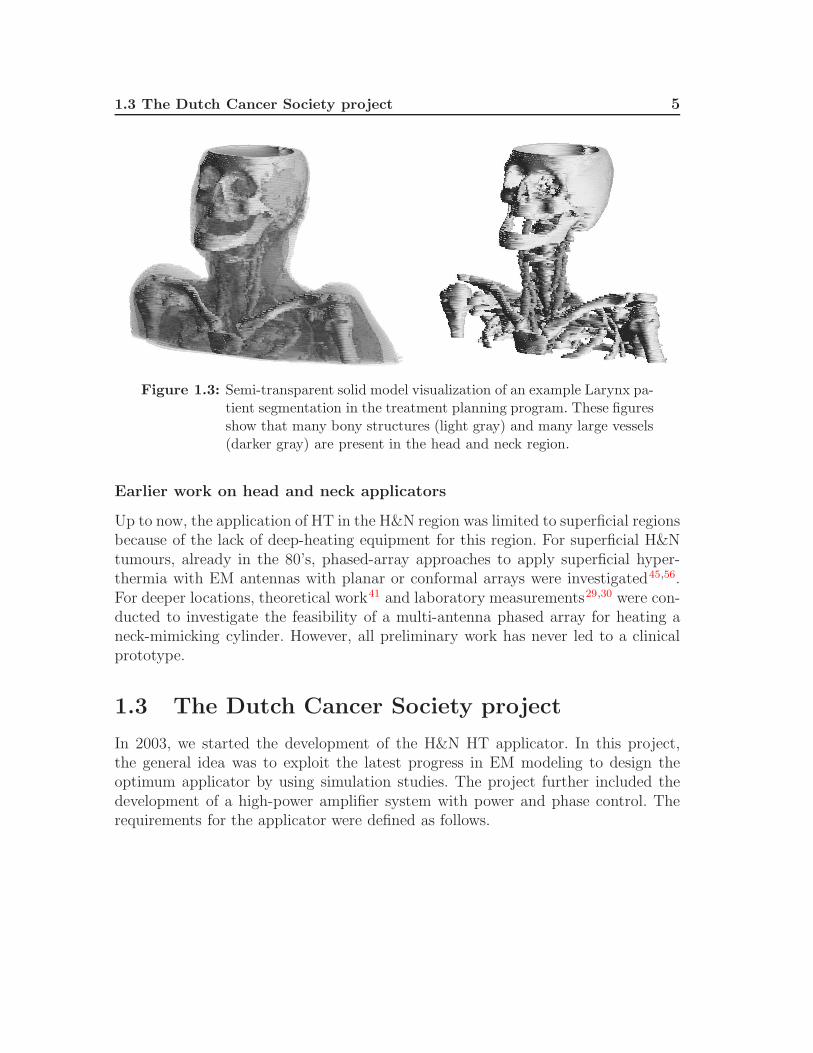
The head and neck region is characterized by many tissue transitions, small in diam-eter structures and large cooling vessels (Figure 1.3). Applying an adequate thermaldose to target areas in the entire head and neck region therefore is a challengingtask since the anatomy can have a major influence on the power absorption pat-tern. Further, highly thermo-sensitive tissues are present within the treatment region(myelum = spinal column) or very nearby (brains) and hence there exist a relevantrisk of thermally related toxicity34. Hyperthermia must therefore be applied withequipment that enables sufficient resolution and degrees of freedom (DOF) to beable to shape the power absorption pattern such that only a limited amount ofpower is absorbed in myelum and brains during treatment while sufficient power isabsorbed in the target region.
1.3 The Dutch Cancer Society project 5
Figure 1.3: Semi-transparent solid model visualization of an example Larynx pa-tient segmentation in the treatment planning program. These figuresshow that many bony structures (light gray) and many large vessels(darker gray) are present in the head and neck region.
Earlier work on head and neck applicators
Up to now, the application of HT in the H&N region was limited to superficial regionsbecause of the lack of deep-heating equipment for this region. For superficial H&Ntumours, already in the 80’s, phased-array approaches to apply superficial hyper-thermia with EM antennas with planar or conformal arrays were investigated45,56.For deeper locations, theoretical work41 and laboratory measurements29,30 were con-ducted to investigate the feasibility of a multi-antenna phased array for heating aneck-mimicking cylinder. However, all preliminary work has never led to a clinicalprototype.
1.3 The Dutch Cancer Society project
In 2003, we started the development of the H&N HT applicator. In this project,the general idea was to exploit the latest progress in EM modeling to design theoptimum applicator by using simulation studies. The project further included thedevelopment of a high-power amplifier system with power and phase control. Therequirements for the applicator were defined as follows.

6 Introduction
SAR distribution:
• The applicator must have the flexibility to heat advanced lateralized tumoursand/or tumours located at the center of the H&N region.
• The hyperthermia field widely covers the macroscopic tumour, e.g. with aminimum margin of 1 cm overlap. The hyperthermia field is defined as thearea enclosed by at least the 25% iso-SAR contour54.
• The applicator should allow SAR pattern adjustment such that no heating ofcritical organs (myelum, cartilage) above the tolerance limits occurs.
• The SAR distribution can be controlled in both the radial (dorsal-ventral andleft-right) and axial (patient-axis: cranial-caudal) direction.
Technology:
• The applicator has the ability to conform to the tissue contour with minimaldiscomfort to the patient.
• The water bolus and antennas are integrated in a single mechanical construc-tion rendering easy positioning of the applicator around the target area.
• The applicator set-up can be positioned with a reproducibility better than1 cm in any direction.
• Building the applicator set-up should be simple and fast.
• The applicator has excellent reliability under clinical conditions, e.g. it canoperate for long periods at high RF-power outputs and requires only limitedtime for preventive and scheduled maintenance service.
1.3.1 Approach
The project was started by carrying out a feasibility study into deep heating inthe neck with a good control of the SAR pattern. SAR control is highly frequencydependent and requires sufficient resolution (high frequency) but also sufficient pen-etration of the EM waves (low frequency). Therefore, as a first step we determinedthe optimum trade-off frequency. Good SAR control is further determined by theamount of DOF (phases and amplitudes), i.e. the number of antennas. Therefore,in subsequent steps we analyzed the required number of antennas and their posi-tioning. These parameter studies were performed by using the most simple antenna,i.e. a dipole. To improve the robustness and predictability of the applicator set-up,we specifically designed a patch antenna to replace the dipoles. Simultaneously, weestablished that calculated or measured SAR patterns in a simple model are predic-tive for the SAR pattern in the neck. This simple cylindrical model was then used
1.4 Outline of this thesis 7
to verify the predicted SAR patterns by phantom measurements. As a last step, allparameters were used as input to design a clinical prototype of the applicator: theHYPERcollar.
Simulation of harmonic signals with FDTD
For this project we chose to use the FDTD method for all EM calculations becauseit: 1) is suited for simulating highly non-homogeneous models, 2) scales well withthe resolution increase 3) implicitly incorporates coupling between patient and an-tennas and 4) can be implemented efficiently in hardware accelerators. The FDTDmethod is described extensively in89 and its use for hyperthermia purposes is dis-cussed in11,38. The FDTD technique is a time domain technique. An item that ispoorly addressed for FDTD is the definition of steady-state for harmonic signals38.For harmonic signals (433 MHz), we will assess steady-state by placing voltage sen-sors at the gap of each antenna and centrally in the domain. Steady-state will beassumed when the difference in maximum value of multiple subsequent periods hasdecreased to a few percent. For simplicity we will use the dielectric properties per-taining to the operation frequency of 433 MHz for all frequencies that are present inthe excitation signal. Using Fourier analysis, we established that a time-harmonicsinusoidal signal, modulated by a one-period ramp, exhibits only a small frequencyband (-10dB bandwidth ¡ 100 MHz). This ramp further prevents dc signals to begenerated23 and the FDTD algorithm works as a filter for high frequencies89. Inaddition, the signal is used to excite antennas that work as a good frequency filter.Considering the above mentioned, we have chosen to use FDTD as a designer tool tofast and accurately calculate the EM distributions. Improvements on the algorithmitself are not considered and outside the scope of the research. The validity of ourchoice is supported by measurements in which the predictive value of the simulationsfor our application has been shown.
1.4 Outline of this thesis
Chapter 2 contains the results of a theoretical analysis into the feasibility of fo-cussed heating in the head and neck region by a circumferential array of an-tennas. The analysis was performed by using an electromagnetic solver and arealistic patient model. Parameters of interest in this investigation were an-tenna positions, number of antennas and operating frequency.
Chapter 3 is dedicated to the distortions on the local SAR distribution of the the-oretical set-up (chapter 2) by various major anatomical structures in the neck.The influence on the SAR pattern of major structures was assessed by highresolution 3D FDTD calculations. In this work, the neck was approximatedby a semi-3D generic phantom based on average dimensions obtained fromCT-derived human data.

8 Introduction
Chapter 4 describes the work to converge from the theoretical set-up, as found inchapter 2, towards an actual multi-antenna-ring configuration for the clinicalapplicator.
Chapter 5 is dedicated to a specifically designed patch antenna and its develop-ment process. Further, theoretical work into its behavior under clinical con-ditions is reported. Finally, the accuracy of the FDTD model is assessed bymeasurements using an approximated array set-up.
Chapter 6 describes the measurements that were conducted using a cylindricalmuscle phantom (chapter 3) and a laboratory prototype consisting of patchantennas (chapter 5) in the optimum arrangement (chapter 4). By these mea-surements we determined the minimum focus size, the SAR pattern steeringpossibilities of the set-up and verified the SAR pattern predictions.
Chapter 7 shows the final, clinical, head and neck applicator prototype and all itsfeatures. Further, the corresponding treatment planning is explained and itspotential shown using an example larynx patient model.
Chapter 8 reports on the session that was applied to the first patient of the clinicalfeasibility study. In this chapter we present the results of treatment planning,the HT session and the measured temperatures.
Chapter 9 finalizes the scientific content by providing the general conclusions andfuture perspectives.

CHAPTER 2
Optimization of frequency and sources for a single antenna ring
This chapter is based on:M.M. Paulides, S.H.J.A. Vossen, A.P.M. Zwamborn, G.C. van Rhoon. “Theoreticalinvestigation into the feasibility to deposit RF energy centrally in the head and neckregion.” Int. J. Rad. Onc. Biol. Phys. Vol. 63, No. 2, pp. 634-642, 2005.

10 Optimization of frequency and sources for a single antenna ring
Abstract
Purpose: Investigation of the ability to deposit radiofrequency (RF) energy
centrally in the neck as a function of antenna positions, number of antennas
and operating frequency. Materials and methods: Power absorption (PA)
distributions in a realistic model of the head and neck anatomy are calculated,
where the head model is irradiated by an array of dipole antennas. The relative
PA distributions corresponding to different set-ups are visualized and analyzed
using the ratio of the average PA (aPA) in the target and neck region.
Results: Both the PA distributions and aPA ratios indicate an optimal
focussing ability of the set-ups, i.e. the ability to direct energy efficiently
into the target region, between 400 and 600 MHz. In this frequency band the
focussing ability depends only moderately on the size of the neck. Finally
it is found that the focussing ability at 433 MHz is increased significantly
by increasing the number of antenna elements. Conclusions: The optimal
frequency is found to be highly dependent on the size of the target volume; thus
a single optimum is hard to define. However, future clinical research will focus
on 433 MHz based upon the optimal range of frequencies, as found in this study.
2.1 Introduction
Patients with advanced carcinomas in the head and neck (H&N) have a dismalprognosis. Loco-regional control still poses a major therapeutic challenge. For tu-mours considered to be unresectable, the traditional treatment has been conven-tional fractionated radiotherapy (RT) resulting in low 2-year survival rates (30%)for stage III/IV disease57,60. Introducing hyperfractionation and/or accelerated ra-diation treatment schedules have substantially improved the poor treatment out-come19,37,97. Similarly, by combining RT with simultaneous chemotherapy an 8%increase of overall 2-year survival was reported in the three meta-analyzes study ofPignon et al.79. Unfortunately, the improved treatment outcome is at the cost of in-creased toxicity90, in particular of the mucosal linings20, where for older patients thistreatment is even too toxic. Consensus exists that the optimal strategy for treat-ment of advanced unresectable H&N carcinomas remains to be defined and thatthe identification of a combined modality treatment with equal or better treatmentoutcome but with a lower toxicity is of high priority.New strategies currently under investigation, like ARCON, hypoxic cell sensitizersand angiogenesis, focus on killing the radioresistant, hypoxic tumour cell popula-tion7. Some of these approaches have shown improved treatment outcome but havenot gained general acceptance. The unique feature of HT is that it enhances localtumour control but it does not increase radiation toxicity98. From the perspectiveof the focus on the radioresistant hypoxic cell population it is disappointing that

2.1 Introduction 11
the potential of hyperthermia (HT) to greatly enhance the local control (from 24%for RT alone to 69% for RT + HT) and survival rate (from 0% for RT alone to50% for RT + HT) for metastatic lymph nodes in Stage IV carcinoma of the H&Nwithout additional toxicity, as was demonstrated in a phase III study by Valdagniet al.94,95, has not been further explored. In 1997 Amichetti et al.2 showed thatHT also improves treatment outcome when added to a hyperfractionated radiationschedule, but does not increase toxicity.In our opinion a major cause of the loss of interest in the combined treatment ofRT+HT for advanced H&N tumours has been the lack of a good HT system toadequately heat tumours at this location. HT treatment of H&N tumours involvesthe heating of tumour tissue extending from the surface to as deep as the center of theneck, e.g. depths from 0 to 7 cm. From our own clinical experience (unpublished data)we know that in general cervical lymph nodes can be heated relatively easy withelectromagnetic (EM)-energy, but that it is much more difficult to adequately heatthe more deeper located tumours. The latter is confirmed by the experiences of otherHT groups. Serin et al.85 reported adequate ability to heat superficial metastaticcervical lymph nodes using a commercial ultrasound (US) system, though nodalvolume and depth influence the quality of the heating. Wust et al.107 and Ben-Yosef and Kapp6 compared the performance of heating of more deeply located H&Ntumours, e.g. surrounded by bone and air, using EM or US technology. They reportedthat HT applied by US was limited by bone pain and showed inferior temperaturedistributions in comparison to heat applied by single EM applicator systems. Wustet al.107 anticipate that the use of a specific designed HT applicator consisting ofan array of EM antenna elements will result in large improvements in the quality ofheating advanced H&N tumours.Overall, the great potential of combined RT+HT for the treatment of advancedH&N tumours in combination with the significant progress in radiofrequency (RF)applicator technology as well as in EM modeling, is a strong stimulant for us tostart the development of a site-specific EM applicator system for HT treatment ofH&N tumours. In this paper we report on the results of a theoretical study into thefeasibility of such an applicator system where the focus is on the arrangement ofantenna elements and the optimal frequency for heating tumours located in the neckregion. An important criterion for the frequency selection is our demand that theapplicator must have the flexibility to heat both advanced laterally located tumoursand tumours located at the midline of the H&N region. Hence, the power absorption(PA) distribution must be controlled in both the axial and radial direction for whichamplitude and phase steering is essential. Axial PA control requires multiple antennarings whereas control of the radial PA distribution is obtained by placing multipleantennas in a circular array configuration. The ability to obtain a high PA at thecenter of the neck will be the most challenging and difficult problem to solve becausepenetration depth is strongly frequency dependent56. Therefore, in this study, wehave focussed on investigating the dependence of the PA at the center of the neckas the complex function of number of EM-sources in one ring and frequency.

12 Optimization of frequency and sources for a single antenna ring
Target
y (m)
x (m
)
−0.05 0 0.05
−0.05
0
0.05
Total neck
Antenna ring
Target
x (m)
z (m
)
−0.1 −0.05 0 0.05 0.1
−0.05
0
0.05
Figure 2.1: Tissue distribution in the neck and positioning of the antennasaround the neck at cross-sections through (a) z = 0 mm and (b)y = 14 mm. The tissue type index (tti) values correspond with thosein Table 2.1.
2.2 Materials and methods
Investigation of all parameters and their combined effects requires a huge amountof calculations. Therefore, this numerical investigation is split into three series ofcalculations. The first series of calculations addresses the influence of the placementand number of antennas for a rough selection of frequencies using one patient. Theparameter under investigation for the second series of calculations is the operatingfrequency while using the number of antenna elements that offers a good discrimi-nation between the results obtained at these frequencies. A single optimal frequencyis will be hard to find since the absorbed power is to a large extent dependent on thesize of the area that should be treated. Hence, in addition to the frequency investi-gation for a target volume of 5x5x5 cm we also varied the target size in the analysis.Finally, for the last (third) series of calculations, we scaled the patient anatomy ob-taining three set-ups: a small, average (1.24x) and large (1.39x) anatomy, where thediameter of the neck is 9.7, 12 and 13.5 cm, respectively. For these configurations aconstant number of antennas is used (eight) and a constant antenna-tissue distanceis applied. This part is mainly dedicated to the need for a high penetration depthand focuses on frequencies within the frequencyband, as selected from the secondseries of calculations.
2.2.1 Anatomy model
The entire volume is divided into a finite number of volume elements, e.g. voxels, foruse in numerical calculations with a computer program. Assigning tissues to thesevoxels results in a head segmentation.
For the first step of the head segmentation process we used a CT-scan of a H&N RT

2.2 Materials and methods 13
patient consisting of 69 transverse 2-D CT-slices. A 3-D model of the head and neckregion is constructed automatically from these 2-D slices by a dedicated computerprogram. In this model, four different regions of Hounsfield values are defined andlabelled automatically, which leads to a rough head segmentation. Subsequently,organs are assigned manually. For the analysis we introduce a hypothetical targetvolume with realistic content in the model at the central neck location.The head model is truncated at the level of the shoulders and nose and no matchingat the transition to the water is applied because it is assumed that the distance tothe area of interest was sufficient to suppress the influences of reflections. Each voxelmeasures 2.83, 2.83, 2.50 mm in dimension (x, y and z-axis), where the geometricaldimensions of the head model are 234, 424 and 173 mm, respectively. The diameterof the neck of this particular example patient is found to be relatively small73 i.e.9.7 cm. The influence of larger necks is investigated by using two scaled versions ofthis H&N model. Scaling was carried out to obtain H&N models with neck diameterof 12.0 and 13.5 cm, respectively. Note that this scaling implies multiplication of thevoxel sizes with an equal scalar in all Cartesian directions.Figure 2.1 shows transversal and sagittal cross-sections of the tissue distributionin the model, where the tissue coding is according to Table 2.1. The cross-sectionsthrough z = 0 mm and y = 14 mm have been chosen to visualize the results avoid-ing inclusion of the trachea where the PA results will be equal to zero since thetrachea is a non-conducting material. Note that the single dark spots at the edgesof the anatomy represent wet skin (11) and not perfectly electric conducting (PEC)material.
2.2.2 Applicator model
The use of dipole antennas within a clinical environment is common. Consequently,dipoles are used as radiating elements in our study. Calculations are carried outwith one, four, six, eight or 16 dipole antennas embedded in de-ionized water. Equalspacings between the antennas are used since according to Henke et al.35 a sym-metrical array performs best for a symmetrical set-up, which is approximately thecase for the neck region. The operating frequency is chosen from the interval of100 to 915 MHz which includes the entire region indicated for this site41, i.e. be-tween 100 and 750 MHz, and the closest ISM∗ frequencies. The dipole antennas areequally-spaced positioned on a, 170 mm in diameter, circle that surrounds the neck(”Antenna ring”: Figure 2.1). The diameter of the antenna ring is increased for thescaled model in order to keep a constant distance between the antennas and the skinof the patient for all set-ups, i.e. the diameters for these set-ups are 193 and 208mm. The sources are of equal phase and amplitude since this is expected to resultin positive interference in the central region. Phase and amplitude optimization has
∗ISM frequencies: these are frequencies allocated for applications in Industry, Science andMedicine. In most European countries they are: 27.12, 433 and 2450 MHz. In the USA 433 MHzis replaced by 915 MHz.

14 Optimization of frequency and sources for a single antenna ring
Table 2.1: Dielectric properties of the tissue types at 100, 433 and 915 MHz (µr
= 1.0).
Tissue type (index) 100 MHz 433 MHz 915 MHzǫr [-] σ [S/m] ǫr [-] σ [S/m] ǫr [-] σ [S/m]
0. De-ionised water 78 2*10−3 78 0.04 78 0.181. Trachea 10 0.00 1 0.00 1 0.002. Fat 6 0.04 6 0.04 6 0.053. Muscle 66 0.71 57 0.81 55 0.954. BoneCortical 15 0.06 13 0.09 12 0.155. Air bubble 1 0.00 1 0.00 1 0.006. Lung 1 0.00 1 0.00 1 0.007. Tooth 15 0.06 13 0.09 12 0.158. Cartilage 56 0.48 45 0.60 43 0.799. BrainGrey matter 80 0.56 57 0.75 53 0.9510. BrainWhite matter 57 0.32 42 0.45 39 0.6011. SkinWet 66 0.52 46 0.68 46 0.8512. Gland 69 0.80 61 0.89 60 1.0413. PEC 1 1*106 1 1*106 1 1*106
been omitted in the entire study. The length of the dipole antennas (Ldip) is chosensuch that they are resonant or smaller since this provides equal radiation patterns5,i.e. 3.75 cm for low frequencies (f = 433 MHz) and 1.75 cm for higher frequencies(f > 433 MHz) are used. An infinite de-ionized water environment with a relativepermittivity of 78.0 is used as waterbolus since the influences of a waterbolus arenot subject of this study.
2.2.3 Electromagnetic modelling
A finite-difference time-domain (FDTD) based program† 9 is used to calculate thePA distributions. The FDTD algorithm is widely used and described extensively,e.g. by Taflove89. The algorithm calculates the electric (E) and magnetic (H) fieldsin a discrete space and time frame. The PA value in a certain voxel is obtained fromthe electric field components at every point:
PA =σeff | ~E|2
2(Wm−3) (2.1)
where σeff is the effective conductivity (S/m). Note that the PA values differ onlyby the tissue-dependent mass density from the specific absorption rate (SAR) val-ues. As main inputs, the program requires the head model and an applicator model.
†FDTD program developed at TNO-FEL, The Hague, The Netherlands.

2.2 Materials and methods 15
Mur’s second-order absorbing-boundary conditions (ABC)62 are applied to termi-nate the borders of the entire computational domain. A uniform rectilinear mesh isused and additional voxels between the head model and ABC are applied to reducethe influence of reflections at the ABC’s. For high frequencies (f ≥ 433 MHz) thecomputational domain consists of 163, 170 and 89 voxels (= 2.5 million voxels) inthe x, y and z-direction respectively, where the dimensions of a voxel are 2.9, 2.9and 2.5 mm. For low frequencies (f < 433 MHz) the domain is extended with 10voxels in all directions since the penetration depth in water is higher at these fre-quencies. The dielectric properties of the tissues per frequency are found using anapplication of IFAC-CNR69 based on a parametric model by Gabriel et al.26. Asan example the dielectric properties at 100, 433 and 915 MHz are given in Table1, where isotropic tissues are assumed. The dielectric properties of the trachea andlung are chosen equal to those of air since from the results of Gabriel it was notclear whether the entire lung and trachea were considered or just the organ walls.The properties of de-ionized water (salinity = 0.00 g/l, T = 20C) and PEC areassumed to be dispersion-free. The dipoles of the applicator are approximated by socalled ”hard sources”89, i.e. electric-field point sources, that excite two conductingwires (PEC material, Table 2.1) with a cross-section of 2.89 x 2.89 mm2.
2.2.4 Evaluation
The evaluation of the PA distributions is carried out qualitatively by comparingvisualizations of cross-sections trough the PA distribution at z = 0 mm and y =14 mm. The distributions are normalized to the average PA value in the neck re-gion (PAneck volume): PAnorm(x,y,z) = PA(x,y,z)/PAneck volume. Visualization of the PAdistribution by color plots is strongly influenced by the choice of the normalizationmethod. This makes it difficult to evaluate the treatment quality from these visu-alizations alone. As our aim was to assess the ability of a set-up to direct power tothe central target region we selected the average power absorption ratio to quantifythe relative amount of energy that is absorbed in the target region. It is defined as:
aPA ratio =
∑
target volumePA(x,y,z)
Ntarget volume
∑
neck volumePA(x,y,z)
Nneck volume
where Nneck volume and Ntarget volume are the total amount of tissue voxels in the neckand target volume, respectively. This ratio is found to depend little on the size ofthe neck volume but to a large amount on the dimensions of the target volume.The neck volume is defined as the tissue voxels within a 12x12x10 cm brick volume(Figure 2.1). We chose to use a target volume of 5x5x5 cm because the aim is totreat advanced tumours. However, since the aPA ratio is highly dependent on thetarget size, other target volume dimensions are shown as well. The target volumedimensions range from 2x2x2 cm (8 cm3) to 8x8x8 cm (512 cm3) since the aim is on
16 Optimization of frequency and sources for a single antenna ring
treating all from a primary tumour up to a combination of a large primary tumourand/or its lymph node metastases.
2.3 Results
2.3.1 Positioning and optimal number of dipoles in a single
antenna ring
The first series of calculations are carried out using 1, 4, 6, 8 and 16 antennas at 100,433 and 915 MHz. Concerning the positioning of applicator sources it is found thatthe PA distributions are influenced adversely by a region of high PA at the chin,due to the local irregular tissue distribution. Therefore, all set-ups are rotated suchthat the antenna-chin distance is as large as possible to circumvent this problem,e.g. for eight antennas a 22.5 rotation is applied with respect to the 0 position infront of the chin (Figure 2.2a-c).
y (m)
x (m
)
a
−0.1 −0.05 0 0.05 0.1
−0.1
−0.05
0
0.05
0.1
y (m)
b
−0.1 −0.05 0 0.05 0.1y (m)
c
−0.1 −0.05 0 0.05 0.1
PAnorm
0
1
2
3
4
5
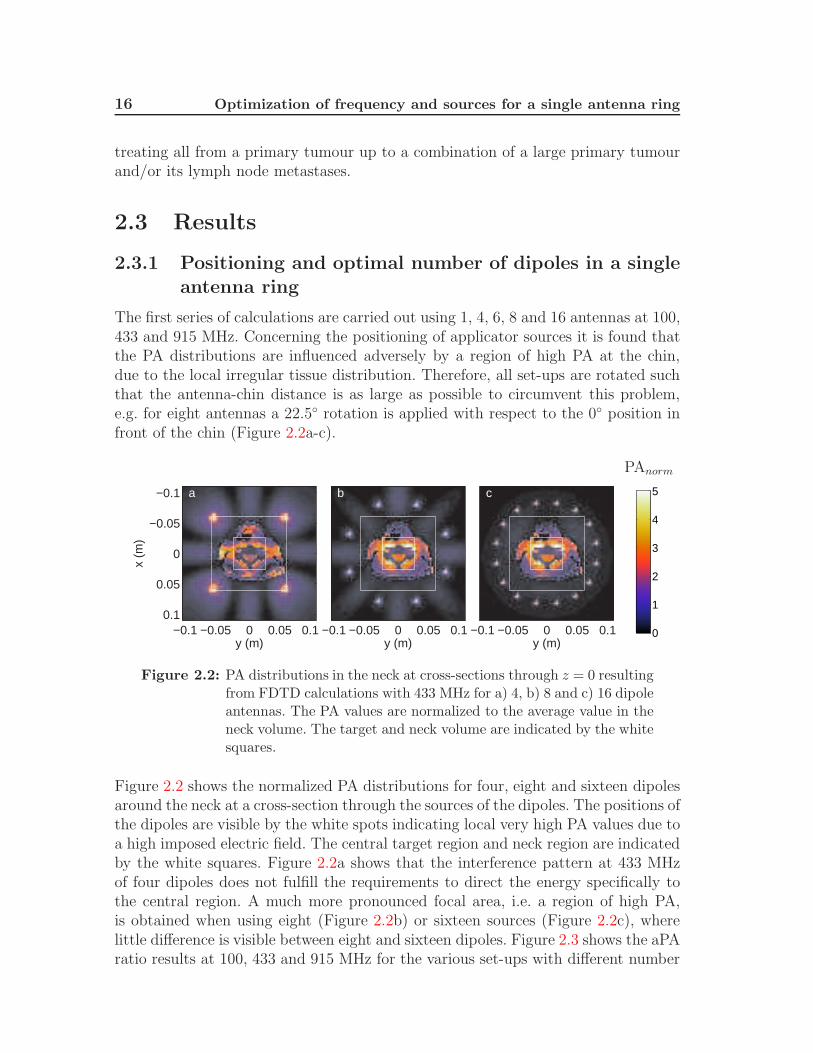
Figure 2.2: PA distributions in the neck at cross-sections through z = 0 resultingfrom FDTD calculations with 433 MHz for a) 4, b) 8 and c) 16 dipoleantennas. The PA values are normalized to the average value in theneck volume. The target and neck volume are indicated by the whitesquares.
Figure 2.2 shows the normalized PA distributions for four, eight and sixteen dipolesaround the neck at a cross-section through the sources of the dipoles. The positions ofthe dipoles are visible by the white spots indicating local very high PA values due toa high imposed electric field. The central target region and neck region are indicatedby the white squares. Figure 2.2a shows that the interference pattern at 433 MHzof four dipoles does not fulfill the requirements to direct the energy specifically tothe central region. A much more pronounced focal area, i.e. a region of high PA,is obtained when using eight (Figure 2.2b) or sixteen sources (Figure 2.2c), wherelittle difference is visible between eight and sixteen dipoles. Figure 2.3 shows the aPAratio results at 100, 433 and 915 MHz for the various set-ups with different number

2.3 Results 17
1 4 6 8 160.2
0.4
0.6
0.8
1
1.2
1.4
1.6
1.8
2
Number of antennas
aver
age
PA
rat
io100MHz433MHz915MHz
Figure 2.3: aPA ratio values as a function of number of sources for 100 MHz,433 MHz and 915 MHz. The target volume is 5x5x5 cm and the neckvolume 12x12x12 cm.
of radiating elements. It is found that the highest aPA ratio values are obtainedusing 433 MHz with sixteen dipoles but the plateau starts roughly at eight dipoles.The curves corresponding to 100 and 433 MHz show a similar behavior. The curvebelonging to 915 MHz, however, shows a decreased aPA ratio for six antennas. Thisis the result of secondary foci (foci other than the central focus) that are presentin the tissue at this frequency. Based on these results we chose to use eight dipolessince this number of antennas provides the best compromise between the constraintto use as few antennas as possible and best performance in terms of aPA ratio.
2.3.2 Optimum operating frequency
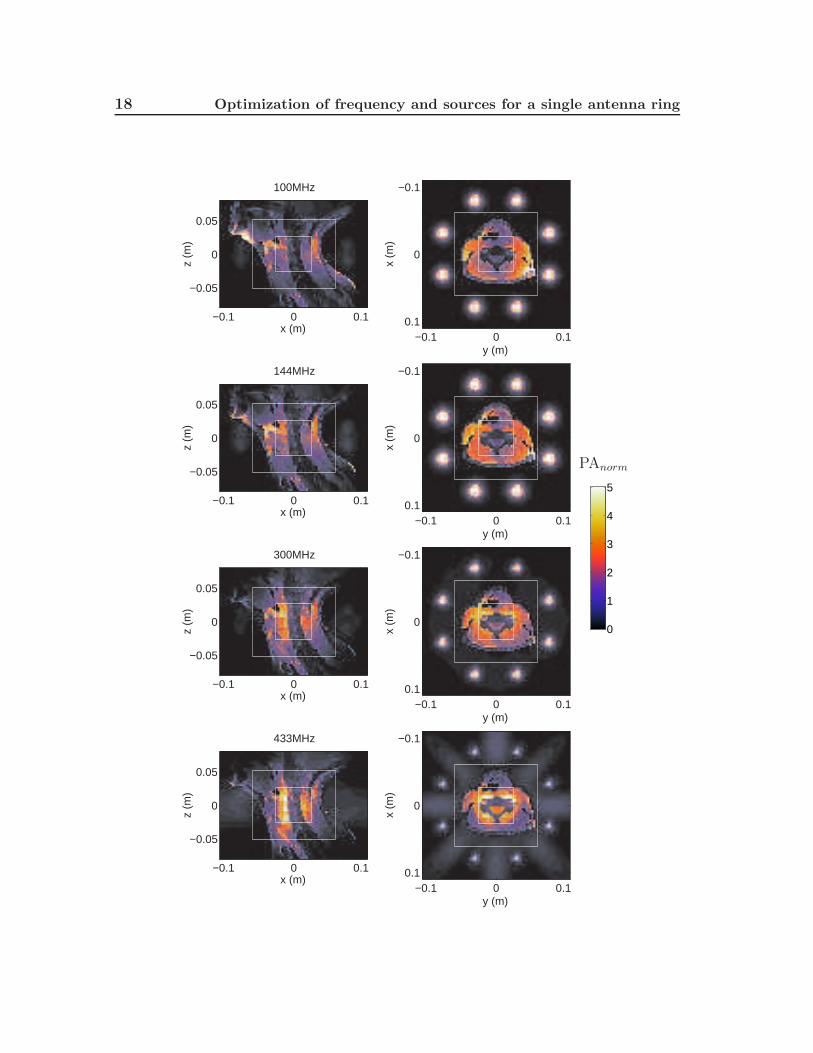
The second series of PA predictions is performed to study the influence of the fre-quency on the ability to heat centrally located target volumes of various sizes. Fig-ure 2.4 shows the PA distributions for all frequencies under consideration usingan eight dipole configuration. It is observed that low frequencies (100 MHz and144 MHz) result in superficial absorption only, whereas the antenna set-up performsinsufficient at high frequencies (700 MHz and 915 MHz) due to secondary in tissue.Multiple foci in the surroundings, besides in the target volume, lead to unwantedhigh superficial PA. Also, the high frequencies lead to high PA values in the sur-
18 Optimization of frequency and sources for a single antenna ring
y (m)
x (m
)
−0.1 0 0.1
−0.1
0
0.1x (m)
z (m
)100MHz
−0.1 0 0.1
−0.05
0
0.05
y (m)
x (m
)
−0.1 0 0.1
−0.1
0
0.1x (m)
z (m
)
144MHz
−0.1 0 0.1
−0.05
0
0.05
y (m)
x (m
)
−0.1 0 0.1
−0.1
0
0.1x (m)
z (m
)
300MHz
−0.1 0 0.1
−0.05
0
0.05
y (m)
x (m
)
−0.1 0 0.1
−0.1
0
0.1x (m)
z (m
)
433MHz
−0.1 0 0.1
−0.05
0
0.05
PAnorm
0
1
2
3
4
5

2.3 Results 19
y (m)
x (m
)
−0.1 0 0.1
−0.1
0
0.1x (m)
z (m
)
550MHz
−0.1 0 0.1
−0.05
0
0.05
y (m)
x (m
)
−0.1 0 0.1
−0.1
0
0.1x (m)
z (m
)
700MHz
−0.1 0 0.1
−0.05
0
0.05
y (m)
x (m
)
−0.1 0 0.1
−0.1
0
0.1x (m)
z (m
)
915MHz
−0.1 0 0.1
−0.05
0
0.05
PAnorm
0
1
2
3
4
5
Figure 2.4: PA distributions in the neck at cross-sections through y = 14 mm(left) and z = 0 mm (right) resulting from FDTD calculations. ThePA values are normalized to the average value in the neck volume.The target and neck volume are indicated by the white squares.
rounding water and consequently to high losses which reduces the efficiency of theapplicator. Unwanted high PA values are visible in the chin region as well, for highand low frequencies, due to a lower central PA intensity. Note that for high frequen-cies smaller dipoles are used and thus the antenna-chin distance is larger, whichimplies that the PA in the chin was expected to be lower. The intermediate frequen-cies result in a centrally positioned focus covering almost the entire target domain.As expected, the bony structures receive little energy due to their low conductivity.

20 Optimization of frequency and sources for a single antenna ring
Figure 2.5 summarizes the PA distributions of Figure 2.4 by displaying the corre-sponding aPA ratio values: as a function of target volume and frequency. It showsthat the antenna set-up performs well in the range of frequencies between 300 MHzand 700 MHz, where the optimum depends on the target size. When we focus to-wards the most likely target volume sizes (4x4x4 cm to 6x6x6 cm), this range ofoptimal frequencies decreases to frequencies between 400 MHz and 600 MHz. Forthe latter frequencies the average PA in the target volume is approximately two-foldthe average PA in the neck volume. Note that higher frequencies perform best forsmall target volumes and lower frequencies perform marginally better for large tar-get volumes. Note further that the sensitivity of the performance of the system as afunction of the frequency is high for small, but low for large target volumes.
144 300 433 550 700 9150.4
0.6
0.8
1
1.2
1.4
1.6
1.8
2
2.2
frequency (MHz)
aver
age
PA
rat
io
2x2x2cm4x4x4cm5x5x5cm6x6x6cm8x8x8cm
Ldip
= 1.75 cm Ldip
= 3.75 cm
Figure 2.5: aPA ratio values calculated with FDTD as a function of frequencyfor different target volume sizes. aPA = 1, i.e. the average PA intarget and neck volume are equal, is indicated.
2.3.3 Influence of the neck dimensions on the frequency
The third and last series of calculations are carried out to investigate the dependenceon the aPA curve of the neck dimensions. Frequencies in the most suitable rangefor this application are used for this investigation, i.e. 300, 433 and 550 MHz. Thedistances between the antennas and the skin are constant for all set-ups.
2.4 Discussion 21
y (m)
x (m
)
a
−0.1 −0.05 0 0.05 0.1
−0.1
−0.05
0
0.05
0.1
y (m)
b
−0.1 −0.05 0 0.05 0.1y (m)
c
−0.1 −0.05 0 0.05 0.1
PAnorm
0
1
2
3
4
5
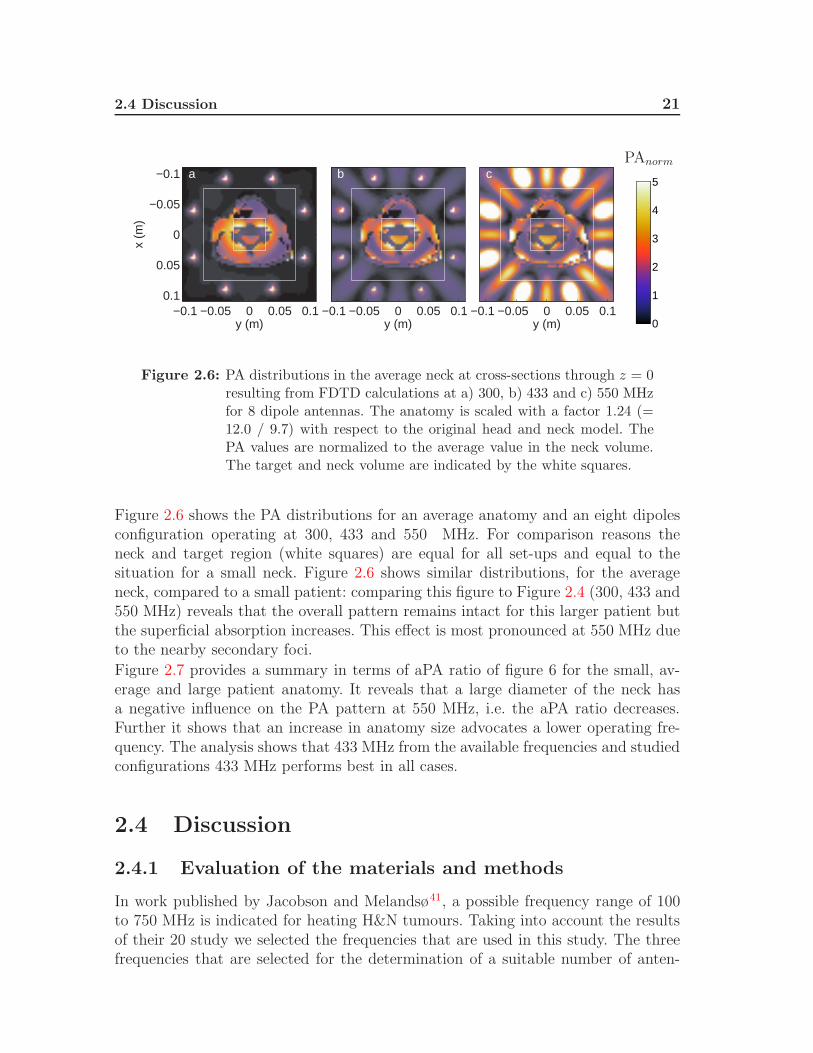
Figure 2.6: PA distributions in the average neck at cross-sections through z = 0resulting from FDTD calculations at a) 300, b) 433 and c) 550 MHzfor 8 dipole antennas. The anatomy is scaled with a factor 1.24 (=12.0 / 9.7) with respect to the original head and neck model. ThePA values are normalized to the average value in the neck volume.The target and neck volume are indicated by the white squares.
Figure 2.6 shows the PA distributions for an average anatomy and an eight dipolesconfiguration operating at 300, 433 and 550 MHz. For comparison reasons theneck and target region (white squares) are equal for all set-ups and equal to thesituation for a small neck. Figure 2.6 shows similar distributions, for the averageneck, compared to a small patient: comparing this figure to Figure 2.4 (300, 433 and550 MHz) reveals that the overall pattern remains intact for this larger patient butthe superficial absorption increases. This effect is most pronounced at 550 MHz dueto the nearby secondary foci.
Figure 2.7 provides a summary in terms of aPA ratio of figure 6 for the small, av-erage and large patient anatomy. It reveals that a large diameter of the neck hasa negative influence on the PA pattern at 550 MHz, i.e. the aPA ratio decreases.Further it shows that an increase in anatomy size advocates a lower operating fre-quency. The analysis shows that 433 MHz from the available frequencies and studiedconfigurations 433 MHz performs best in all cases.
2.4 Discussion
2.4.1 Evaluation of the materials and methods
In work published by Jacobson and Melandsø41, a possible frequency range of 100to 750 MHz is indicated for heating H&N tumours. Taking into account the resultsof their 20 study we selected the frequencies that are used in this study. The threefrequencies that are selected for the determination of a suitable number of anten-

22 Optimization of frequency and sources for a single antenna ring
9.7 12.0 13.5
1
1.1
1.2
1.3
1.4
1.5
1.6
1.7
1.8
1.9
2
aver
age
PA
rat
io
Neck diameter (cm)
300MHz (Ldip=3.75 cm)433MHz (Ldip=3.75 cm)550MHz (Ldip=1.75 cm)
Figure 2.7: aPA ratio values calculated with FDTD as a function of frequencyfor an anatomy with a small, average and large neck diameter. Thetarget region is 5x5x5 cm and the neck volume is 12x12x10 cm,14.8x14.8x12.4 cm and 16.7x16.7x14.0 cm for the small, average andlarge configuration, respectively.
nas, i.e. 100 MHz, 433 MHz and 915 MHz, span the indicated frequency intervaland/or conform to ISM frequencies. For the first two frequencies high-power am-plifiers are available in our department (Erasmus MC - Daniel den Hoed CancerCenter) enabling future verification PA measurements in phantom models.
The first part of this work is the construction of a (truncated) anatomy segmentation.The truncations have little influence on the PA distribution in the neck volumebecause the electric field near the transitions is low; thus little power is reflected atthe boundaries.
To reduce the number of set-ups to be analyzed, only two different dipole heightsare used. The dipoles are resonant (λ/2) or smaller which has a high influence onthe efficiency but a small influence on the radiation pattern5 of the dipole. For thistheoretical study the efficiency is of limited importance since the PA distributionsare compared qualitatively.
When evaluating the obtained predictions we faced the common problem of the in-ability to define the quality of a hyperthermia treatment70. From a biological pointof view the focus is on thermal dose relationship14,17 . Such an approach is well vali-dated in a clinical environment although it provides only retrospective information.

2.4 Discussion 23
For applicator development, the main source of information are data from predictedspecific absorption rate (SAR), or PA, distributions (where the PA and SAR valuesare related through the mass density). As a result, a strong need exists for an ob-jective criterion to express the quality of the SAR distribution. The Effective FieldSize (EFS‡) and penetration depth as defined within the ESHO quality guidelines32
provide a general solution for single applicators and SAR distributions in ’semi’ ho-mogenous, e.g. layered, phantoms. Other parameters, like the areas enclosed by the25%, 75% iso-SAR contour and their ratio EFS75%/EFS25%28,80 have been sug-gested for superficial hyperthermia. Here again, they are intended for use in simplephantom configurations. In the development of loco-regional (deep) hyperthermiatechniques, application of EM-modelling has a longer history and various evaluationprocedures have been used38,77. As a global indicator the ratio of the SAR50% in thetumour to SAR50% in the total volume is frequently used107. The aPA ratio followsan approach similar to that of Paulsen et al.77. It differs from the index defined byWust et al.107 in the sense that the quotient of power absorption in the target regionand the neck is used, thus the influence of a normalization procedure is excluded.The aPA ratio is strongly dependent on the size of the target volume and thus thechoice of its dimensions is of high importance. The size of the target region is chosento vary from 2x2x2 cm to 8x8x8 cm, where the focus is on sizes between 4x4x4 cmand 6x6x6 cm since the aim is to heat advanced tumours together with lymph nodemetastases.
In this study, to speed up the analysis, we omitted SAR pattern optimization. Be-cause the set-up under study is fairly symmetrical, we assumed that optimization ofthe amplitudes and phases would only minimally alter the SAR patterns. Further,we have focussed on the global PA pattern and therefore we have not performed acomparison of the set-ups in terms of (the avoidance of) hotspots in normal tissue.Therefore, we expect that the conclusions will hold when analyzing optimized SARpatterns.
2.4.2 Discussion of the results
For the positioning of the sources, we found that antenna positions close to thechin region should be avoided in order to decrease the influence of the limitinghotspot in the chin region. The optimal amount of antennas of the investigatedset-ups is sixteen, where six and eight antennas are found to be highly suitableas well. The good performance with eight antennas as found in this study is inagreement with Jouvie et al.45. They found that a set-up comprising eight dipolesat 433 MHz for H&N HT is approximately optimal; their approach though was by useof 2D calculations. The number of antennas, however, should be increased when thefrequency is increased, for an optimal SAR distribution77. More antennas, though,result in a higher complexity. For the clinical practice, a system with low complexity
‡EFS: the area enclosed by the 50% iso-SAR contour.

24 Optimization of frequency and sources for a single antenna ring
is preferable and therefore a low amount of antennas is desired. For the frequencyinvestigation we selected eight antennas since this provides a close to optimal resultand is a clinically acceptable amount of elements.For a set-up of eight antenna elements, it is found that low frequencies (100 MHz and144 MHz) result in superficial absorbtion only (Figure 2.4). This seems very counterintuitive as lower frequencies generally correspond to higher penetration depths. Atthese frequencies for our set-up, a difficult complex interaction occurs between tissueand antennas. From the current results we anticipate that the interference patternsuffers from an insufficient distance between the antennas and the center of theanatomy. A small distance in terms of effective wavelength in the media may flattenthe maximum and increases patient load influences.The optimal frequency is amongst others dependent on the number and locationof the sources and the target size. Hence, it is difficult to select a single optimalfrequency. For target sizes between 4x4x4 cm and 6x6x6 cm optimal frequenciesin the range of 400-600 MHz are found. For two out of three target sizes the bestperformance is obtained at 433 MHz where for the smallest target size at 550 MHzthe best performance is achieved by use of the eight antenna set-up. For larger targetsizes the optimal frequency range shifts to somewhat lower frequencies, i.e. between300 MHz and 433 MHz.This investigation was carried out using a 9.7 cm in diameter neck and scaled versionswith neck diameters of 12 and 13.5 cm. The calculations at 300, 433 and 550 MHzindicate the best performance at 433 MHz for all realistic neck dimensions. It shouldbe noted that usually a small neck contains more muscle in comparison to a large(in diameter) neck. A higher percentage of muscle results in a lower penetrationdepth thus reducing the interference at depth. Therefore a more pronounced focusis anticipated for a large neck with a high fat percentage. Jacobson and Melandsø41
and Gross et al.29 previously investigated the possibility to heat H&N tumours.Jacobson and Melandsø predicted and measured a central focus in a cylindrical,muscle equivalent, phantom with four spiral antennas radiating with equal phasesat 488 MHz. In the study of Gross et al., four in-phase dielectric loaded circularhorn antennas are used to illuminate a muscle phantom. They measured a betterfocus at 400 MHz compared to 915 MHz in case of a phantom with a diameter of 11cm. The data as presented in this publication narrows down the range of interestingfrequencies indicated by Jacobson and Melandsø but presents a confirmation by 3DFDTD calculations of the measurements by Gross et al..The influence of using multiple antenna rings is investigated by both Seebass et al.83
and Paulsen et al.77 who found an optimal frequency of approximately 150 MHz fortheir deep hyperthermia systems consisting of three (Seebass et al.) or four (Paulsenet al.) rings of antennas. Both studies differ from the present study in the fact thatthe aim is to heat tumours in the pelvic region where the average diameter of thebody is approximately three times larger. Converting the optimal frequency for deephyperthermia (150 MHz) to our set-up, taking into account the different requiredpenetration depths and assuming a cylindrical approximation in both cases, would
2.5 Conclusion 25
result in an optimal frequency around 450 MHz. This provides some support ofan optimum frequency in the range of 400 to 600 MHz for heating head and necktumours when using multiple antenna rings.
2.5 Conclusion
In this study, we investigated the ability of a multi-element, single antenna ring,H&N HT applicator to deposit RF energy selectively in the center of the neck, whilesparing the normal tissue in the neck. It provides a quantitative confirmation of ourintuitive applicator design.It has been found that positioning antennas closely to the chin should be avoided.Further, eight antenna elements is shown to be a suitable number of antennas forfrequencies in the investigated frequency band for a set-up of one concentric ring ofequally spaced antennas. The optimum frequencies are shown to be in the frequencyband between 400 and 600 MHz for the investigated target sizes. This frequencyband shifts downwards for larger target volumes.From the findings of this study and the fact that 433 MHz is an ISM frequency atwhich high power amplifiers are available in our clinic we feel it is highly justifiedto continue our investigations at 433 MHz. The actual number of antennas and useof multiple rings of antennas are subject of further research, where an optimum isexpected around six to eight antennas per ring.
Acknowledgements
This work was financially supported by the Dutch Cancer Society, grant: DDHK2003-2855. The authors further would like to thank J. Mooibroek for his contribu-tions.

26 Optimization of frequency and sources for a single antenna ring

CHAPTER 3
Local SAR distortion by major anatomical structures
This chapter is based on:M.M. Paulides, D.H.M. Wielheesen, J. Van der Zee, G.C. Van Rhoon. “Assessmentof the local SAR distortion by major anatomical structures in a cylindrical neckphantom.” Int. J. Hyperthermia 2005; 21: 125-140.
28 Local SAR distortion by major anatomical structures
Abstract
The objective of this work is to investigate the distortions on the local SAR
distribution by various major anatomical structures in the neck. High resolu-
tion 3D FDTD calculations based on a variable grid are made for a semi-3D
generic phantom based on average dimensions obtained from CT-derived
human data and in which simplified structures representing trachea, cartilage,
spine and spinal cord are inserted. In addition, phantoms with dimensions
equal to maximum and minimum values within the CT-derived data are also
studied. In all cases, the phantoms are exposed to a circular coherent array
of eight dipoles within a water bolus and driven at 433 MHz. Comparisons
of the SAR distributions due to individual structures or a combination of
structures are made relative to a cylindrical phantom with muscle properties.
The calculations predict a centrally located region of high SAR within all
neck phantoms. This focal region, expressed as contours at either 50% or
75% of the peak SAR, changes from a circular cross-section in the case of
the muscle phantom to a donut shaped region when the anatomical structures
when the anatomical structures are present. The presence of the spine causes
the greatest change in the SAR distribution, followed closely by the trachea.
Global changes in the mean SAR relative to the uniform phantom are < 11%
whilst local changes are as high as 2.7-fold. There is little difference in the
focal dimensions between the average and smallest phantoms but a decrease
in the focal region is seen in the case of the largest phantom. This study
presents a first step towards understanding of the complex influences of the
various parameters on the SAR pattern which will facilitate the design of a
site-specific head and neck hyperthermia applicator.
3.1 Introduction
Patients with advanced carcinomas in the head and neck (H&N) have a dismalprognosis and loco-regional control for this site still poses a major therapeutic chal-lenge. Combining radiotherapy (RT) with simultaneous chemotherapy improves thetreatment outcome but at the cost of increased toxicity. Triggered by the phase IIItrial of Valdagni et al.94,95, we started the exploration of hyperthermia (HT) ap-plied to the head and neck region. Valdagni demonstrated that with a non-specificHT-applicator already a significant increase in local control (from 24% for RT aloneversus 69% for RT plus HT) is achieved for metastatic lymph nodes in Stage IVcarcinoma of the H&N, without additional toxicity. However, for an optimal HTtreatment of the primary tumour and metastatic lymph nodes a specific H&N HTapplicator is warranted. In our opinion such a site-specific designed, multi-element,applicator would also enable a substantial improved control of the specific absorp-

3.1 Introduction 29
tion rate (SAR) deposition pattern and is expected to result in a higher quality ofthe HT-treatment (Wust et al.107).The head and neck region is characterized by many tissue transitions, small struc-tures and large cooling vessels. Applying an adequate thermal dose to the head andneck region therefore is a challenging task. In the clinical set-up the thermal dose isdetermined by a huge amount of parameters with separate and combined influences.From a designers point of view the aim is to approach the problem by simplifica-tion of the problem since 1) this increases the development progress, 2) provides abetter understanding of separate parameter influences, 3) enables verification mea-surements and 4) links with quality assurance set-ups. As a first step we start thisSAR-based investigation with the most simple set-up: an array of eight dipole anten-nas radiating a centrally positioned muscle equivalent cylinder representing a firstapproximation of the neck. This simple set-up forms the reference configuration fromwhich the problem is extended to a more and more realistic neck anatomy. The in-fluence on the SAR pattern of various parameters can now be regarded distortionson the local SAR pattern with respect to the reference configuration.The causes of the perturbations on the SAR distribution in the region of interest areclustered in three groups: 1) anatomy, 2) antenna array and 3) waterbolus relateddistortions. These parameters can be investigated independently, allowing a betterunderstanding of their - sometimes opposing - effects. In this publication we dedicateour attention to the anatomy related effects, thus a fixed applicator and waterbolusdesign are chosen, i.e. an array of dipole antennas embedded in an infinite waterspace. The SAR distribution in the neck is, to a large amount, dictated by the tissuedistribution in the H&N region and it is our expectation that a thorough explorationof the anatomy-based distortions will pay off in the applicator design. Exploringall different anatomy-related influences is a vast task and therefore a distinctionis made between 2D and 3D anatomical shape-related SAR perturbations. In thiswork we focus on 2D related effects, while the 3D related distortions are subject offurther research. With 2D related distortions we refer to the influences on the SARpattern caused by differences in tissue in the radial direction, however the assessmentis carried out with a 3D FDTD calculation. The investigation is carried out byplacing inserts representing major anatomical structures in the muscle cylinder. Thedistortions on the SAR pattern caused by these major structures are subsequentlyaddressed by comparison of their respective SAR distribution with the SAR patternin the muscle cylinder.This investigation is carried out at 433 MHz since it is found to be within the rangeof promising frequency candidates for a head and neck applicator41 and equipmentfor latter verification measurements at this frequency is available at our clinic. Theconfigurations are chosen such that at 433 MHz in a water environment (ǫr = 78)the cylindrical phantoms are located in the far-field region of the antenna array.Combined with a contrast-type SAR pattern distortion evaluation parameter, i.e.Relative Differences (RD’s), yields an investigation that is only very limitedly de-pendent on the radiation patterns of the antennas.

30 Local SAR distortion by major anatomical structures
Table 3.1: Relative permittivity, effective conductivity and mass density for theselected neck structures and the surrounding water at 433 MHz.
Structure ǫr σeff (S/m) ρ (kg/m3)
Muscle 57 0.80 1050Trachea (air) 1 0.00 1Cartilage∗ 45 0.60 1100Spine (Bone, cortical) 13 0.09 1595Spinal cord (Brain, white matter) 42 0.45 1050
De-ionised water (0.00 g/l NaCl, T = 20oC) 78 0.04 998
∗ no discrimination is made between dry and wet cartilage
3.2 Materials and methods
3.2.1 Creation of the average neck phantom
A homogeneous muscle cylinder is used to model the anatomy as a starting point.From this base situation the set-up is extended towards a more realistic neck anatomyby inclusion of inserts representing major structures, e.g. trachea and spine. Theshapes of the structures in the neck vary strongly in the radial direction and onlyto a lesser extent in the axial direction. Therefore the shape of these structures isapproximated by elementary shapes (Figure 3.1). Extruding these shapes results insemi-3D approximations of the original structures. The dimensions of the shapesare defined using Computerized Tomography (CT)-scans from which the minimum,average and maximum dimensions and locations of the major neck structures areextracted. The neck in this case is defined as the elliptically shaped area betweenthe widening curvatures towards the head and towards the shoulders.
In this parameter study we focus on structures with an expected large influence onthe SAR pattern. The selection criteria for inclusion in the model of an anatomicalstructure are: 1) existence in the neck in the axial plane (from collar bone up to theoropharynx), 2) amount of dielectric contrast with neighbouring tissue (muscle), 3)size of its transverse cross-section, 4) amount of perfusion. It is expected that theamount of perfusion is an issue mainly in areas consisting of cartilage. The SARin these areas probably will not appear to be dramatic but might, due to the poorperfusion, cause limiting hotspots, i.e. burns. Table 3.1 shows the list of structuresthat are selected using these criteria. The ”cartilage” is the cartilage of the trachea.The skin and oesophagus are not included in the considerations due to their smalltransverse cross-sections and low dielectric contrast with respect to the neighbouringmuscle tissue. No fat is selected since in these patients only a small amount of fattytissue is present, which is overshadowed by the large muscles that it surrounds. Theinfluence of a small layer of subcutaneous fat is assessed as a side step.

3.2 Materials and methods 31
Determination of the elementary shapes
The selected structures (Table 3.1) are fitted by elementary shapes (Figure 3.1b).The dimensions of these shapes are extracted from CT scans of eight patients froma representative patient group, i.e. H&N patients at our radiotherapy departmentwith tumours at various sites (hypopharynx, parotic gland (3x), larynx, oropharynxand nasopharynx (2x)).The dimension extraction is carried out by calculation of the mean of the HounsfieldUnit (HU) distribution, i.e. averaging the HU’s in the CT scans of the 4th downto the 6th cervical vertebra for every patient (14 - 19 slices). An example averageHU distribution is shown in Figure 3.1a. Markers are positioned in this averageHU distribution at every extent of a structure and subsequently the dimensions ofthe structures are calculated using their respective locations. For example, a circleis described by four markers defining two radii (in the x and y-direction). Thesemarkers are then used to calculate the smallest, average and largest value of eachdimension (Figure 3.1b), which are presented in Table 3.2. These dimensions arecalculated such that they are symmetrical with respect to the sagittal plane (x = 0).
a) Average HU distribution
dNec
k dTra
chdS
pCrd
thCricCart
OT
rach
OSp
ine
h1,S
pine
w1,Spine
w2,Spine
h2,S
pine
b) Rounded elementary-shape fit
Figure 3.1: a) Example average (4th ↔ 6th neck vertebra) HU distribution ofone patient and b) the rounded elementary-shape fit with 2D shapes(average dimensions of multiple patients). The dimensions of theshapes correspond to those of tabel 3.2 and the distance betweenthe mesh lines is 5 mm. Note that the lower part of the spine seemsto have a larger width in b) compared to a) which is the result of(i) the different shapes of the vertebra’s and (ii) our focus on thecentral vertebra, which sometimes consists of two peaks.
The most difficult tissue type to assign is the cartilage surrounding the trachea,due to its low HU contrast with surrounding muscle. Therefore, for guidance ofpositioning the markers of the trachea surrounding cartilage, an anatomy book isused61.

32 Local SAR distortion by major anatomical structures
Table 3.2: Smallest, average and largest dimensions (mm) of the selected neckstructures and the rounding radius per geometry. The abbrevia-tions refer to a d(iameter), th(ickness), O(ff-set), h(eight), w(idth)or r(adius). The off-sets are shifts, with respect to the origin, in they-direction.
Dimension Smallest Average Largest
dNeck 97 120 135dTrach 19 25 29OTrach 28 36 41thCart 5 8 9dSpCrd 27 31 34OSpCrd 0 0 0w1,Spine 48 52 58w2,Spine 19 25 29h1,Spine 25 37 51h2,Spine 8 10 12OSpine 2 2 2
rrounding 4 5 6
The elementary shapes are subsequently extruded using the solid modelling kernelof SEMCAD84 to become a 250 mm high cylindrical shape: the ”solid model”. Thissolid model is rounded, using rounding radius rrounding, to avoid local hotspots dueto a sharp model. This rounding is applied because the aim is to study macroscopicinfluences of anatomical structures and not hotspots due to patient specific sharpedged structures. Further, applying the rounding increases the visual resemblancebetween the model and the average HU distributions. The neck model is chosensufficiently high to avoid influences, in the plane of interest, of the upper and lowertransitions (tissue ↔ water). A cross-section of the average solid model is shownin Figure 3.1b. Similar set-ups are conducted using the smallest and largest founddimensions (Table 3.2) forming the ”smallest” and ”largest” cylindrical neck phan-toms.
Creation of a semi-3D neck anatomy for contour verifications
A semi-3D neck anatomy is created to be able to investigate the difference in SARdistribution of an approximation of the neck by 1) a cylindrical neck shape withelementary shaped inserts versus 2) a neck with actual contours. This latter anatomyis constructed from a single slice, at the height of the 5th cervical vertebra, of asingle patient. The patient with neck dimensions close to average (Table 3.2) isselected. Note that this does not mean that every dimension of the patients neck

3.2 Materials and methods 33
structures is average. The contours of the neck structures are found by applying aHU-based threshold contour fit procedure. These contours are subsequently extrudedto form a semi-3D neck anatomy, where the same structures are selected as for theaverage neck phantom (Table 3.1). There was little difference in HU value betweencartilage and the surrounding muscle, so only a small piece of (probably ossified)cartilage could be selected. It is noted that simulations, with assigning bone andsubsequent cartilage to this small piece, have confirmed that its influence is negligible(in the z = 0 cm plane) so the small piece of cartilage was excluded for furthercalculations.
3.2.2 Applicator model
The applicator is modelled by, a close to optimum number of45, eight dipole anten-nae, radiating at 433 MHz, that are positioned at equal distances on an imaginaryring surrounding the neck (Figure 3.2a). The dipoles are embedded in an infinitewater space because we anticipate the use of a waterbolus. However, the disturbinginfluences of the waterbolus on the SAR pattern are outside the scope of this study.The diameter of the applicator ring is chosen such that it can enclose a large maleneck (diameter = 16 cm) with a sufficient overlap (> λ/2 = 4 cm) at all sides, i.e.the diameter of the antenna ring is chosen to be 25 cm. Halve-wave dipoles, resonantat 433 MHz, are utilized in the antenna ring. In practice, a somewhat smaller heightthan λ/2 must be used for the dipoles to account for their, non-infinitely small (0.25cm), diameter5: the height of the dipoles is 3.25 cm. The radiation pattern of theantennas is not influenced by the phantom because the phantom is located in thefar field (∼ 4 cm5). Therefore, the choice of applicator antennas, and thus theirradiation pattern, is in fact of limited importance since a contrast type of evaluationis used.
3.2.3 FDTD modelling
For the calculations of the electromagnetic field and SAR distribution we utilizedSEMCAD84: a Finite Difference Time Domain (FDTD)89 algorithm. For the FDTDalgorithm, the entire computational domain must be divided in voxels, i.e. smallbrick shaped elements. The computational domain is truncated using Highdon’s2nd order boundary conditions89 and steady state is assumed after 10 periods ( 5%difference from the peak value). The solid model of the applicator and tissue areused to assign a label to each voxel, in this way describing the set-up in voxels.Every label is assigned certain dielectric properties. The dielectric properties of thestructures in the neck are found using an application of IFAC-CNR69 based on aparametric model by Gabriel et al.26 (Table 3.1).The dielectric properties of the trachea are chosen equal to those of air. The prop-erties of the de-ionized water (salinity = 0.00 g/l, T = 20C) in the waterbolus arefound in both a publication of Stogryn88 and of the ESHO taskgroup comittee11.

34 Local SAR distortion by major anatomical structures
The properties of a voxel in the x, y and z-direction are identical, so an isotropictissue distribution is obtained.SEMCAD provides the possibility of a global grid refinement: the grid lines do nothave to be spaced homogeneously. This enables the modelling of fine structureswhereas the computational effort is only gradually higher. In literature a maximumof the grid stepping between λ/1589 and λ/20 is indicated for sufficient accuracyfor a variable grid. This is most critical in regions with high permittivities, whichin this case means in the water environment. For this research the maximum gridstep, far from the region of interest, is 5 mm thus the grid steps remains smallerthan λ/15: ∆max < λ/15. For the main investigation set-up and the set-up to verifythe contour influences the respective grid steps are given below.
Neck phantoms (smallest, average and large) The region of interest, i.e. theneck slice between the antenna elements, of the cylindrical neck phantom ismodelled with grid steps of 1 mm in the x and y-direction (see Figure 3.2b),however at the antennas a local refinement is applied. The grid steps in tissuein the z-direction vary from 0.5 to 5 mm, but the maximum grid step in theregion of interest is 2 mm.
Semi-3D neck anatomy In the z-direction the grid steps vary from 0.5 to 5 mmbut the grid steps are 2.5 mm in the x and y-direction since we only aim tocompare global SAR patterns using this geometry.
The source of the dipole antennas is modelled with a hard source89 at 433 MHz,i.e. no feeding circuits are modelled. It is positioned at the 2.5 mm gap between thetwo conducting (σ = ∞) poles. The modelling of the antenna is carried out withspace steps down to 0.5 mm which provides accurate results as presented by Hertelet al.36.
3.2.4 Evaluation
The evaluation of the SAR distributions is carried out using data of the plane atz = 0 cm through the phantom, i.e. SAR(x, y, z=0 cm), since the main influencesfor the neck phantoms are in the 2D plane. A contrast-type formulation is definedto be able to separately investigate the influences of the geometry thus subtractingthe influences of the antenna array. The Relative Difference (RD) function is definedas:
RD(x, y) =SARguc(x, y) − SARref(x, y)
SARref(x, y)· 100%, (3.1)
where SARref(x, y) is the SAR value in the reference situation, i.e. the homogeneousmuscle cylinder, and SARguc(x, y) is the SAR value in the geometry under consid-eration (guc). This RD quantifies the positive or negative influence of the anatomy

3.2 Materials and methods 35
a) Antenna set-up b) Average neck model
Figure 3.2: Visualization of a) the antenna set-up surrounding the 3D solidmodel of the average neck phantom, and b) a cross-section at z =0 cm through the FDTD implementation of the average neck phan-tom, with an overlay of the grid lines. For clarity, the surroundinginfinite water space is not visualized in both figures.
on the SAR distribution, i.e. the increase or decrease of the SAR by the anatomy.The minimum, mean, maximum and the standard deviation values of the RD serveas evaluation parameters:
RDmin = minRD(x, y), (3.2)
RD =
∑
N w(x, y)RD(x, y)∑
N w(x, y), w(x, y) = ∆x(x, y)∆y(x, y) (3.3)
σ =
√
1
N − 1
∑
N
(RD(x, y) − RD)2 (3.4)
RDmax = maxRD(x, y), (3.5)
of the distribution of the relative differences. N is the total amount of voxels in theregion under consideration and ∆x and ∆y are the voxel sizes of every voxel in twodirections. For calculation of the mean values the weighting with w(x, y) is appliedto account for the variable grid. The importance of this weighting is small since thegrid step differs only at the locations of the antennas, where refinement of the gridis applied. RDmin and RDmax are used to quantify the local SAR influences whereasRD and σ are used to quantify the global SAR (shape) distortion.
The area enclosed by the 50% and 75% iso-SAR contours are investigated to compareinter-geometry results quantitatively in terms of the change in focus size, i.e. thecentral region of high SAR values.

36 Local SAR distortion by major anatomical structures
3.3 Results
3.3.1 Influences per structure
First, a full analysis is carried out on the average geometry with all inserts. Thisclarifies the way in which all set-ups are evaluated. Each evaluation is a comparisonwith respect to a muscle cylinder with an identical radius. For clarity of the figuresthe outer tissue SAR values are not shown unless indicated otherwise.
Figure 3.3: a) normalized SAR pattern of the muscle cylinder, b) normalizedSAR pattern of the total neck anatomy, c) their RD pattern and d)RD profile at x = 0 cm are visualized for the average anatomy set-upat z = 0 cm. The 50% and 75% iso-SAR contours are indicated ina) and b), and in c) the RD = 0% contours are visualized (-.-).
Figure 3.3a and 3.3b show the SAR distribution in the average muscle cylinder andaverage total neck anatomy at a cross-section through z = 0 cm. The SAR pat-terns differ mainly centrally and superficially at and near the trachea. For the totalneck anatomy the SAR values are zero at the trachea due to the zero conductiv-

3.3 Results 37
ity. Further, a low conductivity at the spine results in low SAR values. The centralhotspot in the muscle cylinder is de-focussed due to reflections at the muscle-bonetransition but it remains centrally located. The high SAR values at the locationof the spinal cord are lowered due to the anatomical properties. Figure 3.3c and3.3d visualize the RD distribution and the RD profile at x = 0 cm respectively.These images show that the anatomy has a positive influence on the SAR aroundthe spine (RD ∼ 80%) and a negative influence at the spine (RD ∼ −80%) andtrachea (RD = −100%). Regions with a negative RD value (∼ −25%) can also befound approximately 1 cm underneath the ”skin”. The cross-section at x = 0 cmis visualized to show the effect of the conductivity transitions, i.e. all the sharp edges.
Figure 3.4 shows the SAR distribution in the average muscle cylinder and the averagemuscle cylinder with various clusters of inserts. This figure shows that the highsuperficial SAR values near the trachea, induced by the insertion of trachea andsurrounding cartilage, are reduced by the subsequent insertion of the spine and spinalcord. As a consequence the negative RD values near the trachea in Figure 3.4e arenot present in Figure 3.4f and Figure 3.4g. The figure also shows that the globalSAR pattern is determined mainly by the cluster containing spine and spinal cord(see SAR and RD distributions).
Table 3.3: RDmin : RD ± σ : RDmax values (%) per geometry for set-ups withsmallest, average and largest dimensions (dNeck is 9.7, 12 or 13.5 cmrespectively).
Geometry Smallest Average Largest
Musc+cart -31: 0±6 : 5 -33 : -1 ± 6 : 7 -27 : 5 ± 7 : 16Musc+trach -100:-1±23: 44 -100 : -2 ± 23 : 36 -100 : -2 ± 26 : 45Musc+cart+trach -100:-2±23: 38 -100 : -3 ± 24 : 36 -100 : -2 ± 27 : 50Musc+sp.crd -42: 0±10: 18 -42 : 0 ± 10 : 24 -42 : 0 ± 10 : 29Musc+sp -92:11±61: 124 -92 : 2 ± 58 : 157 -92 : 1 ± 61 : 190Musc+sp.crd+sp -91:11±70: 149 -91 : 4 ± 69 : 200 -92 : 3 ± 71 : 242Total neck -100:11±81: 172 -100 : 2 ± 75 : 224 -100 : -1 ± 76 : 274
Table 3.3 and Table 3.4 are given to quantitatively analyse the RD and SAR pat-terns. In this section we only refer to the values belonging to the average set-ups. InTable 3.3, the RDmin, RD, σ and RDmax values per geometry are given. From thistable, for the average geometry, it can be concluded that the largest local influenceis a result from the trachea (low RDmin). The largest global distortion is due to the

38 Local SAR distortion by major anatomical structures
cartilage+
trachea
spine+
spinal cordtotal neck
Figure 3.4: The normalized SAR and RD patterns at cross sections throughthe neck phantom at z = 0 are visualized for the muscle cylinder(top), the muscle cylinder with trachea and cartilage insert (left),the muscle cylinder with spine and spinal cord insert (center) andthe total neck anatomy set-up (right) for the average set-up (dNeck
= 12 cm). The 50% and 75% iso-SAR contours are indicated in theSAR distributions and the zero RD contours are indicated in the RDdistribution (-.-).

3.3 Results 39
Table 3.4: The areas (cm2) enclosed by centrally located 50% and 75% iso-SARcontours per geometry for set-ups with smallest, average and largestdimensions (dNeck is 9.7, 12 or 13.5 cm respectively).
Smallest Average LargestGeometry SAR50% : SAR75% SAR50% : SAR75% SAR50% : SAR75%
Musc 9.6 : 4.0 9.6 : 4.0 5.2 : 0.0Musc+cart 9.6 : 4.1 9.8 : 4.1 5.2 : 0.0Musc+trach 9.7 : 4.1 9.7 : 4.1 4.4 : 0.0Musc+cart+trach 9.8 : 4.0 9.8 : 4.1 3.6 : 0.0Musc+sp.crd 8.9 : 2.5 8.3 : 2.4 3.6 : 0.3Musc+sp 10.5 : 4.4 11.0 : 4.7 6.1 : 0.0Musc+sp.crd+sp 14.0 : 3.7 13.4 : 3.8 4.2 : 0.0Total neck 14.2 : 4.0 14.2 : 3.5 2.8 : 0.0
inclusion of the spine (high σ). The spinal cord and cartilage cause relatively littledistortion.
Table 3.4 provides the areas enclosed by the centrally located 50% and 75% iso-SARcontours per geometry. This table indicates an increased 50% SAR area for the set-ups with inserts, however the area within the 75% iso-SAR contour in some casesslightly decreases (because the normalization point increases). The latter effect isdue to the more irregular tissue distribution at the location of the high SAR values,which disturbs the Gaussian shape of the focus.
3.3.2 Influences of structure dimensions
Figure 3.5 visualizes the SAR in the muscle cylinder and total neck set-up and thecorresponding RD distribution for the set-ups with the smallest, average and largestdimensions. It shows that the structure dimensions have a low impact on the shapeof the central hotspot other than the local structure dimensions. The central SARhowever is highly dependent on the radius of the neck, the superficial hotspots evenoverrule the central hotspot for the largest dimensions set-up. This is mainly due tolarger path lengths in the tissue from the antennas to the center of the phantom.
Table 3.3 shows the RDmin, RD, σ and RDmax values per geometry for set-ups withsmallest, average and largest dimensions. From this table it is concluded that for allset-ups the trachea has the largest local SAR decreasing effect (RDmin = −100%)but its global effect is moderate (σ ∼ 23%). The global influence of the spine is highfor all set-ups: σspine ∼ 60%. For the smallest dimensions set-up it is found thatRD ∼ 10% which can be explained by the relatively large area of increased SARvalues as a result of the inclusion of the spine (see also Figure 3.5). The analysespresented until now are all carried out by investigating RD’s calculated locally. The

40 Local SAR distortion by major anatomical structures
Smallest(dNeck = 9.7 cm)
Average(dNeck = 12 cm)
Largest(dNeck = 13.5 cm)
Figure 3.5: The SAR patterns at cross sections through the neck phantom atz = 0 cm are visualized for the muscle cylinder (SARref ), the totalneck set-up (SARguc) and their RD distribution for smallest, averageand largest dimensions. The 50% and 75% iso-SAR contours areindicated in the SAR distributions and the zero RD contours areindicated in the RD distribution (-.-).
set-ups can also be compared using a more global approach, i.e. by comparing themean and maximum SAR of the entire distribution. Figure 3.6a visualizes the ratioof the average SAR levels: SARguc/SARref , for the three set-ups. Again, a large
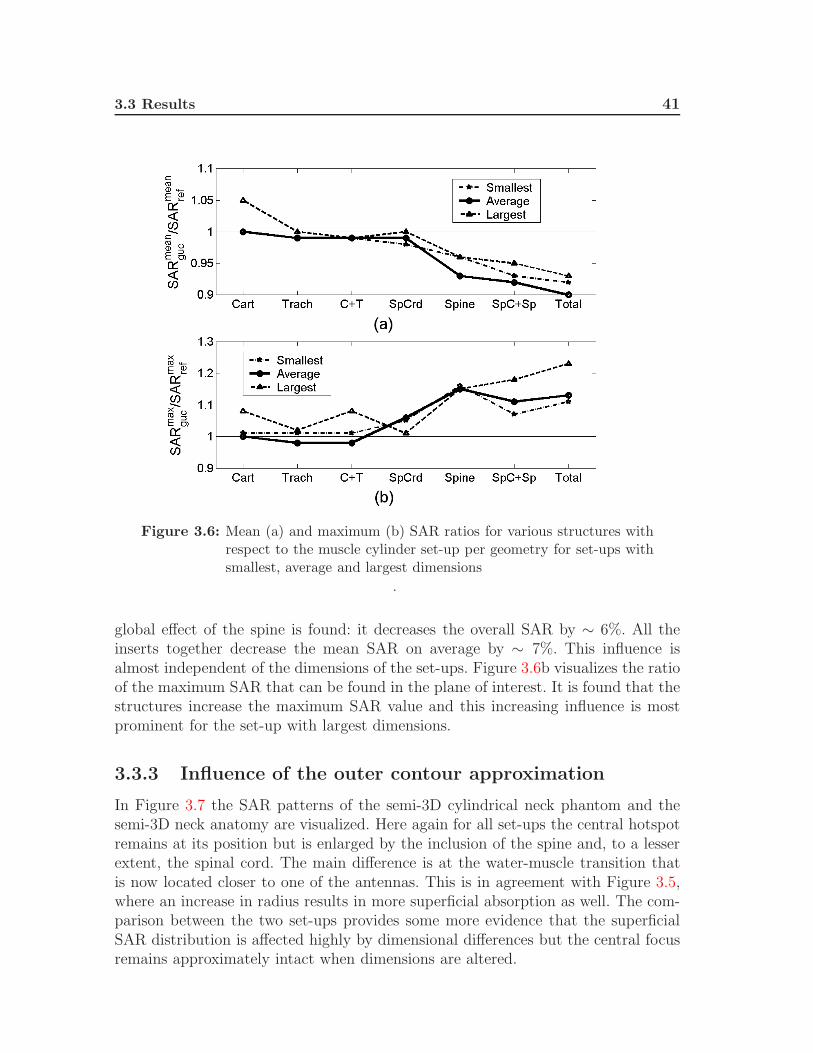
3.3 Results 41
Figure 3.6: Mean (a) and maximum (b) SAR ratios for various structures withrespect to the muscle cylinder set-up per geometry for set-ups withsmallest, average and largest dimensions
.
global effect of the spine is found: it decreases the overall SAR by ∼ 6%. All theinserts together decrease the mean SAR on average by ∼ 7%. This influence isalmost independent of the dimensions of the set-ups. Figure 3.6b visualizes the ratioof the maximum SAR that can be found in the plane of interest. It is found that thestructures increase the maximum SAR value and this increasing influence is mostprominent for the set-up with largest dimensions.
3.3.3 Influence of the outer contour approximation
In Figure 3.7 the SAR patterns of the semi-3D cylindrical neck phantom and thesemi-3D neck anatomy are visualized. Here again for all set-ups the central hotspotremains at its position but is enlarged by the inclusion of the spine and, to a lesserextent, the spinal cord. The main difference is at the water-muscle transition thatis now located closer to one of the antennas. This is in agreement with Figure 3.5,where an increase in radius results in more superficial absorption as well. The com-parison between the two set-ups provides some more evidence that the superficialSAR distribution is affected highly by dimensional differences but the central focusremains approximately intact when dimensions are altered.
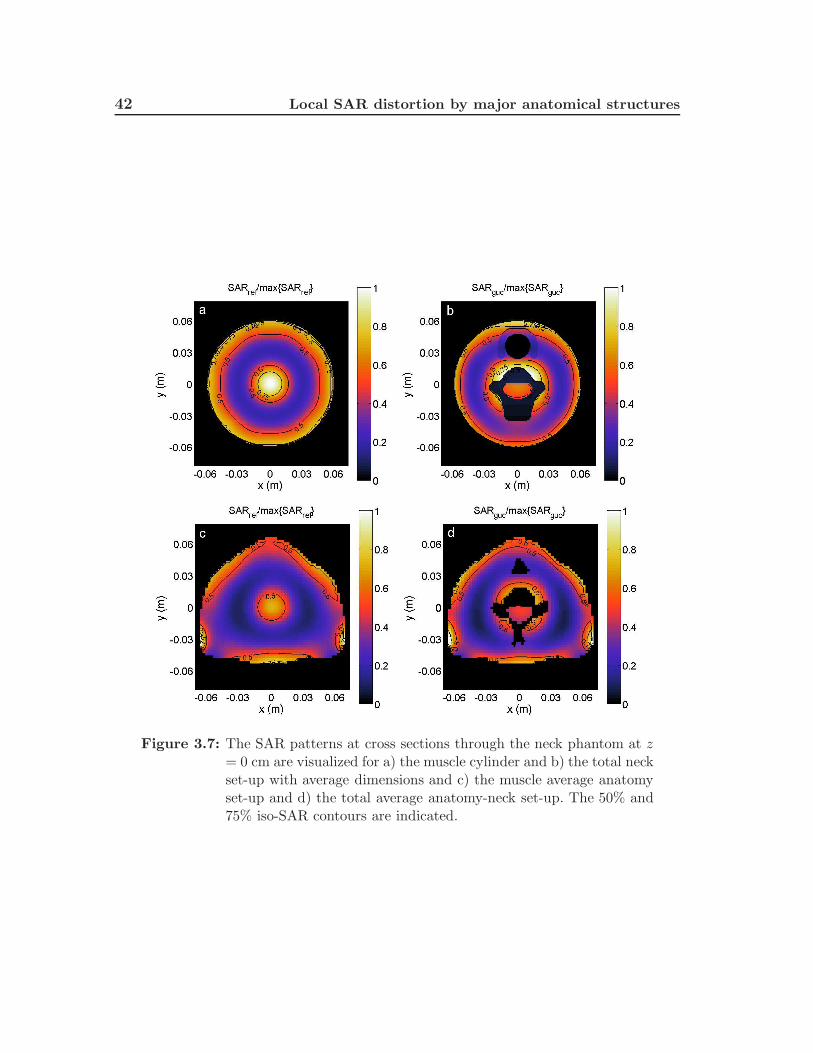
42 Local SAR distortion by major anatomical structures
Figure 3.7: The SAR patterns at cross sections through the neck phantom at z= 0 cm are visualized for a) the muscle cylinder and b) the total neckset-up with average dimensions and c) the muscle average anatomyset-up and d) the total average anatomy-neck set-up. The 50% and75% iso-SAR contours are indicated.
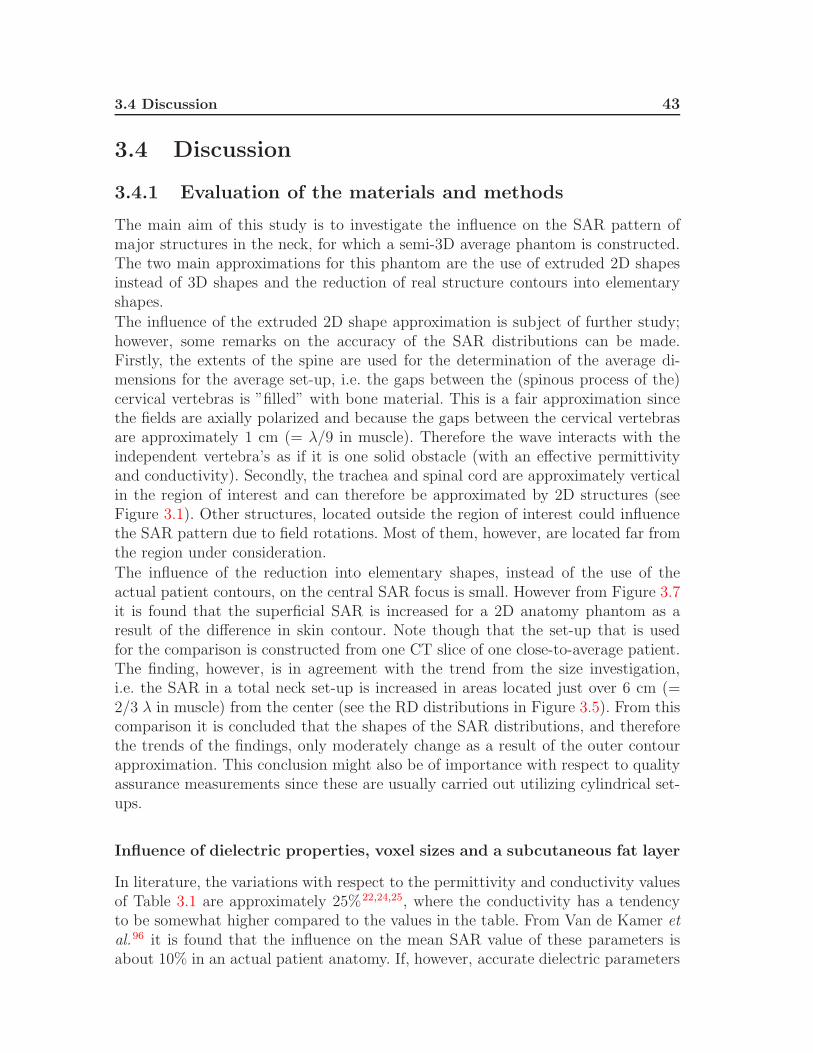
3.4 Discussion 43
3.4 Discussion
3.4.1 Evaluation of the materials and methods
The main aim of this study is to investigate the influence on the SAR pattern ofmajor structures in the neck, for which a semi-3D average phantom is constructed.The two main approximations for this phantom are the use of extruded 2D shapesinstead of 3D shapes and the reduction of real structure contours into elementaryshapes.
The influence of the extruded 2D shape approximation is subject of further study;however, some remarks on the accuracy of the SAR distributions can be made.Firstly, the extents of the spine are used for the determination of the average di-mensions for the average set-up, i.e. the gaps between the (spinous process of the)cervical vertebras is ”filled” with bone material. This is a fair approximation sincethe fields are axially polarized and because the gaps between the cervical vertebrasare approximately 1 cm (= λ/9 in muscle). Therefore the wave interacts with theindependent vertebra’s as if it is one solid obstacle (with an effective permittivityand conductivity). Secondly, the trachea and spinal cord are approximately verticalin the region of interest and can therefore be approximated by 2D structures (seeFigure 3.1). Other structures, located outside the region of interest could influencethe SAR pattern due to field rotations. Most of them, however, are located far fromthe region under consideration.
The influence of the reduction into elementary shapes, instead of the use of theactual patient contours, on the central SAR focus is small. However from Figure 3.7it is found that the superficial SAR is increased for a 2D anatomy phantom as aresult of the difference in skin contour. Note though that the set-up that is usedfor the comparison is constructed from one CT slice of one close-to-average patient.The finding, however, is in agreement with the trend from the size investigation,i.e. the SAR in a total neck set-up is increased in areas located just over 6 cm (=2/3 λ in muscle) from the center (see the RD distributions in Figure 3.5). From thiscomparison it is concluded that the shapes of the SAR distributions, and thereforethe trends of the findings, only moderately change as a result of the outer contourapproximation. This conclusion might also be of importance with respect to qualityassurance measurements since these are usually carried out utilizing cylindrical set-ups.
Influence of dielectric properties, voxel sizes and a subcutaneous fat layer
In literature, the variations with respect to the permittivity and conductivity valuesof Table 3.1 are approximately 25%22,24,25, where the conductivity has a tendencyto be somewhat higher compared to the values in the table. From Van de Kamer etal.96 it is found that the influence on the mean SAR value of these parameters isabout 10% in an actual patient anatomy. If, however, accurate dielectric parameters

44 Local SAR distortion by major anatomical structures
for fat are utilized this value is about 6%. Since in the neck no fat is modelled weestimate the accuracy of the SAR distribution at this 6%. The worst case estimationfor the RD distribution therefore is 12% global difference. This estimation is usefulonly for global values: it cannot be used for local influences.
Calculations for every structure and average dimensions at a lower resolution (2.5 mmfor ∆x and ∆y and 1 mm - 5 mm for ∆z) are carried out in order to assess theinfluence of the results on the grid size. Comparing the results of the 2.5 mm withthe 1 mm resolution we find for the differences: ∆RD < 2%, ∆RDmax < 11% and∆SAR50% < 0.2 cm2 (1.4%). This means that the 50% iso-SAR pattern is almostindependent of this grid size change and that the influence on the RD values is small.
The influence of the subcutaneous fat layer is neglected in this study. To investigatethe effect of such a layer we carried out calculations with a 3 mm thick fat layer atthe transition between the muscle and water environment. The conclusion from thesecalculations are that, due to increased reflections, the amount of SAR is decreased: ∆RD = −12%, ∆RDmax = −18% and ∆SAR50% = −0.3 cm2, but the patternremains intact for all structures and thus σ remains approximately equal (∆σ =−0.3%). The total amount of SAR in the cylinder is reduced ∼ 14% after inclusionof this fat layer.
3.4.2 SAR and RD distributions: trends and clinical trans-lation
With respect to the clinical translation this investigation forms a first step intothe systematic investigation of the parameters that influence the quality of an HTtreatment of H&N tumours. Subsequent steps will consist of investigations into3D-anatomy distorting influences and the influences of the applicator, i.e. antennaring(s) and waterbolus. From these results, the main treatment influencing param-eters can be identified and used as an aim for the design of an applicator.
For the muscle calculations it is found that a λ/3 in diameter central hotspot iscreated by eight circumferentially placed dipole antennas. This is in agreement withliterature values for the central hotspot in muscle30,105.
The influence of the trachea and spine on the SAR pattern is found to be large. Theinfluence of the trachea is mainly local but the spine has a more global influence,i.e. it spreads the central hotspot from λ/3 in diameter to approximately 2/3 λ.This value (2/3 λ) is in agreement to calculations, carried out by Guy et al.30, at915 MHz using an anatomy, which are verified with measurements. The location ofthe first region of low SAR, seen from the center, is identical to the results of Guyet al.30 as well: 2/3 λ for the muscle cylinder, λ/2 for the layered bone-muscle-fatcylinder. The difference lies in the fact that for this work a plane wave illuminationfrom four sides is used and therefore the superficial absorption by closely positionedantennas is not modelled. The resemblance of the central phenomena does agree

3.5 Conclusions 45
with the finding that the shape of the structures is of moderate importance but thatits position in the SAR pattern and its dielectric contrast are of high importance.
433 MHz is used as operating frequency in this study, which has a major effect onthe results. The pattern in the neck is highly determined by the wavelength and thedielectric properties of the tissues, thus by the operating frequency. This study in-dicates that 433 MHz is a suitable choice since its penetration depth is sufficient forlarge structures but still phase and amplitude steering are possible due to a singlecentral hotspot in all set-ups. This finding is concluded as well from SAR measure-ments in muscle phantoms at 400 MHz and 915 MHz29. This conclusion howeverneeds confirmation by calculations with a 3D anatomy since 1) the influence of fieldsreflected at higher and lower structures and at oblique transitions are not includedin this study and 2) a symmetrical set-up is used for the calculations.
With respect to the design of the future clinical H&N applicator we found littleevidence of disturbing effects that would restrict any specific applicator design. Wefound a minor indication that the only avoidable, undesired, increase of the SARis located at the trachea. Further, no evidence is found of a limiting change of theSAR in the spinal cord, which is a highly relevant issue because of the potential ofneurotoxicity. This study indicates that a cylindrical muscle phantom with a bonyspine insert is a suitable configuration for fast and simple inter-antenna performancecomparisons and provides good opportunities for experimental verification.
3.5 Conclusions
From this study it is found that the anatomy at 433 MHz, and especially the con-ductivity distribution, has a major impact on the SAR distribution in the neck: upto ∼ 11% global (mean) relative difference and a standard deviation from the meanof up to ∼ 80 % with respect to a muscle cylinder. Central, low in conductivity,structures cause the 50% iso-SAR contour to be widened and have a local influenceof up to ∼ 270%. The focal region is changed from a circular to a more donut shapefollowing the conductivity distribution in the neck. This effect is almost independentof the dimensions of the neck and the outer contours of the structures. The 50% and75% iso-SAR contours remain identical for changing dimensions up to a thresholdfrom which the path lengths in tissue from the antennas towards the center of theneck become to large with respect to the penetration depth.
The results in this study are obtained with use of an extruded semi-2D elementaryshape-fit phantom. Further study with 3D set-ups is necessary to investigate theinfluence of 3D structures on the SAR pattern. This study however forms a firststep towards the understanding of the complex influences of the various parameterson the SAR pattern in the head and neck and the design of a specific EM-applicatorfor heating H&N tumours.

46 Local SAR distortion by major anatomical structures
Acknowledgements
This work is financially supported by the Dutch Cancer Society, grant DDHK 2003-2855. The authors further would like to thank Professor A.P.M. Zwamborn for hiscontribution to the discussion.

CHAPTER 4
Optimization of a multi-ring antenna array set-up
This chapter is based on:M.M. Paulides, J.F. Bakker, A.P.M. Zwamborn, G.C. van Rhoon. “A head and neckhyperthermia applicator: theoretical antenna array design.” Int. J. Hyperthermia2007; 23: 59-67.

48 Optimization of a multi-ring antenna array set-up
Abstract
Purpose: Investigation into the feasibility of a circular array of dipole
antennas to deposit RF-energy centrally in the neck as a function of: 1)
patient positioning, 2) antenna ring radius, 3) number of antenna rings,
4) number of antennas per ring and 5) distance between antenna rings.
Materials and methods: Power absorption (PA) distributions in realistic,
head and neck, anatomy models are calculated at 433 MHz. Relative PA
distributions corresponding to different set-ups were analysed using the ratio
of the average PA (aPA) in the target and neck region. Results: Enlarging
the antenna ring radius from 12.5 cm to 25 cm resulted in a ∼ 21% decrease
in aPA. By changing the orientation of the patients with respect to the array
an increase by ∼ 11% was obtained. Increase of the amount of antenna
rings led to a better focussing of the power (1 → 2 / 3 : ∼ 17%). Increase
of the distance between the antenna rings resulted in a smaller (more target
region conformal) focus but also a decreased power penetration. Conclu-
sions: A single optimum array set-up suitable for all patients is difficult to
define. Based on the results and practical limitations a set-up consisting of
two rings of six antennas with a radius of 20 cm and 6 cm array spacing
is considered a good choice providing the ability to heat the majority of patients.
4.1 Introduction
Hyperthermia (HT) applied to advanced, unresectable, head and neck (H&N) carci-nomas, and their lymph node metastases, has a high potential to improve the resultsof currently existing treatment strategies20,79,90,94,95. Hereto equipment is warrantedthat enables application of an adequate heating pattern to this region. To the bestof the authors knowledge, such equipment is available only for heating depths upto 4 cm. Further, these superficial applicators provide only limited possibilities toadjust the specific absorption rate (SAR) pattern. Since we aim at heating both theprimary tumour and lymph node metastases, we need to design a specific H&N HTapplicator to achieve an optimal treatment. This novel applicator must provide ahigh degree of control of the SAR deposition pattern that should result in a highquality of the HT-treatment as shown by Wust et al.107.In earlier work72,73 we have investigated the dependence of the SAR pattern on aselection of basic design criteria: such as frequency, number of antenna elementsand anatomy. In these studies we demonstrated that due to circular symmetry ofthe neck anatomy a circular array of antenna elements is to be preferred. Furtherit was shown that the optimal frequency is highly dependent on the target volumeto be treated. Based on the expected target volumes for HT in the H&N region,we selected 433 MHz as the most suitable frequency. This frequency provides a

4.2 Materials and methods 49
good focussing of the energy and relatively low-priced equipment is available forthis frequency. Finally it was demonstrated that six to eight antennas on a circularring are sufficient to obtain focussed central heating for neck diameters up to 12 cm.For neck diameters larger than 12 cm the focus intensity decreases but in generalsufficient energy is deposited at depth.
In this paper we report on the results of a theoretical study that essentially is afollow-up of these earlier studies. In the present theoretical investigation the focusfirstly is on selection of a more realistic antenna arrangement, i.e. a single optimaland easily applicable antenna ring radius for all neck anatomies. This is carried outby numerically investigating the SAR focussing as a function of antenna ring radius,i.e. the distance from the antennas to the patient is step-wise increased. Secondly,the aim is to investigate the opportunities that multiple antenna rings provide foraxial SAR focussing. The investigation is performed by the calculation of 3D powerabsorption (PA) distributions in two realistic head models. The goal is to developan applicator that provides the flexibility to efficiently heat superficial target areasas well as more deeply located target volumes. Further, it should enable steeringaway from critical organs avoiding toxicity33. Again, we assumed that the ability toobtain a high PA at the center of the neck will be the most challenging and difficultproblem to solve. As a consequence, we consider that if adequate heating can beobtained for centrally located target volumes then phase and amplitude PA steeringcan effectively be used to heat lateral target volumes. Therefore, in this theoreticalstudy, we have focussed on investigating the dependence of the PA at the center ofthe neck as a function of the arrangement of a multi-ring antenna array.
4.2 Materials and methods
The antenna arrangement that provides the optimum PA pattern, and the highestefficiency, varies between patients, tumour locations and tumour volumes. Further,the location and orientation of the patient with respect to the antenna array can havea major influence. Investigating all above mentioned variables and their combinedeffects is obviously a vast task. To restrict the number of simulations, we split ourinvestigation into two series of calculations with growing complexity. Parameters ofinterest for each series of investigations were:

50 Optimization of a multi-ring antenna array set-up
• First series:
– Patient positioning (”RT position” vs ”HT position”)
– Antenna ring radius (”R”)
• Second series:
– Number of antenna rings
– Number of antenna elements per antenna ring
– Distance between the outer antenna rings (”D”)
The aim of the first series of calculations was to explore the influence of the antennaring radius, aiming to find a single diameter for all anatomy sizes. Hereto we startedwith a set-up of eight antenna elements that are equally spaced on an imaginary ringaround the neck, and investigated the influence of the radius of the antenna ringon the PA pattern. Simultaneously, we investigated the effect of patient positioning.From the first series of calculations we selected the antenna ring radius and patientpositioning for further investigations. The second series of calculations was dedicatedto the number of antenna rings, the amount of antennas per ring and the distancebetween these antenna rings.
4.2.1 Anatomy and antenna arrangements
Previously, we examined CT-scans of eight patients that underwent radiotherapy(RT) at various locations in the head and neck region and we determined the mini-mum and maximum diameter of the neck73. These results where used to select twopatients with respectively the smallest (radius ∼ 4.95 cm: ”small patient model”)and largest neck (radius ∼ 6.75 cm: ”large patient model”) from this subgroup. Fur-ther, these patient can be regarded as the ”most easy” and ”most difficult” patientanatomy since they were a skinny patient with a long neck (”small patient model”)and a fatty patient with a short neck (”large patient model”). The small patienthad a carcinoma in the larynx and the large patient a nasopharynx carcinoma. ACT-scan of these patients was used to segment two head and neck tissue models.These patients are assumed to represent the extents of the group of patients in termsof heating in the neck, i.e. results are expected to be representative for the entiregroup of patients. Both models contain over ten tissue types (Table 4.1). The CT-scans contained anatomy information from the shoulders up to the nose for the smallpatient and from the shoulders up to the crest for the large patient. By comparingthe PA patterns in patient models with and without an artificial extension we foundthat the truncations affect only the PA values within ∼2 cm from the truncation.Figure 4.1 shows the tissue distributions of both anatomy models.In72 we found that 433 MHz is within the optimum range of frequencies for an eightdipole antenna set-up and that the array should be rotated 22.5 with respect to the

4.2 Materials and methods 51
a) Small patient model(3D view) b) Small patient model
(Sagittal cut, x=0)
c) Large patient model(3D view) d) Large patient model
(Sagittal cut, x=0)
Figure 4.1: 3D view (a,c) and sagittal cuts (b,d) of the tissue distribution of thetwo head models. b) and d) show the RT position and an indicationof the HT position (10 rotation).

52 Optimization of a multi-ring antenna array set-up
Table 4.1: Dielectric properties at 433 MHz of the tissues types correspondingto the two head models (µr = 1.0).
Tissue type ǫr [-] σeff [S/m]
Demineralized water 78 0.04Trachea 1 0.00Fat 6 0.04Muscle 57 0.81BoneCortical 13 0.09Air bubble 1 0.00Lung 1 0.00Tooth 13 0.09Cartilage 45 0.60BrainGrey 57 0.75BrainWhite 42 0.45SkinWet 46 0.68Gland 61 0.89Eye 58 1.01PEC 1 1*106
chin to avoid hotspots at the chin. In Figure 4.4a we present the set-up to investigatethe influence of variation of the antenna ring radius R on the absorption pattern inthe neck. A minimum radius of 12.5 cm was used to ensure that both anatomies arelocated in the far field of the dipoles (∼ λ/2). This radius was enlarged to 25 cm insteps of 2.5 cm to obtain the required minimum distance between the tissue surfaceand the antenna elements. Simultaneously, we investigated the effect of a ten degreesrotation of the array with respect to the patient around the x-axis (left→right): ”RTposition” vs ”HT position” (see Figure 4.1 and 4.2). The RT position conformsto the RT treatment position and the HT position is considered optimal for a HTtreatment. We chose a ten degrees rotation (around the x-axis) because this leadsto a smaller neck cross-section and aligns the spinal column of the patient with thecentral axis of the applicator.
Using the selected antenna ring radius and anatomy rotation angle, the secondseries of calculations addressed the potential of multiple antenna rings. As a startingpoint we used set-ups with six and eight antennas and investigated the benefit ofset-ups consisting of two or three antenna rings. We further changed the distancebetween the outer antenna rings (D in Figure 4.2) stepwise from 0 to 10 cm. Withmultiple rings at a suitable distance we expected to obtain a more axially focussedabsorption pattern and axial steering possibilities. In practice, the maximum amountof antennas is restricted to twelve since this amount of 150 Watt amplifiers, operatingat 433 MHz, is available in our unit. This leads to set-ups of two rings of four (”2x4”)

4.2 Materials and methods 53
Neck volume Target volume
Antenna ring 1Antenna ring 2
Antenna ring 3
2x4
2x8
RT position HT position
2x6
3x4
1 3 2
D
y
z
y
x
R
Figure 4.2: Schematic representation of the antenna ring arrangements (2x4,2x6, 2x8 and 3x4) and schematic sagittal cross-sections of the RTposition and the 10 rotated (around the x-axis) HT position.
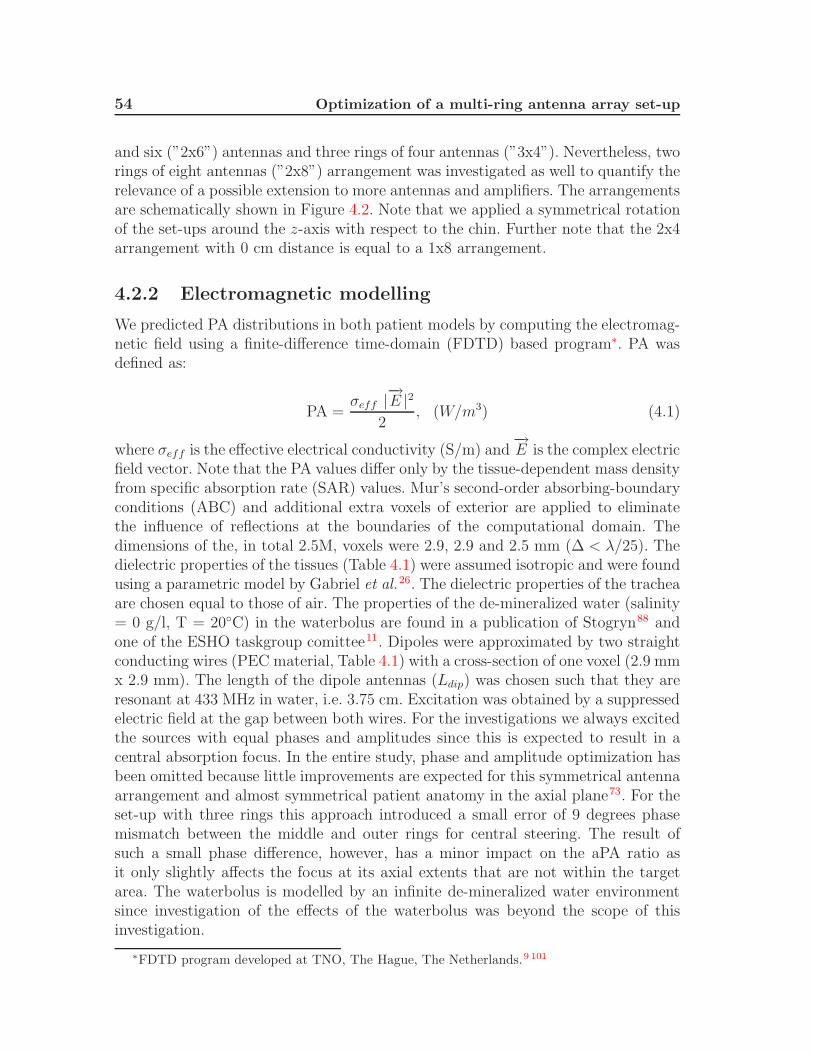
54 Optimization of a multi-ring antenna array set-up
and six (”2x6”) antennas and three rings of four antennas (”3x4”). Nevertheless, tworings of eight antennas (”2x8”) arrangement was investigated as well to quantify therelevance of a possible extension to more antennas and amplifiers. The arrangementsare schematically shown in Figure 4.2. Note that we applied a symmetrical rotationof the set-ups around the z-axis with respect to the chin. Further note that the 2x4arrangement with 0 cm distance is equal to a 1x8 arrangement.
4.2.2 Electromagnetic modelling
We predicted PA distributions in both patient models by computing the electromag-netic field using a finite-difference time-domain (FDTD) based program∗. PA wasdefined as:
PA =σeff |
−→E |2
2, (W/m3) (4.1)
where σeff is the effective electrical conductivity (S/m) and−→E is the complex electric
field vector. Note that the PA values differ only by the tissue-dependent mass densityfrom specific absorption rate (SAR) values. Mur’s second-order absorbing-boundaryconditions (ABC) and additional extra voxels of exterior are applied to eliminatethe influence of reflections at the boundaries of the computational domain. Thedimensions of the, in total 2.5M, voxels were 2.9, 2.9 and 2.5 mm (∆ < λ/25). Thedielectric properties of the tissues (Table 4.1) were assumed isotropic and were foundusing a parametric model by Gabriel et al.26. The dielectric properties of the tracheaare chosen equal to those of air. The properties of the de-mineralized water (salinity= 0 g/l, T = 20C) in the waterbolus are found in a publication of Stogryn88 andone of the ESHO taskgroup comittee11. Dipoles were approximated by two straightconducting wires (PEC material, Table 4.1) with a cross-section of one voxel (2.9 mmx 2.9 mm). The length of the dipole antennas (Ldip) was chosen such that they areresonant at 433 MHz in water, i.e. 3.75 cm. Excitation was obtained by a suppressedelectric field at the gap between both wires. For the investigations we always excitedthe sources with equal phases and amplitudes since this is expected to result in acentral absorption focus. In the entire study, phase and amplitude optimization hasbeen omitted because little improvements are expected for this symmetrical antennaarrangement and almost symmetrical patient anatomy in the axial plane73. For theset-up with three rings this approach introduced a small error of 9 degrees phasemismatch between the middle and outer rings for central steering. The result ofsuch a small phase difference, however, has a minor impact on the aPA ratio asit only slightly affects the focus at its axial extents that are not within the targetarea. The waterbolus is modelled by an infinite de-mineralized water environmentsince investigation of the effects of the waterbolus was beyond the scope of thisinvestigation.
∗FDTD program developed at TNO, The Hague, The Netherlands.9 101

4.3 Results 55
4.2.3 Evaluation
Simulated PA patterns were analysed qualitatively by comparing visualizations ofcross-sections through the origin of the applicator, i.e. through the planes x = 0,y = 0 and z = 0. These plots visualize PA values that are normalized to the averagevalue in the neck region. For quantitative evaluation we defined the average PA ratiothat quantifies the average amount of power that is absorbed in the target regionwith respect to the average amount in the neck:
aPA ratio =PAtgt
PAnck
, (4.2)
where PAtgt is the mean power absorption value in the target region and PAnck
is the mean power absorption value in the neck region. The aPA ratio effectivelyquantifies the global shape of the PA pattern. For this analysis we introduced acentrally located hypothetical target volume with realistic content in both anatomiesas shown in Figure 4.2. Target volumes of 4 cm x 4 cm x 4 cm (0.064 dm3), 5 cmx 5 cm x 5 cm (0.125 dm3) and 6 cm x 6 cm x 6 cm (0.216 dm3) are investigatedbecause the aim is to treat advanced tumours. Results are shown only for 5 cm x5 cm x 5 cm since observed phenomena were similar for all three target volumesizes. The height of the neck volume was 16 cm (small anatomy) or 20 cm (largeanatomy) to incorporate the PA values up to the chin and shoulders. High localPA values (”PA hotspots”) were found at these sites in the previous investigation72
and these effects are potentially decreased by a proper set-up with multiple antennarings. This larger neck volume means that the aPA values will be higher than inprevious publication since more low values are included in the neck volume and asa consequence the average PA in the neck volume will be lower.
4.3 Results
4.3.1 First series: ring radius and patient model orientation
Figure 4.3 shows a sagittal, transversal and coronal cross-section of the PA distri-bution in the large patient model corresponding to two set-ups: 1) one ring of eightdipoles (”1x8”) and 2) two rings of six dipoles (”2x6”), both with a radius of 20 cm.
The transversal cross-section of the 1x8 set-up clearly shows a central region of highPA: the central focus. This central focus quite nicely fits in the inner white square:the target region. The sagittal and coronal view confirm this central focus but revealthat the axial focus length extends to the outside of the target volume. Further itshows regions of high PA in tissue outside the target region (”PA hotspots”) at the

56 Optimization of a multi-ring antenna array set-up
Figure 4.3: Cross-sections of the PA distributions in the large patient model inHT position for one ring of eight dipoles (1x8, R = 20 cm) and tworings of six dipoles (2x6, R = 20 cm, D = 6 cm). Black arrows indicatethe locations of PA hotspots (1x8) or corresponding locations wherethese hotspots are reduced (2x6).
chin and shoulders. The locations of these hotspots are indicated because they arepoorly visible.
Figure 4.4 visualizes aPA ratios as a function of applicator ring radius (1x8 set-up)for a small and large patient model in RT and HT position. The aPA ratio is foundto decrease about 21% for arrangements with increasing radii. An increasing radiusleads to a larger focus length (z-direction) so relatively less power is deposited withinthe 5 cm of the target region. The slopes of the curves depend on the choice of theneck volume, but the shape is comparable for different volumes. A radius of 20 cmis selected for the clinical applicator so all antennas are sufficiently far away forall patients and for ease of patient positioning. The figure also shows that the HTposition leads to favourable aPA ratios compared to the RT position for the small(+5%) and large (+18%) patient model. Hence, a PA pattern is obtained with amore pronounced central focus and a lower sensitivity to the neck diameter. Thismore intense focus is the result of a smaller neck cross-section in HT positioning(perpendicular to the spine, see Figure 4.1). From these results we chose the HTposition as optimum and hence used the HT position and a radius of 20 cm forfurther calculations.

4.3 Results 57
R
Neck volume Target volume
a) set-up
0 5 10 15 20 250
0.5
1
1.5
2
2.5
3
3.5
4
Radius of the antenna ring (cm)
aver
age
PA
rat
io
1x8, small (RT pos)1x8, small (HT pos)1x8, large (RT pos)1x8, large (HT pos)
Large neck
Small neck
λ/2
b) Results
Figure 4.4: Average PA ratios as a function of antenna ring radius for a set-up ofeight antennas: set-up a) and results b). Curves correspond to resultsfor a small and a large patient model in RT and HT (10 rotationaround the x-axis) position. The average radius of these models andthe near-field distance (λ/2), where the dipole antennas should notbe placed, are indicated.

58 Optimization of a multi-ring antenna array set-up
4.3.2 Second series: number of rings, amount of antennasper ring and ring distance
When enlarging D we found for all array arrangements that the central focus becomessmaller in the axial direction and more and more conforms to the target region.When the distance D becomes too large, the intensity of the focus is hamperedby insufficient penetration of the electromagnetic waves due to an increasing pathlength. Further, the PA hotspots at both shoulders reduce for all arrangementswhen D is enlarged up to a maximum of 8 cm. These effects are exemplified byFigure 4.3, which shows PA distributions for 1x8 and 2x6 configurations. The maindifference between the PA patterns of both set-ups are the PA hotspots at the chinand shoulders for the 1x8 set-up that are reduced in the 2x6 set-up: this effect isindicated by the arrows. For both set-ups we found a central focus that is modulatedby the anatomy distribution. The PA pattern, however, is somewhat more focussedby using two rings, however, it is difficult to notice this effect on the base of PAvisualizations.
Figure 4.5 visualizes the aPA ratios for all antenna arrangements, all distances andboth anatomy models. For an increased antenna outer ring distance, it quantifiesthe previously mentioned effects: an increase of focus but a decrease of intensity atthe target region. The figure shows that extending the amount of antenna rings fromone to two or three results in ∼15% (small patient) to ∼19% (large patient) morepower absorption at depth. Three out of four aPA ratio curves show their highestvalues for the set-ups with D=0 cm. The aPA of these curves, however, is relativelystable until a certain threshold distance where the decrease becomes much steeper.This effect is less prominent for a 3x4 set-up but in this case the third central ringis not moved (see Figure 4.2). For a 2x8 set-up, maximum focussing is not obtainedat D=0 cm because each ring of eight antennas provides optimum PA intensity atthe target region on its own but the focus in z-direction conforms best to the targetregion for ring distances around 4–6 cm. All curves are positively correlated withthe total amount of antennas. For small distances (< 6 cm) the aPA values indicatea 20% increase in focussing from eight to twelve antennas and an additional 10%increase for a 16 antenna set-up.
4.4 Discussion
As we explained earlier73, the causes of the perturbations on the SAR distributionof a phased array hyperthermia applicator device can be clustered into three groups.From inside to outside these are: 1) anatomy, 2) antenna array and 3) waterbolusrelated distortions. We chose to investigate these parameters independently to gainmore understanding of their, sometimes opposing, effects on the PA pattern. In thepresent study we dedicated our attention to extending earlier work that has beendone on the second step72. Of course, it is difficult to separate waterbolus related
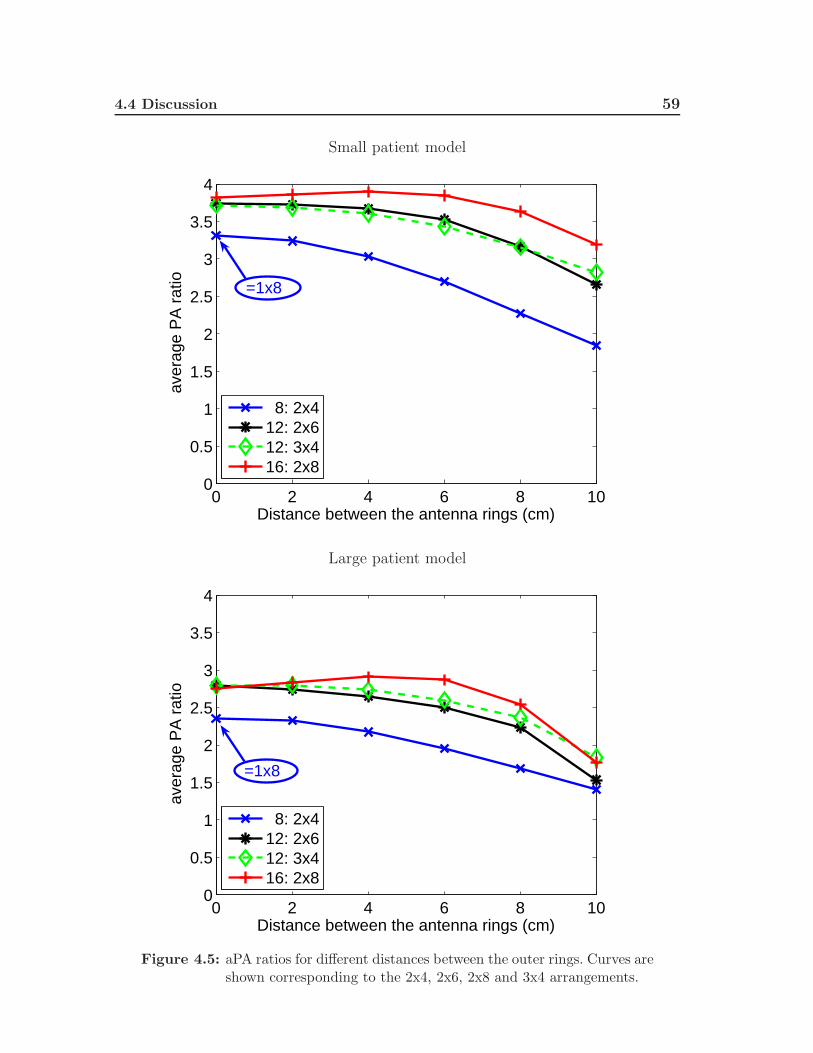
4.4 Discussion 59
Small patient model
0 2 4 6 8 100
0.5
1
1.5
2
2.5
3
3.5
4
Distance between the antenna rings (cm)
aver
age
PA
rat
io
8: 2x412: 2x612: 3x416: 2x8
=1x8
Large patient model
0 2 4 6 8 100
0.5
1
1.5
2
2.5
3
3.5
4
Distance between the antenna rings (cm)
aver
age
PA
rat
io
8: 2x412: 2x612: 3x416: 2x8
=1x8
Figure 4.5: aPA ratios for different distances between the outer rings. Curves areshown corresponding to the 2x4, 2x6, 2x8 and 3x4 arrangements.

60 Optimization of a multi-ring antenna array set-up
influences from array related influences, especially at bolus-air transitions16,38. How-ever, waterbolus shapes are difficult to prescribe clinically and they highly dependon practical limitations. Further, effects from waterbolus edges that are present inmany calculations due to straight edged models are expected to reduce due to moreround shapes in the clinical practice. Therefore we chose to investigate antenna arrayeffects and postpone studying effects of the waterbolus edges.To perform the study within an acceptable period and to avoid an enormous amountof calculations, we simplified the problem by investigating only the ability of a circu-larly symmetric antenna arrangement to adequately heat a centrally located targetregion. Exploiting the high amount of symmetry of this set-up it was reasonable touse central phase and amplitude settings. Further, we assumed that the variationin aPA due to different patient anatomy locations is much larger than the variationdue to suboptimal phase and amplitude settings. In a previous study72 we haveinvestigated the influence of the choice of frequency on the PA pattern by using asingle anatomy model. The frequency has a huge effect on the PA pattern (two foldincrease in focussing) and, for that study, one anatomy model and scaled versionswere sufficient to represent the entire group of H&N patients that apply for RT.In this study we expected smaller differences and we therefore used two anatomymodels that represented the extremes of the subgroup of H&N RT patients, i.e. asmall patient and a large patient. The simplifications to the phase and amplitudeoptimization and anatomy models led to a considerably reduced computational ef-fort while still a high predictive value for the optimum set-up for this group ofpatients can be expected. Phase and amplitude optimization, however, is expectedto be inevitable to effectively steer the central focus to a non-central target regionand is useful to further reduce hotspots per individual patient. These effects will bethe subject of a subsequent study when the applicator is routinely used for clinicaltreatments giving us the opportunity to perform patient specific treatment planning.For this study we analyzed CT scans of eight patients and selected the ”most easy”and ”most difficult” patient anatomy, i.e. a skinny patient with a long neck (”smallpatient model”) and a fatty patient with a short neck (”large patient model”). Wefaced some difficulties to determine the optimum axial location of the array aroundthe large patient’s neck while trying to keep sufficient distance between all anten-nas and patient model’s skin. In the first attempt large PA hotspots were visible,especially at the shoulders for set-ups with D > 6 cm. These hotspots where alsoreflected in steeper and less straightforward aPA curves. These problems, however,were less prominent in HT position compared to RT position. An improved place-ment, i.e. a shift in cranial direction, led to less hotspots and more predictable aPAcurves.This investigation is a follow-up of the study reported in a previous paper72 andforms the step from that theoretical parameter study to an actual applicator antennaarray set-up. In that study we selected an array of six to eight antennas operatingat 433 MHz as optimum arrangement for a single ring, H&N, HT applicator. In thepresent study we found that more than eight antennas yields better focussing, thus

4.4 Discussion 61
better aPA values. The reason for this different result is that by increasing the neckvolume we now also incorporate the effects of PA hotspots at chin and shouldersthat are reduced by the increased amount of antennas in the current study.Earlier investigations used phased-array approaches to apply superficial hyperther-mia with planar or conformal arrays45,56. Experimental work by Gross et al.29 showedthe potential of cylindrical phased arrays for heating tumours in the neck using fourwaveguide horn antennas applied to a neck-sized cylindrical muscle-phantom. How-ever, to the best of the authors’ knowledge, no clinical phased-array based applicatorfor applying hyperthermia to deep-seated head and neck tumours exists. Moreover,this is the first attempt to use 3D calculations for a parameter optimization of a(circular) phased-array applicator specifically designed for deep heating in the H&Nregion.For deep hyperthermia (DHT), the use of circular phased-array applicators has along history91,100 and the application is to a certain extent comparable. A prominentdifference that hampers comparison is the concave shape of the neck whereas thepelvis is more convex shaped. This concave shape results in more strict limitations onthe distance between outer rings (∼8 cm as found in this study) where for DHT thatdilemma is not that an important issue. Further, the neck has the advantage that itis more cylindrically symmetrical. As a consequence, SAR pattern optimization byphase steering is expected to be more straightforward.The influence of multiple antenna rings for DHT was previously investigated theo-retically by Seebass et al.83, Paulsen et al.77 and Kroeze et al.50 for their deep hy-perthermia systems consisting of three50,83 or four77 rings of antennas at predefinedpositions. Paulsen et al.77 conclude from their results (power based optimization)that increasing the number of antennas per ring in many cases is more favourablethan increasing the number of antenna rings. A similar conclusion is drawn by See-bass et al.83 for their power based optimization, but they found the reverse effectfor the temperature based optimization. They explain this phenomenon by deviat-ing between obtaining a proper focus at the target region with positive interference(power optimization) and the decrease of hotspots by negative interference (tem-perature optimization). Seebass et al 83 further conclude that a large amount ofantennas per ring should be avoided because this results in a high sensitivity of thePA pattern to small amplitude and phase shifts. Kroeze et al.50 compared a set-upsof multiple waveguide slot antennas for heating in the pelvic region. For this con-vex region they conclude that a 3x4 arrangement outperforms a 2x6 arrangement.Together these three studies agree with the current results that twelve antennas aresufficient for SAR pattern steering and that it is difficult to discriminate between a3x4 and a 2x6 set-up.The influence of the distance between two arrays for deep HT is previously ex-perimentally instigated by Crezee et al.13. They started with their AMC-4 set-up,consisting of one ring of four waveguide antennas, and added an extra ring (”AMC-8”) and varied the inner-ring distance. In contrast to our findings, they found byphantom measurements that the effective length (L50%: axial dimension of the 50%

62 Optimization of a multi-ring antenna array set-up
iso-SAR volume) increased for an increased ring distance. The reason for this dif-ference is the much smaller relative distance between the antennas and the patientfor the AMC-8 system (∼ 0.25λ) compared to our set-up (∼ 1.5λ). In a separatestudy in cylindrical phantoms (results not reported) we found that a small distancebetween the patient and the antennas results in a small L50% and thus a poor inter-ference between the two antenna rings. In the extreme case of exposure of a musclecylinder by a circumferential plane field, L50% will reach ∞, providing the waveshave sufficient penetration depth.
4.5 Conclusions
In this theoretical study we have focussed on investigating the dependence of thePA at the center of the neck as function of the arrangement of a multi-ring antennaarray. Parameters of interest were: 1) patient positioning 2) antenna ring radius 3)number of antenna rings 4) number of antenna elements per antenna ring 5) distancebetween the outer antenna rings.We found that a rotation of ten degrees of the antenna array with respect to thepatient results in a better heating at depth (∼11%). This rotation further alignsthe spinal column to the central antenna array axis, thus steering the central focusaway from the spinal column by means of phase and amplitude adjustments is morestraightforward. aPA values decreased (∼21%) when increasing the antenna radiusof a 1x8 set-up. Mechanically, a radius of around 20 cm was experimentally foundto fit best around the neck: thus we chose this smallest, practical, radius.Investigations into an array with over eight antennas for this H&N heating applica-tion revealed an increase of around 17% in aPA for D = 0 cm. It is difficult to choosethe best performing set-up (2x6 or 3x4) that matches our twelve, clinically avail-able, amplifiers since only small differences in power focussing at depth are found.Furthermore, results are modulated by the array distance. Globally, the increase inpenetration at depth of multiple rings diminished when the antenna rings wherepositioned at distances over 6 cm. We chose to use two rings of six antennas becauseof its high intuitive steering (compared to a 3x4 set-up) and an inner-ring distanceof 6 cm for maximum axial (z-direction) SAR steering possibilities. Increasing ourclinically available amount of amplifiers to 16 (2x8 set-up) would result in a 10%increase in focussing at depth when D = 6 cm.
Acknowledgements
This work is financially supported by the Maurits and Anna de Kock Foundationand the Dutch Cancer Society, grant DDHK 2003-2855. The authors further wouldlike to thank M. Franckena for her segmentation work and J.B. Rhebergen for hishelp on fast simulations.

CHAPTER 5
Design of the patch antenna
This chapter is based on:M.M. Paulides, J.F. Bakker, N. Chavannes, G.C. van Rhoon. “A patch antennadesign for application in a phased-array head and neck hyperthermia applicator.”IEEE Trans. Biom. Eng., In press. (http://ieeexplore.ieee.org/Xplore)

64 Design of the patch antenna
Abstract
In this paper we describe a specifically designed patch antenna that can be
used as the basis antenna element of a clinical phased-array head and neck
hyperthermia applicator. Secondly, we theoretically assessed its electrical
properties under clinical conditions. Using electromagnetic simulations we
optimized the dimensions of a probe-fed patch antenna design for operation
at 433 MHz. By several optimization steps we could converge to a theoretical
reflection of -38dB and a bandwidth (-15dB) of 20 MHz (4.6%). Theoretically,
the electrical performance of the antenna was satisfactory over a temperature
range of 15-35C, and stable for patient-antenna distances to as low as 4
cm. In an experimental cylindrical set-up using six elements of the final
patch design, we measured the impedance characteristics of the antenna 1) to
establish its performance in the applicator and 2) to validate the simulations.
For this experimental set-up we simulated and measured comparable values:
-21dB reflection at 433 MHz and a bandwidth of 18.5 MHz. On the basis of
this study, we anticipate good central interference of the fields of multiple
antennas and conclude that this patch antenna design is very suitable for
the clinical antenna array. In future research we will verify the electrical
performance in a prototype applicator.
5.1 Introduction
In previous publications72,73 we have explained the need for a site-specific designof an applicator that will adequately heat head and neck (H&N) tumours. In anexploratory theoretical study72 we demonstrated that such a site-specific applicatormust consist of multiple antenna elements to provide adequate control of the specificabsorption rate (SAR) deposition pattern. We also showed that 433 MHz (ISMfrequency in Europe: a frequency allocated for Industry, Science and Medicine) isa suitable frequency for heating H&N tumours with a multi-antenna applicator. Inthis paper we will address the first step of the applicator design, i.e. the design of asingle antenna element.The problems involved with hyperthermia antenna design are very different fromthe design of antennas in free space and should not be underestimated87. Firstly,the antenna radiates into a lossy medium, which has a considerable influence onthe impedance, bandwidth and antenna losses31,48. For this reason, the antennadesign procedures described in the literature could not be used, since these weredeveloped for a lossless environment (usually air) and simulations have to be verifiedby measurements. Secondly, the presence of a patient in the near field can alsohave considerable impact on the reflection characteristics. For deep hyperthermia(DHT), the most common array set-up is a circular or elliptical array of multiple

5.1 Introduction 65
antennas that are matched to the patient by means of a waterbolus filled with(demineralized) water. The use of a waterbolus requires an antenna design thatenables efficient radiation from the substrate material of the patch antenna into thebolus water. In the antenna design proposed in this paper, this problem is solvedby using water as substrate material, whereby the patch antenna is submerged inthe water. This water can be circulated to cool the antenna, thereby increasing thestability of the antenna characteristics at high power. Another advantage is that awater substrate considerably decreases the optimal size of the antenna comparedto that of a configuration with a solid substrate (ǫr < 20). The drawback of thisapproach, however, is that the substrate is lossy and its permittivity will vary withthe waterbolus temperature, which is determined depending on the skin-coolingstrategy required.Most DHT99 applicator designs consist of an array of waveguide antennas (”guidefed slot”) or dipole antennas87. The first designs utilized water-filled waveguidesbecause they are rigid and require no external matching. Despite the utilization ofwater-filling, these antennas have a very narrow bandwidth and are relatively largeand heavy. Another disadvantage of water-filled waveguides is their relatively strongnear-field components68,102. These fields extend to the outside of the waterbolus,especially for low frequencies (<433 MHz), leading to hotspots in superficial tissueeffectively reducing penetration depth68. The problems with high near-fields weresolved by a subsequent design utilizing dipole antennas, which are simpler and havea larger bandwidth. Dipoles, however, require an RF-matching network containinga balun5 to obtain a symmetric radiation field and stable electrical performance.This matching network absorbs a substantial amount of power and thus decreasesthe efficiency of the antenna.The need for such a matching network can be circumvented by using a properlydesigned probe-fed patch antenna operating within the waterbolus. Since the 1970s,patch antennas have received a lot of attention27 because they are inexpensive,lightweight, easy to construct and can be made to conform to curved structures. Theyhave also been investigated extensively within the hyperthermia community31,59,93,but mainly for purposes of superficial hyperthermia (SHT) (heating depth ≤ 4 cm).For SHT the most important drawback was the patch antennas’ small bandwidth,and the correspondingly large influence of tissue loadings in the close vicinity of theskin on the antenna’s reflection characteristics. For DHT, when a minimal patient-antenna distance can be assured, this influence of tissue loadings is restricted. Fur-ther, a highly appealing feature of patch antennas is that they can be fed with asimple coaxial cable, requiring no special matching network between antenna andtransmission line. When used for a clinical treatment, antennas in which an RFmatching network can be avoided have a clear advantage in terms of reliability andreproducibility. The build-up of heat in the matching network, associated with largemismatches of the antenna load, may cause an unpredictable63,108 and unstable be-haviour of the system.
66 Design of the patch antenna
In this work we designed and analyzed a patch antenna for use in a head and neckapplicator, where the main parameter under investigation was its reflection charac-teristic. The resulting patch antenna design was analyzed by extensively exploiting3D electromagnetic (EM) simulations of various patch antenna set-ups and mea-surements. The analysis focussed on the sensitivity of the design to the influences ofdimensions (length, width, height, feeding position) and to influences under clinicalconditions (water temperature, patient, neighbouring patch antennas). The amountof cross-coupling was also estimated using a flat set-up. The antenna design wasbuilt in an array setting, and its reflection was optimized by fine-tuning its length.Finally, we conducted measurements on multiple versions of these patches to verifythe practical feasibility of the design and to check the accuracy of the simulations.
5.2 Materials and methods
5.2.1 Design requirements
The use of an antenna design within an hyperthermia (HT) applicator leads to someapplication-specific requirements. The antenna will be embedded in a movable appli-cator system, hence the antenna should be light, small and robust. Because E-fieldcomponents perpendicular to the patient skin lead to high power absorption val-ues at fat-muscle transitions73, a high E///E⊥ ratio at the patient’s skin is desired.Furthermore, constructive interference would be optimal for axial electric field com-ponents21. To reduce power losses in the water bolus (σeff,water 6= 088), the antennasshould be positioned as close as possible to the patient skin. On the other hand, thedistance to the skin has to be large enough to minimize the patient’s influence onthe reflection characteristics. Further, to avoid an additional matching circuit (ex-tra power losses) which would destroy the initial advantage of the patch antenna, amatched and efficient antenna design was desired. This efficient operation should bepossible in the entire range of waterbolus temperatures, which is anticipated to bebetween 20 and 30C for this semi-deep HT treatment. For the initial design processwe anticipated that optimizing the -15dB bandwidth would result in a design witha low sensitivity of the reflection coefficient to different tissue loadings and suffi-cient room to cope with the change in resonance frequency due to the changes inwaterbolus temperature. We aimed to achieve little cross-coupling because it wouldincrease ”reflected power” at other antennas, thus virtually decreasing efficiency.
5.2.2 Application specific configuration
The patch antenna configuration and its most important dimensions are shown inFigure 5.1. The configuration consists of a conducting groundplane with a conductingpatch of length L and width W at distance h from the groundplane. The patch isconnected, at distance xf from the width of the patch, to the extending conducting

5.2 Materials and methods 67
rod of a C-female receptacle connector. The diameter of the extending rod is 3 mmand the diameter of the surrounding teflon dielectric is 10 mm.
Muscle layer
W
x
y
z
3D configuration
L
h
xf
Cross-section
Figure 5.1: Schematic visualization of the patch antenna configuration and across-section, with the dimensions that are varied. The ”Musclelayer” was present only in the set-ups that were used to investigateinfluence of a patient on the reflection characteristics.
In this configuration, efficient radiation into the waterbolus is obtained by usingwater as substrate material, i.e. the patch is submerged in the water. The waterwill be circulated to cool the patient’s skin and, at the same time, this circulatingwater provides cooling of the antenna’s self-heating effects at high power (∼100W).Cross-coupling between antennas is expected to be low in this design because nodielectric transition is present that may enable surface waves. For the first designwe used dielectric properties of demineralized water at 433 MHz and 25C, i.e. ǫr
(relative permittivity) = 78 and σeff (effective conductivity) = 0.04 S/m.
5.2.3 EM modelling
Ansoft Designer
The design process was initiated by using Ansoft Designer v2.13, a layered 2Dmethod of moment (MoM) based program. The program makes it possible to defineinfinitely thin Perfectly Electrically Conducting (PEC) and finite dielectric layers;definition of non-infinite PEC structures and a feed of finite size can also be modelled(Figure 5.2). A constrained gradient optimization algorithm was used to optimizethe length L, width W and distance of the feed to the edge of the patch xf fordifferent heights h. To simulate the waterbolus, Layer1 and Layer2 where assigneddielectric properties of demineralized water at 433 MHz11,88. For Layer3, we useddielectric properties of muscle at 433 MHz26: ǫr = 56, σeff = 0.8 S/m, to simulate

68 Design of the patch antenna
ABC
Layer2
Layer3
Patch
FeedLayer1
PEC
L
h
xf
Figure 5.2: Schematic visualization of the layered patch set-up implementationin Designer. ”Patch” is infinitely thin and ”Feed” has a diameter of3.0 mm, both are PEC.
the influence of a patient in the design. We further assumed frequency-independentmaterial properties. Layer3 was positioned 50 mm from the patch, i.e. the thicknessof Layer2 was 50 mm.
SEMCAD X
The initial design created with Ansoft Designer was further investigated using SEM-CAD X v11.084, a commercial finite-difference time-domain (FDTD)89 based pro-gram. For the FDTD algorithm, the entire computational domain must be dividedinto voxels, i.e. small brick-shaped elements. As SEMCAD X supports a variable gridstepping, grid refinements at small structures can be used to increase the accuracyof the model while retaining acceptable computational times.The single-patch set-up in SEMCAD X is an implementation of the set-up of Fig-ure 5.1. The combination of connector and connected coaxial cable was modelledusing an 8 cm coax with the dimensions of the connector: central conductor (PEC,diameter=3mm) teflon dielectric (ǫr=2.08, σeff=0.46 mS/m). Because modelling ofthis connection had a considerable impact on the results, we used the most accuratemodel. Four voltage sources were positioned in the coax, each in a different quad-rant, 4 cm beneath the ground plane. These sources were excited with a Gaussianpulse modulated with a 433 MHz sinusoid containing frequencies between 350 and500 MHz. The resulting E-field pattern in the coax was investigated to ensure thatthe correct mode was propagating towards the patch. An infinite water environmentwas modelled by using four or eight layers of Berenger’s Perfect Matched Layers(PML)89 as Absorbing Boundary Conditions (ABC). To extract the energy propa-gating away from the antenna, eight layers of PML were used at the truncation ofthe coaxial cable. The size of the computational domain was 20 cm x 20 cm x 22 cm(length x width x height), i.e. the distance from the patch to the ABC was alwaysmore than 8.8 cm (> λwater). The set-up was modelled with gridsteps from 3.2 mmdown to 0.06 mm. Refinement down to 0.06 mm at the patch and feed proved neces-sary because the model appeared quite sensitive to accurate modelling of the coaxialcable. Further the grid-steps at the patch were always smaller than 0.5 mm. This

5.2 Materials and methods 69
resulted in a total amount of 3.6 million voxels. Voltages and currents were recordedin the coaxial cable at the location of the ground plane from which the S-parameterswere calculated. Transient simulations were terminated after ∼ 55ns when signalshad sufficiently decayed (< 0.01%), while for harmonic simulations (f=433 MHz) 10periods were simulated.As in Designer, the water of the waterbolus was modelled by using dielectric proper-ties of water at 25C and muscle (ǫr=57, σeff=0.8 S/m) at 433 MHz for all frequen-cies. The influence of a different waterbolus temperatures was investigated by usingdielectric properties of water between 20 and 30C11,88. Variations of the reflectioncoefficient due to patient distance was investigated by positioning the muscle layer(Figure 5.1) at various distances from the patch antenna. The dielectric propertiesof this layer were varied as well in addition to investigate the influence of differentpatients.
Multiple antenna set-up
To investigate the influence of neighbour antennas and the amount of cross-coupling,we created set-ups with two antennas that were always oriented in the same di-rection. Three arrangements of two antennas were investigated, i.e. horizontal (H-plane), diagonal and vertical (E-plane). The distance between the antennas wasalways 10 cm, since this is the worst-case distance of the anticipated twelve anten-nas on a 40 cm diameter ring75. The combined influence of a patient was investigatedby positioning a muscle layer at infinity (muscle layer absent), 10 cm or 5 cm for allarrangements. The set-ups were also used to determine the amount of cross-coupling(S12) between two neighbours. Hereto we recorded voltages and currents simultane-ously at both primary and secondary antenna to be able to calculate S11 and S12
parameters.
5.2.4 Clinical antenna set-up: measurements and simulation
In previous publications72,75 we have shown that the optimum set-up for an H&Nhyperthermia applicator is a circular array (diameter=40 cm) of two rings of sixantennas (spacing between rings=6 cm). We constructed such a set-up to measurethe reflection characteristics of the patch antenna design within the applicator, andas such validate our theoretical analysis. Figure 5.3 shows the measurement set-up, which consisted of a PEC cylindrical backplane (diameter=40 cm, height=15cm) that formed the groundplane of the patch design. To decrease the influenceof a water-air transition, this cylinder was positioned on top of an absorbing flatmuscle phantom, which was filled with demineralized water (25C) to model thewaterbolus. A cylinder (diameter=88 mm) filled with a 10g/l saline solution wasused to model the patient. The theoretical patch design was adapted somewhatto increase its robustness under clinical conditions. In particular, we added a low-dielectric support which was only 10 mm in the x-direction and was positioned

70 Design of the patch antenna
Figure 5.3: Picture of the measurement set-up with twelve antennas at staggeredlocations in two rings75. Further visible are 1) the centrally placedbottle containing saline water, 2) the gauze that forms the conduct-ing backplane (limitedly visible) and separate conducting backplanesper antenna and 3) the flat muscle phantom on which the antena ringis positioned. The reflection characteristics of the lower six antennaswere measured for validation of the model.
centrally under the patch to avoid influences on radiation pattern and reflectioncoefficient. By simulations we found that a support that is both centrally placedand sufficiently small has a negligible influence on the resonance frequency. For themeasurements we used the six antennas of the lower ring (4.5 cm above the flatmuscle phantom), since these are affected the least by the water-air transition that1) in practice is further away due to bulging of the waterbolus and 2) decreasesthe reproducibility and predictability of the set-up. Reflection measurements wereperformed using a 8751A network analyzer (Agilent Technologies, USA). As a resultof these measurements, the lengths of the patches were adapted one final time.
Figure 5.4 shows the corresponding solid model implementation for one antennaof the measurement set-up in SEMCAD X. By using the model settings describedearlier, a model that consisted of 6 million cells was obtained, and total simulationtime was 25 hours using a special hardware accelerator (aXware84). Due to memorylimitations, we modelled only one antenna.

5.3 Results 71
Figure 5.4: Solid model in SEMCAD X of the measurement set-up.
5.3 Results
5.3.1 Antenna design
Using Designer we found that a resonant antenna was obtained only at heights(h: substrate thickness) over 5 mm and lengths much smaller than λwater/2. Us-ing Designer’s gradient optimizer, we optimized the patch dimensions for substratethicknesses between 5 and 10 mm. The optimization procedure provided best re-sults for set-ups with patch heights between approximately 8 and 9 mm. However,all minimum reflection values were well beneath -20dB, and the -15dB bandwidthwas ∼ 28 MHz (6.5%), and thus sufficient for our purposes. The influence of thepresence of a muscle layer (Figure 5.2: ”Layer3”) at a minimum distance of 4 cmfrom the antenna’s groundplane was found to be negligible, i.e. it resulted in thesame optimal dimensions as in the optimization without the muscle layer. We choseto continue our investigations using a set-up of: L=27.8 mm, W=10 mm, h=9 mm,xf=1.75 mm.

72 Design of the patch antenna
400 410 420 430 440 450 460 470−60
−50
−40
−30
−20
−10
0
Frequency (MHz)
|S11
| (dB
)
Height: optimized length
h=5, L=31.2, W=10 (BW=16MHz)h=6, L=29.9, W=10 (BW=17MHz)h=7, L=28.7, W=10 (BW=18MHz)h=8, L=27.5, W=10 (BW=18MHz)h=9, L=26.4, W=10 (BW=16MHz)h=10, L=25.4, W=10 (BW=16MHz)
Figure 5.5: Reflection characteristics calculated with SEMCAD X for variouspatch heights and optimized lengths.
SEMCAD X
When implementing the Ansoft Designer (2D-model) optimized set-up (h=9 mm)in SEMCAD X v10.0 (3D-model), we found that Designer overestimated the per-formance in terms of reflection characteristics. Using SEMCAD X, we fine-tunedthe set-up for better reflection characteristics. Hereto we investigated set-ups withheights around h=9 mm, and scaled the lengths L of these set-ups to find a resonantantenna at 433 MHz (W=10 mm, xf=1.75 mm). The results of this optimizationare shown in Figure 5.5. Here, we selected the set-up with h=7 mm as optimum,since this yielded the highest bandwidth (18 MHz=4.2%).Subsequently, we analyzed the sensitivity of the design to its design parameters.This is useful in assessing the influence of construction errors and for selecting thebest dimension for fine-tuning the clinical antenna. Figure 5.6 shows the sensitiv-ity of the selection to all four design parameters. This figure shows that variationsin height and length are of great importance: the resonance frequency changes ina rather linear fashion by approximately 12 MHz/mm (length) and 15 MHz/mm(height). Small realistic errors in the location of the feed had little influence. Chang-ing the width only scaled the real part of the antenna’s impedance, i.e. the resonancefrequency remained unchanged. Therefore, we could further improve the design byusing the width that corresponded with a real part of the impedance closest to 50Ωat 433 MHz. The final theoretical design was thus set at L=28.7 mm, W=8 mm,h=7 mm, xf=1.75 mm.
The electric field for this optimized set-up without (”all water”) or with (”muscle
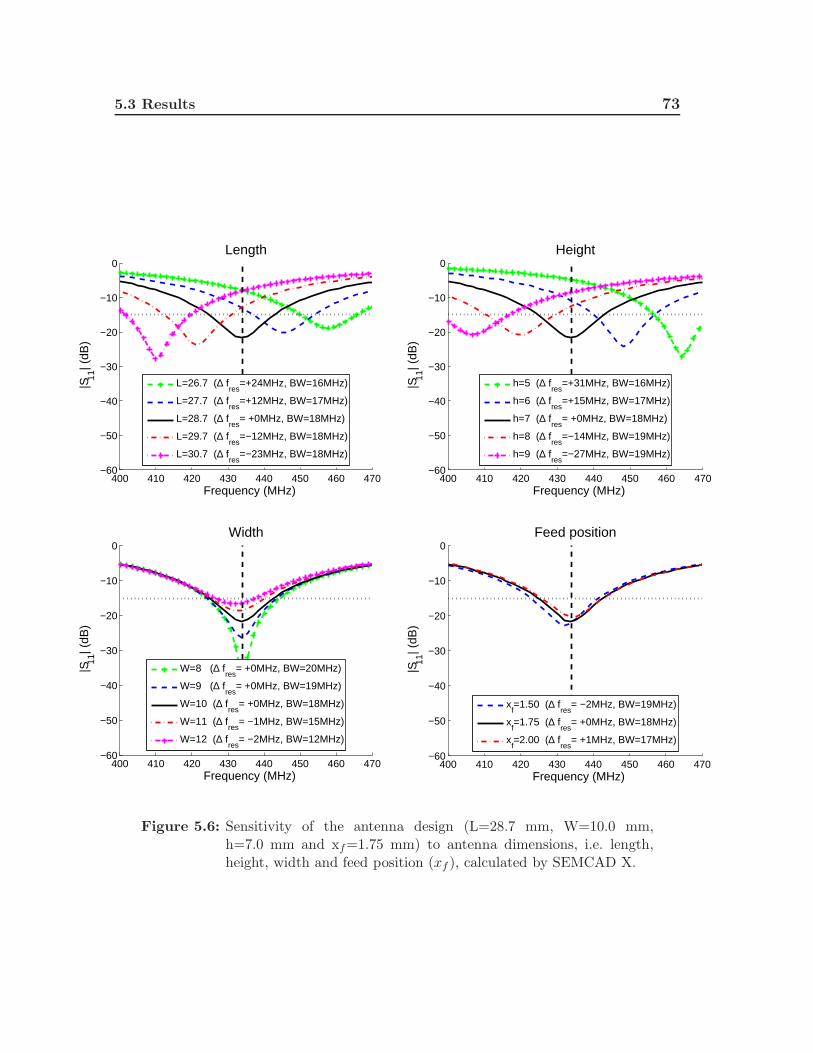
5.3 Results 73
400 410 420 430 440 450 460 470−60
−50
−40
−30
−20
−10
0
Frequency (MHz)
|S11
| (dB
)
Length
L=26.7 (∆ fres
=+24MHz, BW=16MHz)
L=27.7 (∆ fres
=+12MHz, BW=17MHz)
L=28.7 (∆ fres
= +0MHz, BW=18MHz)
L=29.7 (∆ fres
=−12MHz, BW=18MHz)
L=30.7 (∆ fres
=−23MHz, BW=18MHz)
400 410 420 430 440 450 460 470−60
−50
−40
−30
−20
−10
0
Frequency (MHz)
|S11
| (dB
)
Height
h=5 (∆ fres
=+31MHz, BW=16MHz)
h=6 (∆ fres
=+15MHz, BW=17MHz)
h=7 (∆ fres
= +0MHz, BW=18MHz)
h=8 (∆ fres
=−14MHz, BW=19MHz)
h=9 (∆ fres
=−27MHz, BW=19MHz)
400 410 420 430 440 450 460 470−60
−50
−40
−30
−20
−10
0
Frequency (MHz)
|S11
| (dB
)
Width
W=8 (∆ fres
= +0MHz, BW=20MHz)
W=9 (∆ fres
= +0MHz, BW=19MHz)
W=10 (∆ fres
= +0MHz, BW=18MHz)
W=11 (∆ fres
= −1MHz, BW=15MHz)
W=12 (∆ fres
= −2MHz, BW=12MHz)
400 410 420 430 440 450 460 470−60
−50
−40
−30
−20
−10
0
Frequency (MHz)
|S11
| (dB
)
Feed position
xf=1.50 (∆ f
res= −2MHz, BW=19MHz)
xf=1.75 (∆ f
res= +0MHz, BW=18MHz)
xf=2.00 (∆ f
res= +1MHz, BW=17MHz)
Figure 5.6: Sensitivity of the antenna design (L=28.7 mm, W=10.0 mm,h=7.0 mm and xf=1.75 mm) to antenna dimensions, i.e. length,height, width and feed position (xf ), calculated by SEMCAD X.

74 Design of the patch antenna
x (cm)
z (c
m)
a) |Etot
| (dB): all water
−5 0 50
5
10
15
−60
−40
−20
0
x (cm)
z (c
m)
b) |Ex| / |E
tot| (%): all water
−5 0 50
5
10
15
20
40
60
80
100
muscle
x (cm)
z (c
m)
c) |Etot
| (dB): muscle at 4cm
−5 0 50
5
10
15
−60
−40
−20
0
muscle
x (cm)
z (c
m)
d) |Ex| / |E
tot| (%): muscle at 4cm
−5 0 50
5
10
15
20
40
60
80
100
Figure 5.7: Rms value of the electric field (a, c) and respective amount of co-polarization (b, d) corresponding to a patch in water without (a, b)or with (c, d) a muscle layer. Cross-sections through y=0 are shownand the water-muscle transition is indicated by a white dotted line.
at 4 cm”) a patient is shown in Figure 5.7. In this figure we visualize the rms valueof the electric field and the amount of co-polarization, both with and without apatient. The figures show that the electric field decay is faster in muscle (a, c). Theamount of co-polarization, however, is high (-5 cm < x < 5 cm : >80%) for boththe set-ups investigated (b, d).
5.3.2 Characteristics of the design under clinical conditions
To assess the performance of the design under clinical conditions, we theoreticallyanalyzed its reflection characteristics for 1) waterbolus temperature changes, 2) thepresence of a patient, and 3) the presence of a neighbour antenna. Figure 5.8 showsthe reflection curves corresponding to water temperatures between 15C and 35C.For increasing temperatures, these curves show that the shape of the reflectioncurve remains intact, but that the increase in resonance frequency was linear at
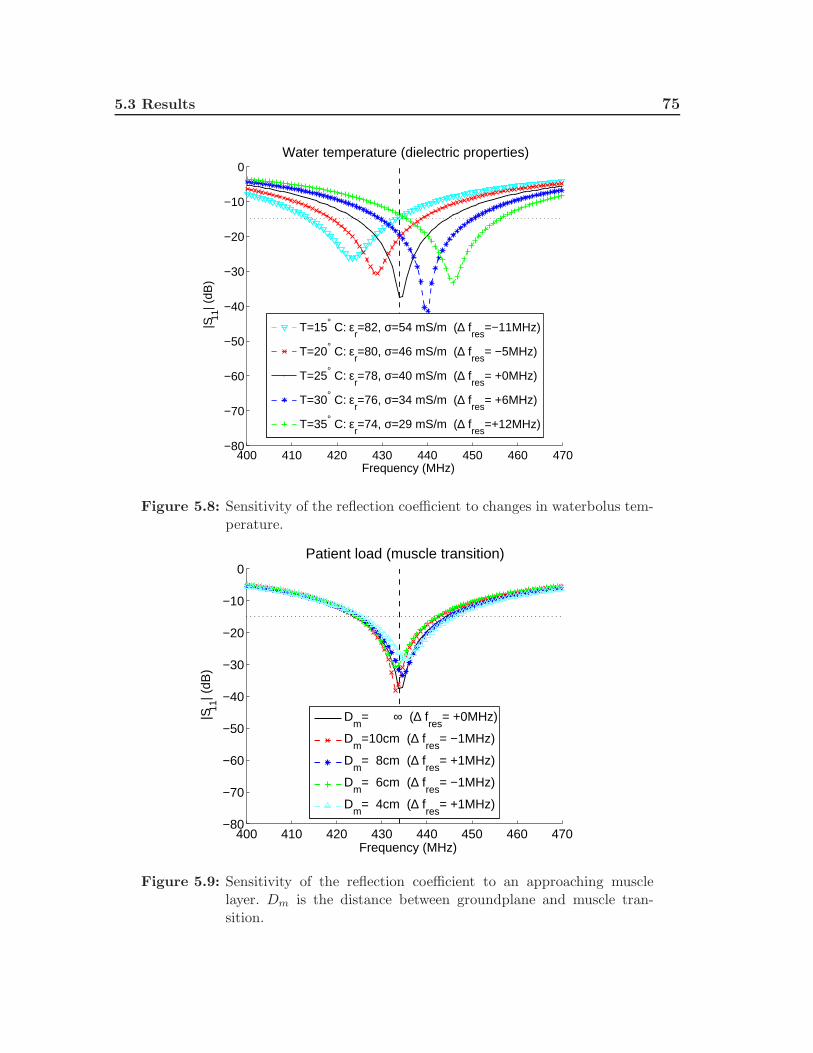
5.3 Results 75
400 410 420 430 440 450 460 470−80
−70
−60
−50
−40
−30
−20
−10
0
Frequency (MHz)
|S11
| (dB
)
Water temperature (dielectric properties)
T=15° C: εr=82, σ=54 mS/m (∆ f
res=−11MHz)
T=20° C: εr=80, σ=46 mS/m (∆ f
res= −5MHz)
T=25° C: εr=78, σ=40 mS/m (∆ f
res= +0MHz)
T=30° C: εr=76, σ=34 mS/m (∆ f
res= +6MHz)
T=35° C: εr=74, σ=29 mS/m (∆ f
res=+12MHz)
Figure 5.8: Sensitivity of the reflection coefficient to changes in waterbolus tem-perature.
400 410 420 430 440 450 460 470−80
−70
−60
−50
−40
−30
−20
−10
0
Frequency (MHz)
|S11
| (dB
)
Patient load (muscle transition)
Dm
= ∞ (∆ fres
= +0MHz)
Dm
=10cm (∆ fres
= −1MHz)
Dm
= 8cm (∆ fres
= +1MHz)
Dm
= 6cm (∆ fres
= −1MHz)
Dm
= 4cm (∆ fres
= +1MHz)
Figure 5.9: Sensitivity of the reflection coefficient to an approaching musclelayer. Dm is the distance between groundplane and muscle tran-sition.

76 Design of the patch antenna
around 1 MHz/C. Figure 5.9 shows the reflection curves corresponding to de-creasing patient-antenna distances, i.e. decreasing muscle-layer heights. Differentpatient-antenna distances (Dm > 4 cm) showed little influence, i.e. an almost sta-ble (<1 MHz) reflection pattern. An extreme (50%) decrease and increase of thedielectric properties of the muscle layer (Dm = 5 cm) resulted only in a very smalladditional alteration of maximum 1 MHz in resonance frequency. The combined in-fluence of a patient and a neighbour antenna was investigated for three set-ups: 1)without a muscle-layer, 2) with a muscle-layer at 10 cm, and 3) with a muscle-layerat 5 cm. The predictions show 1 MHz maximum, uncorrelated, differences in res-onance frequency with respect to the reference situation: a set-up with no musclelayer and no neighbour antenna. All orientations (vertical, horizontal and diagonal)and all muscle distances (∞, 10 cm and 5 cm) show little cross-coupling betweenneighbours: S21 < -27dB.
5.3.3 Clinical antenna set-up: measurements and simulation
400 410 420 430 440 450 460 470−25
−20
−15
−10
−5
0
Frequency (MHz)
|S11
| (dB
)
Simulation (εr = 78)
Simulation (εr = 77)
Measurement (mean of 6 antennas)
Figure 5.10: Mean of reflection measurements of 6 patches in the applicator ringand corresponding FDTD simulation results for two values for thepermittivity of the water in the waterbolus.
Utilizing measurements of patch antennas in the applicator set-up (see Figure 5.4),we made a final amendment to the theoretical design, i.e. we reduced the length:L=28.2 mm, W=8 mm, h=7 mm, xf=1.75 mm. Figure 5.10 shows the curves of theaverage measured reflection characteristics of six of such patch antennas, while thewater temperature was 24.8C. The figure indicates that, on average, the patches had

5.4 Discussion and conclusions 77
the following characteristics: S11(433 MHz)=-21dB and BW=18.5 MHz (4.3%). Thisfigure also shows a good agreement between simulated values and measurements. Forthese calculations we used as permittivity both ǫr=78 and ǫr=77, to illustrate theslight better agreement at this lower value. The figure also shows that the modelcan be used to predict the location of the resonance frequency with reasonableaccuracy but the predicted bandwidth is somewhat lower (BW=17.1 MHz). Sincethe depth of the peak depends on the conductivity of the water, this might explainthe discrepancy in depth of the resonance peak remaining (∼4dB). We expect that,in the more predictable flat set-up that we used for the analysis, differences will beeven less than in this applicator set-up with its more cavity-like behaviour.
5.4 Discussion and conclusions
In this study we have designed a patch antenna and when we examine its char-acteristics against the design criteria formulated at the start, we can draw thefollowing conclusions: 1) the patch antenna design has a high amount (>80%) ofco-polarization in broadside direction, 2) while the dependence of the resonancefrequency is linearly dependent on the temperature, it can be chosen to allow water-bolus temperatures between 15 and 35C, 3) the influence of a patient at a distanceas close as 4 cm from the groundplane is a maximum resonance frequency shift of1 MHz, 4) cross-coupling with neighbour-antennas in all investigated realistic set-ups was predicted to be lower than -27dB. Although these low cross-coupling valuesindicate that it will be of no concern in the clinical applicator, this aspect will beinvestigated further; we are specifically interested in the combined cross-couplingwhen all twelve antennas are operating coherently.
A clinical version of the patch antenna was constructed, and modifications weremade for better mechanical robustness and to conform it within an array of anten-nas. The simulations of the theoretical set-up were validated by performing mea-surements with six of these patch antennas. These measurements show a very goodagreement for the resonance frequencies obtained, and a good agreement for theobtained bandwidths. We found that the length of the patch antenna for resonancein an infinite water halfspace (Lres=28.7 mm) could be slightly reduced for resonantbehaviour within the applicator (Lres=28.2 mm). The situation in the applicatordiffers from the theoretical situation because 1) the groundplane was curved, 2) alow-permittivity support was added for stability, and 3) the patch was placed in thewaterbolus, which acts to some extent as a cylindrical resonant cavity. Although thecontribution of each effect to this decrease in required length is unclear to us, theadapted patch length was accurately predicted by SEMCAD X. We further foundthat the bandwidth obtained with the infinite layered set-up (20 MHz, 4.6%) is some-what larger than that in the applicator set-up, i.e. simulation: 17.1 MHz (3.9%) andmeasurement: 18.5 MHz (4.3%). This -15dB bandwidth is similar compared to aprobe-fed patch design radiating into air as reported by Garg et al.27.

78 Design of the patch antenna
For simulations throughout this paper, we used properties of muscle and waterat 433 MHz for all frequencies. Theoretically, in our entire frequency range (400-470 MHz), the variation in permittivity values is small: -0.01% for demineralizedwater88 and -0.9% for muscle26. The variation in conductivity, however, is muchgreater: +28% for demineralized water88 and +2.3% for muscle26. On the basis ofour own measurements with saline water (unpublished data), we know that theconductivity of the water has an effect on the depth of the S11 curve of a patchantenna, i.e. increasing conductivity leads to a flatter curve, but not on the resonancefrequency. By comparing the measurements with the simulations (Figure 5.10), wealso show that the main difference is indeed the depth of the resonance peak, butthat the estimation of the resonance frequency is fairly accurate (∆fres ∼ 2 MHz).We have investigated the application of a probe-fed patch antenna design in aphased-array H&N hyperthermia applicator. If we convert the results of our anal-ysis to the situation for DHT, this design has several advantages over the designscurrently used. The main advantage of this design is the direct feeding with a coax-ial cable, i.e. no matching circuit is required. As we explained before, this leads toeasier and more accurate modelling, and also to greater robustness and higher effi-ciency. A main drawback of the design for a more broadband application (multiplefrequencies) is its relatively small bandwidth. However, in this application this isnot a problem, as we use only a single frequency.
Acknowledgements
This work is supported by the Maurits en Anna de Kock foundation and the DutchCancer Society, grant DDHK 2003-2855. The authors further would like to thankThomas Bertuch and Hans Strijbos for their help on the initial patch antenna design.

CHAPTER 6
Experimental SAR verification with a laboratory prototype
This chapter is based on:M.M. Paulides, J.F. Bakker, G.C. van Rhoon. “An electromagnetic head and neckhyperthermia applicator: experimental phantom verification and FDTD model.” Int.J. Rad. Oncol. Biol. Phys. 2007; 68: 612620.

80 Experimental SAR verification with a laboratory prototype
Abstract
Purpose Experimental verification of the feasibility of focussed heating in the
neck region by an array of two rings of six electromagnetic antennas. We fur-
ther measured the dynamic specific absorption rate (SAR) steering possibilities
of this set-up and compared these SAR patterns to simulations. Materials
and methods: By a specially constructed laboratory prototype head and
neck applicator, including a neck mimicking cylindrical muscle phantom, we
performed SAR measurements by electric-field Schottky-diode sheet measure-
ments and, using the power-pulse technique, by fiberoptic thermometry and
infra-red (IR) thermography. Using phase-steering, we also steered the SAR
distribution in radial and axial directions. All measured distributions where
compared to predictions by a finite-difference time-domain (FDTD)-based
electromagnetic simulator. Results: A central 50% iso-SAR focus of 35 mm
(±3 mm) in diameter and around 100 mm (±15 mm) in length are obtained
for all investigated settings. Further, this SAR focus can be steered towards the
desired location in radial and axial direction with an accuracy of ∼5 mm. SAR
distributions as measured by all three experimental methods are well predicted
by the simulations. Conclusions: We conclude that focussed heating in the
neck is feasible and that this focus can effectively be steered in both radial
and axial direction. For quality assurance (QA) measurements we conclude
that the Schottky-diode sheet provides the best compromise between effort,
speed and accuracy, although a more specific and improved design is warranted.
6.1 Introduction
Loco-regional control of advanced carcinomas in the head and neck (H&N) regionstill poses a major therapeutic challenge20,79 and treatment related toxicity remainsa major issue in this region90. Combining hyperthermia (HT) with the current treat-ment modalities has a high potential to increase treatment outcome without increas-ing toxicity39. Recent phase III trials have shown the benefit of the addition of HTto current treatment modalities for various tumour sites10,44,99. Valdagni et al.94,95
have demonstrated that with a non-site-specific HT-applicator already a significantincrease in local control (from 24% for radiotherapy (RT) alone versus 69% for RTplus HT) is achieved for metastatic lymph nodes in stage IV carcinoma of the H&N.Extension of the hyperthermia application to deeper located tumours is cumbersomewith the available applicators and therefore requires a specific designed applicatorthat is also expected to contribute to a better treatment quality for this site87,107.In recent years, we have investigated the ability of a multi-element circumferentialH&N HT applicator to deposit radiofrequency (RF) energy selectively in the centerof the neck72. Suitable frequencies were shown to be in the frequency band between

6.2 Materials and methods 81
300 and 600 MHz for all realistic target sizes therefore we selected 433 MHz∗ as op-erating frequency. Further, we found that eight antenna elements provide sufficientfocussing for selective heating. Building on these findings, we analyzed the influencesof the anatomy on the SAR pattern73. In this study we found that the SAR patternsin a homogeneous muscle cylinder are predictive for the SAR pattern in inhomoge-neous neck structures. Therefore muscle phantom measurements will be predictivefor the SAR pattern that can be obtained in the middle of the neck. Due to thespine, the central SAR focus changes from a circular to a more donut shape but thecentral focus remains at its central position. Subsequently, research was conductedinto possibilities of further improving the power absorption pattern by going fromone to two or three antenna rings75, which provides also axial steering possibilities.We established that heating at depth is highly correlated with the number of anten-nas arranged in multiple rings. Multiple rings enable steering in the direction of thepatient axis, which is well validated for deep hyperthermia77,83 but needs confirma-tion for the head and neck application. This work resulted in a final set-up design: aset-up with two rings of six antennas each operating at 433 MHz. As radiators, weselected a patch antenna set-up that is simple, low-cost, efficient and small and wedesigned it specific for the head and neck applicator76. Another major advantageof this antenna design is that no matching network is required, which facilitatesa better control of the input parameters of the set-up and hence provides betterpossibilities to create a representative model. Subsequently, the latter improves thereliability and accuracy of numerical predictions.The aim of the present study was to experimentally verify the feasibility of focussedheating in the head and neck region using an array of two rings of six antennas by thesplit-phantom technique. Simultaneously, we established the accuracy of the predic-tions of our electromagnetic simulation model. Finally, we explored the dynamic SARsteering behavior of the antenna array. Hereto we constructed a laboratory proto-type applicator consisting of twelve patch antenna elements and a muscle-equivalentneck phantom. We performed measurements with this set-up and compared themto predicted SAR patterns.
6.2 Materials and methods
6.2.1 Prototype design
Figure 6.1 shows a picture of the bottom half of the prototype applicator and Fig-ure 6.2 visualizes an exploded view of its two parts. These parts can be separated toallow 2D IR measurements or positioning of measurement devices: glass fiber probesor electric (E)-field Schottky-diode sheet. Both parts of the applicator consist of asemi-circular PVC backplane (diameter = 30 cm, length = 60 cm: Figure 6.3) andPVC shields at both ends. Both half backplanes are covered, waterproof, with a
∗433 MHz is an ISM frequency: a frequency available for Industry Science and Medicine

82 Experimental SAR verification with a laboratory prototype
50µm thick ABS copolymer sheet that is glued on a frame that can be mounted onthe backplanes (see Figure 6.2). Twelve antenna elements are mounted on the PVCbackplanes in a 2x6 arrangement75, i.e. two rings (distance = 8 cm, ring-radius =30 cm: see Figure 6.3) of six equally spaced patch antennas. We defined the ori-gin of the applicator between the rings so the antennas in these rings are located atz = -4 cm and z = 4 cm. The water in the prototype was circulated and temperaturecontrolled by two E4850 refrigerated recirculators (Bio-Rad, Microscience Division).
Every patch antenna76 consists of a, resonant, 2mm-thick brass patch (width =12 mm, length = 25 mm) that is asymmetrically (the distance from the rod to theside of the patch is 0.5 mm) mounted on the extending conducting rod of a C-femalereceptacle connector. Coaxial cables are used to transfer the 433.92 MHz signalfrom PG70.150.2 power generators (SSB Electronic, Germany) to the applicator.The conducting backplane required for the patch antenna design is formed by softcopper tape (thickness: 35 µm + 25 µm adhesive) that covers the inner side of bothPVC backplanes (see Figure 6.1).
Two PVC semi-cylinders (muscle cylinder diameter = 11.6 cm, PVC thickness =1.5 mm) † filled with muscle equivalent material, representing the neck of a patient,are positioned at the center of the prototype. The muscle-equivalent material wascreated using a recipe described by Ito et al.40 and had properties in accordancewith Gabriel et al.26 (see Table 6.1).
Figure 6.1: Picture of the bottom half of the prototype with the sheet and itsframe excluded. Visible are the copper tape that covers the back-plane, one half of the muscle phantom and multiple patch antennas
†The dimensions of the phantom approximately equal an average neck73

6.2 Materials and methods 83
Array 2
Array 2Water outflow
Water outflow
Water inflow
Water inflow
Array 1
Array 1
Phantom
E-field direction
zy
x
Figure 6.2: Exploded view of the prototype that is constructed in two parts formeasurements (T-probes, E-field sheet, IR pictures). Visible are thephantom semi-cylinders (pink/light grey), the two frames spanningthe sheet, the PVC backplanes (dark grey) and the copper tape onthe inside of the backplanes (light grey).
6.2.2 EM modelling
We predicted the SAR distributions in the prototype applicator using SEMCAD84.SEMCAD has a FDTD kernel that can be used for dosimetric simulations. It in-cludes a solid modeling kernel in which we created a full 3-D model using the exactdimensions of the applicator prototype and muscle phantom. The sheets between thesemi-cylinders could be neglected for calculations since they were very thin. Further,instead of modeling the complete connector and the transmission line, we used thecommonly accepted approach to apply a voltage source at the gap between the con-ducting backplane and the rod of the patch antenna81, which provides accurate fielddistributions15. This solid model was converted automatically into a grid implemen-tation with maximum gridsteps of λ/15 and grid refinements at the locations of theantennas (λ/250 < ∆ < λ/80), i.e. a total of ∼5 million cells. The grid refinementsat the antennas were required to accurately model the (important) small dimensionsof the antenna and the non-orthogonal placement in the grid, at the location of thefeeding rod. Table 6.1 lists the properties of all the materials used in the simulation.Properties of demineralized water (salinity = 0.04 g/l, T = 25C) were found in apublication of Stogryn88. We exited the voltage sources at all gaps at 433 MHz andsteady state was obtained after 10 periods (1% variation).
6.2.3 Measurements
Three SAR pattern measurement methods were used because they all have theirown features: their major strengths are either accuracy (fiberoptic thermometry),

84 Experimental SAR verification with a laboratory prototype
Ring 2
E-field sheet 1 E-field sheet 2
Ring 1
z
x60 cm
30 c
m
11.6
cm
(a)
z=0
W50%
L50%
x=0
z
x
(b)
Figure 6.3: Cross-section through the prototype at y = 0 cm with a SAR distri-bution obtained from two IR pictures (before and after heating) forcentral settings (a) and a zoomed version of this SAR distribution(b). In (a), the location of the Schottky diodes (E-field sheet 1 and2) is indicated by the black rectangles and the boundaries of thesheets by the dotted lines. Further, the location of the antenna ringsand the main dimensions of prototype and phantom are indicated.T-probe measurements are taken at locations on the lines indicatedby ”x=0” and ”z=0”. In (b) the colorscale is from black (0%) towhite (100%) and the length (L50%) and width (W50%) of the focus,i.e. the 50% iso-SAR contour, are indicated.

6.2 Materials and methods 85
Table 6.1: Properties of the materials at 433 MHz
Material ρ (kg/m3) ǫr (-) σeff (S/m)
Muscle phantom 900 56 0.8PVC 1350 2.2 0.004Demineralized water 1000 78 0.04
resolution (IR thermography) or speed (E-field Schottky diode sheet). These mea-surement methods and their results were compared to establish the optimum methodfor quality assurance. Waterbolus temperatures where chosen such that mean tem-peratures in the prototype were around 22C, at which the phantom properties arereported, i.e. the waterbolus temperatures was 18-19C for the power-pulse mea-surements (T-probes and IR) and 22C for the E-field measurements. Figure 6.3shows a cross-section through the applicator at y = 0 cm and a zoomed version ofthe SAR distribution obtained by taking IR pictures before and after heating.
Fiberoptic thermometry
Temperatures were measured with 24 Takaoka FTP1 standard sensor probes (ac-curacy = 0.1C, precision = 0.1C), which are read with a Takaoka FT1310 fiberthermometer (Takaoka Electric MFG Co. Ltd., Japan) with a refresh rate of 3s.These non-metallic probes were positioned at the main axes between both halvesof the prototype. The local SAR was measured using the power pulse method: thechange of temperature (3-10C) in a phantom is measured while applying a highpower (300-600W) for a short time (90-300s) at the antennas of the applicator82
(see Figure 6.5). To reduce influences of heat conductivity a short heating time isrequired, therefore we used a high power to obtain accurately measurable tempera-ture changes. The local SAR is calculated from the temperature rise via:
SAR(x, y = 0, z) = c ·∆T (x, y = 0, z)
∆t, (6.1)
where c is the specific heat capacity of the muscle phantom material (3.63 kJ kg−1
K−1), ∆T is the local temperature rise [K] and ∆t is the corresponding heating time[s]. We assumed no electric field disturbing effect of the fiber probes.
IR thermography
We used IR thermography to visualize the temperature (rise) pattern at a highresolution (320x236 pixels). Pixel size was determined by taking an IR picture ofa hot object with known dimensions: for our set-up the dimensions were 0.5x0.5mm2. After application of power, the top half was removed and IR pictures weretaken using a TVS-600 infrared camera (Nippon Avionics Co. Ltd., Japan) that was

86 Experimental SAR verification with a laboratory prototype
mounted on a solid framework. From the IR picture before and after heating wecalculated the SAR pattern using equation 6.1. The inevitable time between end ofheating and first IR picture was kept as short as possible (typically ∼ 10s) in anattempt to reduce influences of heat conduction.
E-field Schottky-diode sheet
For fast measurements, which also enables studying the prototypes dynamic behav-ior, we performed SAR measurements also with the E-field Schottky diode sheet,that is described in Kaatee et al.46 and Van Rhoon et al.104. Hereto, two diode sheetswere positioned between both halves of the prototype (Figure 6.3). To avoid a de-crease in sensitivity caused by overlapping sheets at the location of the diodes105, weused a distance between both sheets such that one row of measurement points wasabsent. SAR values can be calculated from the amplitude of the measured E-fieldvalues, using the effective conductivity (σeff) and mass-density (ρ), according to:
SAR(x, y = 0, z) = σeff ·|E(x, y = 0, z)|2
2ρ. (6.2)
The E-field sheet directly measures real-time the axial (z) component of the E-field.Also, variations in dielectric properties of the phantom materials are much lowerbecause measurements can be performed at low power (120W). Further, no manip-ulation of the set-up is required for multiple measurements, i.e. all distributions canbe measured using one single disposition of the experimental set-up. Without cali-bration the accuracy of the sheets is 6%104, however when airgaps are present closeto the diodes this accuracy is reduced due to lower sensitivity. A main disadvantageof the current design of the sheet is its poor spatial resolution for measurements at433 MHz, i.e. the distance between two diodes is 2.5 cm (∼ λ/4).
Measurement procedures and phase settings
As a first step we measured impedance characteristics of the antennas using an 8751Anetwork analyzer (Agilent Technologies, USA) to verify that they were sufficientlyresonant. As a side step we also assessed the amount of cross-coupling using thenetwork analyzer. Fiberoptic and IR measurements were conducted simultaneously.Hereto we positioned an IR camera above the prototype and positioned the probesbetween both halves of the prototype. High power was applied and simultaneouslywe measured temperatures with the fiber probes (see Figure 6.5). After the requiredmaximum temperature change was obtained, we opened the applicator and took IRpictures. We used a cooling time of typically 2 hours between subsequent measure-ments to obtain a homogeneous thermal distribution. E-field sheet measurementswere performed separately at low power to avoid variations in dielectric propertiesof the phantom due to temperature differences. To check for measurement errors,

6.3 Results 87
all measurements were conducted multiple times in a time period of a year and themuscle phantom was newly constructed two times.
To obtain a central focus for each antenna (i) on each ring (j) we used centralpower (P ) and phase (ϕ) settings (Pj,i = 25 W and ϕj,i = 0). Subsequently, weinvestigated the possibilities of SAR steering in radial and axial direction by using aphase-steering method in analogy to the method that is used in the BSD2000 Sigma-60 system1 92. For each antenna, we analytically calculated the required phase delays(ϕi,j), using the difference in wave velocity in muscle and water, such that maximuminterference occurs at the desired Target Center Point (TCP). For this analyticalmodel we assumed a muscle cylinder (radius is 5.8 cm) and two circumferentialarrays (radius = 14.15 cm) of six point sources at z = -4 cm and z = +4 cm andwe neglected the PVC phantom-shell.
6.3 Results
6.3.1 Reflection and cross-coupling
After one year, reflection coefficients had increased due to degradation (oxidation) ofthe set-up (mainly the copper tape of the groundplane). Figure 6.4 shows the typicalreflection coefficients of all antennas in the array at 23C and 25C halfway duringour measurement period. This figure clearly shows that the reflection coefficient isinfluenced by the temperature of the water in the waterbolus. For both temperaturesthese reflection coefficients are all beneath -10dB (∼6% reflection on average) soefficiency of the antennas was sufficient for the purposes of our measurements. For theclinical applicator, however, we constructed a redesign that has somewhat improvedreflection characteristics76. For this qualitative analysis we neglected the influencesof the variations in efficiency (∼6%) for the antennas of the prototype. We furtherfound low cross-coupling between the antennas: maximum -22dB (0.6%) and onaverage -27dB (0.2%). The lowest values where obtained for neighboring antennaswhile the highest values where found for antenna pairs with around one quadrantinner antenna spacing. This effect is related to the radiation pattern of the antennascombined with the distance through a lossy medium.
6.3.2 SAR tracks
Figure 6.5 visualizes an example of the measured temperatures with the fiber probesand the corresponding measured powers and phases. It shows the length of thepower pulse and the corresponding temperature rise from which we calculated thelocal SAR values. In this example case, the upper halve of the prototype was re-moved approximately 160s after Power On and 10s later the IR picture was taken.The corrections by the control loop that are required to keep the power at theset value (25W) are clearly visible in the power curves. At the start of the power

88 Experimental SAR verification with a laboratory prototype
1_1 1_2 1_3 1_4 1_5 1_6 2_1 2_2 2_3 2_4 2_5 2_6−20
−18
−16
−14
−12
−10
−8
−6
−4
−2
0
Antenna
S11
(dB
)S
11 at 22.0°C
S11
at 25.0°C
Figure 6.4: Reflection coefficients at 433.92 MHz for each antenna of both arrays,e.g. 1 2 is the second antenna of the first antenna ring.
pulse, the phases were influenced somewhat by the increase in power level, but thesewere automatically adjusted. The figure also shows that two amplifiers were leakingsome power after power-off but this influence was relatively small (power-on: 300 Wvs power-off: ∼5 W leakage). We found an almost perfect correlation between themeasured temperatures and a linear fit, for all spatial locations (r2 = 1.0), so weconcluded that the influence of heat conduction on the SAR measurements wasnegligible.
Comparing measurements and simulation
Figure 6.6 shows SAR values as function of the x-coordinate for TCP-based x-steering, i.e. for x = -30 mm, x = 0 mm and x = +30 mm. Similarly, Figure 6.7 showsSAR values as function of the z-coordinate for TCP-based z-steering, i.e. for z = -50mm, z = -25 mm and z = 0 mm. For all IR thermography tracks we averaged over10 pixels (one pixel was 0.7x0.7 mm2) to reduce noise. The tracks were normalizedto their own maximum (IR thermography) or their own maximum of a spline-fitthrough the measurement points (T-probes and E-field sheet measurements). Forcentral steering this maximum was typically around 0.6 W/kg (normalized to 1 Wtotal input power). The desired focus point (TCP) is always indicated with thedashed line.
All measurements and predictions show that a central focus is obtained. As shown

6.3 Results 89
0 20 40 60 80 100 120 140 160 18016
18
20
22
24
26
Tpr
obes
(°C
)Focus at (0,0,0) IR Capture
0 20 40 60 80 100 120 140 160 1800
10
20
30
PF
orw (
W)
0 20 40 60 80 100 120 140 160 180−180
−90
0
90
180
Time after Power On (s)
Pha
se (
°)
Figure 6.5: Temperature (Tprobes) values and corresponding powers (PForw) andphases as function of time during an example powerpulse measure-ment. For the fiber probe temperature measurements (visualized indots) we created linear fits (solid lines) and calculated the local SARvalues from the slopes. IR pictures where captured before Power Onand after Power Off (shown in the figure).
by these figures, this focus can be changed in the radial (x) and axial (z) directions.Comparing the results of the three measurement methods, we found a good qualita-tive agreement. Comparison of the simulations to these measurements reveals goodagreement at central positions but discrepancies for more radial positions close tothe PVC phantom border. The reason for this difference may lie in: 1) wrong di-electric properties of muscle phantom (lower conductivity) or 2) air-gaps at the

90 Experimental SAR verification with a laboratory prototype
−60 −40 −20 0 20 40 600
0.25
0.5
0.75
1
(a) TCP = (−30,0,0)
−60 −40 −20 0 20 40 600
0.25
0.5
0.75
1
(b) TCP = (0,0,0)
Nor
mal
ized
SA
R (
W/k
g)
−60 −40 −20 0 20 40 600
0.25
0.5
0.75
1
(c) TCP = (+30,0,0)
x (mm)
Wat
erW
ater
FDTDT−probesIRE−sheet
Figure 6.6: Simulated (FDTD) and measured (T-probes, IR and E-field sheet)SAR values at y = 0 mm and z = 0 mm for steering in the x-direction. The measurement values of all tracks are normalized totheir own respective maximum value.

6.3 Results 91
−150 −100 −50 0 50 100 1500
0.25
0.5
0.75
1
(a) TCP = (0,0,0)
−150 −100 −50 0 50 100 1500
0.25
0.5
0.75
1
(b) TCP = (0,0,−25)
Nor
mal
ized
SA
R (
W/k
g)
−150 −100 −50 0 50 100 1500
0.25
0.5
0.75
1
(c) TCP = (0,0,−50)
z (mm)
FDTDT−probesIRE−sheet
Figure 6.7: Simulated (FDTD) and measured (T-probes, IR and E-field sheet)SAR values at x = 0 mm and y = 0 mm for steering in the z-direction. The measurement values of all tracks are normalized totheir own respective maximum value.

92 Experimental SAR verification with a laboratory prototype
connection between both halves of the set-up. In the axial direction, there is anunexpected small asymmetry in the FDTD results for central settings (Figure 7a),this is probably caused by the asymmetry in the feeding of the antennas76.
In radial direction, where the SAR patterns are the steepest, the IR thermographycurves show a somewhat flattened profile compared to the FDTD tracks. This flat-tening is caused by thermal conduction during opening of the two halves after powerapplication. After normalization this results in relatively higher values in the valleysof the curves because the maximum value is reduced. In axial direction this effectis less prominent because SAR curves are less steep. Further, the SAR values aredecreased by the circulated water of the waterbolus of a stable temperature.
Determination of the focus-size
Table 6.2: SAR steering (TCP setting (mm) and location of SARmax (mm)) andcorresponding focus-size (length L50% (mm) and width W50% (mm)of the 50% iso-SAR contour) parameters for the simulated (FDTD)and measured (IR thermography) tracks.
TCP setting Method SARmax L50% W50%
Central FDTD (0,–,-1) 103 35(0,0,0) IR (0,–,-5) 112 (+9%) 34 (-3%)X-steering FDTD (31,–,0) 96 39(+30,0,0) IR (32,–,0) 103 (+7%) 37 (-5%)Z-steering FDTD (0,–,-50) 82 37(0,0,-50) IR (0,–,-51) 87 (+6%) 38 (+3%)
Table 6.2 provides a summary of the most important parameters from Figure 6.6and Figure 6.7. This table shows the SAR steering and corresponding focus-sizeparameters for the simulated (FDTD) and measured (IR thermography) tracks.The simulated SAR distribution for central settings and the focus-size parameters(L50%, W50%) are visualized in Figure 6.3. For the experimental verification of thepredicted focus-size we used IR measurements due to its superior resolution andbecause its values correlated well with the T-probe measurements, which we assumeto be more accurate. Table 6.2 shows that, using the TCP based phases, the obtainedSAR focus can be steered towards the desired location with a reasonable accuracy,i.e. ∼5 mm. Further, it indicates that the corresponding focus-lengths (L50%) are inthe range of 87-112 mm and the focus-widths W50% are around 35 mm.

6.3 Results 93
−80 −60 −40 −20 0 20 40 60 80−75
−50
−25
0
25
50
75
(a) X steering
XTCP
(mm)
X(S
AR
max
) (m
m)
Wat
erW
ater
EFS(x,0,0)FDTD(x,0,0)
−80 −60 −40 −20 0 20 40 60 80−75
−50
−25
0
25
50
75
(b) Z steering
ZTCP
(mm)
Z(S
AR
max
) (m
m)
2 m
axim
a2 m
axima
EFS(0,0,z)FDTD(0,0,z)
Figure 6.8: Measured maximum SAR point as function of TCP for SAR-steeringin radial (a) and axial (b) directions. Locations of E-field sheet mea-surement points are indicated by the horizontal dotted lines and theunity curve by the diagonal dotted line. At z=-25 mm no E-fieldswere measured because of the design of the E-field sheets.
6.3.3 Dynamic SAR steering
We used measurements with the E-field sheet to investigate the dynamic steeringpossibilities of the focus since no cooling down period is required for this method.We measured the location of maximum SAR and correlated this position to the TCPsettings, which is visualized in Figure 6.8 (a,b). In this figure we show the maximumSAR location for x and z-steering along several tracks. These curves show a staircaseshape due to the spatial resolution of the E-field sheet and because the use of a spline-fit to find the location of the maximum was omitted. We indicated the location of theE-field sheet diodes by the horizontal dotted lines and the identity curve, indicatinga perfect match, by the vertical dotted line. Both figures show a linear relation and

94 Experimental SAR verification with a laboratory prototype
a high correlation between TCP location and location of maximum SAR, in bothradial (x, and y due to symmetry) and axial (z) direction. This means that the focuscan be accurately steered by using the TCP method to the desired location in theneck-equivalent muscle phantom. We further found that steering in the radial planeis possible in the entire phantom. In the z-direction, the focus can be steered up to60 mm from the center. From this location a double focus distribution is obtained,i.e. the secondary focus becomes more than 50% of the maximum.
6.4 Discussion
6.4.1 Evaluation of the materials and methods
For this work we constructed a split-phantom set-up consisting of two semi-cylindersthat are closed with polymer sheets. In this way the set-up provided the versatilitythat enabled measurements between two parts with several measurement devicesand IR measurements by opening the set-up. The drawback of our approach is thepossibility of air-gaps between the sheets which, especially for these high frequencies,can have a large effect on the local SAR and on the measurement accuracy. Wehave tried to decrease these influences by inserting some water between the sheetsand some additional water pressure while the halves of the prototype are clampedtogether.For the measurements we have used a muscle phantom recipe of Ito et al.40. Amountsof ingredients were used for muscle-equivalent properties (ǫr = 56, σeff = 0.8 S/m)at 22C. These properties, however, vary with temperature and are very sensitiveto small variations in salinity. Due to the required interference of multiple sources,these SAR values depend upon the conductivity in a non-linear fashion. By carryingout simulations with different conductivity values, we found that the SAR tracks inthe x-direction are strongly dependent on conductivity, i.e. the lateral normalizedSAR values are decreased by 30% for a 20% decrease in conductivity. Therefore, infuture measurements we expect to improve the predictability of the measurementsby measuring the properties of the phantom before each measurement.
6.4.2 Evaluation of the results
Electromagnetic models are used more and more for HT treatment planning andthere is a growing use of EM models to perform parameters studies for the opti-mization of HT applicators50,64,86. While the accuracy of EM modelling has increaseddramatically and high resolution simulations have become possible, up to now thishas not led to higher standards concerning model validations. Such a validation isa crucial step to assess dosimetry accuracy and will reduce the need for verificationmeasurements for new applicators. For a superficial antenna, recently, a first attemptof such a quantitative validation by high resolution 3D measurements was presented

6.4 Discussion 95
by De Bruijne et al.15. This validation, however, was for a single antenna set-upand should be confirmed for the SAR distributions with higher gradients that aretypically obtained with array set-ups. For high accuracy SAR dosimetry validationsof array set-ups, accurately on-site measured dielectric properties of all (phantom)materials are required. Further, an accurate measurement device is required, whichin general is very expensive.For our approach we used the availability of more accurate modeling for optimizingthe entire HT applicator. To our knowledge, we were the first to use EM modeling todesign an HT applicator from scratch by detailed parameter studies at frequenciesabove 400 MHz. In a previous publication we have explained our work dedicated tothe design of an optimized antenna positioning. Further, we used EM modeling tofully optimize the reflection characteristics of a single element of the antenna array.In the present paper we have experimentally verified the feasibility of focussed heat-ing in the neck, which has been predicted earlier72,75, and as such to validate ourapproach. We further assessed the dimensions of the focus and verified the possibil-ities of dynamic steering. By comparing measurements to simulation we performeda qualitative verification of the predicted SAR patterns in a muscle phantom.In this study we verified that a central focus can be obtained with two rings of sixantennas each. For central settings, we determined the width of this focus as 34 mm(IR) and 35 mm (FDTD) and the length as 112 mm (IR) and 103 mm (FDTD). Thisdifference might be due to thermal conduction, which results in an overestimationof the EFS by IR thermography. In the radial direction this size is usually λ/373,105,which means ∼31 mm in a muscle phantom, and correlates well with the valuesin this study. In axial direction this focus is determined by a combined effect ofthe distance between the antenna rings, the radius of the antenna rings, and theoperating frequency75, i.e. the wavelength in muscle. The obtained focus can besteered in radial directions towards every point in the muscle phantom. In the axialdirection (−z,z), extreme focus center point location is a 60 mm off-center position.For verification of the SAR profiles we used the split-phantom technique in combi-nation with 1) glass-fiber thermometer probe measurements, 2) IR thermographyusing a high resolution IR camera, and 3) measurements using our Schottky diodeE-field sheet. Local SAR values are determined for the first two (fiber-probes, IR)by using the power-pulse technique32, which means that high power is required. Thelatter (E-field) measurements were carried out at low power. The fiber-probe mea-surements have the advantage of a high accuracy and they provide the possibilityto monitor temperatures during heating. Further, they are non-metallic and verythin thus field disturbances are negligible. The disadvantage of this method is therequired cooling time after measurement (1-2 hours) due to the high temperaturegradients required. Further, multiple (multi-sensor) probes are required for a highresolution and positioning multiple probes in the split-phantom is cumbersome. IRthermography measurements with the most recent IR cameras have a high resolu-tion, which enables to investigate, besides the size of the focus, also the shape of thefocus. IR measurements share the disadvantage of long cooling times. Further, for

96 Experimental SAR verification with a laboratory prototype
these measurements it is required to open up the set-up for taking an IR picture,i.e. measurements were taken typically 10s after power off. According to Samaras etal.82, for effective field size (EFS) measurements, this is sufficiently short for anaccurate measurement. Compared to flat-phantom EFS measurements, the distri-butions obtained in this publication show much higher SAR gradients and thereforeheat conduction might have somewhat more influence. By comparing the thermog-raphy results to the fiber probe measurement we could show that the influence ofheat conduction remains low. By using the Schottky-diode E-field sheet46,104 we per-formed E-field measurements that can be performed at low power thus dynamic SARsteering with the prototype can be assessed. A major drawback of this equipmentis its low resolution because it was designed for superficial hyperthermia applicatorassessments in flat phantoms were the fields are more gradual. Further, in this split-phantom set-up, air-gaps may be present that considerable decrease the sensitivityof the diodes. The measured SAR values close to water from both power-pulse basedmethods further might have been hampered by the active water-cooling of the sidesof the phantom. By the resemblance between the SAR derived from the E-field andtemperature measurements, we conclude that this influence is low.
6.4.3 Quality assurance
Currently, no specific QA guidelines have been defined for our application or fornewly developed applicators. Within the framework of ESHO, guidelines for ESHOprotocols have been defined 1) for treatment of superficial tumours32, i.e. locallyadvanced breast carcinoma, advanced neck nodes, malignant melanoma, and 2) forregional hyperthermia in the pelvic area by radiofrequency equipment52. In termsof (regular) assessment of the SAR pattern of an applicator, clearly different ap-proaches are suggested. For superficial QA guidelines and assessment of applicatorperformance, the effective field size (EFS) and penetration depth (PD) are defined,which ”should be determined by measuring the changes in temperature resultingfrom a brief pulse of high power”32. In these guidelines, the necessity for an addi-tional characterization of the SAR pattern corresponding to a multi-element arrayof applicators is recognized. Further, it is mentioned that if ”non-perturbing E-fieldprobes, thermographic imaging or liquid-crystal sheet imaging” are used, they shouldbe corroborated by measurements obtained using the power pulse technique. A re-quirement for using this technique is that 60s after power-on the EFS and PD shouldbe determined. However, by finding perfect linear temperature curves, we showedthat longer heating periods can be used. In the guidelines for regional hyperther-mia52, it is required for SAR distribution characterization of equipment to performsystem performance regularly using the LED matrix/lamp phantom using differentphase/amplitude settings, different phantom positions and different bolus configura-tions. The E-field Schottky-diode sheet system is compliant to all requirements buta higher resolution is required so the focus size and shape can be determined as well,i.e. ∼ λ/10 instead of ∼ λ/4 (at 433 MHz). Further, to obtain a more homogeneous

6.5 Conclusions 97
temperature distribution, an improvement would be to use a liquid phantom ma-terial. The required new E-field sheet system, however, requires additional researchsince it must be designed specifically.
6.5 Conclusions
In this paper we analyzed the ability of using a phased array hyperthermia applicatorfor focussed heating in the head and neck region. Firstly, we conclude that the earlydesign of the patch antenna, in a well controlled water environment, provides anaverage efficiency of 94%, which is highly sufficient for our investigations. Secondly,we measured low cross-coupling between antennas in the array (maximum -22dB).Thirdly, we conclude that, using the analyzed set-up of two rings of six antennas,focussed heating in the head and neck is feasible. By IR thermography we measureda central 50% iso-SAR focus of 112 mm in axial and 34 mm in radial direction in amuscle phantom. This radial dimension is sufficiently small to allow targeted heatingof advanced tumours and by de-focussing also good SAR coverage of larger tumoursshould be possible. The axial length of this focus is somewhat large for tumour-specific heating. However, this can result in some blood pre-heating because vesselsare mainly oriented in this direction. The focus can be steered in axial (cranial-caudal) direction to maximum 6 cm from the center in the phantom. Combinedwith the focus size of 10 cm in axial direction, this indicates that 50% SAR coveragemay be possible up to 11 cm from a central location. The actual extent of heatingin a patient remains to be determined.We found little differences between the predictions of the SAR distribution by thethree investigated measurement methods. Therefore, as best system for regular qual-ity assurance we suggest the Schottky-diode E-field sheet system. This device en-ables quick measurements and better control of the temperatures resulting in morepredictable di-electric properties of the phantom materials. However, a modified de-sign of the Schottky-diode E-field sheet system is required that provides a higherresolution.
Acknowledgements
This work is supported by the Maurits and Anna de Kock foundation and the DutchCancer Society, grant DDHK 2003-2855. We further would like to thank the work-shop of the department of Radiation Oncology for the construction of the prototypeand T.A. ter Meer, H. Schippers and W. Schaap of the Dutch Aerospace Laboratory(NLR) for their work on the signal measurement equipment. And lastly, we thankH. Strijbos and A.P.M. Zwamborn of TNO (The Hague) for their contributions tothe discussions.

98 Experimental SAR verification with a laboratory prototype

CHAPTER 7
The HYPERcollar: the clinical applicator design
This chapter is based on:M.M. Paulides, J.F. Bakker, E. Neufeld, J. van der Zee, P.P. Jansen, P.C. Levendag,G.C. van Rhoon. “The HYPERcollar: a novel applicator for hyperthermia in thehead and neck.” Int. J. Hyperthermia.

100 The HYPERcollar: the clinical applicator design
Abstract
The purpose of this work was to define all features, and show the potential,
of the novel HYPERcollar applicator system for hyperthermia treatments in
the head and neck (H&N) region. The HYPERcollar applicator consists of 1)
an antenna ring, 2) a waterbolus system and 3) a positioning system. The
specific absorption rate (SAR) profile of this applicator was investigated by
performing infra-red (IR) measurements in a cylindrical phantom. Mandatory
patient-specific treatment planning was performed as an object lesson to a
patient with a laryngeal tumour and an artificial lymph node metastasis. The
comfort tests with healthy volunteers have revealed that the applicator provides
sufficient comfort to maintain in treatment position for an hour: the standard
hyperthermia treatment duration in our center. We further established that
a central focus in the neck can be obtained, with 50% iso-SAR lengths of 3.5
cm in transversal directions (x/y) and 9-11 cm in the axial direction (z).
Using treatment planning by detailed electromagnetic simulations, we showed
that the SAR pattern can be optimized to enable simultaneous encompassing a
primary laryngeal tumour and a lymph node metastasis at the 25% iso-SAR
level. The applicator enables a good control, and sufficient possibilities for
optimization, of the SAR pattern. In an ongoing clinical feasibility study we
will investigate the possibilities of heating various target regions in the neck
with this apparatus.
7.1 Introduction
Clinical phase III trials have shown that the addition of hyperthermia (HT) to radio-therapy (RT) results in remarkably higher (complete) response rates, improved localcontrol rates, better palliative effects and/or better overall survival rates. The pos-sibilities of HT for improving treatment outcome without adding toxicity20,79,90,94,95
are interesting to study in advanced H&N tumours as well.Up to now, the application of HT in the H&N region was limited to superficialregions because of the lack of deep-heating equipment for this region87. In earlierinvestigations, phased-array approaches have been investigated to apply HT to su-perficial regions in the H&N area with planar or conformal arrays45,56. However, tothe best of the authors’ knowledge, no clinical phased-array based applicator forapplying HT to deep-seated head and neck tumours exists. Therefore we conductedwork to design and construct such an applicator for targeted heating of advancedcarcinomas in the H&N region.In earlier studies, we started with a cylindrically symmetrical set-up of dipole an-tennas in an infinite water environment and optimized the dimensions of this set-upspecifically for targeted heating in the H&N region72,73,75. In those studies we se-

7.2 Materials and methods 101
lected an array of twelve antennas operating at 433 MHz arranged in two ringsas the optimum set-up. Simultaneously, we designed a patch antenna specific forthe H&N applicator as a replacement for the dipoles of the theoretical set-ups76.Subsequently, we verified the SAR calculations by phantom measurements using alaboratory prototype consisting of twelve early versions of this patch antenna74.The good results in previous studies have led to the construction of a clinical appli-cator: the HYPERcollar. In the present publication we report on the HYPERcollarapplicator system and its features. Further, we show the results of measurementsfor quality assurance purposes. Finally, as an object lesson, we illustrate the poten-tial of the applicator by showing the mandatory patient-specific treatment planningprocess for an example larynx-patient, and discussing the predicted optimized SARdistribution.
7.2 Materials and methods
Three key elements have to be addressed in preparation of a semi-deep H&N HTtreatment to ensure high quality. Firstly, equipment should be available that pro-vides possibilities for obtaining good specific absorption rate (SAR) coverage of thetumour and enable SAR pattern adjustments. Secondly, these SAR patterns shouldbe verified by phantom measurements. Thirdly, patient-specific treatment planning
Figure 7.1: Picture of the HYPERcollar applicator system. Both patient bed andpositioning system (neck support) are used to position the patient.The coaxial cables, that are normally connected to the applicator,are not shown for visibility.

102 The HYPERcollar: the clinical applicator design
is mandatory to optimize the SAR pattern and diminish the risk of thermally re-lated toxicity. Therefore, in this section, we describe subsequently the HYPERcollarapplicator design, and its characteristics, as well as the treatment planning systemthat is considered an integral element of the applicator.
7.2.1 Applicator system
Figure 7.1 shows a picture of the HYPERcollar applicator system. Basically, thesystem consists of a normal patient bed and an applicator that can be moved overthe head of the patient. After proper positioning, the waterbolus of the applicator isinflated with demineralized water and the twelve coaxial cables of the power systemare connected.
Power system
The power system delivers high-power radiofrequency (RF) signals with accuratelycontrolled powers (±5%) and phases (±2) to the applicator. First, a Direct DigitalSynthesis (DDS) system provides twelve coherent 433.92 MHz signals with inde-pendent phase shifts. These signals are amplified with PG70.150.2 power generators(SSB Electronic, Germany) up to 150 W. Circulators protect the amplifiers againstreflected power and bi-directional couplers are used to measure both forward and re-flected signals. Gains and phases are measured with twelve specially designed detec-tors4, which use one of the DDS system signals as a reference. Low-loss (<0.1dB/m)coaxial cables are used to transfer the 433.92 MHz signal from the amplifiers to theC-connectors of the antennas.
HYPERcollar
The HYPERcollar consists of a transparent perspex cylinder (radius = 40 cm) cov-ered with a fine conducting gauze forming the conducting backplanes required forthe patch antennas. Twelve patch antennas in two rings75 are mounted on the per-spex cylinder. The distance between the center planes of the two antenna rings is6 cm. The patch antennas consist of a brass patch (28.2 mm x 7 mm) oriented inalignment with the patient-axis (z-axis) and connected, close to the short side, tothe extending conducting rod of a C-female receptacle connector. A low-dielectricsupport is placed between backplane and patch for better robustness. Details of thedimensions of the patch can be found in76. The entire applicator is attached to amovable trolley and can be rotated around the z-axis (patient-axis) and around thex-axis (left-right) for maximum positioning flexibility. An inflatable waterbolus isattached to the perspex cylinder for cooling of the skin and to enable an efficienttransfer of the electromagnetic waves from the antennas into the patient.

7.2 Materials and methods 103
Waterbolus system
Figure 7.2 schematically shows the waterbolus system and a top view of the HYPER-collar: with cross-sections through the patient and waterbolus. The demineralizedwater in the waterbolus is circulated and temperature controlled by two E4850 re-frigerated recirculators (Bio-Rad, Microscience Division). In- and outflow points arelocated at every other quadrant in order to obtain maximum temperature homo-geneity in the waterbolus. A special pump is used to fill the bolus around the patientin approximately 30s and the quick release valve can be used to empty the bolusin less than 5s. A small valve at the top of the applicator is used to remove the airduring the filling procedure. By closing all valves, a closed water system is obtained.The recirculators can also be attached to the water vessel to heat or cool this waterto the desired water temperature prior to the treatment.
Fill-up pump
BioRad 1 Water vessel
Air removal valve
BioRad 2
Quick release valve
Figure 7.2: Schematic visualization of the waterbolus system. Direction of flowwithin the tubes is indicated by the arrows.
Positioning system
Positioning of the patient in treatment position is carried out as follows. The patient,who is laying on the patient-bed with the head over the edge of the bed, is positionedby moving the applicator as far as possible over the patient’s head (∼1 cm spacebetween shoulders and applicator). Subsequently, the patient is moved to the desiredposition by altering the height of the patient bed and subsequently the height of theneck support. To check the position of the patient according to planned positions,

104 The HYPERcollar: the clinical applicator design
we verified the coordinates of the nose and jugular notch. Hereto we constructed aspecial device, including a water-gauge, that enables measurements using the originof the applicator as a reference. After inflating the waterbolus, this positioning isverified in order to obtain the highest correspondence to the positions at whichtreatment planning was performed.
We assessed the level of comfort within the applicator in treatment position using fivehealthy volunteers, e.g. whether easily breathing remains possible. The volunteerswere positioned within the applicator and subsequently the waterbolus was inflatedwith water. Volunteers remained in the applicator for approximately an hour.
7.2.2 Characterization measurements
Compared to the laboratory prototype set-up74, the main differences are 1) the pres-ence of a finite waterbolus, 2) a smaller distance between both antenna rings (6 cm),3) a larger ring radius (40 cm) and 4) a new, more optimized, version of the patchantenna76. For characterization and quality assurance (QA) purposes we measuredreflection and SAR patterns. The return loss Pr that is measured at the connectorsof the HYPERcollar can be separated into the primary reflection of the antennaPp.r. and the combined secondary contributions Ps.c. by cross coupling of the otherantenna elements of the array, i.e. Pr = Pp.r. + Ps.c., where Ps.c. is the sum of thesecondary contributions of the other eleven antennas. Dividing these contributionsby the power that is directed towards each antenna, Pf , provides the respectivereflection coefficients. Primary reflection characteristics were measured for variouswaterbolus temperatures to assess the temperature range in which operation is pos-sible. The primary reflection coefficients were measured by attaching a network anal-yser (8751A, Agilent Technologies, USA) to the antennas and by using a centrallypositioned cylindrical muscle equivalent phantom74. We further assessed the SARpattern of the HYPERcollar applicator within this cylindrical phantom by infra-red(IR) thermography, as in74. In addition, we measured the (phase-dependent) returnloss Pr for the phase settings corresponding to TCP steering in x (-60mm : 60mm),y (-60mm : 60mm) and z (-30mm : 30mm) direction, in steps of 10 mm.
7.2.3 Treatment planning
In future, we will perform treatment planning for each patient since in our opinionthis is mandatory for obtaining good heating profiles and to diminish the possibilityof thermally related toxicity. Therefore, we illustrate such treatment planning foran example patient with a laryngeal tumour. Further, we illustrate the potentialof large target volume heating by adding an artificial lymph node metastasis andanalyzing the SAR distributions within tumour and lymph node.

7.2 Materials and methods 105
Figure 7.3: Transparent anatomy visualization in SEMCAD X. Bone tissue,the tumour and the artificial lymph node metastasis are non-transparently visualized.
Table 7.1: Tissue types and their dielectric properties at 433 MHz (µr = 1.0).
Tissue type ǫr [-] σeff [S/m] ρ [kg/m3]
Air 1 0 0Bone 13 0.09 1990Fat 12 0.08 916Muscle/Tongue 57 0.80 1041BloodVessel 47 0.57 1060BoneMarrow 6 0.03 1027Brain 57 0.75 1039Cartilage 45 0.60 1100Esophagus 67 1.01 1040SpinalCord 42 0.45 1043ThyroidGland 61 0.89 1050Tooth 13 0.09 2160
Tumour 59 0.89 1050
Patient model
The patient model was segmented from a CT-scan of a larynx patient that wasmade for radiotherapy treatment planning. Semi-automatic segmentation into dif-ferent tissues was carried out by a medical doctor using a dedicated segmentationprogram67 (Figure 7.3). The segmented tumour volume was 6.5 ml, which corre-sponds to the smallest target volume in72. To investigate the possibilities of heatingboth primary tumour and lymph node metastasis, we also defined an artificial tu-
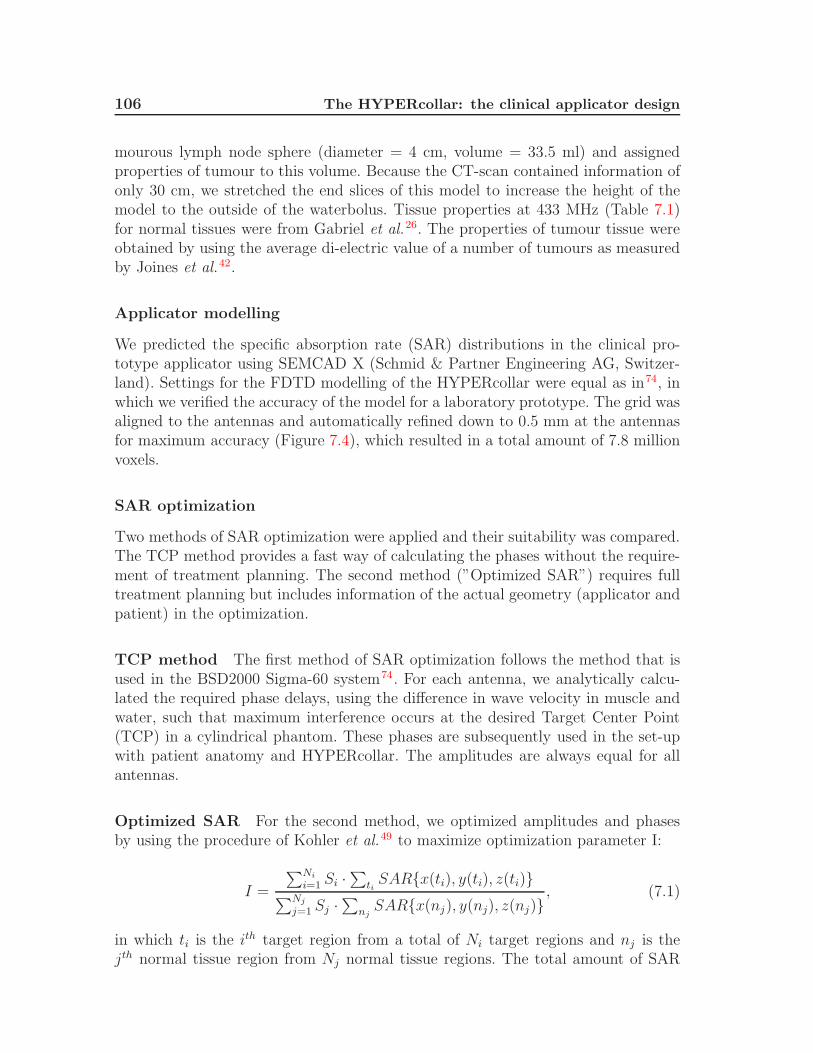
106 The HYPERcollar: the clinical applicator design
mourous lymph node sphere (diameter = 4 cm, volume = 33.5 ml) and assignedproperties of tumour to this volume. Because the CT-scan contained information ofonly 30 cm, we stretched the end slices of this model to increase the height of themodel to the outside of the waterbolus. Tissue properties at 433 MHz (Table 7.1)for normal tissues were from Gabriel et al.26. The properties of tumour tissue wereobtained by using the average di-electric value of a number of tumours as measuredby Joines et al.42.
Applicator modelling
We predicted the specific absorption rate (SAR) distributions in the clinical pro-totype applicator using SEMCAD X (Schmid & Partner Engineering AG, Switzer-land). Settings for the FDTD modelling of the HYPERcollar were equal as in74, inwhich we verified the accuracy of the model for a laboratory prototype. The grid wasaligned to the antennas and automatically refined down to 0.5 mm at the antennasfor maximum accuracy (Figure 7.4), which resulted in a total amount of 7.8 millionvoxels.
SAR optimization
Two methods of SAR optimization were applied and their suitability was compared.The TCP method provides a fast way of calculating the phases without the require-ment of treatment planning. The second method (”Optimized SAR”) requires fulltreatment planning but includes information of the actual geometry (applicator andpatient) in the optimization.
TCP method The first method of SAR optimization follows the method that isused in the BSD2000 Sigma-60 system74. For each antenna, we analytically calcu-lated the required phase delays, using the difference in wave velocity in muscle andwater, such that maximum interference occurs at the desired Target Center Point(TCP) in a cylindrical phantom. These phases are subsequently used in the set-upwith patient anatomy and HYPERcollar. The amplitudes are always equal for allantennas.
Optimized SAR For the second method, we optimized amplitudes and phasesby using the procedure of Kohler et al.49 to maximize optimization parameter I:
I =
∑Ni
i=1 Si ·∑
tiSARx(ti), y(ti), z(ti)
∑Nj
j=1 Sj ·∑
njSARx(nj), y(nj), z(nj)
, (7.1)
in which ti is the ith target region from a total of Ni target regions and nj is thejth normal tissue region from Nj normal tissue regions. The total amount of SAR

7.2 Materials and methods 107
(a): Solid model
(b): Grid implementation
Figure 7.4: The HYPERcollar applicator and the patient within. The waterbolusand the upper head model extension are not visualized to show somepatch antennas.
in a certain region can be increased or decreased respectively by increasing weightfactors Si and Sj .

108 The HYPERcollar: the clinical applicator design
7.3 Results
7.3.1 Comfort of the applicator
Comfort tests with healthy volunteers have revealed that the applicator providessufficient comfort to maintain in treatment position for an hour: which will be thehyperthermia treatment duration for H&N patients in our center. We observed nobreathing problems due to waterbolus pressure at the trachea, provided that thewaterbolus was filled carefully. A special neck support has been constructed sincethe comfort tests revealed that such a support would provide more stability duringfilling of the waterbolus and would increase the reproducibility of the positioning.
7.3.2 Characterization measurements
Reflection characteristics
15.5 20.5 25.2 30.1 34.8 41.0−40
−35
−30
−25
−20
−15
−10
−5
0
Waterbolus temperature (°C)
|S11
(433
.92M
Hz)
| (dB
)
Figure 7.5: Primary reflection coefficient (Pp.r./Pf in dB) at 433.92 MHz fordifferent waterbolus temperatures and all 12 antennas. A cylindricalmuscle equivalent phantom was used to mimic the patient’s neck.
In Paulides et al.76 we have defined the expected clinically relevant range of wa-terbolus temperatures, i.e. between 20 and 30C. Figure 7.5 provides the primaryreflection coefficients measured using the NWA at each antenna, for waterbolus tem-peratures within and outside this range. The figure shows a temperature dependence,related to the change of the permittivity of the water underneath the patch, thatis in agreement with the findings in the previous study76. The primary reflectionof almost all antennas is below -15dB (3%) for temperatures between 20 and 30C.Releasing this threshold to -10dB (10%), the applicable temperature range can even

7.3 Results 109
Table 7.2: Statistics of the measured return loss Pr/Pf (%) at every antenna forTCP-steering settings.
1 1 1 2 1 3 1 4 1 5 1 6 2 1 2 2 2 3 2 4 2 5 2 6 Mean
Mean 10 3 5 6 5 6 12 5 3 4 8 3 6Max 31 15 19 24 28 18 41 19 11 28 20 21 23
be increased to between 15 and 35C, while the average reflection coefficient remainsunder -14dB.Table 7.2 summarizes the statistics of the measured return loss Pr/Pf for the differ-ent phase settings described in section 7.2.2. This table shows that, due to primaryreflection and secondary contributions, on average 6% return loss can be expectedduring treatments, with peaks up to around 31%. The return loss values are found tobe highest for the most ventral antennas (1 1 and 2 1). This is due to the waterbolusthat bulges out more in dorsal (−y) locations than in ventral (+y) locations. There-fore, the water-air transitions are the closest to the antennas and air inclusions, dueto the folds in the waterbolus, are the largest.
Measured SAR distribution
By IR measurements we have established that a central focus can be obtained in thecylindrical muscle equivalent phantom. Figure 7.6 shows the measured SAR patternfor central steering settings, i.e. TCP=(0,0,0). The figure shows a central focus veryclose (5 mm difference) to the desired focus position. The small asymmetry that canbe observed in the x-direction falls within the assumed accuracy of the measurement.
Figure 7.6: SAR distribution within the, 11.6 cm diameter, cylindrical muscleequivalent phantom for central phase steering (ϕi = 0, i = 1 . . . 12)and a combined total input power of 1W.

110 The HYPERcollar: the clinical applicator design
Table 7.3: SAR steering (Direction and TCP setting (x,y,z)) and correspondingfocus-size (length L50% and width W50% of the 50% iso-SAR contour)parameters for the IR thermography measurements. All dimensionsare in mm.
Direction TCP setting L50% W50%
Central ( 0, 0, 0) 88 35X-steering (-30, 0, 0) 103 48Z-steering ( 0, 0,-30) 90 35
The length L50% of the focus for central steering is around 90 mm and its width W50%
is 35 mm (Table 7.3). By TCP based phase adjustments, the focus can be steeredto maximum 50 mm (x-direction), 50 mm (y-direction) and 30 mm (z-direction)from the origin (central steering) in the homogeneous muscle equivalent phantom.Table 7.3 shows that the dimensions of the focus change for steering in the x (andy) direction but remain equal for steering in the z-direction, i.e. the focus lengthvaries between 88 and 103 mm and the focus width between 35 and 48 mm.
7.3.3 Predicted SAR in a patient model
SAR distributions were evaluated by using the 1g averaged Spatial Peak SAR [IEEE-1529] to remove high SAR values due to the staircase approximation of FDTD. Forthe SAR predictions corresponding to the different SAR steering settings we showthe 25% iso-SAR volume and cumulative SAR-Volume histograms. Rather thannormalizing the SAR distributions to the maximum value we calculated the SAR for1 Watt total input power so absolute SAR values can be obtained by multiplicationwith the total input power of all combined antennas. Since we used a highly detaileddescription of the complete patch antennas, including all their dimensions, and weconsider only the real radiated power, we consider these results to be predictive forthe actual SAR.
25% iso-SAR volumes
The possibilities of TCP based phase-steering and optimized phase and amplitudesettings for this patient are shown in Figure 7.7. The figure shows the 25% iso-SARvolume on top of the tumour, lymph node and bony structures. Figure 7.7a showsthe iso-SAR volumes corresponding to TCP steering with the TCP in the middlebetween tumour and lymph node (”TCP @ tumour + lymph node”). This resultsin SAR coverage at the lymph node but the tumour is not covered. Therefore weadjusted the point of focus towards the center of the tumour. The correspondingSAR is shown in Figure 7.7b (”TCP @ tumour”). For these phase settings a much

7.3 Results 111
TCP @ tumour + lymphnode
(a)
TCP @ tumour
(b)
Optimized settings
(c)
Optimized settings (S = 10)tumour
(d)
Figure 7.7: 25% iso-SAR volumes, shown in grey, for the four investigated set-tings. The figure further shows the bony structures (yellow) and thetumour (red) and artificial lymph node sphere (dark red)

112 The HYPERcollar: the clinical applicator design
better coverage of the tumour and an almost equal situation for the lymph node isobtained but at the cost of 1) a hotspot at the shoulder and 2) a large region of highSAR values at the back of the neck region. Figure 7.7c shows the iso-SAR volumes foroptimized settings with equal selectivity values for all tissues (”Optimized settings”).The figures show selective SAR coverage of the lymph node and limited coverageof the more difficult to heat central tumour. Therefore we increased the selectivityvalue of the tumour (Stumour) to 10 in order to obtain a better SAR coverage of bothtumour and lymph node, which is shown in Figure 7.7d. This figure shows that thechange in priority led to coverage of all of the tumour and almost all of the lymphnode by the 25% iso-SAR volume.
Cumulative SAR-Volume histograms
To show the more subtle differences in the SAR patterns of all settings, we showthe cumulative SAR histograms in Figure 7.8. Cumulative histograms specify thepercentage of a certain volume that receives a specified SAR ”dose”. Histogramcurves are shown for tumour, lymph node, central nerve system (CNS: myelumand brains), and total head volume. Figure 7.8 shows that the SAR level at theCNS is under the 25% iso-SAR value for all settings, and that high SAR values areobtained in the two target regions. Figure 7.8a and Figure 7.8b show the histogramscorresponding to TCP steering. When the TCP is between lymph node and tumour,the SAR values in the lymph node are over 25% but the tumour is not covered.When the point of focus is adjusted to the tumour, the SAR values at the tumourare much higher but at the cost of lower SAR values in the lymph node. Figure 7.8cand Figure 7.8d show the histograms corresponding to optimized settings. Comparedto TCP settings, these settings result in higher SAR values in the lymph node and,as a result, relatively lower SAR values in CNS. The SAR values in the lymphnode volume, however, are much higher than the SAR values in tumour for equalselectivity settings (Stumour = Slymphnode = 1). The SAR coverage of the tumour canbe effectively improved by a ten-fold increase of the tumour volume selectivity value,due to lower values in the lymph node and higher values in the tumour. Therefore amuch more homogeneous SAR coverage of the entire target region is obtained withthese settings, i.e. over 85% of all SAR values in both target regions are above the25% iso-SAR value.
7.4 Discussion
Comfort tests with healthy volunteers have revealed that the HYPERcollar providessufficient stability to remain in treatment position for an hour. Further, we observedno breathing problems due to waterbolus pressure at the trachea, provided that thewaterbolus was filled carefully. However, we anticipate that comfort may be lowerfor patients with a combination of a short neck and high shoulders. Further, we still

7.4 Discussion 113
(a) TCP @ tumour + lymph node
0 0.5 1 1.50
25
50
75
100
Spatial Peak SAR (W/kg @ Pin=1W)
Vol
ume
(%)
TumourLymphnodeCNSTotal
(b) TCP @ tumour
0 0.2 0.4 0.6 0.8 10
25
50
75
100
Spatial Peak SAR (W/kg @ Pin=1W)
Vol
ume
(%)
TumourLymphnodeCNSTotal
(c) Optimized settingsStumour = 1, Slymphnode = 1
0 0.5 1 1.5 2 2.50
25
50
75
100
Spatial Peak SAR (W/kg @ Pin=1W)
Vol
ume
(%)
TumourLymphnodeCNSTotal
(d) Optimized settingsStumour = 10, Slymphnode = 1
0 0.5 1 1.50
25
50
75
100
Spatial Peak SAR (W/kg @ Pin=1W)
Vol
ume
(%)
TumourLymphnodeCNSTotal
Figure 7.8: Cumulative SAR-Volume histograms for the four investigated set-tings using 1g-averaged Spatial Peak SAR values. The 25% iso-SARvalue (25% of the maximum value in the entire patient model) isindicated by the straight dotted line
need to assess if completion of an entire session is possible for the patients that aregenerally older and may suffer from severely damaged skins. In a clinical feasibilitystudy, we will investigate whether these items of concern lead to major problems.In that study we will also investigate whether heating or comfort problems can besolved by a changed applicator design or can be converted into exclusion criteria forselected groups of patients.
The primary reflection coefficients (Pp.r.) of, early versions of, the twelve patch an-tennas in the laboratory prototype were all beneath 10% (-10dB) for waterbolustemperatures at 23C and 25C74. The newly designed patch antenna76 is found toperform better, with a maximum primary reflection of 16% (-12dB) for tempera-tures between 15C and 35C. However, when taking into account the contributionsof other antennas, we find a total reflected power of maximum 31% and 6% on
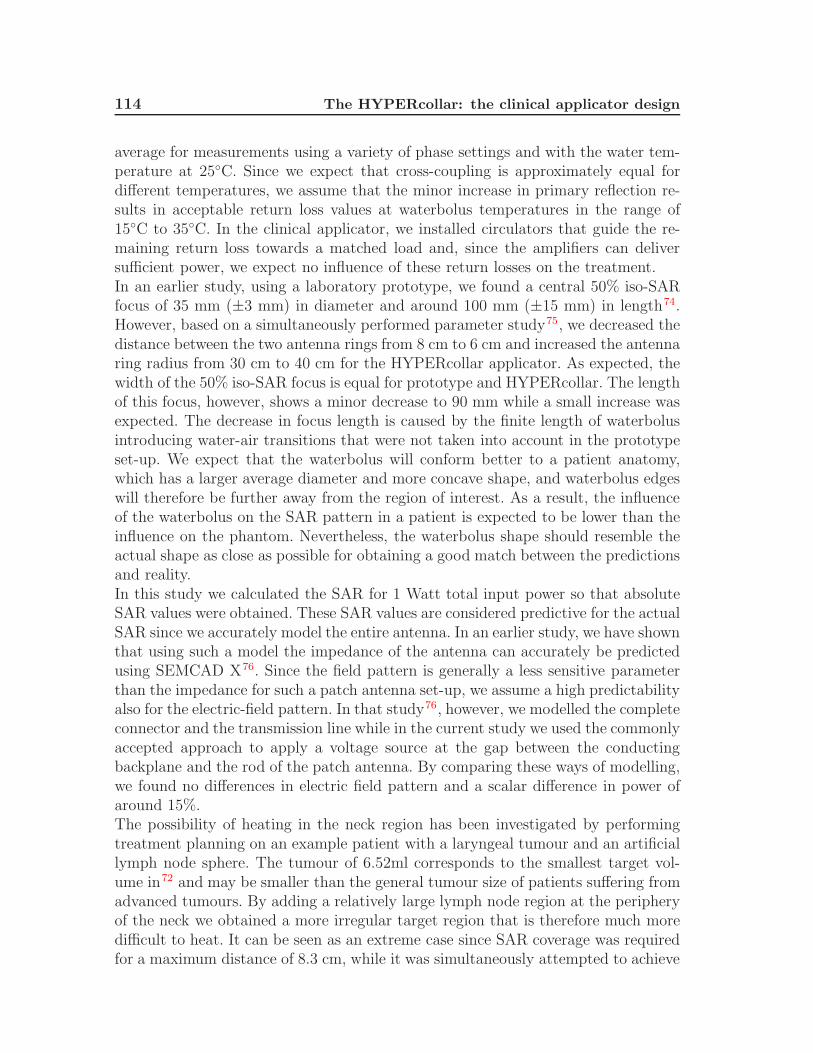
114 The HYPERcollar: the clinical applicator design
average for measurements using a variety of phase settings and with the water tem-perature at 25C. Since we expect that cross-coupling is approximately equal fordifferent temperatures, we assume that the minor increase in primary reflection re-sults in acceptable return loss values at waterbolus temperatures in the range of15C to 35C. In the clinical applicator, we installed circulators that guide the re-maining return loss towards a matched load and, since the amplifiers can deliversufficient power, we expect no influence of these return losses on the treatment.In an earlier study, using a laboratory prototype, we found a central 50% iso-SARfocus of 35 mm (±3 mm) in diameter and around 100 mm (±15 mm) in length74.However, based on a simultaneously performed parameter study75, we decreased thedistance between the two antenna rings from 8 cm to 6 cm and increased the antennaring radius from 30 cm to 40 cm for the HYPERcollar applicator. As expected, thewidth of the 50% iso-SAR focus is equal for prototype and HYPERcollar. The lengthof this focus, however, shows a minor decrease to 90 mm while a small increase wasexpected. The decrease in focus length is caused by the finite length of waterbolusintroducing water-air transitions that were not taken into account in the prototypeset-up. We expect that the waterbolus will conform better to a patient anatomy,which has a larger average diameter and more concave shape, and waterbolus edgeswill therefore be further away from the region of interest. As a result, the influenceof the waterbolus on the SAR pattern in a patient is expected to be lower than theinfluence on the phantom. Nevertheless, the waterbolus shape should resemble theactual shape as close as possible for obtaining a good match between the predictionsand reality.In this study we calculated the SAR for 1 Watt total input power so that absoluteSAR values were obtained. These SAR values are considered predictive for the actualSAR since we accurately model the entire antenna. In an earlier study, we have shownthat using such a model the impedance of the antenna can accurately be predictedusing SEMCAD X76. Since the field pattern is generally a less sensitive parameterthan the impedance for such a patch antenna set-up, we assume a high predictabilityalso for the electric-field pattern. In that study76, however, we modelled the completeconnector and the transmission line while in the current study we used the commonlyaccepted approach to apply a voltage source at the gap between the conductingbackplane and the rod of the patch antenna. By comparing these ways of modelling,we found no differences in electric field pattern and a scalar difference in power ofaround 15%.The possibility of heating in the neck region has been investigated by performingtreatment planning on an example patient with a laryngeal tumour and an artificiallymph node sphere. The tumour of 6.52ml corresponds to the smallest target vol-ume in72 and may be smaller than the general tumour size of patients suffering fromadvanced tumours. By adding a relatively large lymph node region at the peripheryof the neck we obtained a more irregular target region that is therefore much moredifficult to heat. It can be seen as an extreme case since SAR coverage was requiredfor a maximum distance of 8.3 cm, while it was simultaneously attempted to achieve
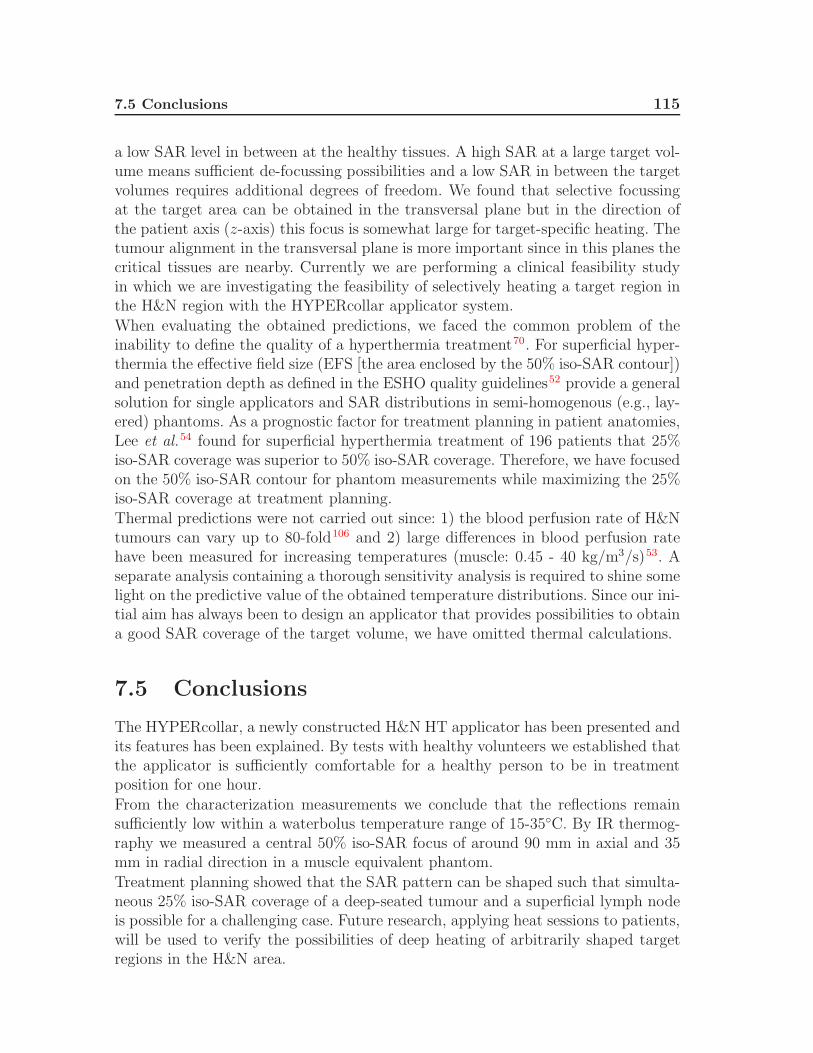
7.5 Conclusions 115
a low SAR level in between at the healthy tissues. A high SAR at a large target vol-ume means sufficient de-focussing possibilities and a low SAR in between the targetvolumes requires additional degrees of freedom. We found that selective focussingat the target area can be obtained in the transversal plane but in the direction ofthe patient axis (z-axis) this focus is somewhat large for target-specific heating. Thetumour alignment in the transversal plane is more important since in this planes thecritical tissues are nearby. Currently we are performing a clinical feasibility studyin which we are investigating the feasibility of selectively heating a target region inthe H&N region with the HYPERcollar applicator system.
When evaluating the obtained predictions, we faced the common problem of theinability to define the quality of a hyperthermia treatment70. For superficial hyper-thermia the effective field size (EFS [the area enclosed by the 50% iso-SAR contour])and penetration depth as defined in the ESHO quality guidelines52 provide a generalsolution for single applicators and SAR distributions in semi-homogenous (e.g., lay-ered) phantoms. As a prognostic factor for treatment planning in patient anatomies,Lee et al.54 found for superficial hyperthermia treatment of 196 patients that 25%iso-SAR coverage was superior to 50% iso-SAR coverage. Therefore, we have focusedon the 50% iso-SAR contour for phantom measurements while maximizing the 25%iso-SAR coverage at treatment planning.Thermal predictions were not carried out since: 1) the blood perfusion rate of H&Ntumours can vary up to 80-fold106 and 2) large differences in blood perfusion ratehave been measured for increasing temperatures (muscle: 0.45 - 40 kg/m3/s)53. Aseparate analysis containing a thorough sensitivity analysis is required to shine somelight on the predictive value of the obtained temperature distributions. Since our ini-tial aim has always been to design an applicator that provides possibilities to obtaina good SAR coverage of the target volume, we have omitted thermal calculations.
7.5 Conclusions
The HYPERcollar, a newly constructed H&N HT applicator has been presented andits features has been explained. By tests with healthy volunteers we established thatthe applicator is sufficiently comfortable for a healthy person to be in treatmentposition for one hour.
From the characterization measurements we conclude that the reflections remainsufficiently low within a waterbolus temperature range of 15-35C. By IR thermog-raphy we measured a central 50% iso-SAR focus of around 90 mm in axial and 35mm in radial direction in a muscle equivalent phantom.
Treatment planning showed that the SAR pattern can be shaped such that simulta-neous 25% iso-SAR coverage of a deep-seated tumour and a superficial lymph nodeis possible for a challenging case. Future research, applying heat sessions to patients,will be used to verify the possibilities of deep heating of arbitrarily shaped targetregions in the H&N area.

116 The HYPERcollar: the clinical applicator design
Acknowledgements
This work was financially supported by the Dutch Cancer Society, grant: DDHK2003-2855. The authors further would like to thank B. van Toorn for manufacturingthe clinical applicator prototype.

CHAPTER 8
First result of the phase I study

118 First result of the phase I study
8.1 Introduction
In the previous chapter we described the HYPERcollar design and showed its pos-sibilities for heating a primary tumour and a large lymph node metastasis. Thenext step of the project and the first step of clinical evaluation is a Phase I studyon whether the HYPERcollar applicator system can be used to adequately heatprimary tumours or primary tumour plus lymph node metastases simultaneously.In this chapter we report on the first patient in the Phase I study: a patient withlaryngeal cancer to whom we applied hyperthermia with the HYPERcollar. In thischapter we present the results of treatment planning, the HT session and the mea-sured temperatures.
8.2 Materials and methods
8.2.1 Case description
The HYPERcollar was tested in a 82 year-old male patient with a squamous cellcarcinoma of the larynx (T3N0M0: a primary tumour without lymph node or distantmetastasis). There were no contra-indications, i.e. there were no metallic implantsand he was treated without concurrent chemotherapy because of his advanced ageand general condition. He gave informed consent, i.e. after extensive informationconcerning the study he agreed to participate.
In 1972, he underwent lymphadenectomy (removal of a gland), for unretrievablereasons, in the left side of the neck and in 1973 a strumectomy (removal of the thyroidgland) was performed. In 1998 a T1a glottic laryngeal carcinoma was diagnosed forwhich he received a CO2 laser treatment. Since then, he had a hoarse voice so thatvisual contact was required for communication. In 2007, he was diagnosed with aglottic laryngeal carcinoma for which he was treated with RT, 36 fractions of 2 Gy,5 fractions weekly. He was in a relatively good physical shape but indicated to sufferfrom lumber pain since October 2006. The HT session was given after the 8th RTfraction. After the HT session, a spondylodiscitis Th12L1 was diagnosed causing thelumber pain in the back.
A CT scan was made for RT treatment planning of which the quality turned out tobe poor, i.e. the patient was not lying straight and one shoulder was lifted a littletowards the head. This CT also showed that the patient had a relatively short neckbut a close-to-average diameter (11.7 cm).
8.2.2 Treatment planning
A standard H&N radiotherapy planning CT was used to differentiate between tis-sues. With this, a patient model (”segmentation”) was constructed that is visualizedin Figure 8.1. This procedure is semi-automatic, i.e. discrimination between areas

8.2 Materials and methods 119
of exterior, fat, muscle and bone is automatic and tissues such as cartilage, whitematter and gray matter are assigned manually. This segmentation, combined with aCAD implementation of the applicator, was imported in SEMCAD X (Figure 8.1).With this we calculated the electric fields in the patient for each antenna.
Figure 8.1: Visualization of the solid model in SEMCAD X of the patient withinthe HYPERcollar. The waterbolus is omitted in this visualization fora better visibility of the patient model and to show one out of thetwelve patch antennas.
For obtaining the relative amplitude and phase settings to be used in the sessionwe used two strategies. The first strategy is the commonly used target-center-point(TCP)-based steering, which is commonly used in hyperthermia, since it provides thepossibility of dynamic steering during treatment. Secondly, we apply an automaticoptimization routine (see page 106) that results in the theoretical optimal SARpattern.
8.2.3 Procedure
Radiotherapy was applied to the primary tumour and lymph node stations accordingto standard procedures. Before the hyperthermia session, the skin showed no signof radiation toxicity. The patient reported that his back pain had become serious;due to which he had difficulties to move. The patient was instructed to mention anypain or unpleasant feeling during the heat session, which might be the result of ahot spot. He was further assured that the treatment would be interrupted when hewould request so.
Placement of thermometry catheters Immediately before the session, a closed-tip catheter was placed, through the nose, in the esophagus near the tumour. Sec-

120 First result of the phase I study
ondly, such a catheter was placed interstitially under CT-control in muscle tissuewith similar SAR as the spinal cord, i.e. ”myelum indicative”. After catheter place-ment, a CT scan was made to document the location of this catheter tract. Dueto swallowing problems, the esophagus catheter was re-inserted after this CT wastaken so locations had to be estimated. Four-point thermometry fibers, TakaokaFTP1 standard sensor probes (Takaoka Electric MFG Co. Ltd., Japan), were placedin these catheters. Figure 8.2 shows the locations of the thermometry points insidethe solid model in SEMCAD. We excluded probe 4 from the analysis since it wasnot within tissue, i.e. in the analysis we found that it was located at the transitionfrom skin to waterbolus.
Figure 8.2: Locations of the interstitial catheter and esophagus catheter andrespective measurement locations. Probes 1 and 2 provide myelumindicative temperatures, probes 6 and 7 are tumour indicative and3, 5 and 8 are in healthy tissue.
Heat session In the hyperthermia treatment room, the patient was placed on the,comfortable, bed. Subsequently we positioned the patient as far as possible withinthe applicator in accordance to the planned position. The thermometry probes wereplaced within the closed-tip catheters, on the skin and at inflow and outflow of thewaterbolus. The waterbolus was filled with demineralized water which was circulatedat a temperature of 28C.

8.2 Materials and methods 121
During the heat session, according to our phase I protocol, total power was increaseduntill one of the constraints was reached:
• 43C measured in a tumour indicative measurement point.
• 43C measured in normal tissue.
• 40C measured in a myelum indicative measurement point.
• A pain complaint by the patient. The relation of this complaint to the ap-plied power is tested by immediately turning the power off and observing thedevelopment of the pain.
Heart rate was continuously monitored, during the session, by a pulse-oxymeterclip placed around a finger. Power and phase settings per separate antenna werecontrolled with the power system (Section 7.2.1).In order to test two ways of steering we divided the heat session in two parts. Forthe first part we used TCP settings for the powers and phases and the second partthe optimized power and phase settings. In the first part we gradually increasedpower in steps of 30 W until one of the limitations was reached. In the second partwe used the last power settings of the first part and again continued increasing insteps of 30W.
In vivo measurement of the SAR We performed power-pulse measurementsto assess the local SAR at the measurement locations, which at a later stage can becompared to the predicted SAR values. Hereto, the change in local temperature ismeasured while switching on high power or switching off the power at a steady-statetemperature. The local SAR is calculated from the temperature rise or decay using:
SAR = c ·∆T
∆t, (8.1)
where c is the specific heat capacity of the tissue (muscle tissue is assumed: 3.60 kJkg−1 K−1), ∆T is the local temperature rise [K] and ∆t is the corresponding heatingtime [s].
8.2.4 Goals of the heating session
In the phase I study protocol, the following goals of the heating sessions were defined.The most important aim of the heating session was to achieve temperatures above39C at all measurement points in the gross tumour volume and as such demonstratethe possibility of deep heating with the HYPERcollar. Secondly, the level of comfortof the applicator was assessed by investigating whether a full session of an hour canbe applied. The third aim was to encompass the gross tumour volume by the 25%iso-SAR volume as predicted by treatment planning. Fourthly, we investigated the

122 First result of the phase I study
predictive value of HT treatment planning by comparing the SAR measurements topredicted SAR. Lastly, acute HT toxicity was assessed immediately after the sessionand on the next day.
8.3 Results
8.3.1 Evaluation of the heat session
Figure 8.3 shows the measured temperatures and total power as a function of timeafter the first power on. The treatment session was started with TCP based phaseand equal amplitude settings. For the second part of the session (after the dash-dotline) we used phase and amplitude settings for which the optimum SAR distributionwas calculated.
The session was started by gradually increasing power untill 340 W of total power,which was reached after around 15 minutes. At this time the patient complainedabout pressure at the location of the cricoid cartilage. Power was turned off to in-vestigate the relation of the complaint to power. After some time, and after releasingsome of the water from the waterbolus, the pressure sensation diminished. With thenew waterbolus shape we could further increase power up to 400W. With this power,temperatures of 39C and 39.4C were reached at tumour indicative points. Myelumindicative temperatures remained under 39C and normal tissue temperatures under40C.
After 26 minutes, the patient complained a second time of pressure at the cartilage.Therefore we decided to continue at optimized settings. Hereto we emptied andrefilled the entire waterbolus and started using optimized settings (t = 37min). Withthese settings we could increase power till 350 W but at that point the maximumpower of channel 1 (antenna 1 1) was reached. Therefore we stopped increasingthe power and finished the session with this amount of power. After some time,temperatures in tumour indicative locations of 40C and 40.6C were obtained. Thetemperatures in myelum indicative points were under 38.6C and normal tissueremained under 40.6C and this temperature was reached only close to the tumour.
Tolerance and toxicity The heating session was well tolerated by the patient andthe session could be completed without major discomfort. Both after the session andthe next day, we found no HT toxicity.
Performance of the antennas By analyzing the measured forward and reflectedpower we found that the antenna performed well during the session, i.e. reflectionswere generally under 10%, although for some very short moments higher reflectionswere measured (∼30%).

8.3 Results 123
37
38
39
40
41 Esophagus Catheter
Tem
pera
ture
(°C
)
37
38
39
40
41 Interstitial Catheter
Tem
pera
ture
(°C
)
0 10 20 30 40 50 60
0
200
400
Tot
al F
orw
ard
Pow
er (
W)
Time after Power On (min)
TCP based phases Optimized settings
5 Normal6 "Tumour"7 "Tumour"8 Normal
1 "Myelum"2 "Myelum"3 Normal
Figure 8.3: Temperature measured in the esophagus and interstitial cathetersand corresponding total power level as function of time after thestart of treatment. For the first part of the treatment we used TCPbased phases and equal amplitude settings. For the second part ofthe treatment (after the dash-dot line) we applied optimized powerand phase settings.

124 First result of the phase I study
8.3.2 SAR analysis
Predicted SAR
SAR distributions were evaluated by using the 1g averaged Spatial Peak SAR [IEEE-1529] to remove high SAR values due to the staircase approximation of FDTD.Figure 8.5 shows the SAR distribution corresponding to optimized power and phasesettings with specificity factors Stumour = 1 and Smyelum,brain = 10. Figure 8.5 showsthat the target region is well covered by the SAR focus, i.e. the tumour is notvisible in Figure 8.5b since it is completely covered. Further, Figure 8.5b shows thata small region of high SAR is obtained at the ears as well. Figure 8.4 shows thecumulative SAR-Volume histogram. For this figure, instead of normalizing the SARdistributions to the maximum value, we calculated the SAR for 1 Watt total inputpower, so absolute SAR values can be obtained by multiplication with the total inputpower of all combined antennas. The figure shows that 90% of the tumour volumeis above the 25% iso-SAR value. Further, the SAR values in the entire central nervesystem (CNS: myelum and brains) are very low, even below the 5% of the maximumSAR value.
0 0.5 1 1.5 20
20
40
60
80
100
Spatial Peak SAR, 1g−averaged (W/kg @ Pin=1W)
Vol
ume
(%)
TumourCNSTotal
Figure 8.4: Cumulative SAR-Volume histogram for tumour tissue, CNS andthe total head corresponding to optimized settings (Stumour = 1,Smyelum,brain = 10).
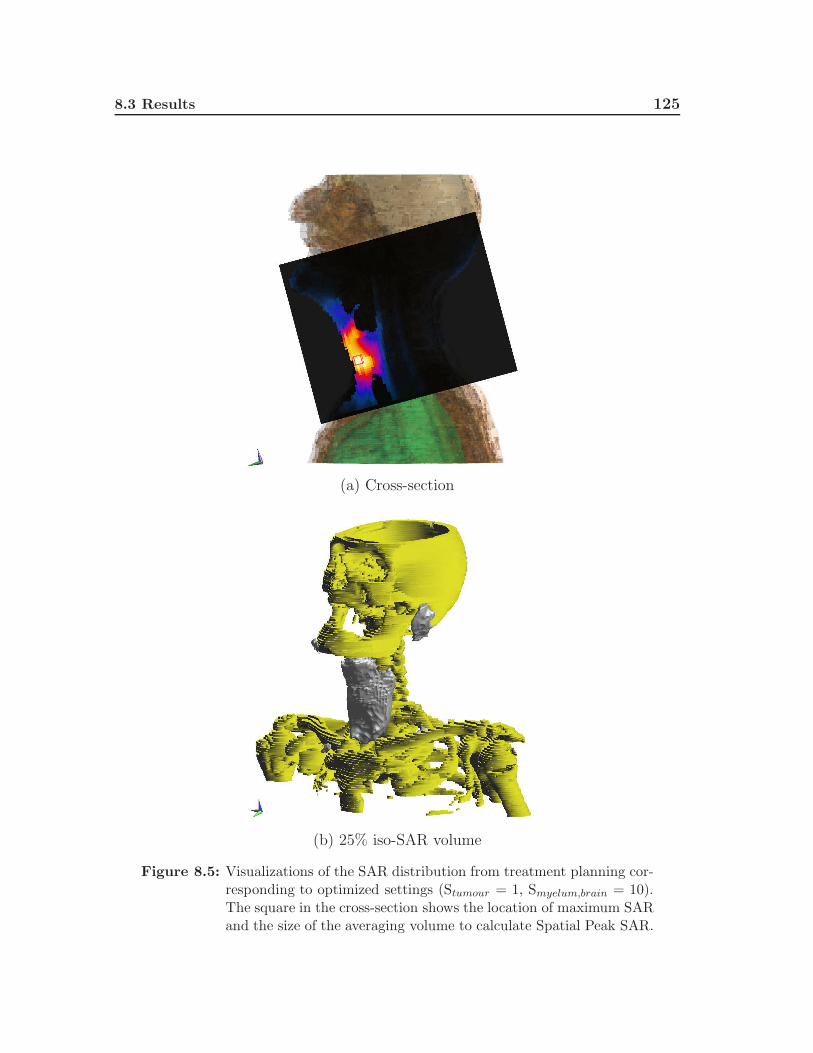
8.3 Results 125
(a) Cross-section
(b) 25% iso-SAR volume
Figure 8.5: Visualizations of the SAR distribution from treatment planning cor-responding to optimized settings (Stumour = 1, Smyelum,brain = 10).The square in the cross-section shows the location of maximum SARand the size of the averaging volume to calculate Spatial Peak SAR.

126 First result of the phase I study
"Myelum" Normal "Tumour"−20
0
20
40
60
80
Mea
sure
d S
AR
(W
/kg)
Interstitial catheterEsophagus catheterMean
Figure 8.6: Measured SAR values at 17 (TCP phases) and 60 (Optimized set-tings) minutes after power on (Figure 8.3) as a function of tissuetype. Measurement locations are clustered in myelum indicative, nor-mal and tumour indicative tissue points.
Measured SAR
Figure 8.6 shows the SAR values that are calculated from the decrease in tem-perature for TCP based phase settings at 17 minutes after start of the session, andoptimized settings at the last power off, 60 minutes after the start. This figure showsthat, on average, the highest SAR is measured at tumour indicative locations andthe lowest at myelum indicative locations. Further, all high values in normal tissueare measured within the esophagus catheter: close to the tumour, whereas the lowvalues are measured in the interstitial catheter: close to myelum.
Comparison measured and predicted SAR
Figure 8.7 shows the simulated and measured SAR tracks for the measurement pointsinside the interstitial and esophagus catheter. This figure shows that the correlationbetween simulated and measured SAR values is much better for optimized settingsthan for TCP based phase settings. The accuracy of the SAR measurements for TCPphase settings is probably seriously affected by the non-equilibrium temperatures,which obviously has the largest influence for the low SAR values within the inter-stitial catheter. For the optimized settings, especially for the interstitial catheter,the resemblance between measured and simulated SAR is quite good. Further, itseems that all measured SAR values in the esophagus are too low. These low valuesare probably caused by air flow cooling during breathing and swallowing and a badcontact between probes and tissue. Also, the local specific heat capacity may bedifferent from the approximated value of muscle. Finally, there is a 3cm differencebetween the measured and simulated location of the maximum SAR. The cause of

8.4 Discussion 127
−6 −4 −2 0−10
0
10
20
30
40
50Interstitial catheter
Distance from skin (cm)
SA
R (
W/k
g)
"myelum"
simulationmeasurement
−4 −2 0 2 4
0
50
100
150
Esophagus catheter
Distance to mid−tumour (cm)
"tumour"
(a) TCP based phase settings
−6 −4 −2 0−5
0
5
10
15
20
Interstitial catheter
Distance from skin (cm)
SA
R (
W/k
g)
"myelum"
simulationmeasurement
−4 −2 0 2 4
0
50
100
150
Esophagus catheter
Distance to mid−tumour (cm)
"tumour"
(b) Optimized settings
Figure 8.7: Comparison between simulated (1g averaged spatial peak SAR) andmeasured SAR tracks for the measurement points inside the intersti-tial and esophagus catheter. Tracks correspond to TCP based phasesettings with equal power settings or optimized power and phasesettings.
this difference remains to be determined but due to the lack of a CT including theintraluminal catheter it was very difficult to accurately assess the axial locations ofthe measurement probes. In future we expect to be able to circumvent the problemsso the track can be determined more accurately from the CT.
8.4 Discussion
In this chapter we report on the first patient within our phase I study into thepossibility of heating tumours in the head and neck region with the HYPERcollar.

128 First result of the phase I study
The first goal of the phase I study is demonstration of the possibility of deep heatingby measuring temperatures above 39C. We measured temperatures up to 40.6Cat tumour indicative measurement points and all myelum indicative temperaturesremained below 39C, and below 38.6C during application of the optimized settings.The high values close to the tumour were obtained for optimized settings at the endof the session and the limitation at that point was the maximum power output ofone of the amplifiers. We expect to be able to circumvent this problem by ensuringthat the power is distributed more over all antennas.
A difficulty in the temperature measurements, and therefore also SAR measure-ments, is knowledge of the exact measurement location that is important due to thelarge gradients in the SAR patterns corresponding to the high frequency: 433 MHz.This problem is the most relevant for the temperature measurement probes in theesophagus catheter since the interstitial catheter was inserted under CT guidance.For the esophagus catheter we have no exact information on its track and thiscatheter can move relatively freely within the esophagus. Therefore, the exact (x/y)positioning and axial location are difficult to reconstruct.
We used only temperature measurements at power off to determine the SAR sincethe measurements at power on were too much biased due to 1) a too small powerincrease, 2) a too slow power and phase control loop. Only for optimized settingswe obtained an equilibrium so only for these measurements we obtained the highestpossible accuracy. However, if we do compare the SAR measurements of TCP andOptimized settings we find the better performance for optimized settings, i.e. theSAR values close to the tumour are measured to be higher. The SAR values atmyelum indicative points using TCP settings seem to be within the measurementaccuracy, due to the non-equilibrium of the temperatures that decrease the accuracyof the measurements for these low values.
By treatment planning we could show that 90% of the tumour volume can be en-compassed by the 25% iso-SAR contour for optimized settings. Verification of thevalidity of treatment planning in this patient was hampered by the low amount ofmeasurements and their quality but the regions of the highest and lowest SAR valueswere well predicted.
With respect to the comfort assessment, we found no problems for the patient tofinish the heating session. On one hand this patient was an ideal case since he washighly motivated to contribute to science, on the other hand though he suffered frompain in the back and therefore had difficulties with moving and there were problemswith positioning on the CT table and HT bed. Nevertheless, lying on the bed withthe neck in the applicator was comfortable. Therefore, we anticipate that for allpatients the level of comfort will be sufficient.

8.5 Conclusion 129
8.5 Conclusion
In this chapter we have described the heating session of the first patient of the PhaseI study. During the session, we measured temperatures between 39.6 and 40.6C attumour indicative locations and low temperatures (< 38.6C) at myelum indicativelocations. Therefore, we conclude that tumour selective heating was obtained inthis patient by using the HYPERcollar. We found that the level of comfort wassufficient for this patient to endure the full treatment length: an hour. Further, bytreatment planning we could show that 90% of the tumour volume could be coveredby the 25% iso-SAR contour. Lastly, we found no evidence of hyperthermia relatedtoxicity immediately after treatment and the next day. We conclude that, althoughwe experienced problems since this was the first patient, we have succeeded in allgoals of the phase I study in this session.

130 First result of the phase I study

CHAPTER 9
General discussion and perspectives
132 General discussion and perspectives
9.1 General discussion and perspectives
9.1.1 Evaluation of the design approach
We have approached the design of a phased array H&N HT applicator by startingwith a simple arrangement and stepwise increasing the complexity of the model.Hereto, we performed parameter studies to provide insight in the influence of allindividual parameters on the SAR distribution. The parameters were clustered intothree groups. From the inside to the outside of the phased array hyperthermia appli-cator these are: 1) anatomy, 2) antenna array and 3) waterbolus related parameters.The parameter studies effectively increased the knowledge on relevant parameters,which formed a good foundation for the choices that had to be made. Investigationsinto the waterbolus related effects have focussed on conceptual steps, as these ef-fects depend heavily on practical constraints. An extensive analysis of these effectsrequires as starting point information on the actual waterbolus shape during HTsessions.
During the last decade, EM modelling has increased substantially in terms of ac-curacy as well as in possibilities for fast computations using large computationaldomains. Therefore, it has become possible to use the exact geometrical applicatordescriptions making the current models as predictive as experimental measurements.As a result, time-intensive experimental verifications can be avoided and an appli-cator can be designed using virtual prototyping. In this research we performed ex-tensive theoretical parameter studies. Using their results, we were able to convergemuch faster to a final design since they enabled limiting the amount of verificationexperiments that were required. We constructed only one laboratory prototype thatwe used to verify focussed heating and steering possibilities in the neck. By thesemeasurements, we further showed that the FDTD model is very suitable to fastand accurately predict the EM distribution for harmonic signals. Further, by virtualprototyping we studied the benefits of new antenna concepts.
Our approach also differed from previous applicator design approaches in the factthat we aimed at a site-specifically designed applicator. Up to now, EM modelswere not sufficiently predictive so parameter studies were limitedly performed andhyperthermia applicators were generally firstly designed and secondly assessed forits applicable sites. Our approach, of using theoretical studies, enables a fast conver-gence towards the final design. However, the use of this site-specific design approachdoes require a better definition of the problem since the quality of the final designis highly dependent on the defined boundaries and demands for the applicable area.
In a medical environment, most projects are multi-disciplinary and therefore theirsuccess is very dependent on the joint efforts of all people involved. A major challengefor a design and construction team is to involve medical partners, that will be theend-users, at an early stage so constructive discussions can be used to select the bestapproach. In our project, we found that it is very difficult for all project membersto imagine relevant topics concerning the quality of the HT treatment during the

9.1 General discussion and perspectives 133
abstract first phase of the design process. In many cases, design demands becameclear after the set-up was built but by then the project had advanced to a stage thatmajor efforts were required to modify the design. The solution would be to strive forproviding even more information to all partners. When informed well, every memberof the team can exploit his/her specific knowledge in the discussions on the majorchoices which would surely enhance the final outcomes of the project.
9.1.2 Evaluation of the design
Theoretical investigations
Extensive parameter studies have been used to find the optimum set-up for heatingin the neck. In Chapter 3 we established that, while the anatomy has a clear influenceon the shape of SAR pattern, no major changes in focus location are introduced forcentral phase settings. Further, the SAR patterns within the cylindrical phantomare comparable to the absorption patterns predicted in 3D models. In Chapter 2and 4 we found that the main parameter of interest for central heating in the neckis the operating frequency. Secondly, the number of antennas and antenna ringswere found to be important as well for SAR focussing. The heating profiles andSAR steering possibilities of the theoretically designed array were experimentallyverified, as described in Chapter 6, in order to assess the predictive value of themodel and to validate our approach. By conducting IR thermography measurementson a laboratory prototype we measured a central 50% iso-SAR focus of around 90mmin length and 35mm in diameter in a muscle phantom. In Chapter 5 we designed aspecial patch antenna as a replacement for the dipoles used in the parameter studies.
In the parameter studies, we separated waterbolus effects from array related influ-ences on the SAR pattern. Of course, it is difficult to completely separate water-bolus related influences from array related influences, especially at bolus-air transi-tions38 16. However, waterbolus shapes are difficult to prescribe clinically and theyhighly depend on practical limitations. We chose to observe the shape that leads tothe highest convenience for the patient and include this shape in the model. Chap-ter 7 shows that a good focus is obtained in the applicator with a certain bolussize. However, more research is needed into the actual effects that the finite-sizedwaterbolus has on the SAR pattern.
Antenna design
We have investigated the application of a probe-fed patch antenna design in aphased-array H&N hyperthermia applicator. This design has several advantages overthe antennas currently used, i.e. waveguides and dipoles. The main advantage of theprobe-fed patch design is the direct feeding with a coaxial cable, i.e. no matchingcircuit is required. This leads to easier, as well as more accurate, modelling and alsoto more robustness and a higher efficiency. By performing characterization mea-

134 General discussion and perspectives
surements we found that the reflections remain sufficiently low within a waterbolustemperature range of 15-35C. During treatment sessions and measurements, how-ever, we measured a much higher reflection due to cross-coupling, i.e. irradiationby the other antennas, but never above the tolerance limits of the power amplifiersystem.
9.1.3 Evaluation of the HYPERcollar applicator system
The head and neck region is characterized by many small in diameter structuresand large cooling vessels. Applying a good HT treatment to this region is thereforea challenging task. In this project we have designed an applicator that has twelveantennas and, consequently, has 23 degrees of freedom (power and relative phase ofall signals). Too many for intuitive settings and therefore highly detailed patient-specific treatment planning is mandatory to find the optimum settings for thesechannels. This need is even higher for dual or large target regions. Therefore weused SEMCAD X, a highly detailed treatment planning program, that enabled toaccurately model the applicator and the patient’s anatomy. By initial verificationmeasurements we showed that the SAR pattern predictions correlate well with themeasurements and that dynamic steering is adequately predicted. Treatment plan-ning results further show that the antenna array design provides sufficient degreesof freedom: it is possible to optimize the SAR pattern such that heating the pri-mary tumour alone but also simultaneous heating of primary tumour and a largelymphnode appears to be possible. In the transversal plane, selective focussing atthe target area can be obtained but in the direction of the patient axis this focusis somewhat large for target-specific heating. This smaller dimension of the focus inthe transversal plane is an important feature since, in this plane, the critical tissuesare nearby and better selective heating is required.By comfort tests with healthy volunteers we observed no breathing problems and forthese volunteers it was feasible to remain in treatment position for an hour. By usinga special filling pump the waterbolus can be filled in approximately one minute butspecial care has to be paid to the removal of the air. After filling the waterbolus, thevalves are closed and a closed water system is obtained containing a much smallervolume of water. A limited water volume is relevant to shorten the time neededto change the watertemperature. Further, a closed water system requires only littlepump strength for circulating the water so low-pressure pumps are sufficient, whichimproves the safety of the system.
Results of the first HT session
By application of a HT session to the first patient of the currently running phase Istudy we found that the level of comfort of the applicator was sufficient for this H&Npatient. In this session we showed that in all tumour-indicative measurement points,in a catheter close to the tumour, effective temperatures could be obtained. Further
9.1 General discussion and perspectives 135
we managed to keep myelum indicative temperatures low. Heart-rate remained equalduring the entire session and we observed no toxicity.
9.1.4 Future work and perspectives
Applicator improvements
A major item in the fast, accurate and comfortable application of head and neckhyperthermia is the controllable and reproducible positioning of the patient in treat-ment position. In the current design this item has received little attention and, atpresent, positioning is still cumbersome. In the future, improvement of the position-ing process deserves attention because, amongst others, the level of comfort andrequired effort during positioning determines the stress of the treatment and theamount of personnel that is required.
As a starting point for the applicator design we aimed at selecting a single design forall locations in the neck. By using an optimizer to automatically optimize the SARpattern we found that generally the powers of the antennas in the neck (in dorsaldirection) are set to 0. These settings were probably obtained because the targetregions that we studied were ventral to the myelum while the SAR in the myelumhad to be minimized. In case target regions are always ventral to the myelum, moreoptimized antenna arrangements may be possible.
Although the waterbolus was as small as possible, still changing the waterbolustemperature is found to be relatively slow and needs good planning in advance.Additional research, using a thermal model, needs to be performed to investigatethe effect of the waterbolus on the temperature pattern and to establish guidelines.Another difficulty forms the shape of the waterbolus which varies substantially andmay influence the SAR pattern. The exact influence of this shape on the SAR patternremains to be determined.
A last item that is indirectly related to the design of the applicator but very impor-tant for future work is the construction of a set-up for quality assurance (QA). InChapter 6 we have chosen a set-up including the Schottky-diode E-field sheet systemas most optimum for QA. This device enables quick measurements and can be per-formed at low power resulting in very small temperature variations and, as a result,in more predictable di-electric properties of the phantom materials. Future researchinto a modified design of the Schottky-diode E-field sheet system should provide ahigher resolution and reduction of air-gaps and therefore a better knowledge of theSAR distributions that can be obtained with the HYPERcollar.
Thermometry during treatment
An important issue for a high quality treatment is knowledge of the applied dose.For a hyperthermia treatment, this actual dose remains difficult to define, and cur-rent research focussed on the influences of blood flow and increased oxygenation.

136 General discussion and perspectives
The process of finding the treatment determining parameters may well be boostedif 3D thermal data becomes available. Therefore, assessment of the 3D temperaturedistribution during treatment is one of the biggest challenges that remains to besolved. Up to now, most hyperthermia centers rely on a limited amount of tem-perature measurements within intraluminal or interstitial catheters. Probably thebest way to obtain temperature data, however, is using non-invasive thermometrytechniques (NIT)103. Therefore, extensive research is directed in the measurementof the 3D thermal distribution by MRI measurements. This technique is promisingbut requires the availability of high-cost MRI equipment. Two other NIT methodsare ultra-sound (US) or microwave imaging (MWI). These techniques are not verywell established and still require fundamental research. Another option is to furtherimprove treatment planning and use patient-specific thermal models for predictingthe temperature in the patient. This pathway however requires a lot of work onmodel validations and subjects like improving QA, improving patient positioning,acquisition of the electromagnetic and thermal model and knowledge of the vari-ability of dielectric and thermal properties of tissues. If all these requirements arefulfilled, and one can assure SAR dose, then treatment determining parameters canbe investigated in vivo, which probably will result in a major boost in the requiredknowledge for finding the ultimate goal of the treatment.
Clinical perspectives
Application of HT to other sites in the H&N Physically, the potential ofthe applicator for other sites is limited by the amount of penetration depth requiredfor the specific site. The applicable areas are thus determined by the concave shapeof the head and neck region, i.e. widening diameter towards shoulders and head.Further, a practical constraint is that during treatment the patient should be ableto breath normally limiting the possibilities of using the HYPERcollar for treatmentof sites higher in the head and neck region. The other sites at which adequate HT canbe applied with the HYPERcollar remain to be determined. However, such researchshould be initiated by specific clinical demands.
Potential of HT for the larynx and hypopharynx region Treatment ofadvanced squamous cell carcinoma of the head and neck (HNSCC) still remainschallenging. The currently standard radiochemotherapy treatment generally resultsin a 5-year survival rate of 20% to 65%12, depending on the site, stage and treat-ment techniques used. The addition of chemotherapy to radiation is at the costof major toxicity, i.e. approximately 80% of patients require a feeding tube duringtreatment12. Further, late toxicities related to radiation, such as loss of salivaryfunction and soft tissue fibrosis, can lead to difficulties in speaking and eating43.These toxicities can be avoided by keeping the dose to the concerned tissues low8,43.There are two possible goals of adding HT to current treatment schedules, i.e. 1)increase of local tumour control by the addition of HT to current treatment modal-

9.1 General discussion and perspectives 137
ities or 2) decrease of toxicity due to the replacement of current modalities, or apart of them, by HT. Based on treatment planning results of ten H&N patients,we expect no elevation of the toxicity related to RT since the SAR levels predictedin the myelum are very low. Recently, a relationship between RT dose, received bythe muscular components of the swallowing apparatus, and - dysphagia related -quality of life (QoL) was found for 81 patients with oropharyngeal cancer treatedwith IMRT / 3DCRT ± Chemotherapy55. A steep dose-effect relationship, with anincrease of the probability of dysphagia of 19% with every additional 10 Gy, wasestablished. The multivariate analysis shows a significant effect of dose. Experimen-tal studies have shown that HT enhances RT by a factor between 1.2 and 598 andclinical studies in H&N cancer suggest a thermal enhancement ratio of 1.671. Anenhancement of RT toxicity to normal tissues generally is not observed. Therefore,one way to improve the QoL is to constrain the dose to be received by the swallowingmuscles and supplement this dose reduction with HT.Combining all possibilities, there is sufficient potential for the thorough explorationof the effect of adding HT to the currently available options for a multi-modalitytreatment of cancers in the head and neck region.

138 General discussion and perspectives
Summary
Treatment of advanced tumours in the head and neck (H&N) remains complex andthe toxicity related to the currently standard treatment modalities remains a majorissue. For many tumour sites, the addition of hyperthermia (HT) to radiotherapy hasbeen shown to result in remarkably higher (complete) response rates, improved localcontrol rates, better palliative effects and/or better overall survival rates. HT hasa high potential to improve cancer treatment results in H&N patients as well whileadding no toxicity. However, an appropriate applicator that can heat both superfi-cially and deeply located target sites in the H&N region is currently not available.
This thesis describes the items that needed to be addressed to design and build suchan applicator. Extensive theoretical parameters studies were performed 1) to showthe feasibility of deep heating in the H&N using radiofrequency (RF) waves and 2)to guide the design of the applicator. These parameter studies were performed usingelectromagnetic (EM) simulation programs. These predictions were then verified bymeasurements and with their results we designed and build a clinical prototype. Weperformed treatment planning for several patients to establish the specific absorp-tion rate (SAR) patterns that are achievable with this applicator. Lastly, the heatingsession of the first patient of the ongoing clinical feasibility study is evaluated.
After a general introduction in Chapter 1, the investigations into the ability todeposit RF-energy centrally in the neck are reported in Chapter 2. For this in-vestigation we used a realistic model of the H&N anatomy, which is irradiated bya circumferential array of dipole antennas, and calculated the corresponding powerabsorption distributions. An optimal focussing ability of the set-ups, i.e. the abilityto direct energy efficiently into the target region, was found for frequencies between400 and 600 MHz. The optimum frequency is found to be highly dependent on thesize of the target volume but relatively robust for different neck sizes. Finally it isfound that this focussing ability at 433 MHz is enhanced significantly by increasingthe number of antenna elements from four to six and eight, but this enhancement islimited for a further extension to sixteen antennas.

140 Summary
The objective of the work described in Chapter 3 was to gain insight in the distor-tions on the local SAR distribution by various major anatomical structures in theneck. Calculations, based on a high resolution variable grid and a finite differencetime domain (FDTD) algorithm, are conducted for a semi-3D generic phantom.This muscle-equivalent phantom was based on average dimensions obtained fromCT-derived human data and simplified structures representing trachea, cartilage,spine and spinal cord. In addition, phantoms with dimensions equal to maximumand minimum values within the CT-derived data are also studied. By exposingthese phantoms to a circular coherent array of eight dipoles, driven at 433 MHzusing no phase delays, we found a centrally located region of high SAR within allneck phantoms. This focal region changes from a circular cross-section in the caseof the muscle phantom to a donut shaped region when the anatomical structuresare inserted. However, the location of the focus does not change. We conclude thatthe SAR obtained in homogeneous phantom measurements can be considered rea-sonable predictive for the SAR patterns in more complex geometries.
Chapter 4 describes the exploration of the options of a circular, multi-ring, arrayof antennas to deposit RF-energy centrally in the neck. We found that, for ob-taining one single arrangement for all patients, an enlarged antenna ring radius isrequired, which leads to some decrease in efficiency of the set-up. By improving theorientation of the antenna array with respect to the patient we could reduce thiseffect. Increasing the number of antenna rings led to a better focussing of the power(1 → 2 / 3 : ∼ 17%). Increase of the distance between these antenna rings resultedin a smaller - more target region conformal - focus but also a decreased penetrationof the waves to the center. From this study we selected an arrangement consistingof two rings of six antennas with a radius of 20cm and 6cm array spacing. Thisarrangement is considered a good choice providing the ability to heat the majorityof patients.
The next step was the design of an antenna element to replace the dipole antennasof the parameter studies, which is described in Chapter 5. Hereto we used EMmodelling for converging towards a resonant probe-fed patch antenna for the H&Napplicator. The main advantage of this design, over the designs currently used indeep hyperthermia, is the direct feeding with a coaxial cable, i.e. no matching circuitis required. We presume that this direct feeding leads to easier and more accuratemodelling, and also to greater robustness and higher efficiency. Further, the designis light and small (∼ λ/3). Theoretically, the electrical performance of the antennawas found to be satisfactory over a temperature range of 15-35C, and stable forpatient-antenna distances to as small as 4cm. As expected, the predictions furthershowed a very good match with the experimental verification measurements.

141
The purpose of the work described in Chapter 6 was to experimentally verifythe feasibility of focussed heating in the neck region by an array of two rings ofsix antennas as found in Chapter 4. SAR measurements were performed with a spe-cially constructed laboratory prototype H&N applicator, including a neck mimickingcylindrical muscle phantom. Measurements were conducted by three different meth-ods: i.e. electric-field Schottky-diode sheet measurements and, using the power-pulsetechnique, fiberoptic thermometry and infra-red (IR) thermography. Using phase-steering, we further showed that the antenna arrangement enables to adjust theSAR focus in radial (x/y) and axial (z) directions. A central 50% iso-SAR focus of35 mm (±3 mm) in diameter and around 100 mm (±15 mm) in length were obtainedusing the laboratory prototype for all investigated settings. SAR distributions, asmeasured by all three experimental methods, are qualitatively well predicted bythe simulations. For quality assurance (QA) measurements we conclude that theSchottky-diode sheet provides the best compromise between effort, speed and accu-racy, though a more specific and improved design is warranted.
All previous investigations have resulted in the construction of the novel HYPERcol-lar applicator system for clinical treatments. By the work described in Chapter 7,we aimed to show the features and potential of the applicator system for hyper-thermia treatments in the H&N region. By infra-red (IR) thermography in a neck-equivalent cylindrical phantom, we measured that a central focus in the neck can beobtained, with 50% iso-SAR lengths of 35 mm in radial (x/y) directions and around100 mm (±10 mm) in the axial direction (z). These dimensions are comparable tothe focus obtained with the laboratory prototype. By comfort tests with five healthyvolunteers we found that the applicator provides sufficient comfort to maintain intreatment position for an hour, which is the standard hyperthermia treatment du-ration in our center. Patient-specific treatment planning showed that the applicatorprovides sufficient degrees of freedom to enable encompassing simultaneously botha deep-seated primary laryngeal tumour and a superficial lymph node metastasis,at the 25% iso-SAR level. Therefore we conclude that heating of such a large andirregularly-shaped target region is feasible.
In Chapter 8 we report on the first heating session of the phase I study. In thisstudy we investigate the feasibility of deep heating in the H&N with the HYPERcol-lar. The first session was applied to an 82 year-old male patient with a squamous cellcarcinoma of the larynx (T3N0M0: a primary tumour without lymph node or distantmetastasis). According to the phase I study protocol, the most important aim wasto achieve temperatures above 39C at all measurement points in the gross tumourvolume. We found that tumour selective heating was obtained, i.e. we measuredtemperatures between 39.6 and 40.6C at tumour indicative locations and lowertemperatures at myelum indicative locations. Further, the level of comfort was suf-ficient for this patient to endure the full treatment hour. By treatment planning wecould further show that the tumour volume was well covered by the 25% iso-SAR

142 Summary
contour and we found no evidence of hyperthermia related toxicity. Therefore, weconcluded that all goals of the phase I study are met.

Samenvatting
De behandeling van gevorderde (grote) tumoren in het hoofd-hals (HH) gebied blijftlastig en de toxiciteit (bijwerkingen) bij de huidige standaardbehandelingen is nogsteeds een belangrijk item. Voor veel tumor locaties is aangetoond dat de toevoegingvan hyperthermie (HT) aan radiotherapie leidt tot opmerkelijk betere (complete)responses, verbeterde lokale controle, betere palliatieve effecten en/of betere over-levings cijfers. Er is een grote kans dat hyperthermie (HT) ook kan bijdragen aaneen goede behandeling van kanker in het HH gebied. Voor het HH gebied echterbestaat er nog geen apparaat dat zowel oppervlakkige als diep-gelegen tumoren kanverwarmen.
Dit proefschrift beschrijft alles wat nodig was om te komen tot een dergelijk HHHT applicator. Uitgebreide theoretische parameter studies, met behulp van electro-magnetische (EM) simulatie paketten, zijn uitgevoerd om 1) de mogelijkheid aan tetonen om diep te verwarmen in het HH gebied met radiofrequente (RF) golven en 2)om de keuzes voor het ontwerp te onderbouwen. De simulaties zijn geverifieerd metmetingen en daarna gebruikt om het klinische protoype te ontwerpen en bouwen.Met behulp van behandelplanningen voor meerdere patienten zijn verder de moge-lijke ”specific absorption rate” (SAR) verdelingen vastgesteld voor deze applicator.Tot slot, is in de eerste patient van een fase I (haalbaarheids) studie de mogelijkheidom diep te verwarmen aangetoond.
Na een algemene introductie in Hoofdstuk 1, wordt het onderzoek naar de mo-gelijkheid om centraal in de hals te verwarmen beschreven in Hoofdstuk 2. Voordit onderzoek is een realistisch model van de HH anatomie gebruikt, die door eencircumferentiele array (reeks) van dipool antennes wordt bestraald, en zijn de bij-behorende vermogensabsorptie distributies berekend. Het doel was hierbij om deopstelling te vinden waarmee de energie het beste kan worden gefocusseerd, d.w.z.dat de energie efficient naar het doelgebied wordt geleid. De frequentie die leidt toteen optimale focussering ligt tussen 400 en 600 MHz. De exacte optimale frequen-tie is erg afhankelijk van de grootte van het doelvolume maar relatief robuust voor

144 Samenvatting
andere hals diameters. Tot slot wordt de focussering van de energie verbeterd doorhet aantal antenne elementen te verhogen van vier naar zes of acht. Het voordeelvan een verdere uitbreiding tot zestien antennes is echter beperkt.
De doelstelling van het werk dat in Hoofdstuk 3 wordt beschreven is inzicht tekrijgen in de vervormingen van de lokale SAR distributie door diverse belangrijkeanatomische structuren in de hals. De berekeningen zijn uitgevoerd met een finitedifference time domain (FDTD) gebaseerd programma, met een variabel grid eneen hoge resolutie, voor een semi-3D generiek fantoom. Dit spier-equivalent fan-toom was gebaseerd op gemiddelde afmetingen uit CT scans van HH patienten enbestond uit vereenvoudigde structuren die trachea, kraakbeen, ruggemerg en rugge-wervel vertegenwoordigden. Bovendien werden fantomen met afmetingen gelijk aanmaximum en minimumwaarden bestudeerd. Door deze fantomen aan een circulairecoherente array van acht dipolen bloot te stellen, die golven van 433 MHz met gelij-ke fases uitzenden, werd een centraal gebied met hoge SAR waarden gevonden vooralle halsfantomen. Dit focus gebied verandert van een cirkelvorm in een donutvormwanneer de anatomische structuren in het fantoom worden geplaatst. De positievan het focusgebied verandert echter niet, dus homogene fantoom metingen kunnenvoorspelbaar worden geacht voor de meer complexe geometrieen.
Hoofdstuk 4 beschrijft het onderzoek naar de opties die een circumferentieel, multi-ring, array van antennes biedt om RF-energie centraal in de hals te focusseren.Voor het verkrijgen van een enkele opstelling voor alle patienten is een vergrotestraal van de antenne-ring vereist, welke tot een kleine daling van efficientie vande opstelling leidt. Door de orientatie van de antenne array, met betrekking totde patient, te veranderen kan deze daling in efficientie verminderd worden. Hetverhogen van het aantal antenneringen leidt tot een betere focussering van het ver-mogen (1 → 2 / 3 : ∼ 17%). De vergroting van de afstand tussen deze antenneringenresulteert in een kleiner - meer doelgebied conform - focusgebied, maar ook een ver-minderde penetratie van de golven naar het centrum. Als gevolg van deze studieis een opstelling geselecteerd bestaande uit twee ringen van zes antennes, met eenstraal van 20cm en 6cm afstand tussen de twee antenne ringen. Deze opstelling biedtwaarschijnlijk de mogelijkheid om de meerderheid van de tumoren te verwarmen.
De volgende stap was het ontwerp van een antenne element die de dipool antennesvan de parameterstudies kon vervangen, wat wordt beschreven in Hoofdstuk 5.Hiervoor is EM modellering gebruikt om een resonante ”patch” antenne voor de HHapplicator te vinden. Het belangrijkste voordeel van dit ontwerp, vergeleken met deontwerpen die momenteel in diepe HT worden gebruikt, is de directe voeding met eencoaxiale kabel, d.w.z. er is geen aanpassingscircuit vereist. Waarschijnlijk leidt dezedirecte aansluiting aan de coax kabel tot een gemakkelijkere en nauwkeurigere mo-dellering, en verder tot grotere robuustheid en hogere efficientie. Theoretisch, warende elektrische eigenschappen van de antenne geschikt voor temperaturen tussen 15 en

145
35C, en stabiel voor patient-antenne afstanden vanaf 4 cm. Zoals verwacht, toondende voorspellingen een zeer goede gelijkenis met de experimentele controlemetingen.
Het doel van het werk dat in Hoofdstuk 6 wordt beschreven, was het experimenteelverifieren van de haalbaarheid van het gefocusseerd verwarmen in het halsgebieddoor een serie van twee ringen van zes antennes, zoals gevonden in Hoofdstuk 4. SARmetingen werden uitgevoerd met een speciaal geconstrueerd laboratorium prototypevan de HH applicator, inclusief een cilindervormig spier equivalent fantoom van dehals. De metingen werden uitgevoerd met gebruik van drie verschillende meetme-thodes: elektrische veld Schottky-diode sheet metingen en, gebruik makend van de”power-pulse” techniek, fiberoptische thermometrie en infrarode thermografie (IR).Door middel van fase-sturing, werd aangetoond dat het met de antenne-opstellingmogelijk is om het SAR focus in radiale (x/y) richtingen en in de richting van depatient-as (z) aan te passen. Een centraal 50% iso-SAR focus van 35 mm (±3 mm)diameter en ongeveer 100 mm (±15 mm) lengte werd gevonden in het laboratoriumprototype voor alle onderzochte instellingen. De SAR distributies, zoals die met alledrie de experimentele methodes zijn gemeten, werden kwalitatief goed voorspelddoor de simulaties. Vanuit deze metingen werd geconcludeerd dat het Schottky-diode sheet voor quality assurance (QA) metingen het beste compromis vormt tussenmoeite, snelheid en nauwkeurigheid. Echter, een aangepast ontwerp van het sheetzou hiervoor nog moeten worden ontwikkeld.
Al het voorgaande onderzoek heeft geresulteerd in de bouw van het nieuwe HYPER-collar applicator systeem voor klinische behandelingen. In Hoofdstuk 7 worden demogelijkheden en potentie van het applicator systeem voor HT behandelingen inhet HH gebied beschreven. Door middel van infrarode (IR) thermografie in eenspier-equivalent cilindrisch fantoom, werd vastgesteld dat een centraal SAR focusin de hals kan worden verkregen, met 50% iso-SAR lengtes van 35 mm in de radi-ale richtingen (x/y) en ongeveer 100 mm (±10 mm) in de richting van de patient-as(z). Deze afmetingen zijn vergelijkbaar met het SAR focus dat met het laboratoriumprototype werd verkregen. Comfort tests, bij vijf gezonde vrijwilligers, toonden aandat de applicator voldoende comfort biedt aan de patient om een uur in behande-lingspositie te blijven: de standaard duur van een HT behandeling in de Daniel denHoed kliniek. De patient-specifieke behandelingsplanning geeft aan dat de applicatorvoldoende vrijheidsgraden biedt voor het simultaan omvatten, op het 25% iso-SARniveau, van zowel een diepgelegen primaire larynx tumor als een oppervlakkige lym-feklier metastase. Daarom concluderen wij dat verwarmen van een dergelijk groot,en onregelmatig gevormd, doelgebied uitvoerbaar is met de HYPERcollar.
In Hoofdstuk 8 wordt de eerste verwarmings sessie van de eerste patient in de faseI (haalbaarheids) studie beschreven. In deze studie onderzoeken wij de mogelijkheidom tumoren in het HH gebied met de HYPERcollar te verwarmen. Deze eerste sessiewerd toegepast op een 82-jarige mannelijke patient met een squamous celcarcinoom

146 Samenvatting
in het strottehoofd (T3N0M0: een primaire tumor zonder lymfeklier of afstand me-tastase). In het fase I studieprotocol, is het belangrijkste doel om temperaturenboven 39C te bereiken op alle meetpunten in het tumor volume. Tijdens de sessievonden wij dat de tumor selectief verwarmd kan worden: temperaturen tussen 39.6en 40.6C werden gemeten bij alle tumor-indicatieve meetpunten en lagere tempe-raturen bij myelum-indicatieve meetpunten. Verder, vonden wij dat het niveau vancomfort voor deze patient volstond om de volledige behandelingsduur van een uur tevolbrengen. Door middel van behandelingsplanning werd verder aangetoond dat hettumorvolume voldoende door de 25% iso-SAR contour werd omvat en wij vondengeen aanwijzingen van HT-toxiciteit. Concluderend betekent voorgaande dat, hoeweler problemen waren, alle doelstellingen van de fase I studie zijn behaald voor dezepatient.

List of publications
International journal publications
M.M. Paulides, S.H.J.A. Vossen, A.P.M. Zwamborn and G.C. Van Rhoon, ”Theo-retical investigation into the feasibility to deposit RF energy centrally in the headand neck region,” Int. J. Rad. Onc. Biol. Phys., vol. 63, p. 634-642, 2005.
M.M. Paulides, D.H.M. Wielheesen, J. Van der Zee and G.C. Van Rhoon, ”Assess-ment of the local SAR distortion by major anatomical structures in a cylindricalneck phantom,” Int. J. Hyperthermia, vol. 21, p. 125-140, 2005.
M.M. Paulides, J.F. Bakker, A.P.M. Zwamborn and G.C. Van Rhoon, ”A head andneck hyperthermia applicator: theoretical antenna array design,” Int. J. Hyperther-mia, vol. 23, p. 59-67, 2007.
M.M. Paulides, J.F. Bakker, N. Chavannes and G.C. Van Rhoon, ”A patch antennadesign for a phased-array head and neck hyperthermia applicator,” IEEE Trans.Biom. Eng., In press.
M.M. Paulides, J.F. Bakker and G.C. Van Rhoon, ”A head and neck hyperthermiaapplicator: experimental phantom verification and FDTD model,” Int. J. Rad. Onc.Biol. Phys., vol. 68, p. 612-620, 2007.
M.M. Paulides, J.F. Bakker, E. Neufeld, J. van der Zee, P.P. Jansen, P.C. Levendagand G.C. van Rhoon. ”The HYPERcollar: a novel applicator for hyperthermia inthe head and neck,” Int. J. Hyperthermia., (accepted).
E. Neufeld, M. Paulides, T. Samaras, N. Chavannes, G. van Rhoon, G. Szekelyand N. Kuster. ”Requirements, techniques and implementations for routine highresolution hyperthermia treatment planning in clinical applications,” Int. J. Hyper-thermia., (submitted).
148 Publications
Publications at conferences
M.M. Paulides, S.H.J.A. Vossen, B.J.A.M. van Leersum, A.P.M. Zwamborn, J. Vander Zee and G.C. van Rhoon, ”Hyperthermia treatment of head and neck tumours:an initial exploration”, 21st Annual meeting of the European Society for Hyperther-mic Oncology, 2003, Munchen, Germany.
M.M. Paulides, D.H.M. Wielheesen, M. de Bruijne, W.M. Lee, J. van der Zee andG.C. van Rhoon, ”Heating the head and neck: SAR distortions by major anatomystructures”, 9th International Congress on Hyperthermic Oncology, 2004, St. Louis,USA.
N. Siauve, L. Nicolas, C. Vollaire, N. Burais and M.M. Paulides, ”Development ofa treatment planning tool for hyperthermia treatment of cancerous tumours withelectromagnetic fields”, 3rd international workshop on biological effects of electro-magnetic fields, 2004, Kipriotis Village Resort, Kos, Greece.
G.C. Van Rhoon, M. de Bruijne, M.M. Paulides, J. van der Zee and A.P.M. Zwamborn,”Improvement of the clinical application of superficial hyperthermia during the lasttwo decades.” Radiother. & Oncol. vol. 73, p. 251, 2004.
M.M. Paulides, S.H.J.A. Vossen, A.P.M. Zwamborn and G.C. van Rhoon, ”Theo-retical investigation into the feasibility to deposit RF energy centrally in the headand neck region”, 22nd Annual meeting of the European Society for HyperthermicOncology, 2005, Graz, Austria.
N. Siauve, M.M. Paulides, L. Nicolas, B.J.A.M. van Leersum, G.C. van Rhoon,C. Vollaire and A. Nicolas, ”Comparison of FDTD and FE Methods in NumericalDosimetry for the Treatment of Cancerous Tumours with Electromagnetic Fields”,The 15th Conference on the Computation of Electromagnetic Fields, Shenyang,2005, Liaoning, China.
J.F. Bakker, M.M. Paulides, G.C. van Rhoon, H. Schippers and T.A. Ter Meer, ”De-velopment of a gain & phase detector for a hyperthermia applicator”, Proceedingsof joint 9th International Conference on Electromagnetics in Advanced ApplicationsICEAA ’05 and 11th European Electromagnetic Structures Conference EESC ’05,ISBN 88-8202-094-0, p. 209-212, 2005, Torino, Italy.
M.M. Paulides, J.F. Bakker and G.C. van Rhoon, ”A patch antenna design for aphased-array applicator for hyperthermia treatment of head and neck tumours”,Proceedings of the 3rd European Medical & Biological Conference, IFMBE Eu-ropean Conference on Biomedical Engineering (EMBEC), ISSN: 1727-1983, 2005,Prague, Czech Republic.

149
M.M. Paulides, J.F. Bakker and G.C. van Rhoon, ”A head and neck hyperthermiaapplicator: theoretical antenna array design”, 23nd Annual meeting of the EuropeanSociety for Hyperthermic Oncology, 2006, Berlin, Germany.
V. Bhandari, M.M. Paulides, J. Van Der Zee and G.C. van Rhoon, ”Developmentof hyperthermia treatment planning for head and neck malignancies”, 28th Annualmeeting of the International Clinical Hyperthermia Society (ICHS), 2007, Mumbai,India.
M.M. Paulides, J.F. Bakker, P.P. Jansen, P.C. Levendag, J. van der Zee and G.C.van Rhoon, ”Innovations in technology to targeted heating in head and neck hyper-thermia”, 28th Annual meeting of the International Clinical Hyperthermia Society(ICHS), 2007, Mumbai, India.
M.M. Paulides, J.F. Bakker, P.P. Jansen, P.C. Levendag, J. van der Zee and GCvan Rhoon, ”A novel head and neck applicator for targeted hyperthermia”, Inter-national meeting on innovative approaches in head and neck oncology (EHNS -ESTRO), 2007, Barcelona, Spain.
M.M. Paulides, J.F. Bakker and G.C. van Rhoon, ”A patch antenna design for ahead and neck hyperthermia applicator”, The 23rd International Review of Progressin Applied Computational Electromagnetics (ACES), 2007, Verona, Italy.
M.M. Paulides, J.F. Bakker, P.P. Jansen, P.C. Levendag, J. van der Zee and GC vanRhoon, ”The HYPERcollar: a novel head and neck applicator for targeted hyper-thermia”, 8th International meeting on progress in radio-oncology ICRO / OGRO,2007, Salzburg, Austria.
J. van der Zee, M. de Bruijne, M.M. Paulides, M. Franckena, R. Canters and G.C.van Rhoon, ”The use of hyperthermia treatment planning in clinical practice”, 8thInternational meeting on progress in radio-oncology ICRO / OGRO, 2007, Salzburg,Austria.
M.M. Paulides, J.F. Bakker, P.P. Jansen, P.C. Levendag, J. van der Zee and G.C.van Rhoon, ”Innovations in technology to target heating in head and neck hyper-thermia”, World Conference on Interventional Oncology and Society of ThermalMedicine, May 14-17, 2007, Washington DC, USA.
M.M. Paulides, J.F. Bakker, E. Neufeld, P.P. Jansen, P.C. Levendag, J. van derZee and GC van Rhoon, ”The HYPERcollar: a novel phased-array applicator forhyperthermia treatment in the neck”, 24th Annual meeting of the European Societyfor Hyperthermic Oncology (ESHO), 2007, Prague, Czech Republic.

150 Publications
M.M. Paulides, J.F. Bakker, N. Chavannes and G.C. van Rhoon, ”A patch antennaelement for the HYPERcollar applicator: design and characterization”, 24th Annualmeeting of the European Society for Hyperthermic Oncology (ESHO), 2007, Prague,Czech Republic.
J.F. Bakker, M.M. Paulides and G.C. van Rhoon, ”A phased array head and neckapplicator: measurements of the SAR distributions in a cylindrical muscle phan-tom”, 24th Annual meeting of the European Society for Hyperthermic Oncology(ESHO), 2007, Prague, Czech Republic.
Honors
Young Investigator Travel Award of the 9th International Congress on Hyperther-mic Oncology (ICHO), 2004, St. Louis, USA.
ESHO-student Award of the 23rd Annual Meeting of the European Society for Hy-perthermic Oncology (ESHO), 2006, Berlin, Germany.
Kim Award of the 24th Annual Meeting of the European Society for HyperthermicOncology (ESHO), 2007, Czech Republic.

Curriculum Vitae
Margarethus Marius Paulides was born in the Netherlands in 1979. After graduatinghighschool (HAVO) he started his study electrical engineering at the Hogeschool ’sHertogenbosch. After receiving his first year ”Propadeuse” diploma he continuedstudying electrical engineering at Eindhoven University of Technology (EUT) wherehe received his M.Sc. degree in 2002. For this study he worked on a calibration pro-cedure for an active-microwave imaging scanner at l’Ecole Superieure d’Electricite(Supelec) situated near Paris (France). His graduation project was carried out atTNO-FEL, The Hague and was in association with the Hyperthermia Unit of theErasmus MC. From 2003, he worked as AIO/Promovendus/OIO towards his PhD de-gree at the Hyperthermia Unit, Department of Radiotherapy, Erasmus MC - Danielden Hoed Cancer Center, Rotterdam, the Netherlands. His work was within a DutchCancer Society project entitled: ”Development, construction and clinical testing of anovel electromagnetic applicator for hyperthermia treatment of advanced head andneck carcinoma”. His research interests are in the area of hyperthermia treatmentplanning, bioelectromagnetics, antenna design and applied clinical physics.

152 Curriculum Vitae
Dankwoord / Acknowledgements
Aan het einde van mijn promotie traject is de tijd gekomen om terug te kijken opwat geweest is maar zeker nog niet vergeten. Een promotie lijkt in vele opzichten opeen moeilijke wedstrijd. Maar deze hoeft gelukkig niet alleen te worden gestreden.Er zijn vele mensen geweest die op hun eigen wijze een bijdrage geleverd hebbenaan het tot stand komen van dit proefschrift. Al deze mensen ben ik veel dank ver-schuldigd en een aantal mensen daarvan wil ik in het bijzonder eruit lichten.
Hoe kun je een wedstrijd winnen zonder de goede materialen? Hiervoor zorgden deleden van de instrumentmakerij, en in het bijzonder Bert. De sfeer bij jullie is al-tijd goed en relaxed en verder sta ik nog steeds versteld van het vakwerk dat jullieafleveren bij de constructie van de HYPERcollar.Further, I would like to express my sincere gratitude to Esra who was always will-ing to implement new features in SEMCAD at my demand. Also, I would like tothank all people of Speag and the IT’IS Foundation (Zurich, Switzerland) for theircontinuous help in many ways.Het Nationaal Lucht- en Ruimtevaartlaboratorium (NLR) en de afdeling klinischeinstrumentatie van het UMC Utrecht wil ik bedanken voor hun bijdrage aan hetversterkersysteem en de goede samenwerking.Verder wil ik ook Anton Tijhuis en iedereen van de Technische Universiteit Eind-hoven bedanken voor de inwijding in de elektrotechniek, specifiek de elektromag-netisme, en de hulp tijdens mijn promotie traject.
Een zware strijd kan niet worden gestreden vanuit een goede basis. De unit hyper-thermie vormt deze basis door het verzorgen van de gezelligheid tussen het werkdoor. De koffietafel is de plaats waar lief en leed kunnen worden gedeeld en zelfs demeest baanbrekende ontdekkingen kunnen worden gerelativeerd. De boeiende mixvan laboranten, artsen, technici en fysici zorgt voor een kakelbont geheel waar aangezichtspunten geen gebrek is. Verder is hier ook het forum waar de ideeen uit dekliniek en de wetenschap samen kunnen worden gevoegd. Specifiek wil ik hier deleden van het hoofd-hals behandel team benoemen: Cobi en Laurens, voor al huninspanningen voor het klinische deel van de hoofd-hals behandeling. Verder wil ik

154 Dankwoord / Acknowledgements
Cobi danken voor alles wat je me geleerd hebt met betrekking tot alle klinischeaspecten van een hyperthermie behandeling.
Alle mensen van mijn tweede basis tijdens het project, TNO te Den Haag, wil ik be-danken voor de interessante discussies en al jullie bijdragen. Hierbij wil ik specifiekStefan en Chris noemen van wie ik heb geleerd dat wetenschap, naast inhoudelijkwerk, toch ook mensenwerk is. Hans Strijbos wil ik specifiek noemen voor zijn hulpin het ontwerp van de ”patch” antenne. Verder dacht je altijd mee zodat in eenvroeg stadium de potentiele problemen konden worden voorzien.Speciaal wil ik ook Peter Zwamborn bedanken voor je immer persoonlijke begelei-ding als afstudeer-hoogleraar en promotor. Altijd wilde je tijd vrijmaken voor eenhoogst nodig gesprek of ”zo maar even bijpraten”.
Peter Levendag wil ik bedanken voor je werk als mijn promotor en het vertrouwendat je op cruciale momenten uitsprak in mij en het hoofd-hals project.
Een van de belangrijkste schakels binnen het project en mijn promotie was Gerard,de ”niet-zo-stille” motor achter het project. Je tomeloze enthousiasme werkt echtaanstekelijk en aan ideeen is er nooit gebrek. Het ”out-of-the-box” denken heb jetot een kunst verheven, net als het creatief inzetten van de financieen. Verder ben jeook altijd bezig om iedereen zichzelf te laten ontplooien en verlies je de menselijkekant van het verhaal nooit uit het oog. Gerard, ook zonder jou zou dit alles nooitvoor elkaar gekomen zijn.
Projectwerk is teamwerk en het project had dus nooit kunnen slagen zonder de inzetvan Jurriaan. Het is best bijzonder om een collega te vinden die zo ongeveer allezwakke kanten die je hebt kan compenseren. Onze combinatie zorgde voor een grootsynergistisch effect en dus een grote JER (Jurriaan Enhancement Ratio). Jur, ookjou wil ik hartelijk danken.
Het strijdperk van de wetenschap kan niet goed worden betreden zonder een goedevoorbereiding. In dit verband wil ik vooral mijn ouders bedanken die altijd achterme gestaan hebben en zijn ingesprongen waar dat nodig was. Misschien was echterhet belangrijkste nog wel dat jullie me een groot doorzettingsvermogen hebbenmeegegeven, door zelf hierin voor te gaan. Voor alle bemoeienissen en positievekritiek: hartelijk dank.
Als laatste wil ik mijn liefste bedanken. Zij weet mij altijd met mijn voeten op degrond en mijn hoofd in de wolken te houden.

155

156 Dankwoord / Acknowledgements

Bibliography
1. Sigma eye applicator operator manual. BSD Medical Corporation, 1995.
2. M Amichetti, M Romano, L Busana, A Bolner, G Fellin, G Pani, L Tomio, andR Valdagni. Hyperfractionated radiation in combination with local hyperther-mia in the treatment of advanced squamous cell carcinoma of the head andneck: a phase I-II study. Radiother Oncol, 45:155–158, 1997.
3. Ansoft Designer. Ansoft Coorporation (http://www.ansoft.com).
4. JF Bakker, MM Paulides, GC Van Rhoon, H Schippers, and TA Ter Meer. De-velopment of a gain & phase detector for a hyperthermia applicator. In Proceed-ings of the joint 9th International Conference on Electromagnetics in AdvancedApplications (ICEAA ’05) and 11th European Electromagnetic Structures Con-ference (EESC ’05), pages 209–212, Torino, Italy, 2005. ISBN 88-8202-094-0.
5. CA Balanis. Antenna theory: Analysis and design. John Wiley & Sons, Inc.,New York, 2nd edition edition, 1997.
6. R Ben-Yosef and DS Kapp. Direct clinical comparison of ultrasound and radia-tive electromagnetic hyperthermia in the same tumours. Int J Hyperthermia,11:1–10, 1995.
7. J Bernier, J Denekamp, A Rojas, E Minatel, J Horiot, H Hamers, P Antognoni,O Dahl, P Richaud, M Van Glabbeke, and M Pi. ARCON: Accelerated Ra-diotherapy with Carbogen and Nicotinamide in head and neck squamous cellcarcinomas. the experience of the cooperative group of radiotherapy of the eu-ropean organization for research and treatment of cancer (EORTC). RadiotherOncol, 55:111–119, 2000.
8. PM Braam. Parotid gland sparing radiotherapy. PhD thesis, Utrecht University,2007.

158 BIBLIOGRAPHY
9. CHM Clemens, SHJA Vossen, AB Woltering, and APM Zwamborn. Studyof the possible effects on health of the use of portable terminals within theC2000 radio network. TNO-FEL internal report: FEL-02-C152, ReproductionDepartment of The Netherlands Organisation of Applied Scientific Research(TNO), 2003.
10. R Colombo, LF Da Pozzo, A Salonia, P Rigatti, Z Leib, J Baniel, E Caldarera,and M Pavone-Macaluso. Multicentric study comparing intravesical chemother-apy alone and with local microwave hyperthermia for prophylaxis of recurrenceof superficial transitional cell carcinoma. J Clin Oncol, 21:4270–4276, 2003.
11. ESHO Taskgroup Committee. Treatment planning and modelling in hyperther-mia, a task group report of the European Society for Hyperthermic Oncology.Tor Vergata, Rome, Italy, 1992.
12. BA Conley. Treatment of advanced head and neck cancer: what lessons havewe learned? J Clin Oncol, 24:1023–1024, 2006. Editorial.
13. J Crezee, HP Kok, J Wiersma, G Van Stam, J Sijbrands, A Bel, and PMAVan Haaren. Improving locoregional hyperthermia equipment using 3D powercontrol: from AMC-4 to AMC-8. In Abstracts of the 22nd Annual Meeting ofthe ESHO, Graz, Austria (ESHO-05), pages 14–15, June 2005.
14. O Dahl, R Dalene, BC Schem, and O Mella. Status of clinical hyperthermia.Acta Oncol, 38:863–873, 1999.
15. M De Bruijne, T Samaras, E Neufeld, and GC Van Rhoon. Effectiveness ofFDTD in Predicting SAR Distributions from the Lucite Cone Applicator. InAbstracts of the 22nd Annual Meeting of the ESHO, Graz, Austria (ESHO-05),June 2005.
16. M De Bruijne, T Samaras, JF Bakker, and GC Van Rhoon. Effects of waterbo-lus size, shape and configuration on the SAR distribution pattern of the Lucitecone applicator. Int J Hyperthermia, 22:15–28, 2006.
17. MW Dewhirst, L Pronnitz, D Thrall, D Prescott, S Clegg, C Charles, J MacFall,G Rosner, T Samulski, E Gillette, and S LaRue. Hyperthermia treatment ofmalignant diseases: Current status and a view towards the future. Semin Oncol,24:616–625, 1997.
18. MW Dewhirst, Z Vujaskovic, E Jones, and D Thrall. Re-setting the biologicalrationale for thermal therapy. Int J Hyperthermia, 21:779–790, 2005.
19. S Dische, M Saunders, A Barrett, A Harvey, D Gibson, and M Parmar. Arandomised multicentre trial of CHART versus conventional radiotherapy inhead and neck cancer. Radiother Oncol, 37:123–126, 1997.

BIBLIOGRAPHY 159
20. S El-Sayed and N Nelson. Adjuvant and adjunctive chemotherapy in the man-agement of squamous cell carcinoma of the head and neck region: A meta-analysis of prospective and randomized trials. J Clin Oncol, 14:838–847, 1996.
21. SB Field and C Franconi. Physics and Technology of Hyperthermia. MartinusNijhoff Publishers, P.O. box 163, 330 AD Dordrecht, 1987. ISBN 90-247-3509-2.Chapter I-7.
22. SB Field and JW Hand. An introduction to the practical aspects of clinicalhyperthermia. Taylor & Francis Ltd., 4 John st., London WC1N2ET, 1990.
23. CM Furse, DH Roper, DN Buechler, DA Christensen, and CH Durney. TheProblem and Treatment of DC Offsets in FDTD Simulations. IEEE Trans AntProp, 48(8):1198–1201, 2000.
24. C Gabriel, S Gabriel, and E Corthout. The dielectric properties of biologicaltissues I: Literature survey. Phys Med Biol, 41:2231–2249, 1996.
25. S Gabriel, RW Lau, and C Gabriel. The dielectric properties of biologicaltissues II: Measurements in the frequency range 10 Hz to 20 GHz. Phys MedBiol, 41:2251–2269, 1996.
26. S Gabriel, RW Lau, and C Gabriel. The dielectric properties of biologicaltissues III: Parametric models for the dielectric spectrum of tissues. Phys MedBiol, 41:2271–2293, 1996.
27. R Garg, P Bhartia, I Bahl, and A Ittipiboon. Microstrip antenna design hand-book. Artech House, 685 Canton Street, Norwood, MA 02062, 2001. ISBN0-89006-513-6.
28. EA Gelvich, VN Mazokhin, and II Throshin. An attempt at quantitativespecification of SAR distribution homogeneity. Int J Hyperthermia, 12:431–436, 1996.
29. EJ Gross, TC Ceetas, PR Stauffer, RL Liu, and ML Lumori. Experimentalassessment of phased-array heating of neck tumours. Int J Hyperthermia, 6:454–474, 1990.
30. AW Guy, CK Chou, and KH Luk. 915-MHz phased-array system for treatingtumours in cylindrical structures. IEEE Trans Micr Theor Tech, 34:502–507,1986.
31. JW Hand and JR James. Physical Techniques in Clinical Hyperthermia. Re-search Studies Press LTD. 58B Station Road, Letchworth, Herts. SG6 3BE,England, 1986. ISBN 0-86380-037-8. Chapter 4.

160 BIBLIOGRAPHY
32. JW Hand, JJW Lagendijk, Bach Andersen J, and JC Bolomey. Quality assur-ance guidelines for ESHO protocols. Int J Hyperthermia, 5:421–428, 1989.
33. J Haveman, J Van der Zee, J Wondergem, JF Hoogeveen, and MC Hulshof.Effects of hyperthermia on the peripheral nervous system: a review. Int JHyperthermia, 20:371–392, 2004.
34. J Haveman, P Sminia, J Wondergem, J Van der Zee, and MC Hulshof. Effectsof hyperthermia on the central nervous system: What was learned from animalstudies? Int J Hyperthermia, 21:473–487, 2005.
35. FM Henke, WT Joines, and TV Samulski. Variations of focal regions versusnumber and positions of sources in two-dimensional media. Int J Hyperthermia,17:382–400, 2001.
36. TW Hertel and GS Smith. On the convergence of common FDTD feed modelsfor antennas. IEEE Trans Ant Prop, 51:1771–1779, 2003.
37. J-C Horiot, P Bontemps, W Van den Bogaert, R Le Fur, D Van den Weijngaert,M Bolla, J Bernier, A Lusinchi, M Stuschke, J Lopez-Torrecilla, AC Begg,M Pierart, and L Collette. Accelerated fractionation compared to conventionalfractionation improves loco-regional control in radiotherapy of advanced headand neck cancers: Results of the EORTC 22851 randomized trial. RadiotherOncol, 44:111–121, 1997.
38. SN Hornsleth. Radiofrequency regional hyperthermia. PhD thesis, AalborgUniversity, Denmark, 1996.
39. NG Huilgol. A phase I study to study arsenic trioxide with radiation andhyperthermia in advanced head and neck cancer. Int J Hyperthermia, 22:391–397, 2006.
40. K Ito, K Furuya, Y Okano, and L Hamada. Development and Characteristicsof a Biological Tissue-Equivalent Phantom for Microwaves. Electronics andCommunications in Japan, 84:67–77, 2001.
41. S Jacobsen and F Melandsø. The concept of using multifrequency energytransmission to reduce hot-spots during deep-body hyperthermia. Ann BiomEng, 30:1–10, 2002.
42. WT Joines, Y Zhang, C Li C, and RL Jirtle. The measured electrical propertiesof normal and malignant human tissues from 50 to 900 mhz. Med Phys, 21:547–550, 1994.
43. AS Jones, DE Phillips, and FJM Hilgers. Diseases of head, neck, nose andthroat. Hodder Headline Group, 1998. ISBN 0-340-64610-1. Chapter 12: ”ra-diotherapy in head and neck oncology”.

BIBLIOGRAPHY 161
44. E Jones, D Thrall, MW Dewhirst, and Z Vujaskovic. Prospective thermaldosimetry: the key to hyperthermia’s future. Int J Hyperthermia, 22:247–253,2006.
45. F Jouvie, JC Bolomey, and G Gaboriaud. Discussion of the capabilities ofmicrowave phased arrays for hyperthermia treatment of neck tumours. IEEETrans Micr Theor Tech, 34:495–501, 1986.
46. RSJP Kaatee and GC Van Rhoon. An electric field measurement system, usinga two-dimensional array of diodes. Int J Hyperthermia, 15:441–454, 1999.
47. HH Kampinga. Cell biological effects of hyperthermia alone or combined withradiation or drugs: A short introduction to newcomers in the field. Int JHyperthermia, 22:191196, 2006.
48. RWP King, BS Trembley, and JW Strohbein. The electromagnetic field of aninsulated antenna in a conducting or dielectric medium. IEEE Trans MicrTheor Tech, 31:574–583, 1983.
49. T Kohler, P Maass, P Wust, and M Seebass. A fast algorithm to find optimalcontrols of multiantenna applicators in regional hyperthermia. Phys Med Biol,46:2503–2514, 2001.
50. H Kroeze, JB Van de Kamer, AAC De Leeuw, and JJW Lagendijk. Regionalhyperthermia applicator design using FDTD modelling. Phys Med Biol, 46:1919–1935, 2001.
51. JJW Lagendijk. Hyperthermia treatment planning. Phys Med Biol, 45:61–76,2000.
52. JJW Lagendijk, GC Van Rhoon, SN Hornsleth, P Wust, AC De Leeuw,CJ Schneider, JD Van Dijk, J Van Der Zee, R Van Heek-Romanowski, SA Rah-man, and C Gromoll. Esho quality assurance guidelines for regional hyperther-mia. Int J Hyperthermia, 14:125–133, 1998.
53. J Lang, B Erdmann, and M Seebass. Impact of nonlinear heat transfer ontemperature control in regional hyperthermia. IEEE Trans Biomed Eng, 46:11291138, 1999.
54. HK Lee, AG Antell, CA Perez, WL Straube, G Ramachandran, RJ Myerson,B Emami, EP Molmenti, A Buckner, and MA Lockett. Superficial hyperther-mia and irradiation for recurrent breast carcinoma of the chest wall: prognosticfactors in 196 tumours. Int J Rad Oncol Biol Phys, 40:365–375, 1998.
55. PC Levendag. Dysphagia disorders in patients with cancer of the oropharynxare significantly affected by the radiation therapy dose to the superior andmiddle constrictor muscle: a dose-effect relationship. Radiother Oncol, 2007.

162 BIBLIOGRAPHY
56. RL Magin and AF Peterson. Noninvasive microwave phased arrays for localhyperthermia: a review. Int J Hyperthermia, 5:429–450, 1989.
57. VA Marcial and TF Pajak. Radiation therapy alone or in combination withsurgery in head and neck cancer. Cancer, 55:2259–2265, 1989.
58. CD Mathers, C Boschi-Pinto, AD Lopez, and CJL Murray. CancerIncidence, Mortality and Survival by site for 14 regions of the world.Global Programme on Evidence for Health Policy Discussion Paper No. 13,http://www.who.int/entity/healthinfo/paper13.pdf, World Health Organiza-tion, 2001.
59. C Michel, PY Cresson, L Dubois, M Chive, and J Pribetich. Design andmodeling of microstrip-microslot applicators with several patches and aperturesfor microwave hyperthermia. Micr Opt Tech Lett, 14:121–126, 1997.
60. RR Million and NJ Cassisi. Management of head and neck cancer: a multidis-ciplinary approach. JB Lippincott, New York, 1994.
61. TB Moller and E Reif. Pocket atlas of cross-sectional anatomy: CT andMRI., volume Volume 1: Head, Neck, Spine and Joints. Georg Thieme VerlagStuttgart, New York, 1994.
62. G Mur. Absorbing boundary conditions for the finite-difference approximationof the time-domain electromagnetic field equations. IEEE Trans ElectromagCompat, 23:377–382, 1981.
63. J Nadobny, H Fahling, MJ Hagmann, PF Turner, W Wlodarczyk, JM Geller-mann, P Deuflhard, and P Wust. Experimental and Numerical Investigationof Feed-Point Parameters in a 3-D Hyperthermia Applicator Using DifferentFDTD Models of Feed Networks. IEEE Trans Biom Eng, 49:1348–1359, 2002.
64. J Nadobny, W Wlodarczyk, L Westhoff, J Gellermann, B Rau, G Monich, andP Wust. Development and evaluation of a three-dimensional hyperthermiaapplicator with WAter-COated Antennas (WACOA). Int J Hyperthermia, 30:2052–2064, 2003.
65. National Cancer Institute. Cancer Facts, Head and Neck Cancer:Questions and Answers. http://www.cancer.gov/cancertopics/factsheet/Sites-Types/head-and-neck. 2005.
66. Nederlandse Kanker Registratie. http://www.ikcnet.nl. 2003.
67. E Neufeld, T Samaras, N Chavannes, G Szekely, and N Kuster. An improvedblood flow model to simulate EM induced hyperthermia. In Abstracts of the23nd Annual Meeting of the ESHO, Berlin, Germany (ESHO-06), May 2005.

BIBLIOGRAPHY 163
68. P Nilsson. Physics and technique of microwave-induced hyperthermia in thetreatment of malignant tumours. PhD thesis, Lund University, 1984.
69. The Nello Carrara Institute of Applied Physics of the Consiglio Nazionale delleRicerche (IFAC-CNR). Florence. Italy. http://niremf.ifac.cnr.it/tissprop/.1997-2002.
70. JR Oleson. If we cant define the quality, can we assure it? J Rad Oncol BiolPhys, 16:879, 1989.
71. J Overgaard. The current and potential role of hyperthermia in radiotherapy.Int J Rad Oncol Biol Phys, 16:535–549, 1998.
72. MM Paulides, SHJA Vossen, APM Zwamborn, and GC Van Rhoon. Theoreticalinvestigation into the feasibility to deposit RF energy centrally in the head andneck region. Int Rad Onc Biol Phys, 63:634–642, 2005.
73. MM Paulides, DHM Wielheesen, J Van der Zee, and GC Van Rhoon. Assess-ment of the local SAR distortion by major anatomical structures in a cylindricalneck phantom. Int J Hyperthermia, 21:382–400, 2005.
74. MM Paulides, JF Bakker, and GC Van Rhoon. A head and neck hyperthermiaapplicator: experimental phantom verification and FDTD model. Int J RadOncol Biol Phys, 68:612–620, 2007.
75. MM Paulides, JF Bakker, APM Zwamborn, and GC Van Rhoon. A headand neck hyperthermia applicator: theoretical antenna array design. Int JHyperthermia, 23:59 – 67, 2007.
76. MM Paulides, JF Bakker, N Chavannes, and GC Van Rhoon. A patch antennadesign for a phased-array head and neck hyperthermia applicator. IEEE TransBiom Eng, In press.
77. KD Paulsen, S Geimer, J Tang, and WE Boyse. Optimisation of pelvic heatingrate distributions with electromagnetic phased arrays. Int J Hyperthermia, 15:157–186, 1999.
78. HH Pennes. Analysis of tissue and arterial blood temperature in the restinghuman forearm. J Appl Phys, 1:93–122, 1948.
79. JP Pignon, J Bourhis, and Designe L Domenge, C. Chemotherapy added tolocoregional treatment for head and neck squamous-cel carcinoma: three meta-analyses of updated individual data. Lancet, 355:949–955, 2000.
80. PMJ Rietveld, JB Van de Kamer, J Van der Zee, and et al. Influence of varia-tions in position, form, and contents of semi-simple phantoms in the BSD-2000Sigma-60 applicator on SAR distributions. In Abstracts of the International

164 BIBLIOGRAPHY
Congress of Hyperthermic Oncology (ICHO-2000), page 145, Kyongju, SouthKorea, April 26th-29th 2000.
81. T Samaras, PJM Rietveld, and GC Van Rhoon. Effectiveness of FDTD inPredicting SAR Distributions from the Lucite Cone Applicator. IEEE TransMicr Theor Tech, 48:2059–2063, 2000.
82. T Samaras, GC Van Rhoon, and JN Sahalos. Theoretical investigation ofmeasurement procedures for the quality assurance of superficial hyperthermiaapplicators. Int J Hyperthermia, 18:416–425, 2002.
83. M Seebass, R Beck, J Gellerman, J Nadobny, and P Wust. Electromagneticphased arrays for regional hyperthermia: Optimal frequency and antenna ar-rangement. Int J Hyperthermia, 17:321–336, 2001.
84. SEMCAD: the Simulation platform for EMC, Antenna Design and Dosimetry.Schmid & Partner Engineering AG (http://www.semcad.com).
85. M Serin, HS Erkal, and A Cakmak. Radiation therapy, cisplatin, and hyper-thermia in combination in management of patients with recurrent carcinomasof the head and neck with meta-static cervical lymph nodes. Int J Hyperther-mia, 15:371–381, 1999.
86. N Siauve, L Nicolas, C Vollaire, and C Marchal. Optimization of the sources inlocal hyperthermia using a combined finite element-genetic algorithm method.Int J Hyperthermia, 20:815–833, 2004.
87. PR Stauffer. Evolving technology for thermal therapy of cancer. Int J Hyper-thermia, 21:731–744, 2005. Review.
88. A Stogryn. Equations for Calculating the Dielectric Constant of Saline Water(Correspondence). IEEE Trans Micr Theor Tech, 19:733–376, 1971.
89. A Taflove and SC Hagness. Computational Electrodynamics: The Finite-Difference Time-Domain Method. Artech House, 685 Canton Street, Norwood,MA 02062, 3rd edition, 2005. ISBN 1-580-53832-0.
90. A Trotti. Toxicity in head and neck cancer: a review of trends and issues. IntJ Rad Oncol Biol Phys, 47:1–12, 2000.
91. P Turner. Apparatus for creating hyperthermia in tissue. Technical report, USPatent No. 4,589,423, 1986.
92. PF Turner and T Schaeffermeyer. BSD-2000 approach for deep local and re-gional hyperthermia. Strahlentherapie und Oncologie, 165:738–741, 1989.
BIBLIOGRAPHY 165
93. HR Underwood, AF Peterson, and RL Magin. Electric-Field Distribution NearRectangular Microstrip Radiators for Hyperthermia Heating: Theory VersusExperiment in Water. IEEE Trans Biom Eng, 39:146–153, 1992.
94. R Valdagni and M Amichetti. Report of long-term follow-up in a randomizedtrial comparing radiation therapy and radiation therapy plus hyperthermia tometastatic lymph nodes in stage IV head and neck patients. Int J Rad OncolBiol Phys, 28:163–169, 1993.
95. R Valdagni, F-F Liu, and S Kapp. Important prognostic factors influencingoutcome of combined radiation and hyperthermia. Int J Rad Oncol Biol Phys,15:959–972, 1988.
96. JB Van de Kamer, N Van Wieringen, AAC De Leeuw, and JJW Lagendijk.The significance of accurate dielectric tissue data for hyperthermia treatmentplanning. Int J Hyperthermia, 17:123–142, 2001.
97. W Van den Bogaert, E Van Schueren, J-C Horiot, M De Vilhena, S Schraub,V Svoboda, G Arcangeli, M De Pauw, and M Van Glabbeke. The EORTCrandomized trial on three fractions per day and misonidazole (trial no. 22811)in advanced head and neck cancer; long-term results and side effects. RadiotherOncol, 35:91–99, 1995.
98. J Van der Zee. Heating the patient: a promising approach? Ann Onc, 13:1173–1184, 2002.
99. J Van der Zee, D Gonzalez Gonzalez, GC Van Rhoon, JD Van Dijk,WL Van Putten, and AA Hart. Comparison of radiotherapy alone with radio-therapy plus hyperthermia in locally advanced pelvic tumours: a prospective,randomised, multicentre trial. Dutch Deep Hyperthermia Group. Lancet, 355:1119–1125, 2000.
100. JD Van Dijk, C Schneider, R Van Os, LE Blank, and DG Gonzalez. Results ofdeep body hyperthermia with large waveguide radiators. Adv Exp Med Biol,267:315–319, 1990.
101. GMJ Van Leeuwen, JJW Lagendijk, BJAM Van Leersum, APM Zwamborn,SN Hornsleth, and ANTJ Kotte. Calculation of change in brain temperaturesdue to exposure to a mobile phone. Phys Med Biol, 44:2367–2379, 1999.
102. GC Van Rhoon. Radiofrequency hyperthermia systems: experimental and clin-ical assessment of the feasibility of radiofrequency hyperthermia systems forloco-regional deep heating. PhD thesis, Delft University, 1994.
103. GC Van Rhoon and P Wust. Introduction: Non-invasive thermometry forthermotherapy. Int J Hyperthermia, 21:489–495, 2006.

166 BIBLIOGRAPHY
104. GC Van Rhoon, A Ameziane, WM Lee, DJ Van der Heuvel, HJ Klinkhamer,C Barendrecht, K Volenec, and PJ Rietveld. Accuracy of electrical field mea-surement using the flexible Schottky diode sheet at 433 MHz. Int J Hyperther-mia, 19:134–144, 2003.
105. GC Van Rhoon, DJ Van Der Heuvel, A Ameziane, PJ Rietveld, K Volenec,and J Van Der Zee. Characterization of the SAR-distribution of the Sigma-60 applicator for regional hyperthermia using a Schottky diode sheet. Int JHyperthermia, 19:642–654, 2003.
106. P Vaupel and M Hockel. Blood supply, oxygenation status and metabolicmicromilieu of breast cancers: Characterization and therapeutic relevance (re-view). Int J Oncol, 17:869–879, 2000.
107. P Wust, M Seebas, J Nadobny, P Deuflhard, G Monich, and R Felix. Simula-tion studies promote technological development of radiofrequency phased arrayhyperthermia. Int J Hyperthermia, 12:477–498, 1996.
108. P Wust, M Seebas, JM Gellerman, P Deuflhard, and J Nadobny. Antennaarrays in the SIGMA-eye applicator: Interactions and tranforming networks.Med Phys, 28:1793–1805, 2001.