Developing Network Infrastructure For Classroom TechnologiesDEVELOPING NETWORK INFRASTRUCTURE FOR...
15
AC 2010-2283: DEVELOPING NETWORK INFRASTRUCTURE FOR CLASSROOM TECHNOLOGIES Joseph Tront, Virginia Tech David Bailey, Virginia Polytechnic and State University Thomas Walker, Virginia Tech Steven Lee, Virginia Tech © American Society for Engineering Education, 2010 Page 15.387.1
Transcript of Developing Network Infrastructure For Classroom TechnologiesDEVELOPING NETWORK INFRASTRUCTURE FOR...

AC 2010-2283: DEVELOPING NETWORK INFRASTRUCTURE FORCLASSROOM TECHNOLOGIES
Joseph Tront, Virginia Tech
David Bailey, Virginia Polytechnic and State University
Thomas Walker, Virginia Tech
Steven Lee, Virginia Tech
© American Society for Engineering Education, 2010
Page 15.387.1
1 | P a g e
DEVELOPING NETWORK INFRASTRUCTURE FOR
CLASSROOM TECHNOLOGIES
Abstract
In order for classroom technologies to be useful in engineering education, appropriate
infrastructures must be planned, implemented and tested so that they are sufficiently robust to
serve the needs of the target usage. Usage will vary depending on size of the class, complexity
of the teaching technology being used, and the amount of interactivity that the instructor attempts
to utilize. This paper describes an infrastructure planned to be used in large and medium sized
classrooms with the reasonably complex tool, Classroom Presenter, in a mode where four
different levels of interactions are used in the classroom. The hardware infrastructure is designed
for a nominal class size of 250 students with a medium amount of network traffic.
Testing of the infrastructure was performed using 80 student volunteers. The audience was
requested to complete individual timed operations including: downloading graphic slides,
receiving electronic ink strokes at each student station, students responding to polls, and students
submitting graphical information back to the instructor’s computer. All of these activities are
generally included in a typical highly interactive and engaging classroom.
The infrastructure design will be described. Data will be presented on the outcomes of the testing
including the timing of the data and graphical transmissions. Finally, suggested improvements to
the infrastructure will be made in order to facilitate its use for larger student populations.
Introduction
Designing classroom network infrastructures involves determining the expected bandwidth
needed and the amount of interaction latency that can be tolerated while still maintaining an
effective learning environment. The network implementation that will satisfy these two
parameters depends on the number of students in the classroom, the amount of data transmitted
by the courseware application, the network communications protocol implementation, and the
amount of interaction the students and instructor attempt to have during typical classroom
sessions.
A number of different classroom courseware tools are available on the market these days. Many
of them endeavor to support rich real-time classroom interaction by sending data back and forth
between student and faculty machines. Designing a network infrastructure to satisfy the needs of
Page 15.387.2
2 | P a g e
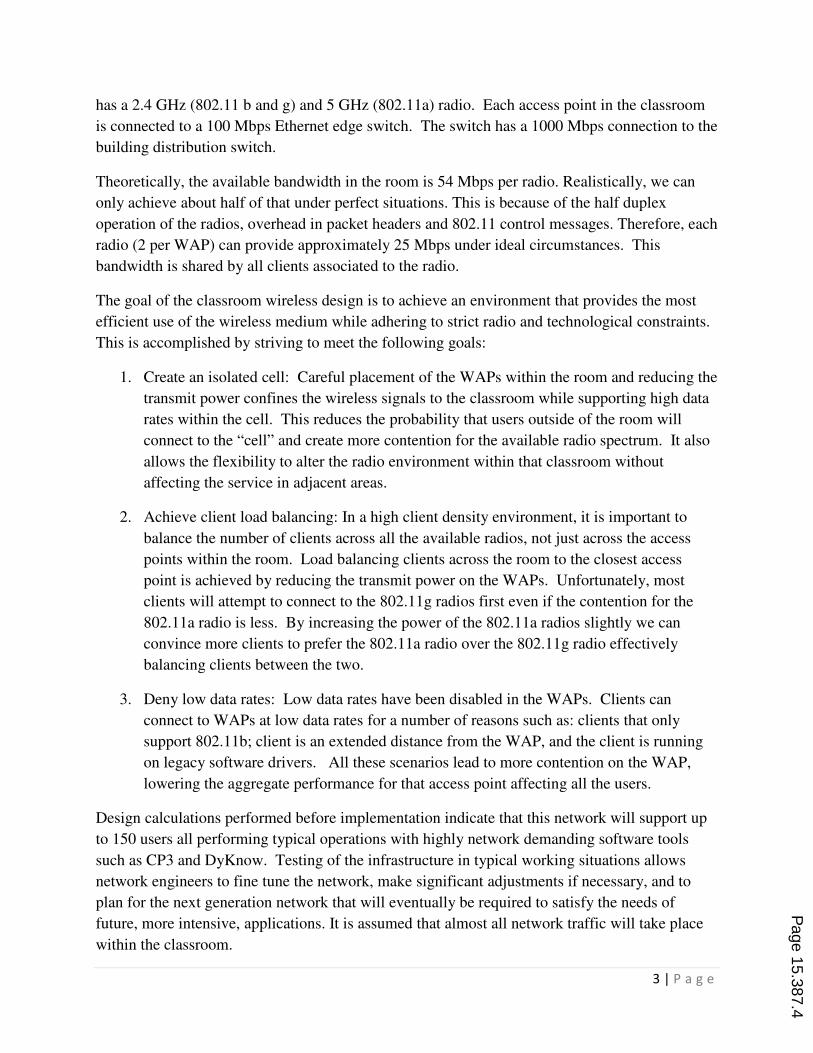
these software packages is best performed by planning for situations that produce the heaviest
network usage and then assuming that any less demanding operations will work fine if the most
demanding needs are satisfied. Two highly interactive programs built to operate most effectively
on Tablet PCs are Classroom Presenter and DyKnow. In their most network intensive modes,
both programs send data between students and faculty members in the form of graphical screen
data. Both use network unicast mode to send the data meaning that each client receives/sends an
individual message from/to a server containing full graphical screen data. The upshot of this
communication process is that for a faculty-students interaction in a classroom of size N, where
information of size M must be transmitted, N × M data must be transmitted through the network
for each such interaction.
Classroom Presenter 3 (CP3) was chosen as the courseware tool to be used to benchmark the
network infrastructure design. CP3 has several modes of interaction that can take place in typical
classroom sessions. These include:
1. Transmit presentation slides from instructor to students
2. Students receive electronic ink (e-ink) from instructor in real-time
3. Instructor receives student poll information from each of the students
4. Instructor receives student submissions consisting of full student screen shots
Each of these modes has specific performance expectations in terms of network response time. If
the technology operates too slowly, the learning environment will not be fluid enough to allow
for natural and timely interactions that are typical in good learning practices. Instructor
presentation slides must be delivered to students at the beginning of a presentation in less than
two to three minutes. The lag time for an e-ink stroke to appear on a student machine must be
less than one or two seconds. A quick poll must be able to be completely received from all
student machines in less than five seconds. Student screen submissions must arrive at the
instructor machine within one or two minutes. A sufficiently powerful network infrastructure
must be designed with these bounds in mind.
Network Infrastructure
The network infrastructure developed at Virginia Tech is based on a scheme where a sufficient
number of access points are placed in classrooms so that the number of students expected to
reside in the room during class times are satisfactorily served by the network. Using typical and
worst-case network traffic from applications such as CP3 allows the network design to be
sufficiently rich while not overdesigned. Of course the design always considers an appropriate
overdesign factor to allow for future increases in demand by more intense applications.
At Virginia Tech, a typical network implementation for a classroom whose capacity is 150
students consists of four Cisco 1240 Wireless Access Points (WAPs). Each wireless access point
Page 15.387.3
3 | P a g e
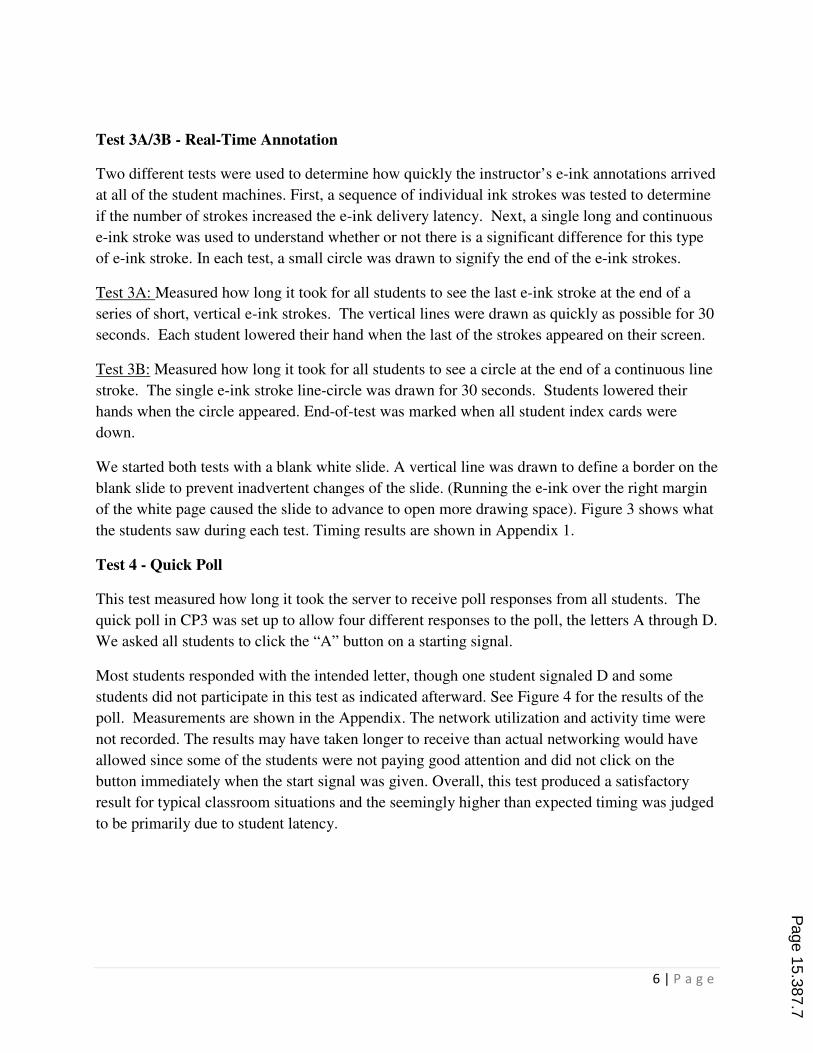
has a 2.4 GHz (802.11 b and g) and 5 GHz (802.11a) radio. Each access point in the classroom
is connected to a 100 Mbps Ethernet edge switch. The switch has a 1000 Mbps connection to the
building distribution switch.
Theoretically, the available bandwidth in the room is 54 Mbps per radio. Realistically, we can
only achieve about half of that under perfect situations. This is because of the half duplex
operation of the radios, overhead in packet headers and 802.11 control messages. Therefore, each
radio (2 per WAP) can provide approximately 25 Mbps under ideal circumstances. This
bandwidth is shared by all clients associated to the radio.
The goal of the classroom wireless design is to achieve an environment that provides the most
efficient use of the wireless medium while adhering to strict radio and technological constraints.
This is accomplished by striving to meet the following goals:
1. Create an isolated cell: Careful placement of the WAPs within the room and reducing the
transmit power confines the wireless signals to the classroom while supporting high data
rates within the cell. This reduces the probability that users outside of the room will
connect to the “cell” and create more contention for the available radio spectrum. It also
allows the flexibility to alter the radio environment within that classroom without
affecting the service in adjacent areas.
2. Achieve client load balancing: In a high client density environment, it is important to
balance the number of clients across all the available radios, not just across the access
points within the room. Load balancing clients across the room to the closest access
point is achieved by reducing the transmit power on the WAPs. Unfortunately, most
clients will attempt to connect to the 802.11g radios first even if the contention for the
802.11a radio is less. By increasing the power of the 802.11a radios slightly we can
convince more clients to prefer the 802.11a radio over the 802.11g radio effectively
balancing clients between the two.
3. Deny low data rates: Low data rates have been disabled in the WAPs. Clients can
connect to WAPs at low data rates for a number of reasons such as: clients that only
support 802.11b; client is an extended distance from the WAP, and the client is running
on legacy software drivers. All these scenarios lead to more contention on the WAP,
lowering the aggregate performance for that access point affecting all the users.
Design calculations performed before implementation indicate that this network will support up
to 150 users all performing typical operations with highly network demanding software tools
such as CP3 and DyKnow. Testing of the infrastructure in typical working situations allows
network engineers to fine tune the network, make significant adjustments if necessary, and to
plan for the next generation network that will eventually be required to satisfy the needs of
future, more intensive, applications. It is assumed that almost all network traffic will take place
within the classroom.
Page 15.387.4

4 | P a g e
Infrastructure testing
The network infrastructure described above was tested with several objectives in mind:
1) Assess usability of tools such as CP3 in the classroom given the state of the network
design.
2) Identify, if possible, any critical bottleneck that limits the number of participants in a CP3
(or other tools) session, or that degrades CP3 performance to an unusable level
3) Identify any adjustments instructors should use in order to take best advantage of the
combination of the software tool and network infrastructure.
4) Plan network infrastructure adjustments.
The network/software test was performed with 80 student participants in the target classroom, a
classroom with a wireless network infrastructure (802.11a, g) already shown to be capable of
handling more than 250 simultaneous connections of users that are doing typical web browsing.
The student participants were rising-freshmen taking part in a summer pre-college experience
program. We used the Networking tool in Windows Task Manager to observe network
utilization on the server. We also used a digital watch to measure elapsed time of student
receptions of and responses to CP3 activities. Communication Network Services (CNS)
monitored network traffic during the testing period and provided data that is discussed at the end
of the report.
The software we used was CP3 version 1934. The instructor Tablet was a Fujitsu T5010 (build
9SEN2), with a 2.4 GHz Intel Core 2 Duo CPU, 2 GB RAM, and the 32-bit Windows Vista
Business operating system. It used an Atheros AR928x wireless network adapter and Mobile
Intel 4 Series display chipset. It is important to note that the student machines are dual band
capable. The instructor machine acted as a TCP server when running CP3. The presentation test
deck was loaded into the instructor machine before the students started CP3. Each student was
using a Fujitsu T4210 Tablet, with a 1.83 GHz Centrino Duo CPU, 1 GB RAM, and Windows
Vista Enterprise.
We distributed 80 index cards, each with a number written on it. Because one student had
computer problems and could not participate in the pilot test, we will consider index card
numbers 1 -79 in this report. The index cards would be used later in the testing to recognize and
isolate any specific difficulties in operation. We also asked the students not to run any
applications except CP3 during the tests. We required all the students to connect to VT_WLAN,
the network subnet for this classroom.
Once the setup was completed, specific tests to gauge the operation in each of the operating
modes listed above were performed. The results are described below.
Page 15.387.5

5 | P a g e
Test 1 – Bulk slide transmission to students. Transmission
This test measured the typical operation that would occur at the beginning of a presentation
where all of the slides on the instructor machine are transmitted to each of the student client
machines at the beginning of class. In this test we measured the elapsed time between the start of
the slide deck transmission from the instructor (server) machine to the point where all students
received the last slide as indicated by them lowering their index card (previously raised at the
start of transmission verbal test command).
We used a test file named CP3-Test-Deck3-Tablet.cp3 (1028 KB) and displayed the last of five
slides on the server. Students were to indicate that their machines were displaying this same slide
by lowering their index card. At the start, students launched CP3, selected “Student” role, and
selected the presentation radio button. This is the typical client start up sequence for CP3. The
whole operation took about two minutes. Partial results for Test 1 are shown in Table 1 of the
Appendix.
Test 2 - Change of Slide
This test measured the elapsed time between the selection of a new slide by the instructor and
receipt of the change as indicated by lowering of the index cards of all students.
The test deck used was CP3-Test-Deck3-Tablet.cp3 (1028 KB). Starting at the last slide of the
deck, we timed how long it took for all students to see the change from one slide to another. See
Figure 2 for the two slides used in this measurement. It took roughly the same time to change in
either direction for these two slides. Measurement results for Test 2 are shown in Table 1 of the
Appendix.
(a)
(b)
Figure 2 Test 2 - Transition from slide (a) to slide (b)
Page 15.387.6
6 | P a g e
Test 3A/3B - Real-Time Annotation
Two different tests were used to determine how quickly the instructor’s e-ink annotations arrived
at all of the student machines. First, a sequence of individual ink strokes was tested to determine
if the number of strokes increased the e-ink delivery latency. Next, a single long and continuous
e-ink stroke was used to understand whether or not there is a significant difference for this type
of e-ink stroke. In each test, a small circle was drawn to signify the end of the e-ink strokes.
Test 3A: Measured how long it took for all students to see the last e-ink stroke at the end of a
series of short, vertical e-ink strokes. The vertical lines were drawn as quickly as possible for 30
seconds. Each student lowered their hand when the last of the strokes appeared on their screen.
Test 3B: Measured how long it took for all students to see a circle at the end of a continuous line
stroke. The single e-ink stroke line-circle was drawn for 30 seconds. Students lowered their
hands when the circle appeared. End-of-test was marked when all student index cards were
down.
We started both tests with a blank white slide. A vertical line was drawn to define a border on the
blank slide to prevent inadvertent changes of the slide. (Running the e-ink over the right margin
of the white page caused the slide to advance to open more drawing space). Figure 3 shows what
the students saw during each test. Timing results are shown in Appendix 1.
Test 4 - Quick Poll
This test measured how long it took the server to receive poll responses from all students. The
quick poll in CP3 was set up to allow four different responses to the poll, the letters A through D.
We asked all students to click the “A” button on a starting signal.
Most students responded with the intended letter, though one student signaled D and some
students did not participate in this test as indicated afterward. See Figure 4 for the results of the
poll. Measurements are shown in the Appendix. The network utilization and activity time were
not recorded. The results may have taken longer to receive than actual networking would have
allowed since some of the students were not paying good attention and did not click on the
button immediately when the start signal was given. Overall, this test produced a satisfactory
result for typical classroom situations and the seemingly higher than expected timing was judged
to be primarily due to student latency.
Page 15.387.7

7 | P a g e
(a)
(b)
Figure 3 (a) Vertical lines in Test 3A and (b) continuous line in Test 3B
Figure 4 Quick poll results
Test 5 - Student Submission
This test is perhaps the most critical in that it measured how long it took the server to receive
submissions from all students. The submissions consisted of screen information developed on the
student machine and sent to the instructor machine on the testers start signal. A typical
classroom scenario for this type of operation is when an instructor asks the class to graphically
respond to a question posed in the flow of a discussion. The test performed here is certainly a
worst-case situation since it asks all students to submit their data starting at the same time. In a
more typical classroom situation, students are very unlikely to complete an assignment and
submit their data at exactly the same instant.
Page 15.387.8
8 | P a g e
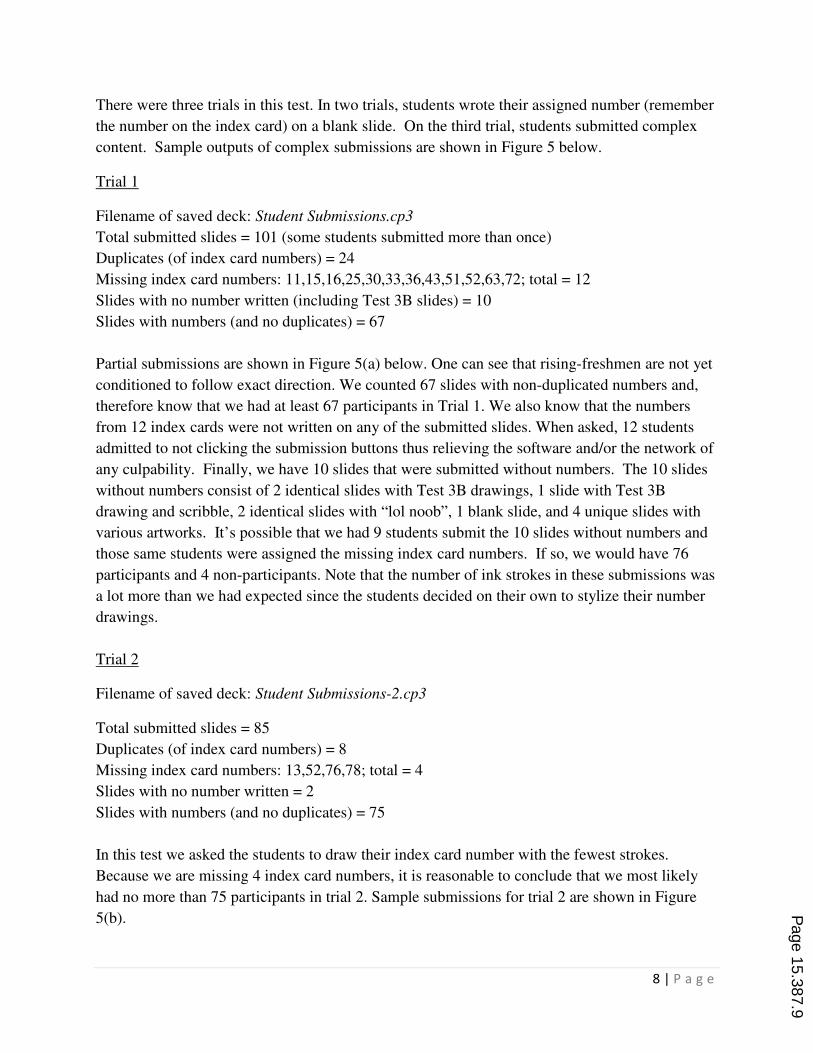
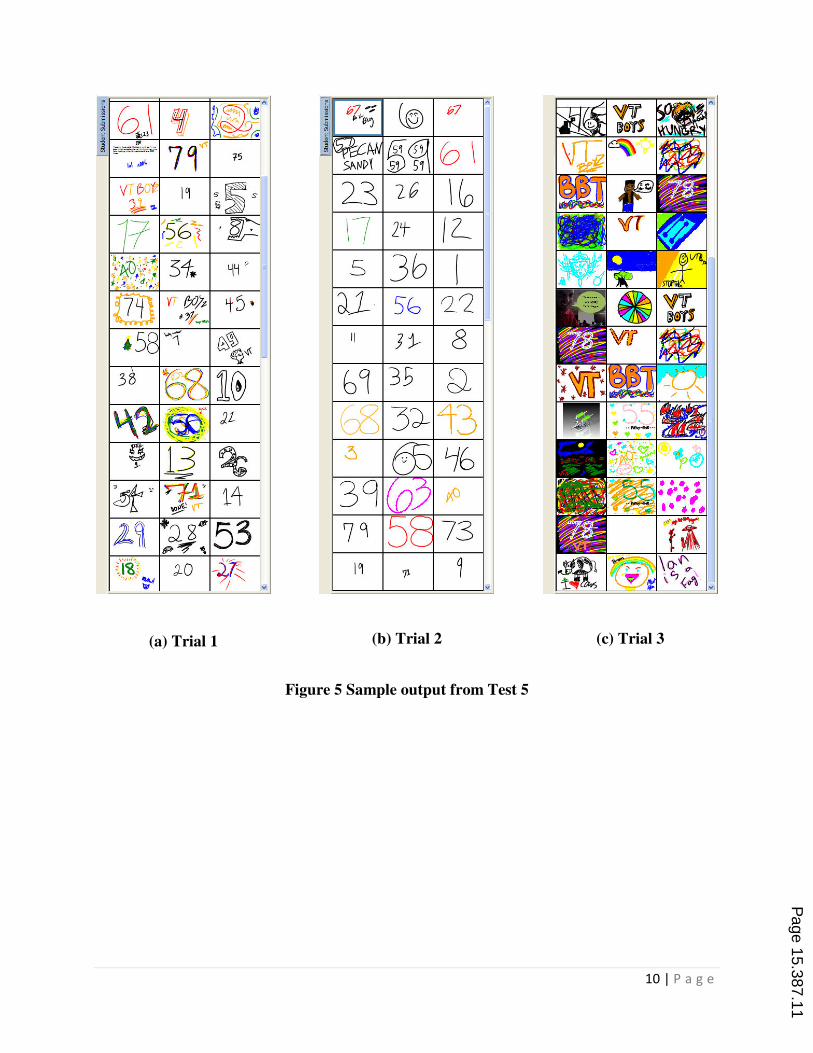
There were three trials in this test. In two trials, students wrote their assigned number (remember
the number on the index card) on a blank slide. On the third trial, students submitted complex
content. Sample outputs of complex submissions are shown in Figure 5 below.
Trial 1
Filename of saved deck: Student Submissions.cp3
Total submitted slides = 101 (some students submitted more than once)
Duplicates (of index card numbers) = 24
Missing index card numbers: 11,15,16,25,30,33,36,43,51,52,63,72; total = 12
Slides with no number written (including Test 3B slides) = 10
Slides with numbers (and no duplicates) = 67
Partial submissions are shown in Figure 5(a) below. One can see that rising-freshmen are not yet
conditioned to follow exact direction. We counted 67 slides with non-duplicated numbers and,
therefore know that we had at least 67 participants in Trial 1. We also know that the numbers
from 12 index cards were not written on any of the submitted slides. When asked, 12 students
admitted to not clicking the submission buttons thus relieving the software and/or the network of
any culpability. Finally, we have 10 slides that were submitted without numbers. The 10 slides
without numbers consist of 2 identical slides with Test 3B drawings, 1 slide with Test 3B
drawing and scribble, 2 identical slides with “lol noob”, 1 blank slide, and 4 unique slides with
various artworks. It’s possible that we had 9 students submit the 10 slides without numbers and
those same students were assigned the missing index card numbers. If so, we would have 76
participants and 4 non-participants. Note that the number of ink strokes in these submissions was
a lot more than we had expected since the students decided on their own to stylize their number
drawings.
Trial 2
Filename of saved deck: Student Submissions-2.cp3
Total submitted slides = 85
Duplicates (of index card numbers) = 8
Missing index card numbers: 13,52,76,78; total = 4
Slides with no number written = 2
Slides with numbers (and no duplicates) = 75
In this test we asked the students to draw their index card number with the fewest strokes.
Because we are missing 4 index card numbers, it is reasonable to conclude that we most likely
had no more than 75 participants in trial 2. Sample submissions for trial 2 are shown in Figure
5(b).
Page 15.387.9
9 | P a g e
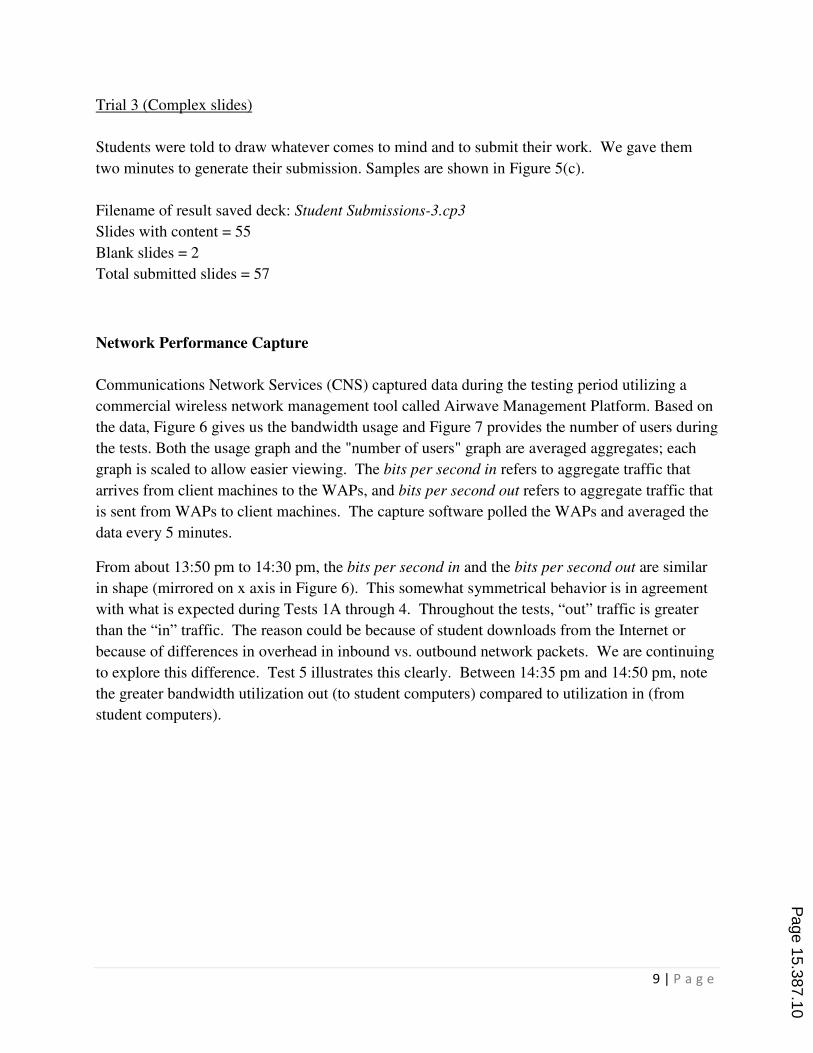
Trial 3 (Complex slides)
Students were told to draw whatever comes to mind and to submit their work. We gave them
two minutes to generate their submission. Samples are shown in Figure 5(c).
Filename of result saved deck: Student Submissions-3.cp3
Slides with content = 55
Blank slides = 2
Total submitted slides = 57
Network Performance Capture
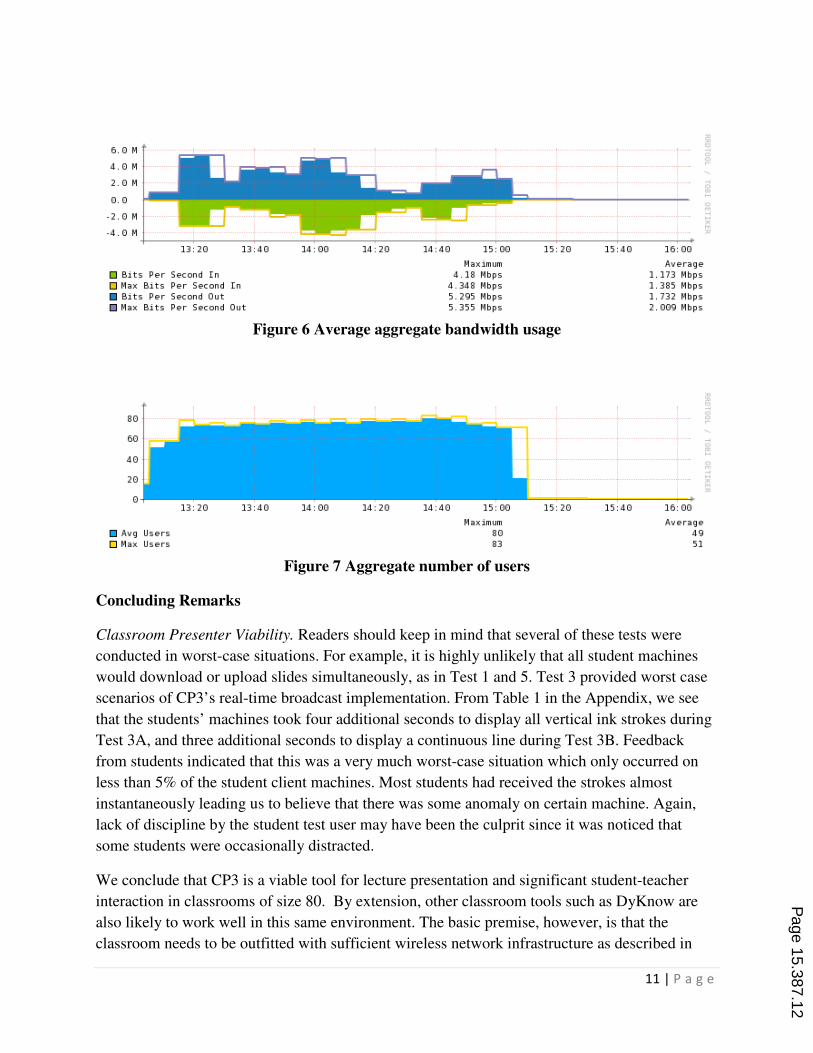
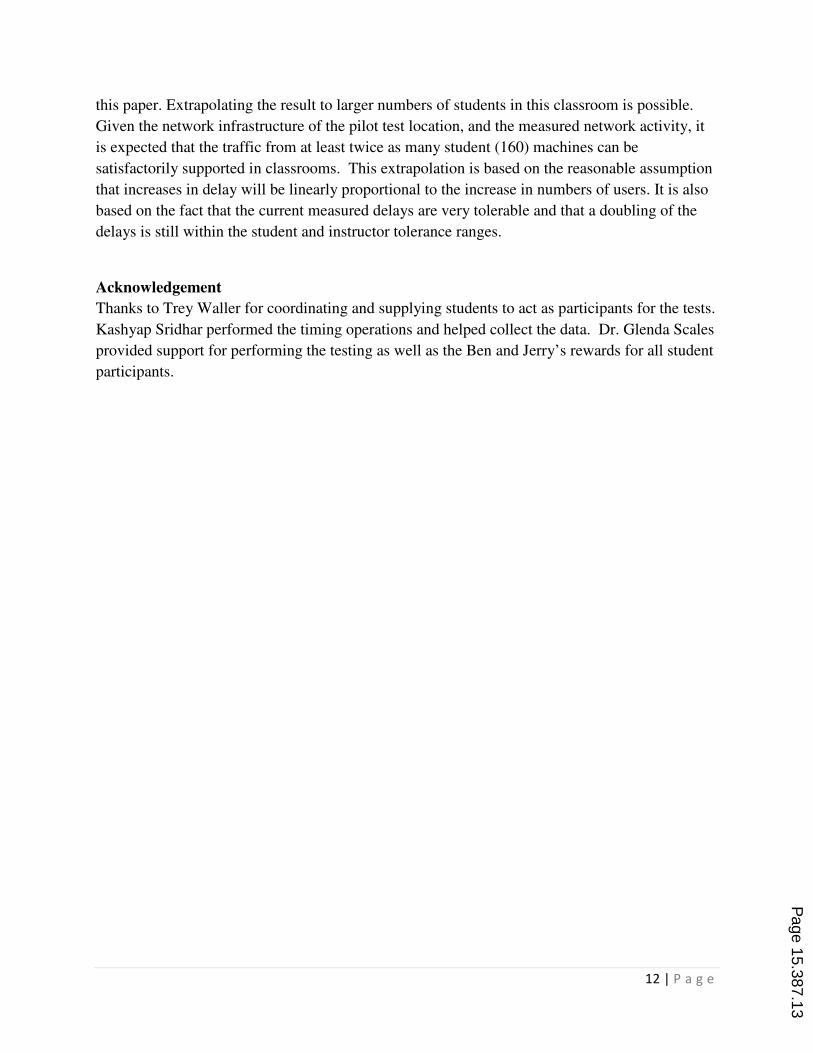
Communications Network Services (CNS) captured data during the testing period utilizing a
commercial wireless network management tool called Airwave Management Platform. Based on
the data, Figure 6 gives us the bandwidth usage and Figure 7 provides the number of users during
the tests. Both the usage graph and the "number of users" graph are averaged aggregates; each
graph is scaled to allow easier viewing. The bits per second in refers to aggregate traffic that
arrives from client machines to the WAPs, and bits per second out refers to aggregate traffic that
is sent from WAPs to client machines. The capture software polled the WAPs and averaged the
data every 5 minutes.
From about 13:50 pm to 14:30 pm, the bits per second in and the bits per second out are similar
in shape (mirrored on x axis in Figure 6). This somewhat symmetrical behavior is in agreement
with what is expected during Tests 1A through 4. Throughout the tests, “out” traffic is greater
than the “in” traffic. The reason could be because of student downloads from the Internet or
because of differences in overhead in inbound vs. outbound network packets. We are continuing
to explore this difference. Test 5 illustrates this clearly. Between 14:35 pm and 14:50 pm, note
the greater bandwidth utilization out (to student computers) compared to utilization in (from
student computers).
Page 15.387.10
10 | P a g e
(a) Trial 1
(b) Trial 2
(c) Trial 3
Figure 5 Sample output from Test 5
Page 15.387.11
11 | P a g e
Figure 6 Average aggregate bandwidth usage
Figure 7 Aggregate number of users
Concluding Remarks
Classroom Presenter Viability. Readers should keep in mind that several of these tests were
conducted in worst-case situations. For example, it is highly unlikely that all student machines
would download or upload slides simultaneously, as in Test 1 and 5. Test 3 provided worst case
scenarios of CP3’s real-time broadcast implementation. From Table 1 in the Appendix, we see
that the students’ machines took four additional seconds to display all vertical ink strokes during
Test 3A, and three additional seconds to display a continuous line during Test 3B. Feedback
from students indicated that this was a very much worst-case situation which only occurred on
less than 5% of the student client machines. Most students had received the strokes almost
instantaneously leading us to believe that there was some anomaly on certain machine. Again,
lack of discipline by the student test user may have been the culprit since it was noticed that
some students were occasionally distracted.
We conclude that CP3 is a viable tool for lecture presentation and significant student-teacher
interaction in classrooms of size 80. By extension, other classroom tools such as DyKnow are
also likely to work well in this same environment. The basic premise, however, is that the
classroom needs to be outfitted with sufficient wireless network infrastructure as described in
Page 15.387.12
12 | P a g e
this paper. Extrapolating the result to larger numbers of students in this classroom is possible.
Given the network infrastructure of the pilot test location, and the measured network activity, it
is expected that the traffic from at least twice as many student (160) machines can be
satisfactorily supported in classrooms. This extrapolation is based on the reasonable assumption
that increases in delay will be linearly proportional to the increase in numbers of users. It is also
based on the fact that the current measured delays are very tolerable and that a doubling of the
delays is still within the student and instructor tolerance ranges.
Acknowledgement
Thanks to Trey Waller for coordinating and supplying students to act as participants for the tests.
Kashyap Sridhar performed the timing operations and helped collect the data. Dr. Glenda Scales
provided support for performing the testing as well as the Ben and Jerry’s rewards for all student
participants.
Page 15.387.13

13 | P a g e
Appendix
Table 1 Test Measurements
Test TOD N
Students
Deck
filename
File size
(KB)
Elapsed
time
(min:sec)1
Net
Utilization2
Net
Activity
Time
(sec)3
Note
1 14:13 79 CP3-Test-
Deck3-Tablet 1028 <2:30 n/a n/a
Second
attempt.
Server
locked up.
2 14:18 79 CP3-Test-
Deck3-Tablet 1028 00:02 ~25% 4
3A 14:25 79 CP3-Test-
Deck3-Tablet 1028 00:34 ~40% 48
Blank
slide
added to
deck
3B 14:28 79 CP3-Test-
Deck3-Tablet 1028 00:33 ~30% 28
Blank
slide
added to
deck
4 14:32 75 n/a n/a 00:11 n/a n/a
Net
utilization
and
activity
not
recorded
5 T1 14:38 67 Student
Submissions 1287 01:19 30-35% n/a
Trial 1;
net
utilization
near end
of test
5 T2 14:45 75
Student
Submissions-
2
175 00:28 ~40% 28 Trial 2
5 T3 14:47 57
Student
Submissions-
3
1494 01:02 ~40% n/a
Trial 3
with
complex
slides; net
utilization
near end
of test
1 By stop watch. Time rounded to nearest second.
2 Peak value as shown on Networking tab of the Windows Task Manager.
Page 15.387.14
14 | P a g e
3 Value measured from start of network activity to end of network activity shown on Networking
tab of the Windows Task Manager.
Page 15.387.15