Determinacion Colesterol
8
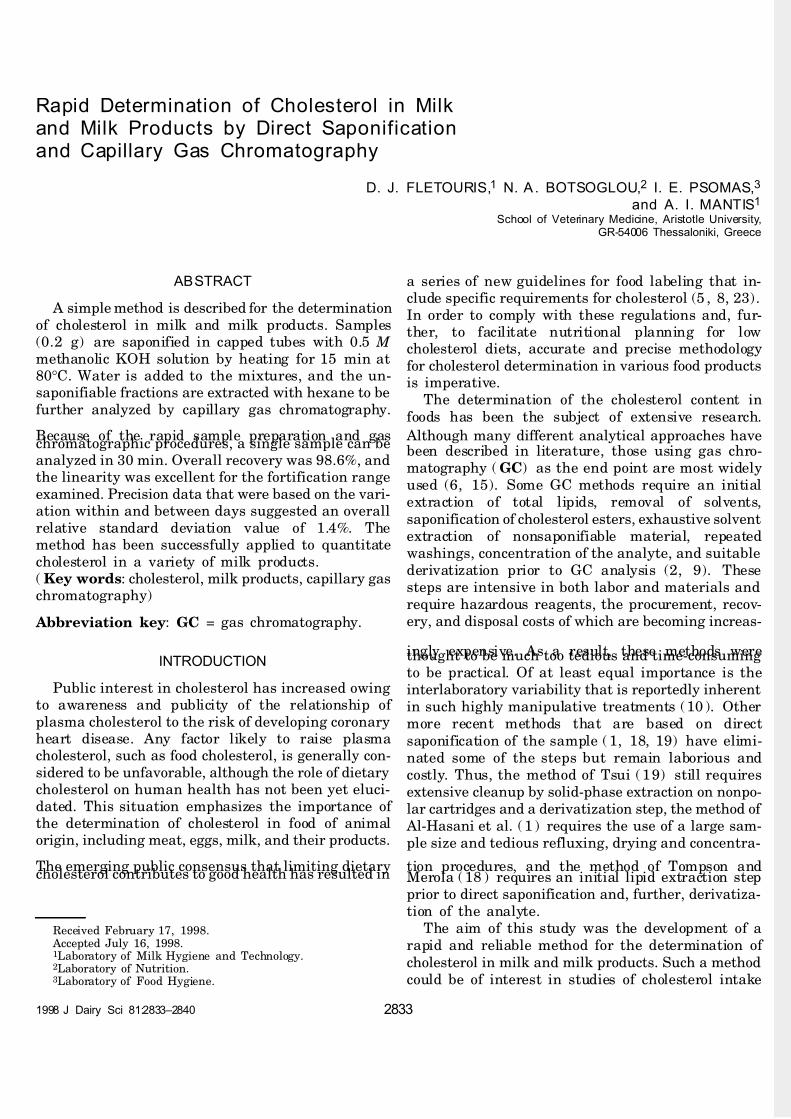
7/27/2019 Determinacion Colesterol http://slidepdf.com/reader/full/determinacion-colesterol 1/8 1998 J Dairy Sci 81:2833–2840 2833 Received February 17, 1998. Accepted July 16, 1998. 1 Laboratory of Milk Hygiene and Technology. 2 Laboratory of Nutrition. 3 Laboratory of Food Hygiene. Rapid Determination of Cholesterol in Milk and Milk Products by Direct Saponification and Capillary Gas Chromatography D. J. FLETOURIS, 1 N. A. BOTSOGLOU, 2 I. E. PSOMAS, 3 and A. I. MANTIS 1 School of Veterinary Medicine, Aristotle University, GR-54006 Thessaloniki, Greece AB STRACT A simple method is described for the determination of cholesterol in milk and milk products. Samples (0.2 g) are saponified in capped tubes with 0.5 M methanolic KOH solution by heating for 15 min at 80°C. Water is added to the mixtures, and the un- saponifiable fractions are extracted with hexane to be further analyzed by capillary gas chromatography. Because of the rapid sample preparation and gas chromatographic procedures, a single sample can be analyzed in 30 min. Overall recovery was 98.6%, and the linearity was excellent for the fortification range examined. Precision data that were based on the vari- ation within and between days suggested an overall relative standard deviation value of 1.4%. The method has been successfully applied to quantitate cholesterol in a variety of milk products. ( Key words: cholesterol, milk products, capillary gas chromatography) Abbreviation key: GC = gas chromatography. INTRODUCTION Public interest in cholesterol has increased owing to awareness and publicity of the relationship of plasma cholesterol to the risk of developing coronary heart disease. Any factor likely to raise plasma cholesterol, such as food cholesterol, is generally con- sidered to be unfavorable, although the role of dietary cholesterol on human health has not been yet eluci- dated. This situation emphasizes the importance of the determination of cholesterol in food of animal origin, including meat, eggs, milk, and their products. The emerging public consensus that limiting dietary cholesterol contributes to good health has resulted in a series of new guidelines for food labeling that in- clude specific requirements for cholesterol (5, 8, 23). In order to comply with these regulations and, fur- ther, to facilitate nutritional planning for low cholesterol diets, accurate and precise methodology for cholesterol determination in various food products is imperative. The determination of the cholesterol content in foods has been the subject of extensive research. Although many different analytical approaches have been described in literature, those using gas chro- matography ( GC) as the end point are most widely used (6, 15). Some GC methods require an initial extraction of total lipids, removal of solvents, saponification of cholesterol esters, exhaustive solvent extraction of nonsaponifiable material, repeated washings, concentration of the analyte, and suitable derivatization prior to GC analysis (2, 9). These steps are intensive in both labor and materials and require hazardous reagents, the procurement, recov- ery, and disposal costs of which are becoming increas- ingly expensive. As a result, these methods were thought to be much too tedious and time-consuming to be practical. Of at least equal importance is the interlaboratory variability that is reportedly inherent in such highly manipulative treatments (10). Other more recent methods that are based on direct saponification of the sample (1, 18, 19) have elimi- nated some of the steps but remain laborious and costly. Thus, the method of Tsui (19) still requires extensive cleanup by solid-phase extraction on nonpo- lar cartridges and a derivatization step, the method of Al-Hasani et al. ( 1 ) requires the use of a large sam- ple size and tedious refluxing, drying and concentra- tion procedures, and the method of Tompson and Merola (18) requires an initial lipid extraction step prior to direct saponification and, further, derivatiza- tion of the analyte. The aim of this study was the development of a rapid and reliable method for the determination of cholesterol in milk and milk products. Such a method could be of interest in studies of cholesterol intake
-
Upload
marcelo-torres -
Category
Documents
-
view
216 -
download
0
Transcript of Determinacion Colesterol
7/27/2019 Determinacion Colesterol
http://slidepdf.com/reader/full/determinacion-colesterol 1/8
1998 J Dairy Sci 81:2833–2840 2833
Received February 17, 1998. Accepted July 16, 1998.1Laboratory of Milk Hygiene and Technology.2Laboratory of Nutrition.3Laboratory of Food Hygiene.
Rapid Determination of Cholesterol in Milkand Milk Products by Direct Saponificationand Capillary Gas Chromatography
D. J. FLETOURIS,1 N. A . BOTSOGLOU,2 I. E. PSOMAS,3
and A. I. MANTIS1
School of Veterinary Medicine, Aristotle University,GR-54006 Thessaloniki, Greece
AB STRACT
A simple method is described for the determination
of cholesterol in milk and milk products. Samples(0.2 g) are saponified in capped tubes with 0.5 M
methanolic KOH solution by heating for 15 min at80°C. Water is added to the mixtures, and the un-saponifiable fractions are extracted with hexane to be
further analyzed by capillary gas chromatography.
Because of the rapid sample preparation and gaschromatographic procedures, a single sample can beanalyzed in 30 min. Overall recovery was 98.6%, andthe linearity was excellent for the fortification range
examined. Precision data that were based on the vari-ation within and between days suggested an overall
relative standard deviation value of 1.4%. Themethod has been successfully applied to quantitate
cholesterol in a variety of milk products.( Key words: cholesterol, milk products, capillary gaschromatography)
Abbreviation key: GC = gas chromatography.
INTRODUCTION
Public interest in cholesterol has increased owing to awareness and publicity of the relationship of
plasma cholesterol to the risk of developing coronaryheart disease. Any factor likely to raise plasmacholesterol, such as food cholesterol, is generally con-
sidered to be unfavorable, although the role of dietarycholesterol on human health has not been yet eluci-
dated. This situation emphasizes the importance of the determination of cholesterol in food of animalorigin, including meat, eggs, milk, and their products.
The emerging public consensus that limiting dietarycholesterol contributes to good health has resulted in
a series of new guidelines for food labeling that in-clude specific requirements for cholesterol (5 , 8, 23) .
In order to comply with these regulations and, fur-ther, to facilitate nutritional planning for lowcholesterol diets, accurate and precise methodology
for cholesterol determination in various food productsis imperative.
The determination of the cholesterol content in
foods has been the subject of extensive research.
Although many different analytical approaches havebeen described in literature, those using gas chro-
matography ( GC) as the end point are most widely
used (6, 15). Some GC methods require an initial
extraction of total lipids, removal of solvents,
saponification of cholesterol esters, exhaustive solvent
extraction of nonsaponifiable material, repeated
washings, concentration of the analyte, and suitable
derivatization prior to GC analysis (2, 9). These
steps are intensive in both labor and materials and
require hazardous reagents, the procurement, recov-
ery, and disposal costs of which are becoming increas-
ingly expensive. As a result, these methods werethought to be much too tedious and time-consuming
to be practical. Of at least equal importance is the
interlaboratory variability that is reportedly inherent
in such highly manipulative treatments ( 10 ). Other
more recent methods that are based on direct
saponification of the sample ( 1, 18, 19) have elimi-
nated some of the steps but remain laborious and
costly. Thus, the method of Tsui ( 1 9) still requires
extensive cleanup by solid-phase extraction on nonpo-
lar cartridges and a derivatization step, the method of
Al-Hasani et al. ( 1 ) requires the use of a large sam-
ple size and tedious refluxing, drying and concentra-
tion procedures, and the method of Tompson andMerola ( 18 ) requires an initial lipid extraction step
prior to direct saponification and, further, derivatiza-
tion of the analyte.
The aim of this study was the development of a
rapid and reliable method for the determination of
cholesterol in milk and milk products. Such a method
could be of interest in studies of cholesterol intake
7/27/2019 Determinacion Colesterol
http://slidepdf.com/reader/full/determinacion-colesterol 2/8
Journal of Dairy Science Vol. 81, No. 11, 1998
FLETOURIS ET AL.2834
because relevant data available from published food
composition tables show wide variability, mainly fromdifferences in the analytical methods used (1 1, 20).
In an effort to ensure the best selectivity, accuracy,and precision in the new method, various analytical
parameters were examined that might influence thedetermination of cholesterol in milk and milkproducts. As a result, a significantly shortened and
simplified analytical procedure was produced that in-volves a sample preparation step accomplished within
20 min in a single tube and a 10-min GC analysiswithout prior derivatization.
MATERIALS AND METHODS
Ap par atus
A capillary column GC system (model GC-15A;
Shimadzu Corp., Kyoto, Japan), equipped with a
flame ionization detector, an automatic sampler(model AOC-17), and a chromatography data system(model Class-VP™) , was used in this study. A
temperature-regulated water bath ( Type 3044, Kot-termann, Germany), a vortex mixer (model G-560E;
Scientific Industries, Inc., Bohemia, NY), a centrifuge(model Centra-MP4; IEC, Needman Heights, MA), amagnetic stirrer plate (Fisher Scientific, Pittsburgh,
PA), solvent dispensers (models P1000 and P5000;Gilson, Villiers-le-Bel, France), and sample prepara-
tion tubes (16 × 12.5 mm, with teflon®-lined screwcaps; Corning, NY) were used for sample treatment.
Materials
Reagent-grade hexane, methanol, and KOH were
from Merck (Darmstadt, Germany). The referencestandard of cholesterol was from Sigma Chemical Co.
(St. Louis, MO).
Preparation of Saponification Solution
A 0.5 M methanolic KOH solution was prepared bydissolving 14 g of KOH in methanol on a magnetic
stirrer plate and diluting to 500-ml volume with thesolvent.
Preparation of Cholesterol Standards
The stock solution (2 mg/ml) was prepared bydissolving 20 mg of reference standard with hexane in
a 10-ml volumetric flask. Working solutions were pre-pared by appropriately diluting aliquots from the
stock solution with hexane to obtain solutions in therange of 10 to 80 mg/ml.
GC Conditions
A fused silica capillary column (15 m × 0.32 mm
id), coated with SPB-1 (Supelco Inc., Bellefonte, PA)with 1.0-mm film thickness, was used in this study.Oven temperature was set at 285°C, injection port
temperature at 300°C, and flame ionization detector
temperature at 300°C. The flow rates were 2 ml/minfor helium, 30 ml/min for hydrogen, and 300 ml/minfor air. The injection volume was 1 ml with a splitratio of 20:1.
Sample Preparation
A 0.2-g sample of milk, yogurt, butter, ice cream, or
well-ground cheese was accurately weighed into asample preparation tube to which 5 ml of methanolic
KOH solution were also added. The tube was cappedtightly, and its contents were vortexed for 15 s. Thelower half of the tube was then immersed in a 80°C
bath and kept there for 15 min, removing the tubeevery 5 min to vortex for 10 s. Several tubes could be
handled conveniently by placing them in a wirebasket. Following heating, the tube was cooled withtap water, 1 ml of water and 5 ml of hexane were
added, and the contents were vortexed vigorously for1 min and then centrifuged for 1 min at 2000 × g. An
aliquot of the upper phase was transferred into theautosampler vial pending GC analysis.
Determination
A calibration curve was generated by injecting 1 ml
from each standard working solution and plotting therecorded peak area versus the corresponding mass of the analyte injected. The slope, intercept, and least
squared fit of the standard curve was computed. Datafor the slope and intercept of the calibration curve
were used to compute the mass of the analyte inunknown sample extracts (1 ml) that were injected.The concentration C (milligrams per 100 g) of
cholesterol in analyzed samples was calculated ac-cording to the equation C = M × V × 2.5, where M =computed mass (nanograms) of the analyte in theinjected extract (1 ml), and V = dilution factor, if any,that was applied.
RESULTS AND DISCUSSION
In recent literature, direct saponification pro-cedures are very often used to eliminate the initiallipid extraction of the sample. However, a variety of widely differing saponification conditions, allseparately claimed to be the most suitable forcholesterol determination, can be found. There is an
7/27/2019 Determinacion Colesterol
http://slidepdf.com/reader/full/determinacion-colesterol 3/8
Journal of Dairy Science Vol. 81, No. 11, 1998
CHOLESTEROL IN MILK PRODUCTS 2835
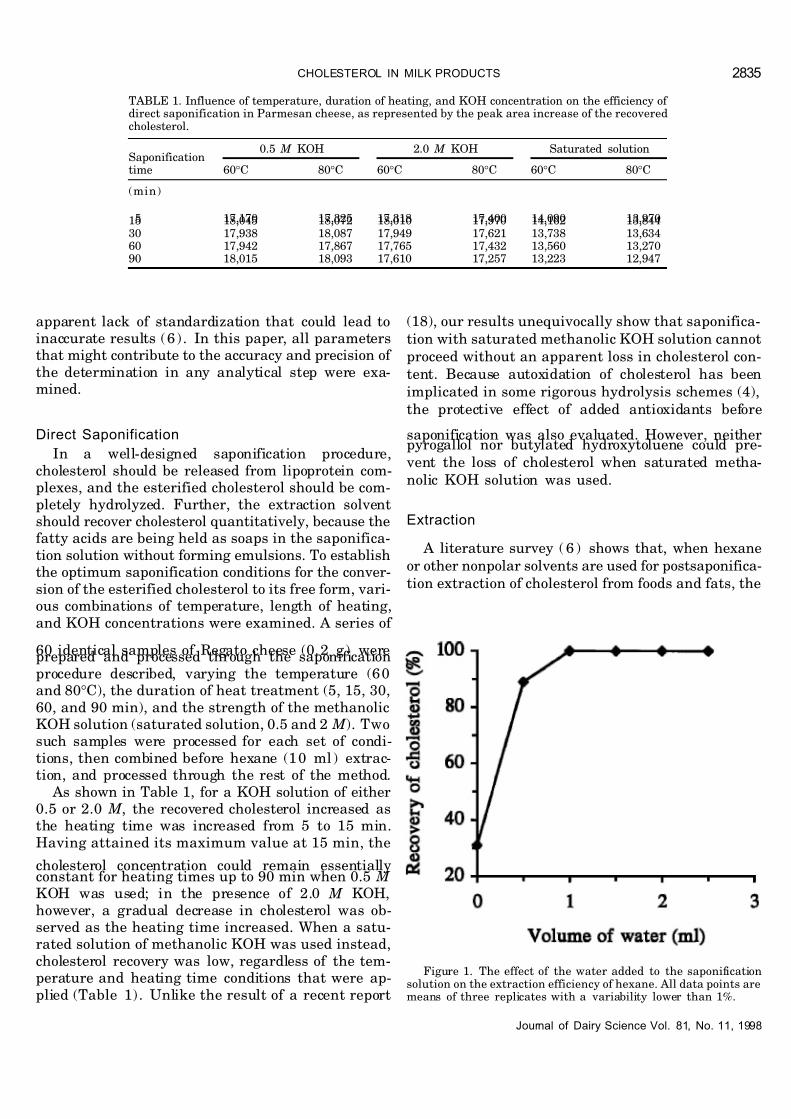
TABLE 1. Influence of temperature, duration of heating, and KOH concentration on the efficiency of direct saponification in Parmesan cheese, as represented by the peak area increase of the recoveredcholesterol.
Saponificationtime
0.5 M KOH 2.0 M KOH Saturated solution
60°C 80°C 60°C 80°C 60°C 80°C
(min)
5 17,170 17,325 17,318 17,400 14,090 13,97015 18,045 18,072 18,010 17,970 14,162 13,84430 17,938 18,087 17,949 17,621 13,738 13,63460 17,942 17,867 17,765 17,432 13,560 13,27090 18,015 18,093 17,610 17,257 13,223 12,947
Figure 1. The effect of the water added to the saponificationsolution on the extraction efficiency of hexane. All data points aremeans of three replicates with a variability lower than 1%.
apparent lack of standardization that could lead toinaccurate results ( 6 ) . In this paper, all parametersthat might contribute to the accuracy and precision of
the determination in any analytical step were exa-mined.
Direct Saponification
In a well-designed saponification procedure,
cholesterol should be released from lipoprotein com-plexes, and the esterified cholesterol should be com-
pletely hydrolyzed. Further, the extraction solventshould recover cholesterol quantitatively, because thefatty acids are being held as soaps in the saponifica-
tion solution without forming emulsions. To establishthe optimum saponification conditions for the conver-
sion of the esterified cholesterol to its free form, vari-ous combinations of temperature, length of heating,
and KOH concentrations were examined. A series of
60 identical samples of Regato cheese (0. 2 g ) wereprepared and processed through the saponification
procedure described, varying the temperature (6 0and 80°C), the duration of heat treatment (5, 15, 30,
60, and 90 min), and the strength of the methanolicKOH solution (saturated solution, 0.5 and 2 M ). Twosuch samples were processed for each set of condi-
tions, then combined before hexane (1 0 ml ) extrac-tion, and processed through the rest of the method.
As shown in Table 1, for a KOH solution of either0.5 or 2.0 M , the recovered cholesterol increased asthe heating time was increased from 5 to 15 min.
Having attained its maximum value at 15 min, the
cholesterol concentration could remain essentiallyconstant for heating times up to 90 min when 0.5 M
KOH was used; in the presence of 2.0 M KOH,
however, a gradual decrease in cholesterol was ob-served as the heating time increased. When a satu-rated solution of methanolic KOH was used instead,
cholesterol recovery was low, regardless of the tem-perature and heating time conditions that were ap-
plied (Table 1) . Unlike the result of a recent report
(18), our results unequivocally show that saponifica-
tion with saturated methanolic KOH solution cannot
proceed without an apparent loss in cholesterol con-
tent. Because autoxidation of cholesterol has been
implicated in some rigorous hydrolysis schemes (4),
the protective effect of added antioxidants before
saponification was also evaluated. However, neitherpyrogallol nor butylated hydroxytoluene could pre-
vent the loss of cholesterol when saturated metha-
nolic KOH solution was used.
Extraction
A literature survey ( 6 ) shows that, when hexane
or other nonpolar solvents are used for postsaponifica-
tion extraction of cholesterol from foods and fats, the

7/27/2019 Determinacion Colesterol
http://slidepdf.com/reader/full/determinacion-colesterol 4/8
Journal of Dairy Science Vol. 81, No. 11, 1998
FLETOURIS ET AL.2836
TABLE 2. Effect of sample size on the recovery of cholesterol frombutter.
1Three replicates.
2Relative standard deviation.
Sample Cholesterolsize concentration1 RSD2
( g ) (mg/100 g ) ( % )
X SD
0.050 226.7 4.82 2.1
0.100 230.0 3.74 1.60.150 227.2 2.89 1.30.200 228.1 4.36 1.90.250 227.9 4.13 1.80.300 214.9 2.78 1.3
Figure 2. Typical chromatograms of a Regato cheese (A ) and aTeleme imitation cheese ( B) . Chromatographic conditions: fusedsilica capillary column, 15 m × 0.32 mm i.d., coated with SPB-1(Supleco Inc., Bellefonte, PA) with film thickness of 1.0 mm;column temperature of 285°C; helium carrier gas set at 2 ml/min,hydrogen set at 30 ml/min, and air set at 300 ml/min. Injection porttemperature was 300°C, flame ionization detector temperature was300°C, split ratio was 20:1, and injection volume was 1 ml. Peak 1,5a-cholestane; peak 2, cholesterol; and peaks 3, 4, and 5, phytoster-ols.
addition of varying amounts of water is in most cases
a mandatory preliminary step. Hexane has been
found to be an excellent extraction solvent for
cholesterol. Hexane is less toxic than other solventscommonly used and does not form emulsions as
toluene does. Hexane also does not form the peroxides
that could degrade cholesterol and does not virtually
dissolve water. Thus, the extraction efficiency of hex-
ane in the presence or absence of water was inves-
tigated using a series of tubes, all containing 5 ml of
saponification solution and the same amount of
cholesterol standard but variable amounts of water (0
to 2.5 ml). Each of these tubes was subjected to the
extraction and GC procedure as described, replicating
each three times.
Results showed (Figure 1) that, when no water isadded, the extraction efficiency of hexane is low. A
second extraction with hexane could improve the
recovery of cholesterol but not to an acceptable level.
The addition of 0.5 ml of water substantially in-
creased the extraction efficiency of hexane. The fur-
ther addition of 0.5 ml of water could make the ex-
traction quantitative, eliminating the need for a
second extraction. The addition of 1 ml of water possi-
bly produces such an increase in the polarity of the
methanolic KOH phase that the cholesterol is forced
to be quantitatively transferred to the less polar hex-
ane phase. These findings on the importance of waterin the extraction process lend support to most pub-
lished procedures but are in direct disagreement with
a recent assay ( 1 2 ) in which the quantitative extrac-
tion of cholesterol is reported in the absence of water
when the methanolic saponification solution is satu-
rated with KOH. We checked this possibility, but the
results did not differ significantly ( P < 0.05) from
those initially found.
Fenton and Sim ( 7) have reported that the
amount of fat in the saponification mixture can also
influence the efficiency of the hexane extraction. To
investigate the matter, variable amounts of butter (0
to 0.3 g ) were submitted to the described saponifica-
tion, extraction, and chromatographic procedures.
The results of these analyses (Table 2 ) showed thatthe extraction efficiency of hexane was not affected by
the presence of fat if the amount of fat in the sample
was ≤0.2 g (0.25 g of butter contains approximately
0.2 g of fat).
Under established conditions of direct saponifica-
tion and extraction, emulsion problems never oc-
curred during the analysis of a variety of dairy
products. Emulsion problems do occur with other
methods, as is apparent from reports (2 1 ) describing
persistent emulsions, amended only by saponification
for 1 h at 100°C.

7/27/2019 Determinacion Colesterol
http://slidepdf.com/reader/full/determinacion-colesterol 5/8
Journal of Dairy Science Vol. 81, No. 11, 1998
CHOLESTEROL IN MILK PRODUCTS 2837
TABLE 4. Precision data based on the determination of cholesterol in Regato cheese.
1Relative standard deviation.
Day Cholesterol found Mean value RSD1
(mg/100 g ) ( % )
X SD
1 85.9, 82.9, 83.9, 84.1, 84.4, 85.6 84.5 1.12 1.32 85.2, 84.4, 84.8, 85.6, 86.4, 87.3 85.6 1.07 1.33 85.6, 86.5, 83.0, 85.3, 86.4, 85.6 85.4 1.27 1.5Overall mean 85.2 1.16 1.4
Variance estimatesSource
Within day 1.4Between days 1.8Overall 1.4
TABLE 3. Accuracy data based on recovery of the cholesterol addedto Regato cheese at three concentrations.
1Six replicates.
2Relative standard deviation.
Mean Augmentation Cholesterol concentrationlevel added1 found RSD2
(mg/100 g ) ( % )
X SD
0 0 85.6 1.07 1.31 60 144.4 1.39 1.02 120 202.9 1.83 0.93 180 263.2 2.37 0.9
GC
Following extraction and centrifugation, an aliquotfrom the top hexane layer was transferred into the
autosampler vial to be submitted further to GC analy-
sis. Derivatization of cholesterol prior to its injectiononto GC was not made because derivatization was not
found to be essential with the short thick-film columnwe used. The thick film that was covering the active
silanol groups on the surface of the fused silica couldpossibly prevent adsorption of the underivatized ana-
lyte, and, thus, peak distortion was not observed(Figure 2).
Although some fatty acid methyl ester peaks were
still present in the recorded chromatograms, they didnot present any separation or contamination problem
on the capillary column, eluting just after the solventfront.
Calibration
Both internal (1, 3, 7, 12) and external (13, 14,
16) standard calibration techniques have been recom-mended for the analysis of cholesterol. The internal
standard technique can compensate for the effect of
various analytical errors, including sample size fluc-tuations, but its compensation feature is because thecompound used as internal standard is chemically
similar to the analyte. However, 5a-cholestane, whichis the most widely used internal standard in
cholesterol analysis, is an alkane that does not bearclose resemblance to cholesterol in its chemical andphysical properties, and, therefore, its use is at vari-
ance with one of the most basic requirements of aninternal standard ( 17 ) . Furthermore, the uncertainty
associated with the measurement of the area of theinternal standard itself may increase the precision
error of the analysis compared with the external stan-dard technique of frequent calibration because of twopeak area measurements rather than one (1 7) .
To test the efficiency of external versus internalstandard calibration in our system, a series of five
sample preparation tubes was prepared so that each
contained the same amount of 5a-cholestane (180 mg )as the internal standard but a variable amount of
cholesterol standard (50, 100, 150, 245, or 400 mg) in5 ml of hexane. Each of the five mixtures consisted of
standards only, so they were analyzed by GC withoutsaponification, replicating each five times. Cholesterolresponses as either peak area ratios of cholesterol to
5a-cholestane or cholesterol peak areas were plottedon a graph as the dependent variable with added
cholesterol on the independent variable axis. Regres-sion analysis showed the response for both types of
calibration to be linear in the range examined (y I =
0.005 + 0.0275x, response factor = 1.00 ± 0.012, rI =
0.99959 for internal standard calibration versus yE =–10.36 + 486.87x, and rE = 0.99967 for external stan-dard calibration, where yI and yE represent the peak
area ratios of cholesterol to 5a-cholestane andcholesterol peak areas, respectively, and x representsthe quantity in nanograms of the cholesterol inject-

7/27/2019 Determinacion Colesterol
http://slidepdf.com/reader/full/determinacion-colesterol 6/8
Journal of Dairy Science Vol. 81, No. 11, 1998
FLETOURIS ET AL.2838
TABLE 5. Cholesterol content of selected milk and milk products.
Source of Type of product product Replicates Cholesterol
(no.) (mg/100 g )
X SD
Bovine milk Greece 3 12.2 0.18 Yogurt from bovine milk Greece 3 12.4 0.21Strain yogurt from bovine milk Greece 3 33.6 0.57Ovine milk Greece 3 21.7 0.32 Yogurt from ovine milk Greece 3 30.1 0.54Caprine milk Greece 3 14.4 0.22Butter Greece 3 228.1 4.36Ice cream Greece 3 46.7 0.72 Anthotyros cheese Greece 3 80.6 1.03Dry myzithra cheese Greece 3 106.8 2.01Manouri cheese Greece 3 143.3 2.62Teleme cheese Greece 3 61.9 1.11Feta cheese Greece 3 68.1 1.18Teleme imitation cheese Greece 3 8.3 0.20Kaseri cheese Greece 3 86.2 1.83Kephalotyri cheese Greece 3 85.7 1.41Romano cheese Italy 3 89.3 1.66Provolone cheese Italy 3 75.9 1.38Mozzarella cheese Italy 3 71.4 1.41Cheddar cheese England 3 101.2 2.12Graviera cheese Greece 3 97.9 1.85Regato cheese Ireland 3 85.6 1.07Emmental cheese Switzerland 3 85.7 1.32Edam cheese Holland 3 82.9 1.17Gouda cheese Holland 3 88.1 0.93Parmesan cheese Italy 3 92.6 1.56Camembert France 3 73.8 1.52Blue cheese Denmark 3 92.1 2.18
ed). The excellent linearity found with these equa-
tions suggested that both techniques were more thanadequate for reliable quantitation of the target ana-
lytes. However, the external standard calibrationtechnique was considered as the best choice because it
reduced the manipulations and cost of analysis to theminimum.
Ac cu rac y
To study the accuracy of the method, a standard
addition procedure was evaluated. Eighteen of 24samples from a Regato cheese were augmented with
standard cholesterol at three concentrations by using a cholesterol solution in methanol (2 mg of
cholesterol/ml), and all samples were submitted toanalysis by this method. Least squares and regressionanalyses of the data (Table 3) based solely on the
three concentrations of cholesterol showed that therelationship between added ( x ) and found ( y)
cholesterol was adequately described by a linearregression ( y = 84.7 + 0.990x; r = 0.99932). Becausethe intercept of this regression line, which is the
value in milligrams per 100 g that is predicted for the
control samples, was not significantly different ( P <
0.05) from the arithmetic mean of the control sam-
ples (84.7 vs. 85.6), it might be concluded that no
interference was present in the extracted samples.
The absence of interference permitted evaluation for
accuracy by using the data from both the augmented
and the control samples. Least squares and regres-sion analyses of these data showed that the linearity
was quite acceptable (y = 85.3 + 0.986x; r = 0.99969).
Therefore, the slope (0. 986 ) of this regression line
could be used as an estimate of the overall recovery
(98.6% ) in the proposed method.
Precision
The precision of the method was studied by assay-
ing six samples of Regato cheese on each of 3 d. To
estimate the overall precision, the raw data (Table 4)
were subjected to ANOVA and expected mean squares
for the one-way classification-balanced design ( 22 ) .
The overall precision was 1.4%, and the precision
values within and between days were 1.4 and 1.8%,
respectively.

7/27/2019 Determinacion Colesterol
http://slidepdf.com/reader/full/determinacion-colesterol 7/8
Journal of Dairy Science Vol. 81, No. 11, 1998
CHOLESTEROL IN MILK PRODUCTS 2839
Figure 3. Comparison of the analytical steps required for thedetermination of cholesterol in milk and milk products by theInternational Dairy Federation (I DF) method ( 9 ) and the newmethod described herein. GC = Gas chromatography.
Ap pl icati on fo r Milk
and Milk Products
The applicability of the method can be best illus-trated by results obtained from the analysis of bovine,
ovine, and caprine milks obtained from a local milkindustry and of various commercial milk productspurchased from local markets (Table 5). None of the
analyzed samples presented any analytical problem.
Figure 2 shows that the Teleme imitation cheese thatis produced using vegetable fat contained phytoster-ols, which, although very well resolved, were not iden-
tified.
CONCLUSIONS
A simple method for the determination of cholesterol in milk and milk products has been devel-
oped, and its accuracy has been tested. The method
needs small sample size and offers considerable sav-
ings over cost of the method of the International
Dairy Federation ( 9 ) in terms of solvent require-
ments, costly materials, sample manipulation, and
time for analyses (Figure 3). The sample preparation
procedure is both rapid and simple, and automatic
sampling can be exploited in extending the capacity
for analysis with unattended chromatographic opera-
tion. Because of its advantages, the newly developed
method might be particularly suitable to laboratories
where large throughput of compliance samples are
obligatory.
ACKNOWLEDGMENT
The authors thank K. Giannakou for computer-
keyboarding assistance.
REFERENCES
1 Al-Hasani, S. M., J. Hlavac, and M. W. Carpenter. 1993. Rapiddetermination of cholesterol in single and multicomponent pre-pared foods. J. AOAC Int. 76:902–906.
2 Association of Official Analytical Chemists. 1990. Cholesterol inmulticomponent foods. Gas chromatographic method. Sec.976.26 in Official Methods of Analysis. Vol. II. 15th ed. AOAC, Arlington, VA.
3 Beyer, J. D., F. X. Milani, M. J. Dutelle, and R. L. Bradley.1989. Gas chromatographic determination of cholesterol in egg products. J. AOAC 72:746–748.
4 Bohac, C. E., K. S. Rhee, H. R. Cross, and K. Ono. 1988. Assessment of methodologies for colorimetric cholesterol assayof meats. J. Food Sci. 53:1642–1644.
5 Code of Federal Regulations. 1991. Food and Drugs. Title 21:Sec. 101:25. U.S. Gov. Printing Office, Washington, DC.
6 Fenton, M. 1992. Chromatographic separation of cholesterol infoods. J. Chromatogr. 624:369–388.
7 Fenton, M., and J. S. Sim. 1991. Determination of egg yolkcholesterol content by on-column capillary gas chromatography.J. Chromatogr. 540:323–329.
8 Health and Welfare Canada. 1990. Nutritional Recommenda-tions. Can. Govt. Publ. Ctr., Ottawa, ON, Canada. Cat. No.H49-42/1990E.
9 International Dairy Federation. 1992. Milk fat and milkfatproducts. Determination of cholesterol content. IDF Stand. 159.Int. Dairy Fed., Brussels, Belgium.
10 Lognay, G., M. Marlier, P. Dreze, M. Severin, and P. J. Wag-staffe. 1989. Validation of a quantitative procedure for theextraction of sterols from edible oils using radiolabeled com-pounds. Analyst 114:1287–1291.
11 Marshall, M. W., B. A. Clevidence, R. H. Thompson, and J. T.
Judd. 1989. Problems in estimating amounts of food cholesterol.J. Food Compos. Anal. 2:228–237.12 Naeemi, E. D., N. Ahmad, T. K. Al-Sharrah, and M. Behbahani.
1995. Rapid and simple method for determination of cholesterolin processed food. J. AOAC Int. 78:1522–1525.
13 Oles, P., G. Gates, S. Kensiger, J. Patchell, D. Schumacher,T. Showers, and A. Silcox. 1990. Optimization of the determina-tion of cholesterol in various food matrices. J. AOAC 73:724–728.
14 Punwar, J. K. 1975. Gas-liquid chromatographic determinationof total cholesterol in multicomponent foods. J. AOAC 58:804–810.
7/27/2019 Determinacion Colesterol
http://slidepdf.com/reader/full/determinacion-colesterol 8/8
Journal of Dairy Science Vol. 81, No. 11, 1998
FLETOURIS ET AL.2840
15 Sempore, B. G., and J. A. Bezard. 1996. Analysis of neutrallipids: unsaponifiable matter. Pages 491–506 in Handbook of Food Analysis. L.M.L. Nollet, ed. Marcel Dekker Inc., New York, NY.
16 Sheppard, A. J., D. R. Newkirk, W. D. Hubbard, and T. Osgood.1977. Gas-liquid chromatographic determination of cholesteroland other sterols in foods. J. AOAC 60:1302–1306.
17 Snyder, L. R., and J. J. Kirkland. 1979. Introduction to ModernLiquid Chromatography. 2nd ed. John Wiley & Sons, Inc., New
York, NY.18 Thompson, R. H., and G. V. Merola. 1993. A simplified alterna-tive to the AOAC official method for cholesterol in multicompo-nent foods. J. AOAC Int. 76:1057–1068.
19 Tsui, I. C. 1989. Rapid determination of total cholesterol inhomogenized milk. J. AOAC 72:421–424.
20 Ulberth, F., and H. Reich. 1992. Gas-chromatographic determi-nation of cholesterol in processed foods. Food Chem. 43:387–391.
21 Walton, C. G., W.M.N. Ratnayake, and R. G. Ackman. 1989.Total sterols in seafoods—Iatroscan TLC/FID versus theKovacs GLC/FID method. J. Food Sci. 54:793–795.
22 Wernimont, G. T. 1987. Use of Statistics to Evaluate AnalyticalMethods. W. Spendley, ed. AOAC, Arlington, VA.
23 World Health Organization. 1982. World Health Org. Tech.Rep. Ser. 678. World Health Org., Geneva, Switzerland.